Preprint
Article

Determination of Active Pharmaceutical Ingredients in Saridon Tablets Using an Economical and Sensitive TLC Method Combined with Densitometry

Altmetrics

Downloads

142

Views

61

Comments

0

A peer-reviewed article of this preprint also exists.

This version is not peer-reviewed

Submitted:

29 November 2023

Posted:

30 November 2023

You are already at the latest version

Alerts
Abstract
New TLC-densitometric method have been developed for the identification and quantification of paracetamol (PA), propyphenazone (PP) and caffeine (C) of Saridon tablets using the NP-TLC technique combined with densitometry. This method allows for the simultaneous determination of PA, PP, and C in the same sample. Among all tested chromatographic conditions, the mixture consisting of chloroform + toluene + ethyl acetate + ethanol + acetic acid (18:18:7.5:5.0:0.3, v/v) and silica gel 60F254 plate proved to be the most effective for the separation of three tested active pharmaceutical ingredients (APIs) and substances related to paracetamol. The fully validation of the proposed NP-TLC method proves that it is specific, precise, accurate, robust and sensitive. The percentage content in relation to the content declared by the manufacturer is for propyphenazone 99.8%, paracetamol 101.6% and caffeine 100.8%, which are in accordance with pharmacopoeial requirements. The results presented indicate the possibility of using the developed method in the routine control of pharmaceutical preparations containing these APIs. The proposed method is economical and more sensitive compared to the previously proposed planar methods for the simultaneously determination of PA, PP and CAPIs. Will be an What is more, the presented method may be anaxcellent excellent economical alternative when HPLC method is unavailable for such determination.
Keywords: 
Subject: Medicine and Pharmacology  -   Pharmacy

1. Introduction

Combined pharmaceutical preparations with analgesic, antipyretic and anti-inflammatory properties often also contain caffeine. Caffeine is a methylxanthine, which is chemically similar to theophylline and theobromine. Caffeine naturally occurs in plant materials such as kola nuts, tea leaves, guarana seeds, or coffee beans. It has a stimulating effect on the central nervous system. It is used in states of fatigue, drowsiness and in situations requiring arousal [1,2]. Caffeine has been proved to enhance the effects of many non-steroidal anti-inflammatory drugs (NSAIDs) and paracetamol [3]. Many of these drugs are being sold as over-the-counter drugs (OTC). Another relevant issue is the growing availability of counterfeit drugs. Not only is it observed in Asia and Africa, but also in European countries [4,5]. About 50 percent of the drugs bought online are counterfeitincluding painkillers. As a result, many counterfeit, contaminated pharmaceutical preparations may appear on the market. Hence there is a need for constant control of their quality and purity.
Saridon is a pharmaceutical preparation with combined action of ingredients. It contains paracetamol and propyphenazone with analgesic and antipyretic properties, as well as a small dose of caffeine, which enhances the analgesic effect of paracetamol. Thanks to the presence of propyphenazone, it also has weak anti-inflammatory properties. The indications for the use of Saridon are: headache, toothache, menstrual pain, postoperative pain, rheumatic pain and ailments like fever, associated with colds and flu.
Various analytical methods for the determination of paracetamol, propyphenazone and caffeine have been described in the scientific literature [6-32]. High performance liquid chromatography (HPLC) [6], reversed phase high performance liquid chromatography (RP-HPLC) [7], reversed phase high performance thin layer chromatography (RP-HPTLC) [8,9], adsorption high performance thin layer chromatography (HP-TLC) [9,10,11] and adsorption TLC [12,13] were used for the simultaneous determination of paracetamol and caffeine in pharmaceutical preparations. Propyphenazone and caffeine in drugs were determined using Fourier-transform infrared spectrometry [14], liquid chromatography (LC) [15] and liquid chromatography-electrospray tandem mass spectrometry (LC-ESI-MS) [16]. Propyphenazone and caffeine were also determined in the presence of other biologically active substances using liquid chromatography with ultraviolet detection (LC/UV) [17], HPLC [18] and LC-ESI-MS [16]. Paracetamol, propyphenazone and caffeine (Figure 1) were determined side by side using spectrophotometric method [19,20], HPLC [20,21,22,23], RP-HPLC [22,24,25], spectrophotomeric [20,26,27], liquid chromatography (LC) [20], square-wave voltammetric [28], high-performance liquid chromatography with diode-array detection (HPLC-DAD) [29], normal phase thin layer chromatography (NP-TLC) [24], pressurized planar electrochromatography [30] and RP-HPTLC [30]. Micellar electrokinetic capillary chromatography (MECC) has also been used to separate paracetamol, propyphenazone and caffeine in the presence of diclofenac [31]. Paracetamol, propyphenazone and caffeine have also been determined in the presence of other biologically active substances (phenobarbital, codeine phospahte, and domperidone, ergotamine tartrate, drotaverine) using RP-HPLC and HPLC techniques, respectively [23,32]. Only a few studies have demonstrated the specificity of the developed methods by separating paracetamol, propyphenazone and caffeine from selected potential impurities [21,22,24,29].
Few scientific studies have described whether the proposed methods demonstrate the chromatographic conditions which allow for the separation of propyphenazone, paracetamol and caffeine from the potential impurities of the drug with 4-nitrophenol and 4-aminophenol. The separation of yet another potential impurity, namely 4-chloroacetanilide, has not been investigated in any study. The crucial aim of this work was to develop an economical and sensitive TLC method combined with densitometry for the determination of active pharmaceutical ingredients (APIs) in Saridon preparation. Chromatographic conditions that allow for the simultaneous quantitative determination of propyphenazone, paracetamol and caffeine and their separation from potential impurities of the drug with 4-chloroacetanilide, 4-aminophenol and 4-nitrophenol by normal phase thin layer chromatography (NP-TLC) combined with densitometry have been developed. The proposed method for the quantitative determination of the above-mentioned APIs in a combined pharmaceutical preparation was also validated. Spectrodensitometric analysis of the listed APIs was used to determine their identity.

2. Materials and Methods

2.1. Chemicals and Reference Standards

Merck chromatography plates on aluminum foil precoated with silica gel 60F254 (#1.05554) and RP18W (#114296) were used for the study. The solvents used were: acetone, chloroform, ammonia 25%, n-hexane, toluene, ethyl acetate, methanol, acetic acid (80%), glacial acetic acid, ethanol (99.8%), acetonitrile and buffer pH=5 (citric acid 0.97 mmol/L + disodium hydrogen phosphate 2.06 mmol/L). They were components of the mobile phases used. Ethanol 99.8% was used to extract the APIs present in the Saridon drug and to dissolve the standards. The solvents mentioned were produced by POCh Gliwice and showed analytical purity. Paracetamol and propyphenazone USP purity and 4-aminophenol and 4-nitrophenol with >99% purity were supplied by Sigma-Aldrich. USP anhydrous caffeine and 4-chloroacetanilide with >98% pure were purchased from Fluka. Saridon tablets (Bayer, Germany) contained 250 mg of paracetamol, 150 mg of propyphenazone and 50 mg of caffeine.

2.2. Preparation of Standard Solutions of Propyphenazone, Paracetamol and Caffeine as well as Potential Impurities

Standard solutions of propyphenazone (PP), paracetamol (PA) and caffeine (C) were prepared by dissolving their standard substances in 99.8% ethyl alcohol. Following PP, PA, C solutions were obtained, respectively: 6.0 mg/5 mL, 5.6 mg/5 mL, 5.2 mg/5 mL, 4.8 mg/5 mL, 4.4 mg/5mL, 4.0 mg/5mL, 3.6 mg/5mL, 3.2 mg/5mL, 2.8 mg/5mL, 2.4 mg/5mL, 2.0 mg/5mL, 1.6 mg/5mL, 1.2 mg/5mL, 0.8 mg/5mL, 0.4 mg/5mL, 0.3 mg/5mL, 0.2 mg/5mL, 0.1 mg/5mL. Ethanol solutions of 4-chloroacetanilide (CA), 4-aminophenol (AF) and 4-nitrophenol (NF) were prepared at a concentration of 1 mg/5 mL.
Mixture solution of PP, PA, C, CA, AF and NF in ethanol was also preparaed. The concentrations of PP, PA, C in this mixture were 5 mg/5 mL, and 1 mg/5 mL for CA, AF, and NF.
Five µL of standard solutions prepared in this way were taken and applied to chromatographic plates.

2.3. Preparation of Saridon Drug Solutions

After weighing five tablets of Saridon, they were crushed for 30 min using a four ball mill at 4000 rpm. From the obtained powder mass, the following quantities were weighed out:
• 30 mg (A1), 20 mg (A2), 10 mg (A3) of propyphenazone,
• 30 mg (A4), 20 mg (A5), 10 mg (A6) of paracetamol,
• 30 mg (A7), 20mg (A8), 10 mg (A9) of caffeine.
The aliquots containing the stated amounts of active substances were extracted for 30 min at 4000 rpm, after being quantitatively transferred to a 4-ball mill and 15 mL of 99.8% ethanol added. The next step was to filter the solution into a 50 mL flask and make up to the mark with 99.8% ethyl alcohol. Nine solutions of Saridon samples were obtained. Samples from A1 to A9 were used to investigate the precision of the proposed TLC method. However, for the quantitative determination of PA, PP and C in the drug, sample A4 was used, in which the content of individual components was within the range of the developed calibration curves. Sample A4 in 5 µL contains 3 µg PA, 1.8 µg PP, and 0.6 µg C.
Five µL of the above-mentioned solutions were taken and applied to chromatographic plates.

2.4. Description of the Conditions of TLC Combined with Densitometry

TLC analysis was performed using 10 cm x 20 cm aluminum plates coated with silica gel 60 F254 (#1.05554). The first stage of the analysis was a 30 min activation of the plates in an incubator set at 120°C. Then, standard solutions of PP, PA, C, solutions of potential impurities (CA, AF, NF) and Saridon drug extracts were applied using 5 µL micropipettes. The tests were performed using the mobile phase: chloroform + toluene + ethyl acetate + ethanol + acetic acid (80%) in a volume ratio of 18: 18: 7.5: 5: 0.3. It was selected experimentally from among the 22 mobile phases tested (Table S1). The chromatography chamber was saturated for 15 min. The plates were developed in a chromatographic chamber to a height of approx. 7.5 cm, and then dried in a fume hood for 24 hours.
Using the Camag TLC 3 densitometer, in which the radiation source is a deuterium lamp, spectrodensitometric and densitometric analysis were performed. The parameters of the first of these analyzes were: wavelength 200÷400nm, slit size 12.00x0.40 mm, Macro, scanning speed - 20 nm/s, resolution 1 nm/step. Densitometric scanning parameters were: range from 250 to 350 nm with a change in wavelength every 25 nm, slit size 12.00x0.40 mm, macro, resolution 100 µm/step and scanning speed 20 mm/s. Quantitative studies were conducted using following wavelenghts: PP and C at λ= 272 nm and PA at λ= 248 nm

2.5. Thin Layer Chromatography (TLC) Method Validation

Range, linearity, precision, accuracy, specificity, robustness, limit of detection and quantification were determined according to validation guides and previous papers [33,34,35,36,37], which allowed validating the TLC method for the determination of paracetamol, propyphenazone and caffeine.
The specificity of the normal phase thin-layer chromatography (NP-TLC) method was determined by selecting the appropriate chromatographic sorbent and mobile phase, with the use of which it is possible to separate propyphenazone, paracetamol and caffeine as well as paracetamol related substances, i.e. 4-chloroacetanilide, 4-aminophenol and 4-nitrophenol.
The linearity and range of the TLC method was evaluated by analyzing 15 standard solutions of paracetamol, propyphenazone, and caffeine applied to chromatographic plates in a volume of 5 µl. The analyses were repeated three times.
The intra-day and inter-day precisions of the method were determined based on the analysis of the surface area of the chromatographic bands of the tested samples. Test solutions of PA, PP, and C (A1-A9) were used. Densitometric measurement of the resulting spots was performed and the relative standard deviation CV [%] was calculated.
The accuracy of the method was determined by measuring the recovery of standard substances added to drug samples. The accuracy of the method was also assessed by comparing the results with the literature method [30]. The analyzes of the sample (A6) described in chapter 3.3 of the manuscript were analyzed according to the conditions given by Hałka-Grysińska et al. [30] (method B) by RP-HPTLC technique on RP18W plates using mobile phase acetonitrile + buffer pH=5.0 (citric acid 0.97 mol/L and disodium hydrogen phosphate 2.06 mmol/L) in a volume ratio of 22.5 : 77.5.
The limit of detection (LOD) and limit of quantification were determined using the calibration curve [33-36].
The robustness of the method was tested according to guidelines described in the papers by Nagy-Turák et al. and Ferenczi-Fodor et al.[34,35,36,37]. The robustness of the method was checked by spotting sample solutions on the plate and developing the plate after altering the conditions (Table S2). The method conditions and the selected factors, for which the values of their (+) and (-) levels are summarized in Table S2. A high level is represented by ‘‘+’’ and a low level by ‘‘-’’. The main effects of seven factors were tested on two levels in eight experiments [35]. The levels of factors investigated and the experimental design matrix (23) are shown in Table S3. The ways of calculation of the effects (E) characterizing the particular individual factors and rank probabilities [37] were presented in previous researches [35,36]. The calculated effects (E) were then evaluated using a semi-normal probability plot [37].

2.6. Quantitative Determination of PA, PP and C in Saridon and Comparison with Literature Method

Developing a new analytical method (method A) for the determination of paracetamol, propyphenazon, and caffeine in Saridon tablets required the comparison of the obtained results with other methods, e.g., RP-HPTLC method (method B) described by Hałka-Grysińska et al [30].
The comparison of the proposed NPTLC-densitometric method (method A) with the RP-HPTLC method (method B) to determine PA, PP, and C in pharmaceutical preparation was studied by the use of ten independently repeated different analyses. The samples A4 and A6 (described in section 2.3) were investigated by methods A and B, respectively, Students t-test and the F-Snedecor value were used to check the significance of the differences between the two analytical methods.

2.7. Statistical Analysis

Statistical studies of the analysis results were made using the Statistica v. 13 PL program (StatSoft, Kraków, Poland), and the charts using Microsoft Office Excel 2016.

3. Results and Discussion

3.1. Validation

The proposed method for the simultaneous determination of paracetamol, propyphenazone and caffeine in Saridon tablets has been fully validated. The validation results are presented in Tables 3-6 and Figures 1-8, Figures S1-S12, and described in the following subsections.

3.1.1. Selection of Chromatographic Conditions
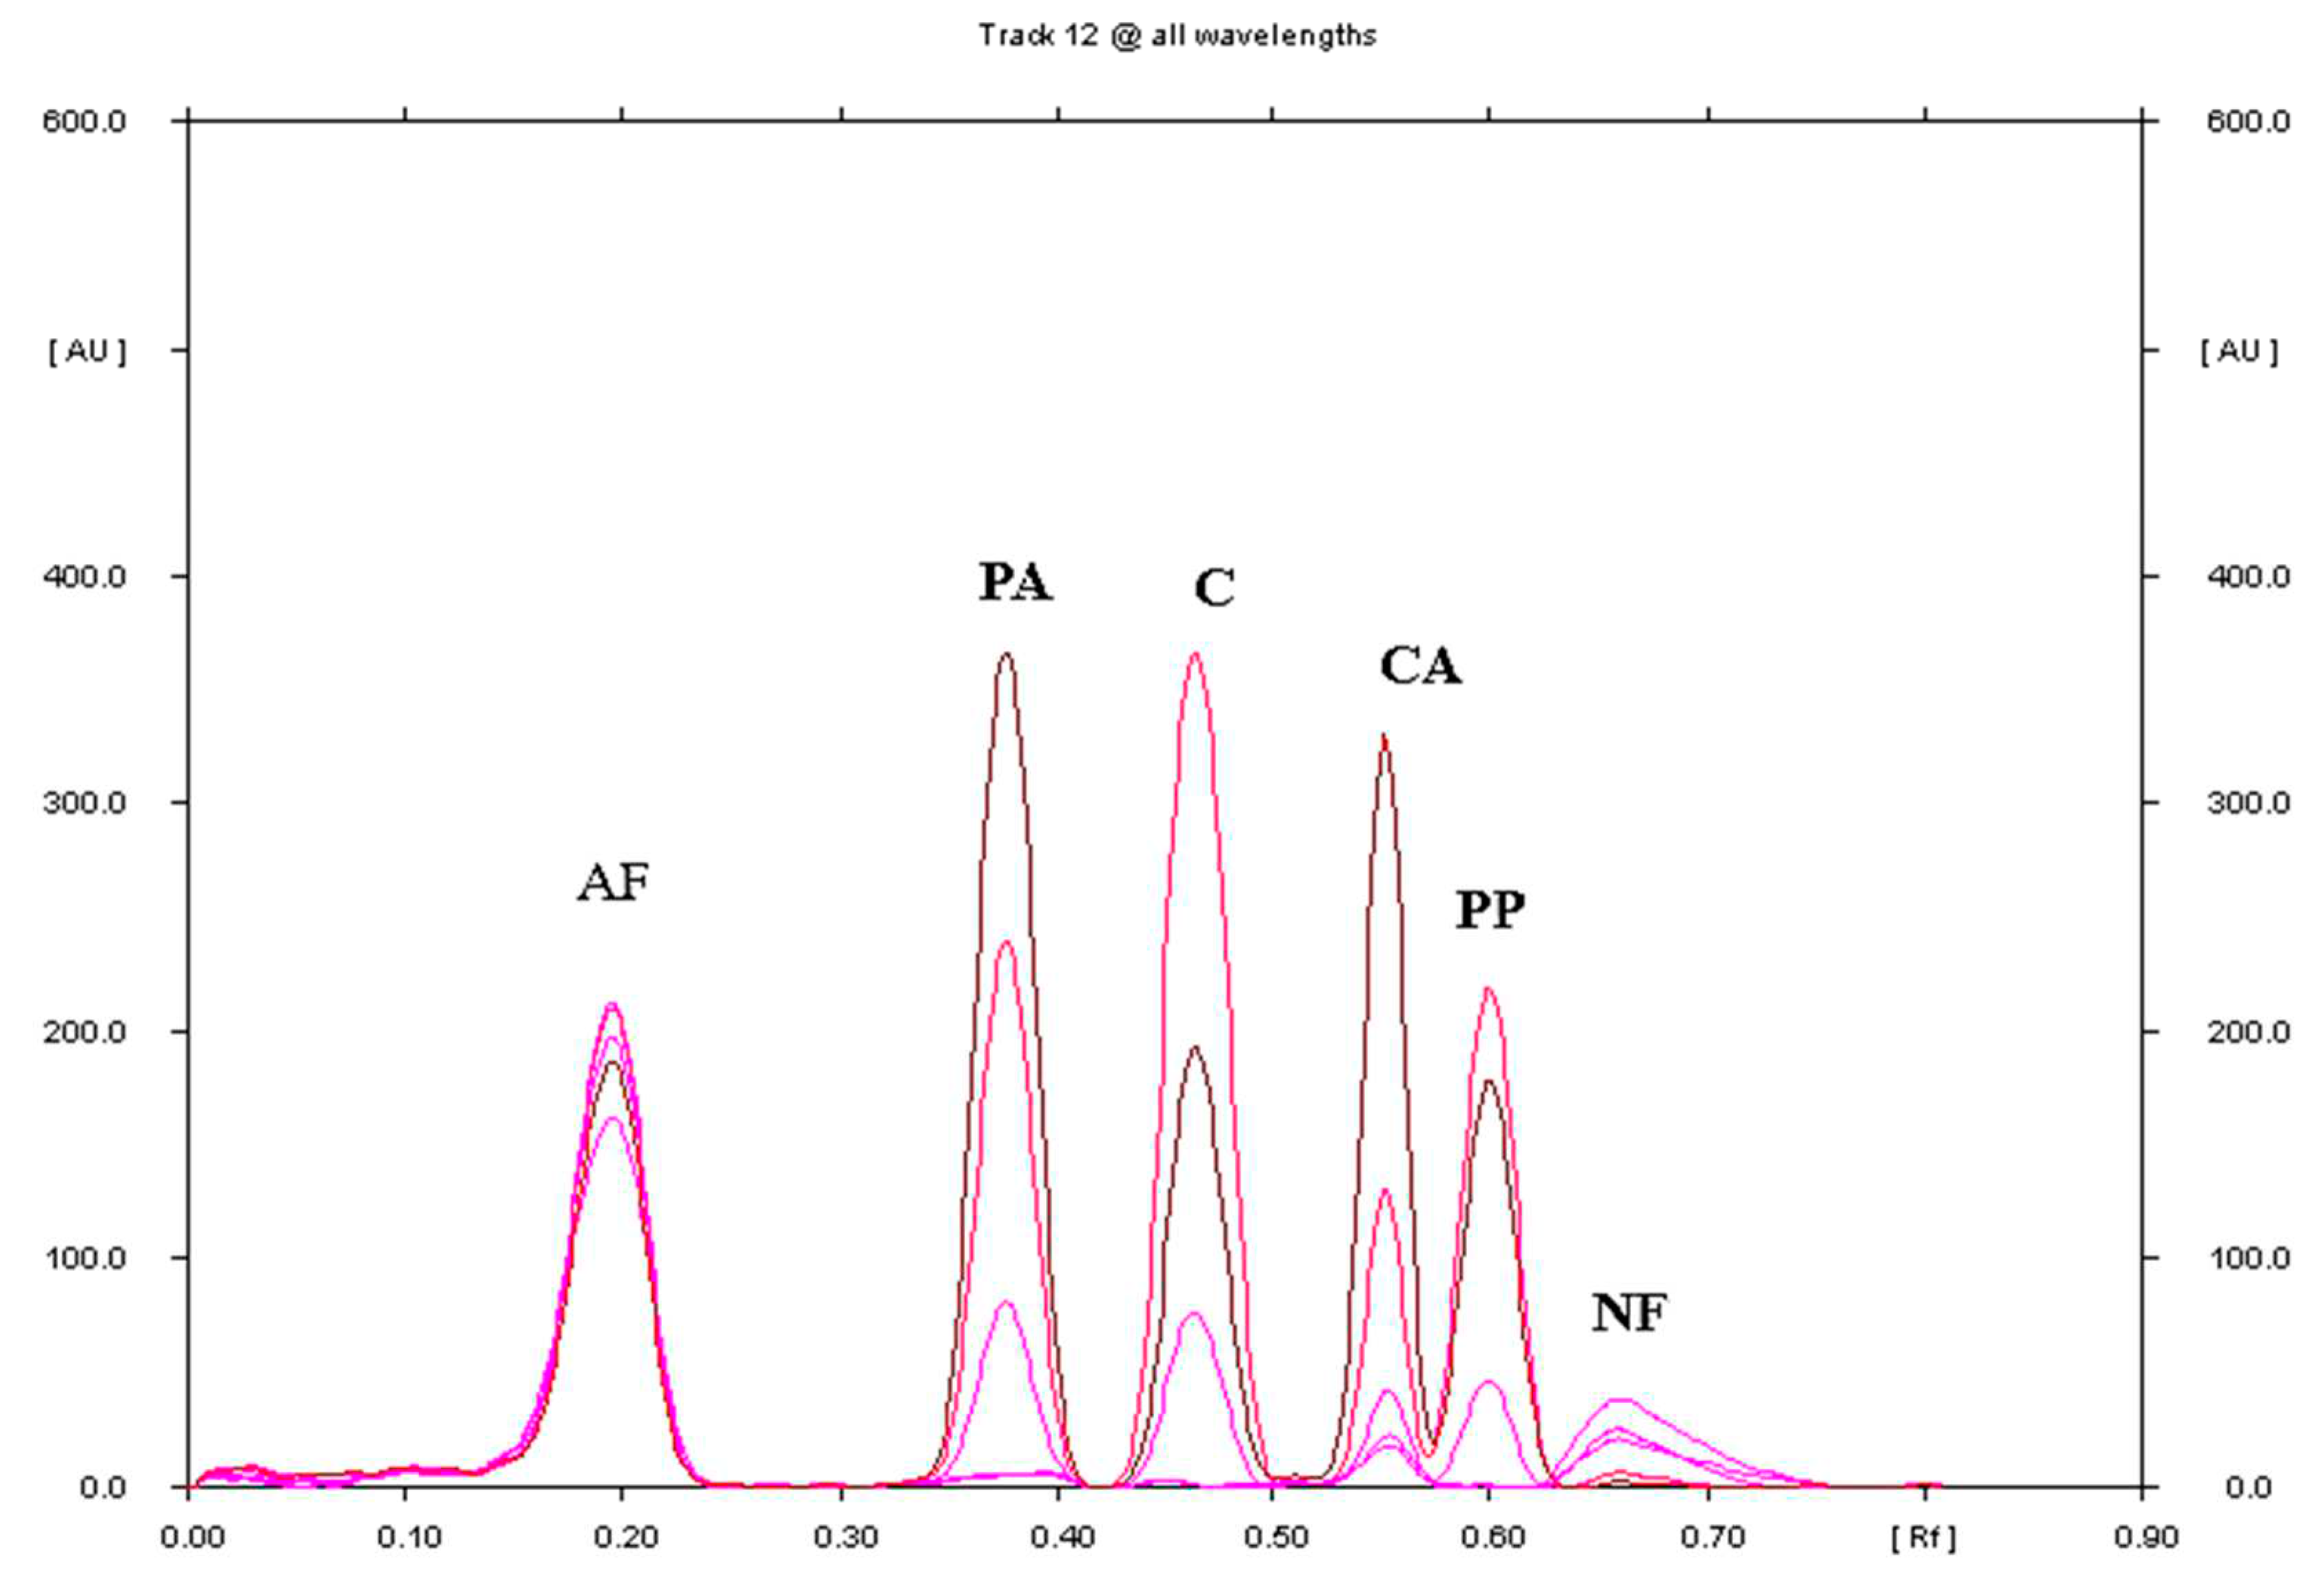
According to the guidelines for validation of analytical methods [33,34] used in pharmaceutical analysis, specificity (selectivity) is an important parameter proving that an analytical procedure allows to determine the API presence in the tested pharmaceutical preparation along with related substances that may be their contaminants. In order to select the optimal mobile phase ensuring the separation of propyphenazone (PP), paracetamol (PA), caffeine (C), 4-chloroacetanilide (CA), 4-aminophenol (AF) and 4-nitrophenol (NF), 22 chromatographic conditions were tested (Table S1). The subject of the research were mobile phases consisting of selected solvents such as acetone, chloroform, ammonia, n-hexane, toluene, ethyl acetate, methanol, ethanol, acetic acid 80%), acetonitile, buffer at pH=5. Hałka-Grysińska et al. [30] determined the separation of propyphenazone (PP), paracetamol (PA) and caffeine (C) by RP-HPTLC on RP18W plates using the mobile phase acetonitrile + buffer pH=5.0 in a volume ratio of 22.5:77.5. However, these authors did not demonstrate the specificity of this method. The use of chromatographic conditions in this manuscript did not allow for separation of caffeine from 4-nitrophenol and 4-aminophenol from paracetamol (Figure S1). Further analyzes were performed on ordinary NP-TLC plates, i.e. aluminum foil precoated with silica gel 60F254. Other selected mobile phases that have previously been used to analyze paracetamol and caffeine in simple and combined preparations were tested [12,38]. These mobile phases (acetone + chloroform + ammonia, 10 : 40: 0.5 and n-hexane + acetone + ammonia, 25 : 25: 0.5) failed to separate caffeine from 4-aminophenol and paracetamol from 4-nitrophenol (Figure S2), and paracetamol from 4-nitrophenol (Figure S3). The mobile phase chloroform + toluene + ethyl acetate + methanol + acetic acid 80%, 6:6:1:2:0.1 was previously used for the analysis of propyphenazone (PP), paracetamol (PA), caffeine (C), 4-nitrophenol (NF), and 4-aminophenol (AF) [24]. This mobile phase, however, fails to separate the caffeine from the 4-chloroacetanilide under these conditions (Figure S4). This mobile phase was modified in terms of changing the volume composition of individual components and the methanol was also replaced with ethanol. A total of 18 mobile phases were tested (Table S1). Studies have shown that the optimal mobile phase is: chloroform + toluene + ethyl acetate + ethanol + acetic acid (80%) in a volume ratio of 18: 18: 7.5: 5: 0.3. The densitogram of standard substances such as propyphenazone (PP), paracetamol (PA), caffeine (C), 4-chloroacetanilide (CA), 4-aminophenol (AF) and 4-nitrophenol (NF) is shown in Figure 1. Mobile phases: chloroform + toluene + ethyl acetate + methanol + acetic acid 80%, 6:6:2:2:0.1 and chloroform + toluene + ethyl acetate + ethanol + acetic acid 80%, 6:6:6:2:0.2 also allow for the separation of all tested substances. However, using the mobile phase of chloroform + toluene + ethyl acetate + ethanol + acetic acid (80%) in a volume ratio of 18: 18: 7.5: 5: 0.3, better separation of C from CA is obtained than using chloroform + toluene + ethyl acetate + methanol + acetic acid 80%, 6:6:2:2:0.1 (Figure S5) and better separation of C from PA than mobile phase chloroform + toluene + ethyl acetate + ethanol + acetic acid 80%, 6:6:6:2:0.2 (Figure S6).
Figure 1. Densitogram of a mixture of standard substances: propyphenazone (PP), paracetamol (PA), caffeine (C), 4-chloroacetanilide (CA), 4-aminophenol (AF), and 4-nitrophenol (NF) made in the range of 250-350 nm with a change in wavelength every 25 nm (different colours on the densitogram), using plates precoated with silica gel 60F254 and phase mobile phase: chloroform + toluene + ethyl acetate + ethanol + acetic acid (80%) in a volume composition of 18: 18: 7.5: 5: 0.3.
Preprints 91853 g002
It follows that the best mobile phase ensuring the separation of the reference substances propyphenazone (PP), paracetamol (PA) and caffeine (C) as well as 4-chloroacetanilide (CA), 4-aminophenol (AF) and 4-nitrophenol (NF) was mobile phase with the composition of chloroform + toluene + ethyl acetate + ethanol + acetic acid 80%, and the volume ratio 18:18:7.5:5:0.3. Using this mobile phase, the following Rf values were obtained: Rf(AF)= 0.20±0.05, Rf(PA)= 0.38±0.04, Rf(C)= 0.47±0.02, Rf (CA)=0.54±0.03, Rf(PP)=0.60±0.02, Rf(NF)=0.67±0.02. The resolution factor (RS) calculated had the following values: RS(AF/PA)= 3.00, RS(PA/C)= 1.62, RS(C/CA)= 2.14, RS(CA/ PP)=1.23, RS(PP/NF)=0.86. Spectrodensitometric analysis indicates that the maximum absorption of propyphenazone and caffeine occurs at 272 nm, and that of paracetamol at 248 nm.
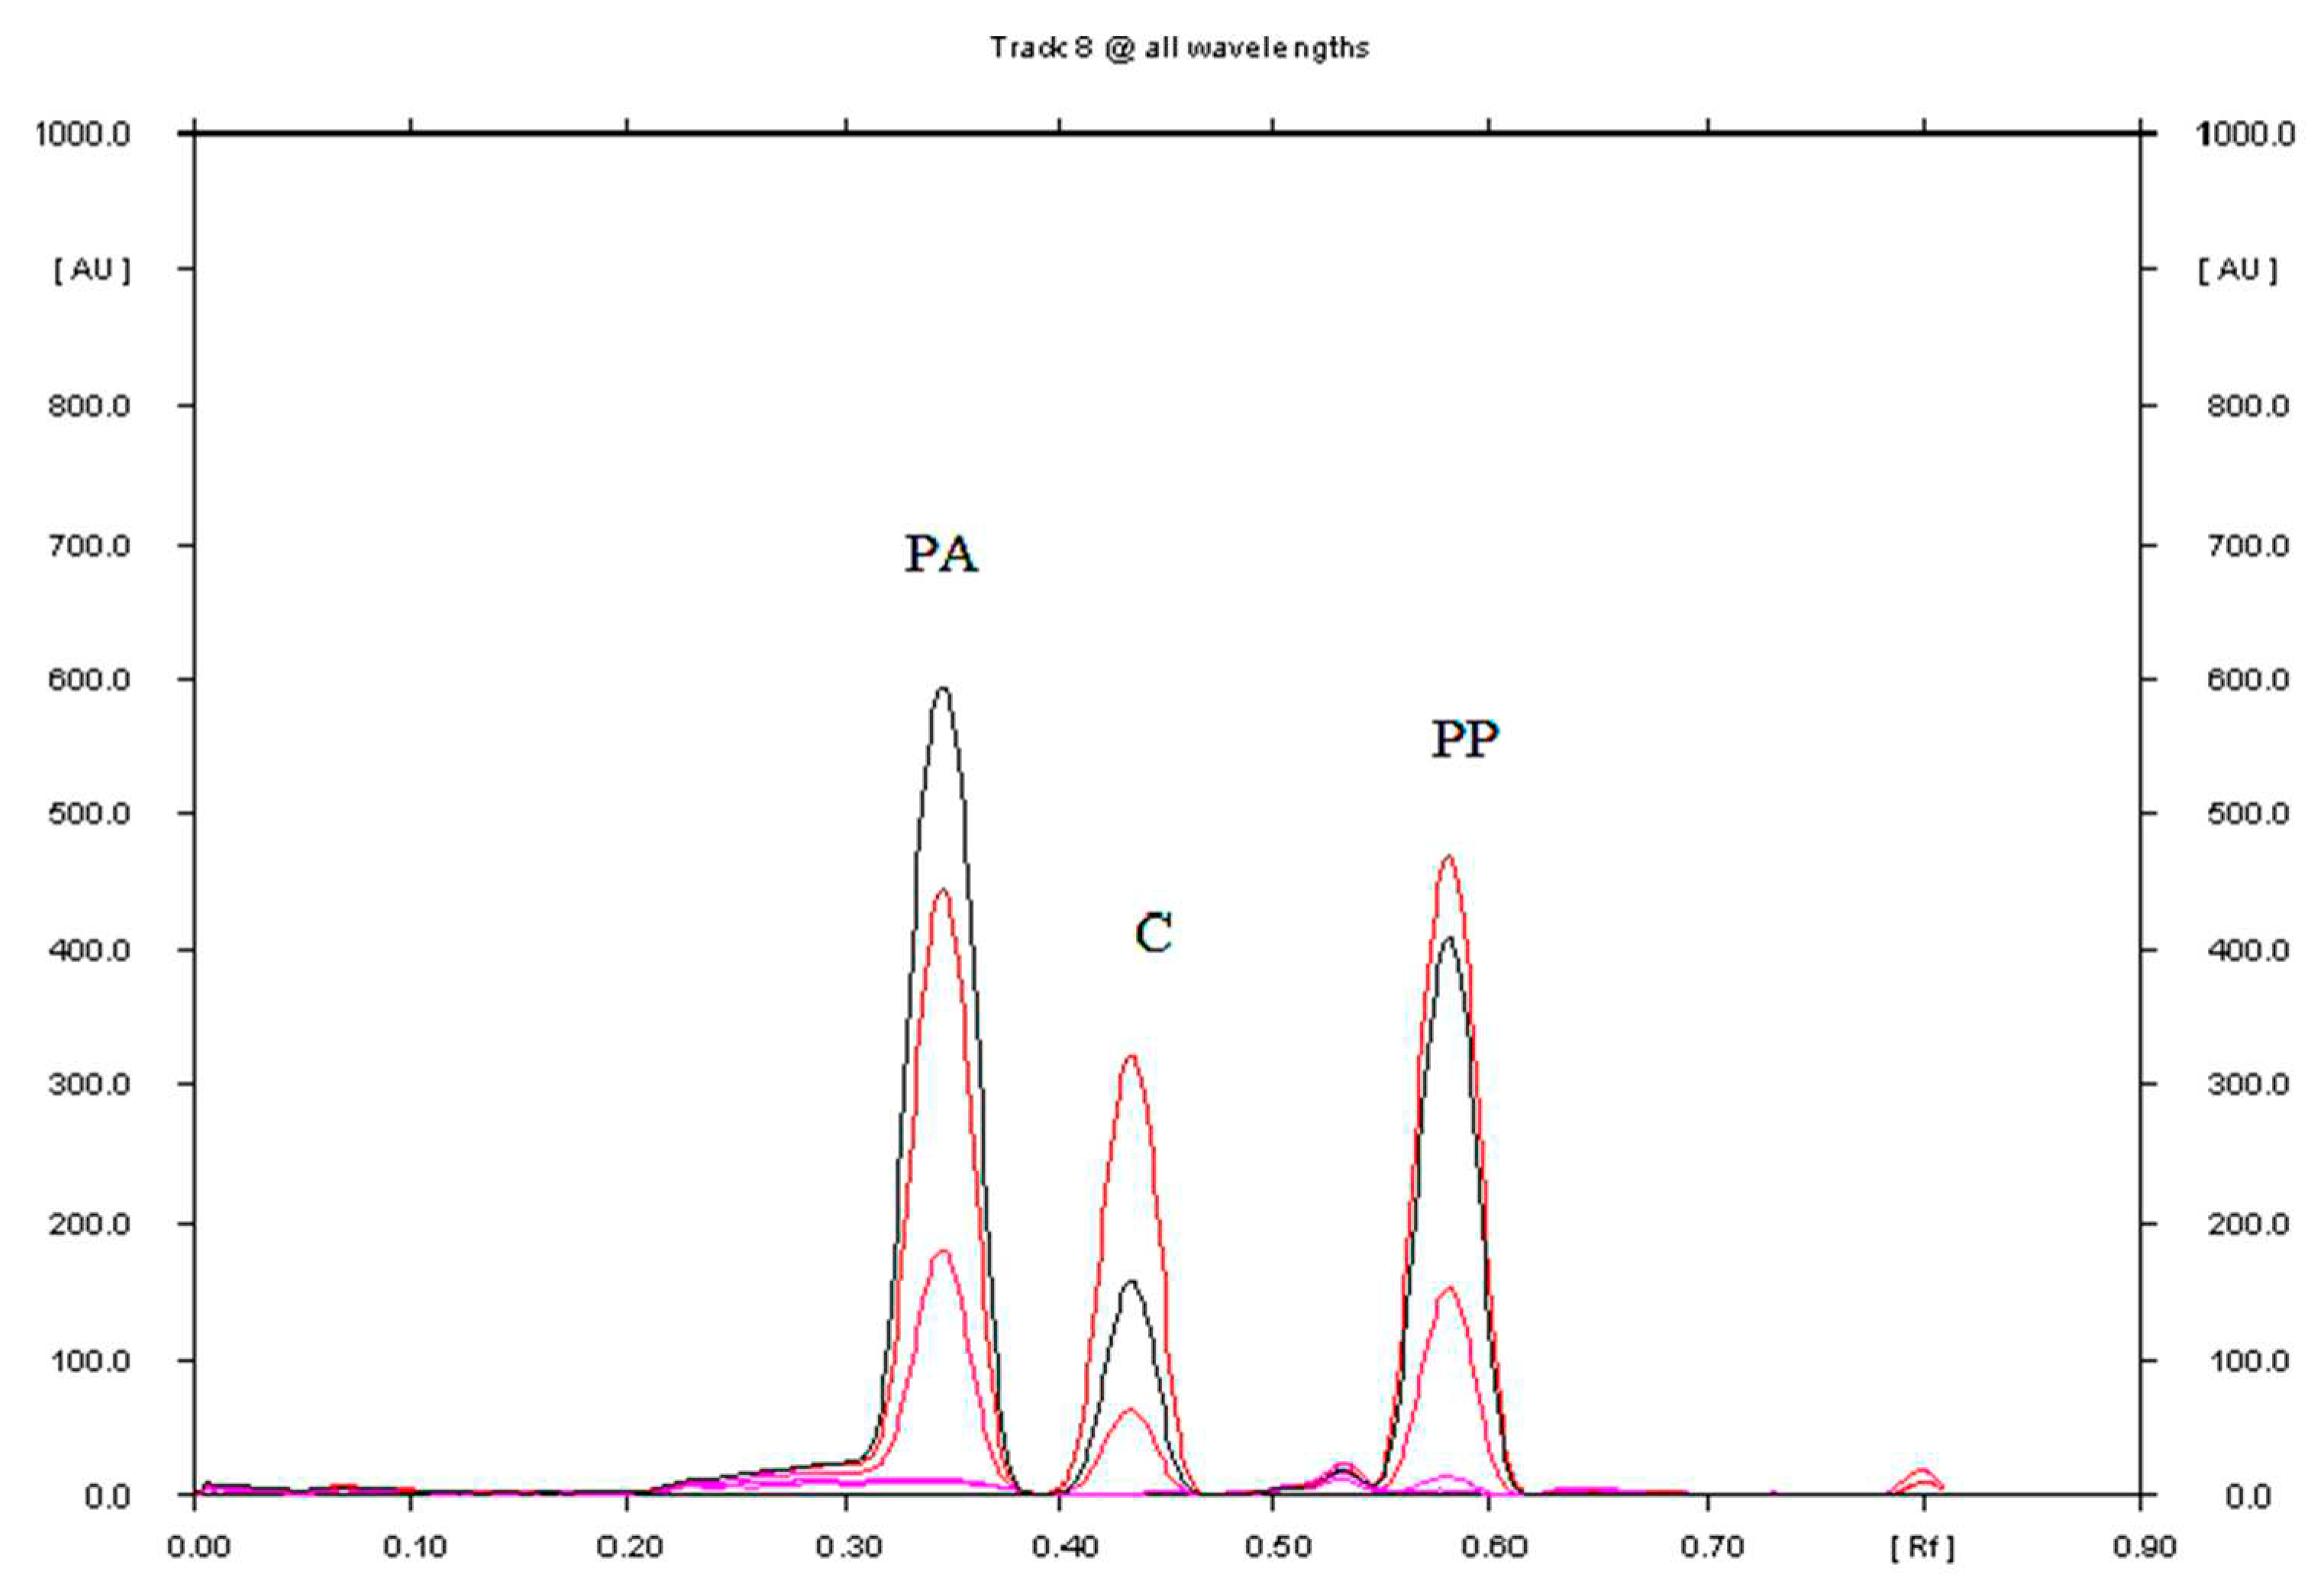
The densitogram obtained from the Saridon drug extract for the optimal chromatographic conditions, shown in Figure 2, indicates that there are no additional chromatographic bands from the analyzed preparation. Only three chromatographic bands are observed on the densitogram, i.e. those corresponding to paracetamol, propyphenazone and caffeine. No matrix effect on the separation and determination of PA, PP, and C was observed.
Comparisons of the spectrodensitograms of propyphenazone (PP), paracetamol (PA) and caffeine (C) standards with the spectrodensitograms of these substances present in Saridon samples are presented in Figures S7, S8 and S9 respectively. The absorption maximum occurs at λ= 272 nm for PP and PA, as well as at λ= 248 nm for C. Therefore, the developed chromatographic conditions can also be successfully used to confirm the identity of paracetamol, propyphenazone and caffeine in their combined Saridon preparation.
The densitogram of propyphenazone (PP), paracetamol (PA) and caffeine (C) presented in Figure 2 confirms that the TLC technique combined with densitometry used for the quantitative determination of propyphenazone (PP), paracetamol (PA) and caffeine (C) in the pharmaceutical preparation Saridon is highly selective. The mean Rf of PA, C, and PP values ​​were 0.38, 0.47, and 0.60, respectively. The Rf values ​​of the propyphenazone (PP), paracetamol (PA) and caffeine (C) standards are consistent with the Rf for PP, PA and C determined in Saridon. What is more, spectrodensitograms of propyphenazone (PP), paracetamol (PA) and caffeine (C) standards are similar to PP, PA and C spectrodensitograms from the drug samples (Figures S7, S8 and S9).
Normal phase thin-layer chromatography (NP-TLC) with densitometry can be used for quantitative analysis of propyphenazone (PP), paracetamol (PA) and caffeine (C) in drugs, using the area values ​​of chromatographic bands for calculations. Qualitative identification of the above-mentioned compounds can be made on the basis of the values ​​of retardation coefficients and spectrodensitometric analysis.

3.1.2. Linearity and Range

To determine the range of linearity, the relationship between the area of ​​the densitometric band (Table 1, Figures S10A, S811A, S12A) and the concentration of propyphenazone (PP), paracetamol (PA) and caffeine (C) standards [µg/spot] was used. The linearity range for propyphenazone was found to be 0.8÷4.0 µg/spot, for paracetamol and caffeine 0.4÷4.0 µg/spot, as shown in Figures S10A, S11A and S12A, respectively. The differences between the real values ​​of the chromatographic band areas and the values ​​calculated using the appropriate calibration curves are shown in Figures S10B, S11B and S12B. Figures S10B, S11B and S12B indicate the correct choice of linearity ranges for paracetamol, propyphenazone and caffeine.

3.1.3. Precision

The measure of the precision of the developed method is the coefficient of variation (CV). Intra-day and inter-day precisions were determined by analyzing solutions of API samples with concentrations of 3.0; 2.0 and 1.0 µg per spot. The resulting chromatographic spots were evaluated by densitometric analysis and the CV was determined. The values ​​of the coefficients CV allow the method to be considered precise, because for propyphenazone they ranged from 0.68% to 1.10% and from 0.53% to 1.26%, for paracetamol from 0.35% to 1.56% and from 0 .79% to 1.54%, and for caffeine from 0.75% to 1.08% and from 0.82% to 1.06%, respectively for intraday and interday precisions (Table 1).

3.1.4. Accuracy

Measurement of the recovery allowed to assess the accuracy of the proposed NP-TLC method. The appropriate amount of the powdered tablet mass was supplemented with standard substances of propyphenazone, paracetamol and caffeine in the ratio of: 50%, 100% and 150% to their content in the weighed amount of the drug. The average recovery for propyphenazone was: 99.0%, 98.8% and 98.4%, for paracetamol: 100.2%, 100.0% and 99.6% and for caffeine: 99.7% , 100.2% and 99.2%, respectively for 50%, 100% and 150% of standard substances added to the Saridon samples (Table 1). The accuracy of the method is indicated by the low values ​​of the coefficient of variation, which was <3% for propyphenazone and paracetamol, and <2% for caffeine. The repeatability of the developed method, which is measured by recovery, is comparable, and in some cases better than the repeatability obtained by TLC and HPTLC techniques by other researchers for simple and combined pharmaceutical preparations containing paracetamol, propyphenazaone, caffeine [8,9,10,11,12,13,24,30,38.

3.1.5. Limit of Detection (LOD) and Limit of Quantification (LOQ) investigated APIs and Comparison with Literature Data

Based on the parameters of the special calibration curve obtained for paracetamol, propyphenazone and caffeine, respectively, the limit of detection (LOD) and the limit of quantification (LOQ) for PA, PP and C were estimated using the NPTLC method combined with densitometry. These calibration curves were obtained on the base of the analysis of three standard solutions containing paracetamol, propyphenazone, and caffeine with following concetrations: 0.20; 0.30 and 0.40 mg/5mL. An example densitogram of a mixture of PA, C, and PP standards with a concentration of each standard of 0.20 µg/spot is shown in Figure S13. The average values ​​of the limit of detection of the tested APIs were: 0.016, 0.032 and 0.054 µg/spot, respectively for PA, PP and C. The limit of quantification of tested APIs were: 0.048, 0.096 and 0.162 µg/spot for PA, PP and C, respectively (Table 1). Proposed method is characterized by low LOD and LOQ for the determination of PA, PP and C, which confirm sensitivity of the proposed method.
Table 2 compares the LOD and LOQ values ​​with the literature data for PA, PP and C. Comparing all LOD and LOQ values ​​presented in Table 2, it should be noted that particularly high LOD and LOQ values ​​for PA, C and PP were obtained by Ibrahim et al [24]. This may be due to, among others, from the fact that Ibrahim et al. [24] performed densitometric measurements at 220 nm, while the maximum absorption occurs at λ = 272 nm for PP and PA and at λ = 248 nm for C. The method developed in this workis more sensitive, with lower LOD and LOQ values ​​for PA, PP and C than previously described TLC methods for the simultaneous determination of PA, PP and C [24,30]. Better LOD and LOQ were obtained only when paracetamol and caffeine [9] or caffeine alone [39] were determined in pharmaceutical preparations. But these analyzes were carried out with more cost-intensive techniques, namely NP-HPTLC and RP-HPTLC.

3.1.6. Robustness

The rules for testing robustness were described in detail in reference publications [35,36,37].
Seven factors were changed, namely the activation temperature of the chromatographic plate, the time of tablet extraction, the time of saturation of the chromatographic chamber and slight changes in the volume of the mobile phase components, i.e. chloroform, toluene, ethyl acetate and ethanol (Table S2). These factors were tested on two levels in eight experiments (Table S2). Table 3 shows the results obtained for PA, PP, and C content (yi) in Saridon tablets. The main effects (E) of the factors calculated from these results (yi) are also presented in Table 3. The calculated statistical data presented in Table 3 indicate that the changed analysis parameters have no impact on the analysis result, because the coefficient of variations is less than 2%. These results show that no factor has significant effect on the results. To evaluate whether the proposed NPTLC method combined with densitometry is robust, these results were evaluated by half-normal probability plotting of rank probabilities (pi) as a function of the absolute values of the main effects. The effects of factors, and half-normal probability plot of effects for the determination of PA, PP, and C in Saridon tablets are presented in Figures S14, S15 and S16, respectively. The points of all factors lie near the straight line, which indicates that their effect is negligible (R2≥0.9424). Therefore, the presented NPTLC-densitometric method can be regarded as robust. The standard deviation of paracetamol, propyphenazone, and caffeine content (yi) in Saridon tablets at seven parameters which have been changed in conducted experiment in order to check the robustness of applied method is placed of 1.5%, 1.2% and 1.8% for PA, PP, and C, respectively. The value of CV in percent (<2) indicates the reliability of proposed NPTLC-densitometric method during its normal use. The only criterion to fulfill the robustness of this method is the content of the acetic acid (80%) in the mobile phase must be constant.
3.2.. Quantification of APIs in Saridon Tablets by Proposed NPTLC-Densitometric Method and Comparison with Literature Method
Table 4 presents the results of the actual content of the tested paracetamol, propyphenazone and caffeine in Saridon tablets obtained by the developed NP-TLC method in combination with densitometry. Statistical parameters listed in Table 6 made it possible to evaluate the obtained results. According to Table 4, the actual APIs contents are 254.1 mg/tablet, 149.7 mg/tablet, and 50.4 mg/tablet for PA, PP and C, respectively. Compared to the values declared by the manufacturer of Saridon, the prestented method indicatess values of 101.6%, 99.8% and 100.8% o for PA, PP and C, respectively. These values ​​are in accordance with the pharmacopoeial guidelines, i.e. they should be in the range of 95-105% for paracetamol and caffeine and in the range of 90-110% for propyphenazone. All these results meet the recommendations of the Polish and USP pharmacopoeias [40,41]. The proposed method allows for the simultaneous determination of PA, PP, and C in the same sample.
To verify the results obtained by the proposed NPTLC-densitometric method (method A), comparison was made with a previous report using the method (method B). The method described by Hałka-Grysińska et al. [30] was used as an accurate method (method B). The comparison of the results obtained with both methods are presented in Table 4. The PA, PP and C contents in Saridon tablets obtained by both methods A and B were similar. The coefficients of variance were smaller than 3% in each case. High reproducibility and insignificant differences between the two compared methods were obtained at the 95% probability level for t-test and F-test of significance of 0.364<2.101 and 1.11<3.18; 1.756<2.101 and 2.04<3.18; and 0.923<2.101 and 2.94<3.18, respectively for paracetamol (PA), propyphenazone (PP) and caffeine (C). These results statistically confirmed the TLC-densitometric method is accurate and can be used as a substitute method. The calculated values ​​of the t and F tests indicate that the proposed in this work NP-TLC method is accurate.

3.3. Comparison of TLC and HPLC for the Separation and Determination of Paracetamol, Propyphenazone and Caffeine

Liquid chromatography, and more precisely HPLC and TLC in accordance with pharmacopeal recommendations, are important techniques for testing drugs. Important parameters characterizing the analytical method are the limit of detection (LOD) and the limit of quantification (LOQ) of the tested sample component. Table 2 and Table S4 present literature LOD and LOQ data for paracetamol (PA), propyphenazone (PP) and caffeine (C) analyzed by TLC and HPLC, respectively.
In thin layer chromatography, the rule is that LOD and LOQ are given in µg/spot. However, in HPLC, LOD and LOQ are given in µg/mL.
The LODs obtained by the developed in this work TLC method combined with densitometry for PA, PP and C were 0.016 µg/spot, 0.032 µg/spot, and 0.052 µg/spot, respectively. Which, when converted to µg/mL, is 3.2, 6.4, and 10.4 for PA, PP and C, respectively. The developed in this work TLC method combined with densitometry for the quantitative determination of PA, PP and C is more sensitive than previously described TLC methods [8-12, 14,24,30,38,39] (Table 2). However, this method is less sensitive than the developed HPLC methods for the determination of PA, PP, and C [6,7,13,15,17,20,22-25,31,42] (Table S4). In the case of determining PA, PP and C in drugs, the sensitivity of the developed TLC method combined with densitometry is sufficient due to the significant amounts of APIs present in the drug.
Substances for pharmaceutical purposes and medicinal products that are found on the market must ensure the suitable quality which guarantees safe use and efficacy. The substance and medinal product must fulfill all quality criteria regarding identity, purity, active substance content and suitability. These properties are contained in specified documents, including pharmacopoeial mongraphs forming pharmacopoeia. To confirm the identity of therapeutic substances or excipients, tests are used that allow to clearly confirm their identity. The preferred method for testing the identity of organic compounds is infrared absorption spectrophotometry and chromatographic methods. The high performance liquid chromatography (HPLC), thin layer chromatography (TLC) and gas chromatography (GC) methods are the most commonly used chromatographic methods. Identity confirmation is obtained by comparing the retention times or retardation factors (TLC) of the examined substance and the reference substance in chromatographic methods. Therefore, the developed NPTLC method combined with densitometry can be used to test the purity of drugs containing paracetamol, propyphenazone and caffeine. This method can be successfully used to test the identity and quantification of APIs in a combined drug. Elaborated NPTLC-densitometric method is sensitive and economic. Thin layer chromatography (TLC) is a complementary method to high-performance liquid chromatography (HPLC) and can be used to determine PA, PP, C in drugs when HPLC is not available in the laboratory. Thin layer chromatography (TLC) has various features that contribute to its popularity and wide applications. Here are some important advantages of TLC: lower solvent consumption than column chromatography; several different samples can be separated simultaneously on the chromatographic layer; the separation process may be stopped at any time; stepwise or two-way elution can be used; separated samples do not need to be pre-cleaned. Compared to other analytical methods, this method is not very labor-intensive. TLC is an inexpensive chromatographic method. TLC equipment is generally inexpensive, and consumables such as TLC plates and solvent solutions are widely available and inexpensive. As a result, TLC is a viable option for regular analysis and large-scale applications. Much lower consumption of mobile phases in TLC and the possibility of simultaneous analysis of up to a dozen samples on a chromatographic plate contribute to the fact that TLC is a more ecological method than HPLC. When using HPLC, only one sample is analyzed at a this same time and large amounts of eluent are used.

4. Conclusions

The mixture of chloroform + toluene + ethyl acetate + ethanol + acetic acid (80%) 18: 18: 7.5: 5.0: 0.3, v/v and TLC plates (#1.05554) precoated with silica gel 60F254 are optimal chromatographic conditions for identity testing and quantification paracetamol, propyphenazone and caffeine in their combined pharmaceutical preparation Saridon. Under these chromatographic conditions, PA, PP and C separate from 4-chloroacetanilide, 4-aminophenol and 4-nitrophenol. The proposed method allows for the simultaneous determination of PA, PP, and C in the same sample. Obtained validation parameters of the developed method confirm that the proposed NP-TLC method in combination with densitometry is precise, accurate, robust and sensitive. The sensitivity of the developed method is better than the previously described TLC methods for the determination of PA, PP and C. It allows you to determine paracetamol, propyphenazone and caffeine at the same level. The LOD and LOQ values ​​of the proposed method are about 50-100 times lower than the LOD and LOQ values ​​in the method described by Ibrahim H. et al [24]. The developed NP-TLC method in combination with densitometry is economical, it does not require the use of plates for high-performance thin-layer chromatography, which are several times more expensive than plates for classic thin-layer chromatography. In addition, the proposed method is easy to use and can be used in the routine control of combined pharmaceutical preparations containing simultaneously paracetamol, propyphenazone and caffeine. Proposed method will be an excellent economic and ecological alternative when HPLC method is unavailable in laboratory.

Supplementary Materials

The following are available online. Table S1: Chromatographic conditions tested. Table S2: The factors and their levels investigated in robustness test. Table S3: Experimental design matrix (23) for robustness test . Figure S1: Densitogram of a mixture of standard substances: propyphenazone (PP), paracetamol (PA), caffeine (C), 4-chloroacetanilide (CA), 4-aminophenol (AF), and 4-nitrophenol (NF) made in the range of 250-350 nm, using RP18W plate and mobile phase: acetonitrile + buffer pH=5.0 (22.5:77.5, v/v). Figure S2: Densitogram of a mixture of standard substances: propyphenazone (PP), paracetamol (PA), caffeine (C), 4-chloroacetanilide (CA), 4-aminophenol (AF), and 4-nitrophenol (NF) made in the range of 250-350 nm, using silica gel 60F254 plate and mobile phase: acetone + chloroform + ammonia (10 : 40: 0.5, v/v). Figure S3: Densitogram of a mixture of standard substances: propyphenazone (PP), paracetamol (PA), caffeine (C), 4-chloroacetanilide (CA), 4-aminophenol (AF), and 4-nitrophenol (NF) made in the range of 250-350 nm, using silica gel 60F254 plate and mobile phase: n-hexane + acetone + ammonia (25 : 25: 0.5, v/v). Figure S4: Densitogram of a mixture of standard substances: propyphenazone (PP), paracetamol (PA), caffeine (C), 4-chloroacetanilide (CA), 4-aminophenol (AF), and 4-nitrophenol (NF) made in the range of 250-350 nm, using silica gel 60F254 plate and mobile phase: chloroform + toluene + ethyl acetate + methanol + acetic acid 80% (6:6:1:2:0.1, v/v). Figure S5: Densitogram of a mixture of standard substances: propyphenazone (PP), paracetamol (PA), caffeine (C), 4-chloroacetanilide (CA), 4-aminophenol (AF), and 4-nitrophenol (NF) made in the range of 250-350 nm, using silica gel 60F254 plate and mobile phase: chloroform + toluene + ethyl acetate + methanol + acetic acid 80% (6:6:2:2:0.1, v/v). Figure S6: Densitogram of a mixture of standard substances: propyphenazone (PP), paracetamol (PA), caffeine (C), 4-chloroacetanilide (CA), 4-aminophenol (AF), and 4-nitrophenol (NF) made in the range of 250-350 nm, using silica gel 60F254 plate and mobile phase: chloroform + toluene + ethyl acetate + ethanol + acetic acid 80% (6:6:6:2:0.2, v/v). Figure S7: Comparison of the spectrodensitogram obtained for the standard substance propyphenazone with the spectrodensitogram obtained for propyphenazone, the source of which was a sample of Saridon. Figure S8: Comparison of the spectrodensitogram obtained for the standard substance paracetamol with the spectrodensitogram obtained for paracetamol, the source of which was a sample of Saridon. Figure S9: Comparison of the spectrodensitogram obtained for the standard substance caffeine with the spectrodensitogram obtained for caffeine, the source of which was a sample of Saridon Figure S10: Calibration plot (A) and plot of residuals (B) for paracetamol (PA) in the linear working range mobile phase: chloroform + toluene + ethyl acetate + ethanol + acetic acid (80%) in a volume ratio of 18: 18: 7.5: 5.0: 0.3. Figure S11: Calibration plot (A) and plot of residuals (B) for propyphenazone (PP) in the linear working range mobile phase: chloroform + toluene + ethyl acetate + ethanol + acetic acid (80%) in a volume ratio of 18: 18: 7.5: 5.0: 0.3. Figure S12: Calibration plot (A) and plot of residuals (B) for caffeine (C) in the linear working range mobile phase: chloroform + toluene + ethyl acetate + ethanol + acetic acid (80%) in a volume ratio of 18: 18: 7.5: 5.0: 0.3. Figure S13: Densitogram of standard mixture of PA, C, PP (each standard about concentration 0.20 µg/spot). Figure S14: Robustness test: the effects of factors (A), and half-normal probability plot of effects (B) for determination of paracetamol (PA) in Saridon tablets. Figure S15: Robustness test: the effects of factors (A), and half-normal probability plot of effects (B) for determination of propyphenazone (PP) in Saridon tablets. Figure S16: Robustness test: the effects of factors (A), and half-normal probability plot of effects (B) for determination of caffeine (C) in Saridon tablets. Table S4: Literature values of LOD and LOQ of PA, PP, and C investigated by HPLC and micellar liquid chromatography techniques.

Funding

This research was funded by Medical University of Silesia grant number PCN-1-040/K/2/F.

Data Availability Statement

Not applicable.

Conflicts of Interest

The author declare that there is no conflict of interests regarding the publication of this paper.

References

  1. Willson, C. The clinical toxicology of caffeine: A review and case study. Toxicology Reports 2018, 5, 1140–1152. [Google Scholar] [CrossRef] [PubMed]
  2. Andrews, K.W.; Schweitzer, A.; Zhao, C.; Holden, J.M.; Roseland, J.M.; Brandt, M.; Dwyer, J.T.; Picciano, M.F.; Saldanha, L.G.; Fisher, K.D.; Yetley, E.; Betz, J.M.; Douglass, L. The caffeine contents of dietary supplements commonly purchased in the US: analysis of 53 products with caffeine – contsining ingredients. Anal Bioanal Chem. 2007, 398, 231–239. [Google Scholar] [CrossRef]
  3. Granados-Soto, V.; Castañeda-Hernández, G. A review of the pharmacokinetic and pharmacodynamic factors in the potentiation of the antinociceptive effect of nonsteroidal anti-inflammatory drugs by caffeine. J Pharmacol Toxicol Methods. 1999, 42, 67–72. [Google Scholar] [CrossRef] [PubMed]
  4. Kovacs, S.; Hawes, S.E.; Maley, S.N.; Mosites, E.; Wong, L.; Stergachis, A. Technologies for detecting falsified and substandard drugs in low and middle-income countries. PLoS ONE 2014, 9, e90601. [Google Scholar] [CrossRef] [PubMed]
  5. Höllein, L.; Kaale, E.; Mwalwisi, Y.H.; Schulze, M.H.; Holzgrabe, U. Routine quality control of medicines in developing countries: Analytical challenges, regulatory infrastructures and the prevalence of counterfeit medicines in Tanzania, TrAC Trends Anal. Chem. 2016, 76, 60–70. [Google Scholar] [CrossRef]
  6. Hassouna, M.E.; Issa, Y.M.; Zayed, A.G. Determination of residues of acetaminophen, caffeine, and drotaverine hydrochloride on swabs collected from pharmaceutical manufacturing equipment using HPLC in support of clearing validation. J AOAC Int. 2014, 97(5), 1439–1445. [Google Scholar] [CrossRef] [PubMed]
  7. Mohammed, O.J.; Hamzah, M.J.; Saeed, A.M. RP–HPLC method Vvalidation for simultaneous estimation of paracetamol and caffeine in formulating pharmaceutical form. Res. J. Pharm. & Technol. 2021, 14, 4743–4748. [Google Scholar] [CrossRef]
  8. Soponar, F.; Moţ, A.C.; Sârbu, C. Quantitative evaluation of paracetamol and caffeine from pharmaceutical preparations using image analysis and RP-TLC. Chromatographia 2009, 69, 151–155. [Google Scholar] [CrossRef]
  9. Alam, P.; Shakeel, F.; Ali, A.; Alqarni, M.H.; Foudah, A.I.; Aljarba, T.M.; Alkholifi, F.K.; Alshehri, S.; Ghoneim, M.M.; Ali, A. Simultaneous determination of caffeine and paracetamol in commercial formulations using greener normal-phase and reversed-phase HPTLC methods: a contrast of validation parameters. Molecules 2022, 27, 405. [Google Scholar] [CrossRef]
  10. Vidhate, S.S.; Potawale, S.E.; Kardile, S.S.; Kashid, A.M.; Bansode, A.S.; Bidkar, A.A.; Washimkar, H.M.; Pawar, P.D. Development and validation of HPTLC method for simultaneous quantification of paracetamol, phenylephrine hydrochloride, nimesulide, cetrizine and caffeine in bulk and pharmaceutical dosage form. Der Pharmacia Sinica 2015, 6, 1–8. [Google Scholar]
  11. Farid, N.F.; Naguib, I.A.; Abdelhamid, N.S.; Anwar, B.H.; Magdy, M.A. Validated ecofriendly chromatographic method for quantitative determination of anti-migraine quaternary mixture. J. Sep. Sci. 2020, 43, 2330–2337. [Google Scholar] [CrossRef] [PubMed]
  12. Dołowy, M.; Pyka-Pająk, A. Application of TLC and densitometry for the determination of paracetamol and caffeine in combined pharmaceutical formulation. Farm. Pol. 2017, 73, 97–104. (in Polish). [Google Scholar]
  13. Boltia, S.A.; Soudi, A.T.; Elzanfaly, E.S.; Zaazaa, H.E. Development and validation of chromatographic methods for simultaneous determination of paracetamol, orphenadrine citrate and caffeine in presence of p-aminophenol; quantification of p-aminophenol nephrotoxic impurity using LC–MS/MS. J. Chromatogr. Sci. 2020, 58, 223–233. [Google Scholar] [CrossRef] [PubMed]
  14. Bouhsain, Z.; Garrigues, S.; de la Guardia, M. Clean Method for the simultaneous determination of propyphenazone and caffeine in pharmaceuticals by flow injection fourier transform infrared spectrometry. Analyst, 1997, 122, 441–446. [Google Scholar] [CrossRef] [PubMed]
  15. Hadad, G.M.; El-Gindy, A.; Mahmoud, W.M. Development and validation of chemometrics-assisted spectrophotometry and liquid chromatography methods for the simultaneous determination of the activei ngredients in two multicomponent mixtures containing chlorpheniramine maleate and phenylpropanolamine hydrochloride. J AOAC Int. 2007, 90(4), 957–970. [Google Scholar] [CrossRef]
  16. Ternes, T.; Bonerz, M.; Schmidt, T. Determination of neutral pharmaceuticals in wastewater and rivers by liquid chromatography–electrospray tandem mass spectrometry, J. Chromatogr. A 2001, 938, 175–185. [Google Scholar] [CrossRef] [PubMed]
  17. Elbarbry, F.A.; Mabrouk, M.M.; El-Dawy, M.A. Determination of the analgesic components of spasmomigraine tablet by liquid chromatography with ultrafiolet detection. J AOAC Int. 2007, 90, 94–101. [Google Scholar] [CrossRef] [PubMed]
  18. Santoni, G.; Fabbri, L.; Gratteri, P.; Renzi, G.; Pinzauti, S. Simultaneous determination of aspirin, codeine phosphate and propyphenazone in tablets by reversed-phase high-performance liquid chromatography, Inter. J. Pharm. 1992, 80, 263–266. [Google Scholar] [CrossRef]
  19. Ainil, F.P.; Effendy, D.L.P.; Siti, M.S. Simultaneous spectrophotometric determination of paracetamol, propyphenazone, and caffeine by using absorption ratio method. AJPR 2018, 6, 5–8. [Google Scholar]
  20. Dinç, E.; Kökdil, G.; Onur, F. Derivative ratio spectra-zero crossing spectrophotometry and LC method applied to the quantitative determination of paracetamol, propyphenazone and caffeine in ternary mixtures. J. Pharm. Biomed. Anal. 2001, 26, 769–778. [Google Scholar] [CrossRef]
  21. Mamolo, M.G.; Vio, L.; Maurich, V. Simultaneous quantitation of paracetamol, caffeine and propyphenazone by high-pressure liquid chromatography. J. Pharm. & Biomed. Anal. 1985, 3, 157–164. [Google Scholar] [CrossRef] [PubMed]
  22. Pal, N.; Avanapu, S.R.; Kumar, P. Stability indicating HPLC method development and validation for the simultaneous estimation of propyphenazone, caffeine and paracetamol by gradient elution technique. IJPBS 2015, 5, 1100–1107. [Google Scholar]
  23. Issa, Y.H.; Hassouna, M.E.M.; Zayed, A.G. Simultaneous determination of paracetamol, caffeine, domperidone, ergotamine tartrate, propyphenazone and drotaverine HCl by HPLC. J. Liq. Chromatogr. Rel. Technol. 2012, 35, 2148–2161. [Google Scholar] [CrossRef]
  24. Ibrahim, H.; Hamdy, A.M.; Merey, H.A.; Saad, A.S. Simultaneous determination of paracetamol, propyphenazone and caffeine in presence of paracetamol impurities using dual-mode gradient HPLC and TLC densitometry methods. J. Chromatogr. Sci. 2021, 59, 140–147. [Google Scholar] [CrossRef]
  25. Chocholous, P.; Satínský, D.; Sklenárová, H.; Solich, P. Two-column sequential injection chromatography- new approach for fast and effective analysis and its comparison with gradient elution chromatography. Anal Chim Acta 2010, 668(1), 61–66. [Google Scholar] [CrossRef] [PubMed]
  26. Rohman, A.; Dzulfianto, A.; Riswanto, F. The employment of UV-spectroscopy combined with multivariate calibration for analysis of paracetamol, Propyphenazone and caffeine. Indonesian J. Pharm. 2017, 28, 191–197. [Google Scholar] [CrossRef]
  27. Özgür, M.; Alpdoğan, G.; Aşçi, B. A rapid spectrophotometric method to resolve ternary mixtures of propyphenazone, caffeine, and acetaminophen in tablets. Monatshefte fuer Chemie 2002, 133, 219–223. [Google Scholar] [CrossRef]
  28. Silva, W.P.; Silva, L.A.J.; França, C.H.; Sousa, R.M.F.; Muñoz, R.A.A.; Richter, E.M. Square-wave voltammetric determination of propyphenazone, paracetamol, and caffeine: comparative study between batch injection analysis and conventional electrochemical systems. Electroanalysis 2017, 29, 1860–1866. [Google Scholar] [CrossRef]
  29. Sopnar, F.; Staniloae, D.; Moise, G.; Szaniszlo, B.; David, V. Simultaneous determination of paracetamol, propyphenazone and caffeinr from pharmaceutical preparations in the presence in of related susbtances using a validated HPLC-DAD method. Rev. Roum. Chim. 2013, 58, 433–440. [Google Scholar]
  30. Hałka-Grysińska A., Ślązak P., Zaręba G., Markowski W., Klimek-Turek A. and Dzido H. T. Simultaneous determination of acetaminophen, propyphenazone and caffeine in cefalgin preparation by pressurized planar electrochromatography and high-performance thin-layer chromatography, Anal. Methods 2012, 4, 973-982. [CrossRef]
  31. Emre, D.; Ozaltin, N. Simultaneous determination of paracetamol, caffeine and propyphenazone in ternary mixtures by micellar electrokinetic capillary chromatography. J Chromatogr B 2007, 847, 126–132. [Google Scholar] [CrossRef]
  32. Golubitskii, G.B.; Budko, E.; Ivanov, V.M.; Basova, E. Quantitative analysis of Pentalgin tablets by gradient and isocratic high-performance liquid chromatography. J. Anal. Chem. 2006, 61, 350–353. [Google Scholar] [CrossRef]
  33. ICH Harmonised Tripartite Guideline: Validation of Analytical Procedures: Text and Methodology, Q2(R1); ICH: Geneva, Switzerland, 2005. Available online: https://database.ich.org/sites/default/files/Q2%28R1%29%20Guideline.pdf (accessed on 28 February 2023).
  34. Ferenczi Fodor, K.; Renger, B.; Végh, Z. The frustrated reviewer–Recurrent failures in manuscripts describing validation of quantitative TLC/HPTLC procedures for analysis of pharmaceuticals. J. Planar Chromatogr. Modern TLC 2010, 23, 173–179. [Google Scholar] [CrossRef]
  35. Nagy-Turák, A.; Végh, Z.; Ferenczi-Fodor, K. Validaton of the quantitative planar chromatographic analysis of drug substances. III. Robustness testing in OPLC. J Planar Chromatogr – Modern TLC 1995, 8(3), 188-193.
  36. Ferenczi-Fodor, K.; Nagy-Turák, A,; ; Végh, Z. Validation and monitoring of quantitative thin layer chromatographic purity tests for bulk drug substances.. J Planar Chromatogr – Modern TLC 1995, 8, 349-356.
  37. Hendix, C.D. What every technologist should know about experiment design. Chem Technol 1979, 9, 167–174. [Google Scholar]
  38. Pyka, A.; Budzisz, M.; Dołowy, M. Validation thin layer chromatography for the determination of acetaminophen in tablets and comparison with a pharmacopeial method. Biomed. Res. Int. 2013, ID 545703. 5457. [CrossRef]
  39. Foudah, A.I.; Shakeel, F.; Salkini, M.A.; Alshehri, S.; Ghoneim, M.M.; Alam, P. A Green high-performance thin-layer chromatography method for the determination of caffeine in commercial energy drinks and formulations. Materials 2022, 15, 2965. [Google Scholar] [CrossRef]
  40. Polish Pharmaceutical Society. Polish Pharmacopoeia X; Polish Pharmaceutical Society: Warsaw, Poland, 2014 (In Polish).
  41. United States Pharmacopeial Convention. The United States Pharmacopoeia, 34th ed.; United States Pharmacopeial Convention: Rockville, MD, USA, 2011. [Google Scholar]
  42. El Sherbiny, D.; Wahba, Me. Validation of a micellar liquid chromatographic method for determination of caffeine and non-steroidal anti-inflammatories. J Chromatogr Sci. 2014, 52(8), 806–813. [Google Scholar] [CrossRef]
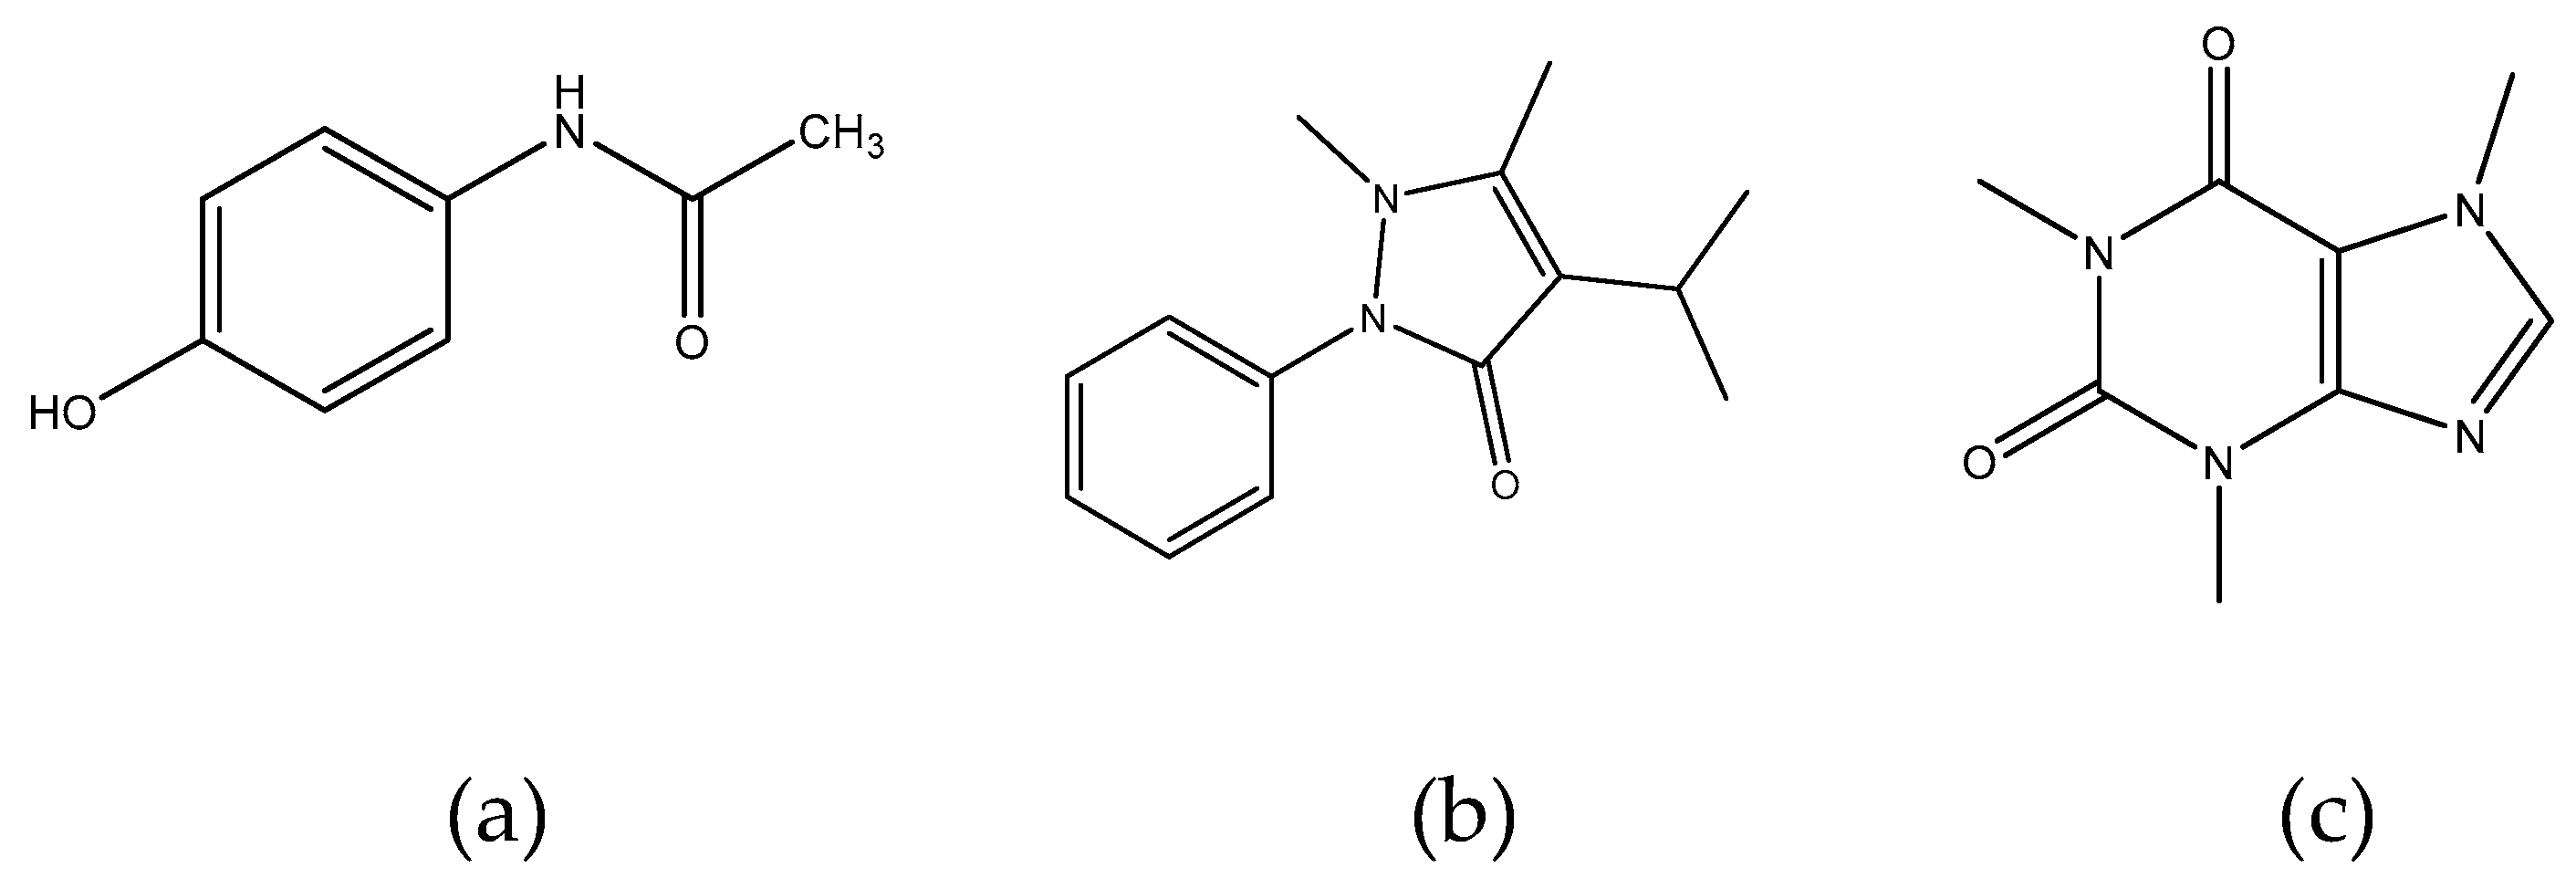
Figure 1. Structural formulas of paracetamol (a), propyphenazone (b), and caffeine (c).
Preprints 91853 g001
Figure 2. Densitogram of Saridon drug sample analyzed by NP-TLC at wavelengths from 200 to 350 nm with a change in wavelength every 25 nm (different colours on the densytogram) on plates precoated with silica gel 60F254 using the mobile phase: chloroform + toluene + ethyl acetate + ethanol + acetic acid (80%) in a volume ratio of 18: 18:7.5:5:0.3.
Preprints 91853 g003
Table 1. Method-validation data for the quantitative determination of paracetamol, propyphenazone, and caffeine by thin layer chromatography with densitometry.
Method Characteristic Results
Paracetamol Propyphenazone Caffeine
Retardation factor (Rf) 0.38 ± 0.04 0.60 ± 0.02 0.47 ± 0.03
Range [μg/spot] 0.4–4.0 0.8–4.0 0.4–4.0
Linearity [μg/spot]
A=a⋅X+b
a 3462.8(±26.6) 3598.2(±36.8) 3317.4(±30.5)
b 3083.5(±66.0) 33645.6(±96.2) 4211.3(±75.7)
n 10 9 10
r 0.9918 0.9996 0.9997
LOD [(µg/spot] 0.016 0.032 0.054
LOQ [(µg/spot] 0.048 0.096 0.162
For tablets
Accuracy
for 50% standard added
(n = 6)
R = 100.2%; CV = 1.77% R = 99.0%; CV = 2.12% R = 99.7%; CV = 1.60%
for 100% standard added
(n = 6)
R = 100.0%; CV = 2.47% R = 98.8%; CV = 2.68% R = 100.2%; CV = 1.66%
for 150% standard added
(n = 6)
R = 99.6%; CV = 2.11% R = 98.4%; CV = 1.98% R = 99.2%; CV = 1.17%
Precission (CV, [%])
Intraday
for 3 µg/spot (n = 3) 0.35 1.10 0.75
for 2 µg/spot (n = 3) 1.56 0.92 1.08
for 1 µg/spot (n = 3) 1.10 0.68 1.02
Interday
for 3 µg/spot (n = 3) 0.79 1.26 0.82
for 2 µg/spot (n = 3) 1.23 0.53 0.93
for 1 µg/spot (n = 3) 1.54 0.73 1.06
Robustness (CV, [%]) robust robust robust
where: A- area of the chromatographic band (spot) of propyphenazone, paracetamol, caffeine [AU], n- number of measurement points, X - micrograms PP/spot, PA/spot or C/spot, r- correlation coefficient.
Table 2. Literature values of LOD and LOQ of PA, PP, and C investigated by planar techniques.
Method Stationary phase Mobile phase LOD and LOQ [ µg/spot] of Ref
PA PP C
NP-TLC Silica gel 60F254 Chloroform + toluene+ ethyl acetate +methanol+ acetic acid (6:6:1:2:0.1 v/v) LOD: 1.50
LOQ: 4.54
LOD = 1.59
LOQ = 4.83
LOD: 1.21
LOQ: 3.67
[24]
NP-TLC Silica gel GF254 Dichloromethane + methanol + acetone + glacial acetic acid (9:1:0.5:0.3, v/v) LOD: 0.3
LOQ: 1.0
- LOD: 0.15
LOQ: 0.5
[14]
NP-TLC Silica gel 60F254 Chloroform +acetone+ammonia 25%, 39.6+9.9+0.5, v/v LOD: 0.070
LOQ: 0.231
- LOD: 0.064
LOQ: 0.194
[12]
NP-TLC Silica gel 60F254 Chloroform+acetone+ ammonia 25%, 8+2+0.1, v/v LOD: 0.09
LOQ: 0.27
- [38]
RP-HPTLC RP18W Methanol+ glacial acetic acid + water, 25:4.3:70.7, v/v LOD: 0.100
LOQ: 0.191
- LOD: 0.040
LOQ: 0.076
[8]
HP-TLC Silica gel 60F254 Toluene+ethyl acetate + methanol+formic acid, 16:2:4::0.8, v/v LOD: 0.039
LOQ: 0.118
- LOD: 0.041
LOQ: 0.124
[10]
HP-TLC Silica gel ethyl acetate+ethanol+ammonia, 9:1:0.1, v/v LOD: 0.262
LOQ: 0.793
- LOD: 0.265
LOQ: 0.802
[11]
NP-HPTLC Silica gel 60F254 Ethyl acetate+ethanol, 85:15, v/v LOD: 0.017
LOQ: 0.051
- LOD: 0.017
LOQ: 0.050
[9]
RP-HPTLC Silica gel Ethanol+water, 50:50, v/v LOD: 0.0087
LOQ: 0.0256
- LOD: 0.0085
LOQ: 0.0256
[9]
RP-HPTLC RP18W acetonitrile + buffer pH=5.0 LOD: 0.12
LOQ: 0.36
LOD: 0.06
LOQ: 0.19
LOD: 0.09
LOQ: 0.28
[30]
PPEC RP18W acetonitrile + buffer pH=5.0 LOD: 0.08
LOQ: 0.26
LOD: 0.04
LOQ: 0.13
LOD: 0.10
LOQ: 0.36
[30]
RP-HPTLC Silica gel 60F254s Ethanol-water, 55:45, v/v - - LOD: 0.017
LOQ: 0.051
[39]
NP.-TLC Silica gel 60F254 chloroform + toluene + ethyl acetate + ethanol + acetic acid (80%) (18: 18: 7.5: 5.0: 0.3, v/v) LOD: 0.016
LOQ: 0.048
LOD: 0.032
LOQ: 0.096
LOD: 0.052
LOQ: 0.162
in this work
Table 3. Experimental design matrix (23) for robustness test for active pharmaceutical ingredients in Saridon tablets.
Experiment
No
X1 X2 X3 X4 X5 X6 X7 Active pharmaceutical ingredienta content (yi)
[mg⋅tablet-1]
PA PP C
1 + + + + + + + 245.6 149.1 49.2
2 + + - + - - - 243.9 148.7 49.1
3 + - + - - + - 247.6 150.9 49.8
4 + - - - + - + 253.2 152.4 50.9
5 - + + - + - - 249.9 152.4 50.3
6 - + - - - + + 246.9 150.5 49.2
7 - - + + - - + 246.3 150.1 49.1
8 - - - + + + - 254.6 153.8 51.5
Size of effect (E) PA -1.850 -3.850 -2.300 -1.800 4.650 0.350 -1.000
PP -1.425 -1.625 -0.725 -1.125 1.875 0.175 -0.925
C -0.275 -0.875 -0.575 -0.325 1.175 0.075 -0.575
The label claim [mg] 250 150 50
Average amount [mg] 248.5 151.0 49.9
Variance 14.1 3.1 0.9
Standard devitation (SD) 3.76 1.76 0.92
Coefficient of variation [CV, %] 1.5 1.2 1.8
a PA paracetamol, PP – propyphenazone, C – caffeine.
Table 4. Comparison of paracetamol, propyphenazone, and caffeine assays [mg/tablet] obtained from ten repeated different analysis of by proposed NP-TLC-densitometric (A) and literature RP-HPTLC RP18W (B) methods.
Active Pharmaceutical Ingredients (APIs)
Paracetamol Propyphenazone Caffeine
Determined by methods
A B A B A B
Number of analysis 10 10 10 10 10 10
1 258.8 248.7 151.0 148.2 50.0 49.1
2 250.4 251.5 151.8 153.1 51.1 48.2
3 263.4 257.2 148.5 146.9 49.5 50.9
4 253.5 249.4 147.3 151.8 50.4 51.8
5 249.1 262.5 149.4 152.1 51.2 48.2
6 260.9 258.7 149.7 148.7 49.9 50.2
7 251.2 252.6 151.2 149.8 50.3 49.8
8 253.1 253.5 150.2 151.6 49.3 50.3
9 249.8 251.3 148.7 152.2 50.7 49.5
10 250.5 247.2 149.6 151.0 51.4 50.8
Average 254.1 253.3 149.7 150.5 50.4 49.9
Label claimed 250 250 150 150 50 50
Amount of API (%) in relations to the label claim 101.6 101.3 99.8 100.3 100.8 99.8
Standard deviation (SD) 5.1 4.8 1.4 2.0 0.7 1.2
Coefficient of variation [CV, %] 2.01 1.89 0.94 1.33 1.39 2.40
Confidence interval of
arithmetic mean with
confidence level equal 95%
µ=254.1±3.2 µ=253.3±3.0 µ=149.7±0.9 µ=150.5±1.2 µ=50.4±0.4 µ=49.9±0.7
Comparison of the results using methods A and B
t calculated 0.364 1.756 0.923
t(95%.18) tabulated 2.101 2.101 2.101
F calculated 1.11 2.04 2.94
F(95%.f1 = f2 = 9) tabulated 3.18 3.18 3.18
Method A - proposed in this work: NP-TLC on silica gel 60F254 plates using chloroform + toluene + ethyl acetate + ethanol + acetic acid (80%) in volume composition 18: 18: 7.5: 5 : 0.3. Method B – RP-HPTLC on RP18W plates using acetonitrile + buffer pH=5.0 in volume composition 22.5:77.5.
Disclaimer/Publisher’s Note: The statements, opinions and data contained in all publications are solely those of the individual author(s) and contributor(s) and not of MDPI and/or the editor(s). MDPI and/or the editor(s) disclaim responsibility for any injury to people or property resulting from any ideas, methods, instructions or products referred to in the content.
Copyright: This open access article is published under a Creative Commons CC BY 4.0 license, which permit the free download, distribution, and reuse, provided that the author and preprint are cited in any reuse.
Prerpints.org logo

Preprints.org is a free preprint server supported by MDPI in Basel, Switzerland.

Subscribe

© 2024 MDPI (Basel, Switzerland) unless otherwise stated