Preprint
Article

Spatial Distribution and Migration of Heavy Metals in Dry and Windy Area Polluted by Their Production in the North China

Altmetrics

Downloads

63

Views

23

Comments

0

A peer-reviewed article of this preprint also exists.

This version is not peer-reviewed

Submitted:

30 November 2023

Posted:

30 November 2023

You are already at the latest version

Alerts
Abstract
The migration paths and distribution driving factors of heavy metals in dry and windy area polluted by their production in the North China need a further research. To address this research gap, we collected 675 soil samples, 72 atmospheric deposition samples and 20 water samples around a production area and measured its heavy metal concentrations. Results showed that the Cu, Zn, As and Pb in 0-10 cm soil layer showed a fan-shaped distribution, which was consistent with their atmospheric deposition fluxes. It indicated the distribution patterns of these heavy metals were driven by strong winds in studied area. Although Cr concentrated to the production area in the 0-10 cm soil layer, principal component analysis showed that this migration was through wind as well. The concentration of Cd in the river increased from 0.257 mg/L to 0.460 mg/L along water flowing, and caused the same distribution trend in soil near the river from upstream to downstream. Unlike the above, surface runoff should drive the Cd migration. The concentration of Pb in the river was over threshold of pollution, and also led to an accumulation in the 5-10 cm soil layer. It suggested that the migration of Pb was through both wind and surface runoff. Six studied heavy metals showed different migration behaviors, and specific control strategies for individual heavy metal should be concerned.
Keywords: 
Subject: Environmental and Earth Sciences  -   Pollution

1. Introduction

Heavy metal pollution has received considerable attention in past decades due to enhanced mining and industry development[1]. China, one of the biggest world's producers and consumers of heavy metals, has also brought heavy metal pollution around the mining area[2,3]. Irrational mining activities have led to environmental pollution of heavy metals, for example, out of 1,672 soil points in 70 mining areas surveyed in China, 33.4% of the investigation points exceeded safety threshold according to the Survey Bulletin of Soil Pollution in 2014[4]. Cao et al. (2022)[5] also reported that the soil pollution area of heavy metal caused by mining reached to 41,600 ha. Once heavy metals constantly accumulated in soil, inevitably lead to environmental threats to the health of the ecosystem and nearby habitats, including animals, botany and microorganisms[6]. To control the soil pollution of heavy metals, it is very essential to expound their distributed driver and migration path.
The distribution of soil heavy metals shows a ring outward direction from the mining area in many previous studies[7,8,9,10]. And the concentration of heavy metals in soil decreases with increasing the distance from mining or production areas. Compared with Cu, Zn and Pb, concentrations of As and Cr show a greater decline in soil by 1-2 folds when the distant from mining area increases from 20 m to 100 m[10]. And Zn can transport a longer distant than Pb and Cd by 2-6 times[8]. However, Gao et al. (2017)[9] found distributions of Cu, Zn, Cr, Pb and Cd appear two peaks along distance from mining area within 0-3 km, and they reach the second peak at 2 km from mining area, then decline to the background value[9].
Many studies showed that wind and surface runoff are drivers of the distribution of heavy metals in soil[11,12,13]. Transport of contaminated soil particles by wind leads to a considerable accumulation in soil nearby mining and production areas[14]. It was confirmed by a previous study, which showed that Cu, Zn and Pb have a greater accumulation in soil in the downwind direction than the upwind direction in mining-affected area[15]. Hu et al.(2018)[10] also showed the wind direction in mining area determines As and Cd accumulation patterns in mining-affected area. The Cu, Cr and Zn migrated much farther than Cd along the wind direction [16]. Li et al. (2018)[17] also found Zn migration is depended on wind more than Cd.
The dissolved heavy metals in water is easy to transport from mining or production areas to other uncontaminated areas through surface runoff [18]. The concentration of heavy metals in the soil near the surface runoff is higher than that of other affected soils in the mining area [11]. Concentration of Cu, Zn, As, Pb and Cd in soil decline along the river from upstream to downstream [19]. The migration distance of Cd migration is twice as high as that of Pb through surface runoff [20]. It was also found by Jiang et al. (2018)[21], and he further found that Cd is also better than Cu for migration through surface runoff.
Compared with wind migration of heavy metals, runoff migration is well-documented by many literatures, especially in the South China with rainy climate [11,22,23]. The western Inner Mongolia is rich in heavy metals reserves. Many companies are working on mining and production of heavy metals. The climate of these region is windy. In general, production area is near the river because levigation is water-cost. Thus, soils nearby production area has a heavy metals pollution risk from both wind and surface runoff ways. Unlike the South China, soil pH in western Inner Mongolia is high, mostly >8.0. The solubility of heavy metals in these soils is much lower than acid soil in the South China. A few studies are focused on such areas. Thus, in this study, we aim to (1) determine the distribution of heavy metals in areas in where it is windy, near river and with high pH soil, and (2) estimate the contributions of wind and runoff ways to the migration of heavy metals in these areas.

2. Materials and Methods

2.1. Studied Area

The studied production area was abandoned for 9 years and located in Urat Houqi, Bayannur City, Inner Mongolia Autonomous Region (Figure 1A, N 41º16 50 ~ 41º18 2, S 106º35 50~106º36 49’’). It showed a temperate continental monsoon climate with an annual mean temperature of 3.8 °C and average rainfall of 96 mm. The dominant wind direction is northwest, with an average wind speed of 5.1 m/s. The type of soil was saline-alkali soil. The terrain was high in the south and low in the north. A river crosses the studied area from south-to-north.

2.2. Data Collection and Processing

2.2.1. Soil Sampling and Analysis

The grid sampling method was adopted in the study area, with each sampling grid covering an area of 50 m × 50 m. One sample was taken from each grid, and the sampling method of nine drills mixed with one drill was adopted. Soil samples were divided into three layers of 0-5 cm, 5-10 cm and 10-20 cm, and a total of 675 soil samples(Figure 1C) were collected avoid roads and mountains when sampling to keep the sample representative. They were immediately sealed in polyethylene plastic bags to avoid contamination and labeled. The latitude and longitude of each sampling point were recorded using a GPS and any relevant environmental information pertaining to the sample site was recorded.
Air-dried soil samples were screened at 0.15 mm and digested by a mixed acid. Firstly, 0.1500 g soil sample was placed in the microwave digestion tube, and 0.5 mL of ultrapure water and 2 mL of HF (40%, Tianjin Xinbote Chemical, China) were added into the tube, then let them react overnight (more than 12 h); secondly, 6 mL HCl (31%, Tianjin Xinbote Chemical, China) and 2 mL of HNO3 (68%, Tianjin Xinbote Chemical, China) were added into the microwave digestion apparatus. Digestion for two hours and temperature control area (120 °C -150 °C -200 °C). After the digestion was complete, the tubes were taken out and placed in the acid extracter. One mL of HClO4 (70%, Tianjin Xinbote Chemical, China) was added into each tube to remove the acid until 1 drop of liquid was left. Finally, after cooling, the left was rinsed with nitric acid (Volume ratio 2%) into a 50 mL volumetric flask for filtratio. The sample to be tested was filtered with a 0.22 μm filter. The concentrations of Cu, Zn and As, Pb, Cd and Cr in solution were determined on AAS (ATS-986, Beijing Pu analysis general instrument company, China) and ICP-MS (ICAPRQ, Thermo Scientific, USA), respectively.

2.2.2. Atmospheric Deposition Sampling and Analysis

Twelve PVC cylinders were settled in the studied area for collecting atmospheric deposition of heavy metals cause by wind (Figure 1D). Two cylinders as a group were in each determination point. Sampling points S4, S7 and S9 were 25 m from the production area. Sampling points S3, S5, S6, S8, S10, S11 and 12 were 50 m away. Sampling points S1 and S2 were 100 m and 150 m away. Samples were taken every 2 months. The pretreatment process of the samples was according to GB/T 15265-94. The analysis methods were the same with soil samples.

2.2.3. Water Sampling and Analysis

River water was sampled by a polyethylene bottle at an interval of 50 m in downstream from the study area until 1 km far away(Figure 1F). The pH of the water sample was adjusted below 2 by adding concentrated HNO3 to maintain the solubility of heavy metals [24]. After filtered at 0.22 μm, samples were determined by ICP-MS.

2.2.4. Data Analysis

Microsoft Office Excel 2010 (Microsoft, USA) was used for statistical analysis. ArcMap10.5 (Environmental systems research institute, USA) software was used for digital visualization processing. Origin 2021 (OriginLab, USA) was used for plotting and principal component analysis.

3. Results

3.1. Spatial Distribution of Heavy Metals

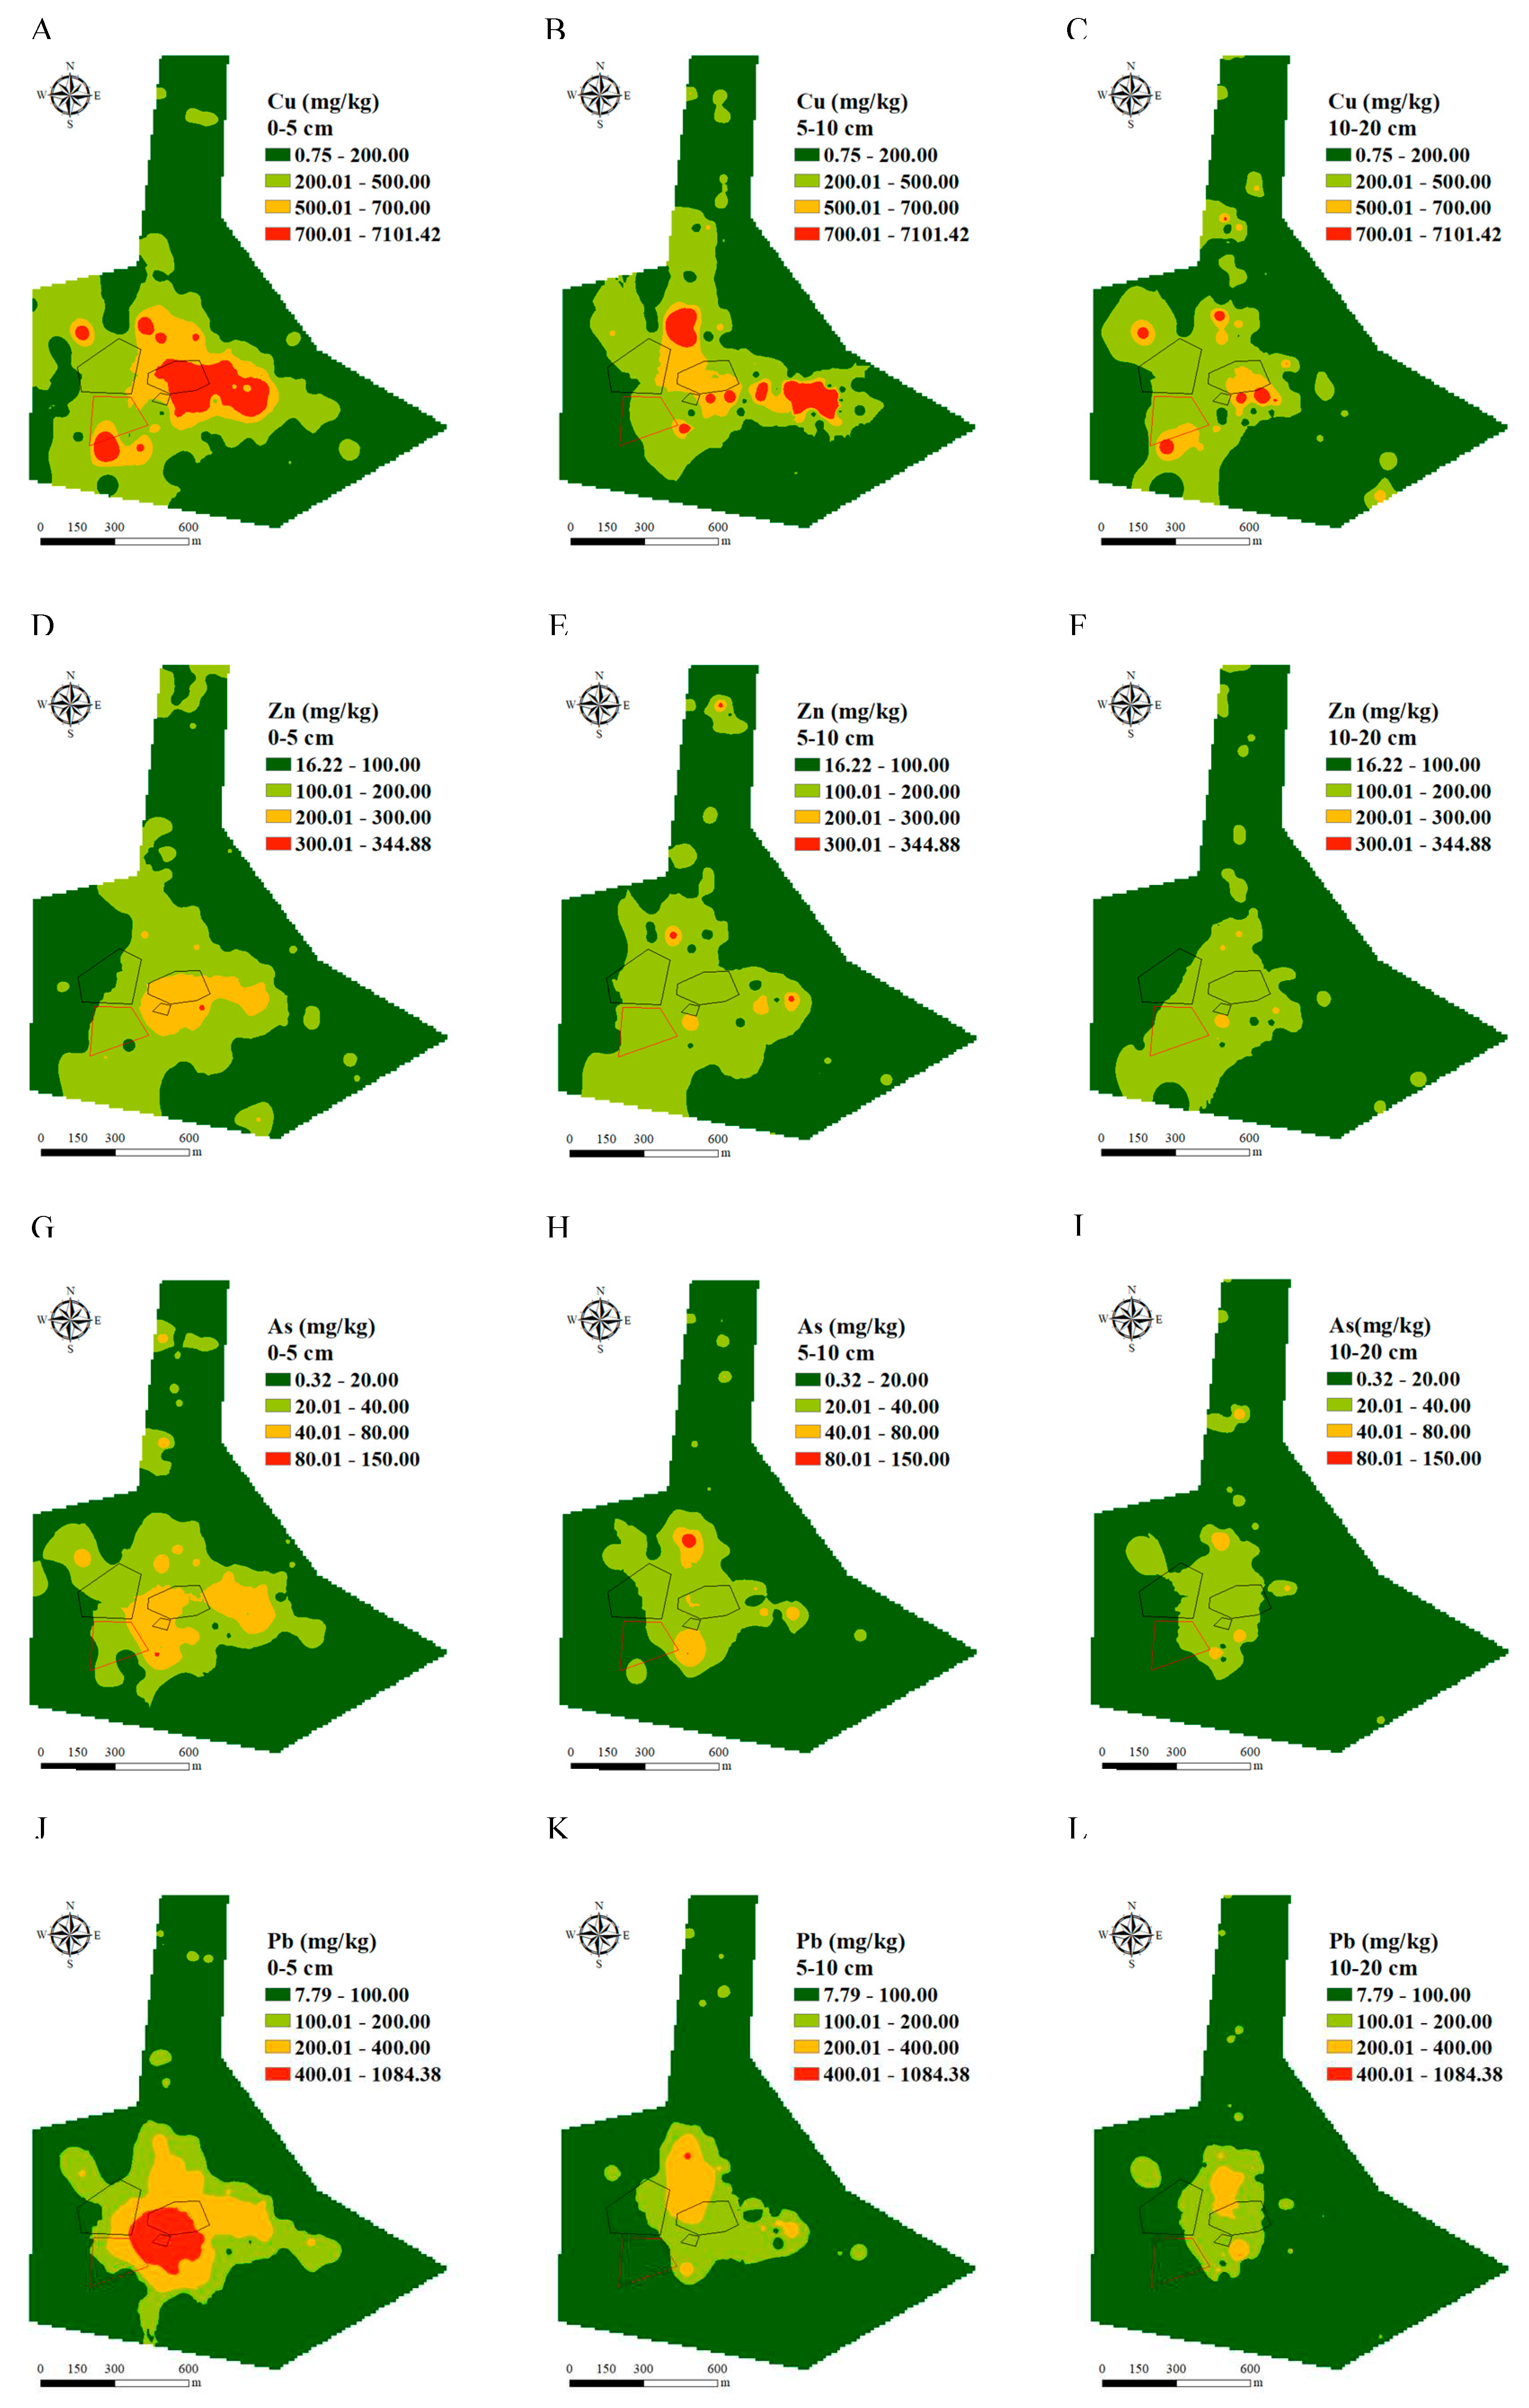
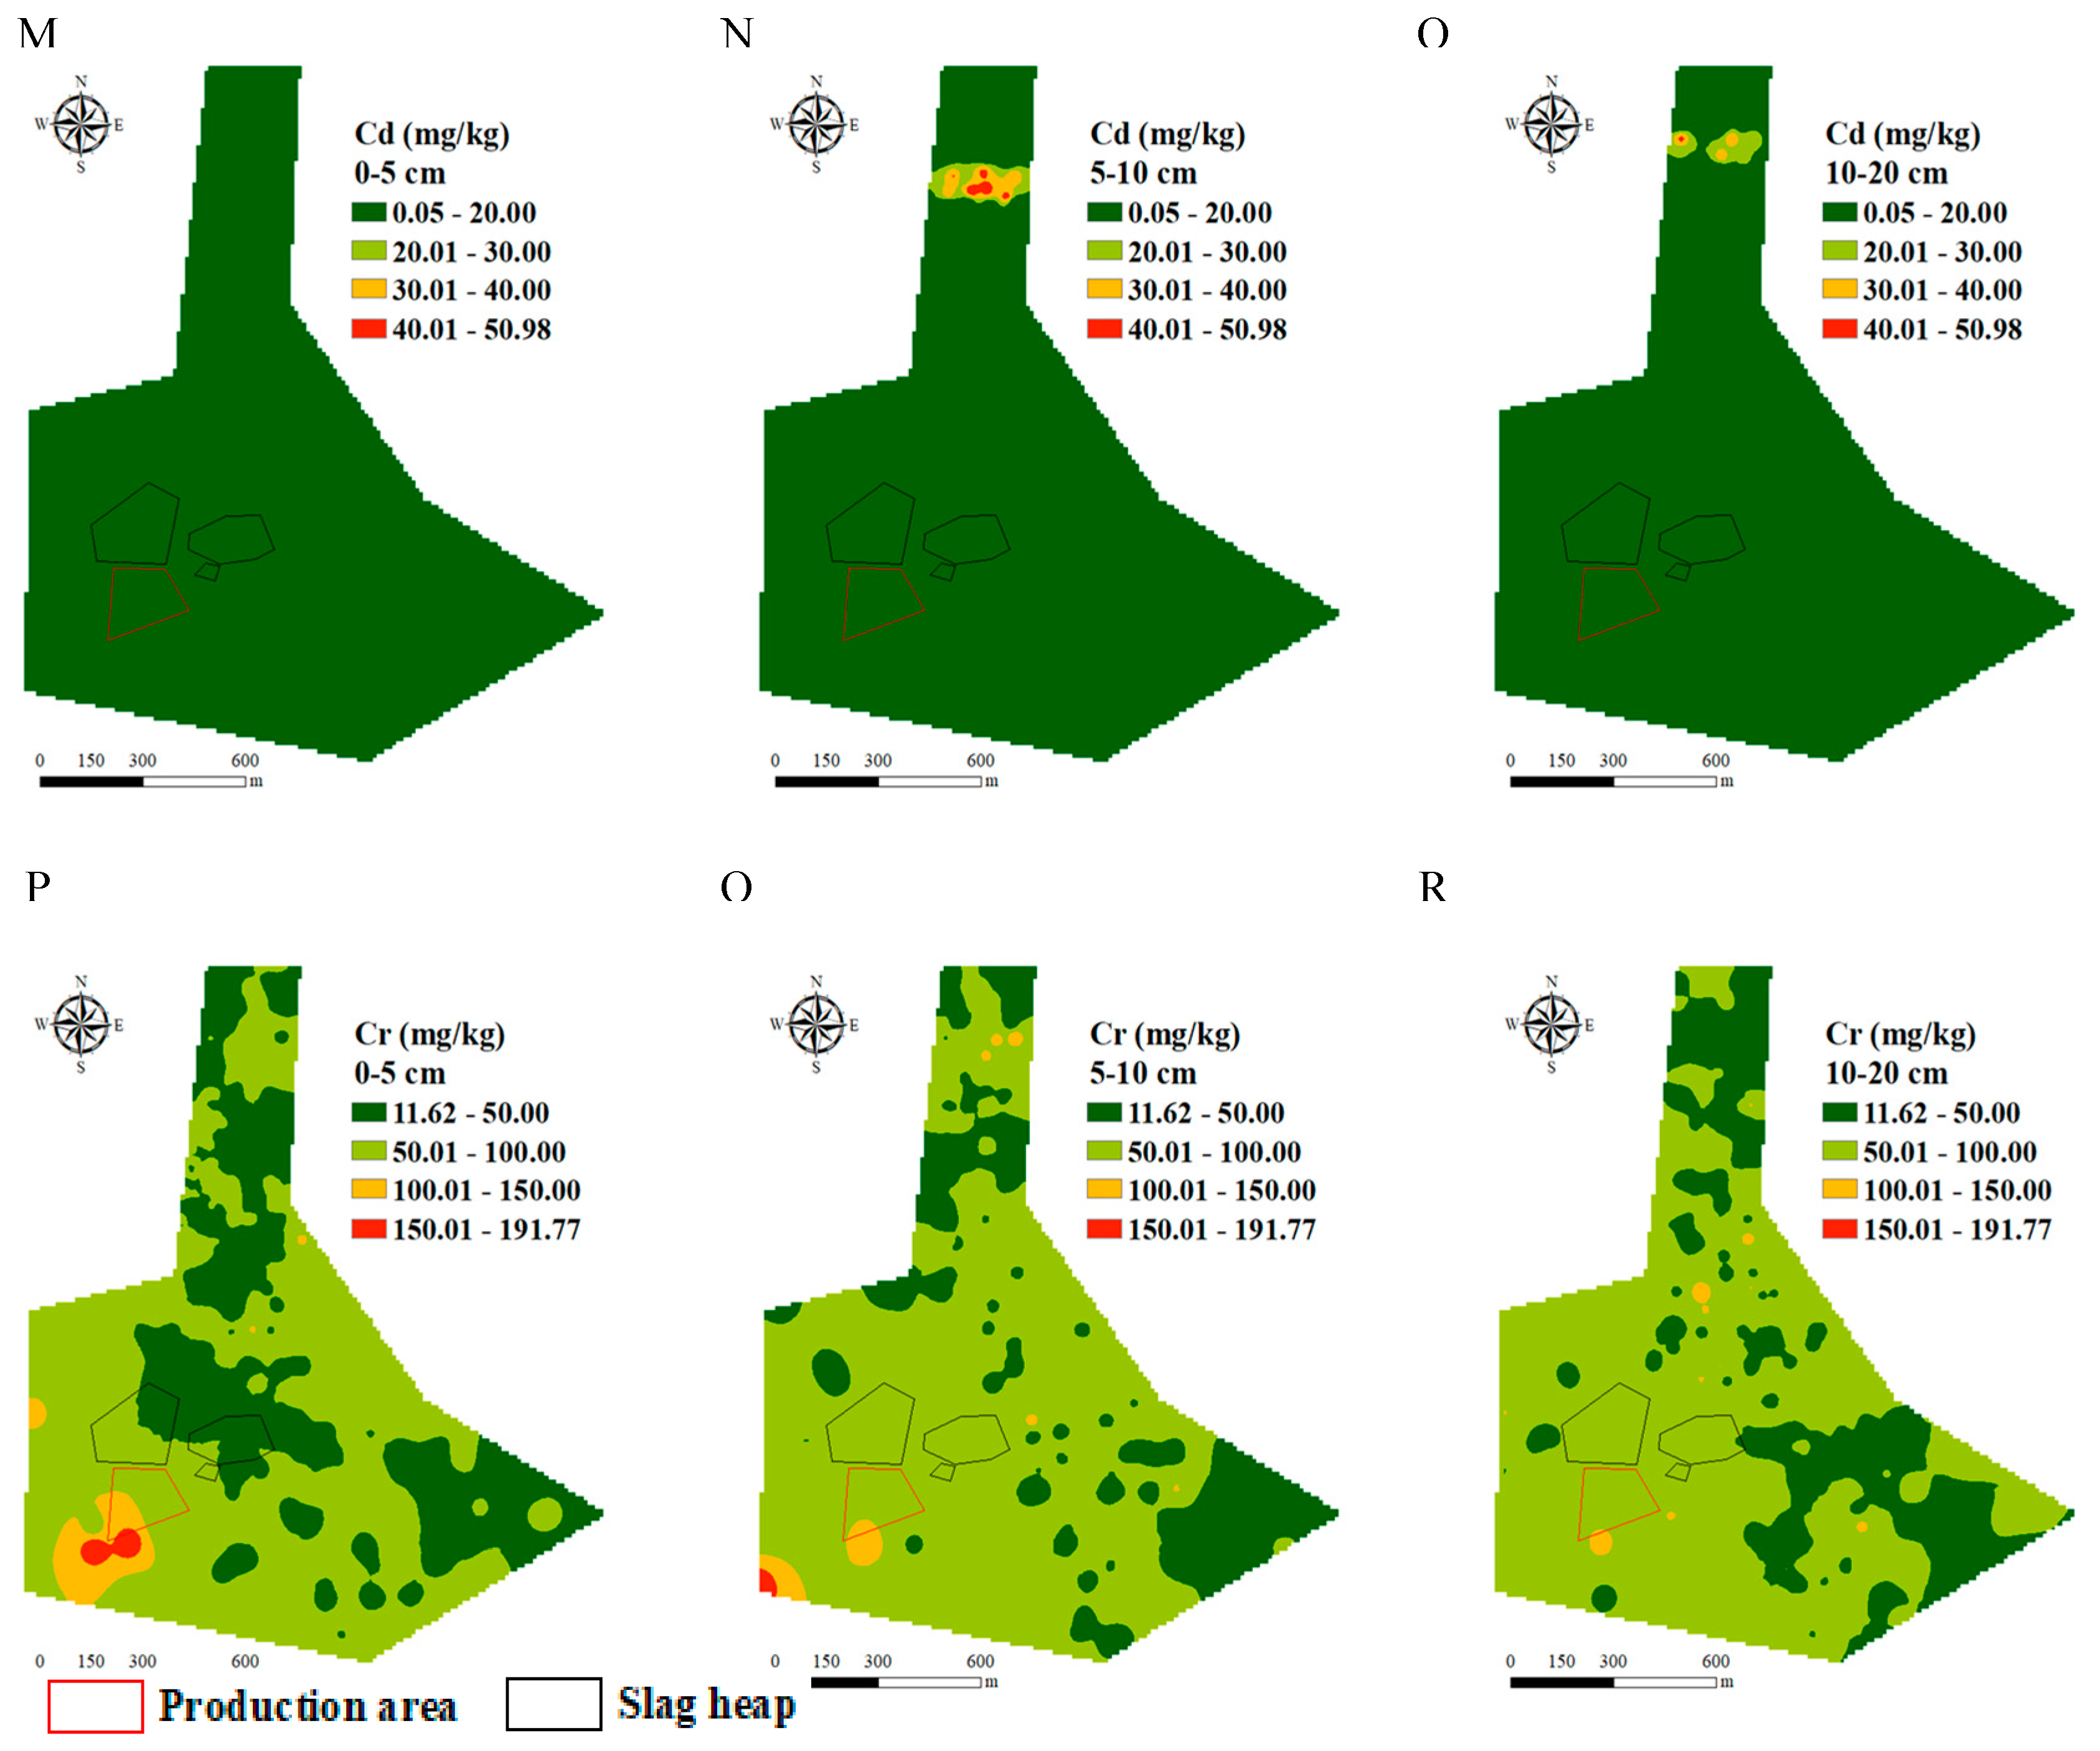
Spatial distributions of Cu, Zn, As, Pb, Cd and Cr along the soil profile in the studied area were shown in Figure 2. The mean concentrations of Cu, Zn, As, Pb, Cd and Cr in the top soil of 0-5 cm were 257.2 mg/kg, 101.5 mg/kg, 18.6 mg/kg, 106.0 mg/kg, 0.3 mg/kg and 60.0 mg/kg, respectively. With increasing soil depth, the concentrations of Cu, Zn, As and Pb decreased by 23.2%, 10.4%, 23.4%, 39.6% in 5-10 cm soil layer, respectively. While the concentrations of Cd showed the greatest increase by 253.9% and Cr did not show a big increase, which was only 1.9%. Compared with the 0-5 cm soil layer, the concentrations of Cu, Zn, As, Pb and Cr reduced by 35.2%, 20.6%, 31.0%, 47.5%, 1.2% in 10-20 cm soil layer, respectively. The concentrations of Cd increased by 169.23%. The concentrations of Cu, Zn, As and Pb had the same trend along soil depth, which was consistently decreased with increased soil depth. The relatively high concentrations of Cu, Zn, As, Pb, Cd and Cr were separately distributed in different subareas, with Cu, Zn, As and Pb sharing similar. The relatively high concentration of Cu was mainly distributed in the soil around 500 m southeast of the production area in the 0-10 cm soil layer. Cu, Zn, As and Pb showed a similar spatial distribution pattern, with relatively high concentrations in the southeast of the mine at 0-10 cm layer. The relatively high concentration of Cu, Zn, As and Pb distributed in the 200 m soil away from the studied area in the 10-20 cm soil layer. The relatively high concentration of Cd and Cr was observed in 5-10 cm layer of soil. The mean value of Cd was in the following order: 5-10 cm > 10-20 cm > 0-5 cm. The relatively high concentration of Cd distributed in the north away from 1200 m of the studied area in the 5-20 cm soil layer. The relatively high concentration of Cr is distributed in the southwest away from 150 m of the studied area in the 0-20 cm soil layer.

3.2. Atmospheric Deposition of Heavy Metals

3.2.1. Concentration of Heavy Metals in Atmospheric Deposition

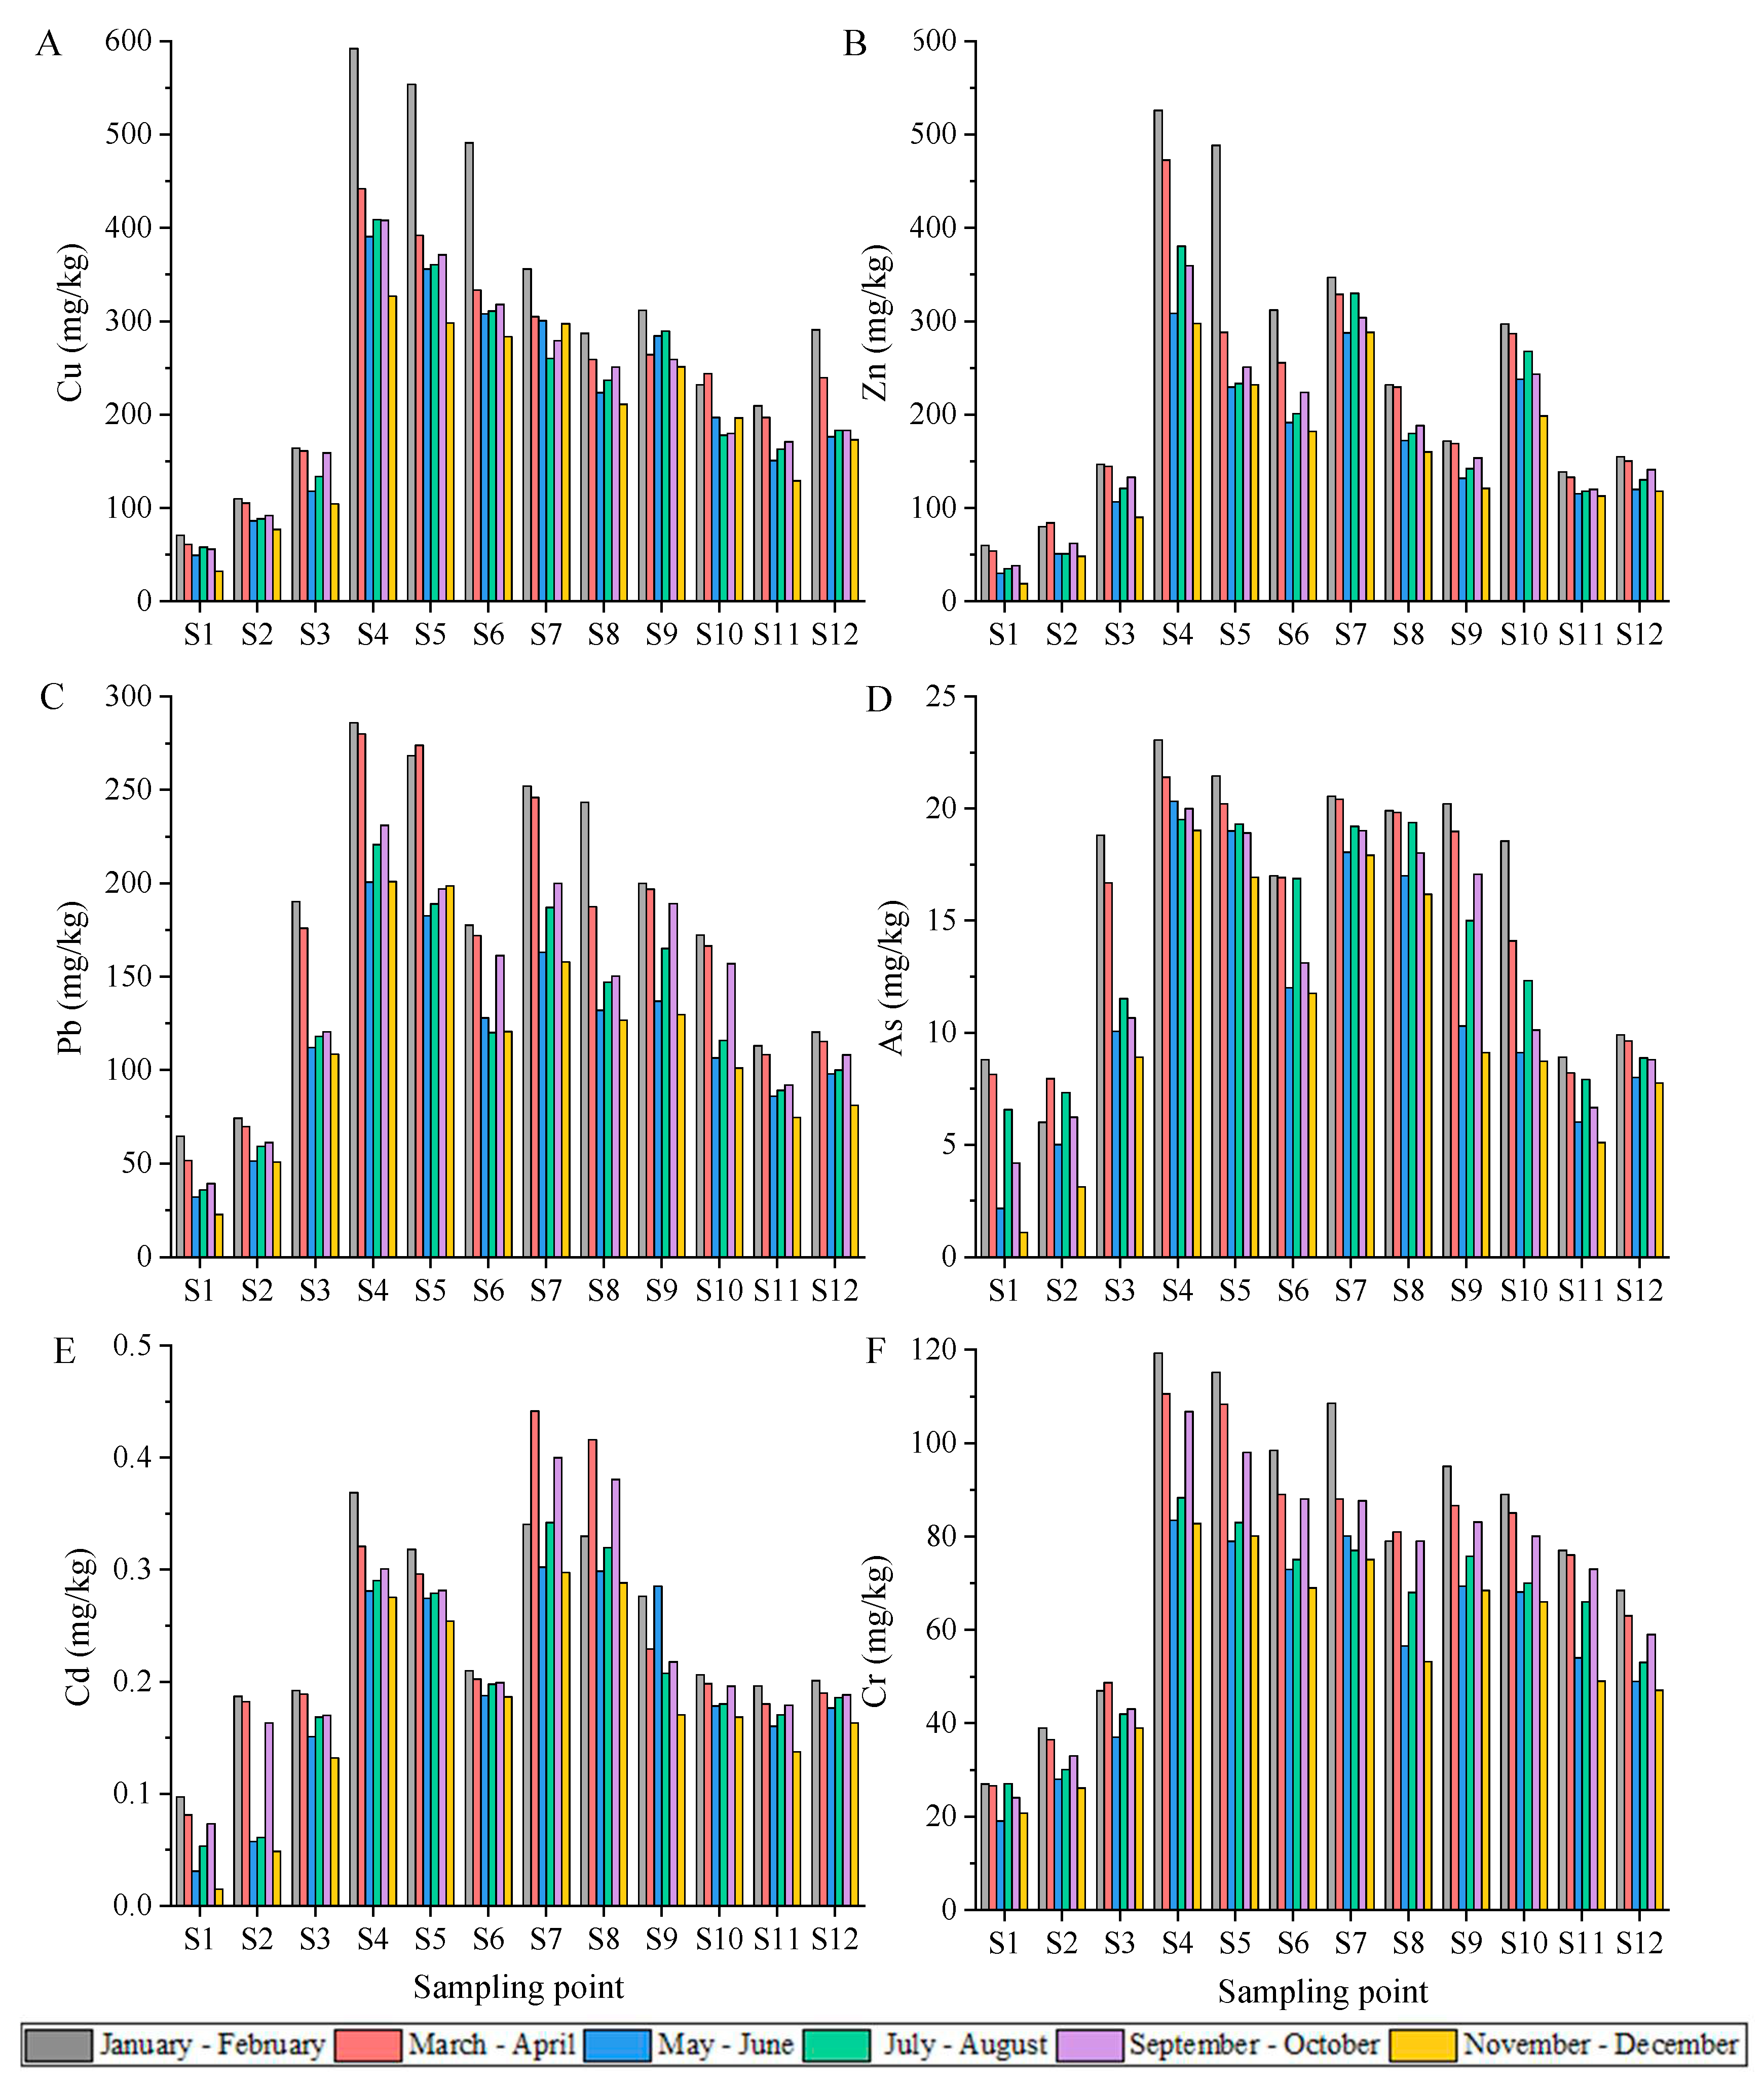
Figure 3 shows heavy metal concentrations in samples of atmospheric deposition. The ranges of heavy metal concentrations in atmospheric deposition were 32.3-592.3 mg/kg for Cu, 19.0-526.1 mg/kg for Zn, 1.1-23.1 mg/kg for As, 22.6-286.0 mg/kg for Pb, 0.02-0.44 mg/kg for Cd and 19.1-119.3 mg/kg for Cr. The concentrations of Cu, Zn, As, Pb and Cd were the highest at S4, and the concentration of Cr was the highest at S7. The concentrations of Cu, Zn, As, Pb, Cd and Cr were the lowest at S1. The S4 concentration was almost 3 times higher than the that in S1. Higher Cu concentrations were found at S4, S5 and S6 compared with others. Compared with others, the concentration of Zn at S4, S7 and S10 was higher. Except S1, S2 and S11, the concentrations of As and Pb were similar among points. The Cd concentrations of was higher at S7 and S8 than that in the others. The concentration of Cr was the same at S4-S12 sampling site. The concentrations of Cu, Zn, As, Pb, Cd and Cr were the highest in January-February, and they were the lowest in November-December. The concentrations of Cu, Zn, Pb, Cd and Cr declined in order of January-February > March-April > September-October > July-August > May-June > November-December. The concentration of As followed the order of January-February > March-April > July-August > September-October > May-June > November-December. The mean concentrations of heavy metals were in order of Cu > Zn > Pb > Cr > As > Cd .

3.2.2. Heavy Metal Fluxes in Atmospheric Deposition

Annual deposition fluxes of Cu, Zn, As, Pb, Cd and Cr were presented in Table 1. The atmospheric deposition flux of Cu ranged from 17.04 to 221.59 mg/m2/year. The highest concentration of atmospheric deposition flux Cu appeared at S4 (221.59 mg/m2/year), and the lowest at S1 (17.04 mg/m2/year). Annual atmospheric deposition fluxes of Zn ranged from 12.33 at S1 to 202.49 mg/m2/year at S4 and the range of As was from 1.62 to 10.56 mg/m2/year at S4. The annual deposition flux of Zn at S5 was similar with S7. The annual deposition flux of Cd was the highest at S4 and S7, being 0.16 mg/m2/year. The annual deposition fluxes of Pb and Cr were 12.81-122.08 mg/m2/year for Pb and 7.50-50.83 mg/m2/year for Cr. The annual deposition flux of Pb, S4 was ten times that of S1.
Table 2 shows the deposition fluxes of heavy metals in the studied area every two months from 2020 to 2021. The deposition flux of heavy metals was the highest in January-February, and the lowest in November-December. The deposition flux of Cd varied weakly during the whole year. The deposition fluxes of Cu, Zn, As, Pb and Cr from March to April were the second highest, which was only less than those in January-February. The deposition flux of Cu and Zn in July-August was higher than that in September-October. The deposition flux of heavy metals in May-June was the highest in November-December, except for Cd.

3.3. Heavy Metals in River

The concentrations of heavy metals in surface runoff of the study area were showed in Figure 4. The concentration ranges of Cu, Zn, As, Pb, Cd and Cr fall in the ranges of 0.01-0.10 mg/L, 0.03-0.08 mg/L, 0.01-0.02 mg/L, 0.00-0.85 mg/L, 0.26-0.46 mg/L and 0.04-0.06 mg/L in surface runoff, with mean concentrations of 0.03 mg/L, 0.05 mg/L, 0.01 mg/L, 0.25 mg/L, 0.35 mg/L and 0.05 mg/L, respectively. The concentration of Cu was the highest at P19, and was the lowest at P2. The highest concentrations of Zn and As were approximately twice the lowest concentrations. At P1, the concentration of Pb was the highest and the concentration of Cd was the lowest. The concentration of Cr was the highest at P9, the lowest at P2, and the highest concentration was 1.5 times of the lowest concentration. The concentration of Pb in some surface runoff and concentration of Cd in all surface runoff were exceed the standard of industrial water (GB 3838-2002). The concentrations of Cu, Zn and As in surface runoff were lower than the industrial water standard (GB 3838-2002). The concentrations of Cu, Zn, As and Cd in the downstream near the mining area were higher than that of the upstream. And, the concentration of Pb was the opposite. The concentration of Cr did not change significantly in the upstream and downstream.

3.4. Principal Component Analysis of Heavy Metals

The results of soil principal component analysis (PCA) in production area are showed in Table 3. The results showed that the KMO test of 0-5 cm, 5-10 cm and 10-20 cm soil layers were 0.805, 0.700 and 0.741, respectively, meeting the condition of KMO > 0.5. Bartlett spherical test results showed that all of 0-5 cm, 5-10 cm and 10-20 cm soil layers were 0. The Bartlett spherical test was < 0.05, which indicated that the soil data of the production area meet the factor analysis condition and can be used for principal component analysis. According to the results, two principal components were finally determined for the soil in the study area, and the variance interpretation rates of 0-5 cm, 5-10 cm and 10-20 cm soil layers were 62.44%, 18.11%, 53.73%, 19.08%, 52.53% and 20.10%, respectively. Cumulative explanations accounted for 80.55%, 72.81% and 72.63%, respectively. Both PC1 and PC2 account for more than 50% of cumulative explanations, which can be used to explain the source and migration path of elements. In the 0-5 cm soil layer, the characteristic of PC1 was 3.75, and the load coefficients of the orthogonal rotation factor of Cu, Zn, As, Pb, Cr and Cd were all higher than 0.8, and the characteristic of PC2 was 1.09. The load coefficients of the orthogonal rotation factors of Cu, Zn, As, Pb, Cr and Cd were low, and the Zn, As and Pb were negative. In the 5-10 cm soil layer, the characteristic of PC1 was 3.22, and the load coefficients of the orthogonal rotation factors of Cu, Zn, As, Pb, Cr and Cd were all higher than 0.5, and the characteristic of PC2 was 1.09. The load coefficients of the orthogonal rotation factors of Cu, Zn, As, Pb, Cr and Cd are low, and the values of Cu and As were negative. In the 10-20 cm soil layer, the characteristic of PC1 was 3.51, and the load coefficients of the orthogonal rotation factors of Cu, Zn, As, Pb, Cr and Cd were all higher than 0.5, and the characteristic value of PC2 was 1.03. The load coefficients of the orthogonal rotation factors of Cu, Zn, As, Pb, Cr and Cd were low, and the values of Cu, As and Cr were negative. Therefore, PC1 was interpreted as atmospheric deposition and PC2 as surface runoff according to the results.

4. Discussion

4.1. Heavy Metals Distribution Pattern

In this study, the Cu, Zn, As and Pb in 0-10 cm soil layer showed a fan-shaped distribution with a direction from northwest to southeast in horizon. The same distribution of heavy metals is observed in mining-affected area of Chifeng city, Inner Mongolia autonomous Region [10]. The fan-shaped distribution of heavy metals was partly due to strong winds in these areas, and the prevailing wind direction determined direction of fan-shape. This distribution pattern increases remediation cost, because of large and dispersive area. And, accompany of multiple metals also enhanced difficulty of remediation. In contrast, horizontal distribution of the same metals showed a thoroughly different pattern in a mining area of Fujian province localized in south China, which is almost uniformly distributed outwards from the mining area [25]. A similar distribution pattern of Pb and As is also found by Xie et al. (2022)[26] in mining area of Hunan province, which is the other province of South China. These results show that winds are not determined drivers of the horizontal distribution of Cu, Zn, As and Pb in the South China.
In this study, Cd was distributed in the north of 1200 m away from the production area and near the downstream of river. It indicated that surface runoff rather than wind drove Cd transport in this studied area. However, many previous studies showed that the horizontal distribution of Cd in the mining area of North China is similar to that of Cu [10,14]. The distribution of Cd was influenced by surface runoff, in the north China. In contrast, the distribution of Cd in the soil of mining area is uniform in all the direction through an outward diffusion in the South China [17,26]. The solubility of Cd was higher than that of Cu, Zn and As, which lead to the above phenomenon. The Cr hardly moves away from the production area, which is consistent with studies conducted in Baotou city of Inner Mongolia autonomous Region and Jiaozuo City of Henan Province [14,17] even in Hunan province localized in the South China [26,27]. These results indicated that the Cr migration capacity was smaller than that of Cu and Zn, and was related to the weight of the Cr-loaded particles. This study showed that the concentrations of Cu, Zn, As and Pb in vertical distribution were negatively correlated to depth. This was consistent with the results of previous studies in North China [8,9], and contrary to the results of studies in the 0-20 cm range in South China[28]. This was due to differences in precipitation and soil pH between them. In this study, the concentration of Cd in the vertical distribution of 0-20 cm soil was positively correlated with soil depth. The distribution of Cd in North China with surface runoff near mining areas is similar to that in the South China [29]. While Cd shows an opposite vertical distribution with Cu, Zn, As and Pb, this is possible due to high mobilization in low pH soils [30]. Contaminated soil was often acidified, with soil pH reaching 2.24 in this study. And then it facilitated Cd leaching in dry areas. This study shows that the vertical distribution of Cr is mainly concentrated in the surface layer (0-10 cm), which is consistent with the research results of mining areas in North China [9]. It is related to the low solubility of Cr and the small weight of attached particles [14].
Accumulated heavy metals in the top soil layer had a higher potential risk of secondary pollution through wind erosion, particularly in northern areas where strong winds often occur in winter and spring. Low precipitation cannot leach heavy metals, such as Cu, Zn, As and Pb, out of the top soil layer in this study area, and they have been detained in this layer. Given these facts, it was speculated that the spatial distribution of heavy metals in the North China driver is wind due to the concentration of heavy metals in the North China are variant in wind direction [13].

4.2. Contribution of Atmospheric Deposition to Heavy Metals Distribution

In this study, the relatively high fluxes and concentration distribution of Cu, Zn, As, Pb and Cr in atmospheric deposition were consistent with distribution pattern of Cu, Zn, As, Pb and Cr in soil in the studied area. The extent of heavy metals in soil affected by atmospheric deposition can be determined [21]. According to the results of principal component analysis, the PC1 was interpreted as atmospheric deposition, and the above six elements in 0-5 cm and 5-20 cm (except Cd in this layer) soil layer were all migrated through atmospheric deposition. The contribution of atmospheric deposition was more than 50% of the total source, which was the main migration path of Cu, Zn, As, Pb and Cr.
Anaman et al. (2022)[19] studied the migration path of heavy metals in the soil of mining areas in Hunan province and found that Cu, Zn, As and Pb in the soil are jointly affected by atmospheric deposition and surface runoff. This was inconsistent with the results of our study, which was caused by more surface runoff near the southern mining area. Wang et al. (2018)[16] studied the migration of heavy metals in the soil of the mining area of Youxi County, Fujian Province, and showed that the migration mode of Cr in the soil is atmospheric deposition, which is consistent with the migration path of Cr in this study. Zhang et al. (2021)[31] found that finer soil particles are more capable of enriching and mobilizing Cr than coarse soil particles. Only finer particles can migrate through atmospheric deposition, so the main migration path of Cr in the soil was atmospheric deposition in both the South and North China. Numerous studies have shown that atmospheric deposition and surface runoff are equally important in the migration path of heavy metals in the South China [19]. In North China, precipitation was lower than in the south, and wind frequency was higher. Thus, atmospheric deposition dominates migration of heavy metals.

4.3. Contribution of Surface Runoff Transport to Heavy Metals Distribution

Surface runoff transport is an important pathway for heavy metal migration, especially in rainy and low-pH soil areas and mobile metals [32]. The main migration path of Cd and Pb in soil of typical mining areas in the North China is surface runoff [33]. The results of principal component analysis could also explain Pb and Cd through surface runoff migration in this study. Chen et al. (2018)[11] analyzed the migration paths of Cd and Pb in typical lead-zinc mining areas in Guangdong Province, and the results showed that the surface runoff of tailings reservoir is the main way of heavy metal migration, which is consistent with this study. Acidic conditions (pH=3) facilitate the release and migration of cadmium and lead from soil, slag or tailings, from residual state to non-residual state, and lead and cadmium from residual state to exchange state [33]. Although the average soil pH in the studied area was about 8, production reduced soil pH in some places, even to less than 3.0. It promoted the migration of heavy metals through surface runoff. A soil leaching experiment showed that the migration ability of Cd is stronger than that of Pb [34]. This result could explain the phenomenon that Cd migrates farther than Pb in surface runoff at this study site.

5. Conclusions

The distribution of soil heavy metals was mainly determined by the local wind direction in dry and windy area. The contribution of atmospheric deposition to migration was over 50%, especially for Cu, Zn, As and Cr. The migration path of Cd was surface runoff. And the migration of Pb were through both atmospheric deposition and surface runoff. This study provided a reliable knowledge for the control of heavy metal pollution in these areas.

Author Contributions

Weimin Bao has carried on the experiment, data analysis and the wrote the manuscript. Zhi Sun guided the experiment. Weifan Wan helped with the final manuscript preparation. Hongmei supervised the research. Haigang Li guided the conception of the study, the analysis of the data and the revision of the paper. All authors contributed to the article and approved the submitted version.

Funding

This work was supported by the Project Fund (2019ZD001).

Data Availability Statement

Data are contained within the article.

Conflicts of Interest

The authors have no conflict of interest to declare.

References

  1. Briffa, J.; Sinagra, E.; Blundell, R. Heavy metal pollution in the environment and their toxicological effects on humans. Heliyon 2020, 6, e04691. [Google Scholar] [CrossRef] [PubMed]
  2. Yang, S.; Danek, T.; Cheng, X.; Huang, Q. Risk assessment of heavy metal pollution in soils of Gejiu Tin ore and other metal deposits of Yunnan Province. In IOP Conference Series: Earth and Environmental Science 2017, 95, 042078.
  3. Zhang, Y.; Wang, Z. Research on Characteristics and Sustainable Development of mineral resources in China. In IOP Conference Series: Earth and Environmental Science 2019, 300, 022155.
  4. Ministry of Environmental Protection of the People’s Republic of China. Report on the national general survey of soil contamination. China Environmental Protection Industry 2014, 36, 10–11. [Google Scholar]
  5. Cao, J.; Xie, C.; Hou, Z. Ecological evaluation of heavy metal pollution in the soil of Pb-Zn mines. Ecotoxicology 2022, 31, 259–270. [Google Scholar] [CrossRef]
  6. Abraham, M.R.; Susan, T.B. Water contamination with heavy metals and trace elements from Kilembe copper mine and tailing sites in western Uganda; implications for domestic water quality. Chemosphere 2017, 169, 281–287. [Google Scholar] [CrossRef] [PubMed]
  7. Steffan, J.J.; Brevik, E.C.; Burgess, L.C.; Cerdà, A. The effect of soil on human health: an overview. European Journal of Soil Science 2018, 69, 159–171. [Google Scholar] [CrossRef]
  8. Deng, D.; Wu, Y.; Sun, Y.; Ren, B.; Song, L. Pollution characteristics and spatial distribution of heavy metals in coal-bearing sandstone soil: a case study of coal mine area in Southwest China. International Journal of Environmental Research and Public Health 2022, 19, 6493. [Google Scholar] [CrossRef]
  9. Fan, S.; Wang, X.; Lei, J.; Ran, Q.; Ren, Y.; Zhou, J. Spatial distribution and source identification of heavy metals in a typical Pb/Zn smelter in an arid area of northwest China. Human and Ecological Risk Assessment 2019, 25, 1661–1687. [Google Scholar] [CrossRef]
  10. Gao, Y.; Liu, H.; Liu, G. The spatial distribution and accumulation characteristics of heavy metals in steppe soils around three mining areas in Xilinhot in Inner Mongolia, China. Environmental Science and Pollution Research 2017, 24, 25416–25430. [Google Scholar] [CrossRef]
  11. Hu, Z.; Wang, C.; Li, K.; Zhu, X. Distribution characteristics and pollution assessment of soil heavy metals over a typical nonferrous metal mine area in Chifeng, Inner Mongolia, China. Environmental Earth Sciences 2018, 77, 1–10. [Google Scholar] [CrossRef]
  12. Chen, T.; Lei, C.; Yan, B.; Li, L.L.; Xu, D.M.; Ying, G.G. Spatial distribution and environmental implications of heavy metals in typical lead (Pb)-zinc (Zn) mine tailings impoundments in Guangdong province, South China. Environmental Science and Pollution Research 2018, 25, 36702–36711. [Google Scholar] [CrossRef]
  13. Fu, L.; Zhang, Z.; Zhang, Q.; Zhang, H. Spatial distribution, risk assessment, and source identification of pollutants around gold tailings ponds: a case study in Pinggu District, Beijing, China. Environmental Monitoring and Assessment 2021, 193, 1–18. [Google Scholar] [CrossRef]
  14. Chen, Y.; Liu, G.; Zhou, C.; Zhou, H.; Wei, Y.; Liu, Y. The influence of gold mining wastes on the migration-transformation behavior and health risks of arsenic in the surrounding soil of mined-area. Frontiers in Earth Science 2023, 10, 1068763. [Google Scholar] [CrossRef]
  15. Wang, Z.; Luo, Y.; Zheng, C.; An, C.; Mi, Z. Spatial distribution, source identification, and risk assessment of heavy metals in the soils from a mining region: a case study of Bayan Obo in northwestern China. Human and Ecological Risk Assessment 2020, 27, 1276–1295. [Google Scholar] [CrossRef]
  16. Li, P.; Lin, C.; Cheng, H.; Duan, X. Contamination and health risks of soil heavy metals around a lead/zinc smelter in southwestern China. Ecotoxicology and Environmental Safety 2015, 113, 391–399. [Google Scholar] [CrossRef]
  17. Anaman, R.; Peng, C.; Jiang, Z.; Liu, X.; Zhou, Z.; Guo, Z.; Xiao, X. Identifying sources and transport routes of heavy metals in soil with different land uses around a smelting site by GIS based PCA and PMF. Science of the Total Environment 2022, 823, 153759. [Google Scholar] [CrossRef] [PubMed]
  18. Fang, H.; Gui, H.; Yu, H.; Li, J.; Wang, M.; Jiang, Y. Characteristics and source identification of heavy metals in abandoned coal-mining soil: a case study of Zhuxianzhuang coal mine in Huaibei coalfield (Anhui, China). Human and Ecological Risk Assessment 2021, 27, 708–723. [Google Scholar] [CrossRef]
  19. Jiang, F.; Ren, B.; Hursthouse, A.S.; Zhou, Y. Trace metal pollution in topsoil surrounding the Xiangtan manganese mine area (South-Central China): source identification, spatial distribution and assessment of potential ecological risks. International Journal of Environmental Research and Public Health 2018, 15, 2412. [Google Scholar] [CrossRef] [PubMed]
  20. Li, K.; Gu, Y.; Li, M.; Zhao, L.; Ding, J.; Lun, Z.; Tian, W. Spatial analysis, source identification and risk assessment of heavy metals in a coal mining area in Henan, central China. International Biodeterioration and Biodegradation 2018, 128, 148–154. [Google Scholar] [CrossRef]
  21. Liang, J.; Feng, C.; Zeng, G.; Gao, X.; Zhong, M.; Li, X.; Fang, Y. Spatial distribution and source identification of heavy metals in surface soils in a typical coal mine city, Lianyuan, China. Environmental Pollution 2017, 225, 681–690. [Google Scholar] [CrossRef]
  22. Lü, J.; Jiao, W.B.; Qiu, H.Y.; Chen, B.; Huang, X.X.; Kang, B. Origin and spatial distribution of heavy metals and carcinogenic risk assessment in mining areas at You'xi county southeast China. Geoderma 2018, 310, 99–106. [Google Scholar] [CrossRef]
  23. Maghrebi, M.; Noori, R.; Bhattarai, R.; Mundher Yaseen, Z.; Tang, Q.; Al-Ansari, N.; Madani, K. Iran's agriculture in the Anthropocene Earth's Future 2020, 8, e2020EF001547.
  24. Qiao, P.; Wang, S.; Li, J.; Zhao, Q.; Wei, Y.; Lei, M.; Zhang, Z. Process, influencing factors, and simulation of the lateral transport of heavy metals in surface runoff in a mining area driven by rainfall: a review. Science of the Total Environment 2023, 857, 159119. [Google Scholar] [CrossRef] [PubMed]
  25. Rahman, A.; Jahanara, I.; Jolly, Y.N. Assessment of physicochemical properties of water and their seasonal variation in an urban river in Bangladesh. Water Science and Engineering 2021, 14, 139–148. [Google Scholar] [CrossRef]
  26. Vanderschueren, R.; Doevenspeck, J.; Helsen, F.; Mounicou, S.; Santner, J.; Delcour, J.A.; Smolders, E. Cadmium migration from nib to testa during cacao fermentation is driven by nib acidification. LWT-Food Science and Technology 2022, 157, 113077. [Google Scholar] [CrossRef]
  27. Wang, J.; Huang, Y.; Beiyuan, J.; Wei, X.; Qi, J.; Wang, L.; Xiao, T. Thallium and potentially toxic elements distribution in pine needles, tree rings and soils around a pyrite mine and indication for environmental pollution. Science of the Total Environment 2022, 828, 154346. [Google Scholar] [CrossRef]
  28. Wang, Q.; Cai, J.; Gao, F.; Li, Z.; Zhang, M. Pollution level, ecological risk assessment and vertical distribution pattern analysis of heavy metals in the tailings dam of an abandon Lead–Zinc mine. Sustainability 2023, 15, 11987. [Google Scholar] [CrossRef]
  29. Wang, Z.; Hong, C.; Xing, Y.; Wang, K.; Li, Y.; Feng, L.; Ma, S. Spatial distribution and sources of heavy metals in natural pasture soil around copper-molybdenum mine in northeast China. Ecotoxicology and Environmental Safety 2018, 154, 329–336. [Google Scholar] [CrossRef]
  30. Wei, H.B.; Luo, M.; Xiang, L.; Zha, L.S.; Yang, H.L. Analysis on the Distribution Characteristics and Influence Mechanism of Migration and Transformation of Heavy Metals in Mining Wasteland. Acta Scientiae Circumstantiae 2023, 44, 3573–3584. [Google Scholar]
  31. Wen, J.; Wu, C.; Bi, X.; Zhang, S.; Ouyang, H.; Ye, J.; Yu, Q. Soil pH change induced by smelting activities affects secondary carbonate production and long-term Cd activity in subsoils. Applied Geochemistry 2023, 152, 105663. [Google Scholar] [CrossRef]
  32. Xie, Q.; Ren, B.; Hursthouse, A.; Shi, X. Effects of mining activities on the distribution, controlling factors, and sources of metals in soils from the Xikuangshan South Mine, Hunan Province. Integrated Environmental Assessment and Management 2022, 18, 748–756. [Google Scholar] [CrossRef]
  33. Zhang, Z.; Guo, G.; Zhao, H.; Wu, D. Partitioning, leachability, and speciation of chromium in the size-fractions of soil contaminated by chromate production. Chemosphere 2021, 263, 128308. [Google Scholar] [CrossRef]
  34. Zhao, W.; Gu, C.; Ying, H.; Feng, X.; Zhu, M.; Wang, M.; Wang, X. Fraction distribution of heavy metals and its relationship with iron in polluted farmland soils around distinct mining areas. Applied Geochemistry 2021, 130, 104969. [Google Scholar] [CrossRef]
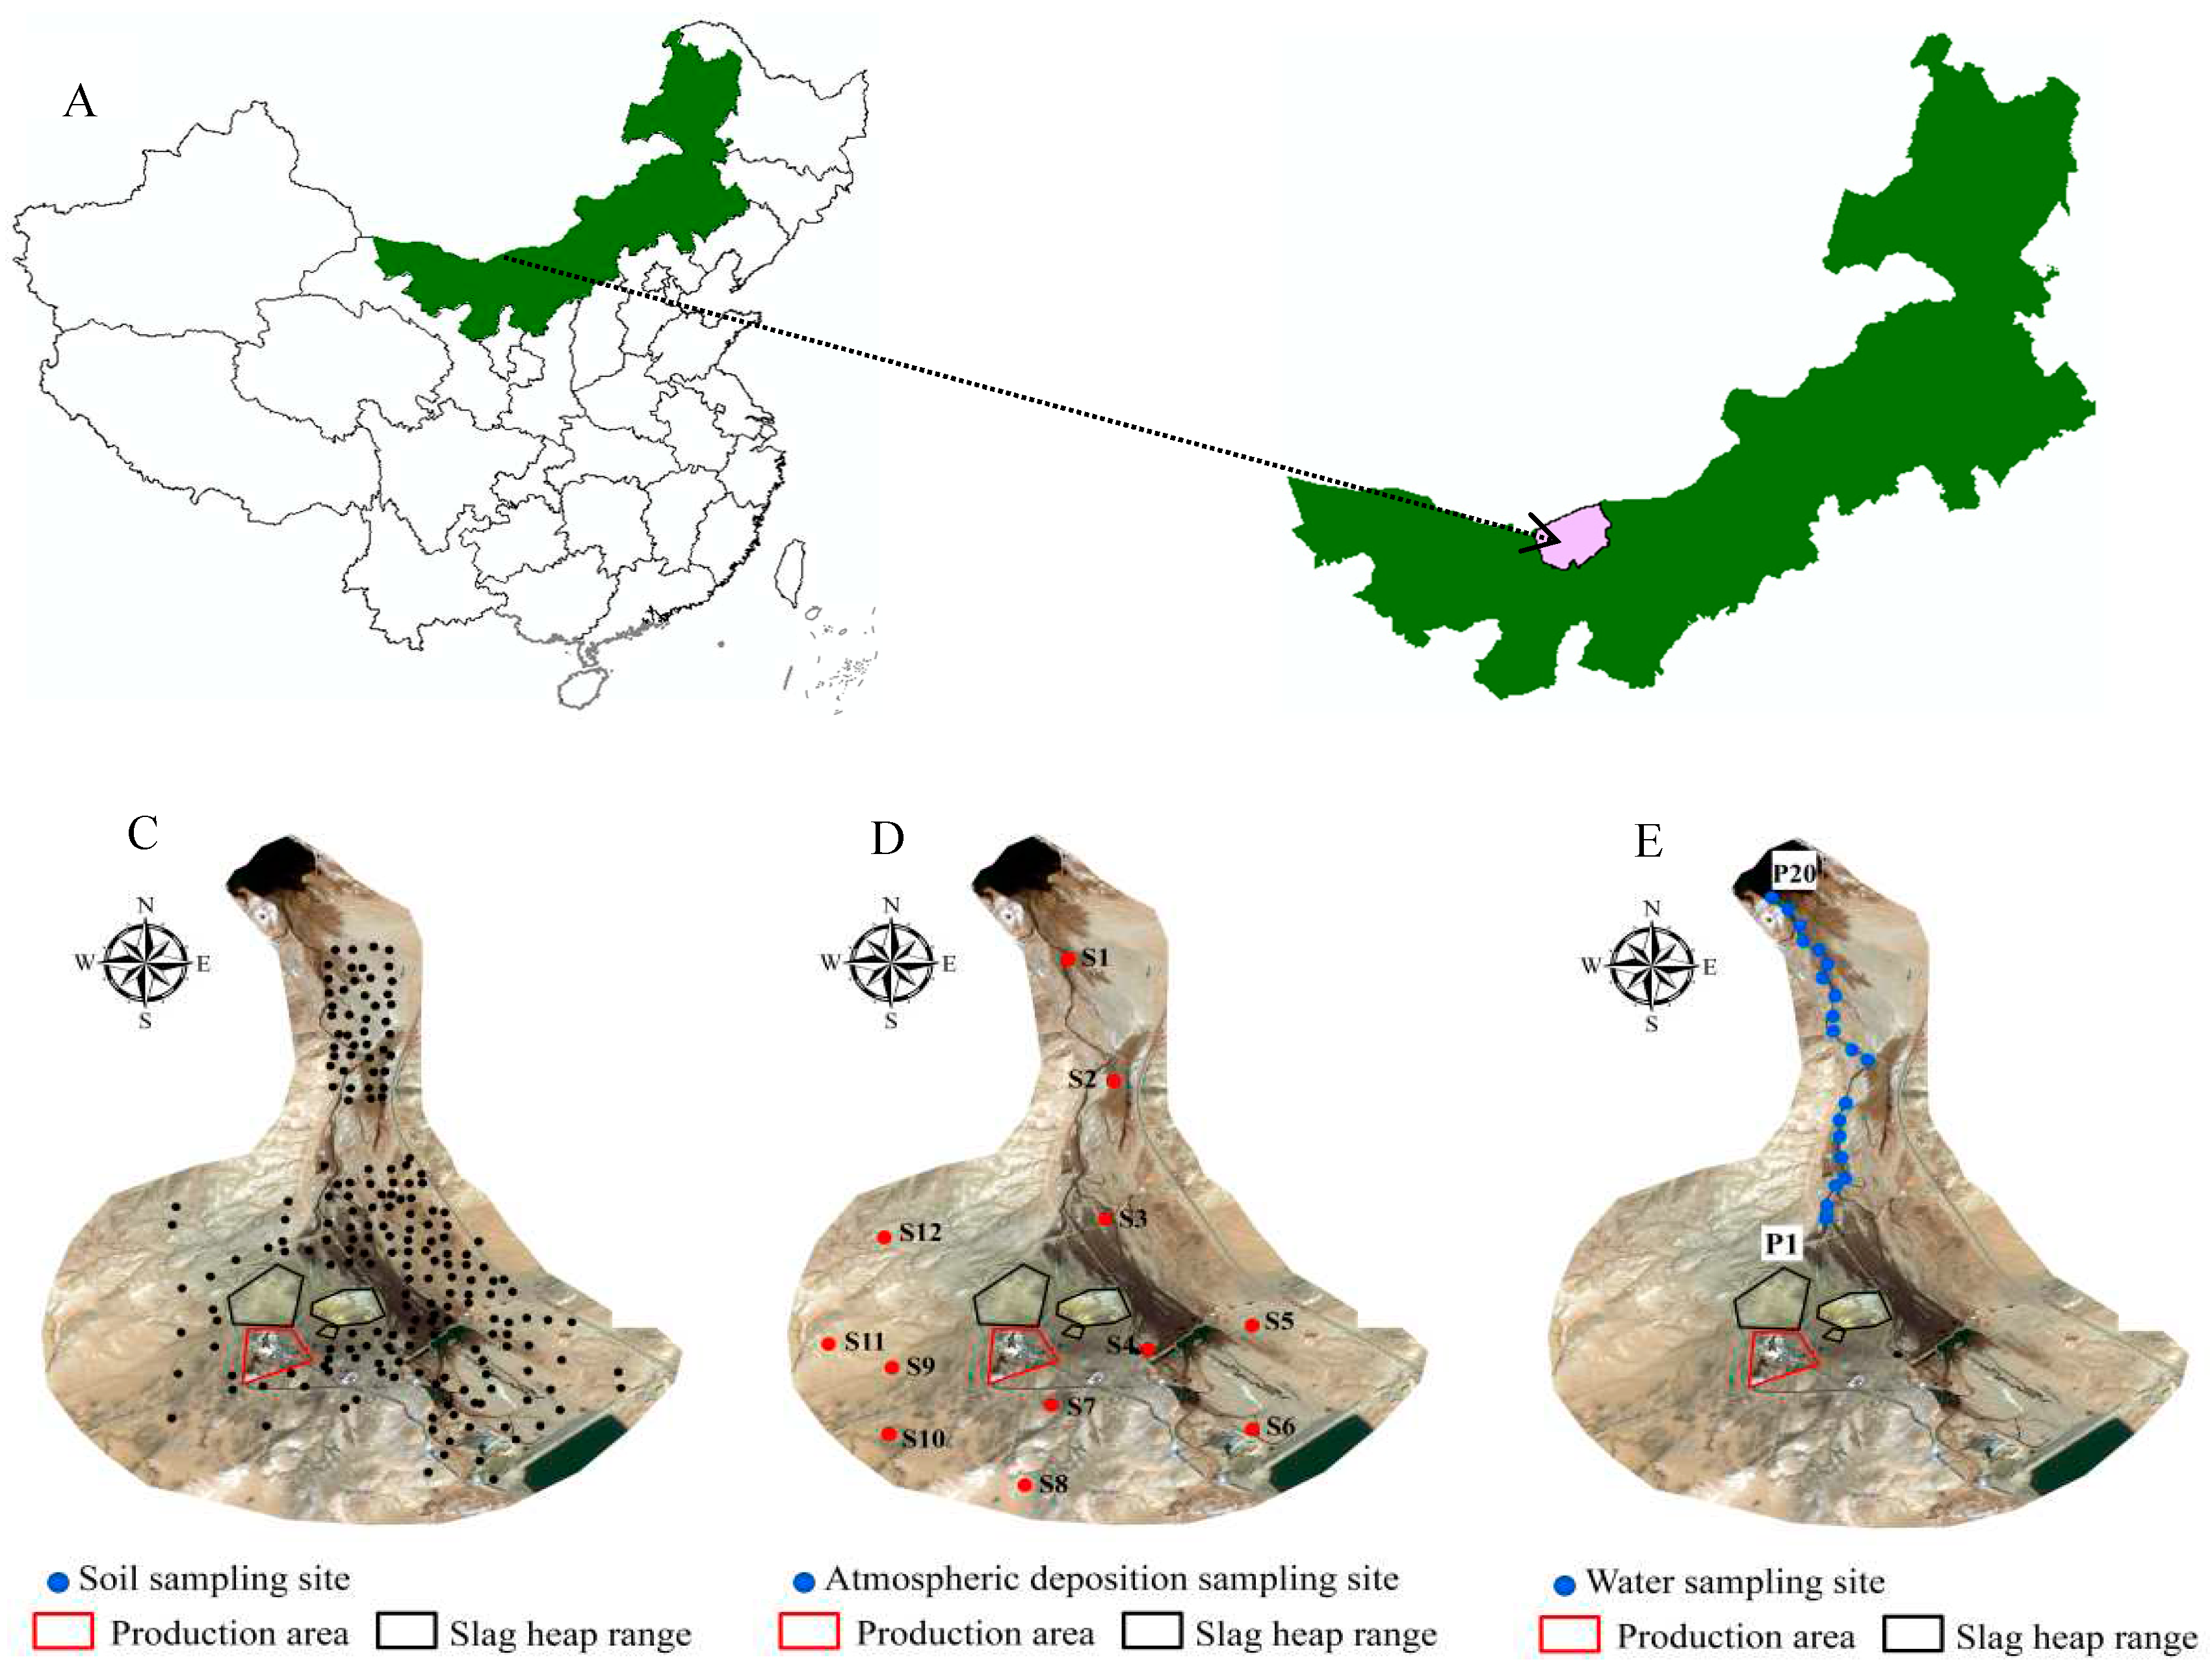
Figure 1. Map of studied area (A) and the location of sample sites (C: soil; D: atmospheric deposition; E: water).
Preprints 91860 g001
Figure 2. Spatial distribution of heavy metals (A, B, C: Cu; D, E, F: Zn; G, H, I: As; J, K, L: Pb; M, N, O: Cd; P, Q, R: Cd) at different soil layer in studied area.
Preprints 91860 g002aPreprints 91860 g002b
Figure 3. Heavy metal concentrations in atmospheric deposition (A: Cu; B: Zn; C: Pb; D: As; E: Cd; F: Cr).
Preprints 91860 g003
Figure 4. Heavy metal concentrations in river (A: Cu; B: Zn; C: As; D: Pb; E: Cd; F: Cr).
Preprints 91860 g004
Table 1. Atmospheric deposition fluxes of heavy metals (mg/m2/year).
Heavy metal Sampling point
S1 S2 S3 S4 S5 S6 S7 S8 S9 S10 S11 S12
Cu 17.04 31.99 52.31 221.59 193.91 163.45 135.30 101.42 120.21 83.32 66.36 85.67
Zn 12.33 21.59 46.20 202.49 143.97 109.07 141.45 80.31 64.41 103.79 47.86 55.73
As 1.62 2.04 4.78 10.56 9.56 6.96 8.64 7.61 6.58 4.94 2.78 3.62
Pb 12.81 20.96 51.39 122.08 108.41 69.97 90.74 68.45 73.67 55.59 36.58 42.65
Cd 0.02 0.04 0.06 0.16 0.14 0.09 0.16 0.14 0.10 0.08 0.07 0.08
Cr 7.50 11.03 15.94 50.83 46.68 39.14 38.85 28.82 34.64 31.08 25.69 23.27
Table 2. Atmospheric deposition fluxes of heavy metals (mg/m2/60 d).
Heavy metal Date Sampling point
S1 S2 S3 S4 S5 S6 S7 S8 S9 S10 S11 S12
Cu 11/2020-12/2020 1.60 4.24 6.02 25.54 22.48 20.52 22.25 14.00 17.55 13.40 8.03 11.34
01/2021-02/2021 3.78 6.51 10.51 55.70 50.57 43.91 28.59 20.92 24.09 15.63 13.82 21.53
03/2021-04/2021 3.23 6.16 10.25 38.78 32.78 26.33 23.24 18.17 18.67 16.91 13.44 16.48
05/2021-06/2021 2.51 4.82 7.15 32.02 28.60 23.73 22.82 14.76 20.57 13.44 9.51 11.63
07/2021-08/2021 3.03 4.97 8.32 34.98 29.27 24.04 18.45 16.04 21.17 11.75 10.46 12.33
09/2021-10/2021 2.89 5.29 10.06 34.56 30.21 24.92 19.95 17.54 18.16 12.18 11.10 12.35
Zn 11/2020-12/2020 0.94 2.65 5.20 23.25 17.48 13.17 21.55 10.60 8.45 13.53 7.02 7.72
01/2021-02/2021 3.21 4.74 9.42 49.47 44.60 27.89 27.87 16.91 13.27 20.01 9.15 11.47
03/2021-04/2021 2.85 4.93 9.18 41.47 24.08 20.18 25.06 16.10 11.95 19.87 9.08 10.34
05/2021-06/2021 1.54 2.85 6.45 25.30 18.44 14.75 21.83 11.36 9.55 16.22 7.26 7.92
07/2021-08/2021 1.83 2.86 7.53 32.55 18.93 15.53 23.42 12.18 10.40 17.69 7.57 8.78
09/2021-10/2021 1.97 3.57 8.41 30.45 20.44 17.55 21.73 13.16 10.79 16.46 7.79 9.50
As 11/2020-12/2020 0.05 0.17 0.51 1.49 1.28 0.85 1.34 1.07 0.64 0.60 0.32 0.51
01/2021-02/2021 0.47 0.36 1.21 2.17 1.96 1.52 1.65 1.45 1.56 1.25 0.59 0.73
03/2021-04/2021 0.43 0.47 1.06 1.88 1.69 1.34 1.56 1.39 1.34 0.98 0.56 0.66
05/2021-06/2021 0.11 0.28 0.61 1.67 1.53 0.92 1.37 1.12 0.74 0.62 0.38 0.53
07/2021-08/2021 0.34 0.41 0.72 1.67 1.57 1.30 1.36 1.31 1.10 0.81 0.51 0.60
09/2021-10/2021 0.22 0.36 0.67 1.69 1.54 1.03 1.36 1.26 1.20 0.68 0.43 0.59
Heavy metal Date Sampling point
S1 S2 S3 S4 S5 S6 S7 S8 S9 S10 S11 S12
Pb 11/2020-12/2020 1.12 2.79 6.27 15.70 14.97 8.72 11.81 8.40 9.06 6.90 4.64 5.32
01/2021-02/2021 3.44 4.39 12.19 26.90 24.50 15.88 20.24 17.74 15.46 11.61 7.46 8.91
03/2021-04/2021 2.72 4.08 11.18 24.57 22.90 13.58 18.74 13.15 13.91 11.54 7.38 7.93
05/2021-06/2021 1.63 2.87 6.78 16.45 14.66 9.86 12.38 8.71 9.90 7.27 5.42 6.47
07/2021-08/2021 1.87 3.32 7.34 18.89 15.34 9.28 13.27 9.95 12.08 7.65 5.71 6.74
09/2021-10/2021 2.03 3.52 7.63 19.57 16.04 12.65 14.30 10.50 13.26 10.62 5.98 7.28
Cd 11/2020-12/2020 0.00 0.00 0.01 0.02 0.02 0.01 0.02 0.02 0.01 0.01 0.01 0.01
01/2021-02/2021 0.01 0.01 0.01 0.03 0.03 0.02 0.03 0.02 0.02 0.01 0.01 0.01
03/2021-04/2021 0.00 0.01 0.01 0.03 0.02 0.02 0.03 0.03 0.02 0.01 0.01 0.01
05/2021-06/2021 0.00 0.00 0.01 0.02 0.02 0.01 0.02 0.02 0.02 0.01 0.01 0.01
07/2021-08/2021 0.00 0.00 0.01 0.02 0.02 0.02 0.02 0.02 0.02 0.01 0.01 0.01
09/2021-10/2021 0.00 0.01 0.01 0.03 0.02 0.02 0.03 0.03 0.02 0.01 0.01 0.01
Cr 11/2020-12/2020 1.03 1.44 2.25 6.46 6.04 4.99 5.61 3.53 4.78 4.50 3.05 3.08
01/2021-02/2021 1.44 2.31 3.01 11.22 10.52 8.80 8.72 5.76 7.35 6.00 5.08 5.07
03/2021-04/2021 1.41 2.14 3.10 9.70 9.06 7.03 6.71 5.68 6.12 5.89 5.19 4.33
05/2021-06/2021 0.97 1.56 2.24 6.85 6.34 5.62 6.08 3.73 5.02 4.65 3.40 3.23
07/2021-08/2021 1.41 1.69 2.61 7.56 6.74 5.80 5.47 4.60 5.54 4.62 4.23 3.57
09/2021-10/2021 1.24 1.90 2.72 9.05 7.98 6.9 6.27 5.52 5.83 5.42 4.74 3.98
Table 3. Principal component analysis results.
Heavy metal Soil layer (cm)
0-5 5-10 10-20
KMO Bartlett KMO Bartlett KMO Bartlett
0.805 0.000 0.700 0.000 0.741 0.000
Components
PC1 PC2 PC1 PC2 PC1 PC2
Cu 0.863 0.060 0.854 -0.556 0.832 -0.190
Zn 0.907 -0.079 0.831 0.025 0.875 0.084
As 0.869 -0.105 0.818 -0.178 0.834 -0.373
Pb 0.823 -0.271 0.521 0.612 0.530 0.558
Cr 0.963 0.120 0.738 0.463 0.802 -0.448
Cd 0.856 0.255 0.440 0.687 0.348 0.759
Eigenvalue 3.746 1.086 3.224 1.025 3.512 1.026
Contribution rate % 62.441 18.105 53.727 19.083 52.529 20.102
Cumulative contribution rate % 62.441 80.546 53.727 72.810 52.529 72.631
Disclaimer/Publisher’s Note: The statements, opinions and data contained in all publications are solely those of the individual author(s) and contributor(s) and not of MDPI and/or the editor(s). MDPI and/or the editor(s) disclaim responsibility for any injury to people or property resulting from any ideas, methods, instructions or products referred to in the content.
Copyright: This open access article is published under a Creative Commons CC BY 4.0 license, which permit the free download, distribution, and reuse, provided that the author and preprint are cited in any reuse.
Prerpints.org logo

Preprints.org is a free preprint server supported by MDPI in Basel, Switzerland.

Subscribe

© 2024 MDPI (Basel, Switzerland) unless otherwise stated