Preprint
Article

Can Forest Certification Schemes Really Drive Economic Value to European Forest Owners?

Altmetrics

Downloads

123

Views

35

Comments

0

Submitted:

28 November 2023

Posted:

30 November 2023

You are already at the latest version

Alerts
Abstract
Keywords: Forest management; sustainability; FSC; PEFC; research; market share
Keywords: 
Subject: Biology and Life Sciences  -   Forestry

1. Introduction

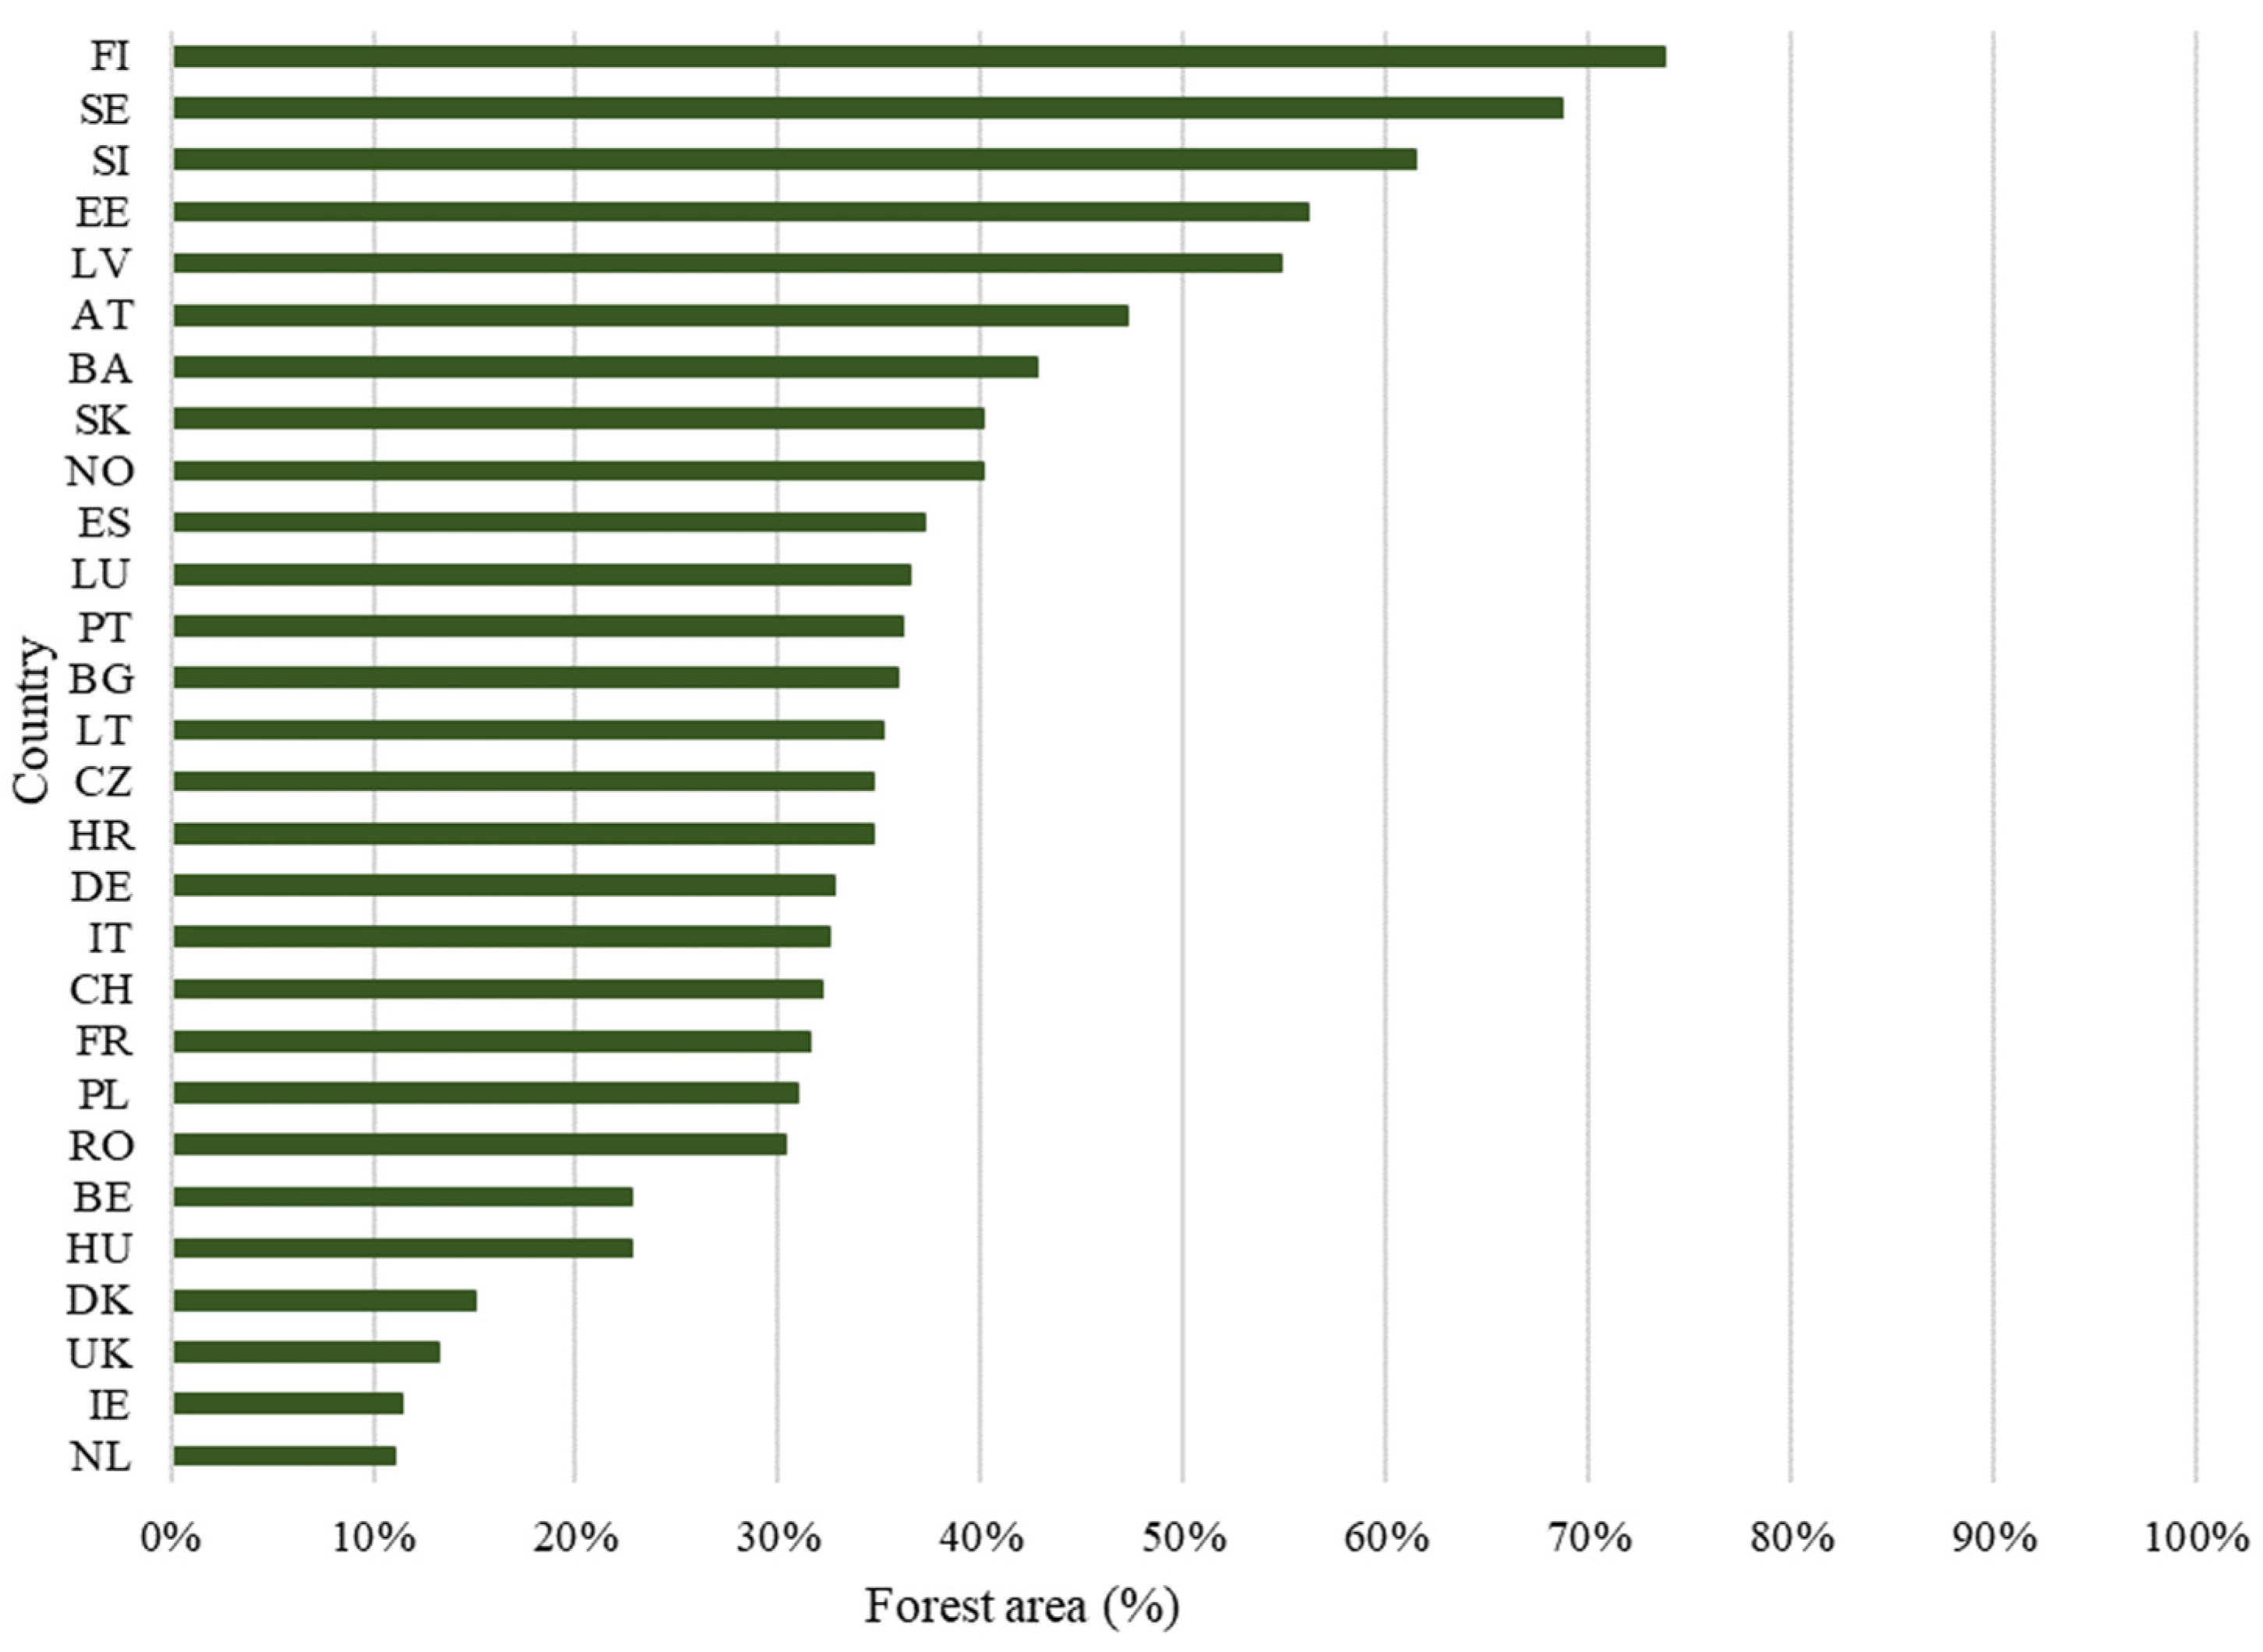
Forest represents around 39% of the land cover in Europe [1], with a highly variable distribution across the continent [2,3]. Countries in Northern Europe generally have large forested areas, while regions in Central-East and Central-West Europe have the lowest percentages of forest area [4]. Overall, Europe has experienced an increase in forest area in the past few decades as a result of additional afforestation programmes and natural regeneration initiatives on less productive lands [5,6].
Forests provide a wide range of ecosystem services, such as climate regulation, carbon sequestration, biodiversity conservation and water regulation besides being the focus of livelihoods for millions of people worldwide, with important economic outcomes, such as wood production, non-wood forest products, and ecotourism [7,8,9,10,11]. In Europe, the forest sector contributes for approximately 1% of the overall Gross Domestic Product (GDP), and employs closely to 2.6 million people [12]. Climate changes, the expansion of the agriculture dedicated areas and the livestock grazing pressure, the intensive exploitation of forests and frequent wildfires have been causing additional damages to forests [13]. These major challenges intensify deforestation and forest degradation, significantly decreasing their potential benefits to the planet while increasing the unwanted greenhouse gas emissions, loss of biodiversity, and degradation of soil quality [14,15].
Sustainable forest management and its relationship to most relevant worldwide goals, such as a low-carbon economy, biodiversity conservation and the mitigation of climate change, has boosted the growing interest in certified forest-based products [16,17]. This has been driven mainly by consumer awareness and demand for sustainable products, as well as by public policies that promote sustainable procurement practices for enhancing forest ecosystem services and related environmental benefits, along with the increasing need for design and production of renewable biomaterials [18,19]. In response to this demand, many companies have now adopted sustainable sourcing policies that require them to rethink the whole value chain and products from certified forests [20].
Forest certification was established as a tool to promote sustainable forest management practices and to reduce the negative impacts of exploiting forests and their ecosystems [6,21]. The sustainable forest management framework should contribute to the global balance of ecological, economic, and social needs by making sure that forest resources are managed in a way that satisfies current demands without endangering the needs of future generations [22,23]. The Forest Stewardship Council (FSC) and the Programme for the Endorsement of the Forest Certification (PEFC) are the two main certification schemes, certifying both forest management and the forest chain of custody [6,16,24]. The FSC, established in 1993, was the first certification scheme to set standards for responsible forest management and to certify forests that meet those standards [25]. The PEFC provides a framework for national forest certification standards [26], allowing national structures to develop their own guidelines reflecting their local conditions and priorities. Additionally, forest management in Europe is governed by a range of policies, laws, and guidelines that aim to promote sustainable forest management. The European Union (EU) has developed a comprehensive framework for forest management through its Forest Strategy, adopted in 2021. This strategy outlines a set of objectives and actions that aim to promote sustainable forest management and ensure that forests continue to provide a wide range of environmental, social, and economic benefits [27]. Several of these policies are grounded on the notion that the investment in forests has the potential to provide financial returns while promoting sustainable forest practices [28]. It is this potential valorization and financial return that is yet undefined and that needs to be further validated.
The forest sector must be sustainable and resilient in all of its aspects including economically, and the certification procedures comprise additional costs to producers and forest managers [19]. An international commitment to sustainability has been established based on the concept that sustainable development represents an urgent need that should be aimed and accomplished by all countries through the coordinated efforts of a variety of individuals and organizations [23]. As forests play an essential role in sustainable development and have a direct impact on the carbon cycle, climate change, and biodiversity [7,8,9,10,11], they were considered in the original definition of sustainability, and their impacts were integrated into sustainable indicators and metrics [29]. The Environmental Performance Index (EPI) aims to measure the environmental health and ecosystem vitality at the national level for hierarchical purposes [30] and Sustainable Development Goals (SDG) give focus to the social, economic, and environmental sustainability [31]. The emphasis on sustainability addressed by EPI and SDG should be mandatory for all nations and not just those in developing regions.
The potential for guiding society towards a more sustainable future relies on scientific and technological advancement. Scientific findings are essential for promoting forestry-related knowledge and innovation. They offer information on the novel management techniques and the most sustainable forest practices [30]. Quantifying the economic, environmental, and social advantages of certification may inspire forest owners to pursue certification and investors to finance certified industries and products. The impact of research on investment choices in forest related topics, across Europe, can be better understood by examining the relationship between the number of scientific publications focused on forest certification and the level of investment in the sector by country. Scientific publications serve as valuable sources of information and guidance for policymakers, investors, and practitioners involved in forestry [30], delivering evidence-based research, case studies, and practical recommendations. Integrating scientific research with data from the forest certification process and the economy of the sector will help to clearly define the risks, advantages, and potential for attracting additional investments and market expansion. There is a significant call from the forest sector for improving financing to address the lack of funds for biodiversity protection and sustainable land management [32]. Investment patterns are still favoring activities that are economically relevant but not always environmentally sustainable [33].
By studying and disseminating new knowledge on the benefits and potential risks of investing in forests, as well as good practices in their sustainable management and ecosystems conservation for the greater good, scientific publications may play a crucial role in encouraging and informing political and investment decisions. The aim of this study is to provide an analysis of the levels of forest certification across Europe and to identify key factors influencing the relationship between forest certification, research, and investment or economic valorization of the forest-related markets. In this context, the present study explores the available information from technical reports, policy documents, and other reliable public data sources associated with forest certification and related economic indicators by country in Europe and infers the impacts they have depending on the types of forest management and certification schemes in the different member states. This research also looks at the relevance of scientific studies on this topic and its potential relationship with the economic impact of forest certification on each country. The relevance of the scientific research was assessed by the number of studies with specific keywords related to this topic that were retrieved from the Scopus database for each European nation.

2. Materials and Methods

A thorough search was conducted on reputable institutional websites, public platforms and databases known to publish data, technical reports and policy briefings linked to forestry, forest certification, economic indicators, and environmental indicators for European countries. The Scopus database was searched for European scientific publications on economic research and forest certification.

2.1. Public and institutional data selection and extraction

2.1.1. Total forest and certified forest areas

Data related to total land area, total forest area and total certified forest area for the year 2020 and for each European country were collected from [34]; the forest area certified by PEFC [35] and certified by FSC [36] were obtained from the respective institutional sites. The percentage (%) of forest area was obtained by dividing the total forest area of each country (1000 ha) by the respective total land area (1000 ha). The percentage (%) of total certified forest area was determined by dividing the certified forest area (1000 ha) by the total forest area of each country. The percentage (%) of certified forest areas by PEFC was calculated by dividing the total certified forest area by the area certified by this organization for each country. The percentage (%) of certified forest area by FSC was quantified by dividing the total certified forest area by the area certified by this programme within each country.

2.1.2. Economic indicators

The economic indicators for the year 2020 1) intermediate consumption (million euros), 2) the gross value added (GVA) (million euros), and the 3) outputs from the forest sector and related secondary activities (million euros), were extracted from [12]. The GVA represents the contribution of each sector, in this particular case of the forest sector, to the economy of a country by calculating the value of the output of the sector minus the cost of intermediate consumption [12]. Economic indicators were weighted by certified forest by multiplying the value for each indicator by the proportion of area certified for country.

2.1.3. Environmental indicators

Data related to environmental indicators were obtained from the Environmental performance index (EPI) database [37] and from the [38]. The selected environmental indicators were EPI and the terrestrial biome protection, global, in biodiversity and habitat (TBG) both for the year 2020 [30]. SDG 15, protect, restore and promote sustainable use of terrestrial ecosystems, sustainably manage forests, combat desertification, and halt and reverse land degradation and halt biodiversity loss, was also addressed through SDG15.2.1 targets: proportion of forest area within legally established protected areas for the year 2020 and proportion of forest area under a long-term management plan [31].

2.1.4. Selected countries

Due to the statistics available for the chosen indicators and variables, 28 European countries were selected and further investigated in the present study: Austria (AT), Belgium (BE), Bosnia and Herzegovina (BA), Bulgaria (BG), Croatia (HR), Czechia (CZ), Denmark (DK), Estonia (EE), Finland (FI), France (FR), Germany (DE), Hungary (HU), Ireland (IE), Italy (IT), Latvia (LV), Lithuania (LT), Luxembourg (LU), Netherlands (NL), Norway (NO), Poland (PL), Portugal (PT), Romania (RO), Slovakia (SK), Slovenia (SI), Spain (ES), Sweden (SE), Switzerland (CH), United Kingdom (UK).

2.2. Scientific publications selection

2.2.1. Scopus database search

To collect scientific data for this review, a comprehensive search was conducted using the electronic database Scopus. The search was conducted during June 2023, using specific words related to forest certification in Europe (Table 1). The search strategy was designed to identify all relevant documents published since ever available through the Scopus database.
To be included in this review, documents had to meet the following criteria: (1) to include one or more of the search words in the document title, in the abstract and/or in the document keywords; (2) to be written in English; (3) to be originated from any country from Europe (country of each co-author). Studies or reports that did not meet these inclusion criteria were excluded from the review. In addition, studies that were duplicates, case reports, or editorials were also excluded (final database retrieved 452 documents).

2.2.2. Scientific data analysis

The data extracted from the articles included the number of the selected words within each publication, the type of publication, the country of origin of all co-authors, the publication year, the forest certification standard studied, author’s and indexed keywords. The extracted data was synthesized using the CADIMA web tool (https://www.cadima.info/index.php). Data related to author’s and indexed keywords and European countries was analyzed with the software VOSviewer version 1.6.19 (https://www.vosviewer.com/).

2.2.3. Limitations

This literature compilation had limitations that were considered by the authors. First, the search was limited to articles published in English, which may have excluded relevant studies published in other languages. This limitation could be overcome by collaboration with colleagues form those countries able to replicate the same methodology in their own national language and databases. Second, the search was limited to Scopus database, although being considered one of the most relevant scientific databases in the world, other relevant publications with no Scopus indexation may be excluded. To partially circumvent this limitation, we have included a vast amount of grey literature and non-indexed studies, data sources and technical reports. Additionally, the search was limited to studies that met specific inclusion criteria, which may have resulted in the exclusion of studies that could have contributed to the present work.

3. Results

3.1. Forest certification status and economic indicators

To first understand the geographical distribution of forest land cover and its relation to FSC and PEFC certified forest area, FAO [34], PEFC [35] and FSC [36] databases were screened and data was extracted by European country. According to data from FAO [36], the average amount of forest cover in the 28 European countries that were screened corresponded to 36% of the total country land area, with 15 of those countries having a forest area between 30% and 40%. Finland, Sweden and Slovenia were the countries with the largest percentage of forested area in the European Continent, reaching the highest value of 74% in Finland and 69% in Sweden. The countries with the lowest percentage of forest area were the Netherlands and Ireland with the forest land use corresponding to circa 11% of the land area (Figure 1).
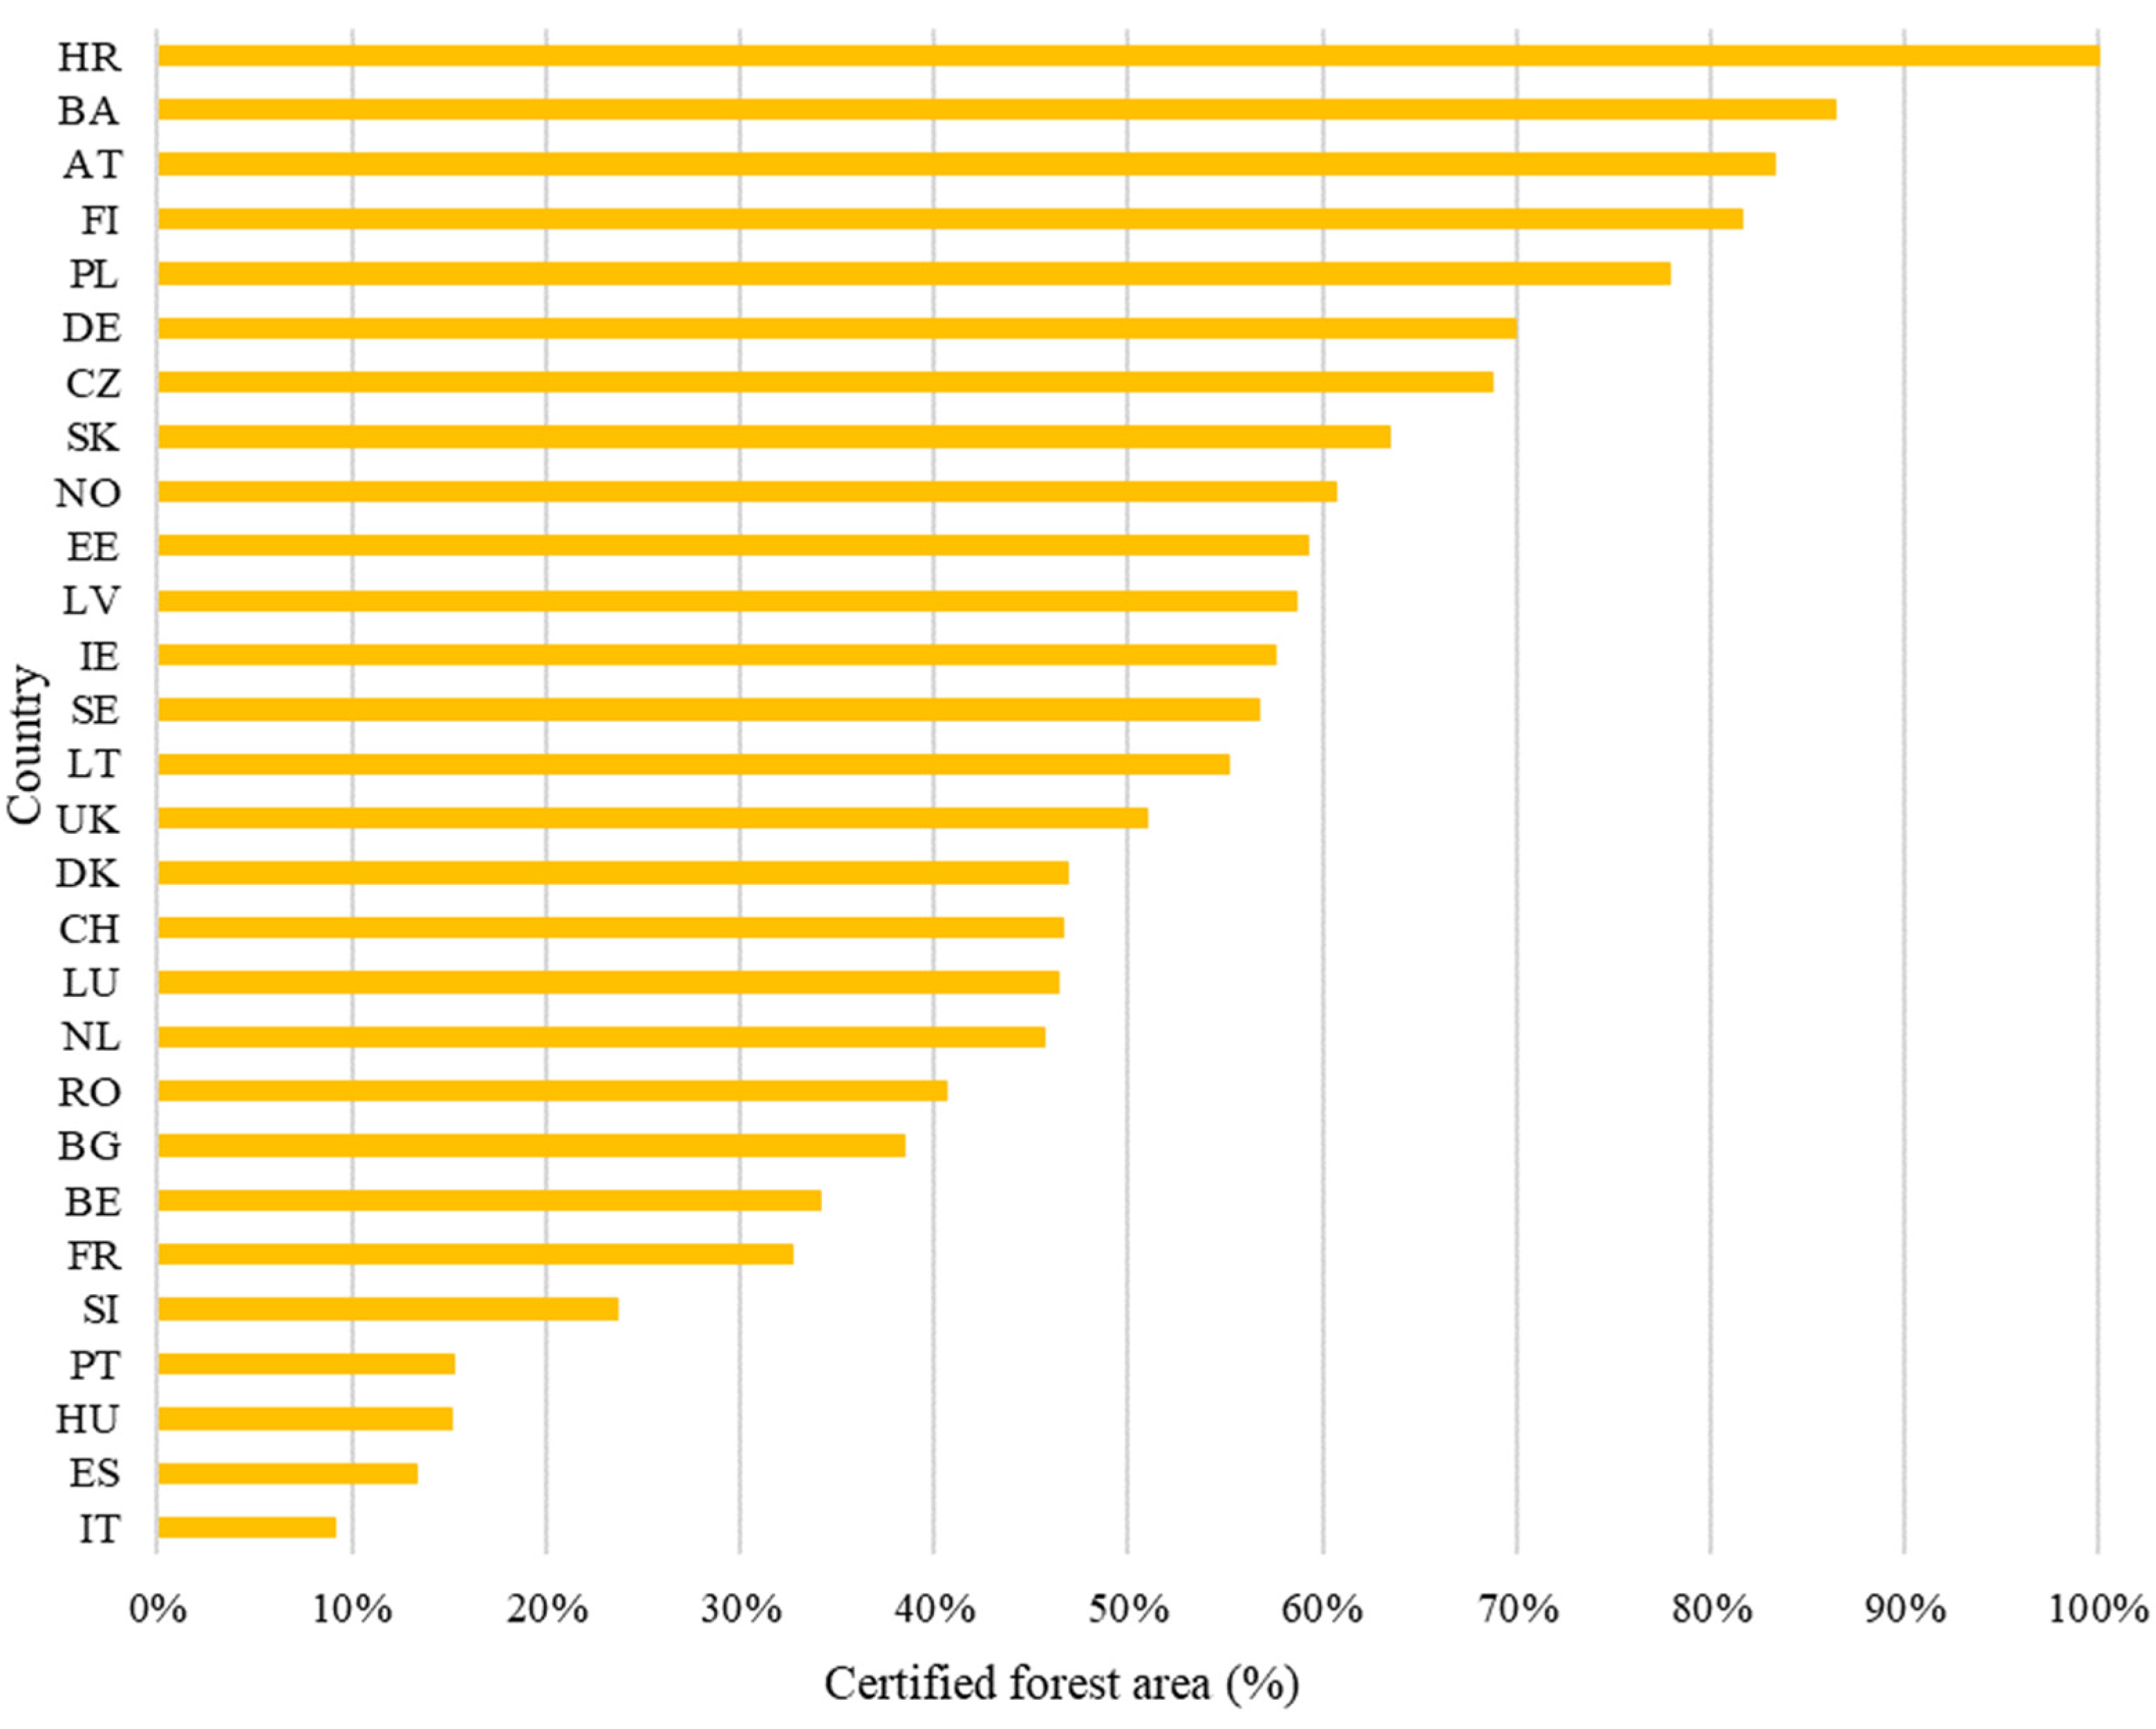
In comparison to the area covered by forest, the analysis of the certified forest area published by [34] in each of the 28 European countries revealed a different pattern: By having all of its forest certified (100%) by at least one of the two organizations, FSC and PEFC, Croatia had the highest proportion of certified forest area followed by Bosnia and Herzegovina (86%). Austria (83%) and Finland (82%) each had more than 80% of accredited forest area. Italy, Spain, Hungary, and Portugal had the lowest percentage of certified forest land, with numbers ranging from 9% in Italy to 15% in Hungary and Portugal. More than 50% of the forest area in 15 of the 28 nations has already received FSC and/or PEFC certification. The average certified forest area among the 28 nations was 51% (Figure 2).
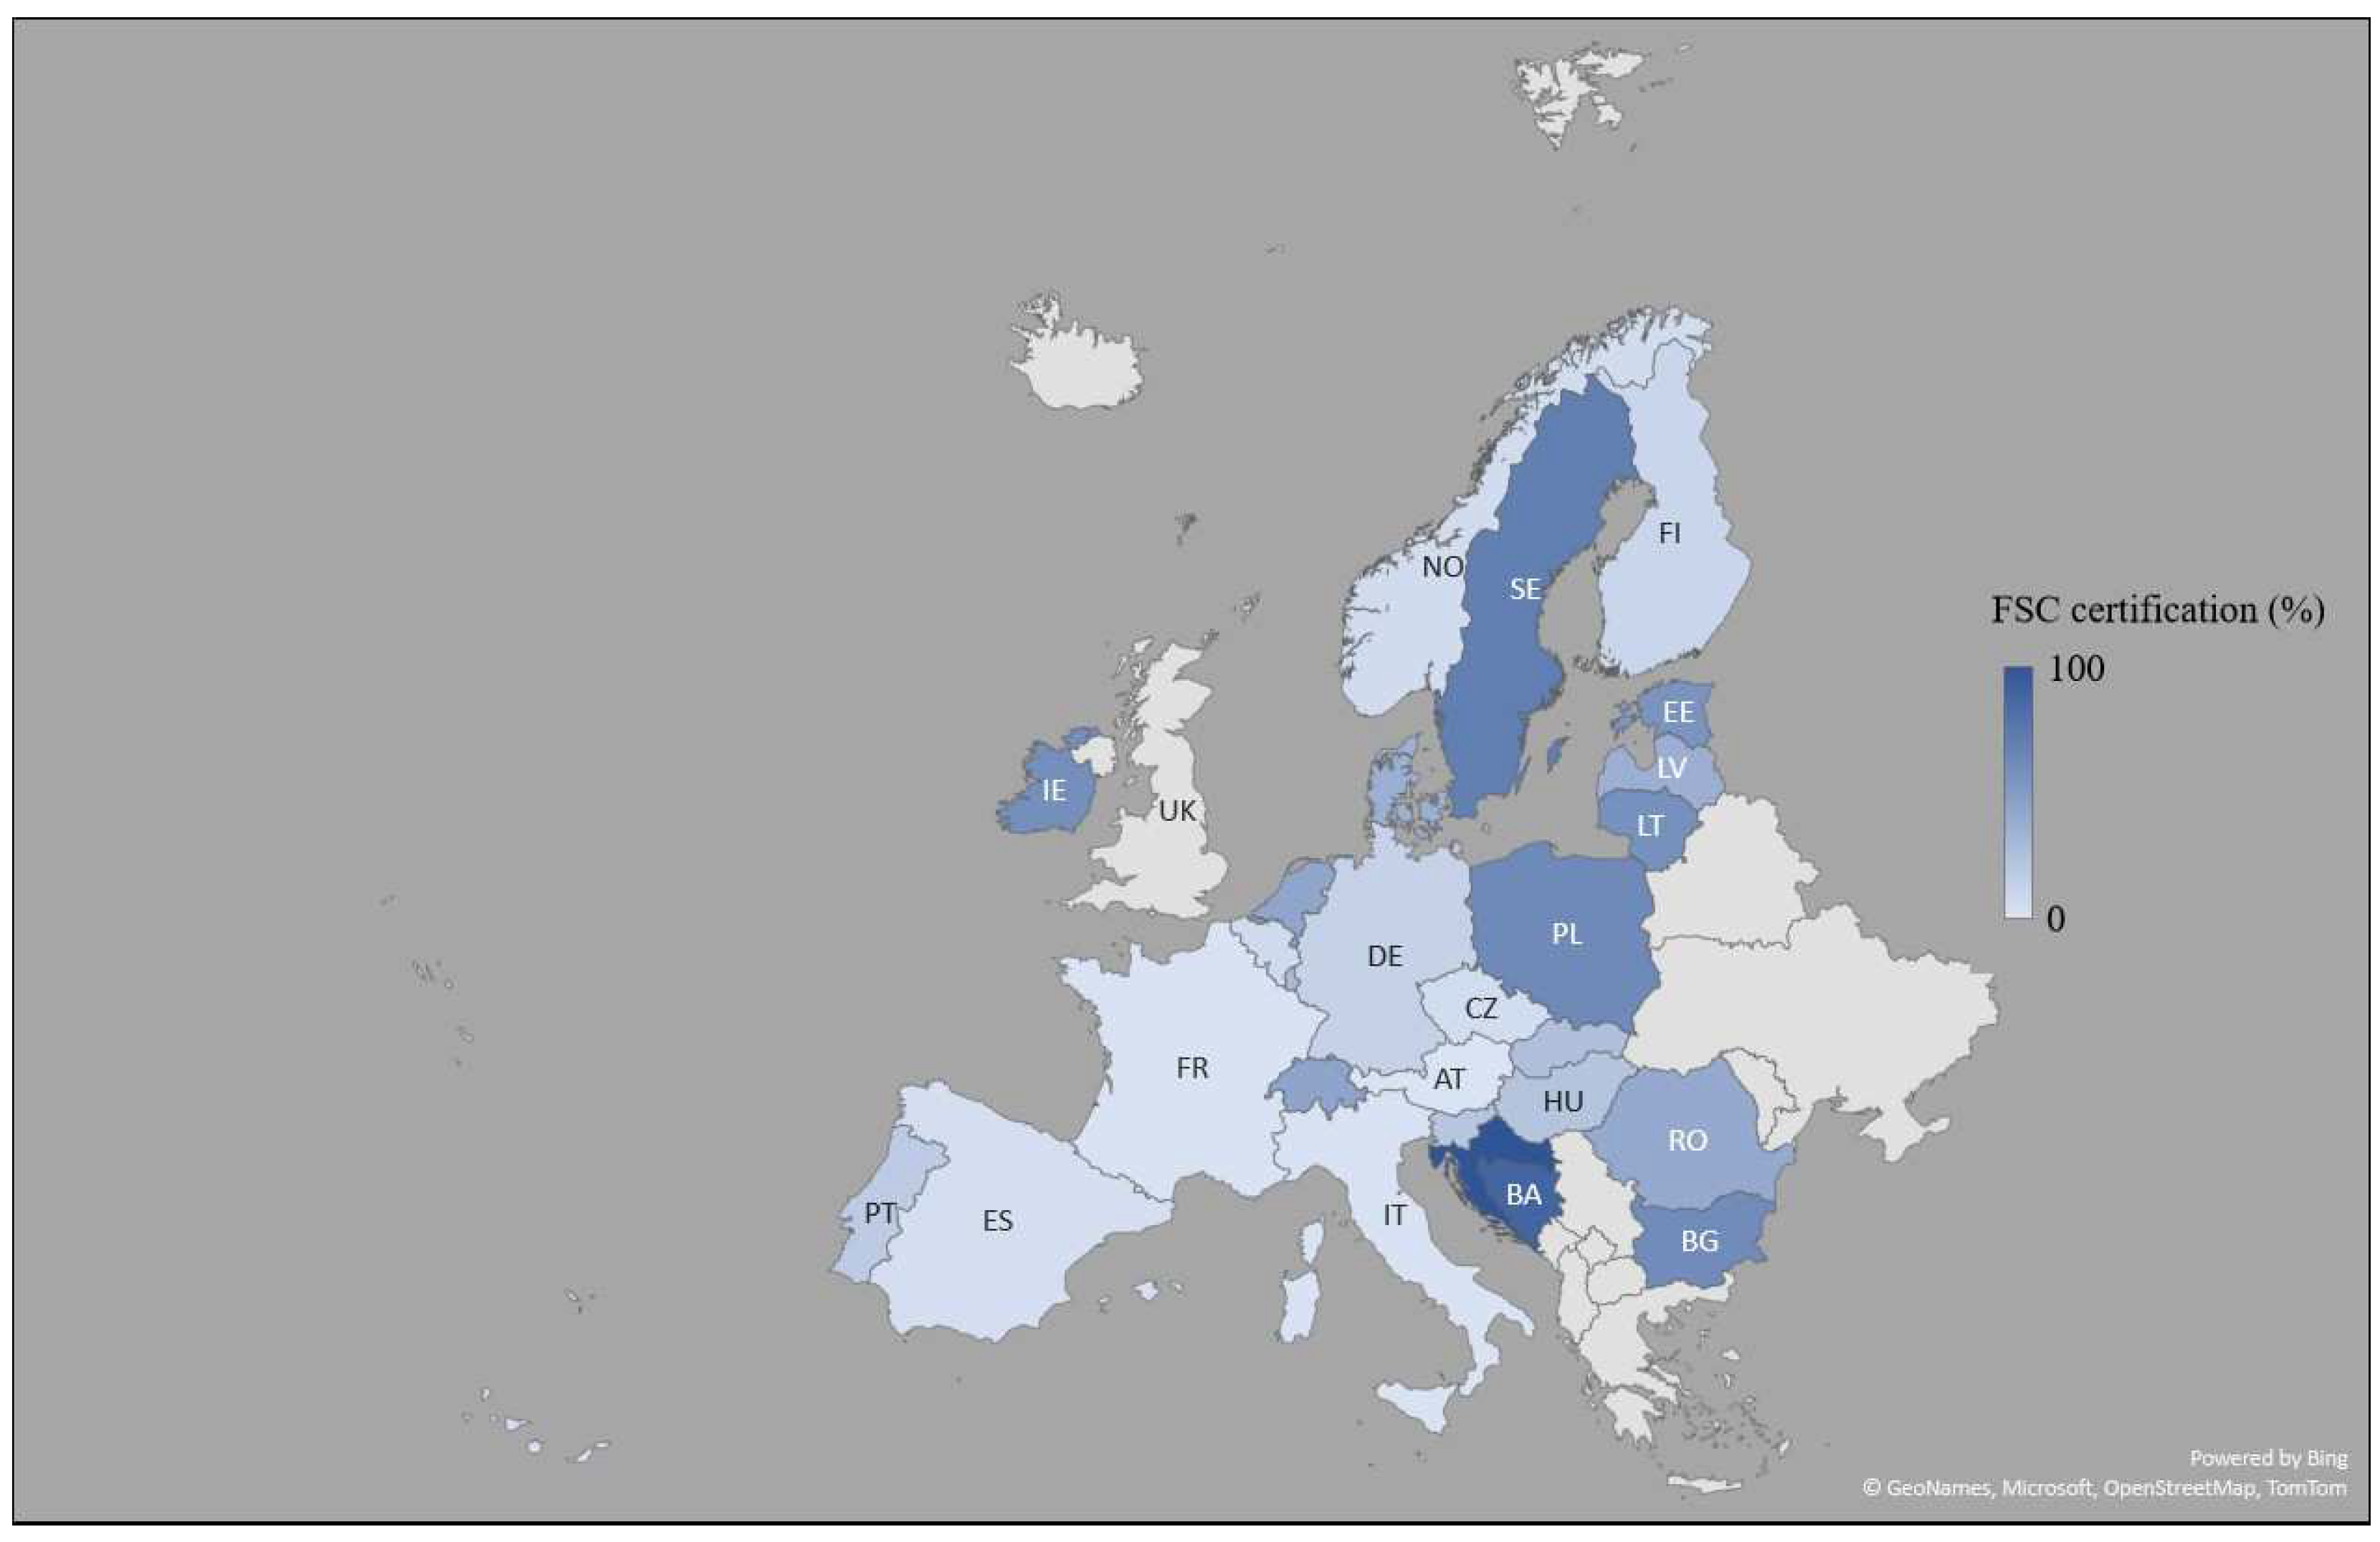
According to data extracted from the FSC database [36], the average amount of forest land in the chosen countries that had been certified by this organization was 36%, with 10 countries accounting for more than 50% of the total forested land. This organization has certified the entire forest area in Croatia, and in Sweden and Bosnia and Herzegovina, the percentage of certified forest land has reached 88% and 70%, respectively. This programme did not certify any forest area in Austria and had a negligible (1% in both) presence in France and Italy (Figure 3).
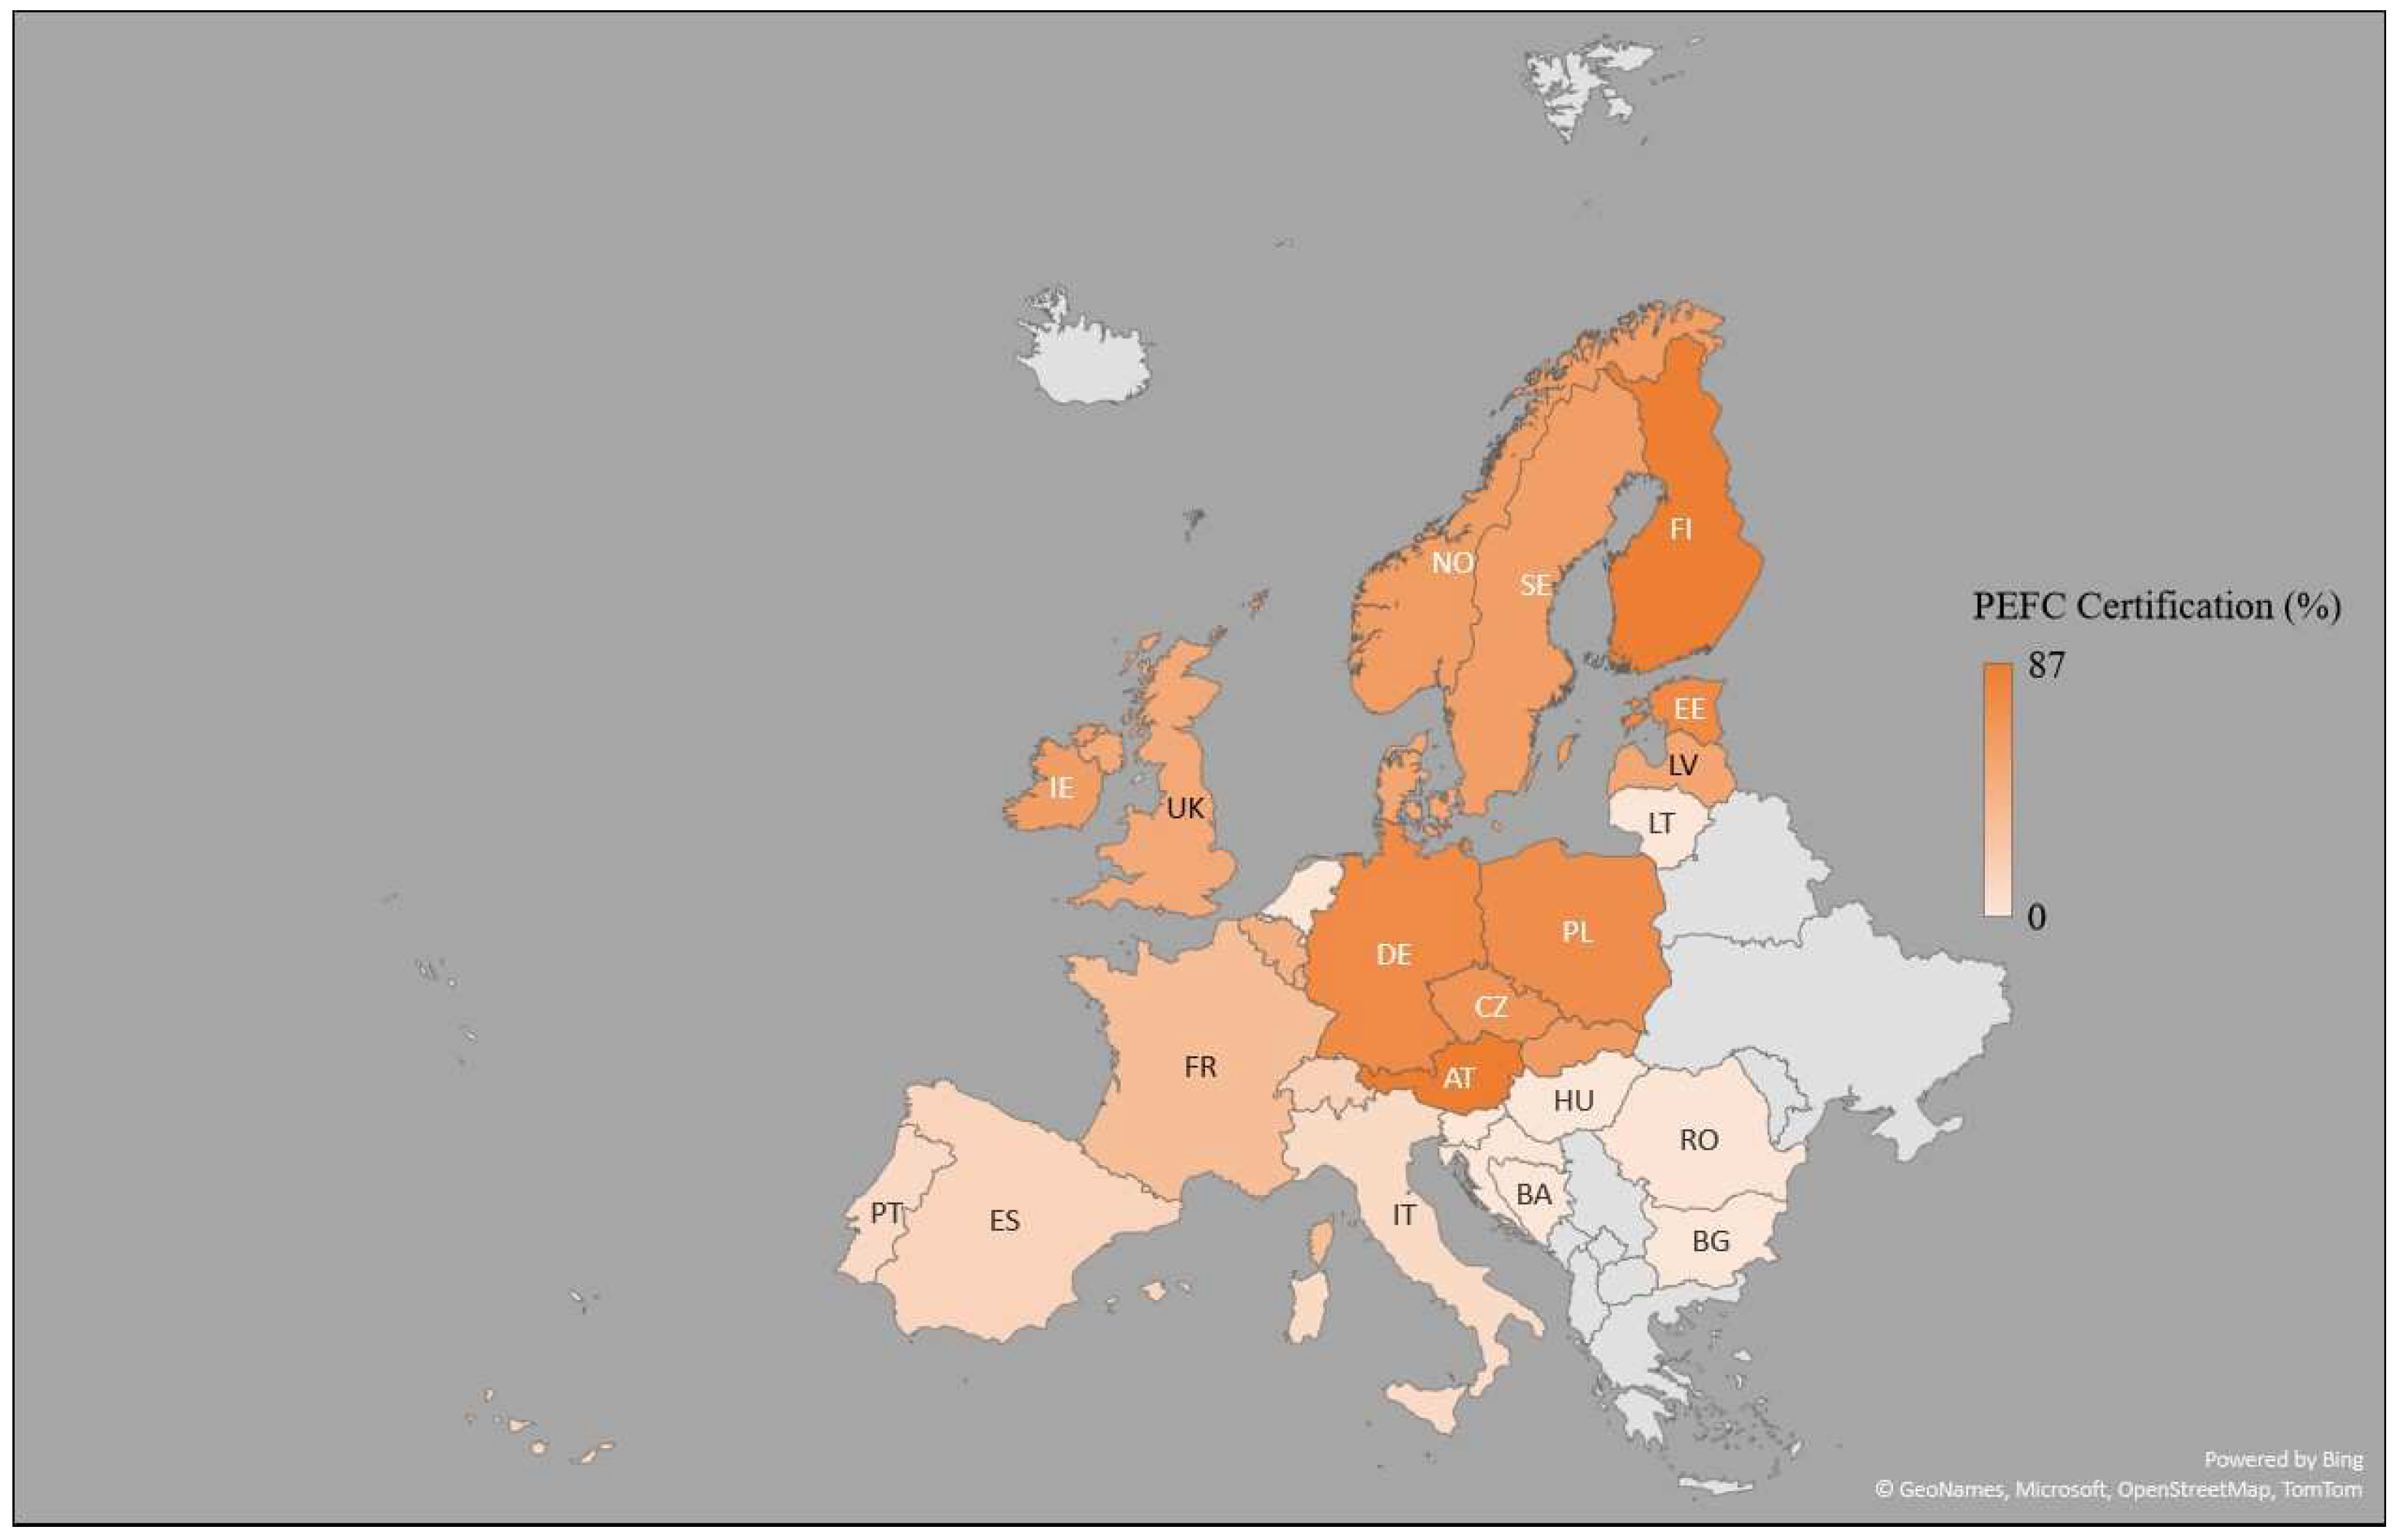
A different profile from FSC was seen when analyzing data from PEFC certification. Of the selected countries, 14 have more than 50% of their total forest cover certified by the PEFC, which on average certified 38% of their forested area. This programme accredited a higher percentage of area in Austria and Finland, 87% and 85%, respectively. In Slovenia and Bosnia and Herzegovina, no forest area was certified by PEFC whereas in Romania and the Netherlands this organization certified 1% of the forest area (Figure 4). Slovenia and Slovakia had almost equal percentages of their total forest area certified by the two programmes: in Slovenia, 52% of the forest was certified by FSC, while 50% was certified by PEFC, and 59% of the entire forest area in Slovakia was certified by both organizations.
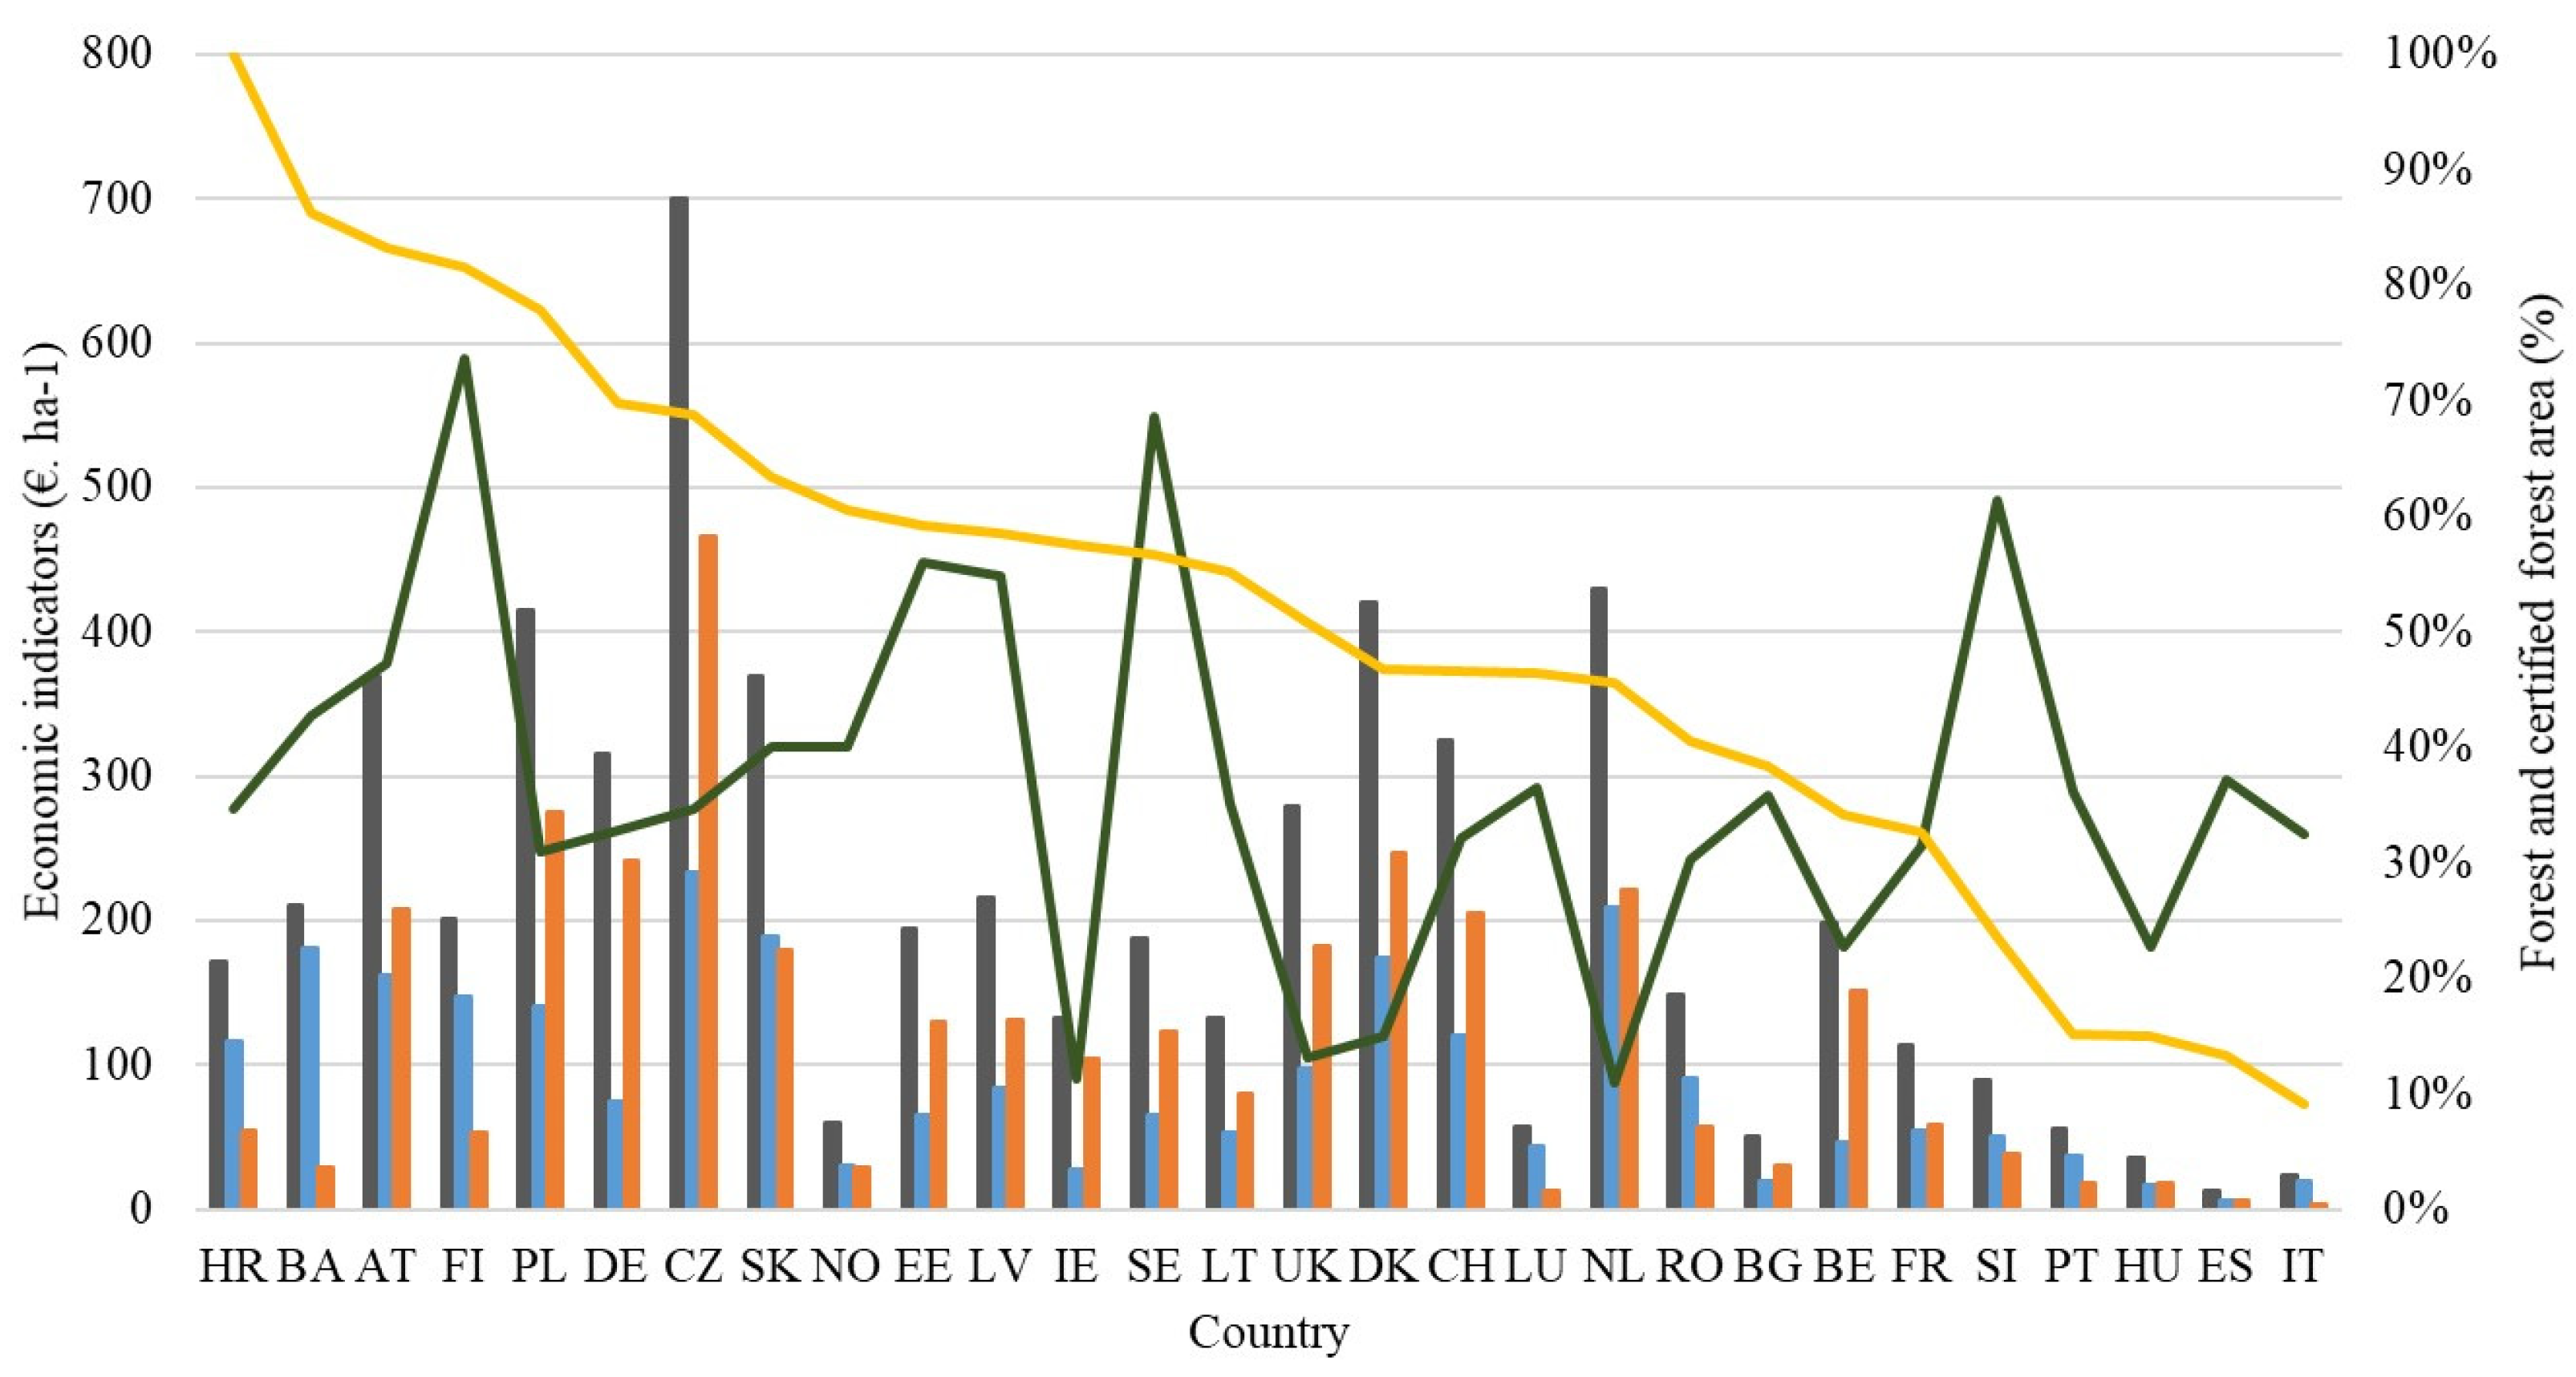
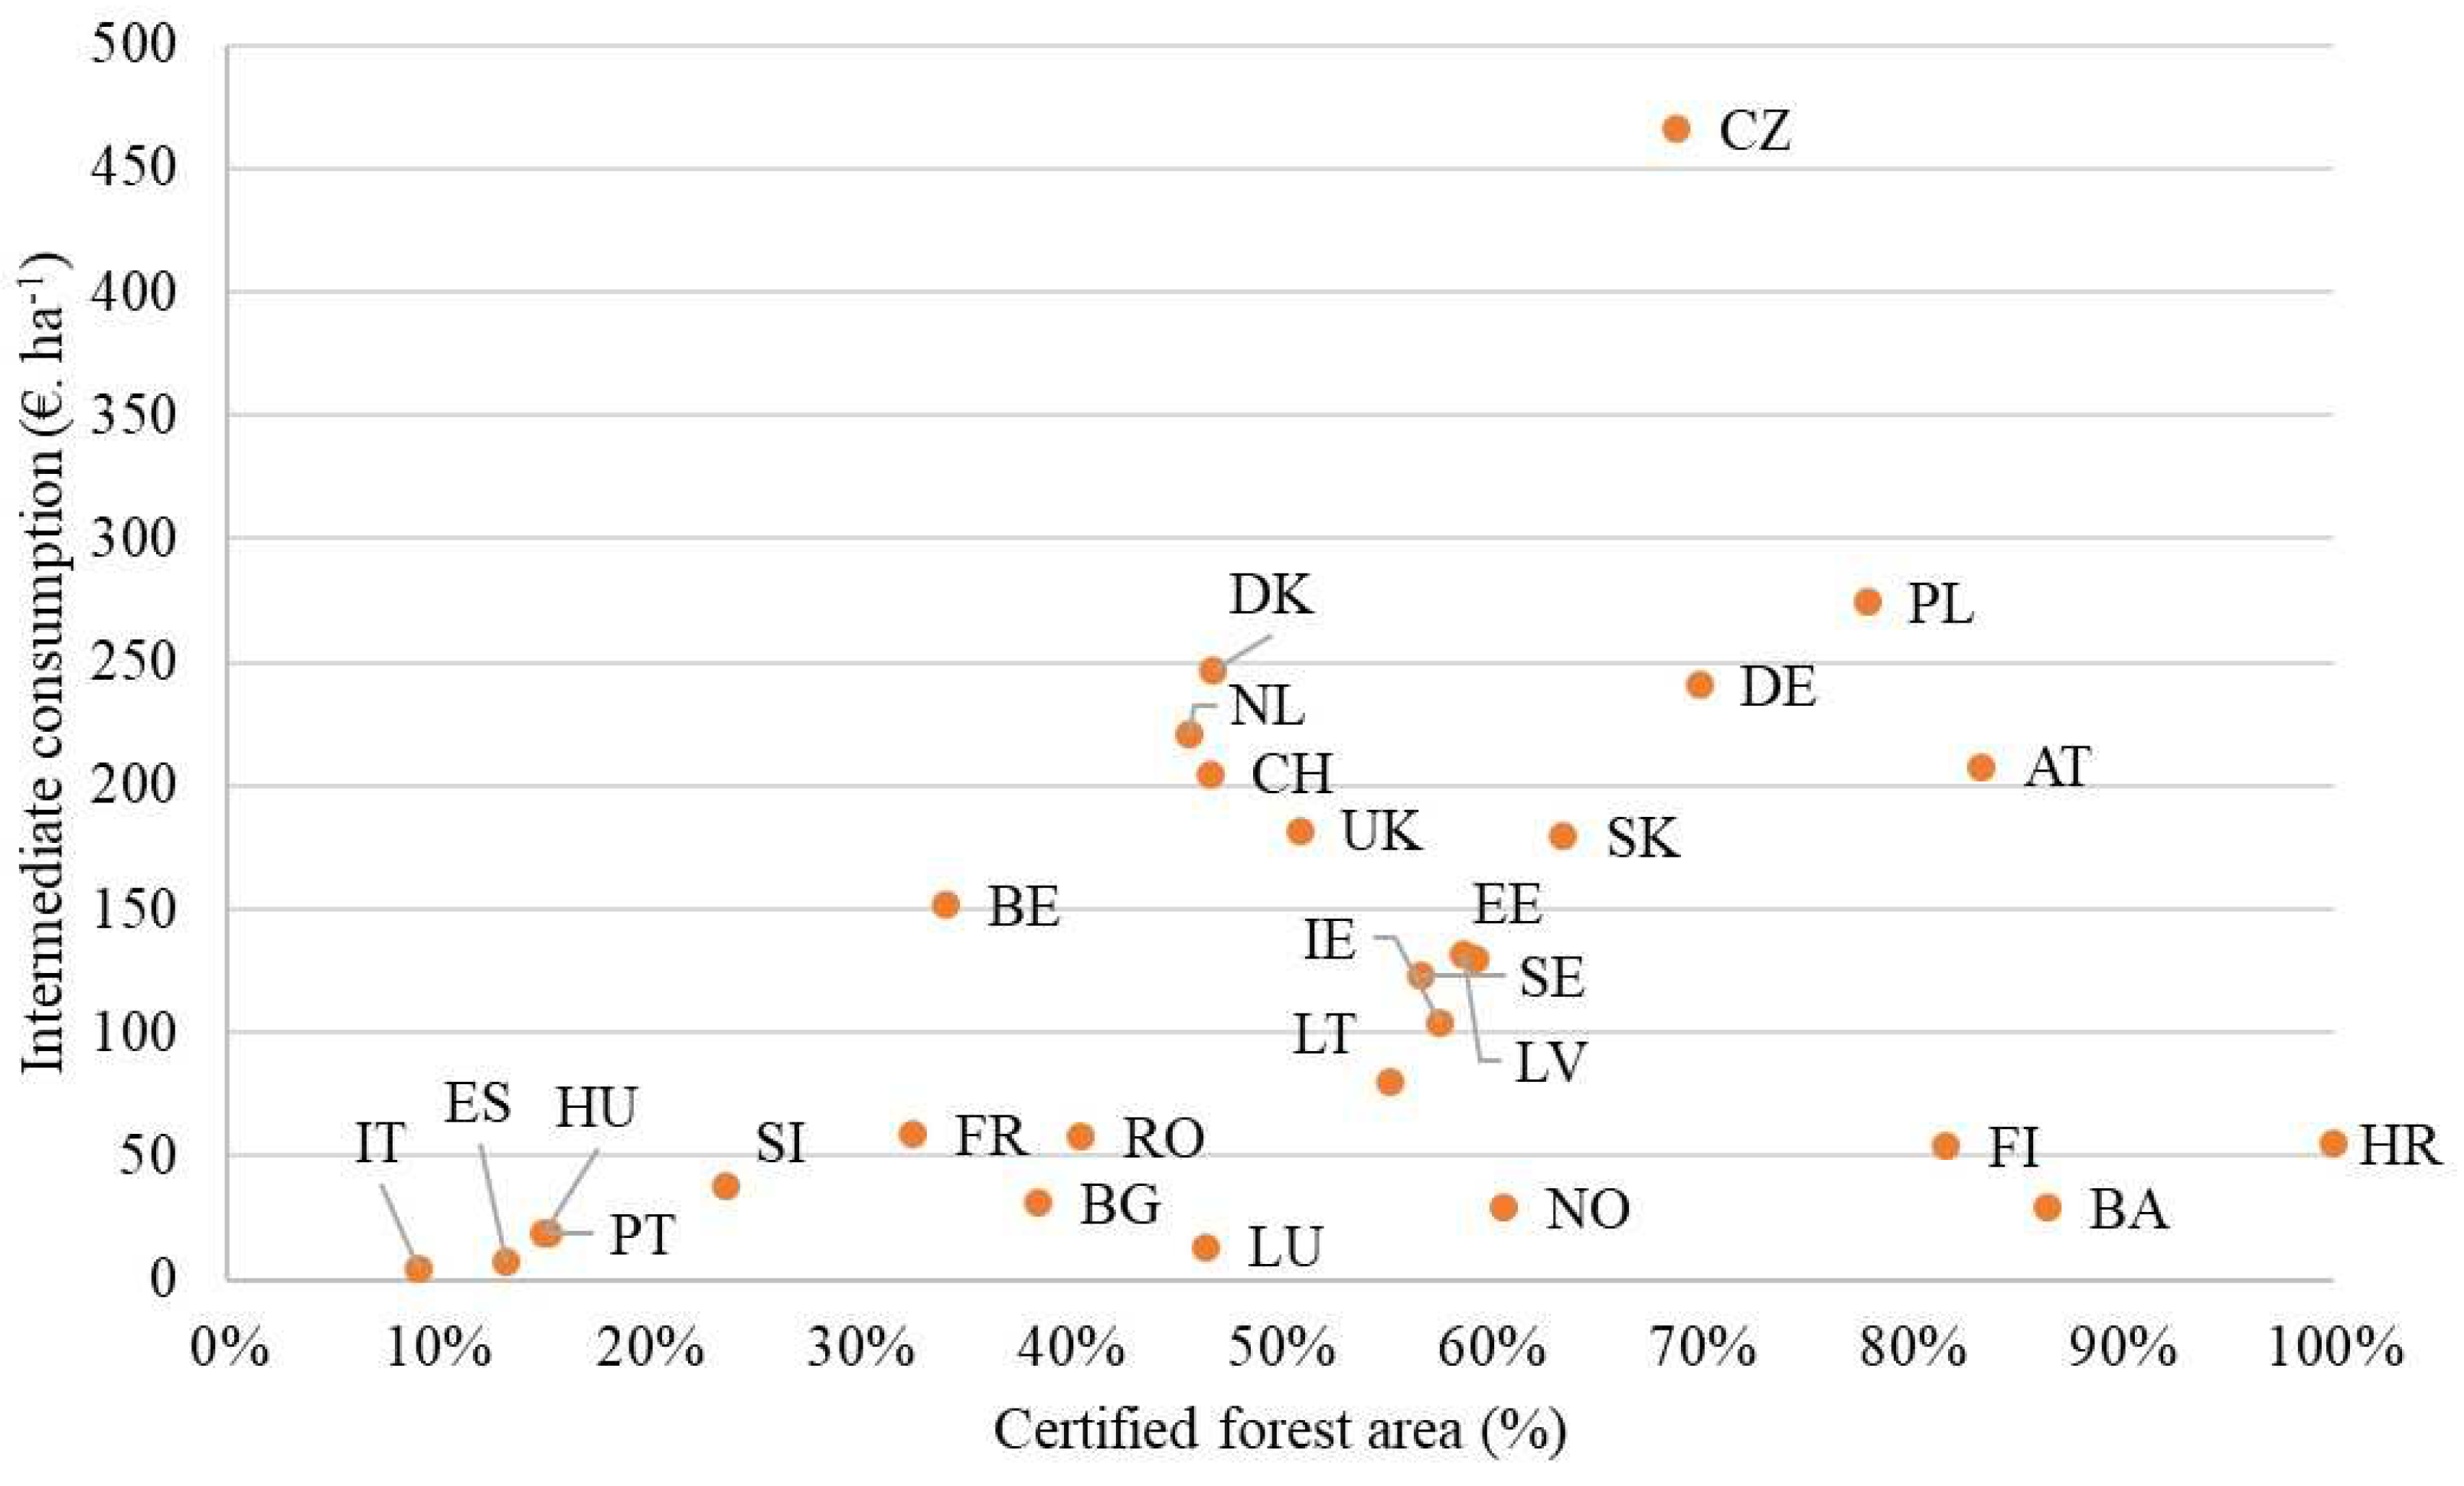
Regarding the expenses, it was feasible to confirm that, on average, the countries selected had an intermediate consumption of 120 (€. ha−1) in 2020 by analyzing the cost by certified forest area. Czechia incurred the most expense, valued at 466 €, with 69% of its forests certified. Italy (4.2 €. ha−1) and Spain (6.8 €. ha−1) spent the least per unit of certified forest area; Italy had 9% of its forest certified while Spain had 13% certified (Figure 5).
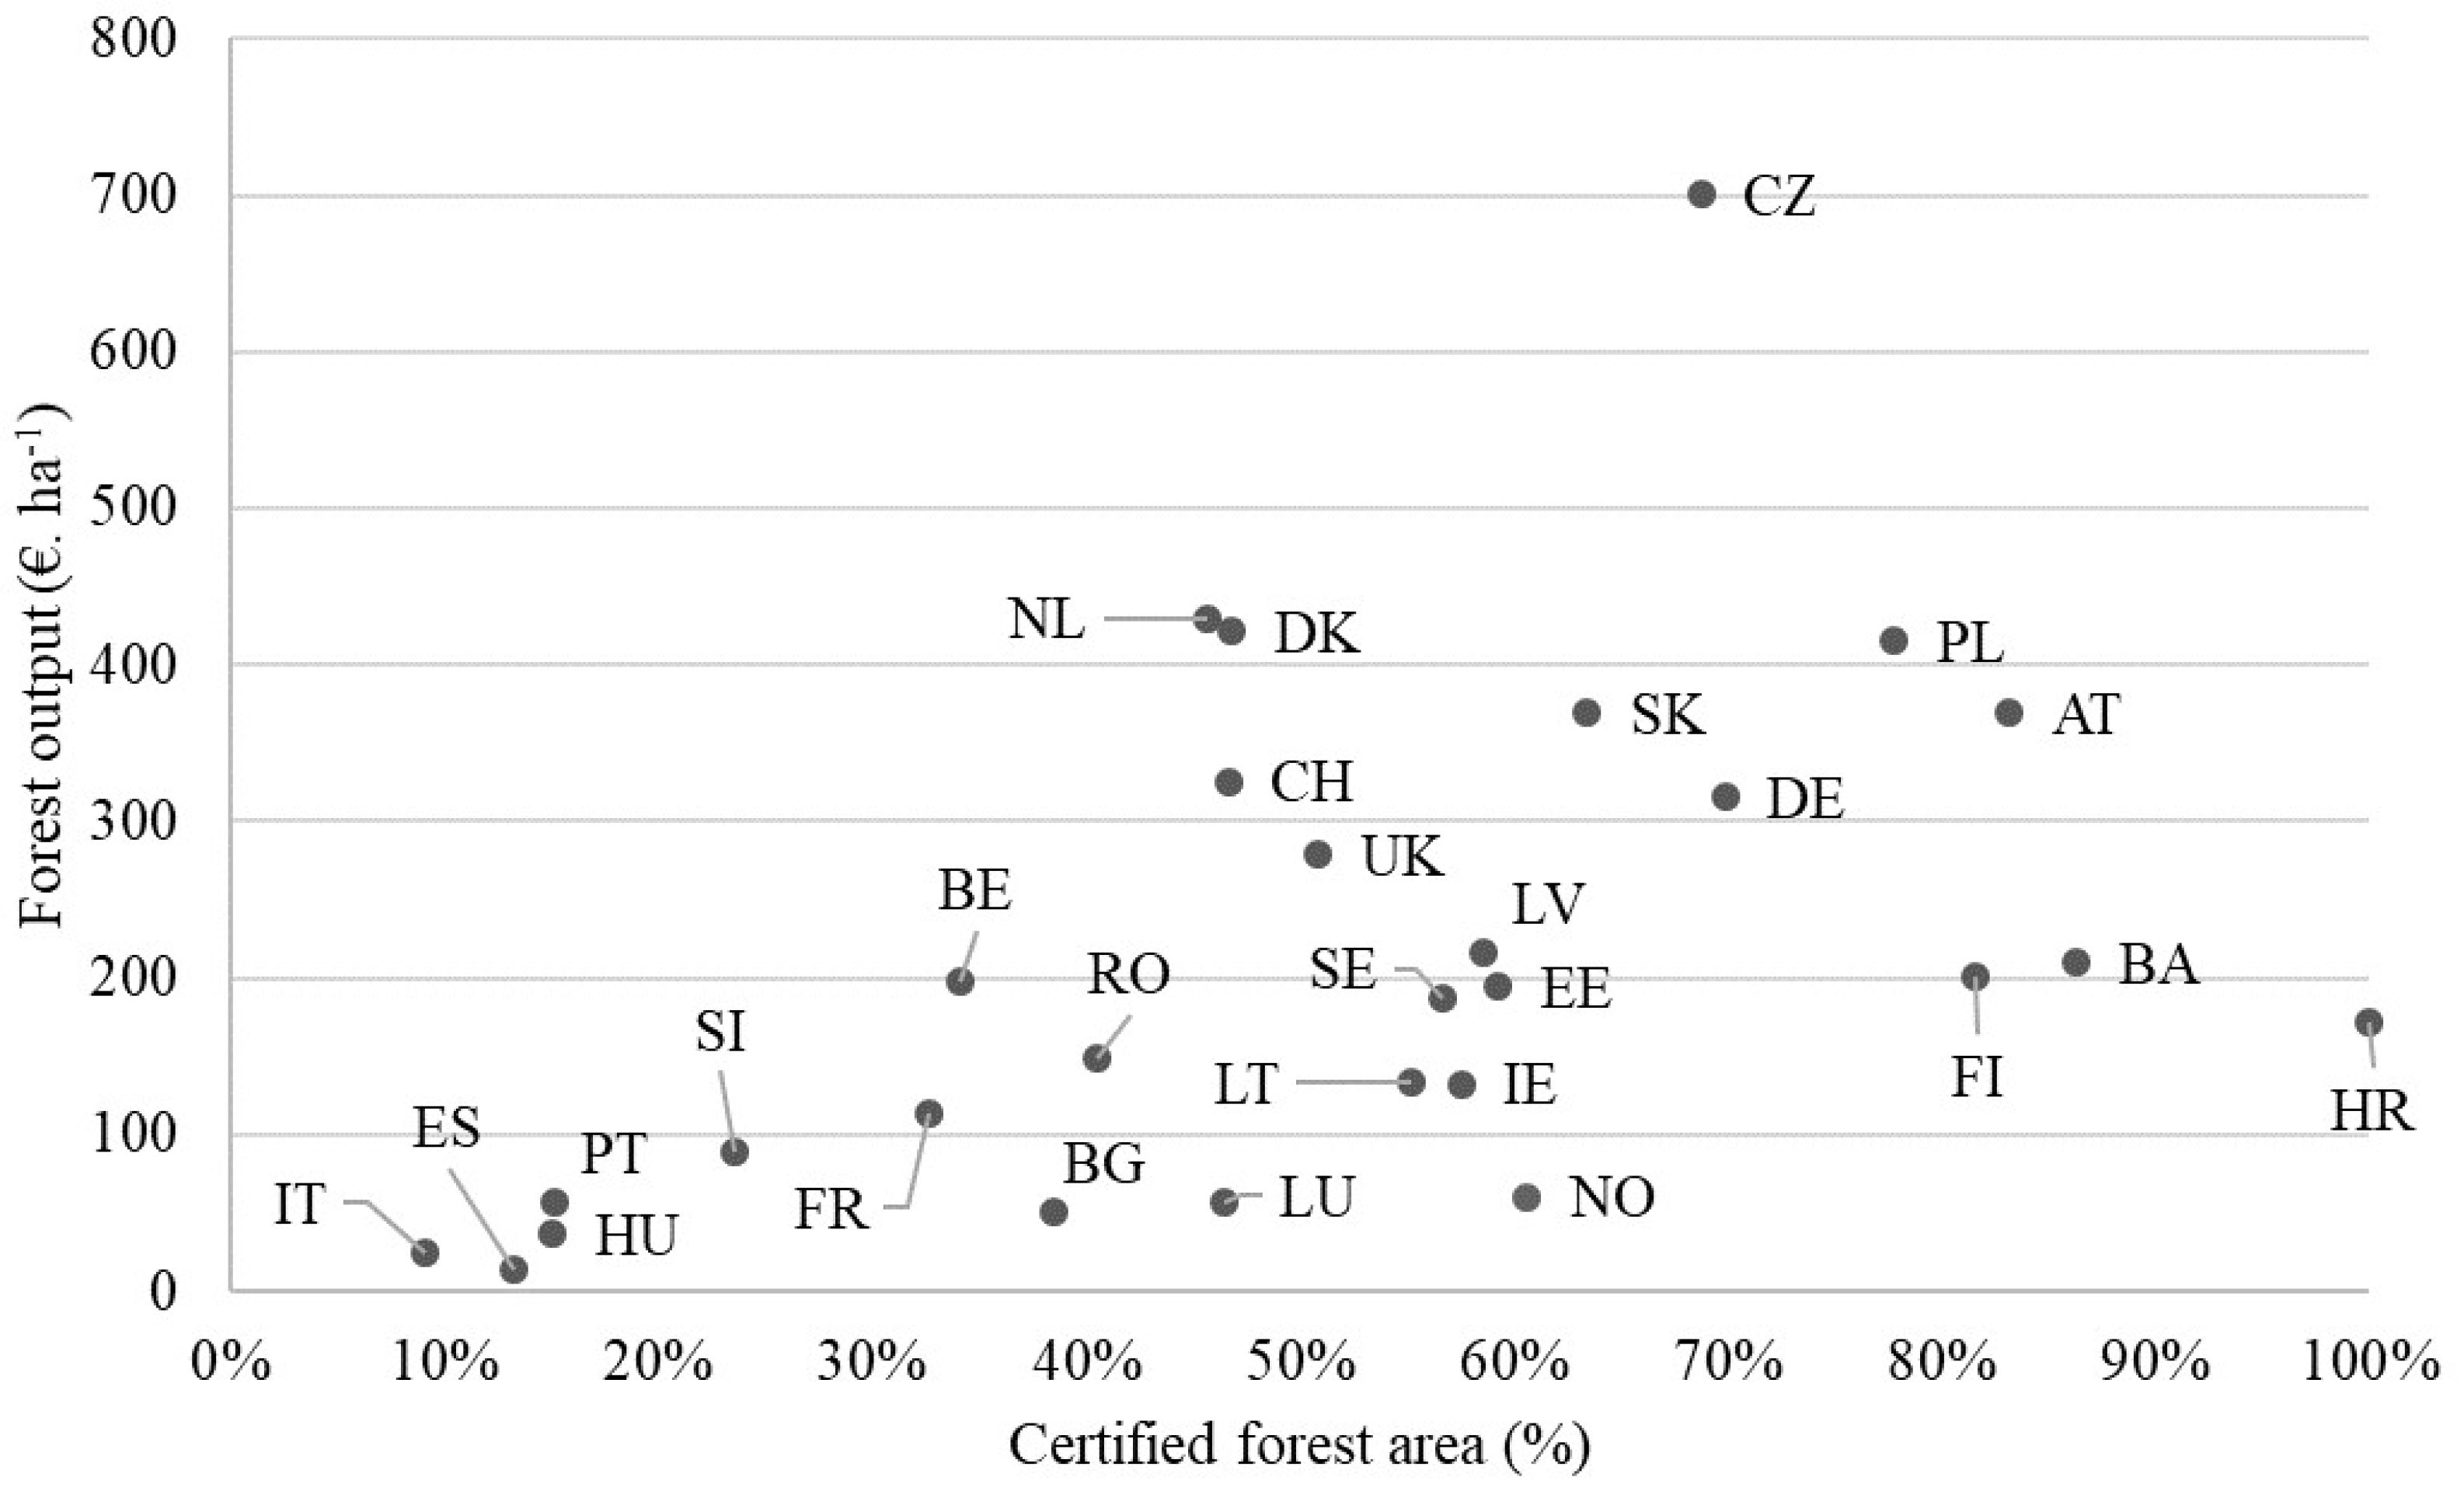
Considering the outcomes, Czechia recorded the highest profits from certified forests, at 701 €. ha−1, according to the examination of the outputs produced by the forest sector and related activities. Italy and Spain reported the lowest revenues, at 24 €. ha−1 and 13 €. ha−1, respectively. The analysis of the 28 nations revealed that, on average, gains were 211 €. ha−1, with 10 of the countries reporting gains that were higher than the average (Figure 5).
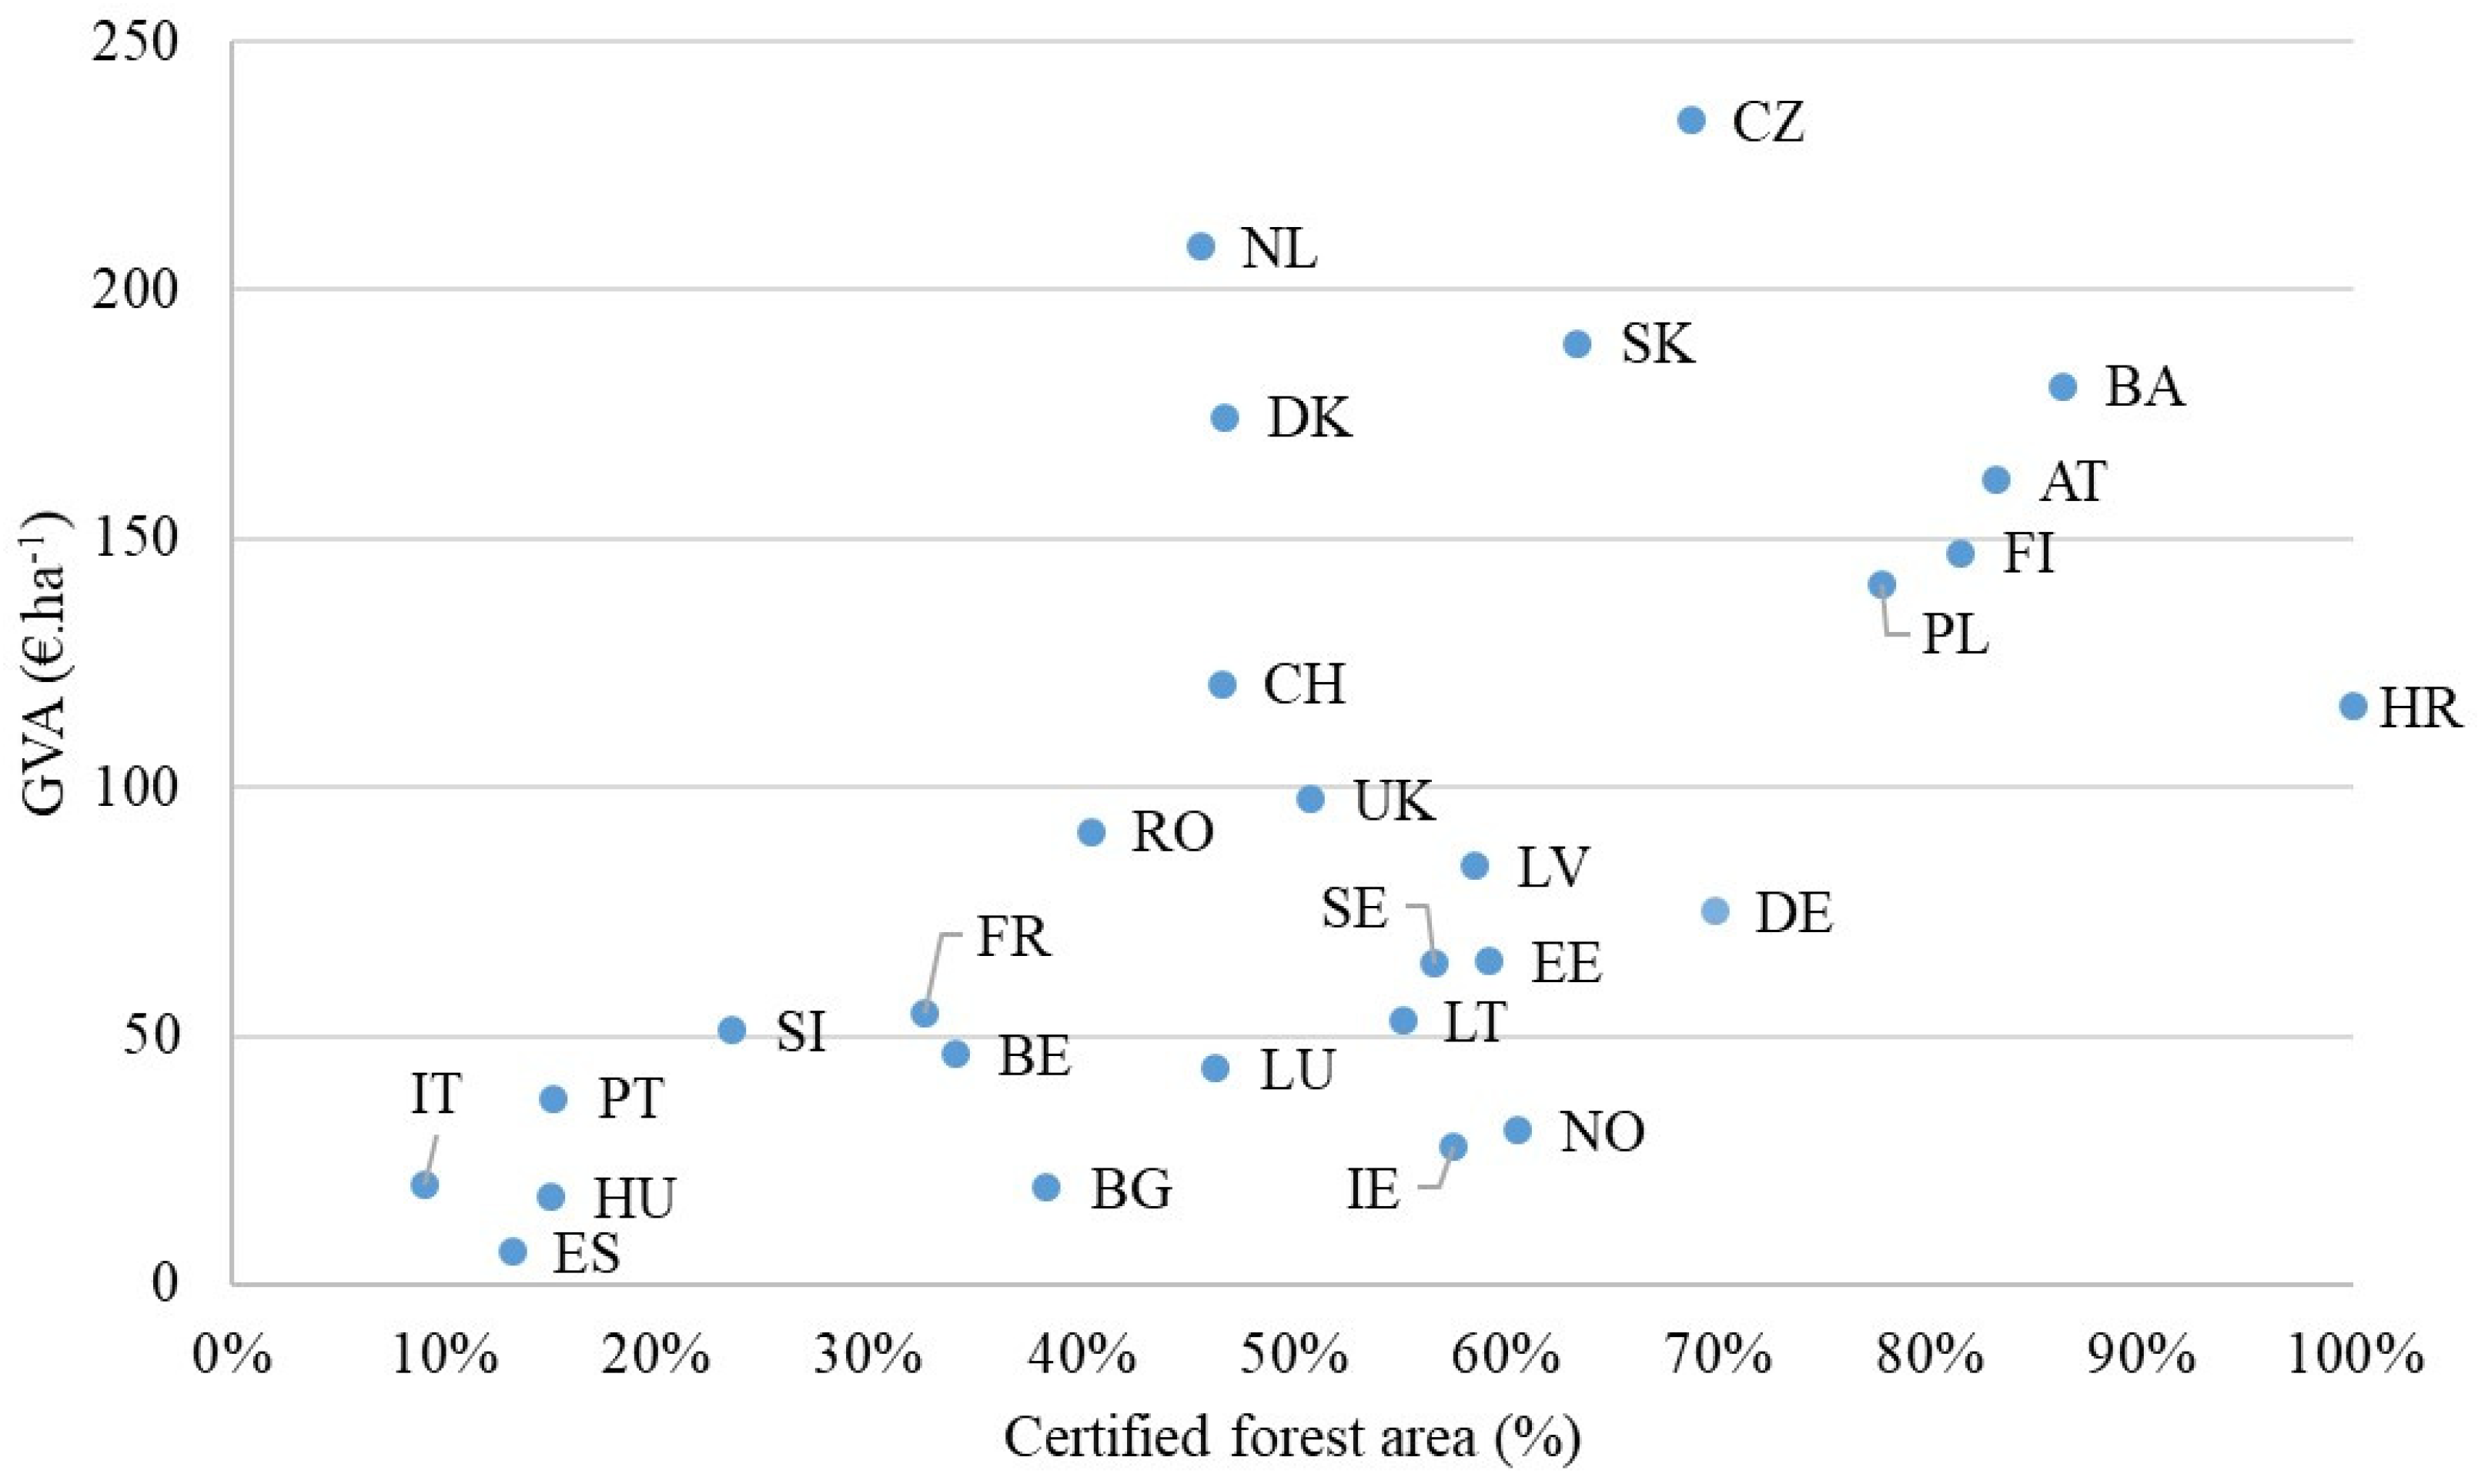
In terms of GVA, the highest value, worth 235 €. ha−1, was likewise recorded in Czechia, while the lowest GVA, valued 7 €. ha−1, was recorded in Spain. Of the 28 countries, 11 had GVA related to the forest sector that was higher than the global average, which was 92 €. ha−1 (Figure 5). In all the countries under study, the expenditure for the year 2020 was lower than the product generated by the secondary activities and the forest sector. When comparing the disparities between the GVA and the expenditure for the same year, only 10 countries had positive results, ranging from 151 €. ha−1 in Bosnia and Herzegovina to 2 €. ha−1 in Norway. For all the other nations the difference was consistently lower than the intermediate consumption, ranging from -0.3 €. ha−1 in Spain to -232 €. ha−1 in Czechia. Overall, there was a -29 €. ha−1 mean variance among these variables (Figure 5).
The relationship between intermediate consumption and the proportion of certified forest land demonstrated, as expected, an increased tendency for certified forest area to correlate with higher costs. When the certified area reached between 50 and 60%, the cost per ha tended to stabilize, and it then started to decline when 70% or more of the forest had certification. The Czechia, which had a 69% forest certification area and an intermediate consumption of 466 €. ha−1, represented the biggest deviation from this trend (Figure 6).
The analysis of the relation between the forest outputs and related secondary activities revealed an increase in revenues proportional to the percentage of certified forest within each country, particular evident in countries with low certification values and low incomes. The relation was not so clear when the percentage of certified area increased but was possible to observe a tendency for the revenues to plateau after at least 70% of the forest had received certification. Once more, Czechia was out the general trend reporting the highest output, 701 €. ha−1. In contrast, Croatia, which had all of its forested land certified, recorded relatively low income, comparable to that of nations with 30 to 40% of forest certified (Figure 7).
The percentage of certified forest land and GVA showed a positive relation, with this indicator rising exponentially as the percentage of forest area increased. The tendency is clearer until reaching 50% of forest with certification. Countries with higher values of certified forest, presented more distinct patterns (Figure 8).
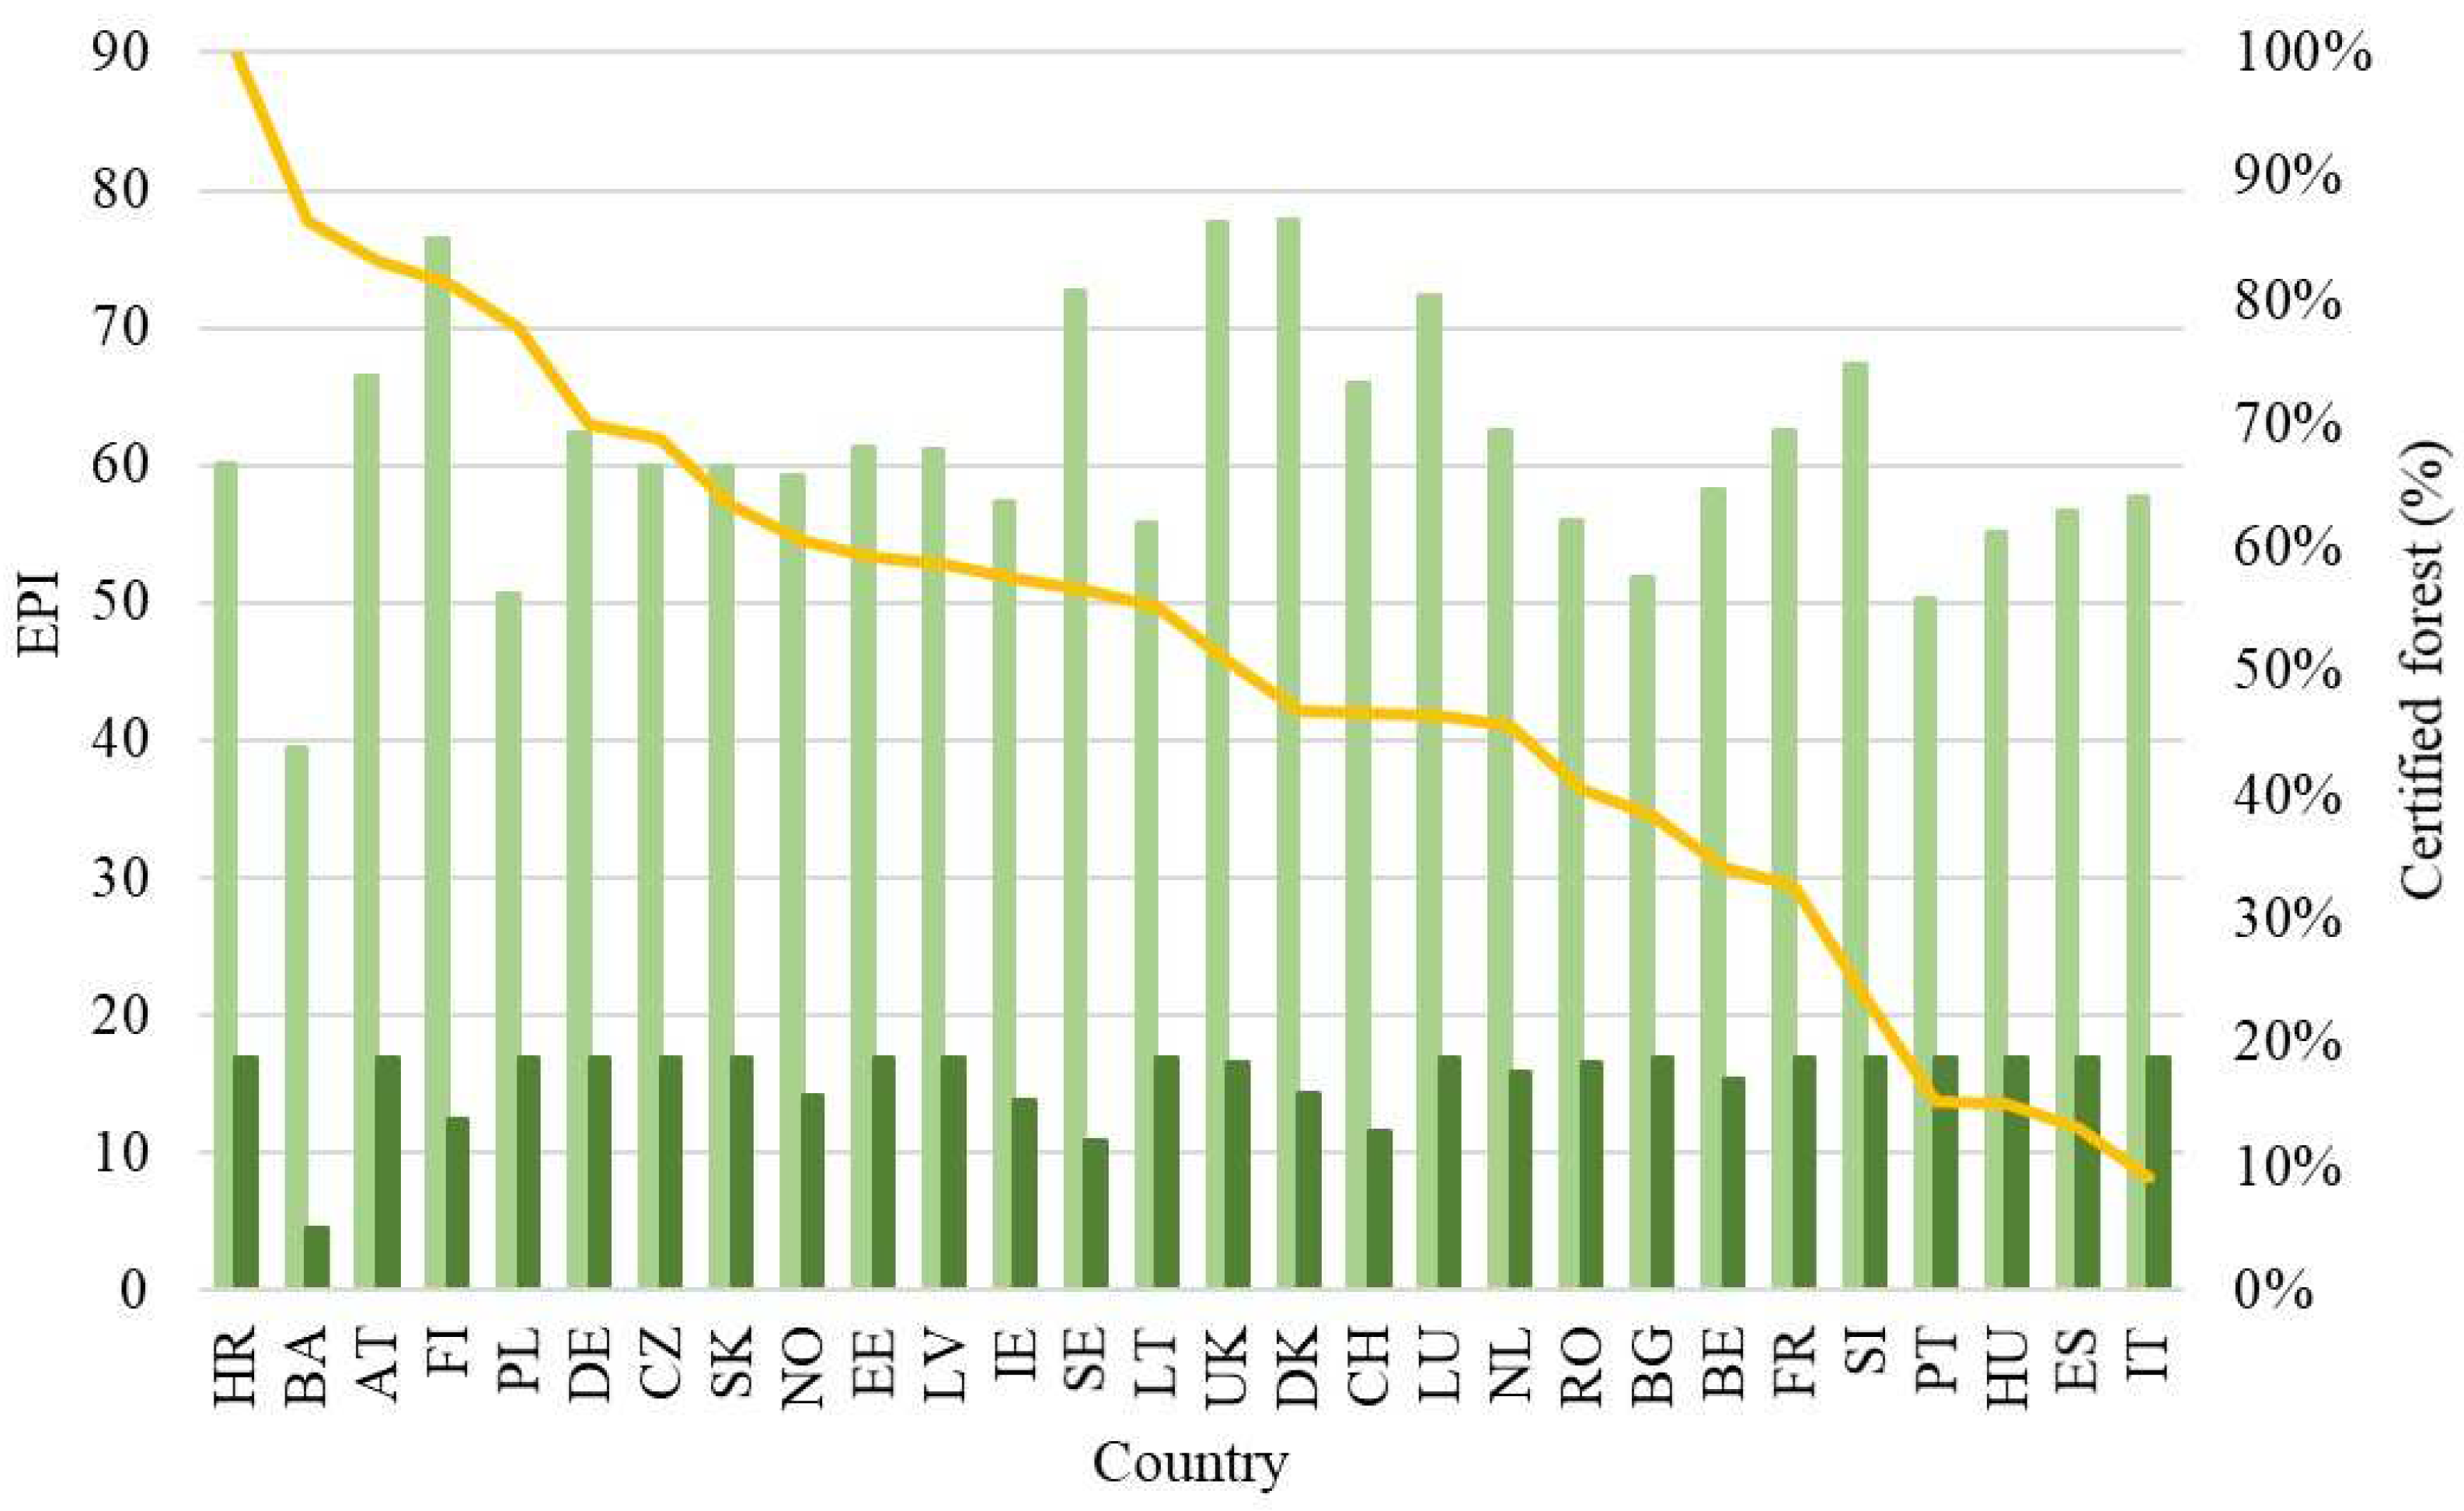
Relating to the EPI, the 28 countries had in average a score of 61, with Denmark and United Kingdom presenting the highest values, 77.9 and 77.7 respectively. All countries had values of EPI higher than 50, regardless the percentage of certified forest area, except for Bosnia and Herzegovina with a value of 39.4 and 86% of certified forest (Figure 9). The indicator for terrestrial biome protection, global, in biodiversity and habitat (EPI - TBG) had a mean value of 16 related to all the 28 countries investigated. Within those countries, 19 had the equal and maximum value observed of 17. The minimum value was reported to Bosnia and Herzegovina with the value 4.5 (Figure 9).
The target of the proportion of forest area within legally established protected areas, as well as, the indicator of proportion of forest area under a long-term management plan (Figure 12) reflect the progression of the countries towards sustainable forest management [38]. The average for all countries in terms of the forest area within legally established protected areas was 20%, with 13 nations above average. The highest percentage was reported by the Netherlands with 60%, and the lowest percentage was stated by Croatia with 3%. It is worthy to note that the trend among the countries with less than 50% certified forest is of the protected areas to follow the evolution of certified forest area, with the exception of Italy and Spain, where the percentage of protected forest highly exceed the percentage of forest with certification. Above 50% of forest certified no trend was observed and, in some cases, the value of protected areas was very low when taking the percentage of certified forest into account (Figure 10). The target of the proportion of forest area under a long-term management plan had an average value across all nations of 67%, with 8 nations—Croatia, Finland, Czechia, Slovakia, Latvia, Lithuania, Slovenia, and Hungary—getting as high as 100% by the year 2020. In 2016, the final year for which Portugal provided the value for this indicator, Portugal reported the lower number, 27%, as its reference value. All of the countries, with the exception of Austria, Germany, and Norway, reported percentages of forested areas under long-term management plans that were equal to or higher than their respective percentage of certified area. Austria had the higher gap between this indication (50%) and the certified forest area (83%). Regarding this target, no data was available for Italy, Luxembourg and, Bosnia and Herzegovina (Figure 10).

3.2. Forest certification in Europe—Scientific research

Results from scientific search demonstrated that, although more than 2565 publications related to forest certification were found in the Scopus database, 594 (22%) had European authors and co-authors. The United States of America was the most represented country with more than 600 publications available on Scopus database. From those publications, 76% of the documents were found to have at least one of the words chosen for this study as well as the issue of forest certification in their title, abstract, or keywords; the equivalent percentage of publications worldwide was 78%.
From the selected terms, economy, related family words, and market were the words that were found in a higher percentage of publications from Europe and related to forest certification within the Scopus database (86% and 62%, respectively). In relation to other searched words, the proportion of scientific articles where they were detected decreased to between 32% (performance) and 2% (valorization) (Table 2).
The analysis of all publications regarding the quantity of search words revealed that 29% of the documents retrieved contained two combinations of the chosen terms, 26% contained one, and 24% contained three. The number of publications with four and five keywords were 12% and 7%, respectively, while six and seven of the chosen words was the minimum noted, 1% for the two word counts.
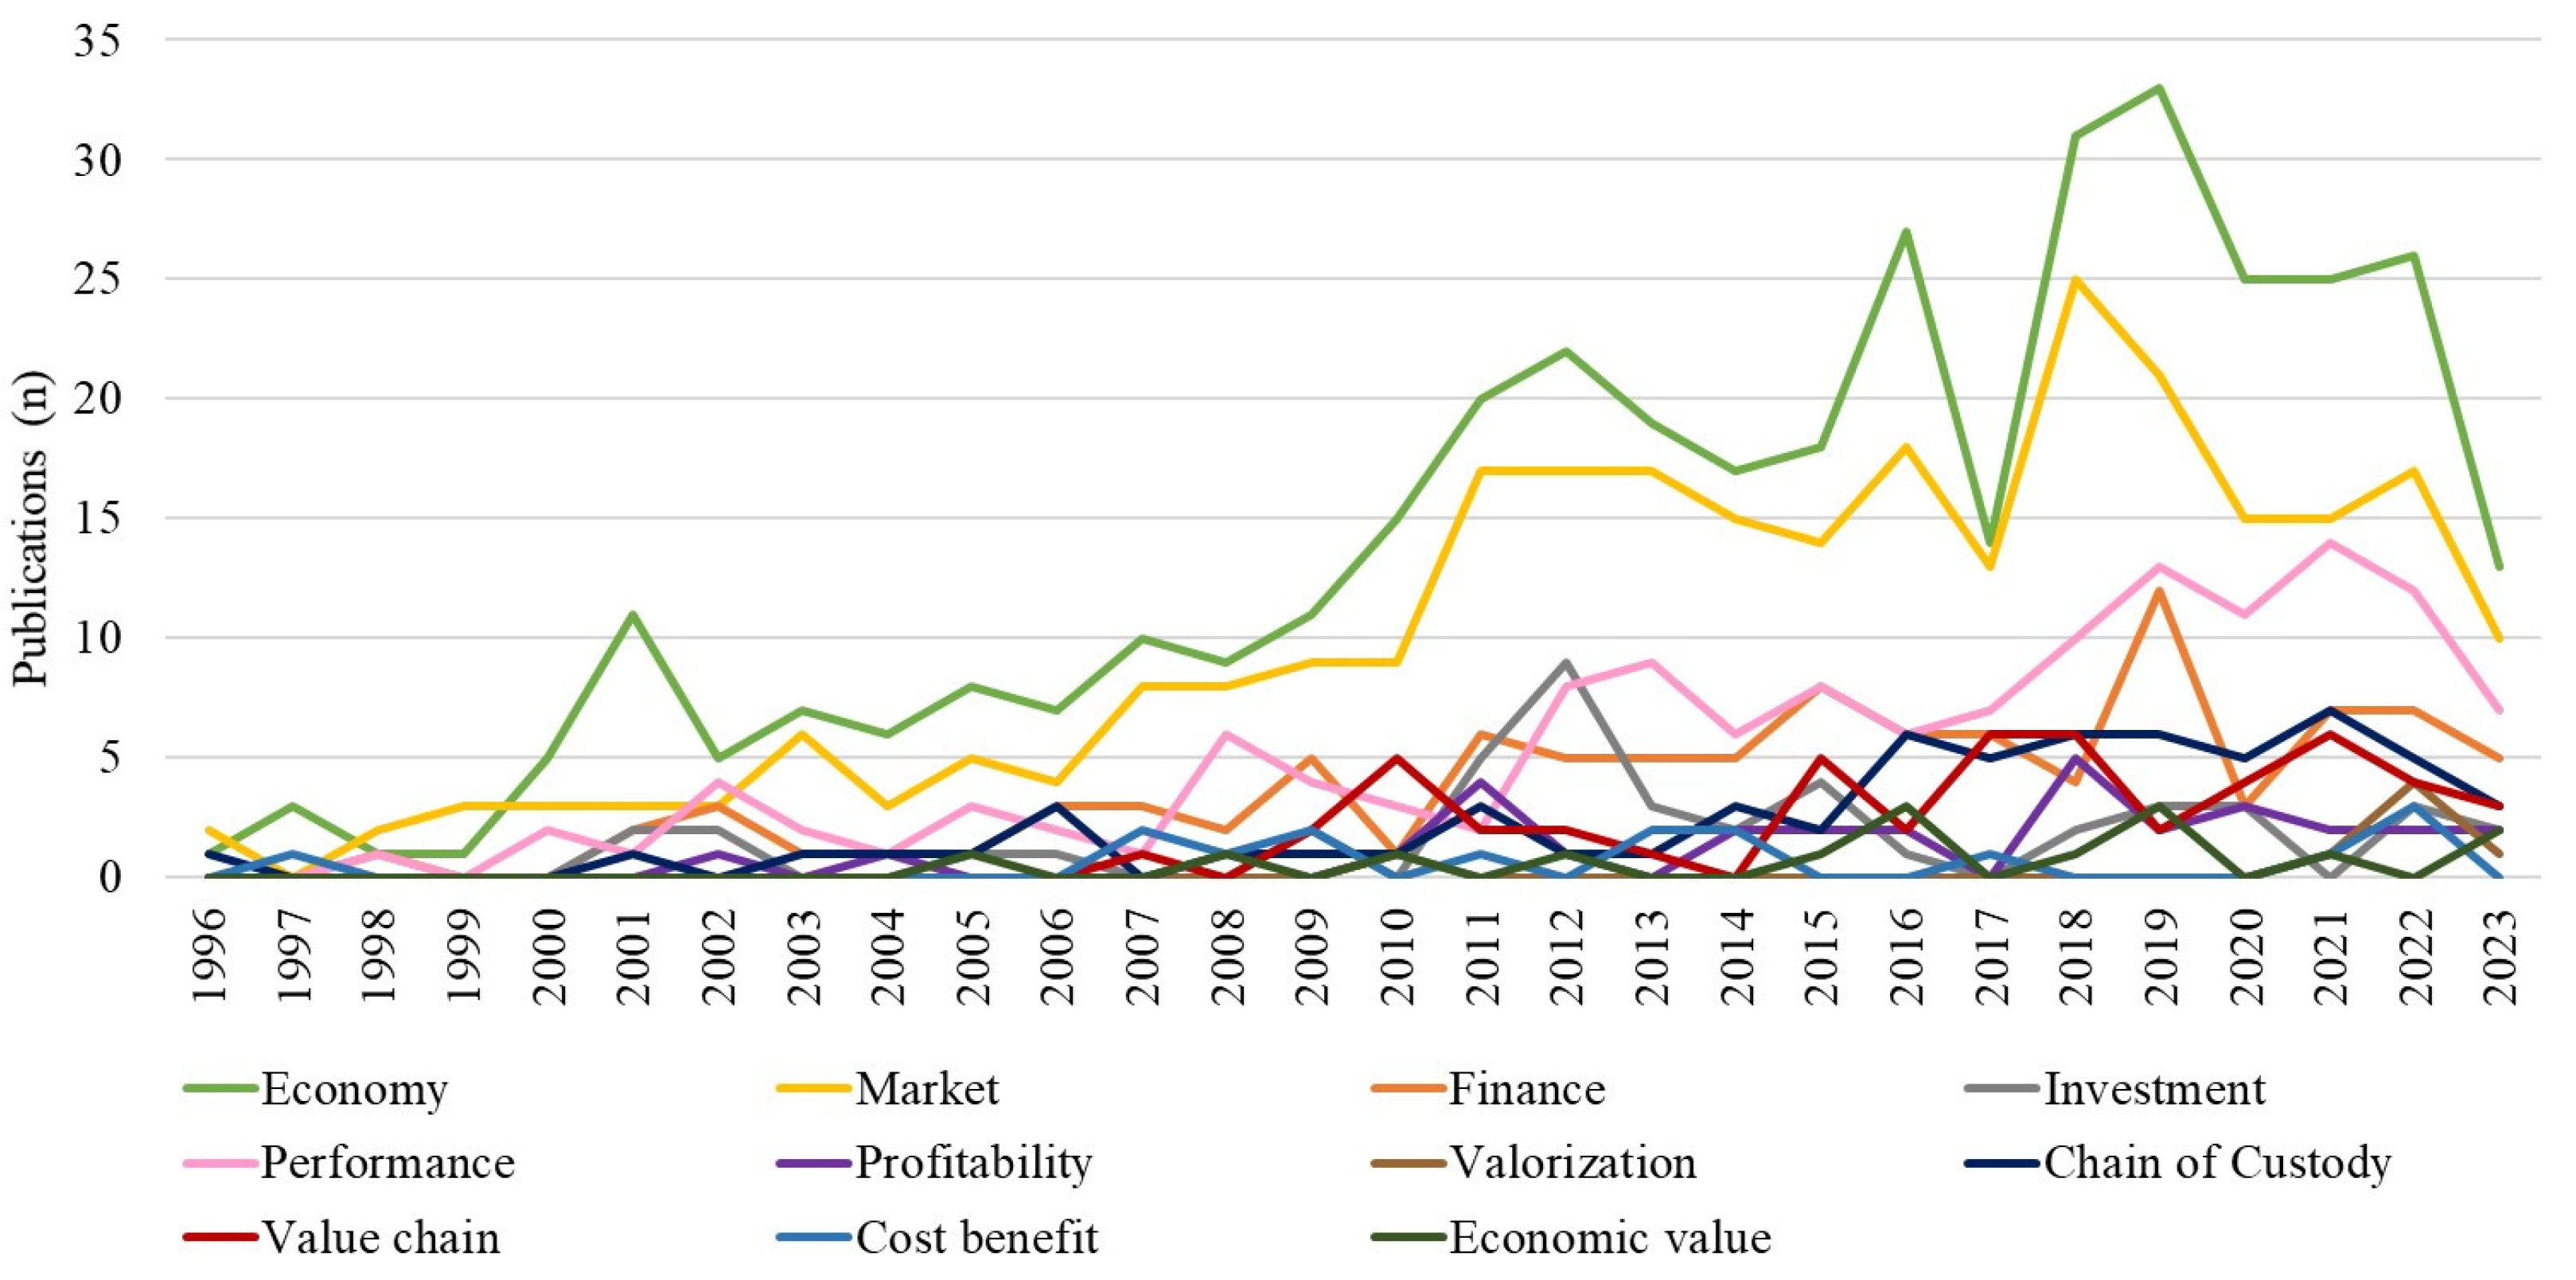
By analyzing the timeline of the obtained scientific data, we could determine that publications relating forest certification and keywords related to economy were first published in 1996. Starting in 1996 and 1997, it was possible to observe an increasing tendency of including the words economy, market and finance in certified forest related studies and analysis. Terms and concepts such as investment and value chain were only later included, around 2000 and 2006 respectively. In line with the findings shown in the previous graphs, the words economy and market were the most mentioned throughout time (Figure 11).
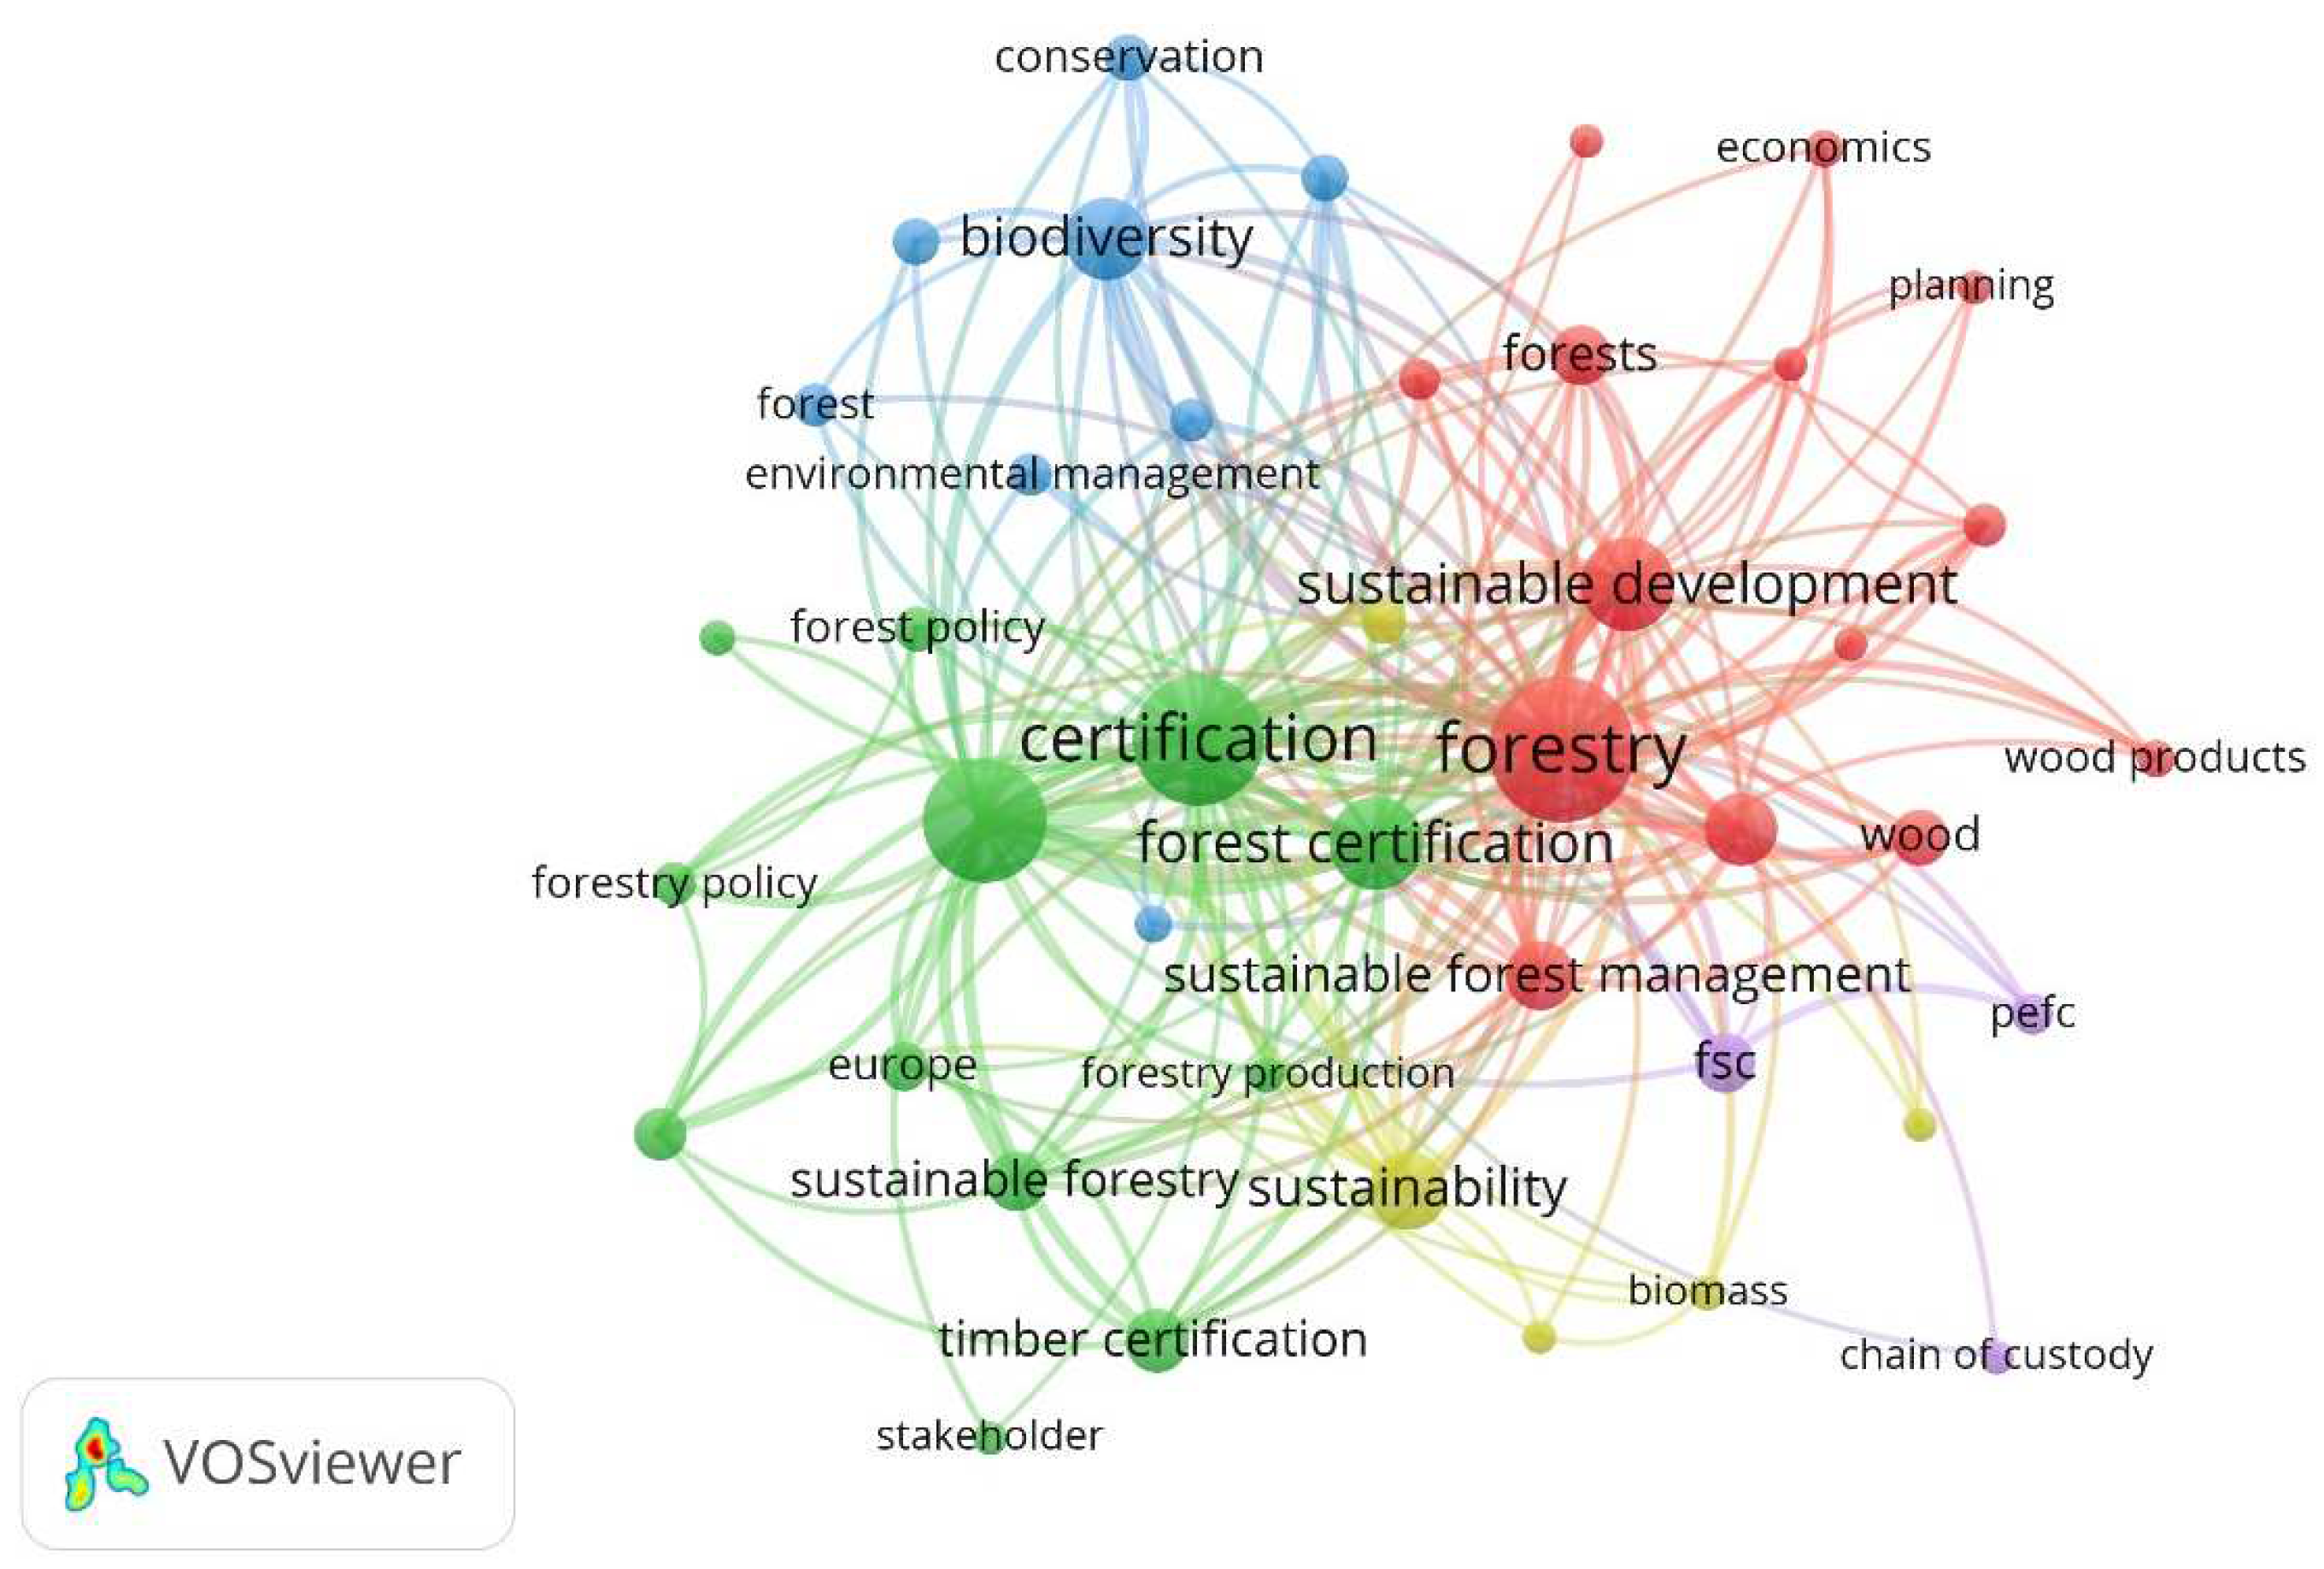
The author keywords and the keywords indexed to each of the publications were analyzed in terms of relevance and interaction between them. It was possible to observe 3 major clusters: one cluster more centered in the keyword certification (green), another around the keyword biodiversity (blue), and another focused on the keyword forestry (red). The keyword economics was observed in the red cluster. The most frequent keywords were forestry, certification, and forest management, mentioned 174, 145 and 132 times, respectively. The keywords more frequently found among those related to the search terms of this study were economics (18), economics and social effects (16) and chain of custody (15) (Figure 12).
Four major clusters centered on the following nations were found in terms of where the corresponding author or co-authors were from: United Kingdom (green), Sweden and Finland (blue), Italy (purple), and Germany (red). The most represented countries in terms of the selected publications were the United Kingdom, with co-authorship on 64 documents, and Italy and Sweden, both represented in 59. Finland had participated in 56 publications, and Germany in 50. The countries with the fewest publications on this topic were Cyprus and Lithuania, both with two publications, and Luxembourg with only 1 (Figure 13).

4. Discussion

The forest covered area varied greatly across the European nations investigated, with countries like Finland and Sweden having nearly 70% of their land cover forested, while Netherlands and Ireland presented circa 11% of forest area. This fact is not only related to a country geographical condition but also is an indicator of different types of forests, distinct management approaches, and national forest policies [39]. However, despite variations in forest coverage across countries, statistics showed that between 2000 and 2018, the quality of more than 60% of the forest in Europe has increased [3]. Forest certification has made significant progress in Europe in promoting sustainable forest management practices [21], a concept that has been growing in acceptance and popularity in both national forest plans and international forest policy [40]. Our results demonstrated that the pattern observed within European countries in relation to forest coverage is not yet fully reflected in the proportion of certified forest. Even though Finland had the highest percentage of forest area and more than 80% of certified forests, Croatia, Bosnia and Herzegovina, and Austria all had even higher certification rates.
More than 98 million hectares of the European forest, representing around 50% of the total forest area in Europe, are certified by one or both of these two certification schemes, FSC and PEFC [35,36], with PEFC certifying more area than FSC within the analyzed countries. Results from this work indicated that few countries were certified by the two organizations at equivalent rates, most of the countries presented a prevalence of one of the certification schemes. This last result is in agreement with the findings reported by other authors [6,41,42]. Countries continue to have an evident preference for one of the certification standards (e.g., Austria and Finland preferring PEFC, and Croatia preferring FSC), other countries like Ireland lost that partiality to have an almost equal percentage of forest certified by both organizations. Ireland and Portugal who, according to [6], had no forest certification by PEFC now presented forest certified by this organization (59% and 10% respectively). The adequacy of FSC and PEFC standards depends on the environmental and socioeconomic context of a given nation or sector, and of the stakeholder perspectives on how to best address the main obstacles of forest certification [42]. In countries like Croatia, where the majority of the forest is managed by the state [43], FSC certification is frequently considered as a means of validating the quality and competence of state forest management organizations [44], justifying the high amount of certified forest area under this standard [6]. On the other hand, the external credibility of companies with greater efficiency and economic profitability, as well as the access to international markets, have been significant drivers of entry into PEFC certification [20,45] for European countries. This tendency to increase the presence of both standards in many European countries is often a requirement to have access to international markets and a response of companies to the market trends, as the two schemes have no mutual recognition [6,20,22] and different consumer markets may prefer different certification brands.
From a more economic perspective, Czechia stood out as the country with a higher expense for certified forest area, but also with larger outputs from forest sector and connected secondary activities. These results may be justified by the implementation of national policies that continued favoring conventional management techniques, with focus mostly on the production of timber and other wood products [46]. The levels of those variables were noticeably lower in Italy and Spain. According to Martinho and Ferreira [47], the production from forest-related activities (2012–2017) was higher in Germany, Czechia, Slovakia, Austria, and Slovenia when weighted by the total land area of the respective country. Considering total revenues for the same period, France, Germany, and Sweden proved to have the capacity to economically explore successfully their forest land [48]. Both studies supported the importance of forests in Czechia, but weighting the economic indicators by the ratio of certified forest area it was possible to better understand the dynamic between forest certification and the economy of the sector in that country. As expected, results from the current study indicated that in terms of GVA, Czechia continued to be the top-ranked nation, followed by Netherlands and Slovakia. Croatia, a country with all its forest land certified by FSC, had a mean GVA value (116€. ha−1), suggesting some inefficiency to successfully and fully explore and increase the outcomes of its forested territory. Such economic pattern may be the effect of (lack of) internal policies and the predominance of the public ownership of the forest territory [43] with less active commercial focus.
The overall analysis of the intermediate consumption demonstrated a tendency for costs to rise along with the increment of certified forest area, supporting the fact that the certification process is often expensive, particularly at a small scale [6,49]. However, this rise tends to plateau after a certain scale is reached within certification coverage (e.g., around 70% area certified) probably implying that it is indeed possible to sustain at scale a profitable certification scheme where costs are controlled and outputs may be further increased. Additionally, a rise in investment and the formation of green jobs has also been observed in nations with variable levels of forest cover, from those with little to those with a large and established portion of their territory covered by forest [48]. The forest output pattern evidenced a positive bias, increasing with the ratio of forest with certification, but quite divergent among countries with more than 50% of the area certified. This is most probably due to external conditions specific for each country, such as market access and political and industrial adequate frameworks. In terms of the relation of GVA with the forest certified, it was nearly exponential, indicating that in general the more certified forest area, the higher the relevance of the sector in the economy of the country, which supports the value of such schemes. Our results reinforce the assumptions of other authors [6,39,50], that the forest certification ought to support an economically, socially, and environmentally viable forest management. In Finland and Sweden, forest and forest management have become further economically relevant as a result of the high number of jobs associated with the forest industry and the rising demand for certified and sustainably managed forest derived products from significant international markets for timber and pulpwood [39,50].
National governmental authorities and their forest regulations have a significant impact on the economy of the forest sector, but the market context and access in the different European countries is also of crucial importance [6,44]. Particularly, markets for timber and pulpwood encouraged landowners to make expenditures in forest management to increase forest productivity [50]. In the last years, forest certification helped to promote the shift of forest management from timber and productivity to a wider range of other ecosystem services such soil conservation and water regulation, using novel approaches to forest governance that involve the interaction of public and private stakeholders [51,52], targeting goals completely aligned with those established within the EPI and the SDG [30,31,35,36].
The findings from our work show no relation between the EPI (general) and the ratio of certified forest, with all of the investigated countries presenting a score equal or higher to 50. The only exception was Bosnia and Herzegovina who scored 39. These results are aligned to what was expected from a more general indicator as the EPI, where the contribution of forest sector is in some way diluted within the overall contributions of other sectors impacting the environment. The EPI ranks 180 nations worldwide on their progress towards enhancing environmental sustainability using 40 performance indicators within 11 categories [30]. Results from the EPI-TBG indicator, connected to global protection of terrestrial ecosystems in biodiversity and habitat [30], reinforced the absence of link with the ratio forest certification of the European countries already observed with the general EPI. Countries like Italy and Spain with circa 10% of certified forest area scored the same value as countries like Lithuania with 60% of forest with certification and Croatia with all its forest certified. Once more, Bosnia and Herzegovina recorded the lowest value, being the second country with more ratio of certified area. Not all the terrestrial ecosystems are forest related, varying greatly in type, number and dimension across countries. Also, the extent of countries investigated from all the continents, attenuates the differences among European countries. In general, European forest ecosystems are productive, well-connected to other forests, and successfully incorporated into the landscape [3]. Having a rate of certified forest of nearly 50% across all EU just emphasizes these conclusions.
Higher variation was observed between the selected countries when considering the SDG 15 indicator, target 15.2.1, proportion of forest area within legally established protected areas. This indicator focuses specifically on protected forest areas, which have different status and focus than certified forest areas. With the exception of Italy and Spain, where the percentage of protected forest vastly exceeded the percentage of forest with certification, the trend among the nations with less than half of certified forest was for protected areas to follow along with the growth of certified forest area. No trend was seen over that threshold of certified area. The area of planted forest is growing in Europe, along with the demand for wood and other services provided by forest plantations [53]. Forest plantations are often related to the conservation and recovery of natural forests [54], however the majority of forest plantations are still mainly managed for wood production and tend to have low ratios of protected areas [55]. The target addressing the proportion of forest area under a long-term management plan showed that Croatia, Finland, Czechia, Slovakia, Latvia, Lithuania, Slovenia, and Hungary had all their forest area covered by such planning, regardless the percentage of their forest area with certification. Except for Italy, Luxembourg and, Bosnia and Herzegovina (no data available), only Austria and Norway had ratios of forest area under a long-term management plan inferior to the certified forest. These findings suggest that, although forest certification can be a main driver in both sustainable commercial exploitation of forest areas, as well as, developing long-lasting management plans, in general European countries have a main concern to define and implement sustainable management forest strategies beyond forest certification, covering specific protected forest areas. The sustainable management of forest plantations, both at stand and landscape levels, is the most effective way to maintain the economic benefits of forest plantations while promoting their multifunctionality and the synergy between ecosystem services [53,54]. The attainment of sustainability in the forest sector in Europe might differ significantly between nations, not only through forest certification but also by the definition and adoption of case-specific measures and transparent national policies while playing the correct balance between certification and protection forest areas, to sustain a responsible balance for future generations. Depending on the country, it may have a negative effect on the economy cost structure, increasing costs and lowering GVA [23], but can also led to currently unvalued and not yet monetized ecosystem services and recovery of valuable biomass.
Scientific publications can also be useful tools in promoting informed discussions and guiding policymakers and investors towards sustainable forest management practices [30,56]. Results from a scientific search on the Scopus database showed that, despite the fact that only about 22% of the publications had co-authors from Europe, researchers in European countries are interested in researching the economic impacts of forest certification. In trying to establish the awareness and focus level of scientists in Europe to the interrelation between sustainable forest management and economic and market valorization of the forest certification schemes we performed a systematic search for specific key terms across the available literature, From the search terms screened, economy and market were the most represented words in the scientific publications from Europe related to forest certification and retrieved from Scopus database. These terms, together with the word performance, did not necessarily imply that the study would discuss any economic analysis, even though 74% of the papers contained more than one of the search terms. These findings are in line with Malek and Abdul Rahim [52], that stated that, despite the numerous publications addressing forest certification publications, only a small number of papers have examined current patterns and trends on this topic. The first study on this matter was first published by 1996, three years after the FSC was established and the first forest areas were certified [25]. Words as chain of custody, investment and profitability started to be include in scientific papers only at the beginning of the 2000. Around 2006, concepts like value chain and cost benefit also begun to appear in academic journals. Despite the great level of specificity of the chosen search terms, no evident relationship between them and the keywords in the scientific articles was identified. Keywords were mostly centered on sustainable forest management and certification. Only one comparable keyword emerged, economics, in one of the clusters interacting with forest management, planning, and productivity.
In relation to European countries, Sweden, Finland, United Kingdom, Germany, Netherlands and Italy stood out as the nations most represented in the scientific publications. It was difficult to define a clear link between the volume of scientific publications and the economic outputs of certified forests, but a positive trend emerged. Countries, such as Germany and Netherlands, with significant levels of investment when weighted by the ratio of certified forest of the respective country, exhibited a good commitment to research on this matter, contributing to the growing body of knowledge on sustainable forest management and informed investment decisions. A similar pattern was seen in countries like Finland with higher GVA associated to the forest sector. On the other hand, Italy with a lower ratio of certified forest, continued to contribute to the advance of scientific knowledge on forest certification matters. The outputs from that contribution were clearly noticeable considering the ranking of Italy in SGD 15.2.1 targets and EPI indicators. However, this does not yet translate to the economic value Italy is retrieving from such good knowledge and practices and certainly more incentives and an adequate political framework could boost the sector in countries like Italy. Results suggest that research in sustainable forest management is frequently acknowledged by countries that had evidence of investing in forestry, even if in some cases apart from the certification process. As a result, these nations normally devote substantial sums of money to universities, research centers, and network collaborations devoted to forestry research. Countries in Eastern Europe, particular Czechia and Croatia, the first with the highest GVA observed and, the second with the totality of its forest area certify but with a low GVA, had a less evident participation on scientific studies. Can a major focus on the timber market and the fact that the majority of the forest is managed by the state [43], be contributing to these results? Many factors beyond scientific publications, such as financial resources, policies, and stakeholder engagement, influence investment and adequate exploitation in forestry. Overall, findings from the current study suggest that certification can help to enhance the financial performance of forest investments, mitigating the risks and improving the trust of investors and allowing the access of forest industries to international and highly competitive markets. On the other hand, our data also points out that there is still some competition between protection and certification of forest areas and that both mechanisms need to jointly work to foster a more sustainable future for forest land in EU. Finally, research and development in forest certification and related sciences, in concrete in the interface between natural and social forest sciences, can be further boosted in Europe, when compared to other world regions alongside suitable political incentives to leverage the informed and sustained forest we all aim to have in European land.
5. Conclusions

Forest certification appears to help to mitigate risks related to major concerns, such as deforestation, human rights violations, and biodiversity loss, by providing assurance that forest operations are managed in a responsible and sustainable manner. This impacts several performance economic indicators across EU countries. Additionally, this can be particularly relevant for investors who are seeking to align their investments with their values and contribute to positive social and environmental outcomes, but also to more conservative investors as it supports the production of timber and non-timber forest products in a responsible and harmonious manner. Forest certification also increases sustainable forest management practices and lead to favorable social and environmental results by increasing market demand for certified goods and at the same time providing access to international and more demanding markets from European forest managers and products developers. A deeper analysis of the obtained database, specifically correlating economic with environmental indicators, as well as, of the internal policies of the selected countries could help to effectively quantify the degree of impact that forest certification has at European level and how European polices can help boost and balance the economy and sustainability of the forest sector across countries.

Author Contributions

Sofia Corticeiro: Conceptualization, Investigation, Formal analysis, Visualization, Writing—original draft, Funding acquisition. Margarida Tomé: Methodology, Writing—review & editing. Helena Vieira: Conceptualization, Methodology, Funding acquisition, Project management, Supervision, Writing—review & editing.

Funding

ERA Chair BESIDE project financed by the European Union’s H2020 under grant agreement No 951389, DOI10.3030/951389, and FirEProd Project (PCIF/MOS/0071/2019) funded by FCT, through national funds.

Data Availability Statement

The datasets generated during and/or analyzed during the current study are available from the corresponding author on reasonable request.

Acknowledgments

We acknowledge the support action (CSA) ERA Chair BESIDE project financed by the European Union’s H2020 under grant agreement No 951389, DOI10.3030/951389, and FirEProd Project (PCIF/MOS/0071/2019) funded by FCT, through national funds. The authors also acknowledge financial support to Centre for Environmental and Marine Studies (CESAM) by FCT/MCTES (UIDP/50017/2020+UIDB/50017/2020+ LA/P/0094/2020), through national funds.

Conflicts of Interest

The authors declare no conflict of interest.

References

  1. FAO Global Forest Resources Assessment 2020: Main Report; Rome (Italy), 2020.
  2. Maesano, M.; Lasserre, B.; Masiero, M.; Tonti, D.; Marchetti, M. First Mapping of the Main High Conservation Value Forests (HCVFs) at National Scale: The Case of Italy. Plant Biosyst. 2016, 150, 208–216. [CrossRef]
  3. Maes, J.; Bruzón, A.G.; Barredo, J.I.; Vallecillo, S.; Vogt, P.; Rivero, I.M.; Santos-Martín, F. Accounting for Forest Condition in Europe Based on an International Statistical Standard. Nat. Commun. 2023, 14. [CrossRef]
  4. FORESTEUROPE State of Europe’s Forests 2020; 2020.
  5. Forster, E.J.; Healey, J.R.; Dymond, C.; Styles, D. Commercial Afforestation Can Deliver Effective Climate Change Mitigation under Multiple Decarbonisation Pathways. Nat. Commun. 2021, 12, 3831. [CrossRef]
  6. Maesano, M.; Ottaviano, M.; Lidestav, G.; Lasserre, B.; Matteucci, G.; Mugnozza, G.S.; Marchetti, M. Forest Certification Map of Europe. IForest 2018, 11, 526–533. [CrossRef]
  7. FAO; UNEP The State of the World’s Forests 2020. Forests, Biodiversity and People.; Rome (Italy), 2020.
  8. Ontl, T.A.; Swanston, C.; Brandt, L.A.; Butler, P.R.; D’Amato, A.W.; Handler, S.D.; Janowiak, M.K.; Shannon, P.D. Adaptation Pathways: Ecoregion and Land Ownership Influences on Climate Adaptation Decision-Making in Forest Management. Clim. Change 2018, 146, 75–88. [CrossRef]
  9. Ontl, T.A.; Janowiak, M.K.; Swanston, C.W.; Daley, J.; Handler, S.; Cornett, M.; Hagenbuch, S.; Handrick, C.; Mccarthy, L.; Patch, N. Forest Management for Carbon Sequestration and Climate Adaptation. J. For. 2020, 118, 86–101. [CrossRef]
  10. Silva, R.A.L.; Robert, R.C.G.; Purfürst, T. How Is the Forest Sector’s Contribution to the Sustainable Development Goals (SDGs) Being Addressed? A Systematic Review of the Methods. Sustain. 2023, 15. [CrossRef]
  11. Gutiérrez, E.; Lozano, S. Cross-Country Comparison of the Efficiency of the European Forest Sector and Second Stage DEA Approach. Ann. Oper. Res. 2022, 314, 471–496. [CrossRef]
  12. Eurostat Economic Aggregates of Forestry Available online: https://ec.europa.eu/eurostat/databrowser/product/page/FOR_ECO_CP?lang=en. Last accessed May 13th 2023.
  13. Hansen, M.C.; Potapov, P. V; Moore, R.; Hancher, M.; Turubanova, S.A.; Tyukavina, A.; Thau, D.; Stehman, S. V; Goetz, S.J.; Loveland, T.R.; et al. High-Resolution Global Maps of 21st-Century Forest Cover Change. Science (80-.). 2013, 342, 850–853. [CrossRef]
  14. Curtis, P.G.; Slay, C.M.; Harris, N.L.; Tyukavina, A.; Hansen, M.C. Classifying Drivers of Global Forest Loss. Science (80-.). 2018, 361, 1108–1111. [CrossRef]
  15. Prevedello, J.A.; Winck, G.R.; Weber, M.M.; Nichols, E.; Sinervo, B. Impacts of Forestation and Deforestation on Local Temperature across the Globe. PLoS One 2019, 14, e0213368. [CrossRef]
  16. Yamamoto, Y.; Takeuchi, K.; Shinkuma, T. Is There a Price Premium for Certified Wood? Empirical Evidence from Log Auction Data in Japan. For. Policy Econ. 2014, 38, 168–172. [CrossRef]
  17. Liu, K.-T.; Liu, W.-Y. Assessing the Information Value of Wood Products Perceived from Young Consumers. Eur. J. Wood Wood Prod. 2023, 81, 801–814. [CrossRef]
  18. Stern, T.; Ranacher, L.; Mair, C.; Berghäll, S.; Lähtinen, K.; Forsblom, M.; Toppinen, A. Perceptions on the Importance of Forest Sector Innovations: Biofuels, Biomaterials, or Niche Products? Forests 2018, 9. [CrossRef]
  19. Michal, J.; Březina, D.; Šafařík, D.; Kupčák, V.; Sujová, A.; Fialová, J. Analysis of Socioeconomic Impacts of the FSC and PEFC Certification Systems on Business Entities and Consumers. Sustain. 2019, 11. [CrossRef]
  20. Zubizarreta, M.; Arana-Landín, G.; Cuadrado, J. Forest Certification in Spain: Analysis of Certification Drivers. J. Clean. Prod. 2021, 294. [CrossRef]
  21. Wolff, S.; Schweinle, J. Effectiveness and Economic Viability of Forest Certification: A Systematic Review. Forests 2022, 13. [CrossRef]
  22. Burivalova, Z.; Hua, F.; Koh, L.P.; Garcia, C.; Putz, F. A Critical Comparison of Conventional, Certified, and Community Management of Tropical Forests for Timber in Terms of Environmental, Economic, and Social Variables. Conserv. Lett. 2017, 10, 4–14. [CrossRef]
  23. Artene, A.E.; Cioca, L.-I.; Domil, A.E.; Ivascu, L.; Burca, V.; Bogdan, O. The Macroeconomic Implications of the Transition of the Forestry Industry towards Bioeconomy. Forests 2022, 13. [CrossRef]
  24. Wolfslehner, B.; Prokofieva, I.; Mavsar, R. (editors) Non-Wood Forest Products in Europe: Seeing the Forest around the Trees. What Science Can Tell Us; Wolfslehner, B., Prokofieva, I. and Mavsar, R., Ed.; European Forest Institute, 2019; ISBN 978-952-5980-78-3 (pdf).
  25. FSC FSC Principles and Criteria for Forest Stewardship; 2023; Last accessed May 13th 2023.
  26. PEFC, I. PEFC Council Statutes; 2014; Last accessed May 13th 2023.
  27. European Commission New EU Forest Strategy for 2030. Communication from the Commission to the European Parliament, the Council, the European Economic and Social Committee and the Committee of the Regions.; Brussels, 2021; Last accessed May 27th 2023.
  28. WEF Investing in Forests: The Business Case; 2021; Last accessed May 14th 2023.
  29. Baumgartner, R.J. Sustainable Development Goals and the Forest Sector—A Complex Relationship. Forests 2019, 10. [CrossRef]
  30. Wolf, M.J.; Emerson, J.W.; Esty, D.C.; de Sherbinin, A.; Wendling, Z.A.; Al., E. 2022 Environmental Performance Index; New Haven, CT, 2022.
  31. United Nations The Sustainable Development Goals Report; New York, 2023.
  32. Rode, J.; Pinzon, A.; Stabile, M.C.C.; Pirker, J.; Bauch, S.; Iribarrem, A.; Sammon, P.; Llerena, C.A.; Muniz Alves, L.; Orihuela, C.E.; et al. Why ‘Blended Finance’ Could Help Transitions to Sustainable Landscapes: Lessons from the Unlocking Forest Finance Project. Ecosyst. Serv. 2019, 37. [CrossRef]
  33. Niewöhner, J.; Bruns, A.; Haberl, H.; Hostert, P.; Krueger, T.; Lauk, C.; Lutz, J.; Müller, D.; Nielsen, J. Land Use Competition: Ecological, Economic and Social Perspectives: In; 2016; pp. 1–17 ISBN 978-3-319-33626-8.
  34. FAO, F. and A.O. of the U.N. Global Forest Resources Assessment 2020 Available online: https://fra-data.fao.org/assessments/fra/2020/EU/sections/extentOfForest/. Last accessed May 28th 2023.
  35. PEFC, I. PEFC Global Statistics, March 2023; 2023; Last accessed May 28th 2023.
  36. FSC, F.S.C. FSC Connect Facts & Figures Available online: https://connect.fsc.org/impact/facts-figures. Last accessed May 28th 2023.
  37. Wolf, M.J.; Emerson, J.W.; Esty, D.C.; de Sherbinin, A.; Wendling, Z.A.; Al., E. EPI2022 Raw Data Available online: https://epi.yale.edu/downloads. Last accessed May 13th 2023.
  38. United Nations SDG Indicators Database Available online: https://unstats.un.org/sdgs/dataportal/database. Last accessed May 13th 2023.
  39. Kauppi, P.E.; Stål, G.; Arnesson-Ceder, L.; Hallberg Sramek, I.; Hoen, H.F.; Svensson, A.; Wernick, I.K.; Högberg, P.; Lundmark, T.; Nordin, A. Managing Existing Forests Can Mitigate Climate Change. For. Ecol. Manage. 2022, 513, 120186. [CrossRef]
  40. MacDicken, K.G.; Sola, P.; Hall, J.E.; Sabogal, C.; Tadoum, M.; de Wasseige, C. Global Progress toward Sustainable Forest Management. For. Ecol. Manage. 2015, 352, 47–56. [CrossRef]
  41. Gomez-Zamalloa, M.G.; Caparros, A.; Ayanz, A.S.-M. 15 Years of Forest Certification in the European Union. Are We Doing Things Right? For. Syst. 2011, 20, 81–94. [CrossRef]
  42. McDermott, C.L.; Elbakidze, M.; Teitelbaum, S.; Tysiachniouk, M. Forest Certification in Boreal Forests: Current Developments and Future Directions BT - Boreal Forests in the Face of Climate Change: Sustainable Management. In; Girona, M.M., Morin, H., Gauthier, S., Bergeron, Y., Eds.; Springer International Publishing: Cham, 2023; pp. 533–553 ISBN 978-3-031-15988-6.
  43. Halder, P.; Paladinić, E.; Stevanov, M.; Orlović, S.; Hokkanen, T.J.; Pelkonen, P. Energy Wood Production from Private Forests – Nonindustrial Private Forest Owners׳ Perceptions and Attitudes in Croatia and Serbia. Renew. Sustain. Energy Rev. 2014, 35, 515–526. [CrossRef]
  44. Cashore, B.; Gale, F.; Meidinger, E.; Newsom, D. Forest Certification in Developing and Transitioning Countries: Part of a Sustainable Future? Environ. Sci. Policy Sustain. Dev. 2006, 48, 6–25. [CrossRef]
  45. Paluš, H.; Parobek, J.; Dzian, M.; Šimo-Svrček, S.; Krahulcová, M. How Companies in the Wood Supply Chain Perceive the Forest Certification. Acta Fac. Xylologiae Zvolen 2019, 61, 155–165. [CrossRef]
  46. Fanta, J.; Petřík, P. Forests and Climate Change in Czechia: An Appeal to Responsibility. J. Landsc. Ecol. 2018, 11, 3–16. [CrossRef]
  47. Martinho, V.; Ferreira, A. Forest Resources Management and Sustainability: The Specific Case of European Union Countries. Sustainability 2020, 13, 58. [CrossRef]
  48. Martinho, V.J.; Ferreira, A.J. Forest Resources Management and Sustainability: The Specific Case of European Union Countries. Sustainability 2021, 13. [CrossRef]
  49. Di Lallo, G.; Maesano, M.; Masiero, M.; Mugnozza, G.S.; Marchetti, M. Analyzing Strategies to Enhance Small and Low Intensity Managed Forests Certification in Europe Using SWOT-ANP. Small-scale For. 2016, 15, 393–411. [CrossRef]
  50. Chudy, R.P.; Cubbage, F.W. Research Trends: Forest Investments as a Financial Asset Class. For. Policy Econ. 2020, 119, 102273. [CrossRef]
  51. Schwaiger, F.; Poschenrieder, W.; Biber, P.; Pretzsch, H. Ecosystem Service Trade-Offs for Adaptive Forest Management. Ecosyst. Serv. 2019, 39, 100993. [CrossRef]
  52. Malek, E.J.; Abdul Rahim, A.R. A Thematic Review of Forest Certification Publications from 2017 to 2021: Analysis of Pattern and Trends for Future Studies. Trees, For. People 2022, 10, 100331. [CrossRef]
  53. Freer-Smith, P.; Muys, B.; Bozzano, M.; Drössler, L.; Farrelly, N.; Jactel, H.; Korhonen, J.; Minotta, G.; Nijnik, M.; Orazio, C. Plantation Forests in Europe: Challenges and Opportunities. From Science to Policy 9.; 2019. [CrossRef]
  54. Tomé, M.; Almeida, M.H.; Barreiro, S.; Branco, M.R.; Deus, E.; Pinto, G.; Silva, J.S.; Soares, P.; Rodríguez-Soalleiro, R. Opportunities and Challenges of Eucalyptus Plantations in Europe: The Iberian Peninsula Experience. Eur. J. For. Res. 2021, 140, 489–510. [CrossRef]
  55. Brockerhoff, E.G.; Jactel, H.; Parrotta, J.A.; Ferraz, S.F.B. Role of Eucalypt and Other Planted Forests in Biodiversity Conservation and the Provision of Biodiversity-Related Ecosystem Services. For. Ecol. Manage. 2013, 301, 43–50. [CrossRef]
  56. Päivinen, R.; Käär, L. From Forest Research to Forestry Practice - Approaches in Leveraging Forest Research in Northern and Central European Countries; 2017.
Figure 1. Total forest area by country in Europe, in terms of percentage of the total country land area, obtained as the ratio between the total forest area (ha) and the total country land area (ha) of each of the European countries Austria (AT), Belgium (BE), Bosnia and Herzegovina (BA), Bulgaria (BG), Croatia (HR), Czechia (CZ), Denmark (DK), Estonia (EE), Finland (FI), France (FR), Germany (DE), Hungary (HU), Ireland (IE), Italy (IT), Latvia (LV), Lithuania (LT), Luxembourg (LU), Netherlands (NL), Norway (NO), Poland (PL), Portugal (PT), Romania (RO), Slovakia (SK), Slovenia (SI), Spain (ES), Sweden (SE), Switzerland (CH), United Kingdom (UK). Source of the original dataset [34].
Preprints 91739 g001
Figure 2. Certified forest area, as percentage of the total forest area, by country in Europe, obtained as the ratio between the total certified forest area (ha) and the total forest area (ha) of each of the European countries Austria (AT), Belgium (BE), Bosnia and Herzegovina (BA), Bulgaria (BG), Croatia (HR), Czechia (CZ), Denmark (DK), Estonia (EE), Finland (FI), France (FR), Germany (DE), Hungary (HU), Ireland (IE), Italy (IT), Latvia (LV), Lithuania (LT), Luxembourg (LU), Netherlands (NL), Norway (NO), Poland (PL), Portugal (PT), Romania (RO), Slovakia (SK), Slovenia (SI), Spain (ES), Sweden (SE), Switzerland (CH), United Kingdom (UK). Source of the original dataset [34].
Preprints 91739 g002
Figure 3. Certified forest area by FSC, as percentage of the total certified forest area, by country, obtained as the ratio between the area certified by FSC and the total certified forest area for the year 2020 of each of the European countries Austria (AT), Belgium (BE), Bosnia and Herzegovina (BA), Bulgaria (BG), Croatia (HR), Czechia (CZ), Denmark (DK), Estonia (EE), Finland (FI), France (FR), Germany (DE), Hungary (HU), Ireland (IE), Italy (IT), Latvia (LV), Lithuania (LT), Luxembourg (LU), Netherlands (NL), Norway (NO), Poland (PL), Portugal (PT), Romania (RO), Slovakia (SK), Slovenia (SI), Spain (ES), Sweden (SE), Switzerland (CH), United Kingdom (UK). Source of the original dataset of the certified forest area by country [34] and of the area certified by FSC [36].
Preprints 91739 g003
Figure 4. Certified forest area by PEFC, as percentage of the total certified forest area, by country, obtained as the ratio between the area certified by FSC and the total certified forest area for the year 2020 of each of the European countries Austria (AT), Belgium (BE), Bosnia and Herzegovina (BA), Bulgaria (BG), Croatia (HR), Czechia (CZ), Denmark (DK), Estonia (EE), Finland (FI), France (FR), Germany (DE), Hungary (HU), Ireland (IE), Italy (IT), Latvia (LV), Lithuania (LT), Luxembourg (LU), Netherlands (NL), Norway (NO), Poland (PL), Portugal (PT), Romania (RO), Slovakia (SK), Slovenia (SI), Spain (ES), Sweden (SE), Switzerland (CH), United Kingdom (UK). Source of the original dataset of the certified forest area by country [34] and of the area certified by PEFC [35].
Preprints 91739 g004
Figure 5. Forest area (%, green line), certified forest area (%, yellow line), intermediate consumption (€. ha−1; orange bars), output of forest and connected secondary activities (€. ha−1; grey bars) and gross values added (GVA) (€. ha−1; blue bars), all for the year of 2020 and for the European countries Austria (AT), Belgium (BE), Bosnia and Herzegovina (BA), Bulgaria (BG), Croatia (HR), Czechia (CZ), Denmark (DK), Estonia (EE), Finland (FI), France (FR), Germany (DE), Hungary (HU), Ireland (IE), Italy (IT), Latvia (LV), Lithuania (LT), Luxembourg (LU), Netherlands (NL), Norway (NO), Poland (PL), Portugal (PT), Romania (RO), Slovakia (SK), Slovenia (SI), Spain (ES), Sweden (SE), Switzerland (CH), United Kingdom (UK). The original data for the intermediate consumption, output of forest and related secondary activities and GVA were obtained from [12] and the total forest area and the certified forest area was obtained from [34].
Preprints 91739 g005
Figure 6. Relation between the intermediate consumption in 2020 by country, in euros per ha, and the respective certified forest area for the European countries Austria (AT), Belgium (BE), Bosnia and Herzegovina (BA), Bulgaria (BG), Croatia (HR), Czechia (CZ), Denmark (DK), Estonia (EE), Finland (FI), France (FR), Germany (DE), Hungary (HU), Ireland (IE), Italy (IT), Latvia (LV), Lithuania (LT), Luxembourg (LU), Netherlands (NL), Norway (NO), Poland (PL), Portugal (PT), Romania (RO), Slovakia (SK), Slovenia (SI), Spain (ES), Sweden (SE), Switzerland (CH), United Kingdom (UK). The original data for the intermediate consumption was obtained from [12] and the certified forest area was obtained from [34].
Preprints 91739 g006
Figure 7. Relation between the output generated by the forestry sector and related secondary activities in 2020 by country, in euros per ha, and the respective certified forest area for the European countries Austria (AT), Belgium (BE), Bosnia and Herzegovina (BA), Bulgaria (BG), Croatia (HR), Czechia (CZ), Denmark (DK), Estonia (EE), Finland (FI), France (FR), Germany (DE), Hungary (HU), Ireland (IE), Italy (IT), Latvia (LV), Lithuania (LT), Luxembourg (LU), Netherlands (NL), Norway (NO), Poland (PL), Portugal (PT), Romania (RO), Slovakia (SK), Slovenia (SI), Spain (ES), Sweden (SE), Switzerland (CH), United Kingdom (UK). The original data for the output of forestry and connected secondary activities was obtained from [12] and the certified forest area was obtained from [34].
Preprints 91739 g007
Figure 8. Relation between the Gross value added (GVA) in 2020 by country, in euros per ha, and the respective certified forest area for the European countries Austria (AT), Belgium (BE), Bosnia and Herzegovina (BA), Bulgaria (BG), Croatia (HR), Czechia (CZ), Denmark (DK), Estonia (EE), Finland (FI), France (FR), Germany (DE), Hungary (HU), Ireland (IE), Italy (IT), Latvia (LV), Lithuania (LT), Luxembourg (LU), Netherlands (NL), Norway (NO), Poland (PL), Portugal (PT), Romania (RO), Slovakia (SK), Slovenia (SI), Spain (ES), Sweden (SE), Switzerland (CH), United Kingdom (UK). The original data for the GVA was obtained from [12] and the certified forest area was obtained from [34].
Preprints 91739 g008
Figure 9. Environmental performance index (EPI) for the year 2020 (light green bars) and terrestrial biome protection, global, in biodiversity and habitat (EPI - TBG) for the year 2020 (dark green bars), and by country and the respective certified forest area (%, yellow line) for the European countries Austria (AT), Belgium (BE), Bosnia and Herzegovina (BA), Bulgaria (BG), Croatia (HR), Czechia (CZ), Denmark (DK), Estonia (EE), Finland (FI), France (FR), Germany (DE), Hungary (HU), Ireland (IE), Italy (IT), Latvia (LV), Lithuania (LT), Luxembourg (LU), Netherlands (NL), Norway (NO), Poland (PL), Portugal (PT), Romania (RO), Slovakia (SK), Slovenia (SI), Spain (ES), Sweden (SE), Switzerland (CH), United Kingdom (UK). The original data for the EPI 2022 was obtained from [37] and the certified forest area was obtained from [34].
Preprints 91739 g009
Figure 10. Sustainable development goal (SDG) 15.2.1 targets of the proportion of forest area within legally established protected areas for the year of 2020 (%, dark green bars) and of proportion of forest area under a long-term management plan for the year of 2020 (%, light green bars), and the respective certified forest area (%, yellow line) for the European countries Austria (AT), Belgium (BE), Bosnia and Herzegovina (BA), Bulgaria (BG), Croatia (HR), Czechia (CZ), Denmark (DK), Estonia (EE), Finland (FI), France (FR), Germany (DE), Hungary (HU), Ireland (IE), Italy (IT), Latvia (LV), Lithuania (LT), Luxembourg (LU), Netherlands (NL), Norway (NO), Poland (PL), Portugal (PT), Romania (RO), Slovakia (SK), Slovenia (SI), Spain (ES), Sweden (SE), Switzerland (CH), United Kingdom (UK). The original data for the SDG 15.2.1 indicator was obtained from UN (2023) and the certified forest area was obtained from [34]. The asterisk (*) indicates countries whose last data was reported between 2015 and 2018.
Preprints 91739 g010
Figure 11. English publications (n) on which the economic related terms (search words) were found in the title, abstract or keywords, distributed by year of publication, exclusively published by European co-authors and retrieved from Scopus database in June 2023.
Preprints 91739 g011
Figure 12. English publications aggregated and linked by keywords (authors’ keywords and indexed keywords) on which the economic related terms were found in the title, abstract or keywords, distributed by year of publication, exclusively published by European co-authors and retrieved from Scopus database in June 2023. Data analysis and image creation was performed with software VOSviewer version 1.6.19.
Preprints 91739 g012
Figure 13. English publications aggregated and linked by country (co-authors’ country) on which the economic related terms were found in the title, abstract or keywords, distributed by year of publication, exclusively published by European co-authors and retrieved from Scopus database in June 2023. Data analysis and image creation was performed with software VOSviewer version 1.6.19.
Preprints 91739 g013
Table 1. Search query, keywords in title, abstract and in authors’ keywords, origin and number of publications from Scopus database in English of each search query.
Keywords (TITLE-ABS-KEY) Additional words Geography Number of publications
(forest AND certification) OR “forest certification” OR “certified forest” OR (fsc AND forest*) OR (forest* AND pefc) - World 2565
- Europe 594
Economy family words Europe 445
Economic value Europe 18
Market Europe 326
Finance family words Europe 123
Investment Europe 59
Valorization Europe 7
Value chain Europe 56
Chain of custody Europe 68
Performance Europe 156
Profitability Europe 34
Cost-Benefit Europe 17
Table 2. Publications in English (in percentage) on which the economic related terms (search words) were found in the title, abstract or keywords, exclusively published by European co-authors retrieved from Scopus database in June 2023.
Economic related search words Publications in English (%)
Economy 86%
Market 62%
Performance 32%
Finance 23%
Chain of custody 14%
Value chain 11%
Investment 10%
Profitability 7%
Cost Benefit 4%
Economic value 3%
Valorization 2%
Disclaimer/Publisher’s Note: The statements, opinions and data contained in all publications are solely those of the individual author(s) and contributor(s) and not of MDPI and/or the editor(s). MDPI and/or the editor(s) disclaim responsibility for any injury to people or property resulting from any ideas, methods, instructions or products referred to in the content.
Copyright: This open access article is published under a Creative Commons CC BY 4.0 license, which permit the free download, distribution, and reuse, provided that the author and preprint are cited in any reuse.
Prerpints.org logo

Preprints.org is a free preprint server supported by MDPI in Basel, Switzerland.

Subscribe

© 2024 MDPI (Basel, Switzerland) unless otherwise stated