2. Methods
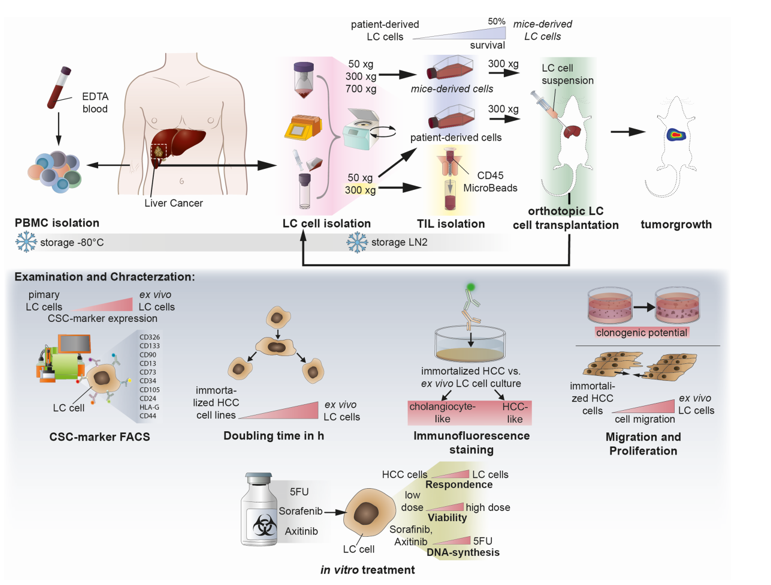
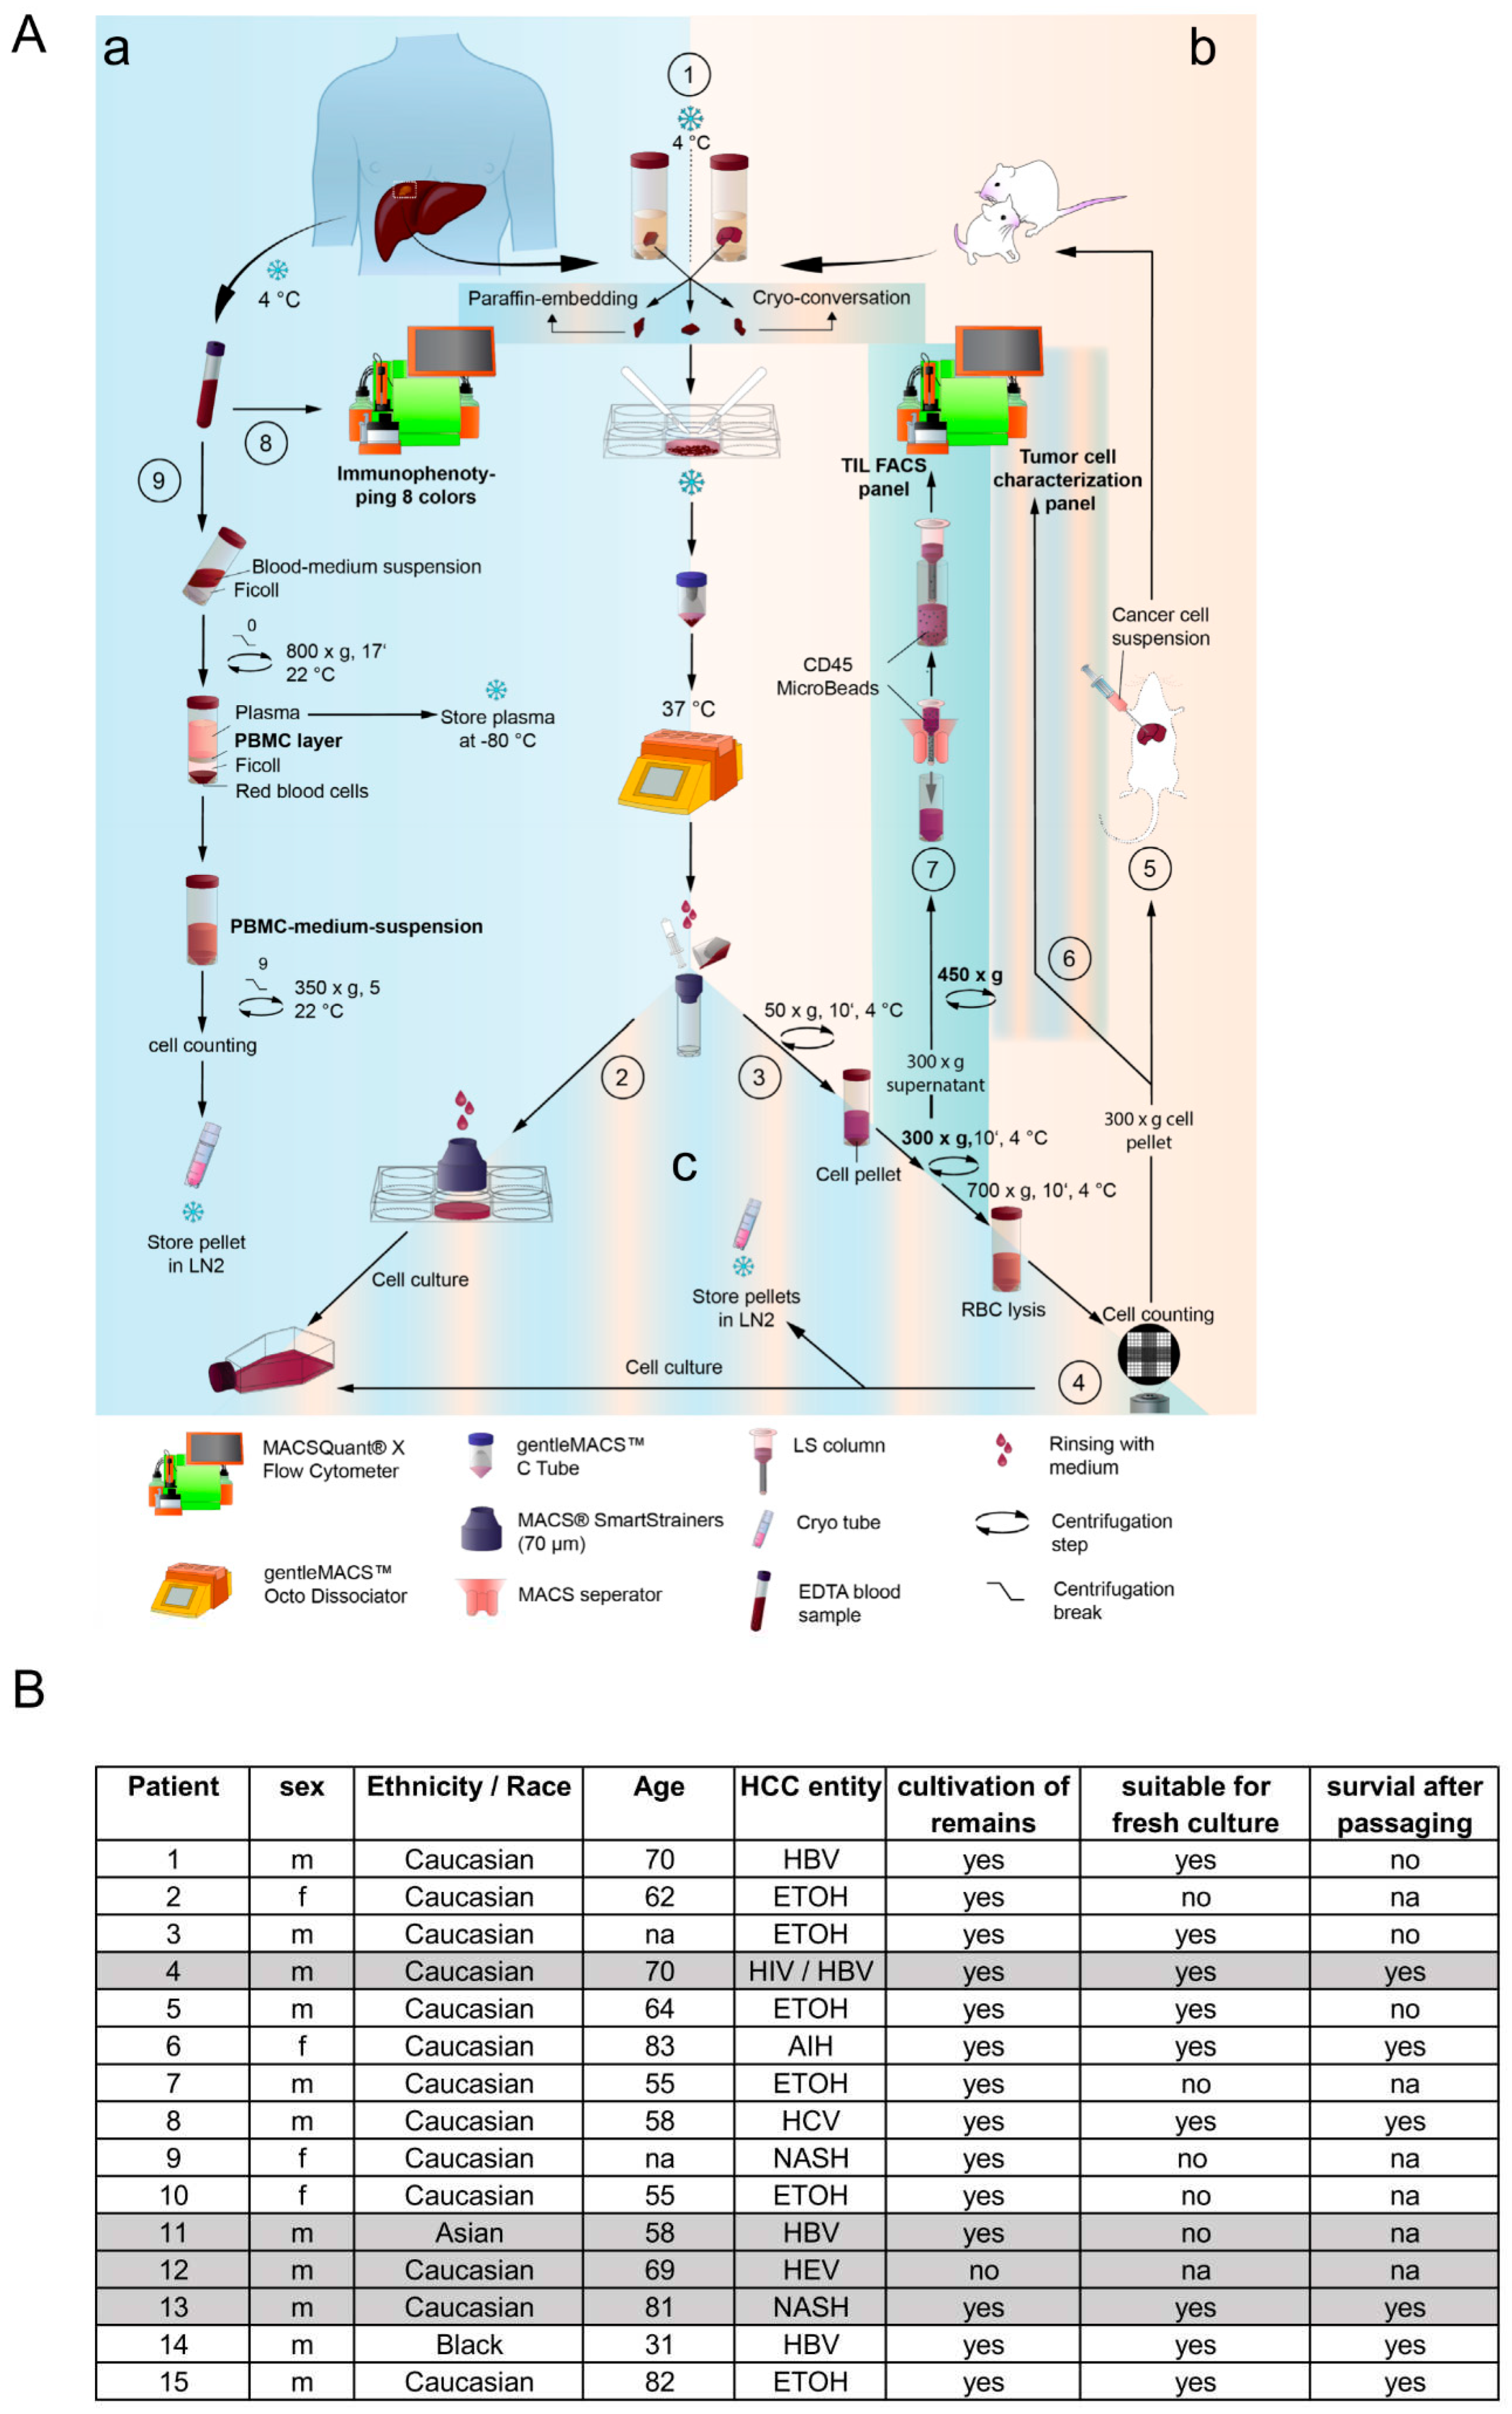
Isolation of liver cancer cells from patient- and mouse-derived material. The foundation of this study is based on the isolation and culturing of human liver cancer cells from patients and mice. Liver tissue samples of various sizes and etiologies were available from 15 patients undergoing surgery at the Center of Surgical Medicine and the Clinic and Polyclinic for General, Visceral, and Thoracic Surgery at the University Medical Center Hamburg-Eppendorf (ethical study approval number PV3578; amendment for this study was approved 18.06.2020; recruitment started from 01.03. 2021 and is still ongoing). The liver tissue was received in Belzer UW Cold storage solution (Bridge to Life, Northbrook, IL, USA) and was immediately stored on ice until further processing. Fresh liver and tumor material were prepared on ice with sterile scalpel blades (C. Bruno Bayha GmbH, Tutlingen, GER), and forceps sterilely under a laminar flow hood. Adipose tissue, blood vessels and necrotic areas were trimmed away. In preparation for enzymatic digestion, the tissue was transferred to a 6-well plate and minced into 1-2 mm3 pieces. The tissue pieces were then resuspended in DMEM + 100 IU/ml Penicillin und 100 µg/ml Streptomycin (1% P/S; Gibco, Paisley, GB and Grand Island, NY, USA) and immediately transferred to a MACS C-tube containing human tumor dissociation enzymes according to the manufacturer’s instructions (Tumor Dissociation Kit human). Tumor dissociation was performed using the gentleMACSTM Octo Dissociator with Heaters, an appropriate liver-dissociation program, and constant rotating at 37°C for 1 hour. The cell suspension was then applied to a MACS SmartStrainer (70µm). Kit, C-Tube, strainer, devices, and programs were purchased from Miltenyi Biotec (Bergisch Gladbach, GER). Any remaining tissue residues on the strainer surface were carefully rubbed through the membrane using the rough side of a 5 ml syringe punch (BD, Heidelberg, GER) and washed with 5 ml DMEM + 1% P/S. For cultivation, the SmartStrainer is placed up-side-down on a 6-well plate (Sarstedt AG & Co. KG, Nümbrecht, GER) and remaining cells were rinsed off with HCC culture medium (Advanced DMEM/F-12 + 2 mM GlutaMAX™ + 1% P/S (Gibco®, Paisley, GB and Grand Island, NY, USA) + 1 µg/ml EGF (Miltenyi Biotec, Bergisch Gladbach, GER) + 20% HyClone™FetalClone™II (Cytiva, Marlborough, Massachusetts, USA)) and collected for cell culture using a T25 cell culture flask (Sarstedt AG & Co. KG, Nümbrecht, GER). Additionally, Zellshield (Minerva Biolabs GmbH, Berlin, GER) was added in a ratio of 1:100. The previously filtered cell suspension was centrifuged at 50 xg at 4°C for 10 minutes. The 50x g supernatant was centrifuged at 300xg at 4°C for 10 minutes; the 300x g supernatant derived from human tissues was harvested and used for CD45-positive cell isolation (TILs, tumor-infiltrating leukocytes). A murine cell suspension containing transplanted human tumor cells was centrifuged at 700x g for 10 minutes (4°C); the 700x g supernatant was discarded. Red blood cell lysis of 50x g, 300x g, and 700x g cell pellets was performed by means of 10 ml ACK-buffer (solved in Aqua dist.; 1,5 M, Ammonium chloride (NH4Cl), 100 mM Potassium bicarbonate (KHCO3), 10 mM Titriplex III (EDTA-Na2)) at 37°C for 5 minutes. Lysis was stopped by diluting the cell suspension with an equal amount of DMEM + 1% P/S. The Neubauer counting chamber and Trypan blue staining (1:5) determined the cell amount of each solution. Cells of each fraction (50x g, 300x g, and 700x g) were cultured in the HCC culture medium as previously described. Orthotropic transplantation into mice was performed by using 1x10⁶ cells per mouse derived from human or murine cell isolation (see section below). FACS characterization of HCC-cells derived from human and murine cell isolation acquired 6x10⁵ cells of the 300x g fraction for staining (see section below). For long-term storage in liquid nitrogen, at least 1x10⁶ cells/ml of each fraction were prepared using a freezing medium (70% Belzer UW Cold storage solution, 20% FCS, and 10% DMSO (Sigma, St. Louis, MO, USA)) and Corning™CoolCell™ freezing container (Thermo Fisher Scientific, Waltham, USA) for controlled freezing.
PBMC isolation of patient-derived EDTA-blood. Peripheral blood mononuclear cells (PBMC) were isolated from fresh patient-derived EDTA-blood. The blood volume was determined and equally diluted for gradient centrifugation with cold RPMI (Gibco, Paisley, GB and Grand Island, NY, USA) without supplements. Diluted blood was then layered carefully on top of 15 ml Ficoll-Paque® PREMIUM (Cytiva, Marlborough, Massachusetts, USA) and centrifuged without a brake at room temperature for 18 min. After centrifugation, the upper layer (plasma) was collected and stored at -80°C. The PBMC layer underneath was carefully removed from the Ficoll-layer by using a 1 ml pipette. PBMCs were washed with RPMI two times, counted, and archived in 1 ml Kryo safe medium I (c.c.pro, Oberdorla, GER) per tube.
Protein analysis by immunofluorescence and ELISA. Human serum albumin (HSA) levels in human serum were measured using the human Albumin ELISA quantitation kit (Bethyl Laboratories, Biomol GmbH, Hamburg, GER) according to the manufacturer’s instructions. Alpha Feto protein (AFP) levels were detected using the human alpha Fetoprotein Elisa Kit (R&D Systems, Minneapolis, USA) according to the manufacturer’s instructions.
Flow cytometry characterization of isolated HCC-cells. Isolated human HCC-cells derived from fresh human liver cancer tissue as well as from murine livers after injection of primary tumor cells were characterized using the following monoclonal antibodies (also see
Supplementary Figure S5 for the strategy): anti-CD13, anti-CD133-1, anti-CD24, anti-epithelial cell adhesion molecule (EpCAM), anti-human leukocyte antigen G (HLA-G), anti-CD90, anti-CD73, anti-CD105, anti-CD44 and anti-CD45, conjugated with phycoerythrin (PE), PE-Vio 615, PE-Vio 770, APC and APC-Vio 770. Cells were stained in 1x DPBS containing 0.5% bovine serum albumin fraction (BSA, pH 7, GE Healthcare, Pasching, GER) and 0.05% sodium azide NaN
3 (Sigma, Steinheim, GER). The staining was divided into five antibody panels to avoid overlapping emission spectra. Each panel requires 1x10
4 cells. Positive cells were distinguished from negative cells using unstained samples. Live/dead staining was performed in advance in 1x DPBS (Gibco, Paisley, GB) using Viability Dye 405/520 Fixable Dye according to the manufacturer’s specifications. FACS measurement was carried out on the MACSQuant® Analyzer 10 Flow Cytometer. All antibodies, Viability Dye, and Flow cytometer were received from Miltenyi Biotech (Bergisch Gladbach, GER).
Generation, Breeding, and Housing of immunodeficient mice. In this study, we employed parental female and male mice with transgenic NOD.Cg.Prkdcscid Il2rgtm1Wjl/SzJ background (Strain #:005557) from Jax Laboratory. Parental females and males were used to develop a breeding colony within the LIV animal facility in Hamburg. Mice individuals were employed for the study at a starting age of 12 weeks. After xenotransplantation, mice were daily visited. Weight was measured three times a week. The individual mice were marked and identifiable using ear punches or tail marks. Mice were housed in individually ventilated cages (IVC) to exclude infection or transmission of infectious diseases. IVCs were changed as described in the standard operation protocol of animal husbandry.
Surgery, recovery phase, and observation of mice. To achieve this study’s goal, we employed three animals for the initial transplantation of fresh or frozen human tumour cells for each tumour or cell line. The mice were anesthetized with isoflurane in all subsequent preparatory and surgical procedures. In the first step, the animal was injected subcutaneously with the painkiller metamizole (200 mg/kg). In the next step, a hair trimmer removed the abdominal hair from the animals. The shaved abdomen was then cleaned and disinfected with Betadine. This first cleaning took place away from the operating table. After the onset of action of the painkiller metamizole (20-30 min), the animal ws now fixed on the operating table, and the abdomen was cleaned and disinfected two more times with Betadine. The operating table was tempered at 37°C to prevent the animals from cooling. A laparotomy was performed along the midline over 1-2 cm. After imaging the left lateral lobe of the liver, intrahepatic injection of the tumor cells followed. The cell solution (0,5-1x10⁶ HCC tumor cells dissolved in sterile Matrigel) was applied in a standardized volume of 20 µl utilizing a very thin injection cannula (30 gauge, 0.3 mm). Possible bleeding was quenched by absorbable hemostatic. After closure of the muscles using a non-resorbable filament and skin using two clips, the mouse was separated from the isoflurane anesthesia and was transferred to a conventional cage. Postoperatively, mice received carprofen (5 mg/kg subcutaneously) every 24 hours for 72 hours. The painkiller was stopped after 72 hours. Subsequently, the mice were examined 1-3 times daily to detect possible pathological changes. Pathological criteria included anemia (inspection of tail color), signs of local infection, splenomegaly (palpation), weight loss (weighing two times a week), as well as apathy and motor deficits (for example, sluggishness or pulling a limb).
HCCcell culture. Immortalized HUH-7, Hep3B, and HepG2H1.3 cells were maintained as described previously [
17,
18]. Isolated primary and mouse-derived human cancer cells were passaged in Advanced DMEM/F-12 with non-essential amino acids and 110 mg/l sodium pyruvate, supplemented with 1% penicillin-streptomycin (P/S), 2% glutamine, 20% FetalCloneTM II Serum (all received from Thermo Fisher Scientific, Waltham, USA) and 10 ng/ml human EGF (Miltenyi Biotech, Bergisch Gladbach, Germany) after forming a monolayer of 70% - 80% density. Immortalized cell lines were cultured in DMEM containing L-glutamine and glucose, supplemented with 1% P/S, 10% Gibco fetal bovine serum (FBS; all from Thermo Fisher Scientific, Waltham, USA). Cell lines were detached in Detachin™ Cell Detachment Solution (AMSBIO, Abingdon, England) and cultured in a humidified atmosphere at 37°C and 5% CO
2.
Stable integration of LeGO-iG2-Puro+-Luc2 construct by Lentiviral transduction. To use bioluminescence imaging, luciferase (Luc,
Photinus pyralis) expressing tumor cells were generated. For this purpose, lentiviral transduction was performed. The vector LeGO-iG2-Puro+-Luc2 (3rd generation HIV1-derived self-inactivating vector) [
19,
20] was used, expressing luciferase under control of the ubiquitous SFFV-promoter linked by an internal ribosome entry signal (IRES) to a fusion protein consisting of eGFP, a 2A peptide and puromycin N-acetyl-transferase leading to resistance to puromycin. Primary HCC cell lines and immortalized HCC cells were stably transduced with this vector. For lentiviral transduction, 3x10
5 cells per well of indicated tumor cell lines were plated in 6 well plates. After 24 hours, viral particles were added to gain a multiplicity of infection (MOI) of 10 and 100. The transduced tumor cells were selected by adding 0.5 µg/ml puromycin to the appropriate regular culture medium. Transduction efficiency was verified via eGFP fluorescence signal using flow cytometry.
In-vivo-imaging of mice by determining luminescence signal. Monitoring tumor growth started one week after transplantation and was assessed using bioluminescence after intraperitoneal injection of D-luciferin (30 mg/mL). After induction of general anesthesia, D-luciferin was injected accordingly to the weight of the mouse (150 mg/kg), and mice were imaged after 9 min with an IVIS-200 imaging system (PerkinElmer, Waltham, MA, USA). Post-processing and quantification of the emitted photons was performed using the Living Image software package (PerkinElmer, Waltham, MA, USA). For each mouse, a quadratic region of interest (ROI) encompassing the primary tumor was selected, and the luminescence in each ROI was acquired in total flux (p/s).
Protein analysis by Western Blot. For protein extraction, cell pellets were incubated in RIPA buffer (solved in Aqua dest; 65mM Trism base, 1% Nonidet P40, 154mM NaCl, 0.1% Sodium dodecyl sulfate SDS, 1 mM EDTA) and 1x Protein inhibitor cocktail (PIC, Merck KGaA, Darmstadt, GER) on ice, for 30 min. Samples were then centrifuged at 14000 RPM, 4°C, for 30 min. The BCA Protein Assay Kit (Thermo Scientific, Rockford, IL, USA) was used to determine protein concentrations in the supernatants. Proteins were diluted to 30 ng/ml with NuPAGE LDS sample buffer 4x (Thermo Fisher Scientific, Waltham, MA USA) and RIPA + 1xPIC. Denaturation took place at 75°C for 10 min. Protein separation by SDS-PAGE using NuPAGE 4-12% Bis-Tris gels and XCell SureLock Mini Cell, as well as the transfer to PVDF membranes through the iBlot™ 2 Dry Blotting System, was carried out according to the manufacturer’s instructions (Thermo Fischer Scientific, Newport, UK). Separation required 130 V for 1 hour and 50 min. PVDF membranes were probed with specific antibodies and detected by enhanced chemiluminescence (SuperSignal™ West Pico PLUS, Thermo Scientific, Waltham, MA, USA). The specific antibodies used were TP53 antibody (FL-393) HRP (sc-6243; Santa Cruz, Dallas, TX, USA) and GAPDH loading control monoclonal antibody (GA1R) HRP (#MA5-15738-HRP; Thermo Fischer Scientific, Newport, UK).
Protein analysis by immunofluorescence. For histological characterization, 10.000 cells were seeded into 96-well plates and were allowed to reach 80% confluence, when they were washed with 1x PBS and fixe with 4%PFA for 10 min. After fixation, cells were used for single immunofluorescence staining against indicated proteins using primary antibodies, as in
Supplementary Table S1. Specific signals were visualized with Alexa 488 or 555 labeled secondary antibodies (Invitrogen, Darmstadt, GER). Nuclear staining was achieved by Hoechst 33258 (Invitrogen, Eugene, USA). Stained cells were analyzed by fluorescence microscopy (BZ-9000 and BX-780, Keyence, Osaka, Japan). Captures were automatically generated with the same magnification and exposure for the same stainings for all cell lines.
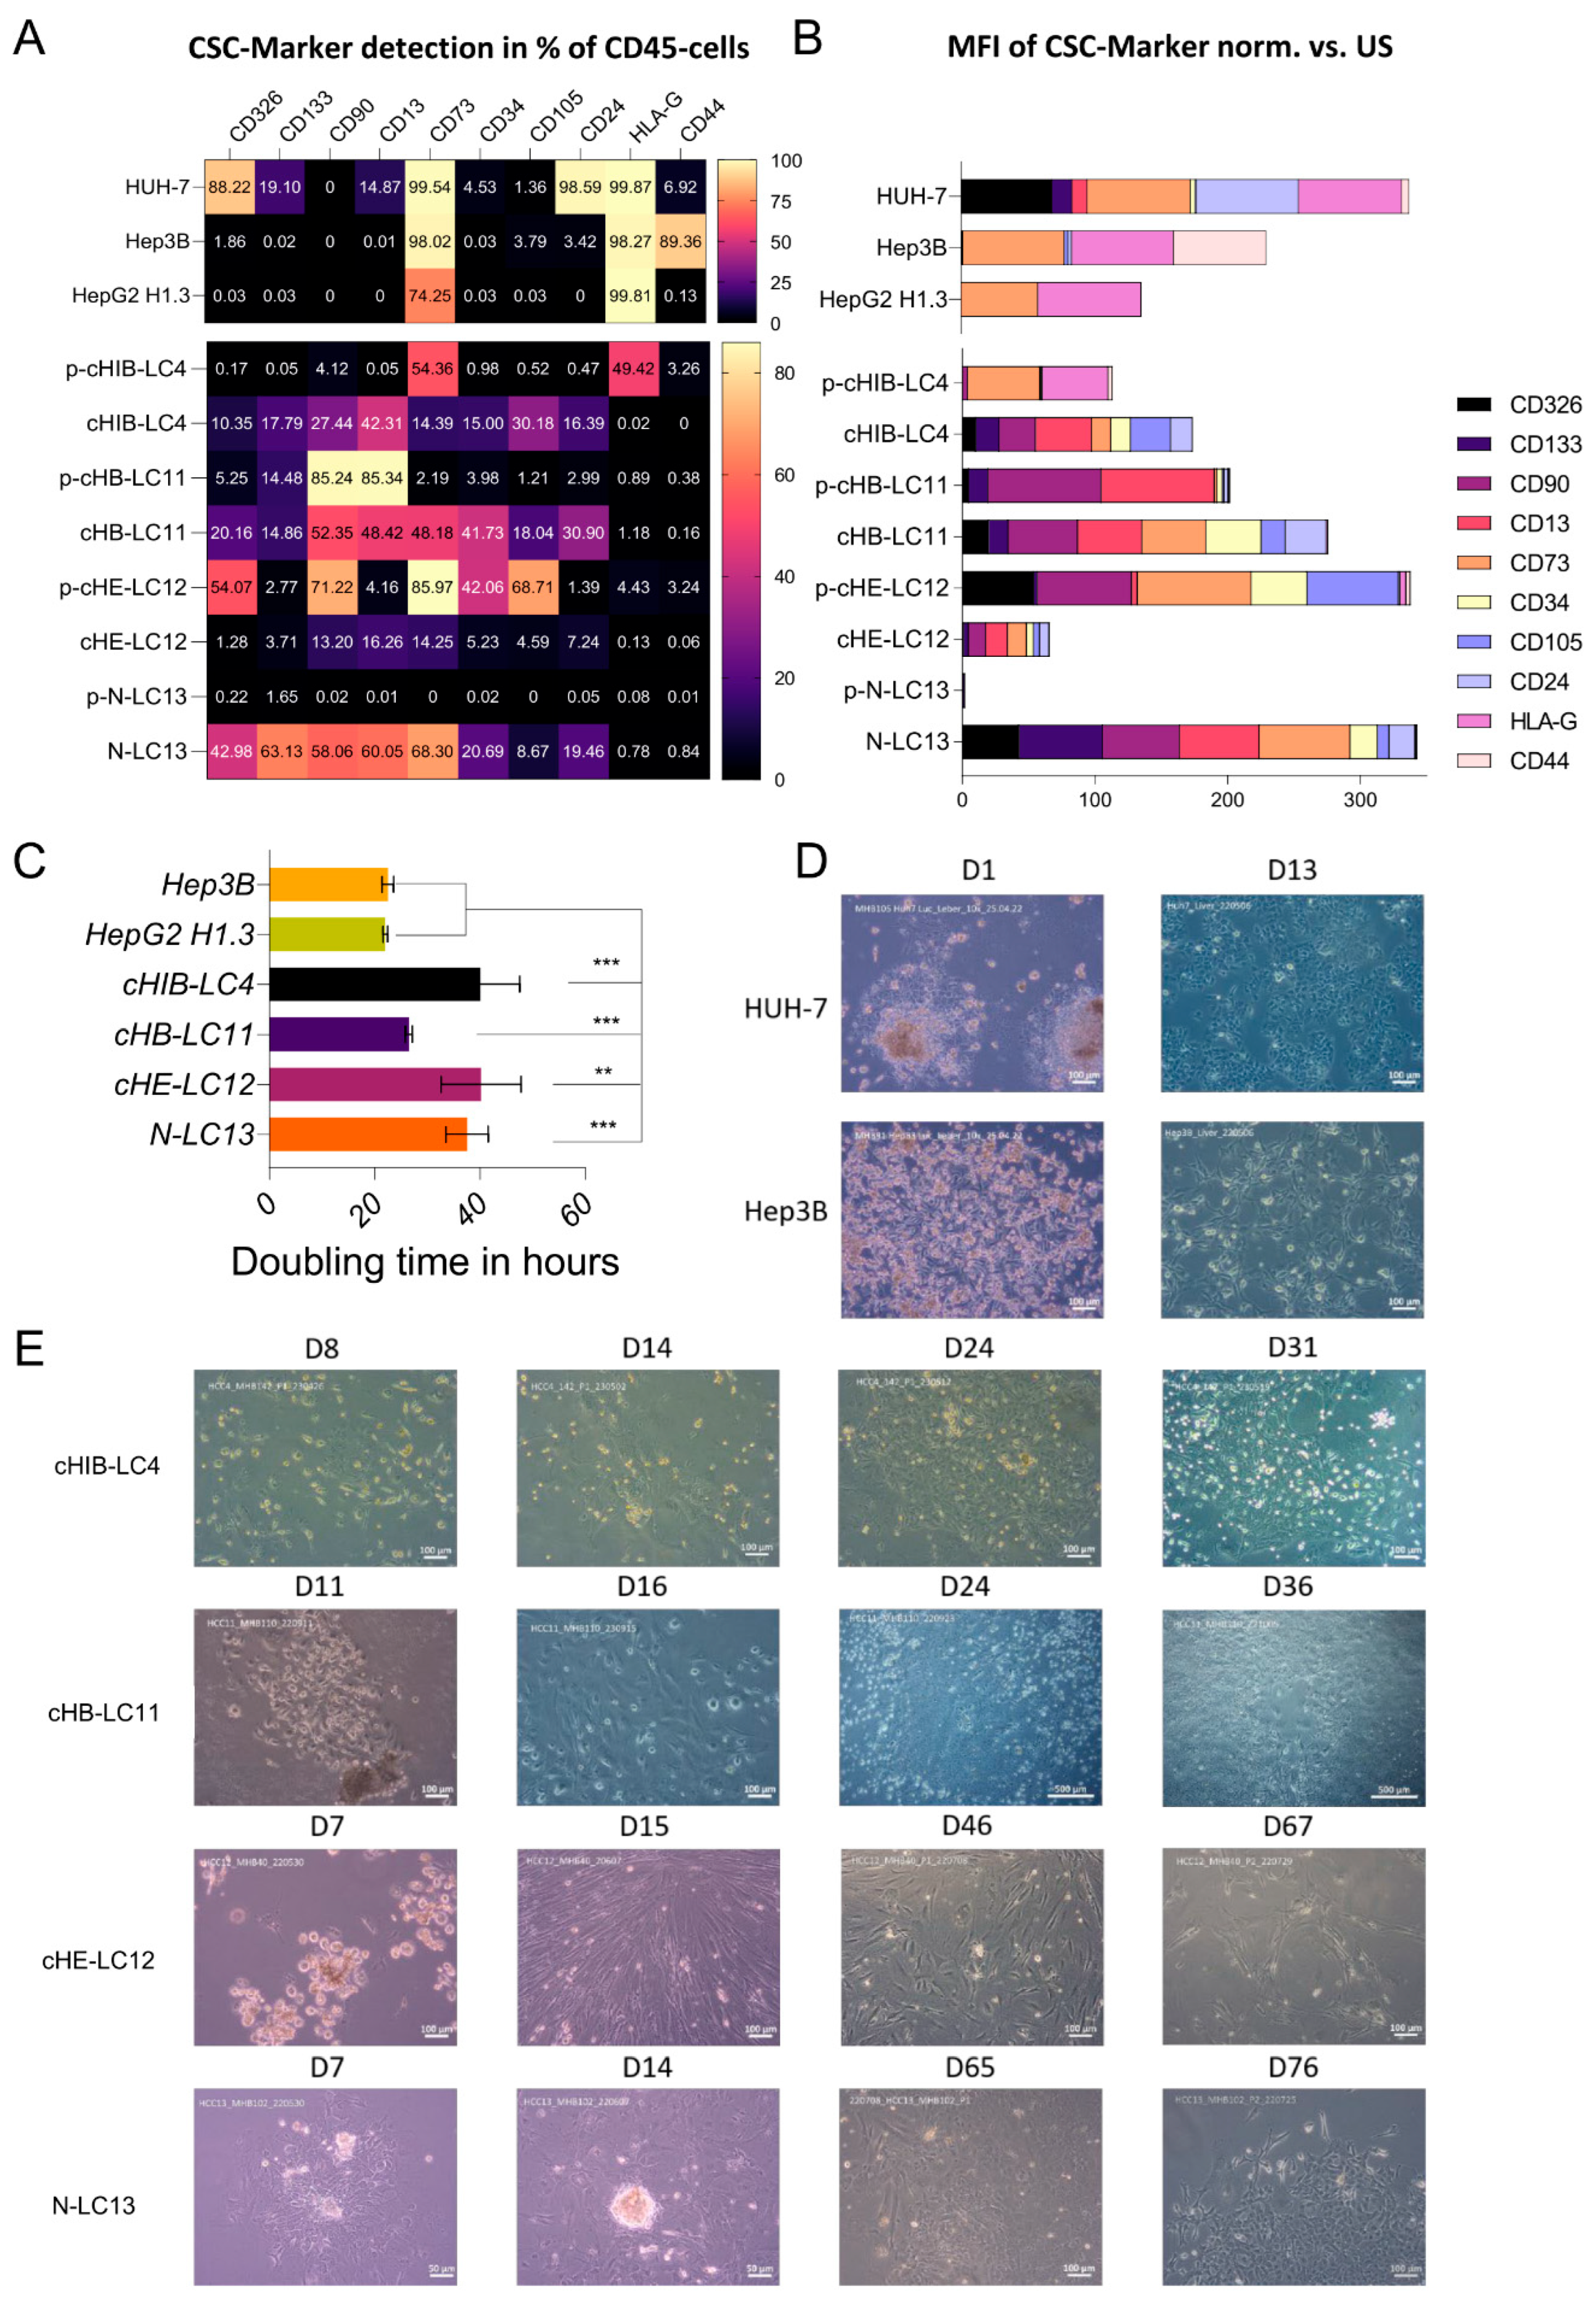
Doubling time Assay. For cell doubling xCELLigence RTCA SP device (ACEA Biosciences) was measured by seeding 10.000 cells into a E-Plate 16 (16-well plate) and allow them to grow for 72h in HCC culture medium (pHCC cell lines) or in DEMEM (Huh-7, HepG2H1.3, Hep3B). Doubling time was calculated from 5 technical replicates and by the usage of the Xcelligence RTCA Software for real-time data analysis [
21].
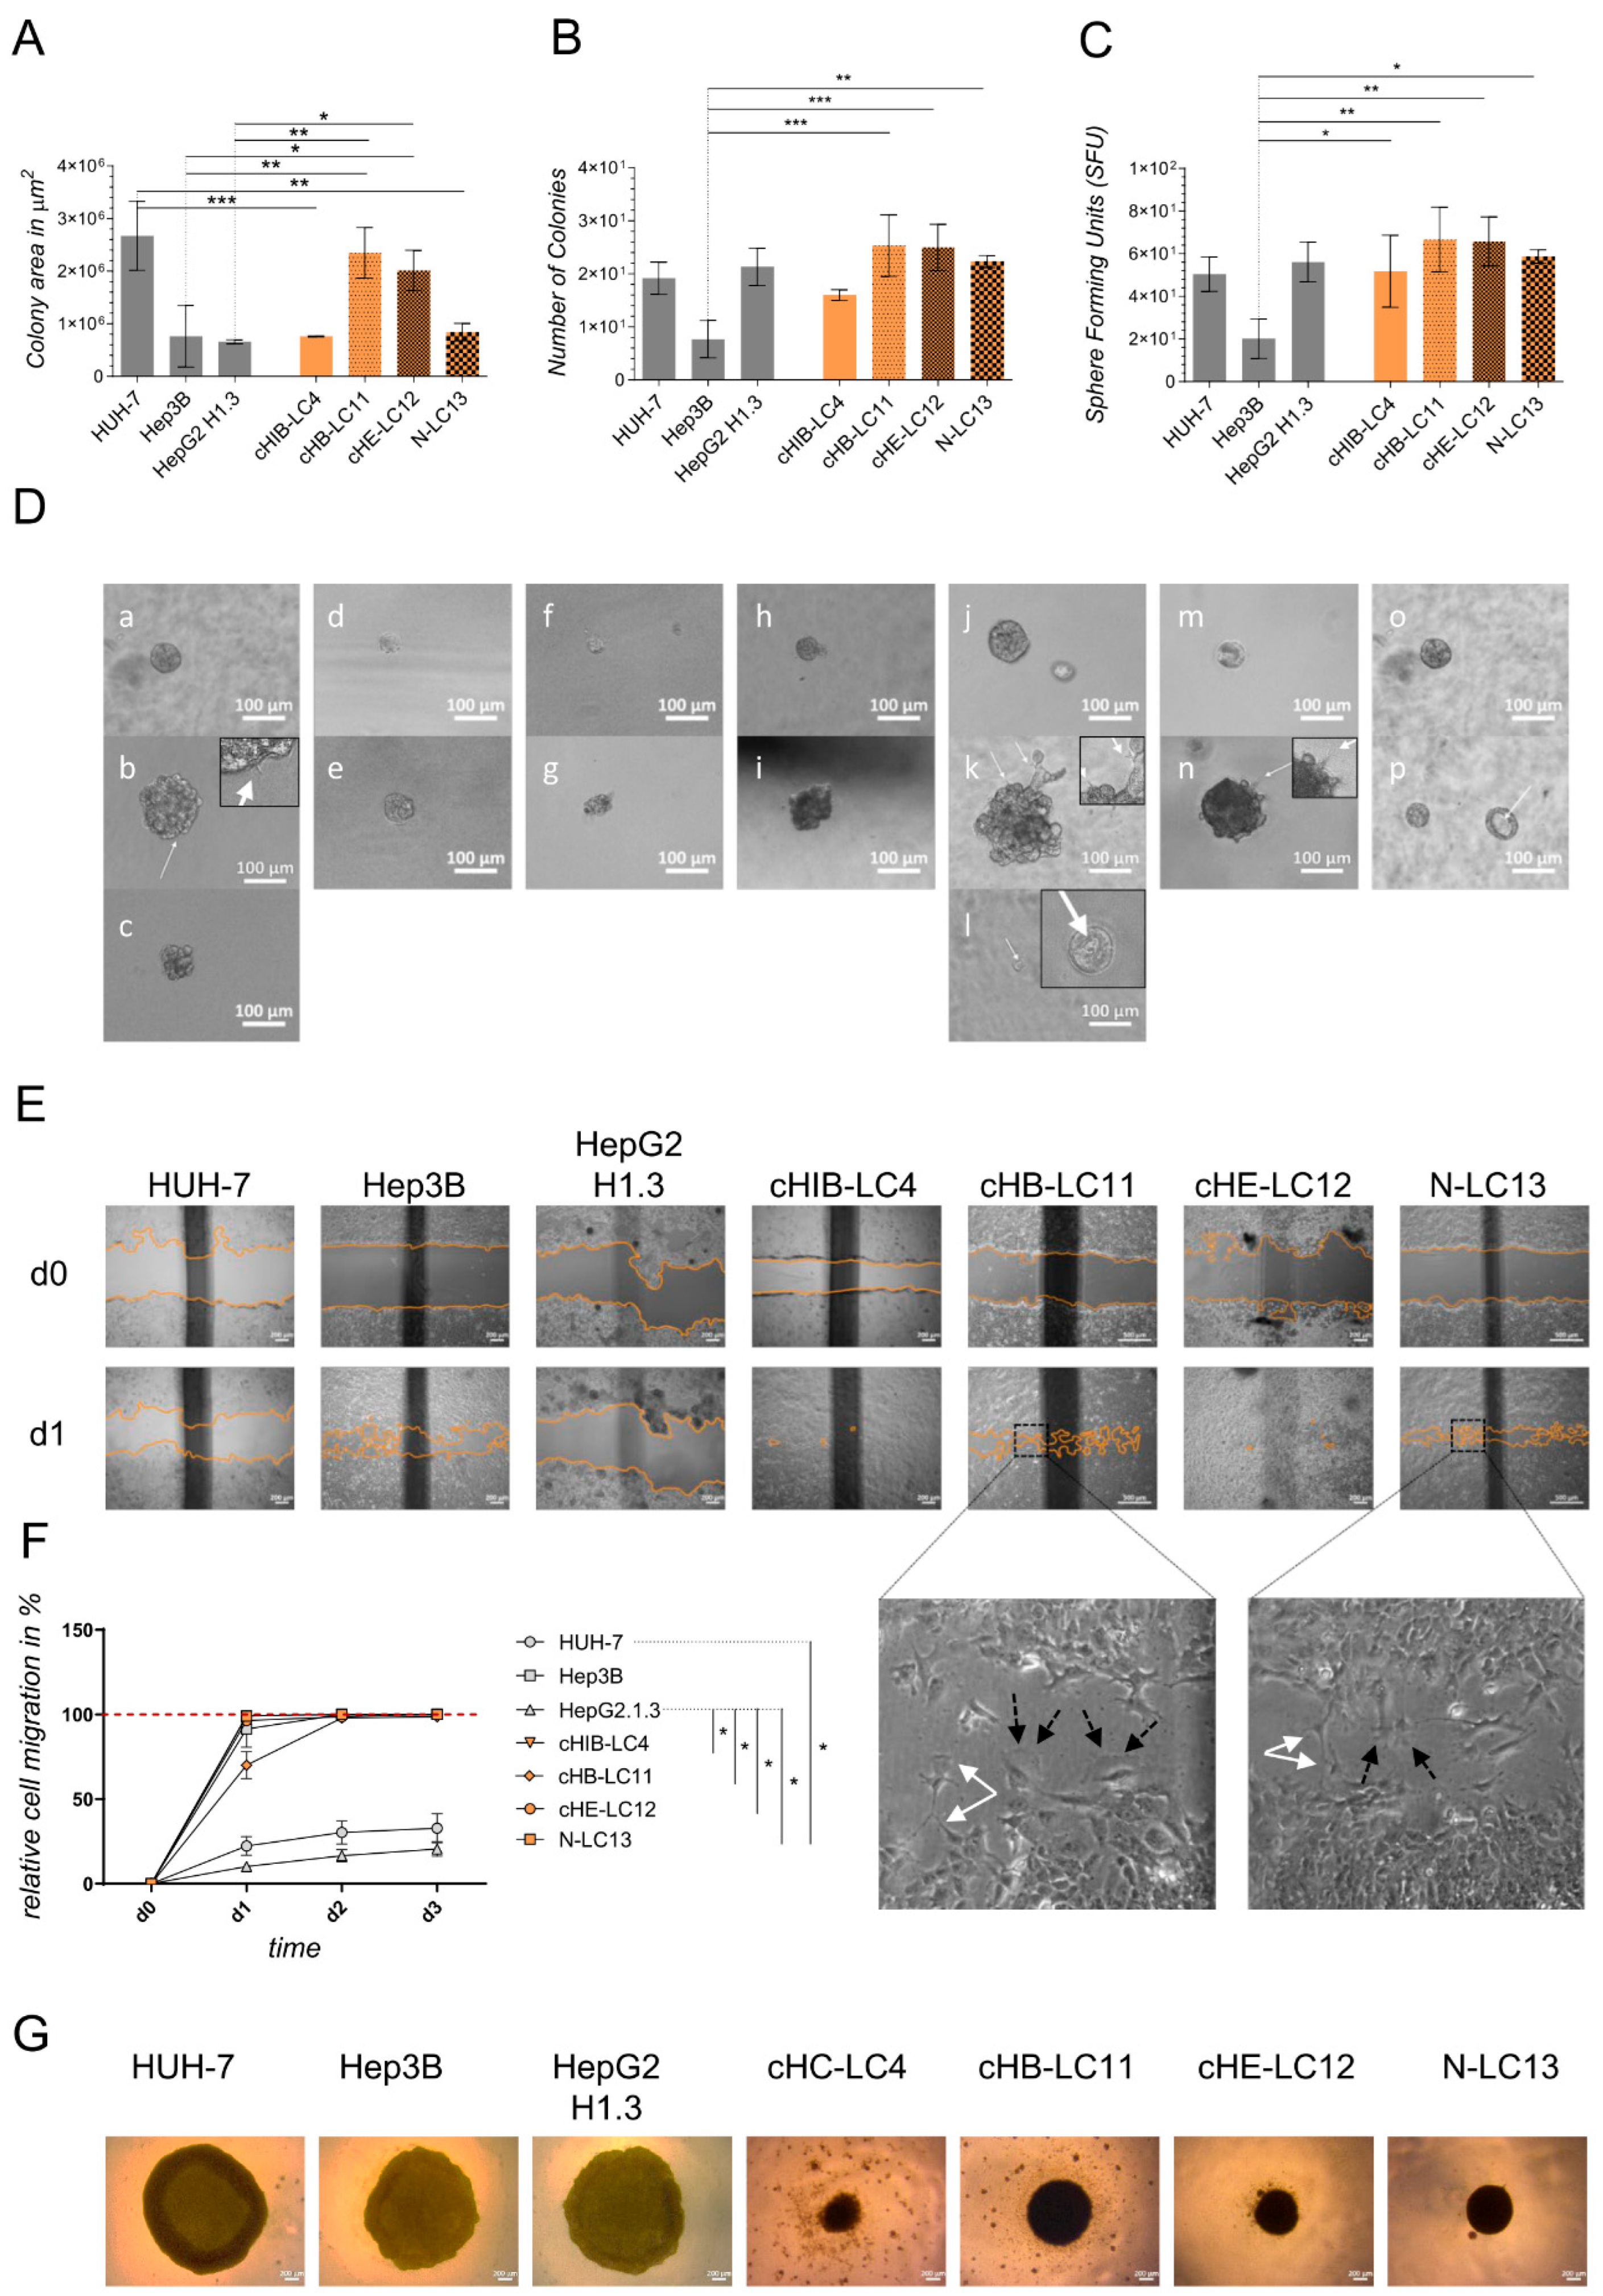
Colony-formation assay in Matrigel. Cell proliferation was evaluated by average size and number of 3D tumor colonies under anchorage-independent growth conditions in 5 mg/ml Matrigel (MG; Corning Incorporated, NY, USA). Therefore, as explained above, a 96-well plate (Sarstedt AG & Co. KG, Nümbrecht, GER) was coated with MG diluted in the appropriated culture medium. After solidifying at 37°C, the upper layer of an MG-cell-suspension (38 cells/well, in a final volume of 53µl cell-MG-suspension each well) was plated as described above. The plate was then incubated for 45 minutes at 37°C and finally augmented with the adequate culture medium. The colony formation took 11 days of incubation at 37°C and 5% CO2. A change in the medium was performed after 7 days. For the evaluation of colony number and surface area, images were captured using Zeiss Axiovert 35 and Zeiss Axiocam ERc 5s (Carl Zeiss Ag, Jena, GER) of colony number and surface area. ZEISS ZEN lite software (Carl Zeiss Microscopy, Oberkochen, GER) was used to photograph the colonies at 10x magnification. The colony area was determined in µm2 by ImageJ 1.53 (NIH, NY, USA).
Colony-formation on PolyHema. To investigate the colony-forming properties of indicated cells lines, a round-bottomed 96-well plate was coated with 12 mg/ml PolyHema (Poly (2-hydroxyethyl methacrylate; Sigma, St. Louis, MO, USA) dissolved in 95% EtOH (Chemsolute, Renningen, GER). 1x10⁵ cells per well were seeded in the appropriate culture medium (see section Isolation of liver cancer cells) and centrifuged at 100x g for 5 min. Cells were incubated in a humidified atmosphere at 37°C and 5% CO2 for 10 days. Colony morphology was recorded by taking images (see section above). Medium change was performed as required.
Migration Assay. 3.5x10⁵ cells of indicated cell lines and primary-like cell lines were seeded into 12-well plates (Thermo Fisher Scientific, Waltham, USA) and allowed to grow until confluency. Cells at confluence were scraped off, creating a thin cell-free area using a sterile 200 µl pipet tip. After scratching, the medium was renewed, excluding detached cells from the culture. To analyze the migration of the cells, a reference image centered on the scratch was taken from each well (see section above). The images were acquired using a 10x magnification every 24 h for 4 days, including day 0 (the day of the scratch) or until gap closure, repectively. Between observations, the culture plates were incubated in a humidified atmosphere at 37°C and 5% CO2 in an incubator. Using the image processing software ImageJ 1.53 (NIH, NY, USA), the gap surface of 3 to 4 wells was determined in µm2 and finally specified in relative migration in %.
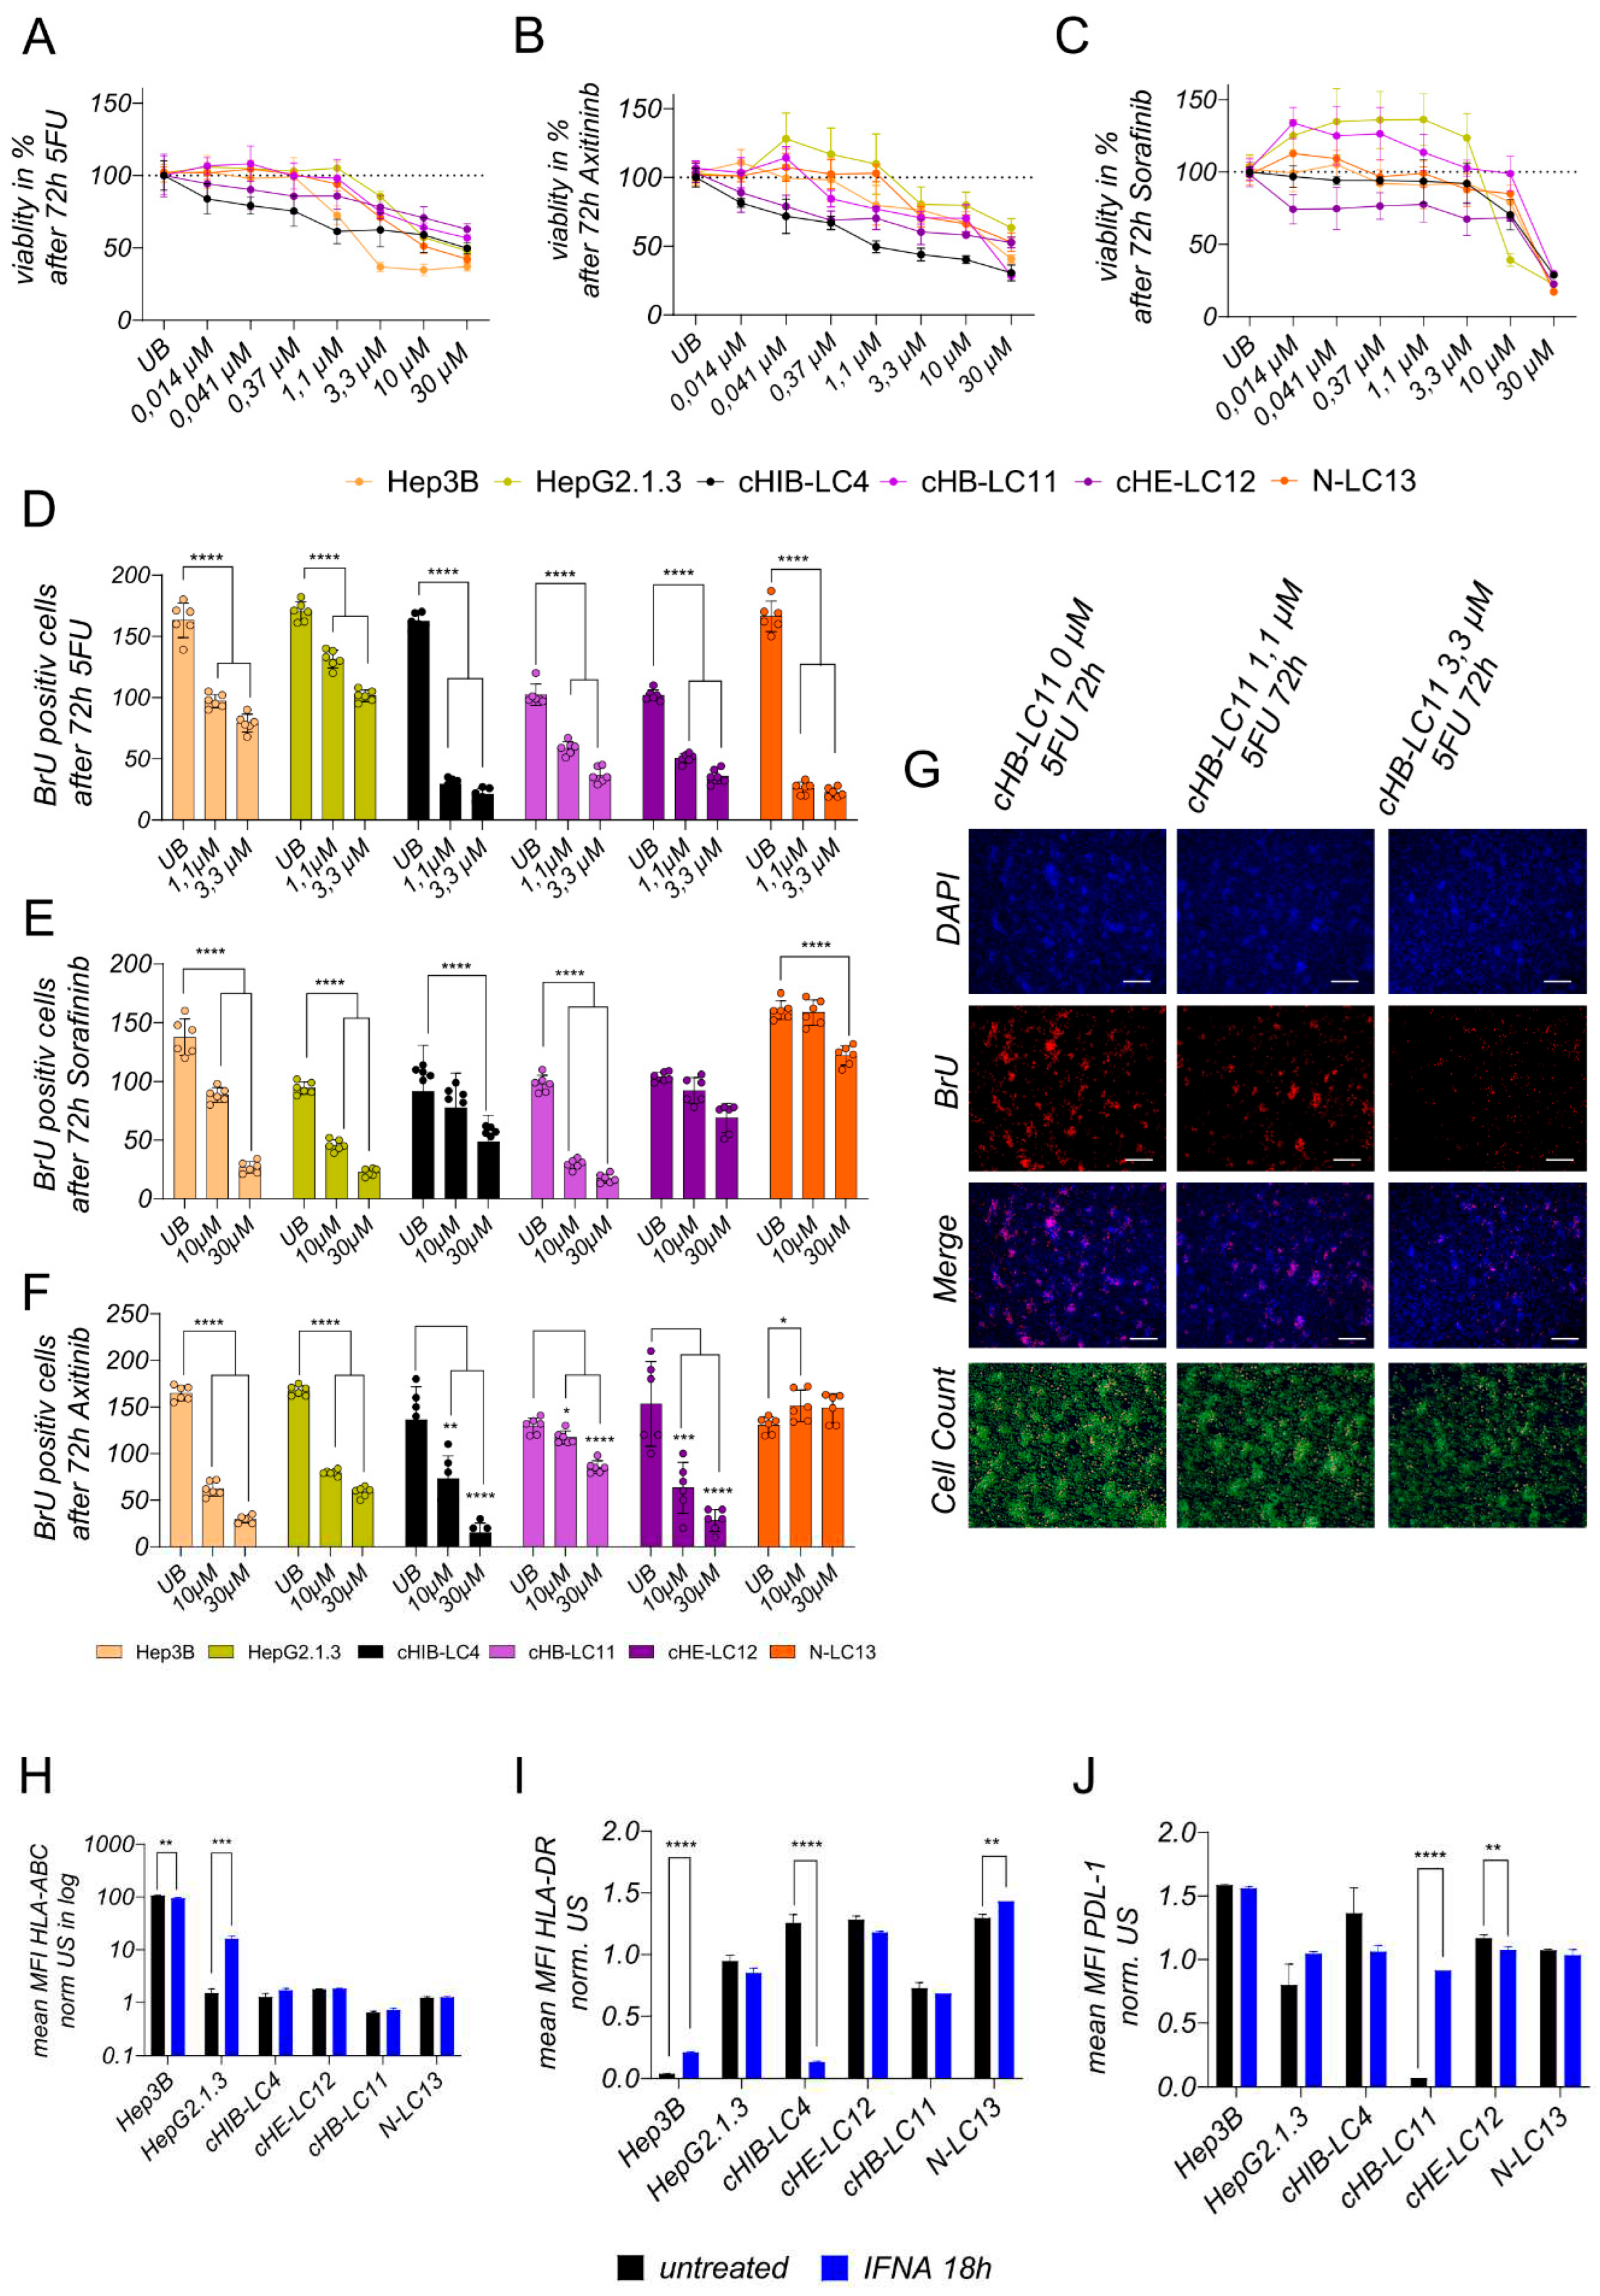
Treatment experiments. For toxicity experiments, 10.000 cells were seeded per well of a 96-well E-Plate; after 24h, cells were treated for 72h with chemotherapeutic 5-FU or kinase inhibitors Sorafenib and Axitinib using indicated concentrations ranking from 30 µM to 0,014 µM. For BrU-based proliferation assays to access the effects of the treatment on newly synthesized DNA, 100.000 cells were seeded into 24-well plates and were treated with effective or highest concentrations of 5-FU (0,1 µM-0,3 µM), Sorafininb (10 µM–30 µM) or Axitininb (10 µM-30 µM) after 24 h, for 72 h. For Protein and gene expression analysis, 150.000 cells were seeded into 24-well plates and were incubated with interferon-alpha (100 IU/ml) after 24 h for 18 h.
Analysis of toxicity level after treatment. Cell viability was measured after 72h of incubation with 5-FU, Sorafininb, or Axitinib using (3-4, 5-Dimethylthiazol-2-yl)-2, 5-diphenyltetrazolium bromide (MTT; Invitrogen) according to the manufacturer’s instructions.
Analysis of proliferation level after treatment. Newly synthesized DNA was detected using the Click-iT EDU Imaging Kit Alexa Fluor 555 (Invitrogen) according to the manufacturer’s instructions. Previously, 100.000 cells were seeded per well of a 24-well plate. After 24 h, the cells were treated with indicated substances at indicated concentrations for 72 h. Twelve analysis fields were captured and counted out of two wells using the same conditions. Representative output data is shown in
Supplementary Figure S4AC.
Analysis of Surface Marker alternation after treatment. Treated cells were characterized using the following monoclonal antibodies: anti-HLA-ABC (Invitrogen, Waltham, USA), anti-PD-L1 (Becton Dickinson, Franklin Lakes, USA), anti-HLA-DR (Becton Dickinson, Franklin Lakes, USA), conjugated with PE, Brilliant Violet 421. The staining was divided into two panels to avoid overlapping of emission spectra. Positive cells were distinguished from negative cells using unstained samples. FACS measurement was performed on the BD FACSCelesta Cell Analyzer.
Isolation of Oligonucleotides. RNA was extracted from human liver specimens using the RNeasy Mini RNA purification kit (Qiagen) [
22]. RNA was extracted from seeded cells with or without treatment after indicated time points using the RNeasy RNA Micro purification kit (Qiagen).
Measurement of gene expression level. For measurement of gene- expression, 2-step PCR was performed. Therefore, cDNA synthesis was conducted by using MMLV Reverse Transcriptase 1st-Strand cDNA Synthesis Kit (Lucigen, Middleton, Wisconsin, USA) to synthesize RNA complementary DNA, according to the manufacturer’s instructions. Human-specific primers from the TaqMan Gene Expression Assay System were used to determine gene expression levels (Life Technologies, Carlsbad, California, USA). Samples were analyzed with the Quant Studio 7 Real-Time PCR System (Life Technologies, Carlsbad, California, USA). The mean of the human housekeeping genes GAPDH and ribosomal protein L30 was used to normalize human gene expression levels.
Statistics. For graph design and statistical analysis, the analysis software graph pad prims version 9 (GraphPad Software, Inc., La Jolla, USA) was used. Doubling time comparison shown in
Figure 2F, treatment comparison shown in
Figure 5D–F were performed using one-way ANOVA analysis followed by Multiple Comparison Test against immortalized cell lines or untreated control. Plotted bar charts represent mean ± SD of technical triplicates (
Figure 2F) or technical multiple replicates (
Figure 5D–F). TP53 expression comparison (
Figure 3D) and treatment comparison for INF alpha, plotted in
Figure 5H–J was analyzed was analyzed using a two-tailed unpaired t-test and 3 technical replicates. Statistical comparison of more than two groups of biological triplicates was calculated using one-way ANOVA and post hoc Tukey’s Multiple Comparison Test and plotted in
Figure 4A–C,F. Statistical outputs are indicated in the figure legends; p-values were plotted in the graph *p < 0.05; **p ≤ 0.01 and ***p ≤ 0.001, ****p ≤ 0.0001.
4. Discussion
Hepatocellular carcinoma is a highly prevalent malignancy and is a common cause of cancer-related mortality. It’s estimated that by 2025, more than 1 million patients will develop liver cancer annually. The hepatitis virus infection is the leading cause in approximately 50% of HCC cases, whereas currently, non-alcohol-related steatohepatitis (NASH) is rapidly becoming a growing etiological concern. Most patients with a developed HCC are diagnosed when reaching the advanced disease stage and are therefore lacking effective treatment options. Consequently, novel molecular biomarkers are needed to predict tumour therapy and evaluate prognosis.
On the other hand, we need relevant pre-clinical models to give novel drug candidates access to clinical studies and approvals. In liver cancer research, human-derived immortalized HCC cell lines like Hep3B and HUH-7 have a long history in pre-clinical testing strategies and played, therefore, a remarkable role by leading to a better understanding of tumour biology and supporting the development of new drugs [
13,
29,
30]. These cell lines’ advantages are their easy handling, robustness [
31], and almost gapless understanding of their genomic, transcriptomic and proteomic landscape. However, due to their genetic alterations, altered growth rates and adapted metabolic pathways, immortalized cell lines deviate significantly from the characteristics of the patient-derived cells [
32].
As a result, these cell lines lost the ability to accurately mimic the clinical context, which leads to a reduced capacity for providing comprehensive insights into drug efficacy or the underlying mechanisms. Here, individual liver cancer material from patients can provide more accurate and substantiated results regarding drug efficacy [
33]. The material can be used in fresh culture or xenotransplantation in immunosuppressed mice to preserve the patient’s imprint. Fresh tumour tissue culture can be maintained over a short period
in vitro. However, it cannot be used for repeatable comparative studies of different therapeutic approaches [
11], as in vivo xenograft models cannot be used for pre-screenings due to cost and ethical reasons. The only reasonable and affordable way to solve this problem is to generate a combined workflow for in vivo and in vitro cultivation of the primary liver cancer cells. In this regard, we established a complete isolation and cultivating workflow for patient derived HCCs to facilitate a long-term cultivation of viable individual liver cancer cells and associated cells.
A total of 15 resections were processed for this study and used for the advanced protocol. Our study revealed that 64% of the isolated samples exhibited the capability for short-term 2D cultivation, which displayed a higher success rate than others [
15,
34,
35]. Due to their underlying clinical parameters, patients 4, 11, 12 and 13 have been chosen to generate patient-derived liver cancer cell lines. Therefore, they were employed for orthotopic transplantation into the liver of immune-deficient NSG mice. Remarkably, all four transplanted samples were suitable for repopulation of the mouse liver and were, moreover, suitable for long-term in vitro cultivation. By conducting the
ex-vivo cultivation, we observed the presence of cancer-associated fibroblasts (CAFs) and cancer stem cells (CSCs). As supported by previous studies, CAF, or tumour-associated fibroblasts, exhibit high versatility within the tumour environment [
36]. Their presence and interactions are believed to contribute significantly to the overall behaviour and characteristics of the cultured cells [
37]. In line with others, we observed that CAFs play a critical role in the formation and adaptation processes within 2D culture [
38]. After the initial formation of CAF assemblies, the process of forming individual colonies, including liver cancer cells, takes place, finally allowing the development of a monolayer. This transition from cell assemblies to a monolayer structure represents a crucial stage in the cultivation process, as it establishes a more organized and cohesive cellular arrangement. Besides their general ability of cell cluster formation and migration, the generated liver cancer cell lines exhibited individual highly heterogeneous characteristics.
The comparison of CSC marker presentation in the isolated cell fractions from the patient- and mouse material reveals both the induction of diversity and the elevated percentage of CSC-specific markers in three out of four samples after repopulation of the mouse liver. In sample number four (cHE-LC12), at least the carcinogenesis-promoting factor CD13 was upregulated. Considering, that CSCs are providing the ability to self-renewal and differentiation of the liver cancer cells as well as the tumorigenesis, the repopulation and proliferation in the physiological environment of the mouse liver increases the potential to grow in vitro for all four samples. These results point out that liver cancer cells must be at least positive for CD13 and for CD73 to be suitable for in vitro long-term cultivation. The expression of CD73, which is associated with increased aggressiveness and promotion towards metastasis formation [
39], was found to be most prominent in all HCC cell lines and even more pronounced in established HCC cell lines. These findings are consistent with the highly tumorigenic progression observed in xenograft mice. The four liver cancer cell lines exert a different allocation of CSC-specific surface antigens, pointing to their high HCC heterogeneity compared to HepG2.1.3 and Hep3B cells. The high heterogeneity was also obtained by performing the cellular staining of different hepatocyte and cancer cell-specific proteins. All four cancer cell lines were human-specific and showed different cell types. CHB-LC11, cHIB-LC4 and cHE-LC12 are CK19+ HCCs and are therefore interesting since this kind of liver cancer was shown to be chemo-resistance. Liver cancer cell lines displayed a dual phenotype, with characteristics resembling both hepatocytes and cholangiocytes and variations depending on the specific liver cancer cell line. Notably, the NASH-derived N-LC13 line exhibited a predominantly cholangiocyte-like character, while the viral-induced cell lines cHB-LC11, cHIB-LC4, and cHE-LC12 displayed a predominantly hepatocyte-like phenotype. These observations indicate heterogeneity in the differentiation state or lineage commitment of the HCC cell lines, potentially reflecting the diverse cellular subpopulations within the parental tumour. In addition, we identified immunosuppressive characteristics in certain cell lines based on the presence of programmed cell death ligand 1 (PD-L1), albeit in low frequency. Specifically, the virus-induced HCC cell lines cHB-LC11, cHE-LC12, cHIB-LC4, and HepG2H1.3 presented PD-L1 expression, suggesting the potential efficacy of PDL-1 inhibitors. The presence of CD68-positive cells within the liver cancer cell lines was particularly intriguing, as CD68 is known as a marker for cancer-associated macrophages (CAMs) but is also present in other liver-associated cell types, like hepatocytes. Further analysis needs to be performed to understand better the role and potential of the CD68+ population in the generated cell lines. Cancer-associated macrophages (CAMs) have diverse roles in the tumour microenvironment, including immune response modulation, tumour promotion, and angiogenesis [
40]. Thus, it can be estimated that CD68+ cells can be supportive of combined immune therapies, as they were positively related to the infiltration of immune cells in many tumour types [
41].
Comparing the generated liver cancer cell lines to immortalized cell lines, the aggregation and colony-forming assays revealed that liver cancer cell lines tend to form more dense cell aggregates and stronger cell-cell interactions. In contrast, the observed immortalized cell lines require less cell-cell interaction for aggregation. The highest and, therefore, unphysiological expansion was obtained using HUH-7 cells in vitro and in vivo. These results show that HUH-7 cells cannot reflect the clinical stage of tumour progression and, therefore, cannot be used for the xenograft experiments in mice. The cell line Hep3B was not aggressive to that high intent but appeared to form extensive, highly necrotic areas in the liver of NSG mice. In contrast, generated liver cancer cell lines form dense clusters in the provided matrices. Therefore, they can be used to mimic the clinical level of progression, as confirmed by orthotopic transplantation experiments.
The general ability of generated liver cancer cell lines regarding their treatment-related response points out, that all four lines are suitable to maintain pre-screening experiments for therapy options in viral-induced and NASH-related HCCs. They reveal differences in the response and non-response to different drugs and, therefore can be used also for combination therapy investigations. Moreover, as they exhibit less aggressive but dense formations in the mouse liver environment, they can be used at the same time to evaluate therapy options in vivo in xenografted NSG mice rather than immortalized cell lines.
A suitable prediction of a combined effective therapy would be the combination of a PDL-1 inhibitor with IFN alpha in cHB-LC11 cells. In the cHB-LC11 xenograft model, engineered effector T-cells with integrated PDL-1 inhibitory signals can be used to facilitate a solid anti-tumor effect.
Taken together, we demonstrated in this study an approach to generate individual liver cancer cell lines that exhibit heterogeneous presentation of cancer stem cells, primary cancer cell characteristics, the potential and ability to form tumours in a clinically relevant manner in vitro and
in vivo, and can be maintained for treatment experiments, in vitro and
in vivo. Therefore, the impact of the study lies in the possibility of studying individual HCC cell lines generated from patient material extensively in vitro before the same individual cells can be used for in vivo evaluation of the findings. In regard to immune therapies, which will not be standalone therapies, the investigation of combinations with common or new drugs will be the future [
42,
43,
44,
45]. Therefore, both the in vitro and the in vivo examination are possibly conducted in the same cells.
