1. Introduction
Magnetic Resonance Imaging (MRI) is a prevalent technique in modern medical diagnostics. It offers clear and stable imaging, non-invasiveness, absence of ionizing radiation, high tissue contrast, and high resolution [
1]. However, traditional MRI is not without its limitations, including prolonged scanning times, leading to decreased patient throughput and suboptimal patient experience [
2]. Such constraints hinder the widespread use and further development of MRI equipment. Particularly, during 3D MRI scans, capturing a full 3D k-space data under inherent physical constraints is time-consuming [
3]. Undersampling the k-space data and reconstructing images from the subsampled data are crucial for fast MRI. Thus, accelerating the 3D MRI process is both urgent and challenging.
Existing fast MRI techniques can be broadly categorized into parallel imaging (PI) [
4]and compressed sensing (CS) [
5]. The former captures multiple anatomical views simultaneously, while the latter collects fewer samples than traditional methods. Parallel imaging utilizes phased-array coils to reduce measurements required for image reconstruction, thereby shortening the scan duration. In contrast, compressed sensing leverages the sparsity or compressibility of MRI data to achieve high-quality reconstructions with fewer samples, enabling faster imaging at reduced costs. Yet, these approaches have their limitations: PI is constrained by its reliance on spatially variant coil sensitivities, which limits the exploitation of data correlations [
4], while CS depends on the sparsity of data, becoming less effective at higher acceleration rates [
5]. Consequently, both techniques face challenges in efficiently handling high acceleration factors due to these inherent limitations.
MRI measurements represent spatial frequency transformation coefficients, also known as k-space. Images are computed by applying the inverse Fourier transform that maps k-space data to the spatial domain. Medical images typically exhibit significant spatial regularities. For instance, intensity values change smoothly in space, barring a few boundary voxels. This regularity induces redundancy in k-space, providing opportunities for sub-Nyquist sampling [
6]. Several Cartesian and non-Cartesian undersampling patterns have been proposed and were widely applied in practice, such as standard random uniform, radial, Poisson, or equispaced Cartesian undersampling schemes. These k-space undersampling strategies speed up the MRI process.
Image reconstruction algorithms play an indispensable role in fast MRI. These algorithms aim to reconstruct images from undersampled k-space data. Many solutions have been proposed to address the inverse problem of recovering full k-space data from undersampled measurements. These can be broadly classified into traditional optimization algorithms and deep learning-based methods. Traditional algorithms deploy mathematical techniques, like compressed sensing and iterative reconstruction, to harness the sparsity or structure of MRI data and recover lost information. Classic techniques like SENSE [
7], SMASH [
8], and GRAPPA [
9] exploit correlations between k-space priors and imaging system sampling properties. Other methods include nonlinear optimization based on low-rank [
10] and total variation [
11]. While these traditional algorithms are mature and commercially implemented, they have limitations due to insufficient, inflexible priors and somewhat longer reconstruction times due to iterative computation [
12].
In recent years, deep learning-based methods have emerged as promising alternatives for MRI reconstruction. Leveraging the potent representational capacity of deep neural networks, these methods directly learn the mapping between undersampled k-space data and the corresponding image. Trained on vast datasets, deep learning models can capture complex image priors and produce high-fidelity reconstructions. End-to-end deep learning techniques excel at noise and artifact removal, with many methodologies based on GAN networks [
13], RNN networks [
14], and U-Net [
15]. These models train on data to learn the mapping of sampled k-space measurements to image domain reconstructions. The aforementioned machine learning-based methods are typically optimized for given undersampling patterns. There are also techniques that optimize undersampling patterns for specified reconstruction methods. Reconstruction model performance largely depends on the undersampling pattern, making a good pattern pivotal in MRI tasks.
In this paper, for 3D MRI tasks, we address the challenge of time-consuming data acquisition by focusing on optimizing undersampling patterns in a data-driven manner. Recognizing the limitations of traditional density-based undersampling methods due to extensive data volume and computational costs, our approach innovatively combines the optimization of undersampling patterns with advanced 3D reconstruction. By employing an end-to-end deep learning strategy, our method not only refines the undersampling pattern for enhanced image quality but also ensures efficiency in the MRI process.
Our contributions include:
Inspired by the unique characteristics of 3D k-space, we designed a novel 3D k-space sampling pattern. This pattern selectively undersamples in the two phase encoding directions while fully sampling in the frequency encoding direction, enabling the generation of an optimal undersampling pattern specifically tailored for the training dataset.
We propose an end-to-end 3D undersampling and reconstruction network (EEUR-Net), where the integrated training process generates a learned undersampling pattern and enhances reconstruction, significantly improving image quality.
Experiments reveal that our network performs well, with the learned undersampling pattern surpassing many established methods. Furthermore, the end-to-end three-dimensional undersampling and reconstruction approach achieves more robust and accurate results in 3D MRI, demonstrating impressive performance on the Stanford University 3D FSE knee dataset.
Future research can explore the integration with other fast MRI methods to har-ness their complementary advantages, further enhancing scan speeds, and advancing the miniaturization of MRI devices.
2. Related Works
The related work will be presented from the following perspectives: Firstly, we will discuss studies on undersampling schemes. Subsequently, we will delve into research on MRI reconstruction based on deep learning techniques.
2.1. Studies on Undersampling Schemes
High-quality MR image reconstruction can be achieved with fewer samples by undersampling in the k-space domain. Fan et al. [
16] explored how to recover high-quality images by sparse representation and optimization algorithms while reducing the number of samples. Compressed sensing MRI methods based on random undersampling [
5] examine the effects of different undersampling patterns and reconstruction algorithms on the quality of reconstruction, and detailed quantitative analysis has been carried out. Khare K et al. [
17] discussed how to design effective sampling patterns and reconstruction algorithms to maintain image quality while reducing sampling time. Low-rank and sparse matrix decomposition [
2] can also be used for sampling pattern optimization in MRI, using this decomposition method to recover high-quality images while reducing the quantity of sampling data.
Convolutional Neural Networks (CNN) can also be used to optimize undersampling patterns using two-dimensional MRI data [
18], but this method was designed for two-dimensional MRI data. Therefore, in 3D MRI tasks, we should consider optimizing three-dimensional undersampling patterns [
19] to accelerate the process of MRI.
2.2. MR Image Reconstruction Using Deep Learning
In the existing research, Ding et al. [
18] presented a deep learning-based approach that enhances image reconstruction in accelerated [
20]MRI acquisition by refining the U-Net architecture to achieve better image resolution. Wang et al. [
21] capitalized on deep learning techniques to expedite the process of 3D MRI. Their approach employs deep neural networks to learn and infer missing data, enabling the reconstruction of high-quality 3D images from partially sampled data. Zhang et al. proposed to apply of two-dimensional super-resolution techniques for the super-resolution reconstruction of three-dimensional MRI images, boasting superiority in texture and frequency information over other super-resolution methods. Han et al. [
22] introduced a deep learning method based on both ALOHA and U-net, realizing a mapping from K-space to the image domain to expedite the reconstruction task in MRI image acquisition. Thus, for 3D MRI tasks, we contemplate employing a deep learning approach using a network model based on 3D U-Net to accomplish the reconstruction of three-dimensional MR images.
3. Methods
In the Methods section, we first present an undersampling strategy specifically for the distinct characteristics of three-dimensional k-space data. Subsequently, we delve into our proposed EEUR-Net, which is an integration of the learned optimization for the undersampling scheme and the reconstruction process utilizing undersampled data into a singular end-to-end deep learning framework. For the reconstruction of the undersampled data, we use the 3D U-Net architecture.
3.1.3. D k-space Characteristics and 3D Undersampling Scheme
In existing MRI scanning techniques, due to inherent physical constraints, obtaining fully sampled data sequentially in k-space requires a significant amount of time [
3]. For 2D k-space scanning, the data to be collected in k-space can be represented as a data matrix: K ∈ C^(N × F × P) [
23]. For 3D k-space scanning, the data to be collected in k-space can be represented as a data matrix K ∈ C^(N × F × P1 × P2) [
24]. Here,
N represents the number of receiving coil arrays, F is the number of frequency encoding steps, P denotes the quantity of phase encoding, and P1 , P2 respectively represent the first and second phase encoding quantities in 3D scanning.
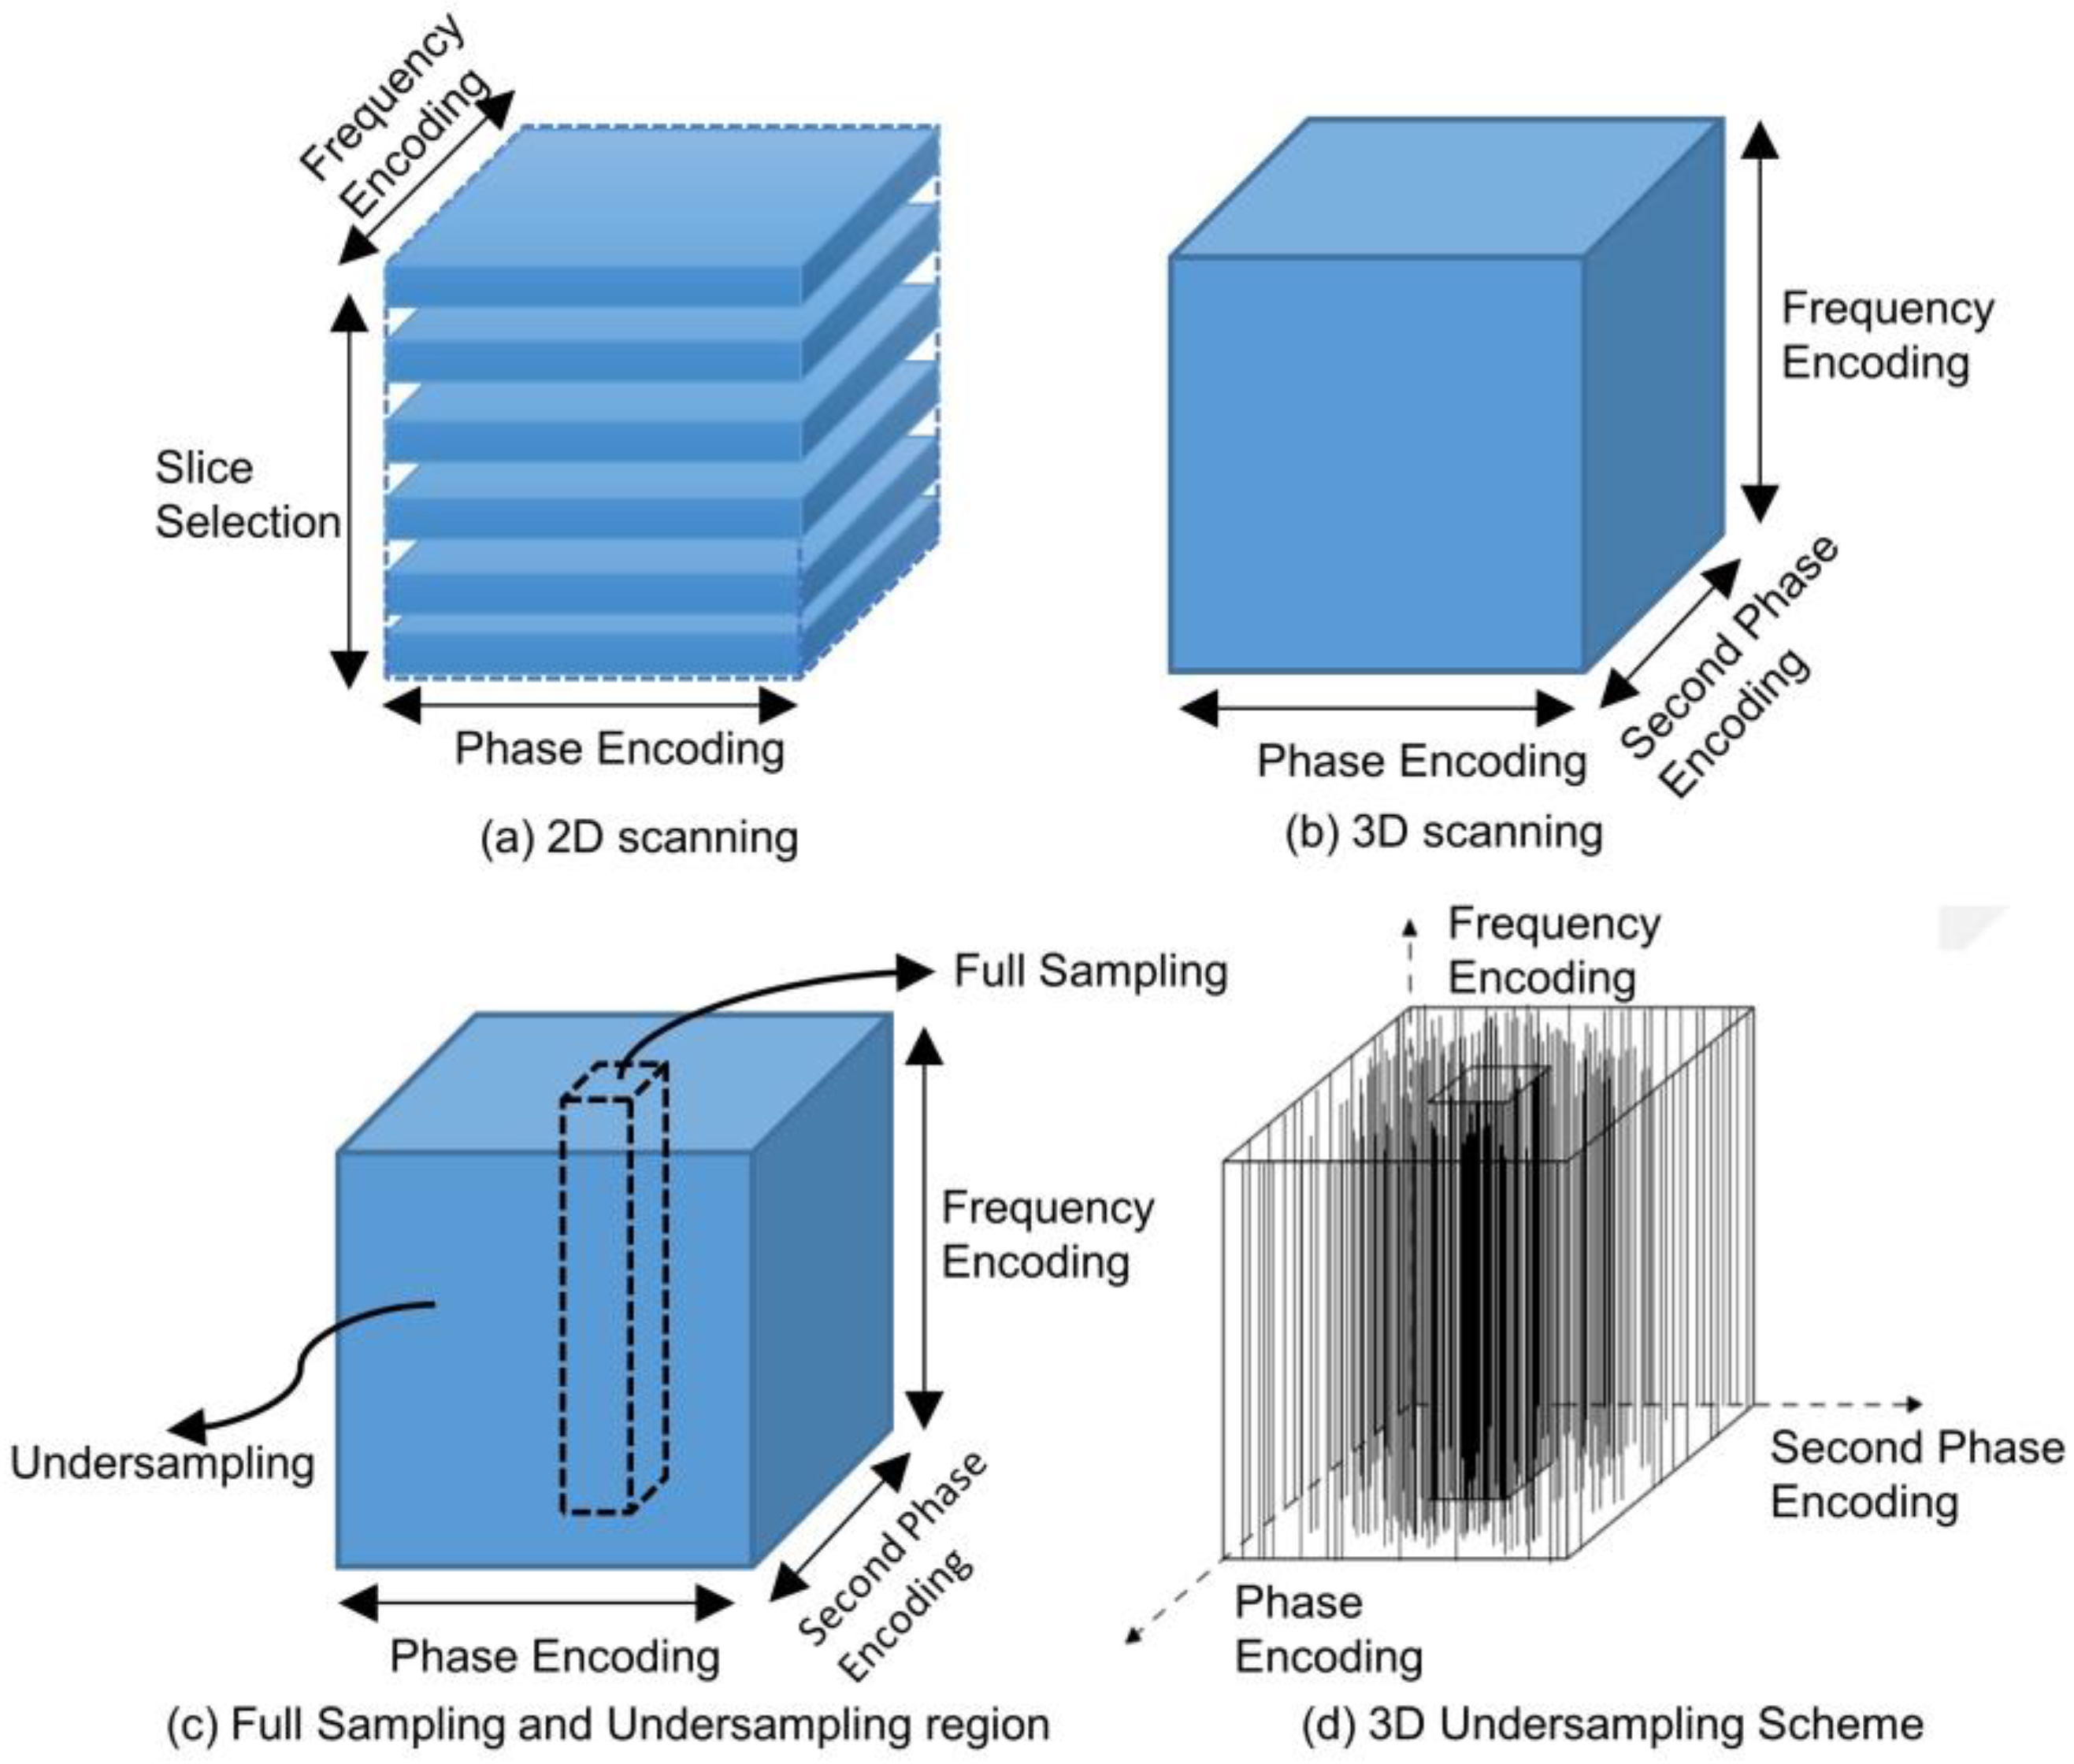
The mechanisms underlying 2D scanning and 3D scanning diverge markedly, as shown in
Figure 1(a). In 2D scanning, imaging is conducted slice-by-slice. Initially, a radiofrequency (RF) pulse is employed to selectively excite a specific slice, a process termed as "Slice Selection". Subsequently, spatial encoding for each individual slice is achieved using frequency encoding gradients and phase encoding gradients, culminating in the final imaging objective. Conversely, 3D scanning omits the slice selection step, as shown in
Figure 1(b). Instead, a volumetric region is directly excited using an RF pulse. The spatial encoding for this volume is accomplished using three orthogonal encoding gradients: one frequency encoding gradient and two phase encoding gradients.
Distinctly different from 2D k-space data, 3D k-space data comprises three spatial frequency axes. This 3D space encompasses a comprehensive spatial frequency domain enriched with intricate and detailed structural information, which is advantageous for imaging outcomes. However, this advantage comes at the expense of an exponentially increased scanning duration due to the expanded volume of data. Through an in-depth analysis of k-space characteristics, we observed that, in terms of energy distribution, the center of 3D k-space data exhibits a spherical concentration, as opposed to the circular concentration evident in 2D k-space. This most pivotal information is centralized in the heart of the k-space, often termed the "DC component." This central region is referred to as the "central k-space", while the surrounding area is designated as the "peripheral k-space". The central k-space encapsulates data regarding contrast and the overall image impression, whereas the peripheral k-space captures details and edges. Given these unique features of the 3D k-space, an effective strategy for reconstructing high-quality images involves dense sampling within the energy-concentrated central k-space and employing techniques such as compressed sensing or machine learning-based methods to undersample the insufficiently sampled k-space, as illustrated in
Figure 1(c).
Our proposed undersampling strategy capitalizes on the energy concentration in 3D k-space. For a given sparsity constraint, we opt for full sampling over a fixed-size central region and undersample in other areas, maintaining the sparsity constraints. This approach facilitates undersampling operations at a designated acceleration rate. To implement this strategy in our experiments, we chose to fully sample along the frequency-encoding direction and perform undersample encoding on the first and second phase encoding directions. Viewed from a three-dimensional volumetric perspective, we conducted full sampling within the central cuboid region of the 3D k-space as depicted below, while other areas are sampled based on the optimized undersampling patterns, as shown in
Figure 1(d).
3.2. EEUR-Net
In this section, we delve deeply into the architecture and compositional structure of the framework utilized for learning the sampling patterns as well as the image reconstruction network. We further elucidate the associated mathematical principles and implementation details.
3.2.1. Overall Framework of EEUR-Net
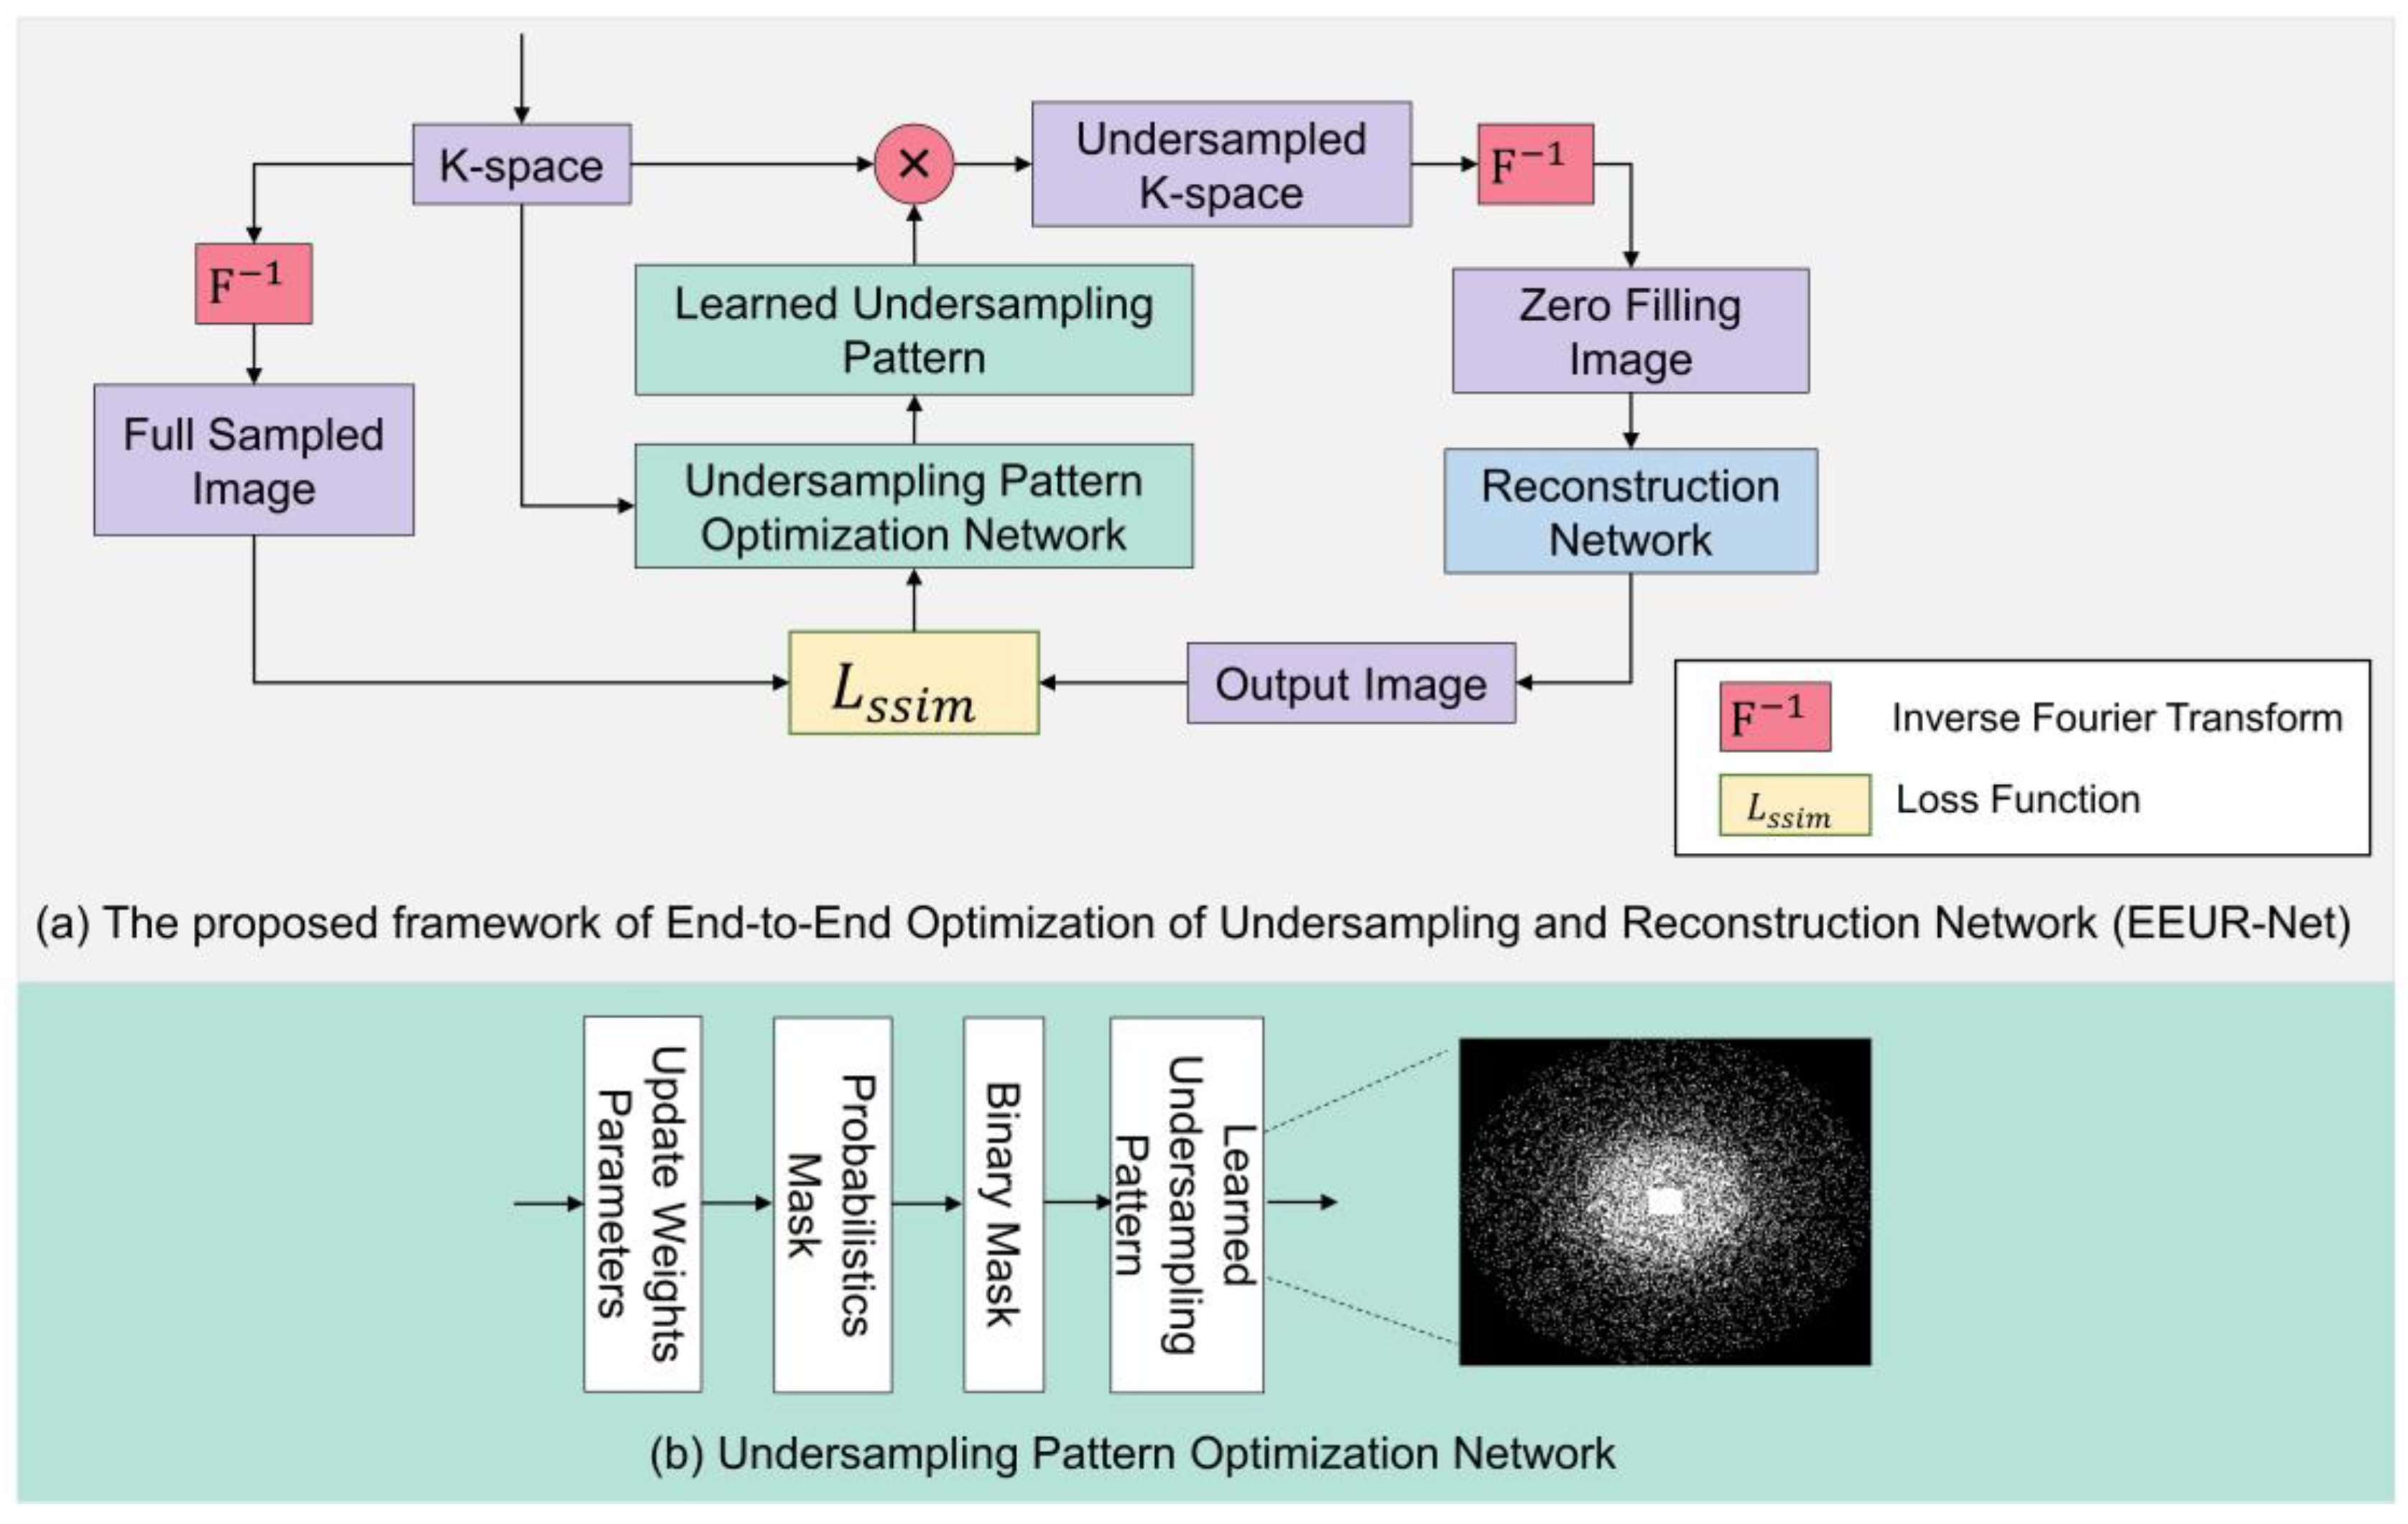
The diagram of our proposed overall network framework is shown in
Figure 2(a), which can be viewed as a whole consisting of undersampling pattern optimization network and an image reconstruction network, and using an end-to-end training deep learning framework. Our network flow can be explained as follows: first, we first obtain 3D K-space data from 3D FSE Knees dataset. Then, the learned undersampling pattern can be obtained by the undersampling pattern optimization network, which in turn obtains the undersampled k-space data. Following this, an inverse Fourier transform results in zero-filled images, which then undergo image reconstruction via the reconstruction network. In the final step, the loss function is computed, and the relevant network parameters are updated. Through end-to-end training, we achieve an optimized learned undersampling pattern and superior reconstruction outcomes.
The undersampling pattern optimization network framework is depicted in
Figure 2(b). The flow of this network can be explained as follows: Firstly, we initialize the sampling pattern using relevant weight parameters. The 3D k-space encoding direction is composed of two phase encoding directions and one frequency encoding direction. Typically, undersampling is applied to the two phase encoding directions, while the frequency encoding direction remains fully sampled. We input a fixed proportion of the central fully-sampled region and, based on the given acceleration factor, initialize the phase encoding directions to a state of random uniform sampling. Additionally, independent random variables are present at each k-space location on the full-resolution grid. From the probability values of frequency encoding for each grid point, a 'Probabilistic Mask' is formed. A higher probability value indicates a greater likelihood that the particular point is selected for sampling. Subsequent binarization leads to the formation of a 'Binary Mask.' A value of 1 (or 0) in the binary mask denotes that the corresponding k-space location is (or isn't) sampled. Through end-to-end training, by calculating the loss function and updating the network's relevant parameters, the probabilistic mask can be altered. This, in turn, modifies the binary mask, resulting in an optimized learned undersampling pattern.
3.2.2. Related Mathematical Principle
In the mathematical model of sampling and reconstruction, a given undersampling pattern and corresponding 3D k-space data can be expressed as obtaining a reconstructed image
by minimizing the following objective function
where
is the MR image to be reconstructed,
is the coil sensitivity map of the
coil,
is the number of receiving coils,
is the three-dimensional Fourier transform,
is the k-space undersampling pattern, and
is the k-space undersampled data of the
coil.
is the regularization term.
Equation 1 can also be implemented by a neural network, where we can learn a parameterized mapping to model the input to the output . We represent the above mapping as using a deep neural network.
describes an independent (binary) random variable at each k-space location on a full-resolution grid in the discrete Fourier domain. Thus, the probability mask forms an image of probability values within the k-space. A binary mask value of 1 (or 0) signifies that the corresponding k-space position is (or is not) sampled.
Ours is to obtain the optimal undersampling pattern
with fixed undersampling ratio α from K fully sampled data by retrospective undersampling. The mathematical formulation of this problem is as follows:
where
is the
MR image reconstructed from the fully sampled k-space data
by direct Fourier inverse transform, and the
function is defined as a loss function measuring the similarity between the reconstructed images, with the fully sampled data, and generates
at a fixed acceleration factor α.
is the anti-aliasing network. By implementing the above optimization problem through end-to-end training, we can obtain the optimal sampling mask. We implement this using a deep neural network, which solves the learning problem by stochastic gradient descent.
3.2.3. Network Architecture of EEUR-Net
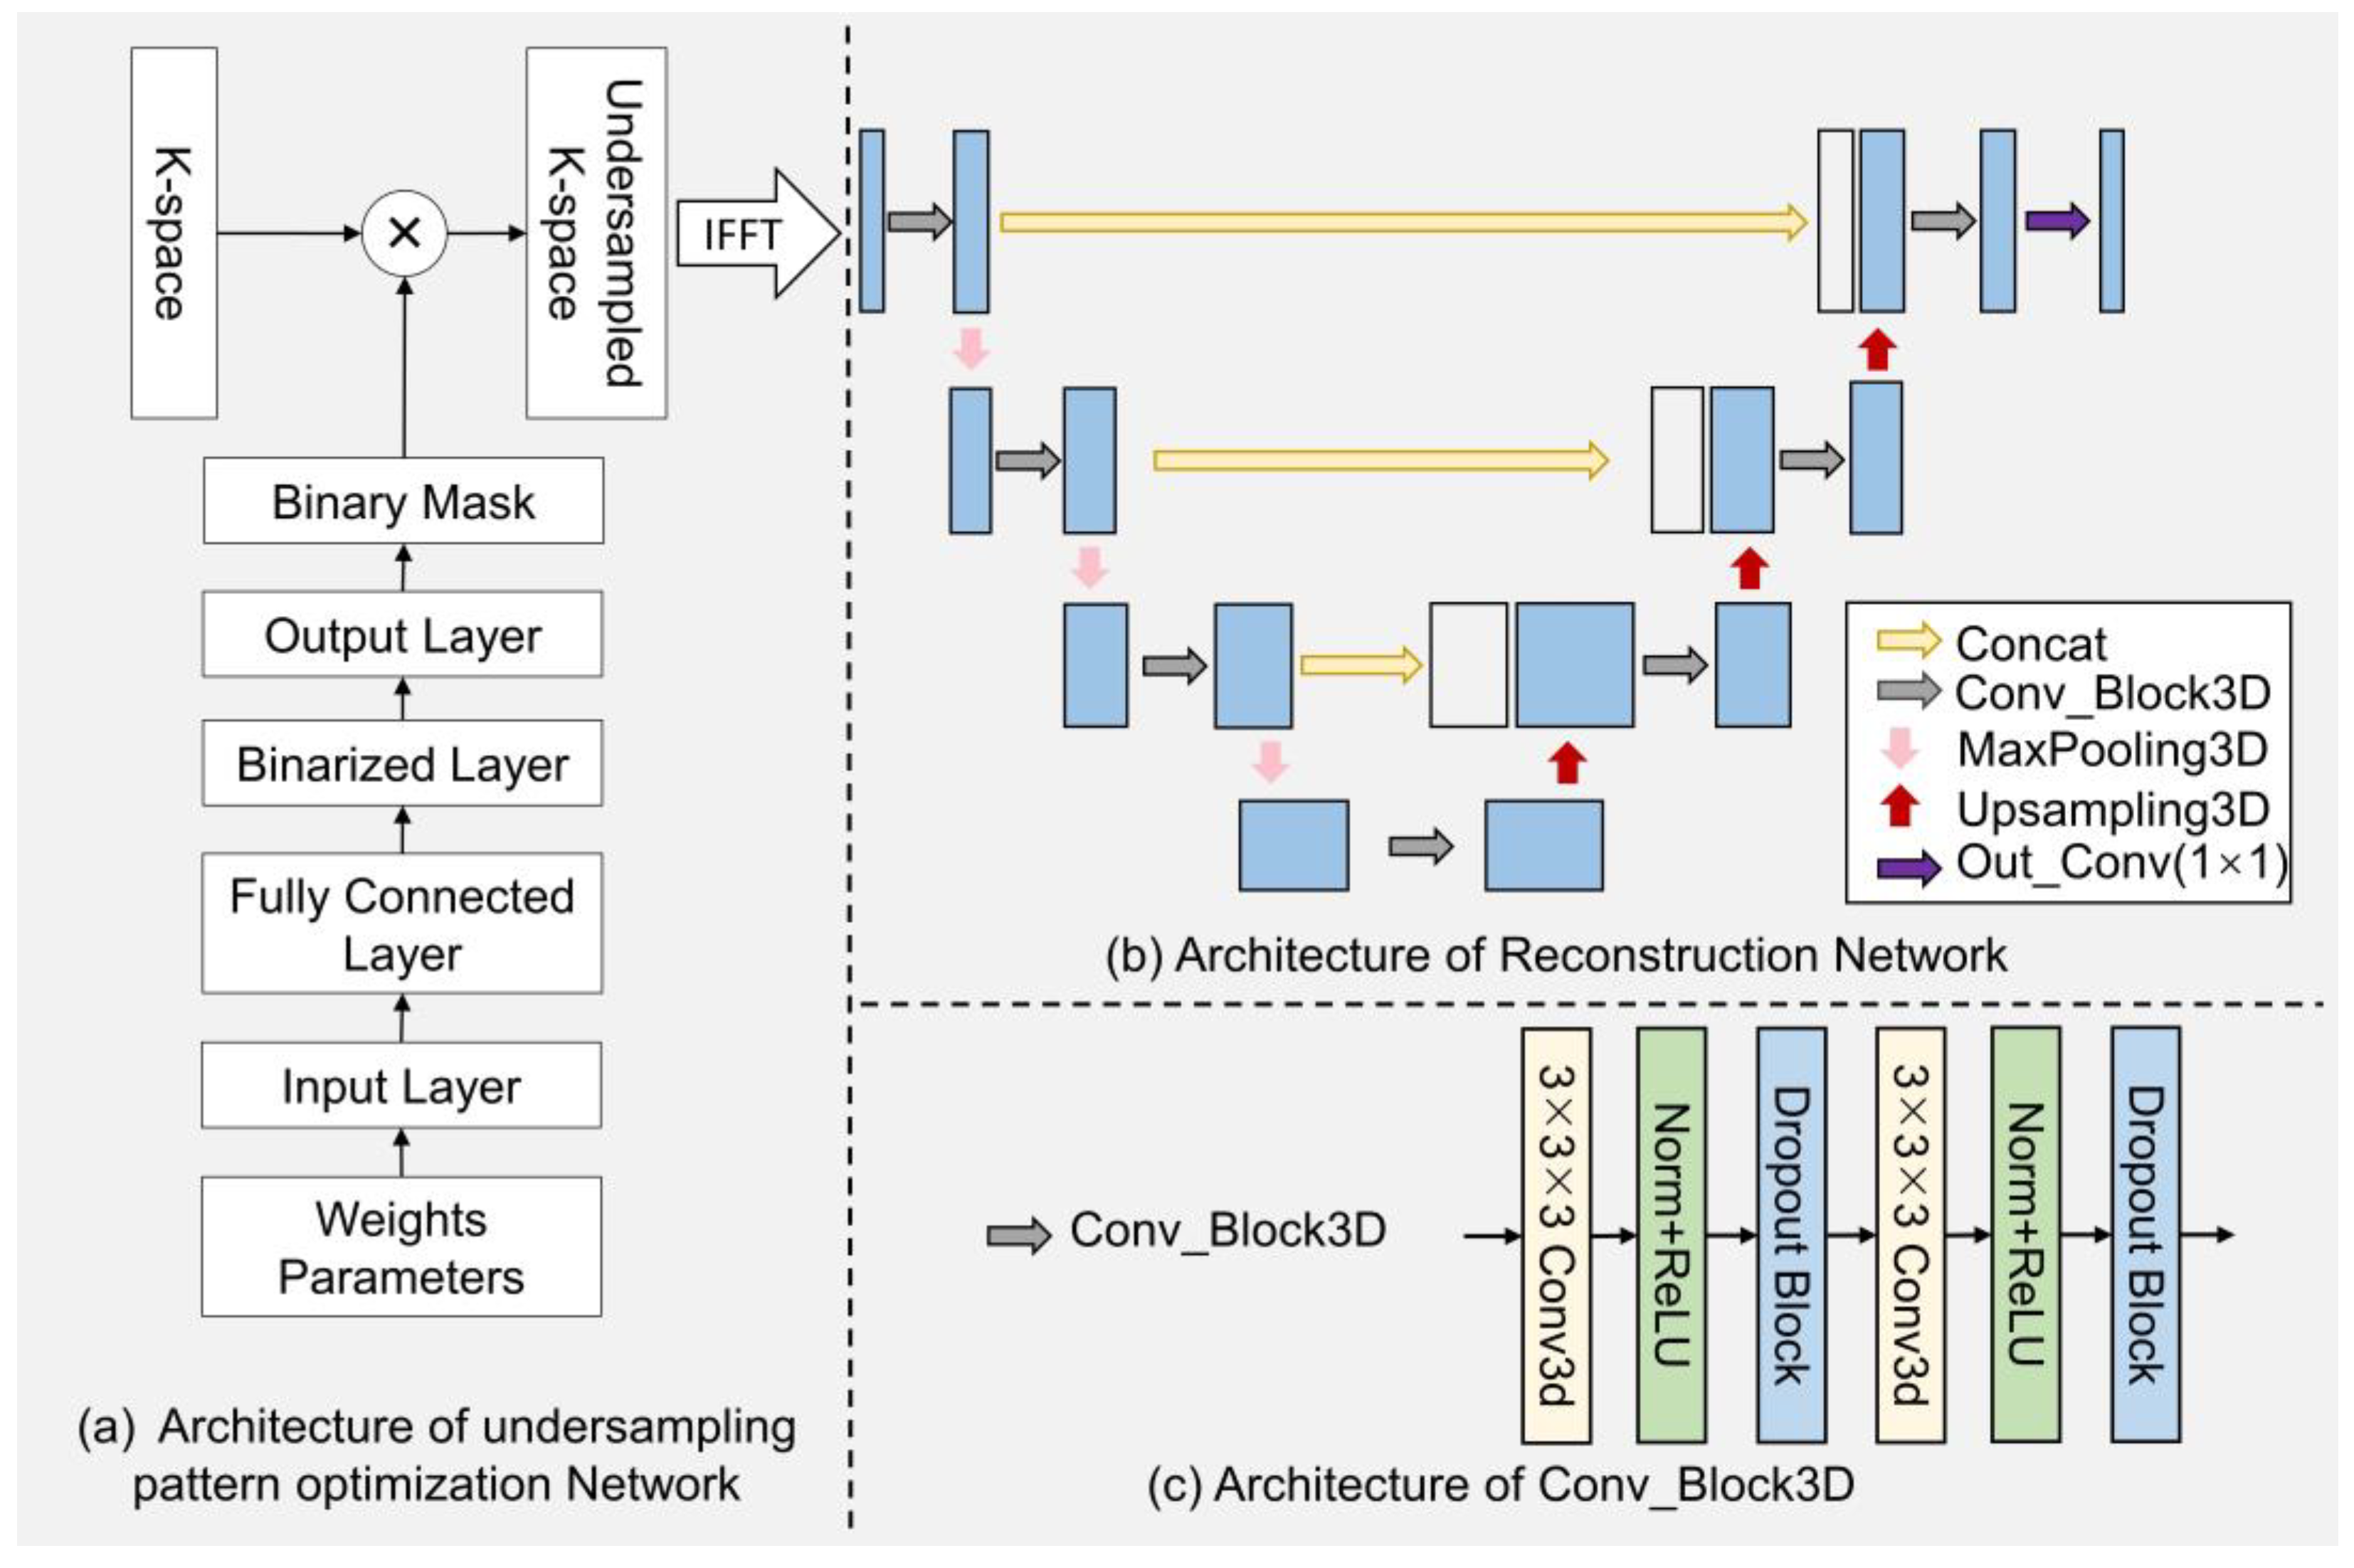
The network diagram of the EEUR-Net is illustrated in
Figure 3, which provides a comprehensive depiction of the undersampling pattern optimization network and the image reconstruction network encompassed within the EEUR-Net.
Figure 3(a) shows the implementation details of the undersampling pattern optimization network. The network is capable of generating probability values at each k-space grid point and optimizing them, and then generating the optimized k-space undersampling pattern. Specifically, the input layer generates the probability value at each grid point in both phase-encoding directions as a probabilistics mask through an initialized weight parameter, and this probabilistics mask is then passed through a fully connected layer with tunable parameters to optimize the probability values. This layer determines the importance of a single k-space data point, with a higher probability value indicating a higher probability that the point will be selected for undersampling. Next is the binarization layer, which converts the continuous data from the fully connected layer into binarized data. The output layer then generates a 3D k-space undersampling mask that is undersampled in both phase encoding directions and remains fully sampled in the frequency encoding direction, resulting in the "Binary Mask" shown in the figure. The value of the binary mask is 1(0), which indicates yes (no) sampling at the corresponding encoding position. Multiplying the obtained 3D k-space undersampled mask with the k-space data becomes the undersampled k-space data, which can be obtained as the zero-filled image as the input of the reconstruction network after the 3D inverse Fourier transform.
The reconstruction network architecture based on 3D U-Net is shown in
Figure 3(b), where each vertical blue line represents an image within the image domain, alongside the results of each step of the processing. The grey arrows denote the "Conv_Block3D" modules, further detailed in
Figure 3(c). Each module consists of a series of operations starting with a three-dimensional convolution, which expands the two-dimensional kernel of traditional convolutions into the third dimension, enabling the network to incorporate information from the depth of the input volume. Following the 3D convolution, a ReLU activation function introduces non-linearity, which is essential for the model to capture complex patterns within the data. Each layer of the encoding pathway in the reconstruction network includes a "Conv_Block3D" module, followed by a downsampling through "MaxPooling3D" operations. In the decoding pathway, upsampling techniques are employed to incrementally restore the spatial dimensions, achieved by "Upsampling3D" operations. The concatenation steps, symbolized by the yellow arrows, merge the upsampled features with the corresponding feature maps from the encoding pathway, allowing the network to preserve high-resolution features throughout the network. The 3D U-Net extends the conventional U-Net into the three-dimensional space, enhancing its capacity for analyzing volumetric images. Our model is designed to learn the optimal undersampling scheme within the three-dimensional k-space. The undersampling mask is treated as a trainable parameter, which is updated during the training process to optimize the quality of the reconstructed image.
4. Experiments and Results
In this section, we provide a comprehensive overview of the datasets employed in the relevant experiments and delve into the specific implementation details. Furthermore, we present the experimental results, elucidating their significance in relation to established evaluation metrics.
4.1. Dataset
The dataset used in this study is Stanford Fully sampled 3D FSE Knees dataset [
25]. The images in the dataset were collected from the knee joints of multiple patients and imaged using the Fast Spin Echo (FSE) sequence. These images were obtained by acquiring a large amount of k-space data in three directions: axial, coronal, and sagittal. Each image features high resolution and rich tissue contrast, including joint cartilage, ligaments, tendons, and surrounding tissues.
The dataset contains 19 volumes, collected using a 3T GE medical system scanner with an 8-channel phased-array coil. A notable characteristic of the Stanford Fully sampled 3D FSE Knees dataset is its complete sampling; that is, every k-space sampling point is measured, without involving any undersampling techniques.
While there are many 2D MRI databases, 3D databases are scarce. This makes the dataset an ideal choice for evaluating and comparing different reconstruction algorithms, providing a benchmark to measure the reconstruction quality and accuracy of other methods. Utilizing this dataset, our study aims to investigate and develop end-to-end sampling and reconstruction methods for three-dimensional knee joint MRI. The availability of high-quality, fully sampled knee images allows us to explore these advanced algorithms that can effectively utilize the rich information contained within the complete k-space data. By evaluating these methods on the Stanford Fully sampled 3D FSE Knees dataset, we can assess their performance in terms of reconstruction effectiveness, evaluation metrics, and accurately capturing the complex anatomical structures within the knee joint.
4.2. Implementation details
Our research was implemented in the PyTorch framework and trained on an NVIDIA Titan Xp GPU. We divided the Stanford Fully sampled 3D FSE Knees dataset, consisting of 19 volumes, into training, validation, and test sets with 14, 3, and 2 volumes, respectively. The network optimization was performed using the RMSProp optimizer. We trained the network for 50 epochs with a batch size of 1 and an initial learning rate of 0.001. At the 40th epoch, the learning rate was reduced to 0.0001. During training, we utilized the SSIM loss function.
For evaluating the reconstruction results, we employed several quality metrics: structural similarity index (SSIM), peak signal to noise ratio (PSNR), and normalized mean squared error (NMSE). These metrics were used to assess the quality of the reconstructed images and provide quantitative measurements of their fidelity.
SSIM indicates the degree of similarity that exists between the undersampled reconstructed images and fully sampled ground truth images. We use NMSE to represent the normalized mean square error existing between the undersampled reconstructed images and the fully sampled ground truth images. We can use PSNR to describe the ratio between the maximum possible energy of the image's intensity and the power of the noise.
4.3. Comparison with Other methods
4.3.1. Visualization of undersampling patterns of various methods
In this study, to validate the efficacy of an end-to-end learning-based approach that optimizes both the undersampling scheme and the reconstruction model, we conducted a comparative analysis with our method against several prevalent sampling techniques, all employing the same acceleration factor. These techniques included standard random uniform, radial, Poisson, and equispaced Cartesian undersampling schemes.
Importantly, to ensure a consistent basis for comparison, all experiments utilized the 3D U-Net for image reconstruction of undersampled data, maintaining uniformity in the reconstruction methodology across different undersampling schemes.
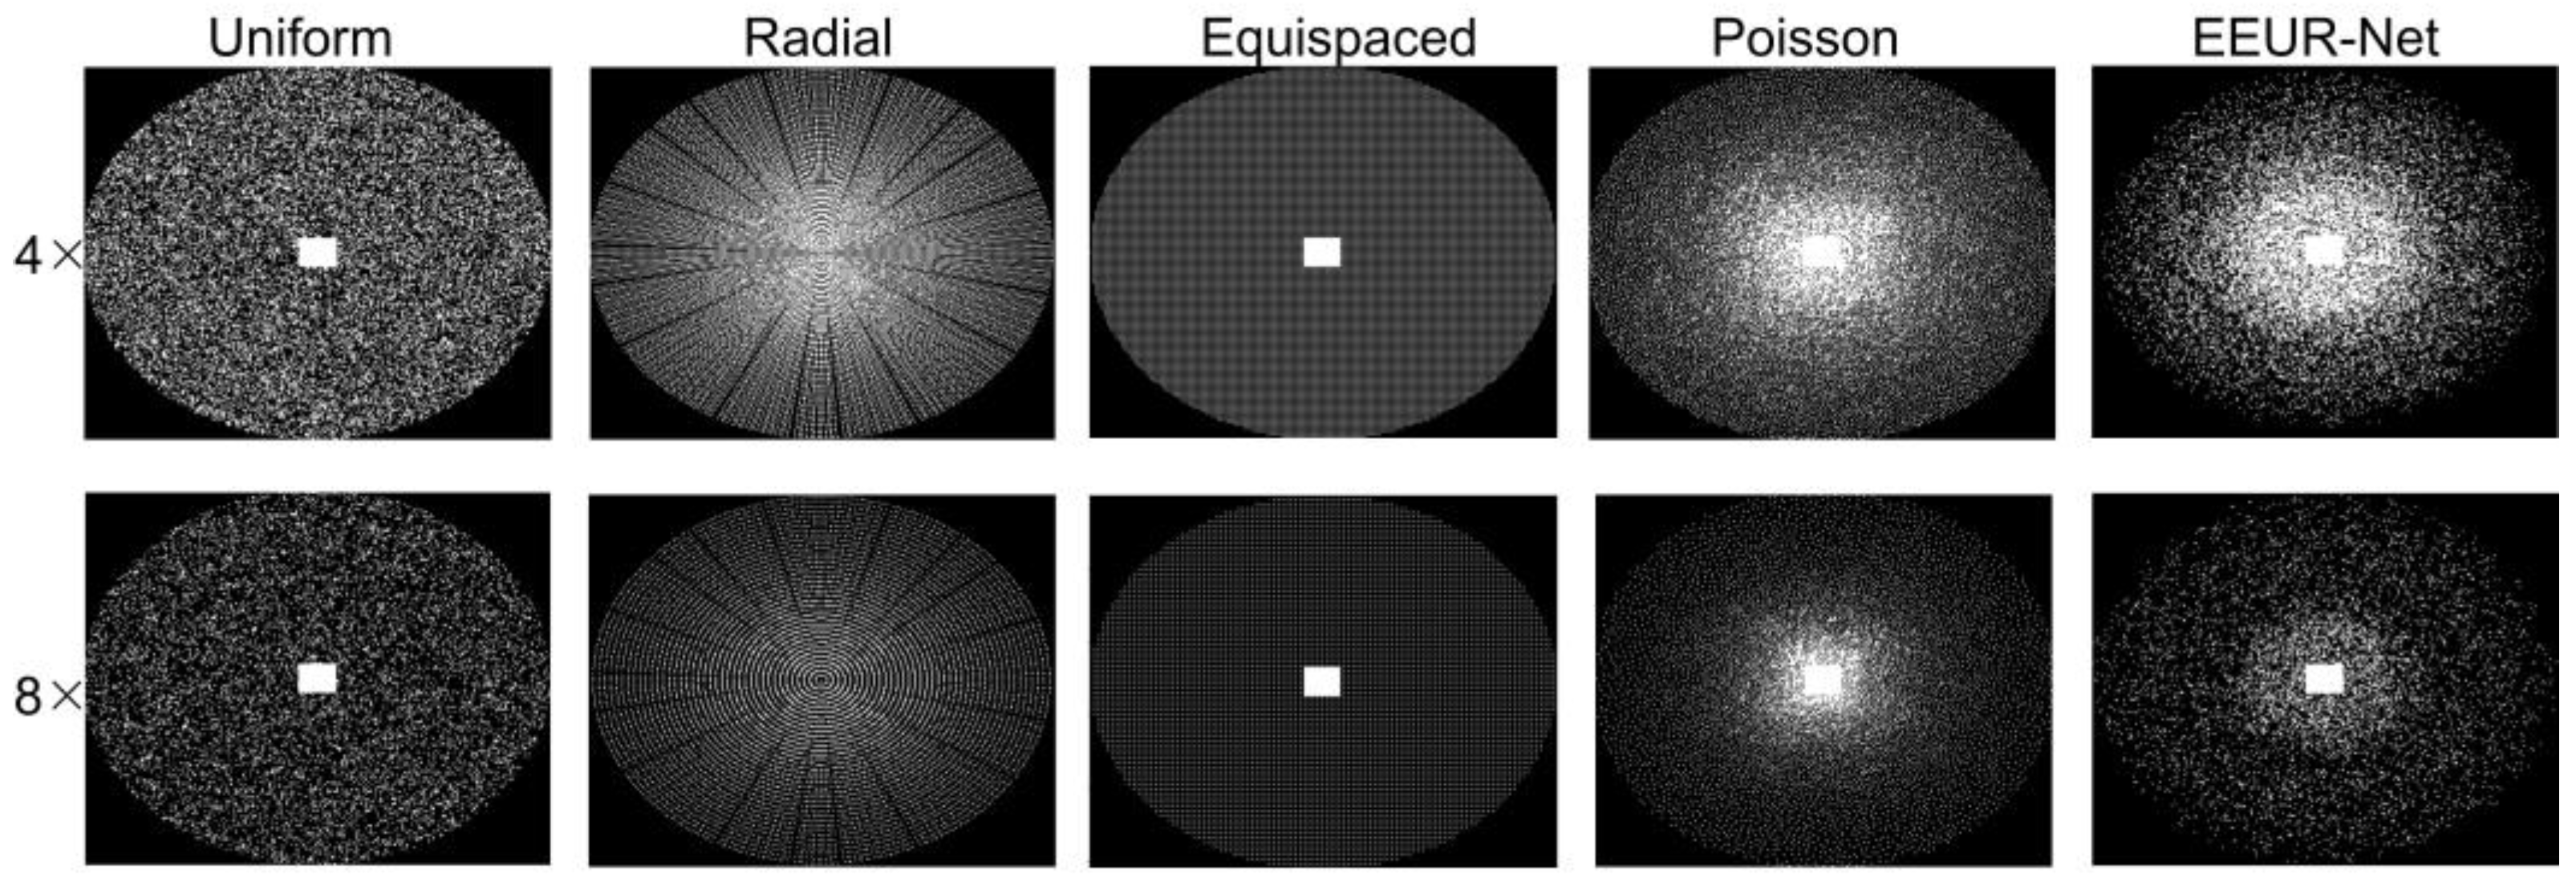
Notably, standard random uniform sampling, equispaced Cartesian undersampling, Poisson sampling, and the learned sampling pattern proposed in this paper all feature a fixed 32 x 26 fully-sampled rectangular region at the center of the k-space, contributing to enhanced reconstruction performance.
Each comparison method employed the same training dataset during their training phase, and evaluations for the various techniques were also conducted on a same test set. For the aforementioned sampling techniques, undersampling experiments were carried out at fourfold and eightfold acceleration rates. In both the first phase encoding and second phase encoding directions, the resultant undersampling patterns can be visualized in
Figure 4.
Figure 4 illustrates the undersampling patterns obtained from various acceleration rates. Notably, the learned undersampling pattern exhibits more sampling in the central region. This observation aligns well with our experimental expectations, since the center region contains more information that is beneficial to the reconstruction results.
4.3.2. Quantitative Evaluation
To quantitatively evaluate the reconstruction performance, we compared the reconstructed images, resulting from different undersampling methods, at 4x and 8x undersampling rates, with full-sampled images. The comparison metrics include Normalized Mean Square Error (NMSE), Peak Signal-to-Noise Ratio (PSNR), and Structural Similarity Index Measure (SSIM).
The quantitative comparison results are shown in
Table 1 and
Table 2. Our primary focus is on the SSIM metric, a highly valued measure in the MRI field. SSIM closely approximates human visual perception and is therefore of great significance for clinical diagnosis.
In the experiments with 4x acceleration, our method achieved the best SSIM value of 0.9324. Compared to the baseline (random uniform sampling), our method increased the SSIM by 0.029 and improved the PSNR by 2.21 dB. For the 8x acceleration experiments, our method recorded an optimal SSIM of 0.9109, an improvement of 0.0213 over the baseline SSIM, and a PSNR enhancement of 3 dB.
From the above metrics, it's evident that the approach proposed in this paper delivers superior performance in terms of NMSE, PSNR, and SSIM. This highlights the efficacy of our proposed EEUR-Net, designed to simultaneously optimize the undersampling scheme and the reconstruction process, in achieving optimal sampling patterns and reconstruction outcomes. In summary, our method demonstrates excellent performance on the 3D FSE knee dataset.
4.3.3. Qualitative Evaluation
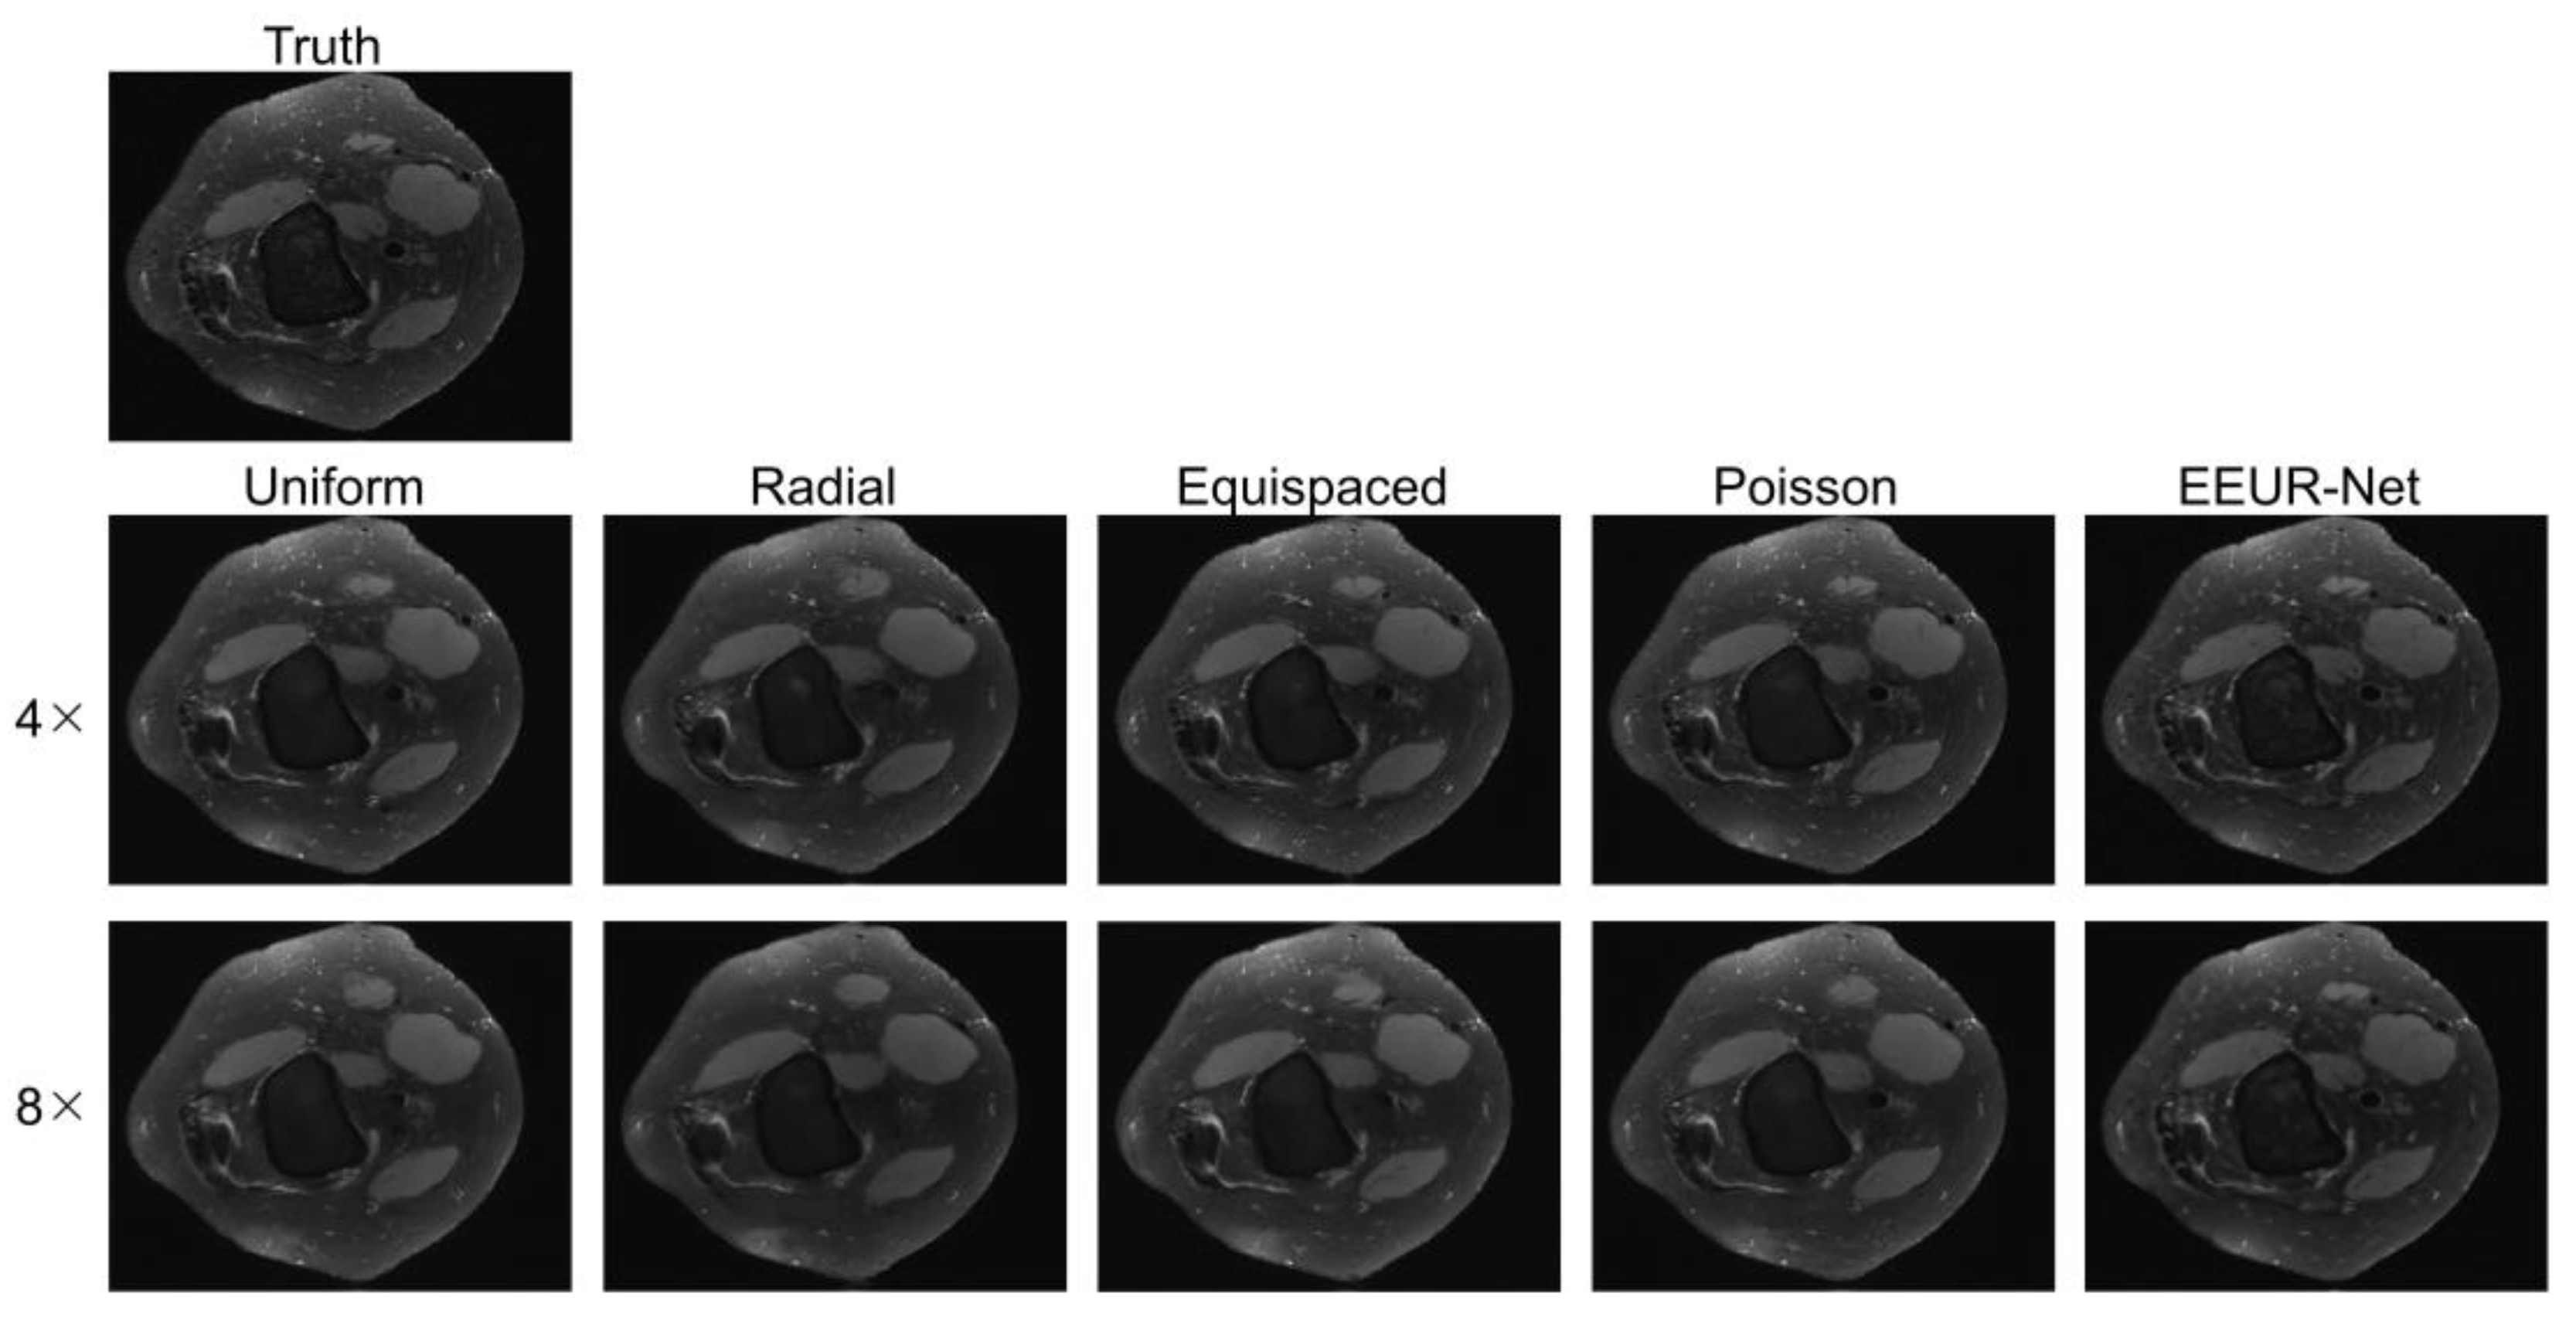
The resulting images from different sampling methods at 4x and 8x acceleration are illustrated in
Figure 5. All experiments employed the 3D U-Net for image reconstruction of undersampled data.
From the image reconstruction results, the learned undersampling pattern generated by this method (EEUR-Net) can produce higher quality reconstruction than other widely used undersampling patterns, with less aliasing artifacts than other methods, and the reconstruction results better preserved image details, with significant improvement in the visualization of the main structures of the knee joint.
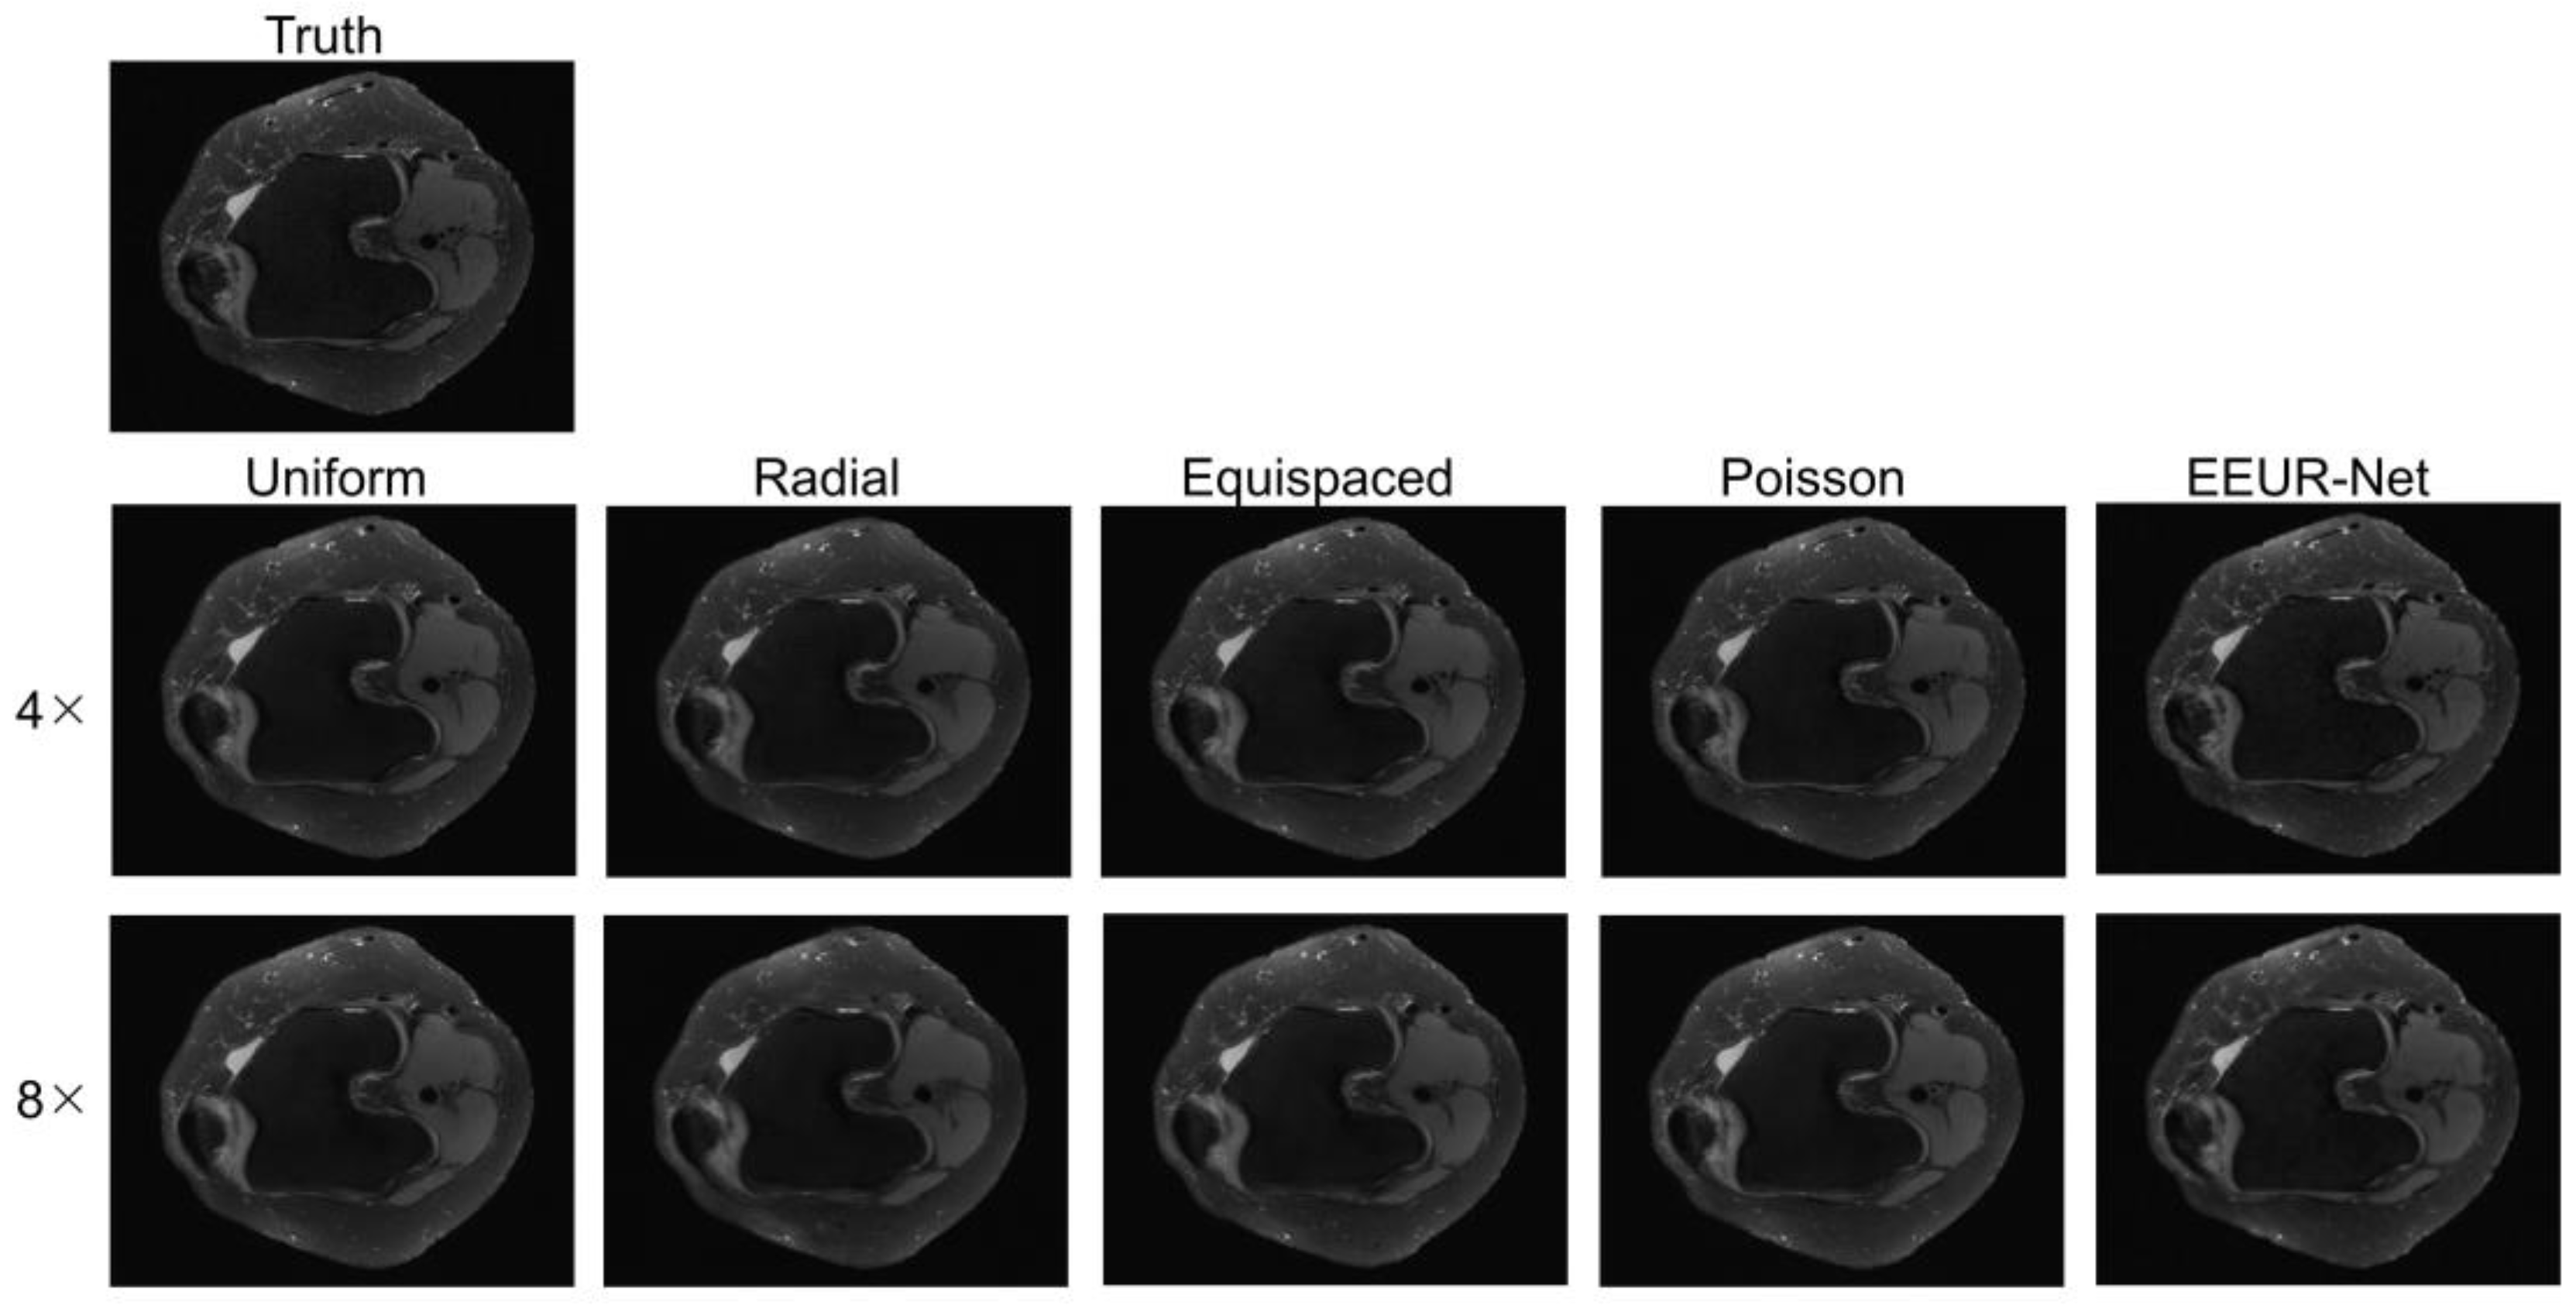
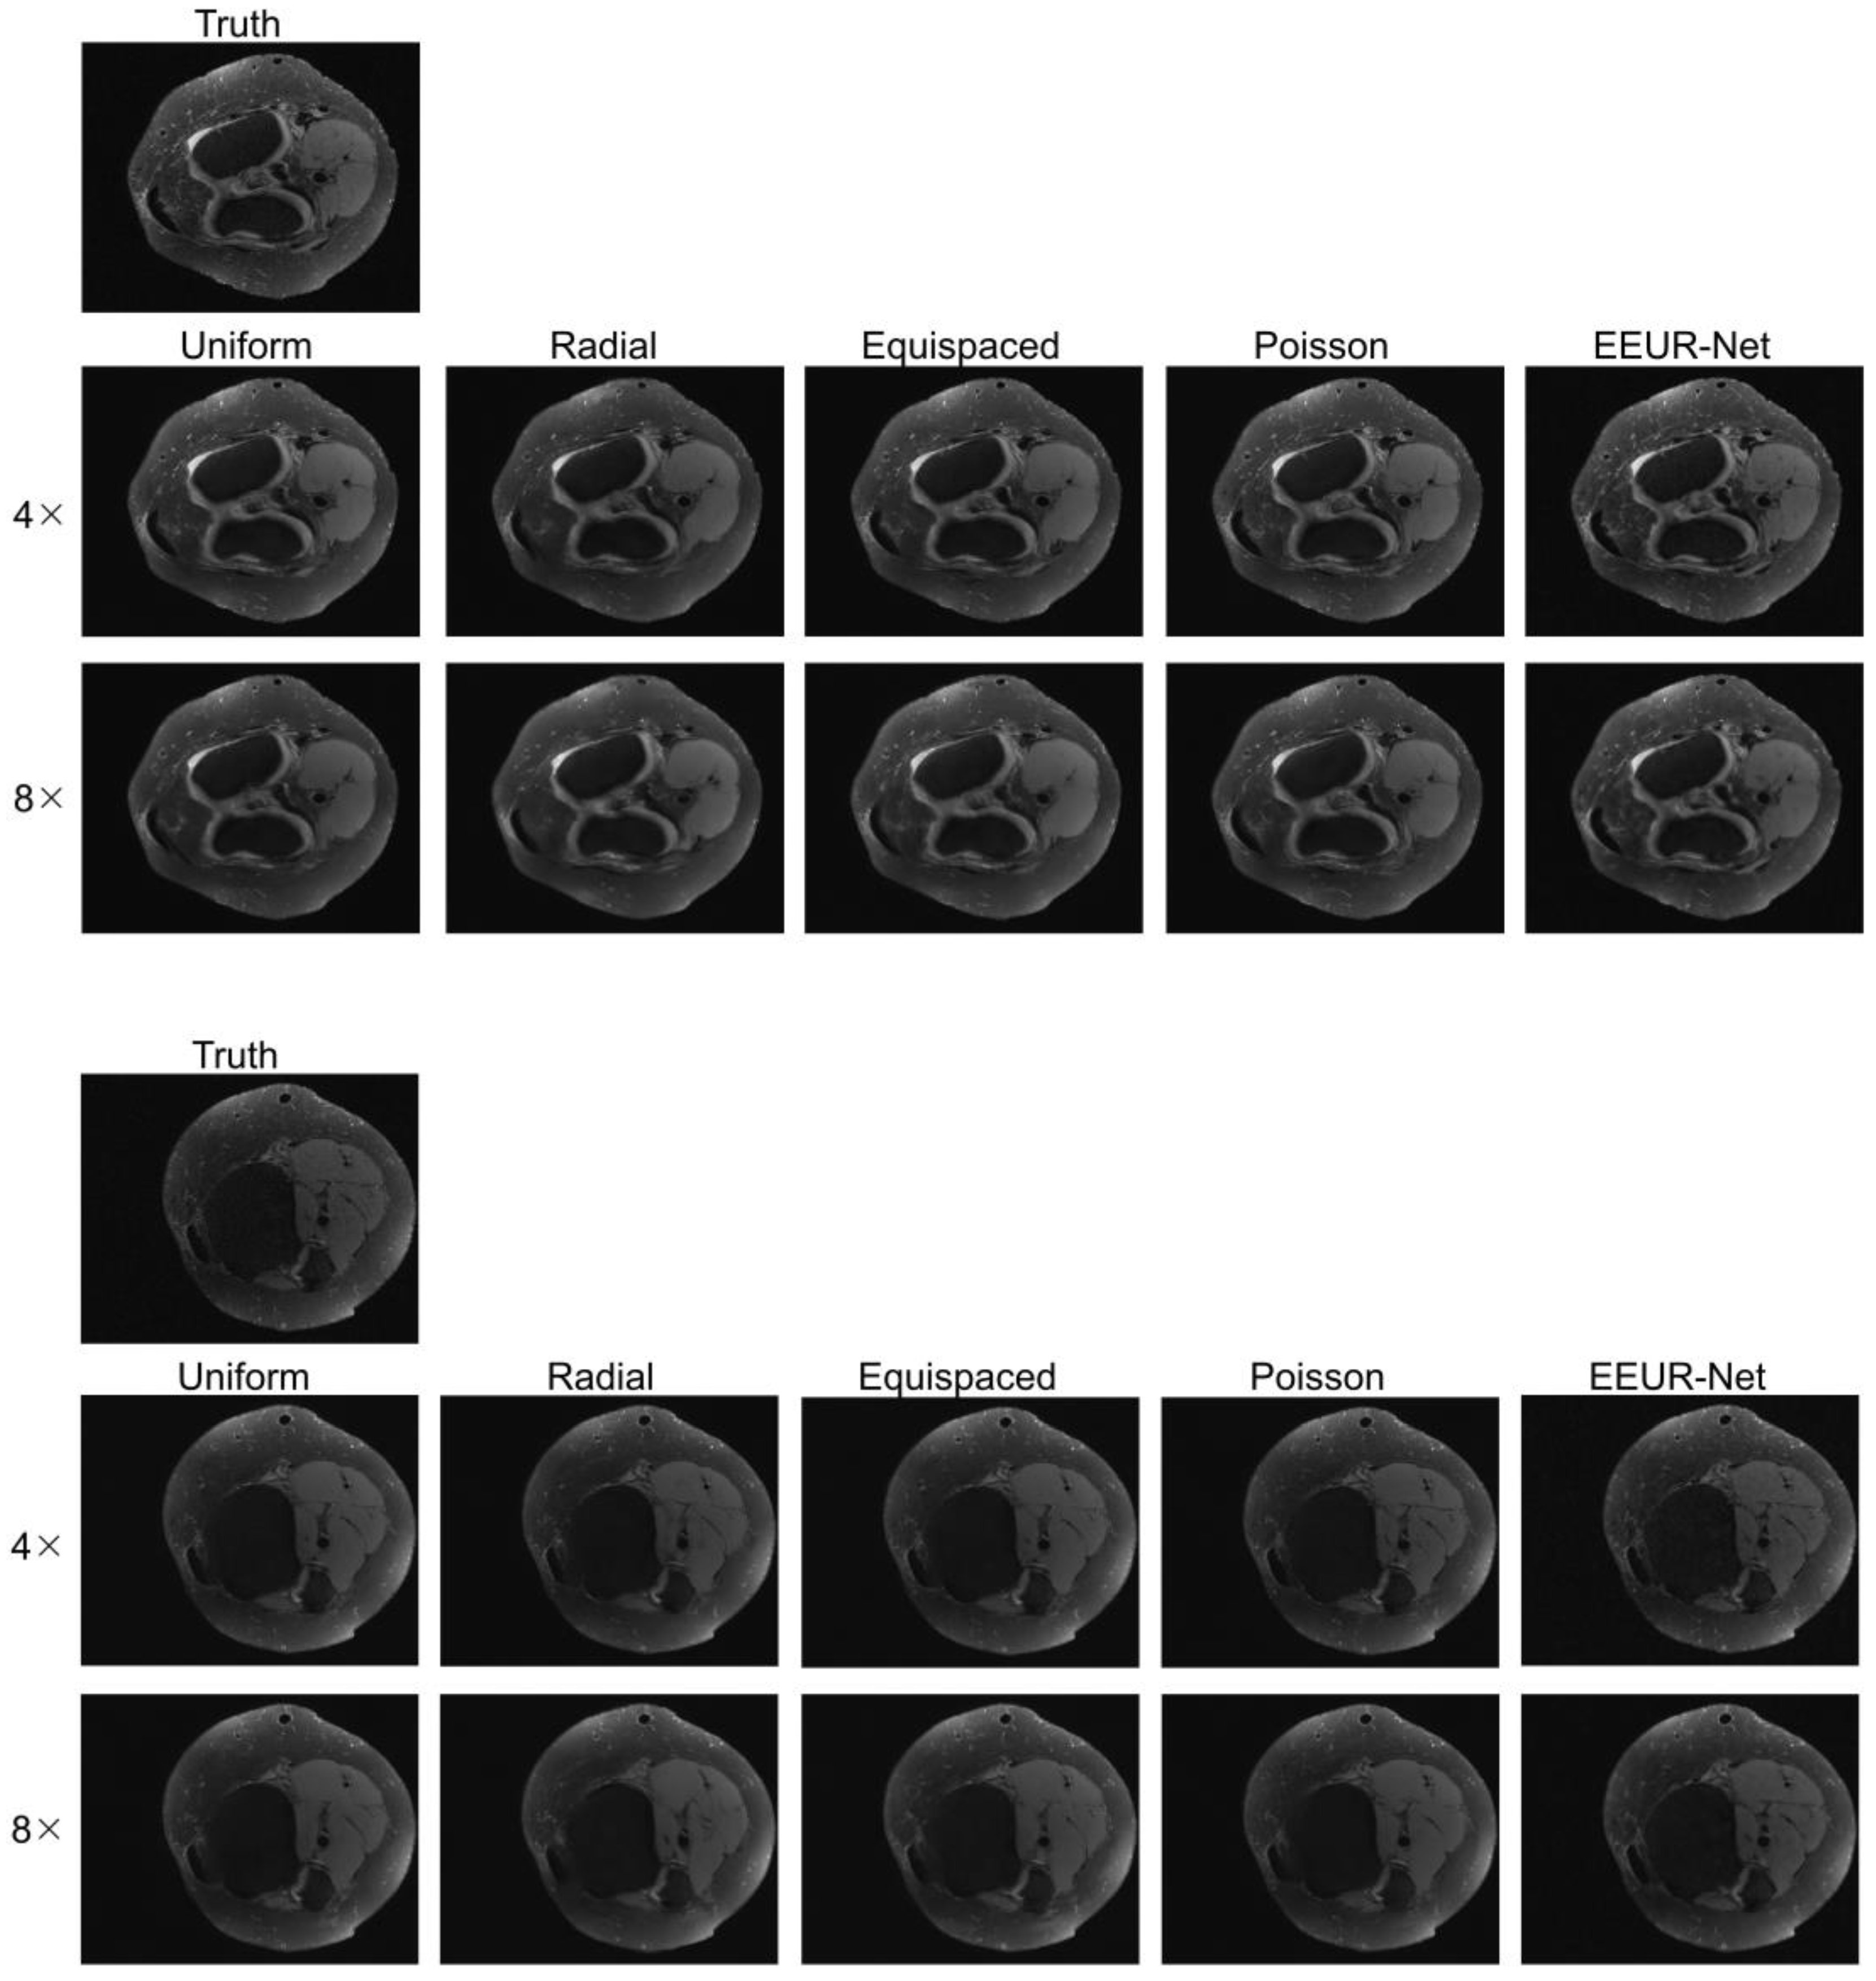
In order to provide a more direct and visual observation of the effect of each network reconstruction, we displayed additional three sets of reconstruction results in
Figure 6, all of which were reconstructed using the 3D U-Net. Examining the results of reconstructed images, it is evident that the results produced by our method (EEUR-Net) are superior, with the clearest reconstruction of image details and the least artifacts. This demonstrates that the learned undersampling pattern can yield higher-quality reconstructions compared to other widely utilized undersampling masks. The end-to-end optimization of undersampling significantly contributes to the improvement of image reconstruction quality.
5. Discussion and Conclusions
The undersampling in 3D k-space significantly accelerates the 3D MRI process. In this paper, we introduce the EEUR-Net, a network capable ofgenerating specific 3D undersampling patterns by optimizing phase encoding from a data-driven perspective, thus enhancing undersampling efficiency in 3D k-space. The EEUR-Net can be holistically viewed as a fusion of an undersampling scheme optimization network and an image reconstruction network using an end-to-end deep learning framework. We derive optimized undersampling patterns through the undersampling scheme optimization network, and perform image reconstruction using the 3D U-Net network. This methodology, adopting an end-to-end learning strategy, concurrently optimizes both the undersampling pattern and the reconstruction model, aiming for robust and precise sampling and reconstruction in 3D MRI.
For tasks involving 3D magnetic resonance reconstruction, we embraced a data-driven approach, leveraging the unique properties of 3D k-space data, and proposed an integrated end-to-end undersampling and reconstruction strategy. Joint training of the k-space undersampling network and the reconstruction network allows our method to efficiently generate optimized undersampling patterns. Experiments on the 3D FSE Knees dataset demonstrated that our undersampling patterns achieve superior reconstruction quality compared to other commonly used undersampling masks, exhibiting exceptional results at 4x and 8x acceleration rates. Looking forward, we plan to explore deeper into the properties of k-space data to further enhance undersampling efficiency. Additionally, the exploration of advanced data-driven undersampling techniques [
26], in conjunction with more sophisticated network architectures, presents an exciting avenue for faster and more accurate reconstruction performance in future research.
Author Contributions
Conceptualization, Q.D. and Y.L.; methodology, Q.D and Y.L.; software, Q.D. and J.X.; validation, Q.D. and J.X.; formal analysis, Y.L.; resources, Y.P.; writing—original draft preparation, Q.D. and Y.L.; writing—review and editing, J.X. and Y.P.; visualization, Q.D.; supervision, Y.P.; project administration, Y.P.; funding acquisition, Y.P. All authors have read and agreed to the published version of the manuscript.
Funding
This research was supported by the National Natural Science Foundation of China (Grant No. 52227814).
Data Availability Statement
Conflicts of Interest
The authors declare no conflict of interest.
References
- Sun, Z.; Pang, Y.; Sun, Y.; Liu, X. DMFF-Net: Densely Macroscopic Feature Fusion Network for Fast Magnetic Resonance Image Reconstruction. Electronics 2022, 11, 3862. [Google Scholar] [CrossRef]
- Bahadir, C.D.; Wang, A.Q.; Dalca, A.V.; Sabuncu, M.R. Deep-Learning-Based Optimization of the Under-Sampling Pattern in MRI. IEEE Transactions on Computational Imaging 2020, 6, 1139–1152. [Google Scholar] [CrossRef]
- Georgescu, M.-I.; Ionescu, R.T.; Verga, N. Convolutional neural networks with intermediate loss for 3D super-resolution of CT and MRI scans. IEEE Access 2020, 8, 49112–49124. [Google Scholar] [CrossRef]
- Hamilton, J.; Franson, D.; Seiberlich, N. Recent advances in parallel imaging for MRI. Progress in nuclear magnetic resonance spectroscopy 2017, 101, 71–95. [Google Scholar] [CrossRef] [PubMed]
- Donoho, D.L. Compressed sensing. IEEE Transactions on information theory 2006, 52, 1289–1306. [Google Scholar] [CrossRef]
- Burshtein, A.; Birk, M.; Chernyakova, T.; Eilam, A.; Kempinski, A.; Eldar, Y.C. Sub-Nyquist sampling and Fourier domain beamforming in volumetric ultrasound imaging. IEEE transactions on ultrasonics, ferroelectrics, and frequency control 2016, 63, 703–716. [Google Scholar] [CrossRef]
- Pruessmann, K.P.; Weiger, M.; Scheidegger, M.B.; Boesiger, P. SENSE: sensitivity encoding for fast MRI. Magnetic Resonance in Medicine: An Official Journal of the International Society for Magnetic Resonance in Medicine 1999, 42, 952–962. [Google Scholar] [CrossRef]
- Sodickson, D.K.; Manning, W.J. Simultaneous acquisition of spatial harmonics (SMASH): fast imaging with radiofrequency coil arrays. Magnetic resonance in medicine 1997, 38, 591–603. [Google Scholar] [CrossRef]
- Griswold, M.A.; Jakob, P.M.; Heidemann, R.M.; Nittka, M.; Jellus, V.; Wang, J.; Kiefer, B.; Haase, A. Generalized autocalibrating partially parallel acquisitions (GRAPPA). Magnetic Resonance in Medicine: An Official Journal of the International Society for Magnetic Resonance in Medicine 2002, 47, 1202–1210. [Google Scholar] [CrossRef]
- Otazo, R.; Candes, E.; Sodickson, D.K. Low-rank plus sparse matrix decomposition for accelerated dynamic MRI with separation of background and dynamic components. Magnetic resonance in medicine 2015, 73, 1125–1136. [Google Scholar] [CrossRef]
- Block, K.T.; Uecker, M.; Frahm, J. Undersampled radial MRI with multiple coils. Iterative image reconstruction using a total variation constraint. Magnetic Resonance in Medicine: An Official Journal of the International Society for Magnetic Resonance in Medicine 2007, 57, 1086–1098. [Google Scholar] [CrossRef] [PubMed]
- Ehrhardt, M.J.; Betcke, M.M. Multicontrast MRI reconstruction with structure-guided total variation. SIAM Journal on Imaging Sciences 2016, 9, 1084–1106. [Google Scholar] [CrossRef]
- Dar, S.U.; Yurt, M.; Karacan, L.; Erdem, A.; Erdem, E.; Cukur, T. Image synthesis in multi-contrast MRI with conditional generative adversarial networks. IEEE transactions on medical imaging 2019, 38, 2375–2388. [Google Scholar] [CrossRef] [PubMed]
- Chen, E.Z.; Wang, P.; Chen, X.; Chen, T.; Sun, S. Pyramid convolutional RNN for MRI image reconstruction. IEEE Transactions on Medical Imaging 2022, 41, 2033–2047. [Google Scholar] [CrossRef] [PubMed]
- Pravitasari, A.A.; Iriawan, N.; Almuhayar, M.; Azmi, T.; Irhamah, I.; Fithriasari, K.; Purnami, S.W.; Ferriastuti, W. UNet-VGG16 with transfer learning for MRI-based brain tumor segmentation. TELKOMNIKA (Telecommunication Computing Electronics and Control) 2020, 18, 1310–1318. [Google Scholar] [CrossRef]
- Fan, X.; Lian, Q. Compressed sensing magnetic resonance image reconstruction based on double sparse model. Sheng wu yi xue Gong Cheng xue za zhi= Journal of Biomedical Engineering= Shengwu Yixue Gongchengxue Zazhi 2018, 35, 688–696. [Google Scholar] [CrossRef] [PubMed]
- Khare, K.; Hardy, C.J.; King, K.F.; Turski, P.A.; Marinelli, L. Accelerated MR imaging using compressive sensing with no free parameters. Magnetic Resonance in Medicine 2012, 68, 1450–1457. [Google Scholar] [CrossRef] [PubMed]
- Ding, P.L.K.; Li, Z.; Zhou, Y.; Li, B. Deep residual dense U-Net for resolution enhancement in accelerated MRI acquisition. In Proceedings of the Medical Imaging 2019: Image Processing; 2019; pp. 110–117. [Google Scholar] [CrossRef]
- Bahadir, C.D.; Dalca, A.V.; Sabuncu, M.R. Learning-based optimization of the under-sampling pattern in MRI. In Proceedings of the Information Processing in Medical Imaging: 26th International Conference, IPMI 2019, Hong Kong, China, June 2–7, 2019, Proceedings 26, 2019; pp. 780–792. [CrossRef]
- Zhang, H.; Shinomiya, Y.; Yoshida, S. 3D MRI reconstruction based on 2D generative adversarial network super-resolution. Sensors 2021, 21, 2978. [Google Scholar] [CrossRef]
- Wang, S.; Su, Z.; Ying, L.; Peng, X.; Zhu, S.; Liang, F.; Feng, D.; Liang, D. Accelerating magnetic resonance imaging via deep learning. In Proceedings of the 2016 IEEE 13th international symposium on biomedical imaging (ISBI); 2016; pp. 514–517. [Google Scholar] [CrossRef]
- Han, Y.; Sunwoo, L.; Ye, J.C. k-space deep learning for accelerated MRI. IEEE transactions on medical imaging 2019, 39, 377–386. [Google Scholar] [CrossRef]
- Shrot, Y.; Frydman, L. Spatially encoded NMR and the acquisition of 2D magnetic resonance images within a single scan. Journal of Magnetic Resonance 2005, 172, 179–190. [Google Scholar] [CrossRef]
- Pipe, J.G.; Zwart, N.R.; Aboussouan, E.A.; Robison, R.K.; Devaraj, A.; Johnson, K.O. A new design and rationale for 3D orthogonally oversampled k-space trajectories. Magnetic resonance in medicine 2011, 66, 1303–1311. [Google Scholar] [CrossRef] [PubMed]
- Available online: http://mridata.org/list?project=Stanford%20Fullysampled%203D%20FSE%20Knees.
- Zijlstra, F.; Viergever, M.A.; Seevinck, P.R. Evaluation of variable density and data-driven k-space undersampling for compressed sensing magnetic resonance imaging. Investigative radiology 2016, 51, 410–419. [Google Scholar] [CrossRef] [PubMed]
|
Disclaimer/Publisher’s Note: The statements, opinions and data contained in all publications are solely those of the individual author(s) and contributor(s) and not of MDPI and/or the editor(s). MDPI and/or the editor(s) disclaim responsibility for any injury to people or property resulting from any ideas, methods, instructions or products referred to in the content. |
© 2023 by the authors. Licensee MDPI, Basel, Switzerland. This article is an open access article distributed under the terms and conditions of the Creative Commons Attribution (CC BY) license (http://creativecommons.org/licenses/by/4.0/).
