Preprint
Article

Enhanced Expression of Glycolytic Enzymes and Succinate Dehydrogenase Complex Flavoprotein Subunit A by Mesothelin Promotes Glycolysis and Mitochondrial Respiration in Myeloblasts of Acute Myeloid Leukemia

Altmetrics

Downloads

110

Views

57

Comments

0

A peer-reviewed article of this preprint also exists.

Submitted:

29 November 2023

Posted:

30 November 2023

You are already at the latest version

Alerts
Abstract
Acute myeloid leukemia (AML) is an aggressive malignancy characterized by rapid growth and uncontrolled proliferation of undifferentiated myeloid cells. Metabolic reprogramming is commonly observed in the bone marrow of AML patients, as leukemia cells require increased ATP supply to support disease progression. In this study, we examined the potential role of mesothelin as a metabolic modulator in myeloid cells in AML. Mesothelin is a well-known marker of solid tumors that promotes cancer cell proliferation and survival. We initially analyzed alterations in mesothelin expression in the myeloblast subpopulations, defined as SSC-Alow/CD45dim, obtained from bone marrow of AML patients using flow cytometry. Our results showed overexpression of mesothelin in 34.8% of AML patients. Subsequently, metabolic changes in leukemia cells were evaluated by comparing the oxygen consumption rates (OCR) of bone marrow samples derived from adult AML patients. Notably, higher OCR was observed in the mesothelin-positive compared to the mesothelin-low and non-expressing groups. Treatment with recombinant human mesothelin protein enhanced OCR and increased the mRNA expression of glycolytic enzymes and mitochondrial complex II in KG1α AML cells. Notably, siRNA targeting mesothelin in KG1α cells led to reduction of glycolysis-related gene expression but had no effect on the mitochondrial complex gene. The collective results demonstrate that mesothelin induces metabolic changes in leukemia cells, facilitating acquisition of a rapid supply of ATP for proliferation in AML. Therefore, targeting of mesothelin presents a potentially promising approach for mitigating the progression of AML through inhibition of glycolysis and mitochondrial respiration in myeloid cells.
Keywords: 
Subject: Biology and Life Sciences  -   Other

1. Introduction

Acute myeloid leukemia (AML) is characterized by uncontrolled proliferation of myeloblasts in the bone marrow, leading to a lack of cellular differentiation [1,2]. The growth of myeloblasts in AML is highly dependent on the rapid replenishment of adenosine triphosphate (ATP), which fuels their metabolic needs and drives proliferation. Consequently, AML cells undergo metabolic reprogramming to meet these energy demands[3,4]. One significant metabolic alteration observed in the bone marrow of AML patients is increased mitochondrial biogenesis and oxidative phosphorylation (OXPHOS)[3,4,5,6]. Dysfunction of the mitochondrial complex is associated with poor prognosis in AML and therefore considered a potential therapeutic target.
Tigecycline, an inhibitor of OXPHOS, has been shown to promote apoptosis of AML cells and clinical trials are underway to evaluate the efficacy of therapeutic agents targeting the mitochondrial complex I [7]. Studies to date have shown that the efficacy of enasidenib, a drug targeting mutations in the mitochondrial isocitrate dehydrogenase (IDH)2 gene, is limited to less than 13% of patients with IDH2 mutations, which only accounts for a subset of AML cases characterized by unrestricted cell proliferation[8,9]. Similarly, venetoclax, an inhibitor of B-cell lymphoma 2 (Bcl-2), has limited effectiveness as monotherapy. Moreover, both drugs are associated with side-effects, such as cytopenia [10,11,12,13]. At present, the specific signaling pathways and marker proteins associated with changes in OXPHOS observed in the bone marrow of AML patients remain largely unknown, highlighting a crucial need to develop mitochondrial-modulating drugs that comprehensively target the identified metabolic pathways and exert beneficial effects on a larger proportion of AML patients. Such a drug would not only improve the efficacy of treatment but also minimize adverse effects, ultimately leading to better patient outcomes.
Overexpression of mesothelin has been reported in the bone marrow of 36% of pediatric acute myeloid leukemia (AML) patients [14,15]. Under normal conditions, mesothelin expression is limited to mesothelial cells lining the pericardium and pleura [16,17]. Mesothelin is widely recognized as a marker of aggressiveness in lung and pancreatic cancer [15,17,18,19]. Earlier studies demonstrated an increase in pancreatic cancer cell metastasis in mesothelin-overexpressing mice. Conversely, knockout of mesothelin restored normal growth and blood cell counts [20,21]. Recently, mesothelin-targeted agents, such as the secreted phosphoprotein 1 (SS1P) immunotoxin and anti-mesothelin chimeric antigen receptor (CAR)-T cells, have entered clinical trials for mesothelioma and ovarian cancer [22]. These therapies have high safety but limited efficacy as monotherapy.
Mesothelin overexpressed in pancreatic cancer activates Akt signaling [16,23] that is reported to stimulate mitochondrial respiration [24]. Additionally, mesothelin induces the production of interleukin-6 (IL-6), B-cell lymphoma-extra large (Bcl-xL) and cyclin E, promoting cancer cell proliferation [16]. The protein exists in both membrane-bound and soluble forms and contains a CA125 binding domain, participating in CA125-mediated signaling to stimulate cell proliferation and survival [17,25]. In acute myeloid leukemia (AML), activation of phosphatidylinositol-3-kinase (PI3K)/Akt and mammalian target of rapamycin (mTOR) signaling pathways leads to enhanced glycolysis and increased production of reactive oxygen species (ROS) in myeloblasts [25,26]. This metabolic alteration supplies ATP for rapid cell proliferation by increasing the production of citric acid cycle intermediates [14,27,28]. Despite its well-established role in oncogenic signaling and solid tumor growth, the precise signaling pathways of mesothelin in hematopoietic malignancies remain unclear. Furthermore, the impact of mesothelin on metabolic reprogramming is yet to be established.
In this study, we analyzed mesothelin expression in the bone marrow of adult AML patients and explored the associated metabolic changes, in particular, mitochondrial respiration. The correlation between mesothelin expression and metabolic alterations was investigated by categorizing patients based on metabolic status. Our collective findings suggest that mesothelin acts as a metabolic modulator, promoting ATP production for continuous proliferation and survival of myeloblasts in bone marrow of AML patients.

2. Results

2.1. Myeloblasts from patients with acute myeloid leukemia exhibit varying levels of mesothelin expression

Mesothelin is overexpressed in various solid tumors, such as lung, pancreatic, and ovarian cancer, and shown to contribute to cancer cell proliferation, migration, and survival [16,19,20,21,25]. Conversely, under physiological conditions, mesothelin is exclusively detected in normal restrictive mesothelial cells. In the bone marrow of acute myeloid leukemia, we observed a significant increase in the population of myeloblasts exhibiting moderate expression of CD45 and low side scatter (SSC-Alow) (Figure 1A). In contrast, normal bone marrow comprised populations of CD45high/SSC-Ahigh monocytes and mature lymphocytes, CD45low/SSC-Alow red blood cells, as well as hematogones. Following induced remission therapy, the population of myeloblast cells vanished and the bone marrow exhibited recovery of normal cell populations. We further investigated mesothelin expression in myeloblasts of AML patients with the aid of flow cytometry. Our findings revealed that among AML patients, the proportion of mesothelin-positive myeloblasts exhibiting CD45dim/SSC-Alow characteristics was highest (22.2%) before remission induction therapy. Mesothelin positivity normalized after treatment, as shown in Figure 1A. However, in the population of CD45high/SSC-Ahigh monocytes and mature lymphocytes within the bone marrow of the same patient, mesothelin-positive cell populations were not detectable at diagnosis or after treatment (Figure 1). Subsequently, patients were categorized based on the intensity of mesothelin expression. Remarkably, the population of mesothelin-positive CD45dim/SSC-Alow myeloblasts ranged from 1.57% to 22.2% in 8 out of 19 AML patients at diagnosis, while the remaining 11 patients had <1% mesothelin-positive myeloblasts (Figure 1B), as confirmed viaflow cytometry. Following induced remission therapy, the majority of patients showed a significant reduction in mesothelin-positive cells, except for one patient who maintained a mesothelin-positive myeloid cell population of 6%. In contrast to the CD45dim/SSC-Alow myeloblast population, mesothelin-positive cells were not detectable in the CD45high/SSC-Ahigh monocyte and mature lymphocyte populations (Figure 1C) in both untreated and treated samples, with the exception of one patient who had a mesothelin-positive cell population of 3.74% (Figure 1C). Characteristics of AML patients are listed in Table 1. The collective findings suggest that mesothelin is induced in myeloblasts and differentially expressed among AML patients. Furthermore, elimination of the mesothelin-positive myeloblast population after induced remission therapy implies a crucial role of mesothelin in the malignancy of AML cells within the bone marrow.

2.2. Mitochondrial respiration is enhanced in bone marrow of AML patients with mesothelin positivity

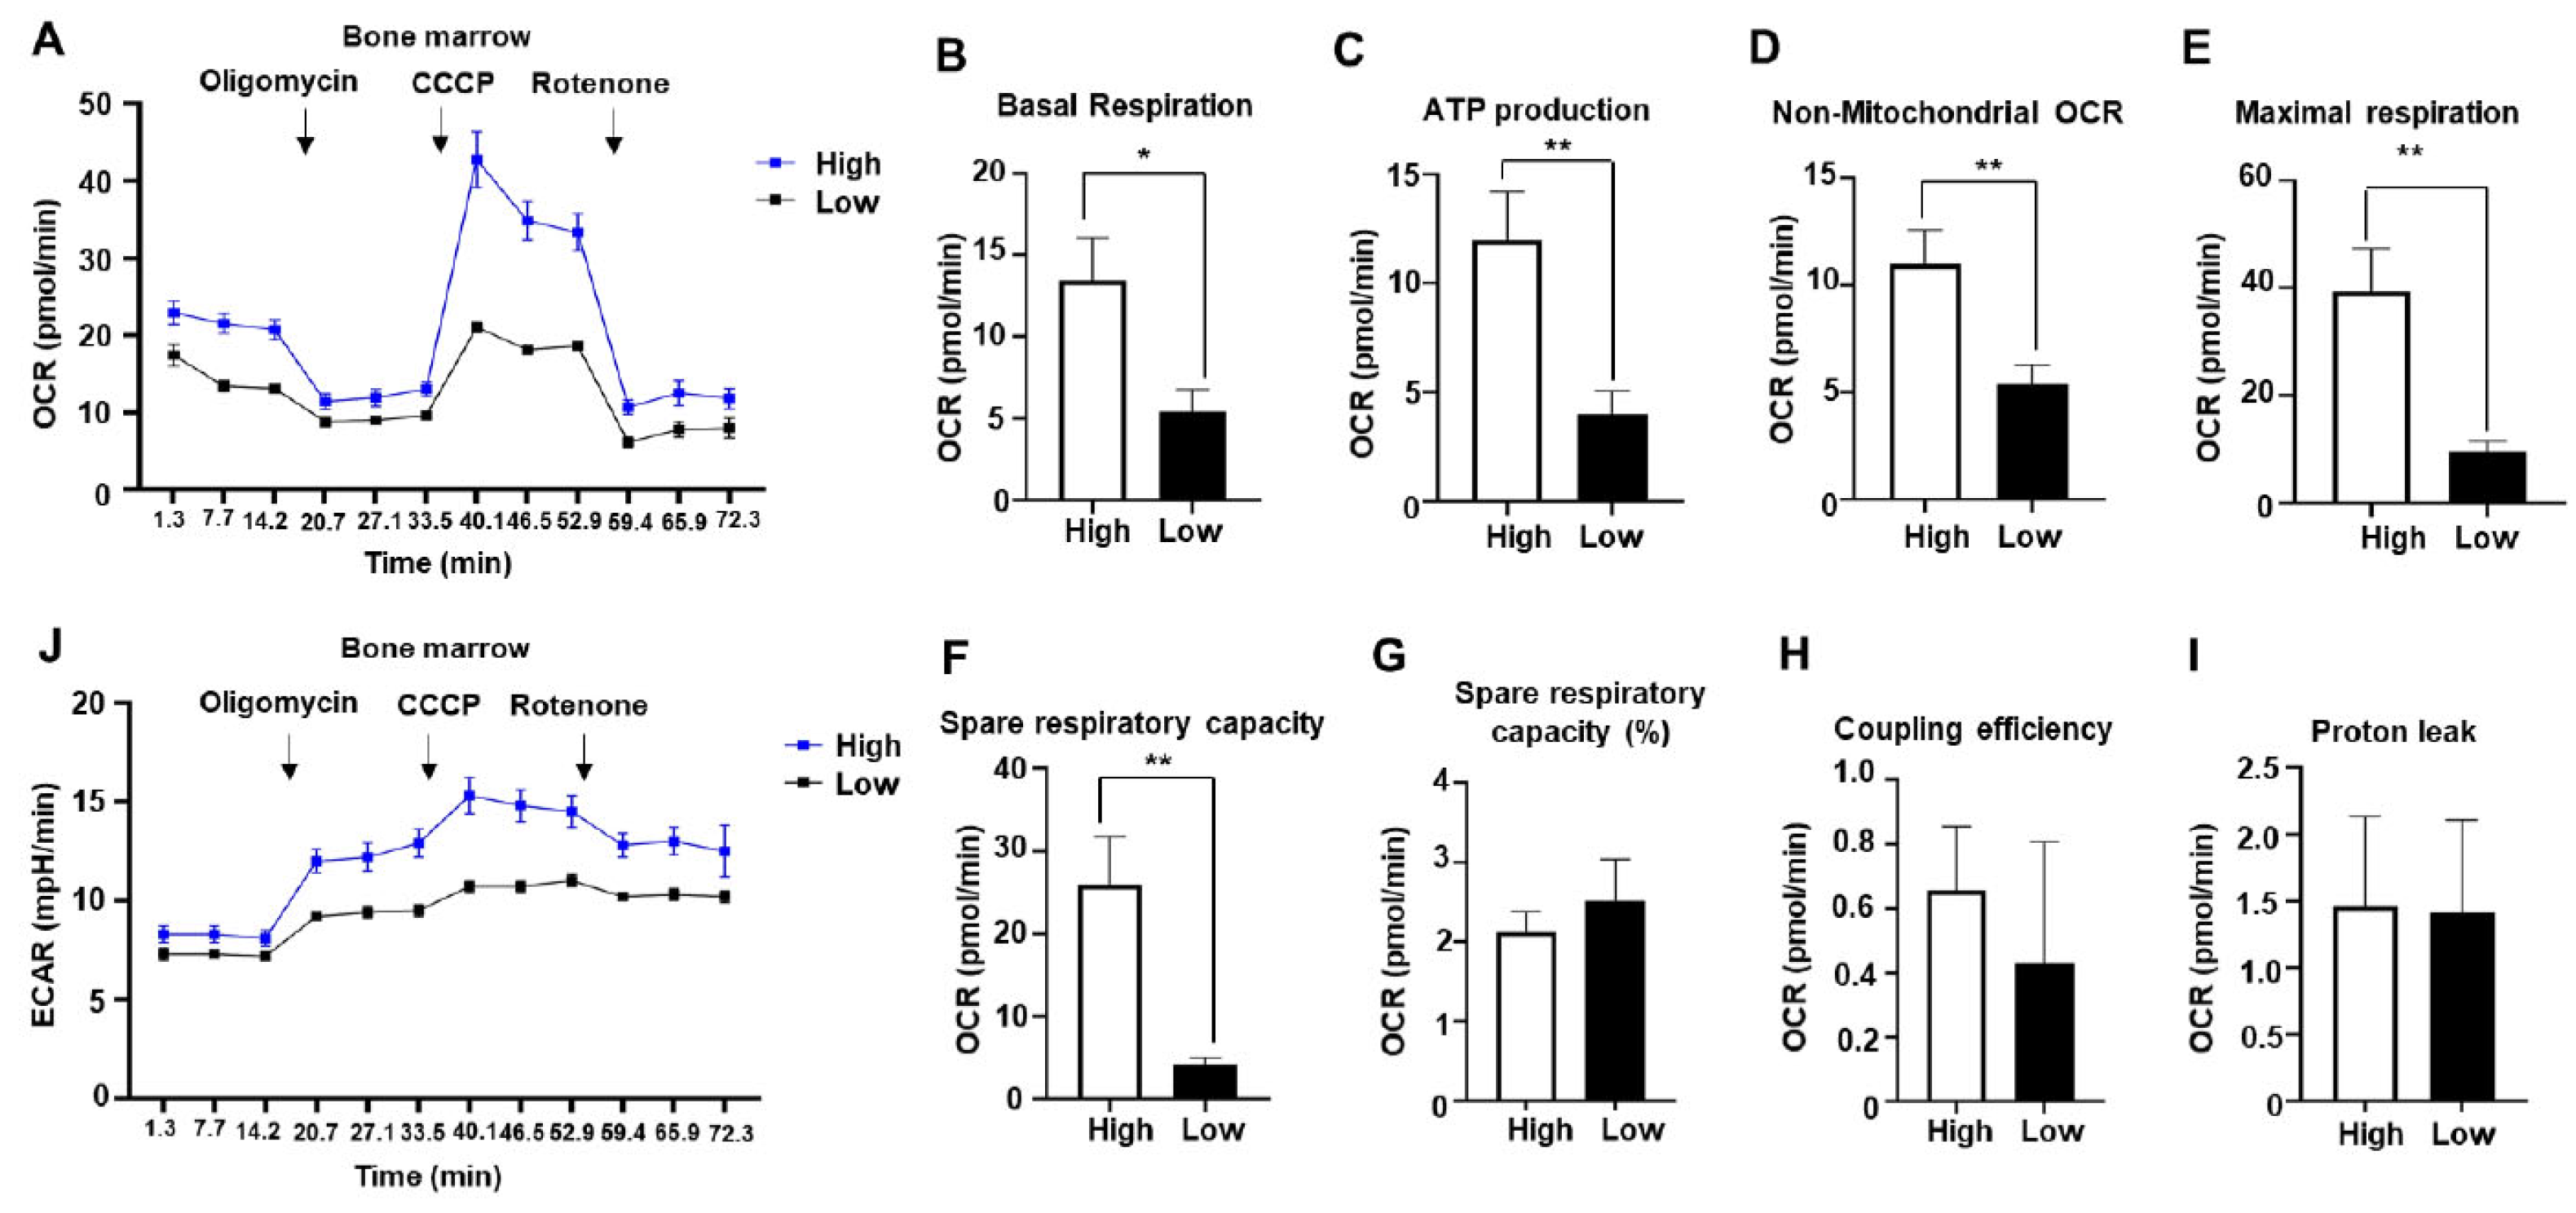
AML myeloblasts have a high demand for ATP to support their continuous proliferation and survival [5,26]. Metabolic alterations, including changes in mitochondrial bioenergetics and glycolysis, commonly occur in AML [3,4,5,6,14,29]. Previous studies have shown enhanced biogenesis of mitochondria and activity of mitochondria complexes II and V in the bone marrow of pediatric AML patients [14]. In this study, we investigated whether similar mitochondrial and glycolytic changes occur in adult bone marrow. To assess mitochondrial respiration and glycolysis, we measured the oxygen consumption rate (OCR) of bone marrow using an XF96 analyzer. The key parameters of mitochondrial respiration and glycolysis were determined by measuring baseline OCR and sequentially injecting oligomycin (a complex I inhibitor), carbonyl cyanide 3-chlorophenylhydrazone (CCCP, an uncoupler), and rotenone (an ATPase inhibitor). Spare respiratory capacity (SRC) was calculated as the difference between basal and maximal respiration, reflecting the capacity of cells to respond to stress. Notably, comparison of AML patients with a high percentage of mesothelin-positive cells to those with no mesothelin expression or <1% mesothelin-positive cells revealed significantly higher OCR in the mesothelin-high group (Figure 2A). Overall, the mesothelin-high group exhibited higher levels of basal respiration, ATP production, non-mitochondrial OCR, maximal respiration, and spare respiratory capacity (SRC) relative to the mesothelin-low group with increases of 2.48-, 2.99-, 2.04-, 4.08- and 6.12-fold, respectively (Figure 2B-F). However, SRC (%), coupling efficiency, and proton leak were comparable between the two groups (Figure 2G-I). Additionally, to assess glycolytic activity in the AML bone marrow of each group, we simultaneously measured the extracellular acidification rate (ECAR) alongside OCR. An increase in ECAR in the mesothelin-high group was observed at baseline and after injection of mitochondrial inhibitors (Figure 2J). Our results indicate that both mitochondrial respiration and glycolysis are enhanced in AML bone marrow of the mesothelin-high compared to the mesothelin-low group, suggesting that increased mesothelin expression is associated with metabolic alterations in AML bone marrow.

2.3. Enhancement of mitochondrial respiration and ATP production in AML cells by mesothelin stimulation

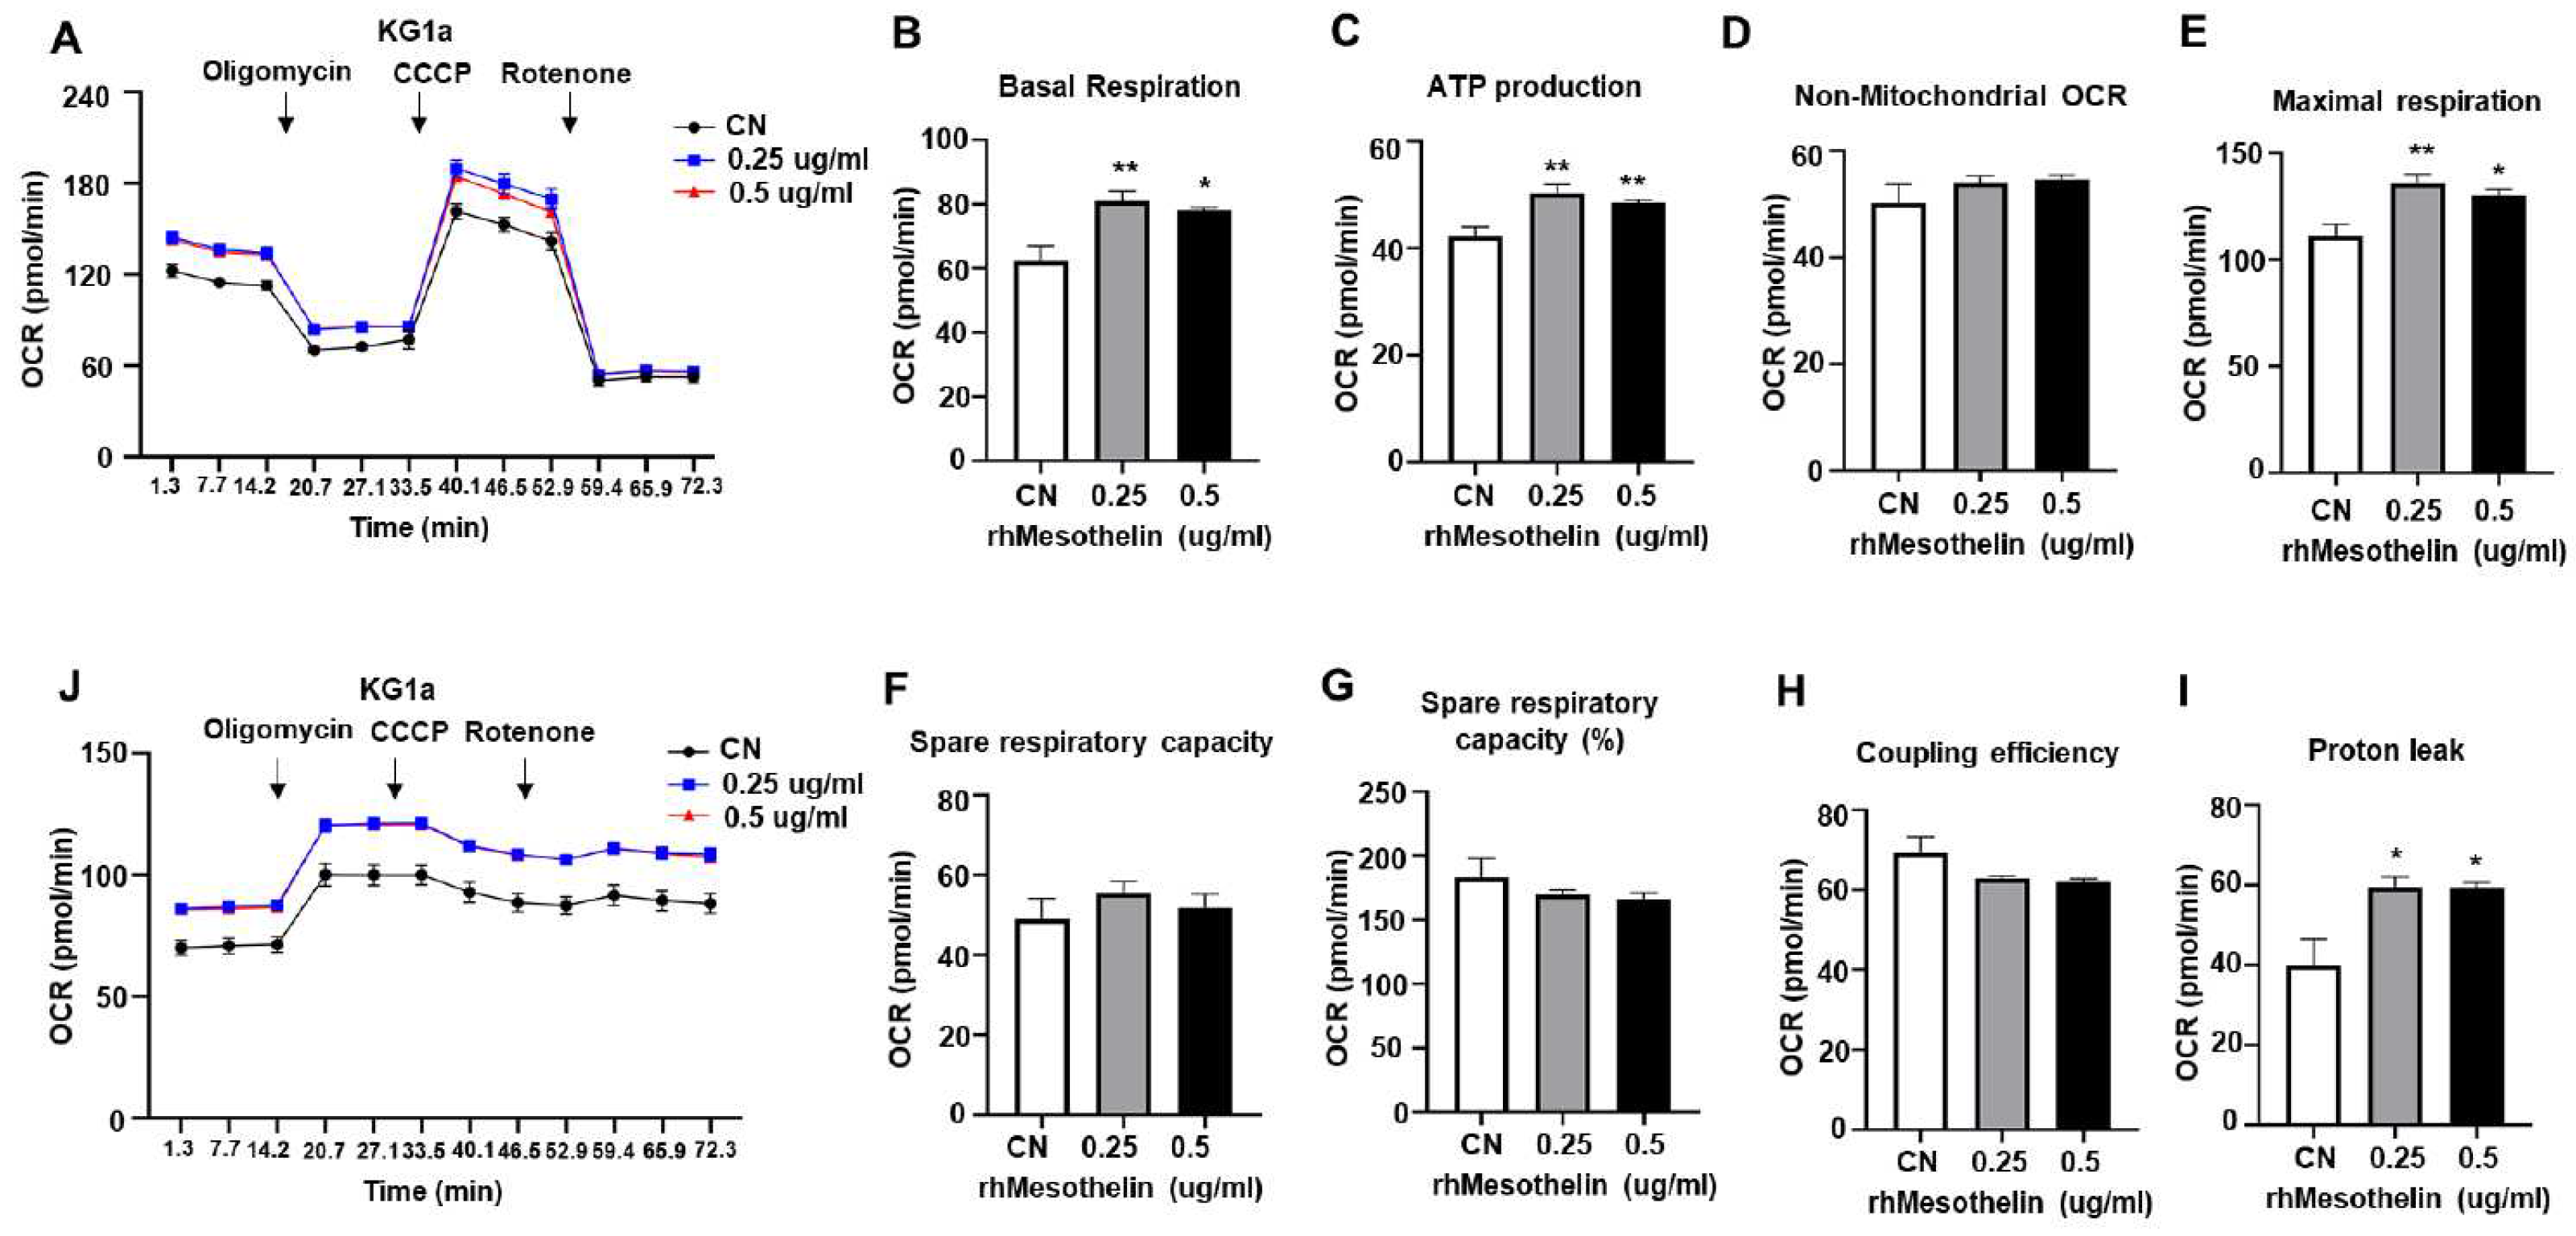
Mesothelin is overexpressed in solid tumors and plays a role in activating Akt/PI3K and mTOR signaling pathways, thereby promoting cancer cell proliferation and survival. The protein interacts with CA125 [17,25,30] and has been linked to Akt-induced IL-6 production associated with enhanced mitochondrial respiration in pancreatic cancer [12,16]. Moreover, cyclin E1 stimulation by mesothelin contributes to cancer cell proliferation and survival, which rely on ATP supply from both mitochondria and glycolysis [12,26]. Considering the increased oxygen consumption rate (OCR) and extracellular acidification rate (ECAR) in bone marrow of the mesothelin-high group, we postulated that mesothelin modulates metabolism in AML. To establish the influence of mesothelin on AML, the KG1α AML cell line was treated with 0.25 μg/ml or 0.5 μg/ml recombinant human (rh) mesothelin peptide (rhMesothelin) for 1 h. Subsequently, OCR and ECAR were measured to exclude the specific environmental effects of complex signaling networks that impact mitochondrial respiration and glycolysis in bone marrow of AML patients (Figure 3A). Notably, the average basal OCR of cells treated with rhMesothelin increased by 30.0% at a concentration of 0.25 μg/ml and 25.3% at a concentration of 0.5 μg/ml (Figure 3B) compared to vehicle-treated control cells. ATP production showed a respective increase of 19.0% and 14.5% (Figure 3C) in the 0.25 μg/ml and 0.5 μg/ml rhMesothelin-treated groups while non-mitochondrial respiration remained comparable between the groups (Figure 3D). Regarding maximal respiration, OCR increased by 21.8% and 16.7% in the presence of 0.25 μg/ml and 0.5 μg/ml rhMesothelin (Figure 3E), respectively, while parameters such as SRC, SRC (%), and coupling efficiency were not significantly altered (Figure 3F-H). Moreover, proton leak was 48.6% and 48.0% higher in cells treated with 0.25 and 0.5 μg/ml rhMesothelin, respectively (Figure 3I). In terms of glycolysis, we observed a significant increase in ECAR in KG1α cells after 1 h of incubation with rhMesothelin (Figure 3J).
Interestingly, maximal respiration of KG1α cells was significantly reduced following mesothelin knockdown using siRNA, along with a decrease in spare respiratory capacity (Figure S1A-I). However, ECAR of mesothelin knockdown cells remained unchanged (Figure S1J). The relatively smaller change between negative control and siMesothelin-treated groups may be attributable to the remaining mesothelin. Mesothelin mRNA expression remained at 41.3%, even after siRNA treatment. Overall, our findings provide evidence that mesothelin modulates mitochondrial respiration and glycolysis of AML cells. Although treatment of KG1α cells with rhMesothelin resulted in enhanced basal respiration, ATP production, and maximal respiration, consistent with the metabolic profile observed in mesothelin-high AML bone marrow, as depicted in Figure 2, we observed no significant effects of rhMesothelin on spare respiratory capacity (SRC) and non-mitochondrial OCR. Furthermore, mesothelin-high AML bone marrow exhibited a proton leak comparable to that of the mesothelin-low group, whereas significant induction of proton leak was observed in the rhMesothelin-treated cells. It should be noted that since we did not perform sorting of mesothelin-enriched myeloblasts and measured OCR and ECAR in the total bone marrow, which comprises ~90% myeloblasts and 10% monocytes and mature lymphocytes, the observed discrepancy in OCR parameters between mesothelin-high bone marrow and rhMesothelin-treated AML cell groups may have arisen as a result of these factors. The collective results clearly indicate that mesothelin alters cancer metabolism to facilitate rapid production of ATP.

2.4. Induction of glycolytic enzymes and mitochondrial complex II gene expression by mesothelin in AML cells

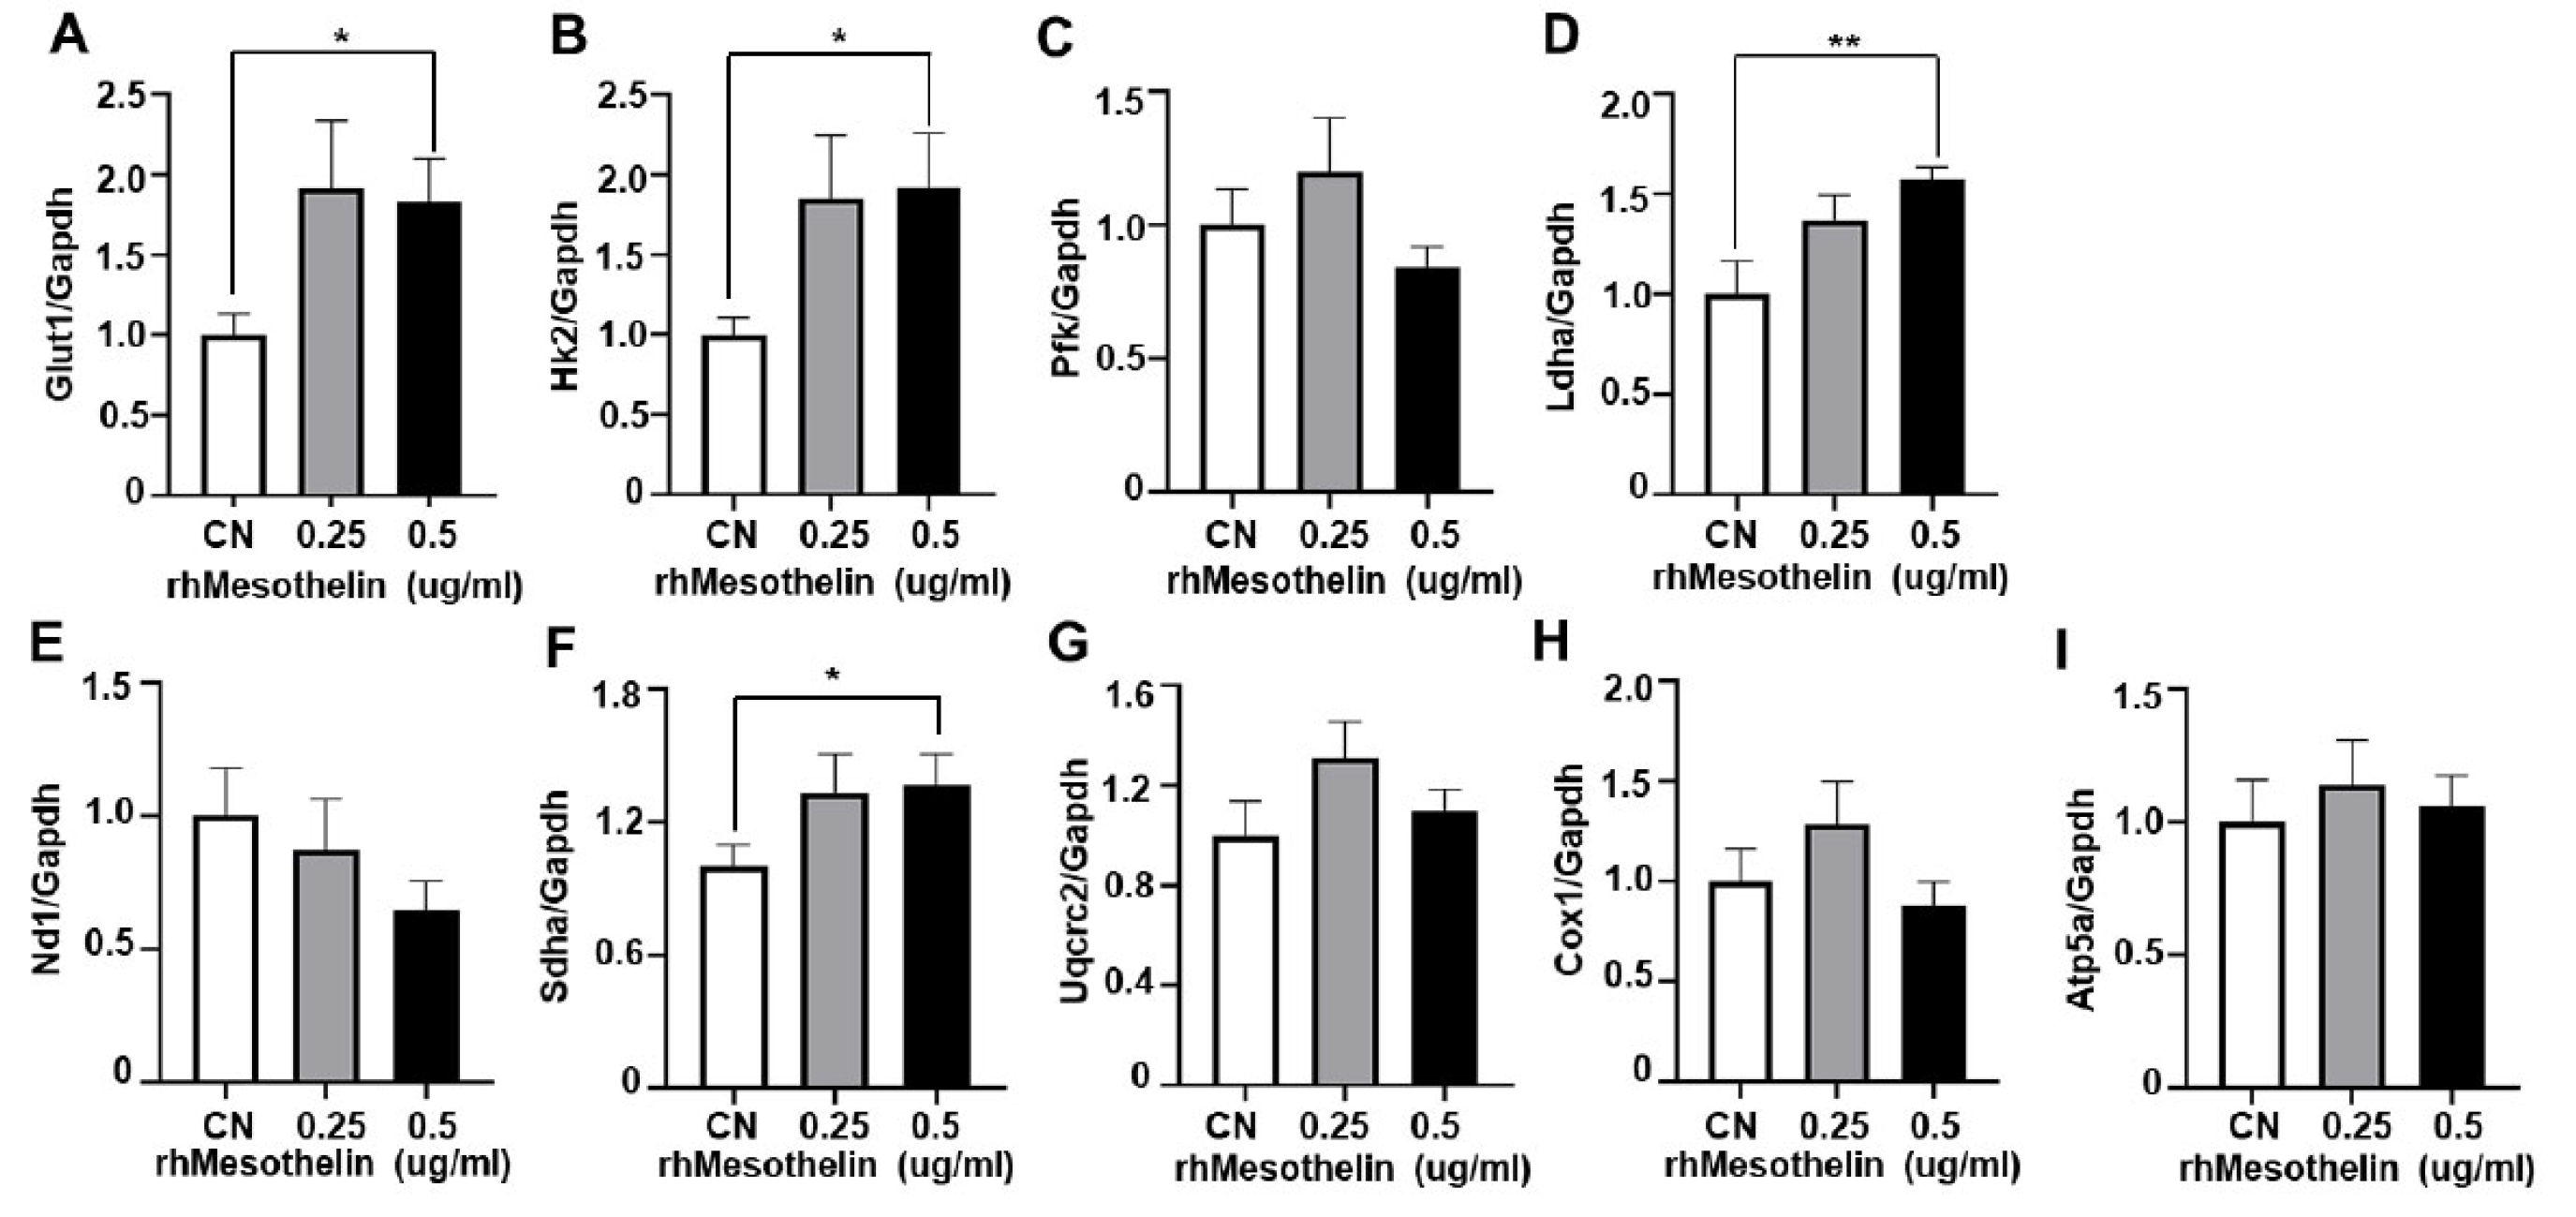
Mesothelin stimulates the Akt pathway in solid tumors [12,23] that is known to increase mitochondrial respiration [24]. In our experiments, rhMesothelin treatment altered the metabolic state of AML cells (Figure 3). In tumor cells, glycolysis serves as a primary source of ATP [26,31,32]. rhMesothelin treatment led to increased ECAR in AML cells, indicating enhanced glycolytic function influenced by glucose transporter and glycolytic pathway enzymes resulting in lactate production. Accordingly, we examined mRNA levels of glucose transporter 1 (GLUT1), hexokinase 2 (HK2), phosphofructokinase (PFK), and lactate dehydrogenase A (LDHA) via quantitative reverse transcriptase PCR (qRT-PCR) in KG1α cells treated with 0.25 or 0.5 μg/ml rhMesothelin for 24 h. After 24 h of rhMesothelin treatment (0.5 μg/ml), mRNA levels of Glut1 and HK2 were significantly increased by 1.83- and 1.92-fold, respectively (Figure 4A,B). However, mRNA levels of PFK were not significantly different between the groups (Figure 4C). Regarding lactate production, the mRNA level of LDHA was elevated by 1.57-fold at a rhMesothelin concentration of 0.5 μg/ml (Figure 4D). These findings demonstrate that mesothelin promotes glycolysis by inducing the mRNA expression of glycolytic enzymes in AML cells.
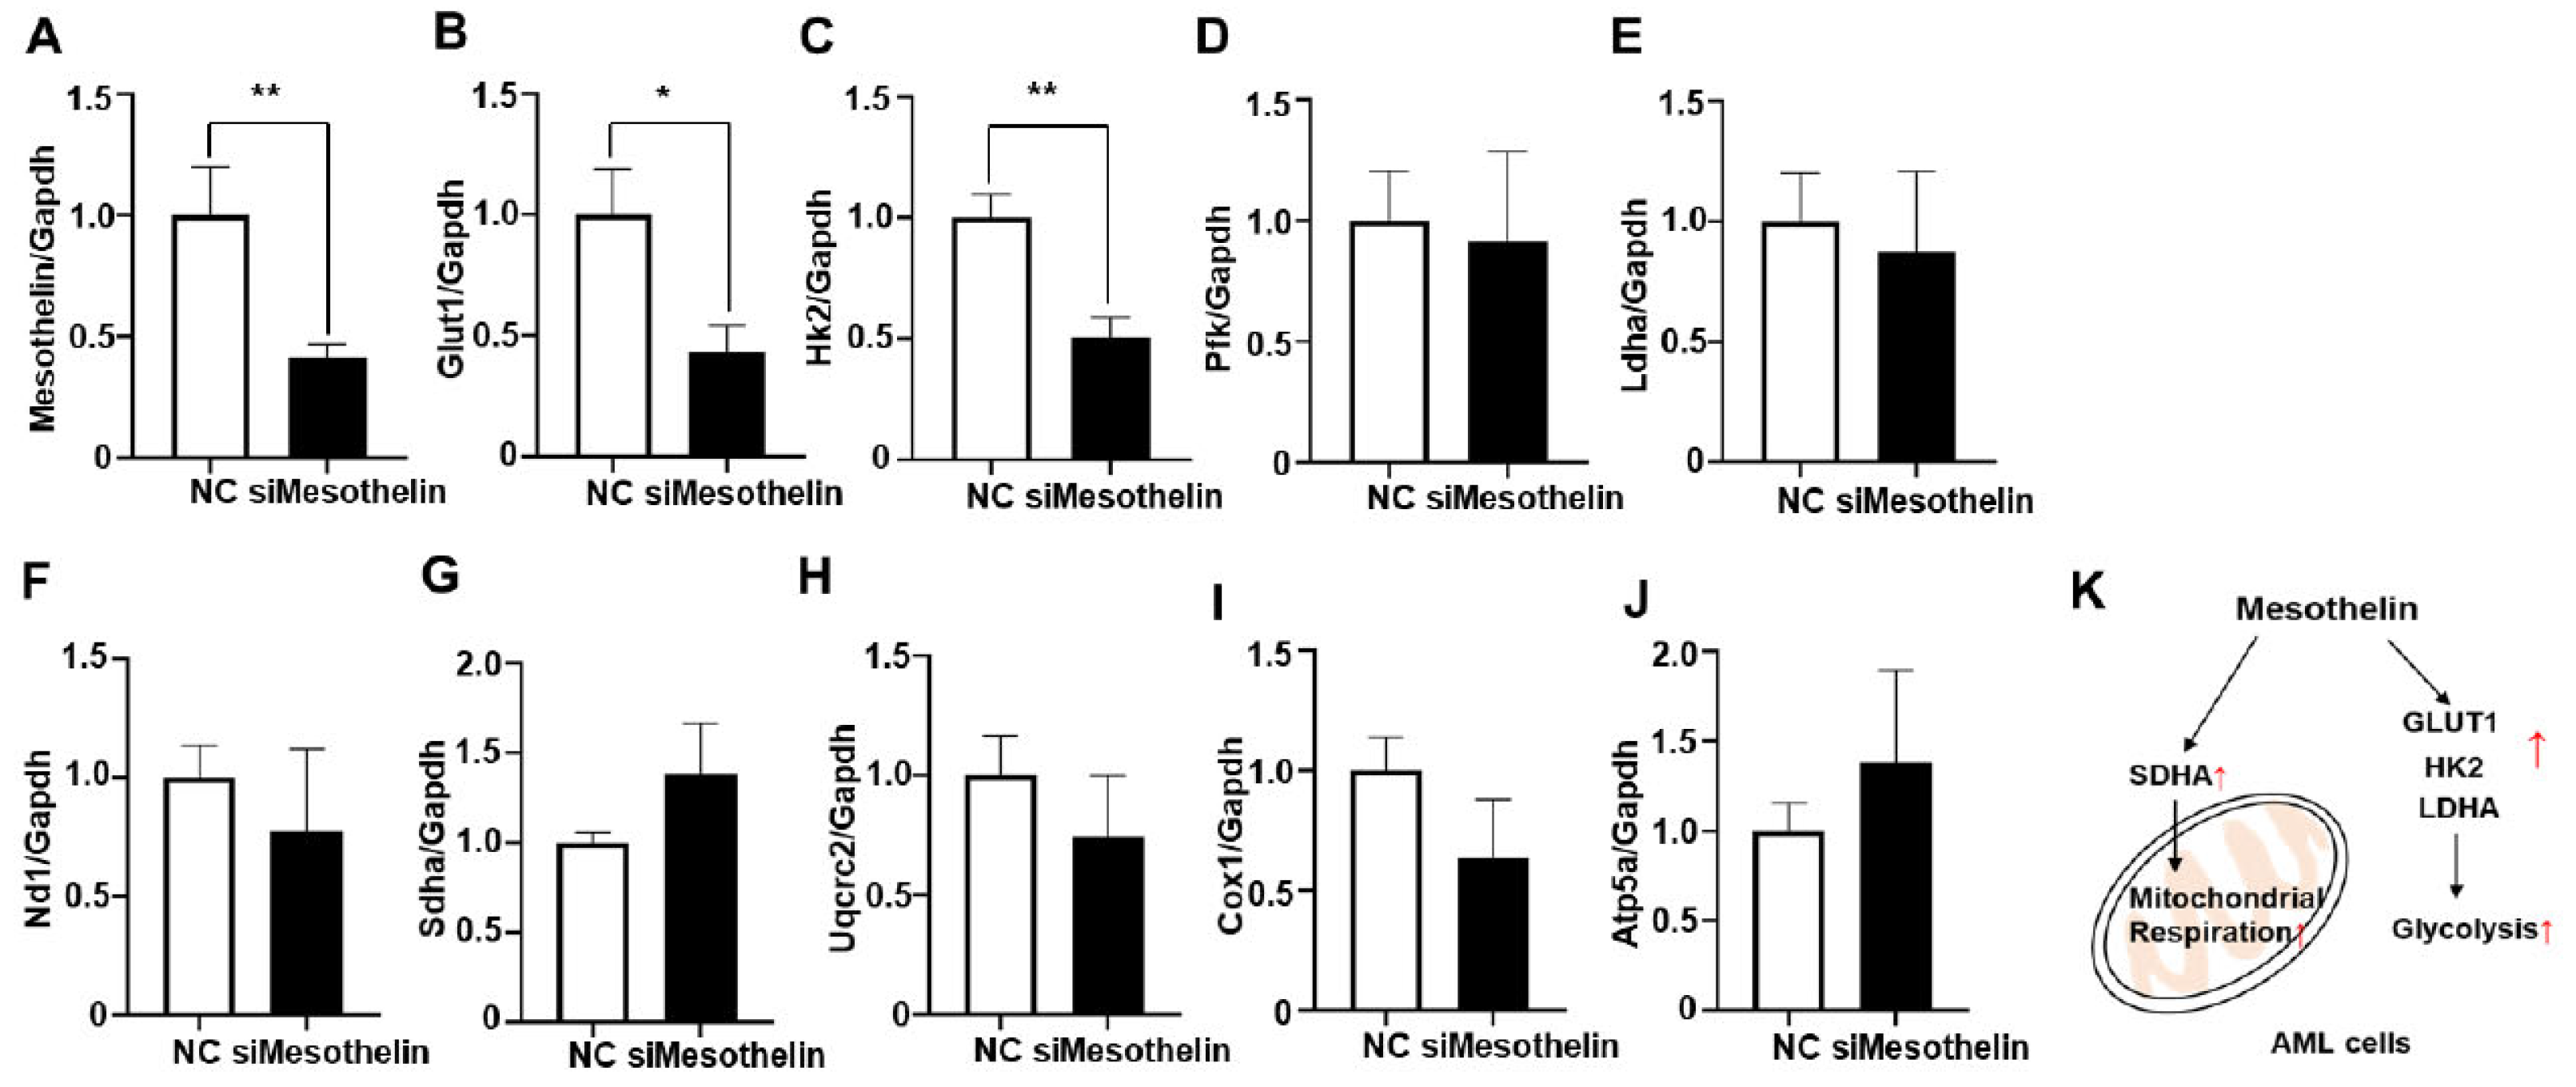
We additionally observed a significant increase in baseline OCR, ATP production, and maximal respiration of AML cells in response to rhMesothelin treatment (Figure 3). Previous reports indicate that increased succinate dehydrogenase complex flavoprotein subunit A (SDHA) activity enhances mitochondrial metabolism in tumor cells, leading to changes in basal and maximal OCR [28]. Accordingly, qPCR analysis was conducted to ascertain whether mesothelin affects the expression levels of mitochondrial complex genes in AML cells. To assess potential alterations in oxidative phosphorylation (OXPHOS) complex genes, we analyzed mRNA expression levels of NADH dehydrogenase subunit 1 (ND1) of complex I (Figure 4E), Sdha of complex II (Figure 4F), Ubiquinol-Cytochrome C Reductase Core Protein 2 (UQCRC2) of complex III (Figure 4G), Cytochrome c oxidase I (COX1) of complex IV (Figure 4H), and ATP Synthase F1 Subunit Alpha (ATP5A1) of complex V (Figure 4I) in KG1α cells treated with rhMesothelin at concentrations of 0.25 or 0.5 μg/ml. The Sdha mRNA level was 1.36-fold increased after incubation of rhMesothelin (0.5 µg/ml) (Figure 4F), suggesting that mesothelin enhances mitochondrial respiration by inducing complex II- associated gene expression. Notably, significant induction of Glut1, Hk2, Ldha and Sdha mRNA by rhMesothelin was observed only at the higher concentration of 0.5 μg/ml, while there was a tendency of increased expression without reaching significance at the lower concentration. This discrepancy may be attributed to the duration of gene transcription stimulated by rhMesothelin. The collective findings indicate that mesothelin markedly upregulates transcription of Sdha, a constituent of mitochondrial complex II, thereby enhancing mitochondrial respiration and the expression of genes encoding glycolytic pathway-associated enzymes in AML cells. Next, we performed knockdown of mesothelin using siRNA in KG1α cells. The mesothelin mRNA level was decreased by 58.7% after 48 h of siRNA transfection. Moreover, Glut1 and Hk2 mRNA levels were reduced by 43.3% and 50.5% in Mesothelin KD cells, respectively (Figure 5A-J). Our data suggest that mesothelin selectively induces glycolytic enzymes and the mitochondrial complex II gene Sdha. In addition, mesothelin enhanced both mitochondrial respiration and glycolysis, leading to increased ATP production in AML cells (Figure 5K).

3. Discussion

Acute myeloid leukemia (AML) is a hematological malignancy characterized by uncontrolled proliferation of immature myeloblasts in the bone marrow [5,26]. Genetic mutations in AML are heterogeneous, resulting in varying treatment responses and difficulty in identifying specific targets for complete remission [33]. Recent studies indicate that abnormal metabolism, attributed to proteins that modulate metabolic processes, contributes to the proliferation and progression of AML myeloblasts [3,4,5,6,14,26]. In the current study, we investigated the metabolic alterations in adult AML bone marrow and identified a key modulator protein involved in mitochondrial respiration and the glycolytic pathway.
AML cells have a higher demand for ATP to support their rapid proliferation and survival and possess a larger mitochondrial content compared to normal hematopoietic cells [3,4,27]. Mitochondrial dysfunction and defects in mitochondrial proteins are associated with poor prognosis and chemotherapy resistance in AML [29,34]. Leukemic cells also tend to upregulate fatty acid oxidation through mitochondrial uncoupling [35]. Pharmaceutical compounds targeting mitochondria and metabolism of AML blasts have been developed that are currently undergoing clinical trials [11,13,36]. Tigecycline, an OXPHOS inhibitor, induces apoptosis in AML cells by inhibiting mitochondrial complex I and etomoxir, an inhibitor of mitochondrial fatty acid oxidation, reduces ATP production. L-deprenyl suppresses mitochondrial respiration and glycolysis, leading to AML cell death [1]. FDA-approved drugs, such as enasidenib and venetoclax, are only beneficial in a limited proportion of patients with mitochondrial genetic mutations in IDH2 and Bcl-2, respectively, that promote leukemogenesis [8,9,10,11,13]. Despite significant advances in these metabolism and mitochondrial-targeting approaches, unclear signaling pathways of the drug targets, limited applicability, and side-effects continue to pose challenges in AML treatment. Accordingly, we focused on mitochondrial and cellular metabolism-modulating proteins with a view to identifying the target pathways in AML cells.
Mesothelin is upregulated in bone marrow of one-third of pediatric AML patients and known for its oncogenic properties in solid tumors, including pancreatic and ovarian cancer [15,19,20,22,37]. Enhanced pancreatic tumor metastasis due to Akt signaling and mitochondrial respiration has been reported in mice with overexpression of mesothelin [16,20,21]. Furthermore, mesothelin promotes cancer cell survival and proliferation through activation of cyclin E and IL-6 signaling pathways [16]. Considering that Akt and mTOR signaling enhance glycolysis in AML myeloblasts, we investigated whether mesothelin expression is augmented in adult AML bone marrow in association with metabolic alterations. To achieve this, AML bone marrow samples were grouped into mesothelin-high and -low groups and metabolic parameters compared between groups. Notably, the mesothelin-high group showed enhanced glycolysis and mitochondrial respiration. Moreover, mesothelin significantly induced mRNA expression of glycolytic pathway-related enzymes and succinate dehydrogenase complex flavoprotein subunit A (SDHA) of mitochondrial complex II. These gene expression alterations potentially account for the increased ATP requirement necessary for rapid growth of AML cells.
It is important to acknowledge that our study did not solely sort myeloblasts for measurement of OCR and ECAR. Since ~90% of cells in AML bone marrow comprise myeloblasts, the presence of other cell types (such as monocytes and mature lymphocytes) cannot be completely excluded. Therefore, sorting and performing measurements on myeloblast cells exclusively would yield more accurate and conclusive data, which may reveal potential differences between the results obtained from mesothelin-treated cells and the overall cell population. Further investigations to elucidate the role of mesothelin using additional approaches are warranted, such as utilizing mesothelin knockout mice. Analysis of the correlations among metabolic changes, mesothelin expression, protein, and mRNA levels in actual patient samples should provide clearer insights into the impact of mesothelin signaling on disease progression and prognosis.
Furthermore, it would be beneficial to assess the current status and limitations of mesothelin inhibitors, such as mesothelin-targeted CAR-T and its impact on metabolism regulation. In combination with metabolism-regulating drugs, modulation of mesothelin may provide an effective treatment strategy for AML patients of all ages, thereby overcoming the low genetic mutation rates associated with conventional drugs. We have additionally identified specific chromosomal relocations, such as histone–lysine N-methyltransferase 2 (KMT2) rearrangement (Table 1), in a number of patients with high mesothelin levels. Confirmation of metabolic changes in a larger sample size of patients possessing both genetic mutations and high mesothelin levels may serve as a marker for targeted metabolic therapies and prognostic prediction. In summary, we have identified mesothelin as a key protein in AML cell metabolism that represents a promising target for AML therapy.

4. Materials and Methods

4.1. Cell culture and transfection

KG1α, human acute myeloid leukemia (AML) cell was cultured in Iscove's Modified Dulbecco's Medium (IMDM, Welgene, South Korea) containing 10% FBS (Hyclone, MA, USA), 1% penicillin and streptomycin (Hyclone, MA, USA) at 37 °C under 5% CO2 and 21% O2 condition. KG1α cells were transfected with siRNA oligo duplexes targeting human Mesothelin and negative control siRNA (ORIGENE, MD, USA) using Lipofectamine 2000 (Invitrogen, CA, USA).

4.2. Human bone marrow samples

Bone marrow samples from 23 AML patients and 5 healthy individuals were obtained from the hematology/oncology department of Chungnam National University Hospital, South Korea. The demographic characteristics of these patients are presented in Table 1. With reference to previous studies, experiments were performed on selected patients with AML with expected mesothelin expression, particularly those with KMT2A gene rearrangements and core binding factor fusions [14]. This study was conducted in accordance with the provisions of the Declaration of Helsinki with the approval of the institutional review board (approval number, CNUH2018-08-013-008). Written informed consent was obtained from each outpatient.

4.3. Flow cytometry of bone marrow samples

Frozen bone marrow stock was thawed and resuspended in RPMI1640 medium. The suspension was centrifuged at 300xg for 3 min and the supernatant discarded. Next, cells were treated with 100 μg/ml DNase I (Stemcell, Vancouver, Canada) for 10 min, filtered through a 70 μm cell strainer (SPL, Gyeonggi, South Korea), and incubated at 37°C under 5% CO2 and 21% O2 for 16 h. Bone marrow cells (2-5 × 10⁵ cells in a 5 ml FACS tube) were rinsed with PBS. After centrifugation at 1000 rpm for 3 min, PBS was discarded, 1 μM of live/dead dye (Thermo Fisher Scientific, MA, USA) added and incubated for 15 min in the dark. Next, cells were washed with 1% BSA (Gibco, MT, USA) for blocking, which was removed after centrifugation. A rabbit anti-human mesothelin-APC antibody (Abcam, Cambridge, UK) and rabbit anti-human CD45-FITC antibody (Abcam) were used to analyze cell surface expression of mesothelin in myeloblasts. Cells were incubated with the above antibodies for 40 min at 4°C. Following a wash with 1% BSA buffer and centrifugation at 1000 rpm for 3 min, the remaining cells were resuspended in 1% BSA and filtered using a 100 μm cell strainer. Fluorescence was detected using a FACS Novo flow cytometer (BD Biosciences, NJ, USA) with excitation/emission wavelengths of 485/535 nm for CD45-FITC, 550/580 nm for mesothelin-APC, and 510/580 nm for live/dead™ dye (Thermo Fisher Scientific). Values are presented as mean fluorescence intensity and the percentage of positive cells in the cell population determined using FlowJo software (BD Biosciences, NJ, USA).

4.4. Measurement of oxygen consumption rate (OCR) and extracellular acidification rate (ECAR)

Bone marrow samples from AML patients and healthy individuals were washed with Seahorse XF RPMI1640 media (pH 7.4, Agilent, CA, USA) and plated in poly-D-lysine (Gibco, MT, USA) coated 96 well microplate (2×10⁵ cells/ well, Agilent, CA, USA). KG1α (1×10⁵ cells/ well) cells were incubated with or without rhMesothelin (0.25 or 0.5 ug/ml, Abcam, Cambridge, UK) for 1 hour. After centrifugation, the media was removed and the cells were washed with Seahorse XF DMEM media (pH 7.4). Subsequently, the cells were plated in poly-D-lysine-coated 96-well microplates. Baseline OCR of the bone marrow or KG1α cells was measured by XFe96 analyzer (Seahorse, MA, USA). Mitochondrial inhibitors that oligomycin A (20 µg/ml), an ATPase inhibitor (Sigma-Aldrich, Saint Louis, MO, USA), carbonyl cyanide 3-chlorophenylhydrazone (CCCP, 50 µM), an uncoupler (Sigma-Aldrich, MO, USA) and rotenone (20 µM), a mitochondrial complex I inhibitor (Sigma-Aldrich, MO, USA) were sequentially injected into each well and OCR was measured after injection at 37℃. ECAR was simultaneously measured with OCR using the XFe96 analyzer. OCR parameters were calculated by WAVE software (Agilent, CA, USA).

4.5. RNA isolation and quantitative real- time PCR

KG1α (2× 10⁵ cells per well of 6-well plate) cells incubated with or without rhMesothelin (0, 0.25, or 0.5 ug/ml) for 24h were harvested and total RNA was isolated using Trizol reagent (Invitrogen, MA, USA). cDNA was synthesized using reverse transcription kit (Invitrogen, MA, USA) according to manufacturer’s instruction. cDNA (100 ng), forward and reverse primers (10 pmole), 2X SYBR Master Mix (Appliedbiosystems, MA, USA), and distilled water were mixed and the mRNA expression levels were determined using a CFX96 Real-time PCR detection system (Biorad, CA, USA). The expression level of each gene was normalized to GAPDH and presented as relative expression. Primers used in this study : GLUT1, 5’-GCCCTGGATGTCCTATCTGA-3’ (forward) and 5’-CCCACGATGAAGTTTGAGGT-3’ (reverse); HK2, 5’-TAGGGCTTGAGAGCACCTGT-3’ (forward) and 5’-CCACACCCACTGTCACTTTG-3’ (reverse); PFK, 5’- GAAGAGCCCTTCGACATCAG -3’ (forward) and 5’-TCTTCCTGCAGTCAAACACG-3’ (reverse); LDHA, 5’-TGTGCCTGTATGGAGTGGAA-3’ (forward) and 5’-AGCACTCTCAACCACCTGCT-3’ (reverse); ND1, 5’-ATATGACGCACTCTCCCCTG-3’ (forward) and 5’-TGAGTTGGTCGTAGCGGAAT-3’ (reverse); SDHA, 5’-TAGTTGGGGCTACAGGTGTG-3’ (forward) and 5’-GGATCACTTGAGACCAGCCT-3’ (reverse); UQCRC2, 5’-TCTTGTCCATGCTGCTTTTG-3’ (forward) and 5’-CGAGGACATGCTGAAGAACA-3’ (reverse); COX1, 5’- ACGTTGTAGCCCACTTCCAC-3’ (forward) and 5’-TGGCGTAGGTTTGGTCTAGG-3’ (reverse); GAPDH, 5’- TGCCTCCTGCACCACCAACT-3’ (forward) and 5’-ACACGTTGGCAGTGGGGACA-3’ (reverse); Mesothelin, 5’-TACAAGAAGTGGGAGCTGGA-3’ (forward) and 5’- TTGTGGGTAGAGCTCATCCA -3’ (reverse).

4.6. Statistical analysis

Statistical analysis of the data was conducted using Prism version 8 software (GraphPad, CA, USA). The data are presented as mean ± SD (error bars). The significance of differences between the control and experimental groups was analyzed using a one-tailed Student's t-test. A p-value < 0.05 was considered statistically significant.

Author Contributions

YJ: JSK, JHP, SC, PTTD, SHK and ICS contributed to study design and conceptualization. YJ, JSK and JHP are responsible for experiment and data acquisition. SHK and ICS helped data interpretation. YJ, JSK, JHP, SHK and ICS wrote the manuscript. SC, PTTD, BYH, SWL, JYK and LMY contributed to data discussion and revision. SHK and ICS supervised the manuscript. All authors approved the final version of the manuscript.

Acknowledgments

This research was supported by a grant from the Korea Health Technology R&D Project through the Korea 19 Health Industry Development Institute (KHIDI), funded by the Ministry of Health & Welfare, Republic of 20 Korea (No. HI22C1212, HR20C0025) and was supported by the National Research Foundation of Korea (NRF) grant funded by the Korea government (MSIT) (2021R1C1C10123971331482092640103, RS-2023-00238188).

Conflicts of Interest

The authors have declared that no conflict of interests existed.

References

  1. Ryu, I.; Ryu, M.J.; Han, J.; Kim, S.J.; Lee, M.J.; Ju, X.; Yoo, B.H.; Lee, Y.L.; Jang, Y.; Song, I.C.; Chung, W.; Oh, E.; Heo, J.Y.; Kweon, G.R. L-Deprenyl exerts cytotoxicity towards acute myeloid leukemia through inhibition of mitochondrial respiration. Oncol Rep 2018, 40, 3869–3878. [Google Scholar] [CrossRef] [PubMed]
  2. Shin, D.Y. Human acute myeloid leukemia stem cells: evolution of concept. Blood Res 2022, 57, 67–74. [Google Scholar] [CrossRef] [PubMed]
  3. de Beauchamp, L.; Himonas, E.; Helgason, G.V. Mitochondrial metabolism as a potential therapeutic target in myeloid leukaemia. Leukemia 2022, 36, 1–12. [Google Scholar] [CrossRef] [PubMed]
  4. Fovez, Q.; Laine, W.; Goursaud, L.; Berthon, C.; Germain, N.; Degand, C.; Sarry, J.E.; Quesnel, B.; Marchetti, P.; Kluza, J. Clinically Relevant Oxygraphic Assay to Assess Mitochondrial Energy Metabolism in Acute Myeloid Leukemia Patients. Cancers (Basel) 2021, 13. [Google Scholar] [CrossRef] [PubMed]
  5. Basak, N.P.; Banerjee, S. Mitochondrial dependency in progression of acute myeloid leukemia. Mitochondrion 2015, 21, 41–48. [Google Scholar] [CrossRef] [PubMed]
  6. Panina, S.B.; Pei, J.; Kirienko, N.V. Mitochondrial metabolism as a target for acute myeloid leukemia treatment. Cancer Metab 2021, 9, 17. [Google Scholar] [CrossRef] [PubMed]
  7. Reed, G.A.; Schiller, G.J.; Kambhampati, S.; Tallman, M.S.; Douer, D.; Minden, M.D.; Yee, K.W.; Gupta, V.; Brandwein, J.; Jitkova, Y.; Gronda, M.; Hurren, R.; Shamas-Din, A.; Schuh, A.C.; Schimmer, A.D. A Phase 1 study of intravenous infusions of tigecycline in patients with acute myeloid leukemia. Cancer Med 2016, 5, 3031–3040. [Google Scholar] [CrossRef] [PubMed]
  8. IDH-Mutated AML: Beyond Enasidenib and Ivosidenib Monotherapy: Highlights From SOHO 2021. J Adv Pract Oncol 2022, 13 (Suppl 1), 12–14. [CrossRef]
  9. Martelli, M.P.; Martino, G.; Cardinali, V.; Falini, B.; Martinelli, G.; Cerchione, C. Enasidenib and ivosidenib in AML. Minerva Med 2020, 111, 411–426. [Google Scholar] [CrossRef]
  10. Moore, J.W.; Pelcovits, A.; Reagan, J.L. Azacitidine and Venetoclax in AML. N Engl J Med 2020, 383, 2088. [Google Scholar] [CrossRef]
  11. Pollyea, D.A.; Stevens, B.M.; Jones, C.L.; Winters, A.; Pei, S.; Minhajuddin, M.; D'Alessandro, A.; Culp-Hill, R.; Riemondy, K.A.; Gillen, A.E.; Hesselberth, J.R.; Abbott, D.; Schatz, D.; Gutman, J.A.; Purev, E.; Smith, C.; Jordan, C.T. Venetoclax with azacitidine disrupts energy metabolism and targets leukemia stem cells in patients with acute myeloid leukemia. Nat Med 2018, 24, 1859–1866. [Google Scholar] [CrossRef] [PubMed]
  12. Satta, T.; Li, L.; Chalasani, S.L.; Hu, X.; Nkwocha, J.; Sharma, K.; Kmieciak, M.; Rahmani, M.; Zhou, L.; Grant, S. Dual mTORC1/2 Inhibition Synergistically Enhances AML Cell Death in Combination with the BCL2 Antagonist Venetoclax. Clin Cancer Res 2023, 29, 1332–1343. [Google Scholar] [CrossRef]
  13. Stahl, M.; Menghrajani, K.; Derkach, A.; Chan, A.; Xiao, W.; Glass, J.; King, A.C.; Daniyan, A.F.; Famulare, C.; Cuello, B.M.; Horvat, T.Z.; Abdel-Wahab, O.; Levine, R.L.; Viny, A.D.; Stein, E.M.; Cai, S.F.; Roshal, M.; Tallman, M.S.; Goldberg, A.D. Clinical and molecular predictors of response and survival following venetoclax therapy in relapsed/refractory AML. Blood Adv 2021, 5, 1552–1564. [Google Scholar] [CrossRef] [PubMed]
  14. Chaudhary, S.; Ganguly, S.; Singh, A.; Palanichamy, J.K.; Chopra, A.; Bakhshi, R.; Bakhshi, S. Mitochondrial complex II and V activity is enhanced in pediatric acute myeloid leukemia. Am J Blood Res 2021, 11, 534–543. [Google Scholar] [PubMed]
  15. Kaeding, A.J.; Barwe, S.P.; Gopalakrishnapillai, A.; Ries, R.E.; Alonzo, T.A.; Gerbing, R.B.; Correnti, C.; Loken, M.R.; Broderson, L.E.; Pardo, L.; Le, Q.H.; Tang, T.; Leonti, A.R.; Smith, J.L.; Chou, C.K.; Xu, M.; Triche, T.; Kornblau, S.M.; Kolb, E.A.; Tarlock, K.; Meshinchi, S. Mesothelin is a novel cell surface disease marker and potential therapeutic target in acute myeloid leukemia. Blood Adv 2021, 5, 2350–2361. [Google Scholar] [CrossRef] [PubMed]
  16. Bharadwaj, U.; Marin-Muller, C.; Li, M.; Chen, C.; Yao, Q. Mesothelin overexpression promotes autocrine IL-6/sIL-6R trans-signaling to stimulate pancreatic cancer cell proliferation. Carcinogenesis 2011, 32, 1013–1024. [Google Scholar] [CrossRef] [PubMed]
  17. Chen, S.H.; Hung, W.C.; Wang, P.; Paul, C.; Konstantopoulos, K. Mesothelin binding to CA125/MUC16 promotes pancreatic cancer cell motility and invasion via MMP-7 activation. Sci Rep 2013, 3, 1870. [Google Scholar] [CrossRef] [PubMed]
  18. Le, Q.; Castro, S.; Tang, T.; Loeb, A.M.; Hylkema, T.; McKay, C.N.; Perkins, L.; Srivastava, S.; Call, L.; Smith, J.; Leonti, A.; Ries, R.; Pardo, L.; Loken, M.R.; Correnti, C.; Fiorenza, S.; Turtle, C.J.; Riddell, S.; Tarlock, K.; Meshinchi, S. Therapeutic Targeting of Mesothelin with Chimeric Antigen Receptor T Cells in Acute Myeloid Leukemia. Clin Cancer Res 2021, 27, 5718–5730. [Google Scholar] [CrossRef] [PubMed]
  19. Montemagno, C.; Cassim, S.; Pouyssegur, J.; Broisat, A.; Pages, G. From Malignant Progression to Therapeutic Targeting: Current Insights of Mesothelin in Pancreatic Ductal Adenocarcinoma. Int J Mol Sci 2020, 21. [Google Scholar] [CrossRef]
  20. Le, K.; Wang, J.; Zhang, T.; Guo, Y.; Chang, H.; Wang, S.; Zhu, B. Overexpression of Mesothelin in Pancreatic Ductal Adenocarcinoma (PDAC). Int J Med Sci 2020, 17, 422–427. [Google Scholar] [CrossRef]
  21. Servais, E.L.; Colovos, C.; Rodriguez, L.; Bograd, A.J.; Nitadori, J.; Sima, C.; Rusch, V.W.; Sadelain, M.; Adusumilli, P.S. Mesothelin overexpression promotes mesothelioma cell invasion and MMP-9 secretion in an orthotopic mouse model and in epithelioid pleural mesothelioma patients. Clin Cancer Res 2012, 18, 2478–2489. [Google Scholar] [CrossRef] [PubMed]
  22. Lv, J.; Li, P. Mesothelin as a biomarker for targeted therapy. Biomark Res 2019, 7, 18. [Google Scholar] [CrossRef] [PubMed]
  23. Bharadwaj, U.; Marin-Muller, C.; Li, M.; Chen, C.; Yao, Q. Mesothelin confers pancreatic cancer cell resistance to TNF-alpha-induced apoptosis through Akt/PI3K/NF-kappaB activation and IL-6/Mcl-1 overexpression. Mol Cancer 2011, 10, 106. [Google Scholar] [CrossRef]
  24. Goo, C.K.; Lim, H.Y.; Ho, Q.S.; Too, H.P.; Clement, M.V.; Wong, K.P. PTEN/Akt signaling controls mitochondrial respiratory capacity through 4E-BP1. PLoS One 2012, 7, e45806. [Google Scholar] [CrossRef] [PubMed]
  25. Faust, J.R.; Hamill, D.; Kolb, E.A.; Gopalakrishnapillai, A.; Barwe, S.P. Mesothelin: An Immunotherapeutic Target beyond Solid Tumors. Cancers (Basel) 2022, 14. [Google Scholar] [CrossRef]
  26. Mesbahi, Y.; Trahair, T.N.; Lock, R.B.; Connerty, P. Exploring the Metabolic Landscape of AML: From Haematopoietic Stem Cells to Myeloblasts and Leukaemic Stem Cells. Front Oncol 2022, 12, 807266. [Google Scholar] [CrossRef] [PubMed]
  27. Sriskanthadevan, S.; Jeyaraju, D.V.; Chung, T.E.; Prabha, S.; Xu, W.; Skrtic, M.; Jhas, B.; Hurren, R.; Gronda, M.; Wang, X.; Jitkova, Y.; Sukhai, M.A.; Lin, F.H.; Maclean, N.; Laister, R.; Goard, C.A.; Mullen, P.J.; Xie, S.; Penn, L.Z.; Rogers, I.M.; Dick, J.E.; Minden, M.D.; Schimmer, A.D. AML cells have low spare reserve capacity in their respiratory chain that renders them susceptible to oxidative metabolic stress. Blood 2015, 125, 2120–2130. [Google Scholar] [CrossRef]
  28. Wang, L.; Cybula, M.; Rostworowska, M.; Wang, L.; Mucha, P.; Bulicz, M.; Bieniasz, M. Upregulation of Succinate Dehydrogenase (SDHA) Contributes to Enhanced Bioenergetics of Ovarian Cancer Cells and Higher Sensitivity to Anti-Metabolic Agent Shikonin. Cancers (Basel) 2022, 14. [Google Scholar] [CrossRef]
  29. Jiang, N.; Zhang, X.; Chen, Q.; Kantawong, F.; Wan, S.; Liu, J.; Li, H.; Zhou, J.; Lu, B.; Wu, J. Identification of a Mitochondria-Related Gene Signature to Predict the Prognosis in AML. Front Oncol 2022, 12, 823831. [Google Scholar] [CrossRef]
  30. Kaneko, O.; Gong, L.; Zhang, J.; Hansen, J.K.; Hassan, R.; Lee, B.; Ho, M. A binding domain on mesothelin for CA125/MUC16. J Biol Chem 2009, 284, 3739–3749. [Google Scholar] [CrossRef] [PubMed]
  31. Yu, L.; Chen, X.; Sun, X.; Wang, L.; Chen, S. The Glycolytic Switch in Tumors: How Many Players Are Involved? J Cancer 2017, 8, 3430–3440. [Google Scholar] [CrossRef] [PubMed]
  32. Zhou, D.; Duan, Z.; Li, Z.; Ge, F.; Wei, R.; Kong, L. The significance of glycolysis in tumor progression and its relationship with the tumor microenvironment. Front Pharmacol 2022, 13, 1091779. [Google Scholar] [CrossRef]
  33. Schuringa, J.J.; Bonifer, C. Dissecting Clonal Heterogeneity in AML. Cancer Cell 2020, 38, 782–784. [Google Scholar] [CrossRef] [PubMed]
  34. Mondet, J.; Lo Presti, C.; Chevalier, S.; Bertrand, A.; Tondeur, S.; Blanchet, S.; Mc Leer, A.; Pernet-Gallay, K.; Mossuz, P. Mitochondria in human acute myeloid leukemia cell lines have ultrastructural alterations linked to deregulation of their respiratory profiles. Exp Hematol 2021, 98, 53–62. [Google Scholar] [CrossRef]
  35. Samudio, I.; Harmancey, R.; Fiegl, M.; Kantarjian, H.; Konopleva, M.; Korchin, B.; Kaluarachchi, K.; Bornmann, W.; Duvvuri, S.; Taegtmeyer, H.; Andreeff, M. Pharmacologic inhibition of fatty acid oxidation sensitizes human leukemia cells to apoptosis induction. J Clin Invest 2010, 120, 142–156. [Google Scholar] [CrossRef] [PubMed]
  36. Zhai, X.; Mao, L.; Wu, M.; Liu, J.; Yu, S. Challenges of Anti-Mesothelin CAR-T-Cell Therapy. Cancers (Basel) 2023, 15. [Google Scholar] [CrossRef]
  37. Kelly, R.J.; Sharon, E.; Pastan, I.; Hassan, R. Mesothelin-targeted agents in clinical trials and in preclinical development. Mol Cancer Ther 2012, 11, 517–525. [Google Scholar] [CrossRef]
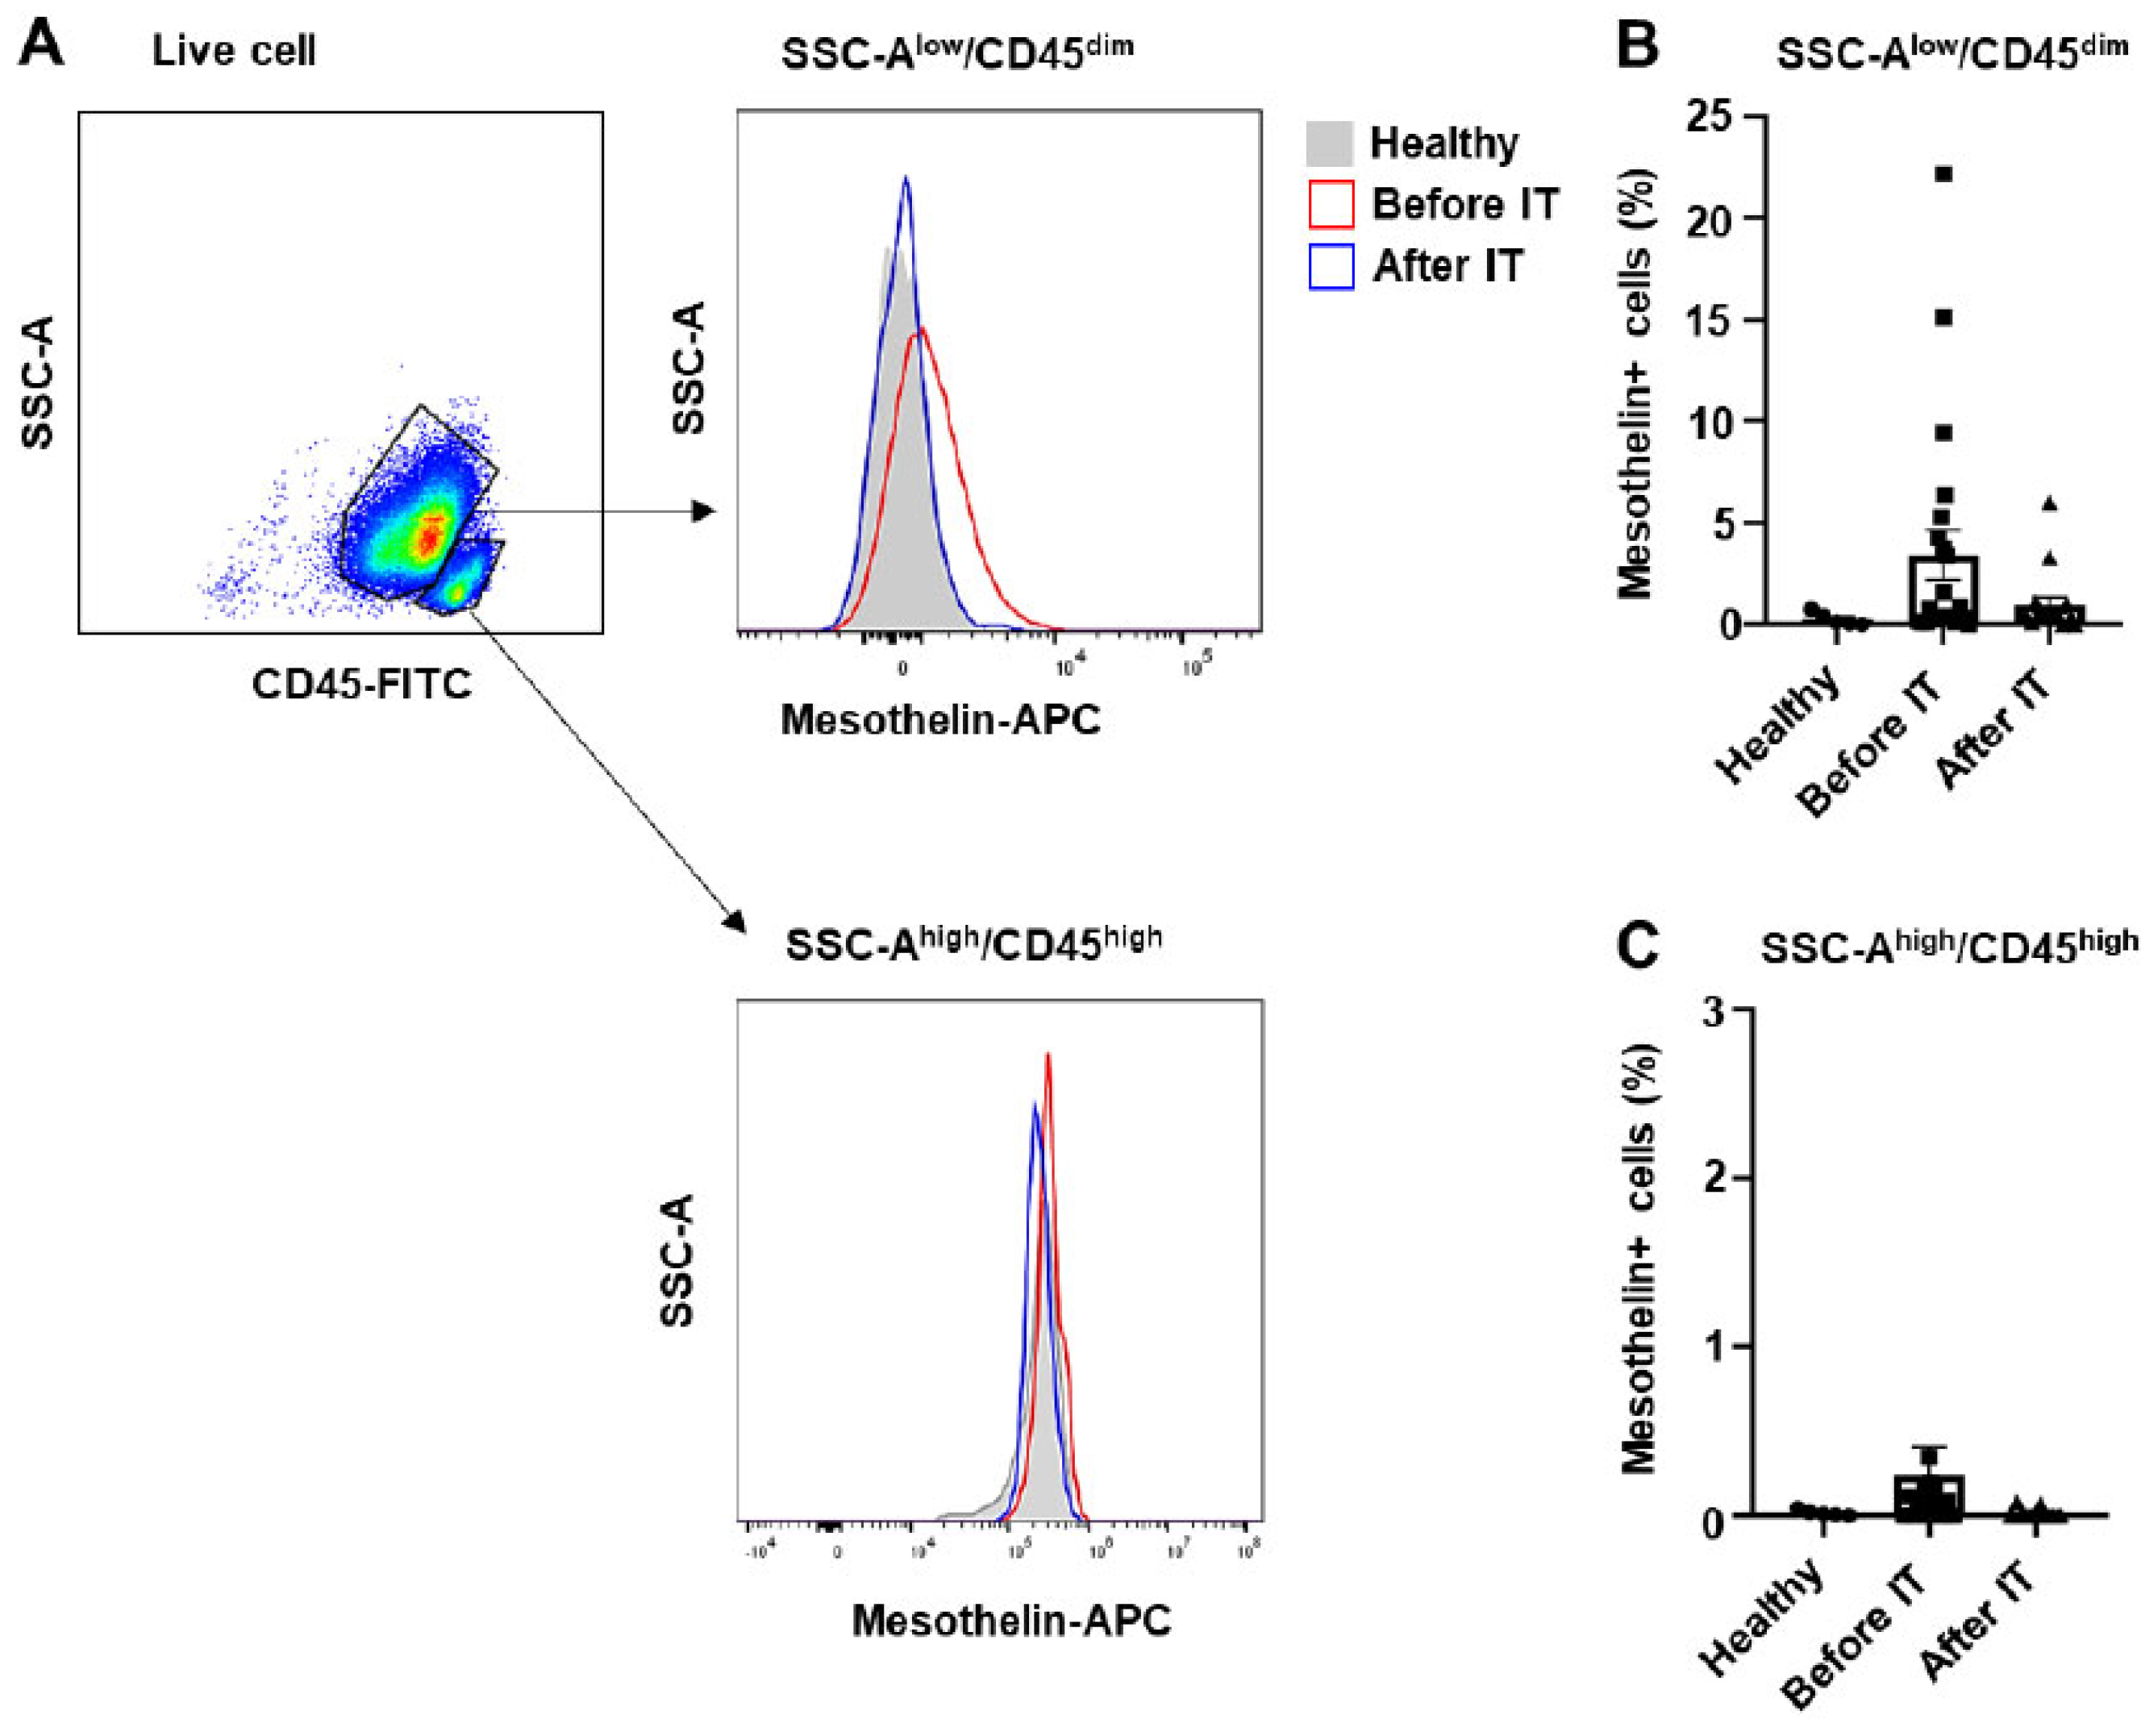
Figure 1. Expression of mesothelin in myeloblast subpopulation of AML patients at diagnosis and after induced therapy. A. Gating strategy for AML bone marrow (2x10⁵ cells) based on CD45 expression. Myeloblast subsets are identified as CD45dim and SSC-Alow. Monocytes and mature lymphocytes subsets are identified as CD45high and SSC-Ahigh. Red blood cells and hematogones subsets are identified as CD45low and SSC-Alow. Histogram showing mesothelin surface expression in AML bone marrow at diagnosis (red), normal (blue), and after treatment (gray area) in the CD45low and SSC-Alow myeloblast subsets (Upper). Histogram showing mesothelin expression in AML and normal CD45high and SSC-Ahigh subsets (Lower). B, Percentage of mesothelin positive cells in the CD45low and SSC-Alow myeloblast subsets calculated using Flowjo software, represented as a bar graph. C, Percentage of mesothelin positive cells in the CD45high and SSC-Ahigh population. IT, induced therapy.
Preprints 91849 g001
Figure 2. Enhanced oxygen consumption rate and extracellular acidification rate in the bone marrow of patients with mesothelin-high acute myeloid leukemia. A, OCR of AML Bone marrow (1x10⁵ cells/well) obtained at diagnosis, grouped by mesothelin expression levels, was measured after sequential injection of mitochondrial inhibitors, including oligomycin, CCCP, or rotenone. B-I, Baseline OCR, ATP production, non-mitochondrial OCR, maximal respiration, spare respiratory capacity (SRC), SRC (%), coupling efficiency, and proton leak were calculated using WAVE software. J, ECAR was measured using the XFe96 analyzer simultaneously with OCR measurements. Values are presented as mean ± SD (bars). (*P < 0.05, **P < 0.01 vs. corresponding controls). The black line indicates OCR or ECAR of the mesothelin-low group, while the blue line represents the mesothelin-high group.
Preprints 91849 g002
Figure 3. Mesothelin treatment increased oxygen consumption rate and glycolysis in AML cells. A, KG1α (2× 10⁵ cells/well) cells incubated with different concentrations (0, 0.25, or 0.5 μg/ml) of rhMesothelin for 1 hour and OCR was measured after sequential injection of mitochondrial inhibitors. B-I, Values of OCR parameters were calculated using WAVE software, and values are presented as mean ± SD (bars) (*P < 0.05, **P < 0.01 vs. corresponding controls). J, ECAR was measured by XFe96 analyzer along with OCR after mitochondrial inhibitor injection. The black line indicates OCR or ECAR of control KG1α cells, the blue line represents the 0.25 μg/ml rhMesothelin-treated group, and the red line represents the 0.5 μg/ml rhMesothelin-treated group.
Preprints 91849 g003
Figure 4. Effects of recombinant human mesothelin treatment on glycolysis and mitochondrial complex gene in KG-1a acute myeloid leukemia cells. AI, KG1α cells were incubated in media containing rhMesothelin (0, 0.25 or 0.5 μg/ml) for 24 hours. mRNA expression of glycolysis-related enzyme gene (AD) and mitochondrial OXPHOS complex gene (EI) was assessed using qPCR analysis. Values were normalized to GAPDH levels and presented as mean ± SD (bars) (* P < 0.05, ** P < 0.01 vs. corresponding controls).
Preprints 91849 g004
Figure 5. Effects of mesothelin knockdown on the expression of glycolysis and mitochondrial complex gene mRNA in KG-1a cells and schematic representation illustrating the modulation of AML cell metabolism by mesothelin. A-J, KG1α cells were incubated in media containing siRNA targeting mesothelin for 72 hours. mRNA expression level of human mesothelin (A), glycolysis-related gene (BE) and mitochondrial OXPHOS complex gene (FJ) was determined using qPCR analysis. Values were normalized to GAPDH levels and presented as mean ± SD (bars) (* P < 0.05, ** P < 0.01 vs. corresponding controls). K, Illustration of metabolic modulation by mesothelin in human AML.
Preprints 91849 g005
Table 1. Baseline characteristics of patients in AML (N=23).
Age, median (range) 59 (19-78)
Gender, M:F (%) 13:10
ELN classification
AML with recurrent genetic abnormalities
AML with mutated TP53
AML with MR gene mutations
AML with MR cytogenetic abnormalities
AML, NOS

22 (95.7%)
0 (0.0%)
0 (0.0%)
0 (0.0%)
1 (4.3%)
NCCN risk stratification
Favorable
Intermediate
Poor

8 (34.8%)
11 (47.8%)
4 (17.4%)
Peripheral blood tests, median (range)
White blood cell count, x103/uL 5.49 (0.0095-163.9)
Hemoglobin (g/dL) 8.9 (5.3-12.8)
Platelet count, x103/uL 52 (9.0-266)
Absolute neutrophil count, x103/uL 0.61 (0.1-7.6)
LDH (IU/L) 1023 (389-11000)
BM blast, median (range), % 68.6 (20.2-95.2)
Cytogenetics
inv(16)/t(16;16) 6 (26.0%)
t(8;21) 10 (43.5%)
11q23/KMT2A rearrangements 4 (17.4%)
Somatic mutations
FLT3-ITD
FLT3-TKD
NPM1
DNMT3A
IDH2
TET2
NRAS
WT1
PTPN11
KIT
U2AF1
KRAS
ASXL1
SMC3
SRSF2
CBL
KMT2C
NOTCH2

4 (17.4%)
2 (8.7%)
2 (8.7%)
1 (4.3%)
2 (8.7%)
2 (8.7%)
5 (21.7%)
1 (4.3%)
1 (4.3%)
9 (39.1%)
1 (4.3%)
1 (4.3%)
1 (4.3%)
2 (8.7%)
1 (4.3%)
2 (8.7%)
2 (8.7%)
3 (13.0%)
Disease status at end of induction (evaluable)
1st CR 17 (73.9%)
2nd CR 0 (0.0%)
3rd CR 0 (0.0%)
Persistent 2 (8.7%)
ELN, European Leukemia Network; MR, myelodysplasia-related; LDH, lactate dehydrogenase; BM, bone marrow; NCCN, National Comprehensive Cancer Network; CR, complete remission.
Disclaimer/Publisher’s Note: The statements, opinions and data contained in all publications are solely those of the individual author(s) and contributor(s) and not of MDPI and/or the editor(s). MDPI and/or the editor(s) disclaim responsibility for any injury to people or property resulting from any ideas, methods, instructions or products referred to in the content.
Copyright: This open access article is published under a Creative Commons CC BY 4.0 license, which permit the free download, distribution, and reuse, provided that the author and preprint are cited in any reuse.
Prerpints.org logo

Preprints.org is a free preprint server supported by MDPI in Basel, Switzerland.

Subscribe

© 2024 MDPI (Basel, Switzerland) unless otherwise stated