1. Introduction
Snow and ice on road pavements are common in most areas of China in winter, they are reducing factors of road surface adhesion coefficient and skid resistance, thus causing the speed of passing vehicles to decrease, prolonging traffic time, increasing fuel consumption, and even causing traffic accidents [
1]. Therefore, snow and ice on road surfaces cause enormous pressure to the traffic, affect people’s life, resulting in huge economic losses. Currently, a number of traffic issues brought on by ice and snow on roads are of global issue [
2]. As a result, melting snow and ice has become a crucial component of winter road maintenance. Effective snow and ice melting has become a key duty for road maintenance personnel. The ability to effectively and conveniently address a number of issues brought on by wintertime road snow and ice has major economic and social benefits [
3].
The problem of snow and ice on roads has become a technical problem puzzling the traffic department, leading to an average annual economic loss of hundreds of millions of yuan due to snow and ice on roads. Therefore, many nations attach great importance to the treatment of road snow and ice, and have carried out a lot of relevant research. Literature have examined a range of solutions, including manual removal, mechanical removal, spreading snow melting agents, heating type pavement, conductive concrete, pavement technology to inhibit freezing, ice-suppressing and coating technologies [
4,
5].
Ice-suppressing material is a material that can reduce the freezing point by means of a melting material within, such as the ice point inhibitor, or isolate the ice layer from the road surface by hydrophobic materials contained in the material itself, so as to achieve the effect of no icing on the road surface or easy deicing of the road surface. Its principle is to load environment-friendly ice melting and snow removing materials plus hydrophobic materials onto the adsorption carrier materials to make an ice-suppressing material, which is sprayed on the asphalt pavement in the form of manual brushing or mechanical spraying [
6]. When rain or snow falls, the ice melting and snow removing materials on the carrier will be released to melt snow and ice. Meanwhile, hydrophobic materials in the ice-suppressing material can isolate the ice layer from the pavement layer, successfully reducing the adhesion between the ice layer and the pavement, so that the former can be easily removed. Ice-suppressing and coating technologies compared with traditional deicing technologies have the following characteristics: ①active melting of ice and snow;②excellent environmental protection performance; ③efficient and lasting deicing; ④ preventive function [
7].
Hydrophobic ice-suppressing technology was originally applied to the field of high-voltage transmission line icing treatment [
1]. The high-voltage wire coating deicing technology is an effective high-voltage wire anti-icing and deicing technical measure. A layer of super hydrophobic nano-deicing coating material is applied on the conductor, which can effectively reduce the formation of ice on the transmission line. Road science and technology workers have developed anti-icing and thin ice removal coatings based on hydrophobic deicing technology for high-voltage transmission lines [
8]. Ma et al. studied the anti-icing performance of asphalt pavement based on hydrophobic surface and thin ice easy to remove pavement coating application technology, and prepared a coating technology with hydrophobic properties, with similarity to the deicing mechanism of high-voltage conductors. A hydrophobic film is constructed on the surface of asphalt pavement to isolate the ice layer without the function of self-melting and only a small number of test sections have been conducted without summarizing the construction process and technology, and without developing special construction machinery and equipment [
9]. The idea of environmental friendly asphalt pavement melting snow and ice coating technology was first put out by Yang. On the one hand, the eco-friendly asphalt pavement melting snow and ice coating technology offers hydrophobic properties that lessen the adhesion between the ice layer and the pavement, as well as a slow-release snow melting and deicing capabilities. The performance of the coating has been investigated, and the necessary test sections have been paved, but no construction technical indicators or requirements have been proposed, nor have any specific construction tools and machinery been developed in accordance with the coating’s features [
10,
11]. According to the principle of ice and snow melting and ice-suppressing and the design of a series of tests, some scholars have examined the performance of ice-suppressing material, and explored construction technologies [
4,
12]. An anti-freeze, ice-suppressing material for asphalt pavement by adding an appropriate amount of slow-release anti-icing agent (Mafilon) to the emulsified asphalt was designed and synthesized. The deicing effect evaluation test and conductivity test were conducted with various Mafilon contents, finally an experiment on the optimum spraying thickness of the ice-suppressing material was conducted. Siegmund Werner et al. used porous adsorption materials to adsorb self melting snow additives, and achieved long-term snow melting function through slow-release [
13]. Kaemereit Wilhelm et al. successfully prepared 0.5~1mm granular self melting snow additive material by using cement as carrier material through the solidification performance of cement. V-260 snow melting agent developed by Verglimit Company in Switzerland is made of calcium chloride coated hydrophobic material, which is widely used at present [
14,
15]. The Japanese self snow melting technology usually uses porous zeolite as an absorbent to adsorb the salt, and adds it to the asphalt mixture in the form of powder to replace fine aggregate or mineral powder in the mixture [
16]. The purpose of snow melting and ice removal is achieved through the release of the salt. China first introduced imported self snow melting technology or materials around 2000. In recent years, many domestic road researchers began to study self snow melting technology [
17]. Zhou et al. adopted Japanese snow melting technology to research and develop self snow melting additives [
18]. Ma et al. has researched and developed the granular snow melting admixture Iceguard, which is slow-release and non corrosive, safe and environmental friendly to the metal components of bridge and road structures [
5]. Shan et al. measured the wettability of the pavement following the application of a hydrophobic coating, the change in stone absorption rate, the length and density of the cracks in the ice layer following the impact of a steel ball [
19]. Zheng et al. analyzed and evaluated the performance of the deicing coating from different aspects, namely the anti-ice-snow performances, the durability of the coating materials, and the impact on the skid resistance of the pavement [
20]. Wu et al. has established a regression model for long-term snow melting performance through research, and has given a calculation formula, which can be used to calculate the precipitation amount of additives on self melting asphalt pavement in different regions of the country [
21]. The long term snow melting performance of asphalt mixtures with Iceguard was evaluated by comparing with foreign products and testing roads, combined with rapid dissolution tests to determine the service life of Iceguard [
22,
23].
Through the research and application of ice-suppressing materials both in China and abroad, it can be seen that the current technologies of ice-suppressing materials are at an initial and exploratory stage. A complete set of technical evaluation indicators and quality control standards for ice-suppressing materials have not been formed, and the current project application is in the test stage [
24,
25].
The ice-suppressing material developed in this paper has the characteristics of: active deicing, zero negative impact on roads, bridges and other ancillary facilities and vegetation, preventive maintenance for the pavement, and continuous deicing in winter, providing a new method and way for road deicing. The composition design method of the ice-suppressing material is proposed. According to the characteristics of the ice-suppressing material, the performance test evaluation method of the material is proposed and its performance is evaluated, which provides a theoretical basis for the promotion of asphalt pavement ice-suppressing material.
2. Design and preparation of ice-suppressing material composition
2.1. Deicing performance test methods of ice-suppressing materials
An important functional role of ice-suppressing materials is the deicing effect. Anti freezing/anti-icing test, hydrophobic property test, adhesion property test and ice melting property test are used to evaluate the deicing performance of ice-suppressing materials.
2.1.1. Anti-icing test method
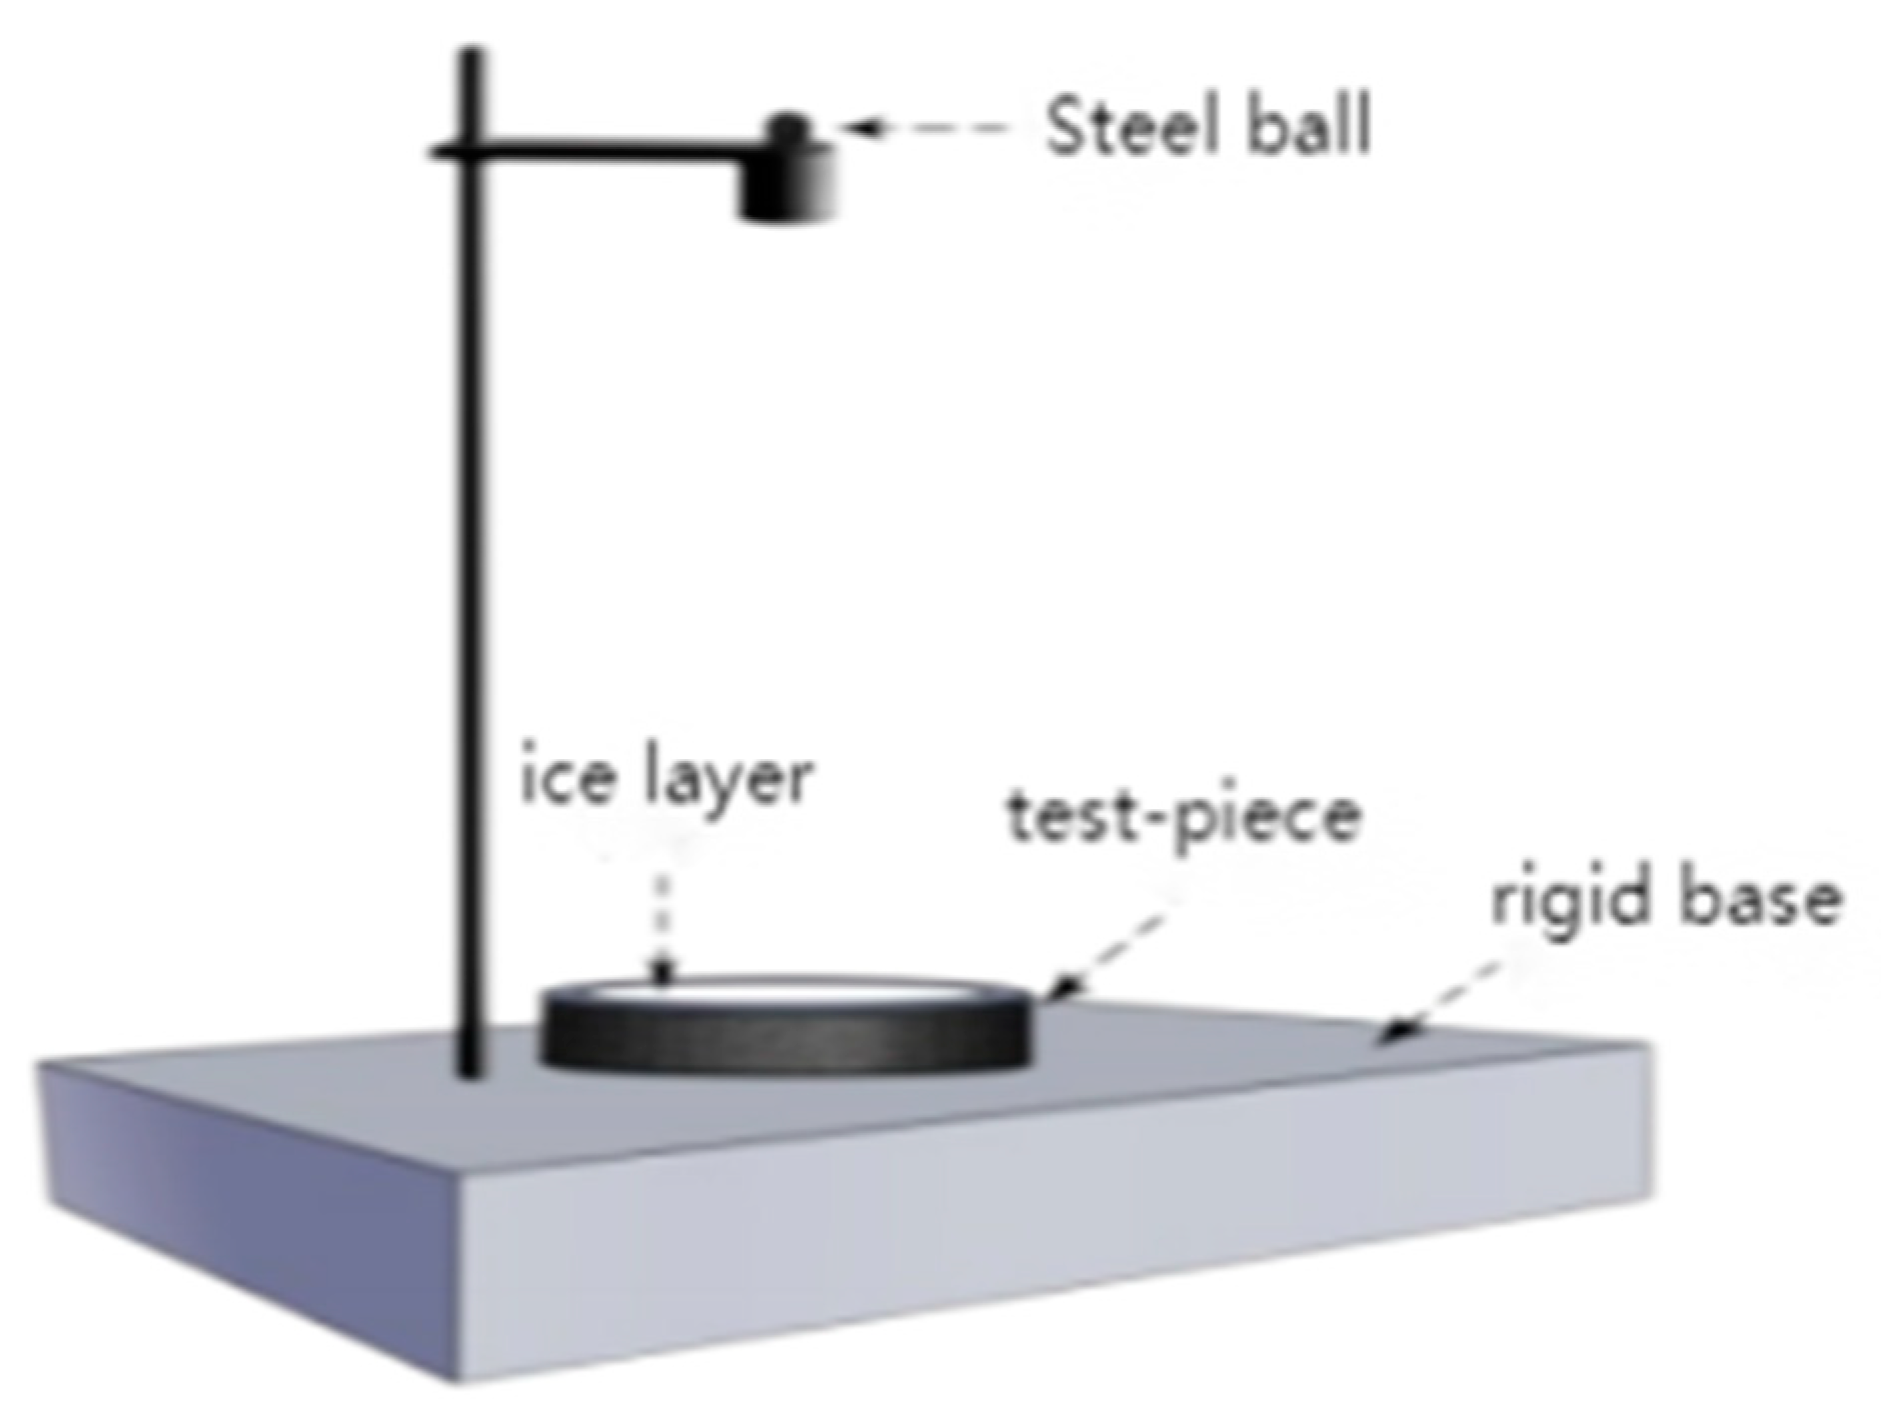
In this paper, the kinetic energy generated by the free fall of the steel ball is used to equivalently simulate the force of removing ice from the road surface, and the magnitude of the adhesion force between the ice and the road surface is characterized by the cracking of the ice layer, the test principle is shown in
Figure 1.
A qualitative method was used to observe the cracking and breaking condition of the ice surface to evaluate the anti-icing effect as shown in
Table 1.
In order to evaluate the ice-suppressing material’s anti-icing effect more accurately, drawing on the pavement structure layer damage evaluation index, the breakage rate index is proposed to evaluate the anti-icing effect, and the breakage rate calculation formula is shown in Equation 1 [
26].
Where: - breakage rate, expressed in percentage, %.
BA-Total area of crushing and cracking,
cm2.
L-extended single crack length, cm.
λ-Influence factor for converting single cracks to area,
generally taken as 0.3.
A-Total area of the test, cm2 .
2.1.2. Hydrophobic performance test method
The hydrophobic performance of the ice-suppressing material is extremely critical to the deicing effect of asphalt pavement, so it is necessary to evaluate its hydrophobic performance after spraying. The hydrophobic performance of the material can be evaluated by the size of the contact angle θ. It is usually considered that when θ> 90°, the material is is hydrophobic, and when θ < 90° it is a hydrophilic material. A larger contact angle θ indicates that the hydrophobic performance of the material is better, currently the methods for measuring contact angle mainly include angle measuring method, height measuring method, force measuring method, droplet image analysis method, transmission method, etc [
27] .
With the development of image processing technology, the droplet image analysis method is used to calculate the contact angle with higher accuracy, and the measurement method becomes simpler. In this paper, the contact angle is calculated by droplet image analysis fitting method [
28] . Following are the detailed steps:
① Acquisition of droplet edges. The methods of acquiring droplet edges can be divided into automatic image processing or manual image processing. Both have their own advantages and disadvantages. The automatic image processing acquisition method has a fast acquisition speed, and the anti-interference performance needs further research. The manual method has strong anti-interference ability, but the workload is particularly large.
② Calculate the contact angle. The contact angle can be calculated by the tangent method, circle fitting method, ellipse fitting method, Young-Laplace method and polynomial fitting method.
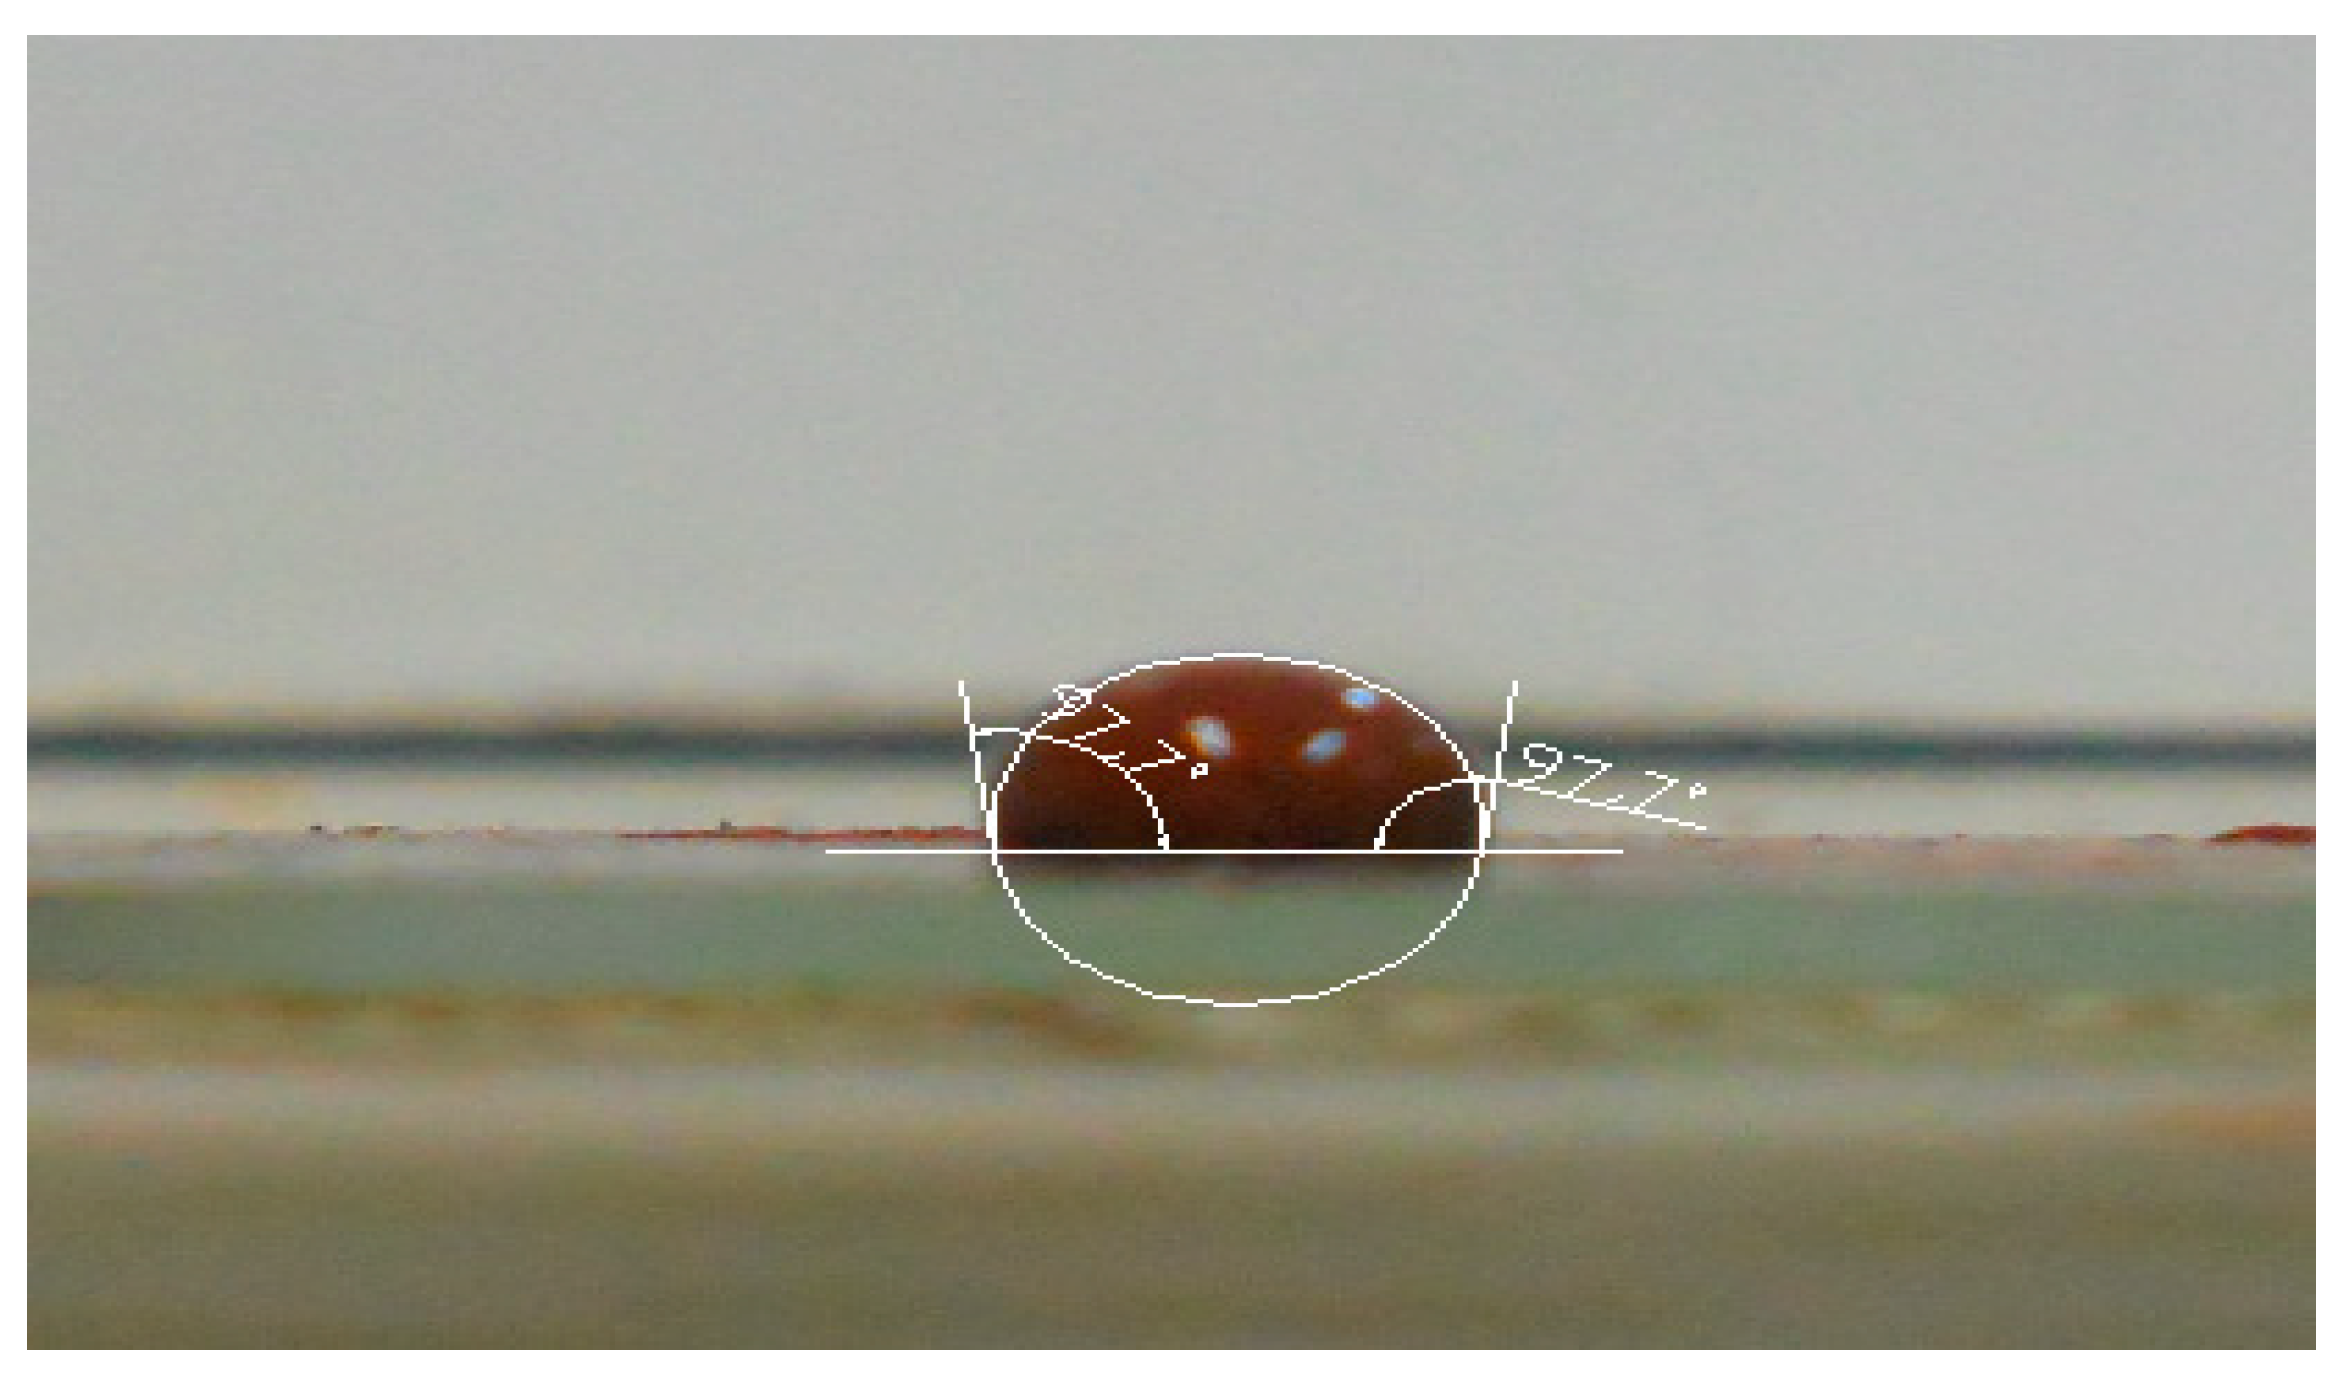
Based on the above theory and method, the contact angle can be calculated by making a sample of ice-suppressing material, using a high-resolution digital camera to photograph the droplet morphology, and combining with Image-Pro Plus or CAD image processing software. The specific steps are as follows:
① Preparation of samples of ice-suppressing material.
② Spraying the prepared sample of ice-suppressing material onto the surface of the glass slide/microscope slide and leaving it at room temperature to cure.
③ Spraying droplets onto the surface of the glass slides coated with cured deicing material.
④ Recording and photographing the process of droplet morphology change using a high pixel digital camera lens perpendicular to the plane of the slide.
⑤ The contact angle is plotted and calculated using image processing software, as shown in
Figure 2.
2.1.3. Adhesion performance test method
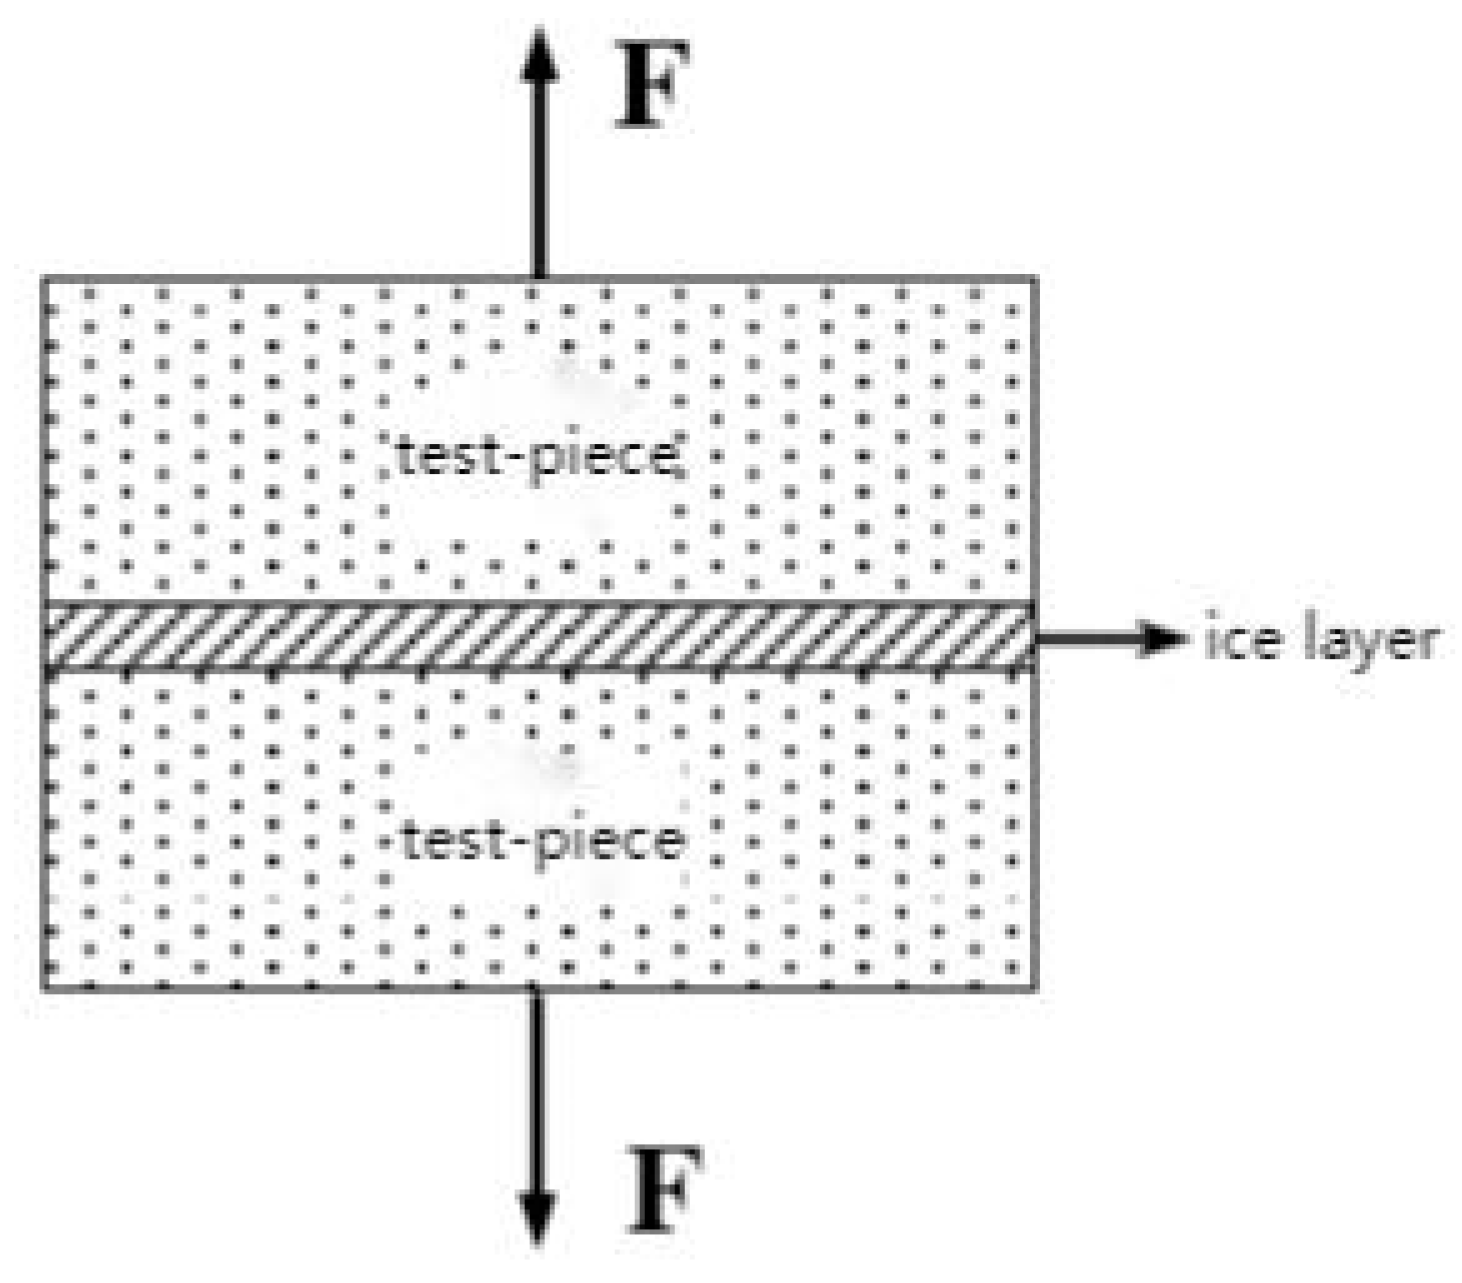
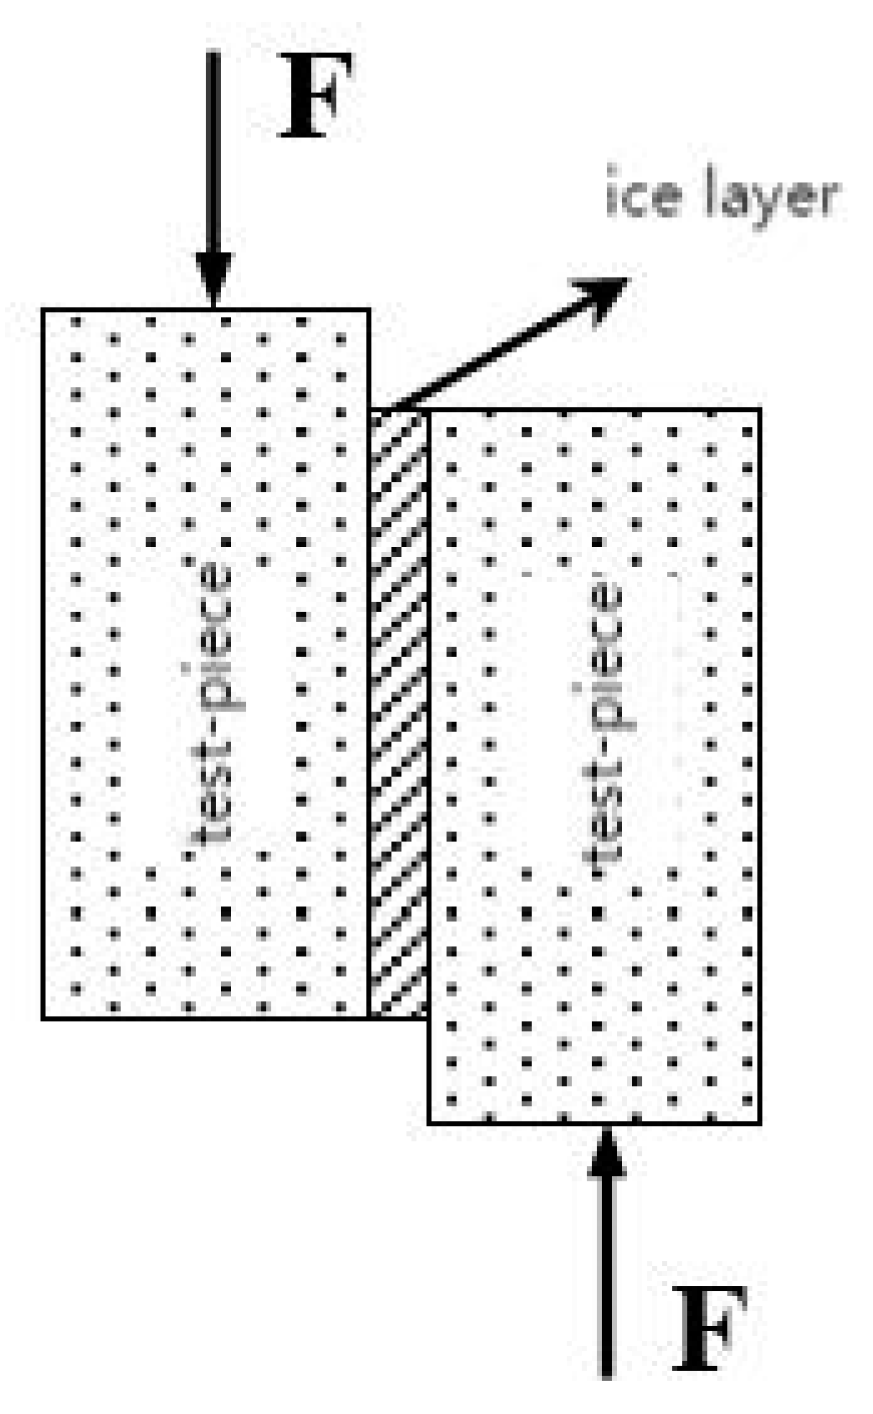
The Bonding material bonding force per unit area is called bond strength. Common methods for measuring bond strength include three-point bending test, shear strength test and tensile strength test. The main purpose of tensile test and shear test is to quantitatively test the adhesion between the sprayed specimen of the ice-suppressing material and ice cubes; in order to reveal clearly the deicing ability of the test pieces of the coating ice-suppressing material, the test pieces of the spraying group and the control group were used for comparative tests; two cylindrical specimens of asphalt mixture were prepared, fixed, water was stored in the middle, and finally freezed in the freezer; In order to simulate more accurately the actual situation, the test temperature was set at - 30 ℃, and the freezing time is 12h. Then the test piece were taken out of the freezer and immediately the tensile test and shear test on a 100KN universal testing machine were conducted. The principles of tensile test and shear test are shown in
Figure 3 and
Figure 4 respectively.
2.2. Design of the composition of the ice-suppressing material
In order to increase the deicing function of the pavement without reducing the skid performance of the pavement, a systematic experimental study was conducted to develop an ice-suppressing material with long-lasting and slow-release characteristics. The final design of the ice-suppressing material includes film-forming component A, adhesive component B and ice suppression component C.
2.2.1. Modified ice suppression component C composition design
According to the design of the ice suppression function of the ice-suppressing material, component C should include the freezing point inhibitor C1, which needs porous adsorption carrier C2 for adsorption. Therefore, the ice-suppressing material should include porous adsorption carrier C2. To avoid the pollution of the color of the ice-suppressing material on the road surface, a small amount of carbon black component C3 is added to enhance the color of the ice-suppressing material powder; the ice suppression component powder was adjusted using a modified coupling agent C4 in order to increase its dispersibility.
The adsorption capacity of porous adsorption carrier material C2 on the freezing point inhibitor C1 can be quantitatively expressed by the mass change before and after the porous adsorption carrier adsorbs the freezing point inhibitor, i.e the adsorption rate. Specific test steps are as follows: weigh the porous adsorption carrier material C2 with a mass of m0 ( accurately up to 0.01g ) after drying, and then soak it in a saturated solution of ice point inhibitor C1 prepared in advance, and take it out 24 hours later, Weigh the mass m1 after drying in a low-temperature drying oven at 110℃, and calculate the adsorption rate of porous adsorption carrier material according to the above formula(2).
Where: is the mass of the material after immersion.
is the mass of the material before immersion.
is the adsorption rate of the porous adsorption carrier material.
The optimal ratio of freezing point inhibitor C1 to porous adsorption carrier C2 can be determined using the above adsorption rate test method, and the test results are shown in
Table 2.
It can be seen from
Table 2 that the adsorption rate of the porous adsorption carrier increases with time, and the rate of increase tends to be gradual. After 18h, the adsorption rate of the porous adsorption carrier material does not increase and tends to be stable, indicating that the porous adsorption carrier has reached the saturation state. From this, it can be concluded that the mass ratio of the porous adsorption carrier C2 to the freezing point inhibitor C1 is C2: C1=100:54. The proportion of carbon black C3 and modified silane coupling agent C4 to composite freezing point inhibitor C1 and porous adsorption carrier C2 can be obtained according to practical experience and adsorption performance test, as shown in
Table 3.
2.2.2. Composition design of film-forming component A
According to the hydrophobic function design of the ice-suppressing material, the composition of the film-forming component A should include the road bonding hydrophobic material silicone-rubber lotion A1, various additives and fillers, including reinforcing agent A2, filler A3, film-forming agent A4, plasticizer A5, catalyst A6, leveling agent A7, defoamer A8, diluent water A9, and anti-skid material quartz sand A10. The role of additives is to promote the plastic flow and elastic deformation of silicone rubber lotion, improve the bonding performance, thereby enhancing and facilitating the effectiveness of the lotion to film-forming. The function of filler is to reinforce silicone rubber and improve the tensile strength of silicone rubber lotion.
The ratio of silicone rubber lotion A1 and diluent was analyzed by hydrophobic and adhesive tests. Several portions of organic silicone rubber lotion with a mass of 100g and a solid content of 20%~60% were weighed, and the organic silicone rubber lotion was mixed with diluent water A9 according to 20g-300g respectively. The hydrophobic property test and adhesion property test were conducted respectively, the contact angle was measured with the height method, and the tensile force and shear force was measured with a UTM machine. The test results are shown in
Table 4.
According to the hydrophobic and adhesion test results in
Table 4, the contact angle of the hydrophobic test increases first and then decreases with the increase of the diluent quality, and the tensile force and shear force of the adhesion test decrease first and then increase with the increase of the diluent quality, indicating that with the gradual increase of the diluent quality, the hydrophobicity of the ice-suppressing material increases first and then decreases, and the adhesion property decreases first and then increases; when the contact angle is at its maximum, and the tensile force and shear force are minimum, the mass of the diluent is 180g. At this time, the anti-icing performance of the ice-suppressing material reaches the best. At the same time, the ratio of silicone rubber lotion A1 and diluent A9 is the best, A1: A9=100:180. Based on practical experience, hydrophobic property test, and adhesive property test, as indicated in
Table 5, it is possible to identify the optimal ratio of each component in the film-forming component.
2.2.3. Adhesive component B composition design
The role of the adhesive component is to accelerate the reaction speed between the components of the ice-suppressing material and speed up the time of opening traffic. The adhesive component is composed of cross-linking agent B1 and coupling agent B2. Based on actual experience, the proportion of the components of the cross-linking agent and coupling agent is usually taken as shown in
Table 6.
2.2.4. Ice-suppressing material A, B, C composition ratio
(1) Determination of the mass ratio of component B
Prepare components A and C according to the optimum composition of each component determined by components A and C in advance. The principle of preparation is that component C is dispersed into component A evenly and does not agglomerate. The A: C mass ratio is 100:2. Slowly pour component C into component A, and prepare the mixture of components A and C according to this ratio. Add different quality of components B into the mixture of components A and C prepared in advance to prepare the ice-suppressing material. Under conditions where the spraying temperature is 5 ℃ and the spraying amount of the ice-suppressing material is 0.5kg/m2, Marshall test pieces are made according to the anti-icing test method.
The three components of the ice-suppressing material will undergo curing reaction after mixing. The curing time of the ice-suppressing material includes the curing time in the spraying equipment and the interval of time from when the ice-suppressing material is sprayed on the road to the time it is completely solidified. The curing time of the ice-suppressing material in the spraying equipment is defined as pre-curing time, the time from when the ice-suppressing material is sprayed onto the road surface to the time when the it is completely solidified is defined as post-curing time; the post curing time of Marshall test pieces was measured and the "falling ball impact test" was conducted. The test results are shown in
Table 7.
It can be seen from
Table 7 that the post-curing time of the test piece gradually decreases with the increase of the mass of component B, and the damage rate of the test piece decreases with the increase of the mass of component B. When component B is less than 2g, the damage rate declines slowly, and when component B is greater than 2g, the damage rate declines dramatically, indicating that when component B is more than 2g, the deicing performance decreases significantly. Considering the deicing performance of the ice-suppressing material and the impact of post-curing time on traffic, the weight of component B should be 2g, and the mass ratio (A+C): B=100:2.
(2) Determination of the mass ratio of component A and C
In the conditions of mass ratio (A + C):B = 100:2, in accordance with different proportions, A and C components formulate the ice-suppressing material, and in accordance with the anti-icing test method for "falling ball impact test" and bonding performance test, the test results obtained are as shown in
Table 8.
From the results of
Table 8, it can be observed that with the gradual increase in the mass of the component C, the breakage rate gradually increased, the rate of increase tends to level off when component C is greater than 3g, the tensile force and bonding force gradually decreased with the increase in the mass of component C, plus the rate of reduction tends to level off. It is advised that the mass ratio of component A and C be 97:3 in order to fully consider the deicing performance of the ice-suppressing material.
In summary, the mass ratio of component A, B and C obtained is as follows:
mA : mB : mC= 97: 2: 3.
3. Ice-suppressing Material Deicing Performance Test Results Analysis
This section may be divided by subheadings. It should provide a concise and precise description of the experimental results, their interpretation, as well as the experimental conclusions that can be drawn.Ice-suppressing material is a new type of active environmental protection deicing material. At present, there is little research and evaluation on its performance, and no perfect evaluation index and method have been formed. Therefore, it is necessary to study its anti-icing performance according to its deicing characteristics. Performance evaluation and analysis of the ice-suppressing materials need to be developed.
3.1. Analysis of anti-icing test results
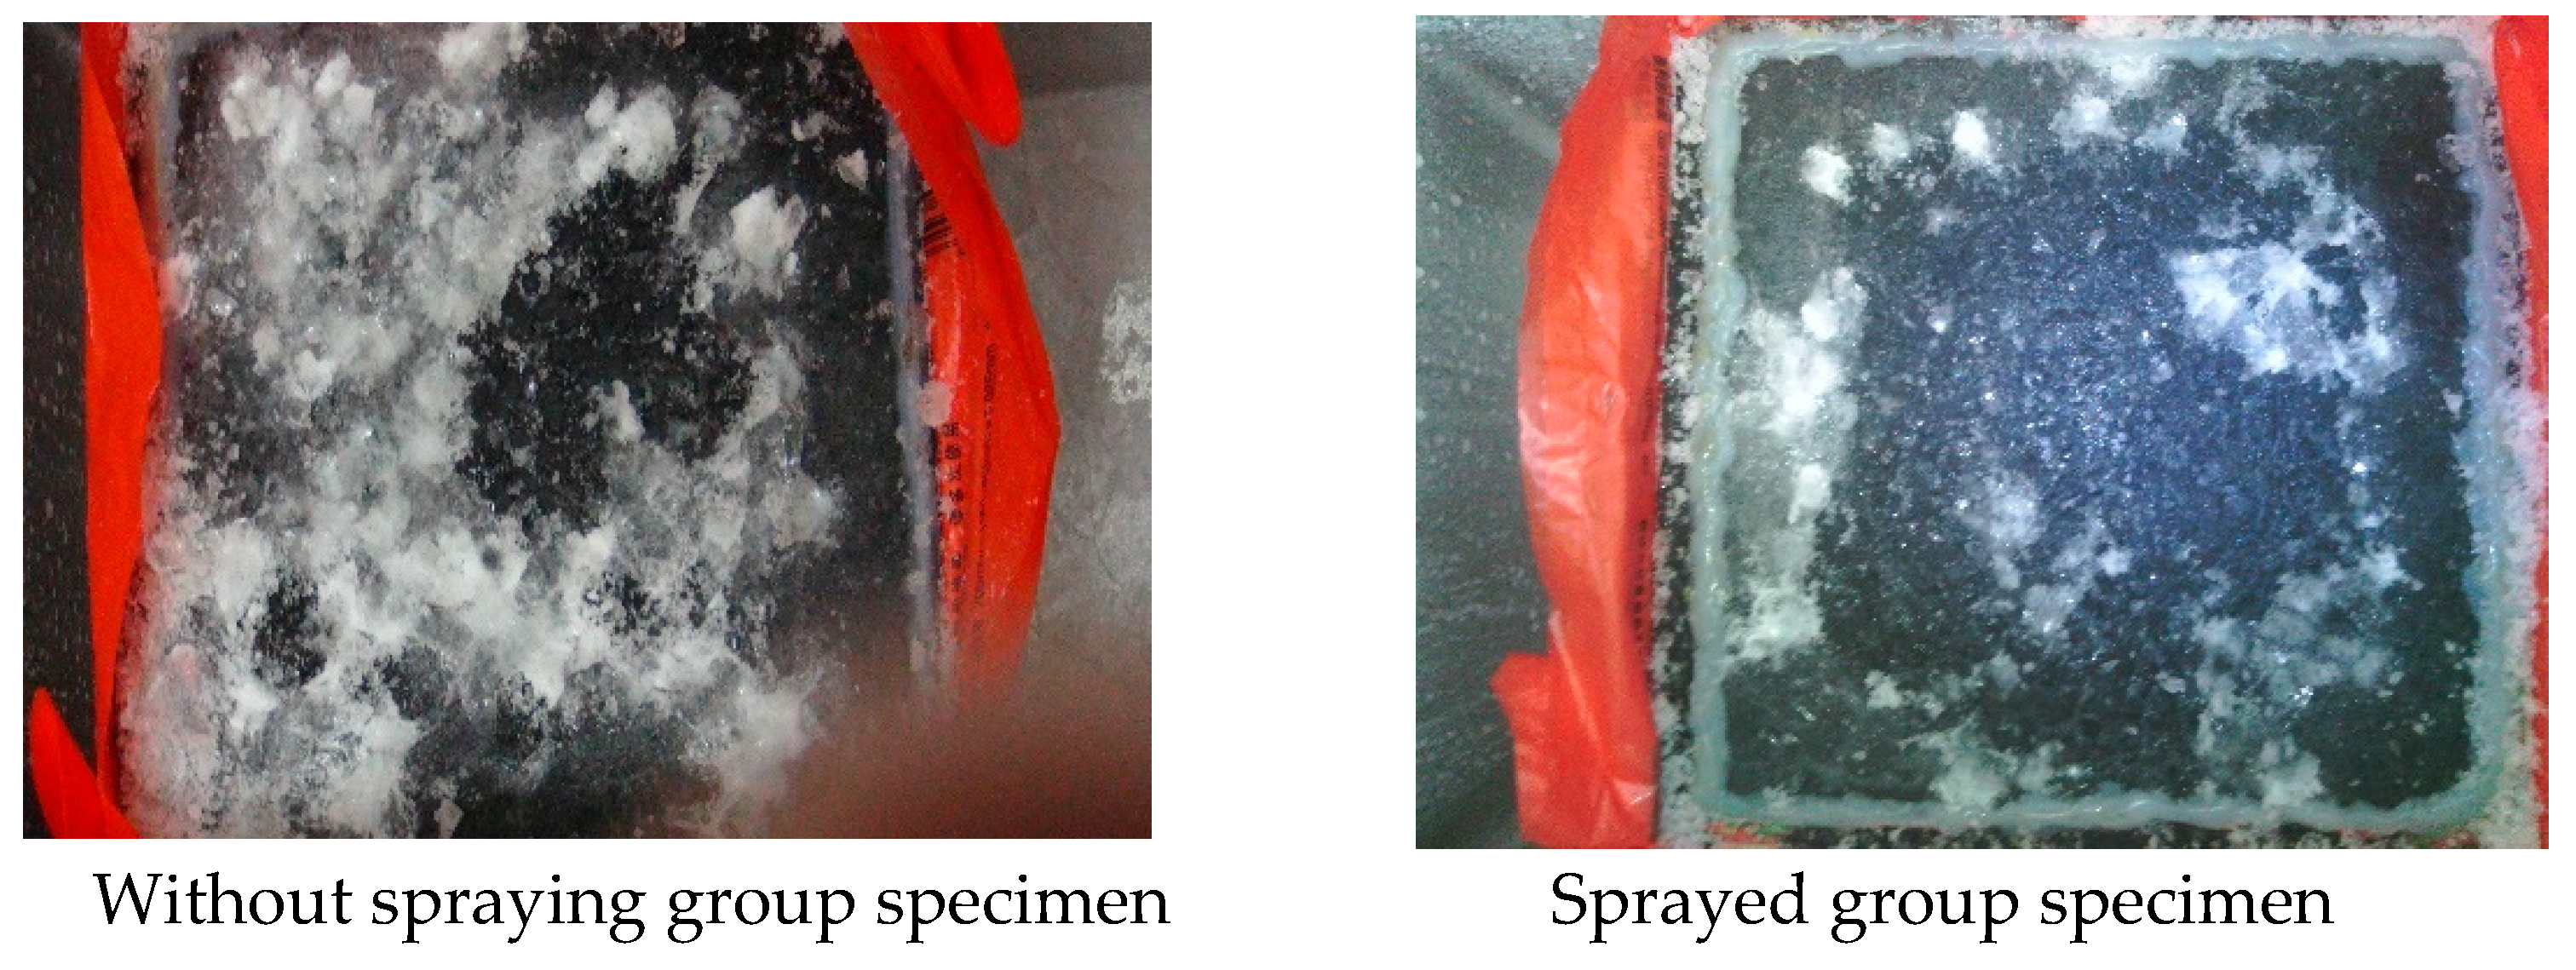
Two groups of Marshall specimens and rutting plate specimens were made with AC-13 grade asphalt mixture, with 5.0% asphalt aggregate ratio. One group of Marshall specimens and rutting plate specimens were sprayed with 0.5kg/㎡ sprinkling amount of ice-suppressing material, and the other group of Marshall specimens and rutting plate specimens were let intact without any treatment. The test was conducted according to the anti-icing test procedure, the falling ball impact test and the Marshall specimens after the falling ball impact test and the gravity knockdown test are shown in
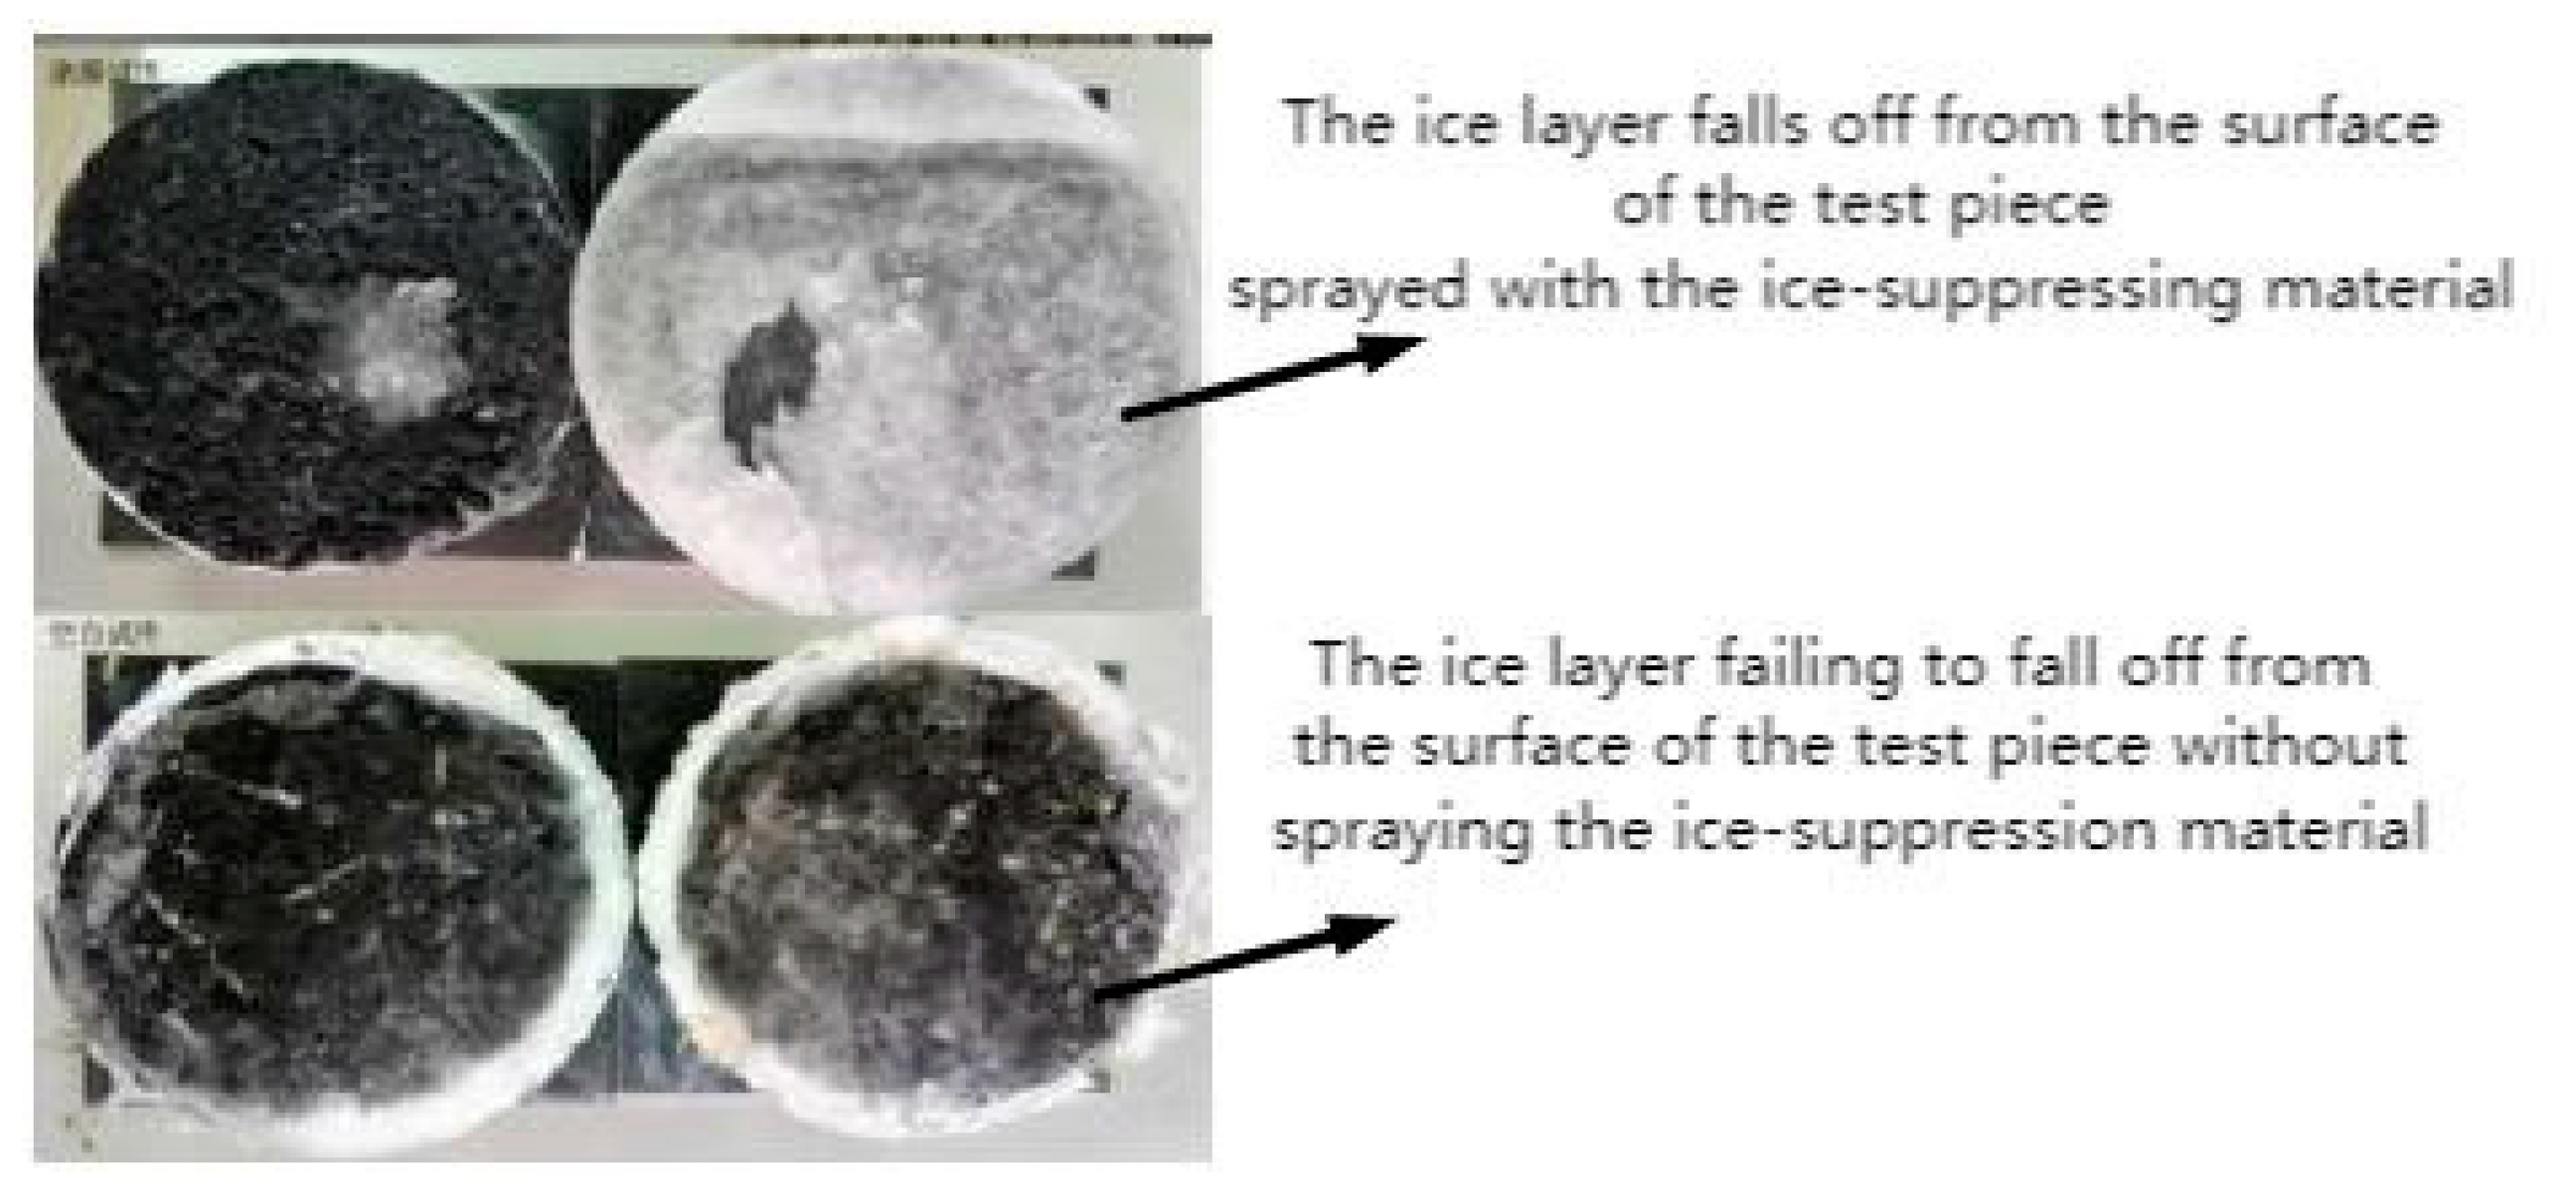
Figure 5 and
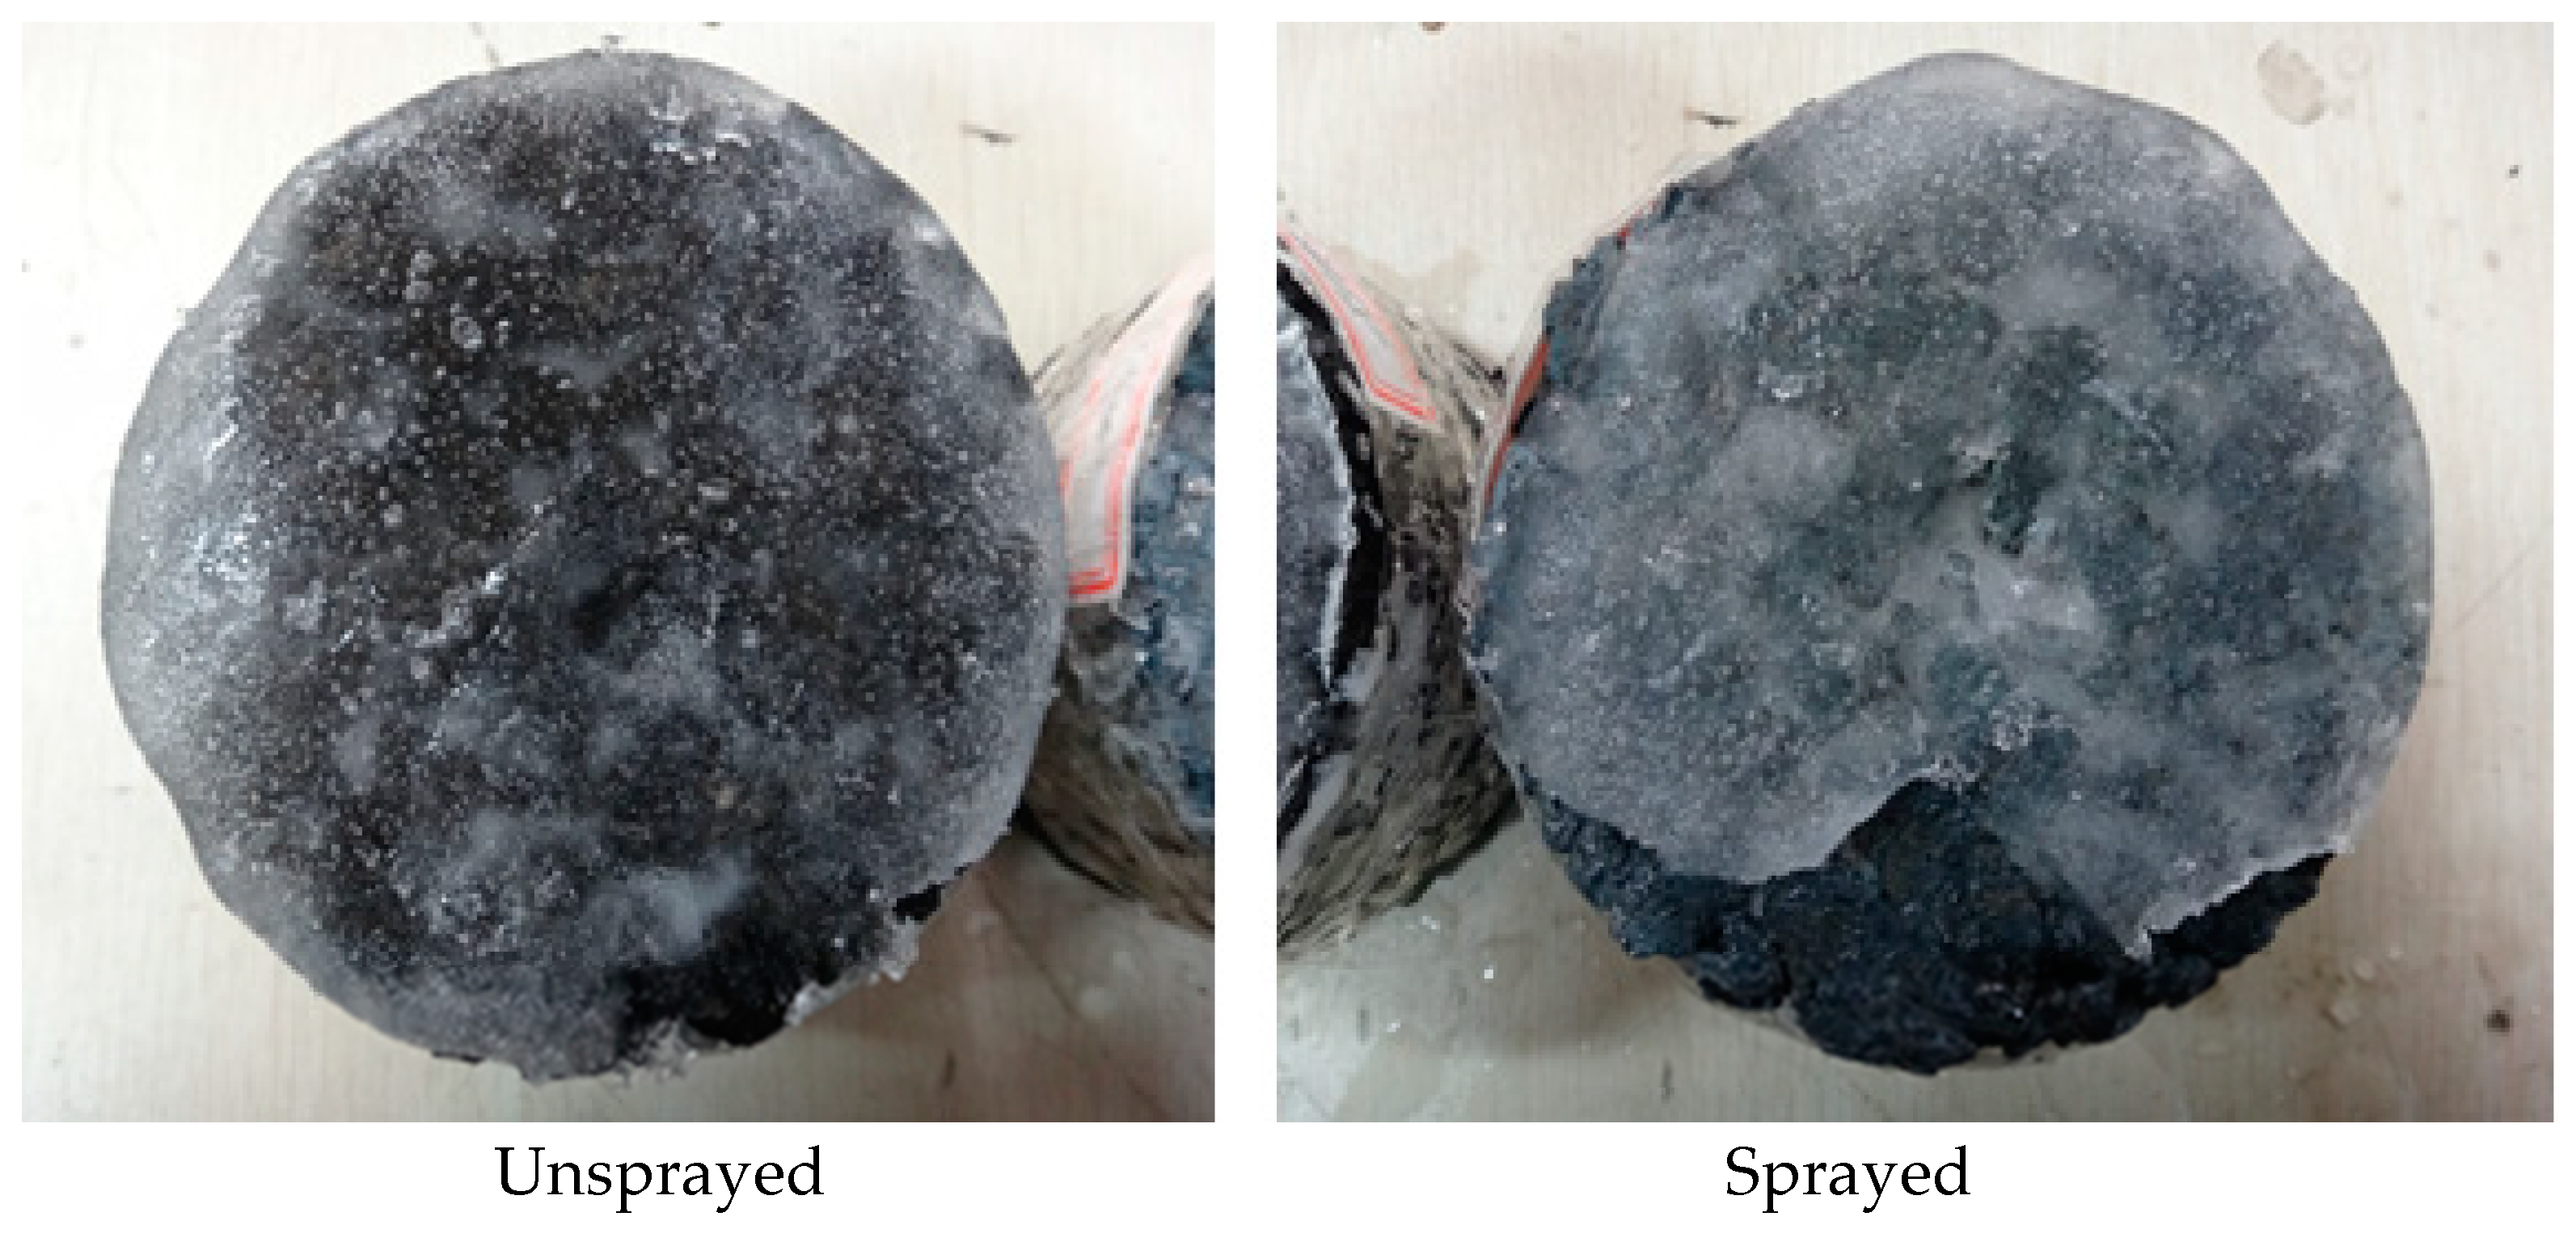
Figure 6, respectively, and the rutting plate specimens after the falling ball test are shown in
Figure 7.
From
Figure 5, it can be concluded that the Marshall specimen contrast group(left) surface has only the steel ball impact marks and pits, while on the right figure, the Marshall specimen spraying group surface can be seen clearly with broken boundaries, and the broken place is without any residual ice adhesion, the anti-icing effect of the ice-suppressing substance can therefore be qualitatively assessed as being better. The ice broken area obtained is 12.72 cm2, measured through indoor measurement of the Marshall specimen spraying group, the calculated breakage rate is 16.2%.
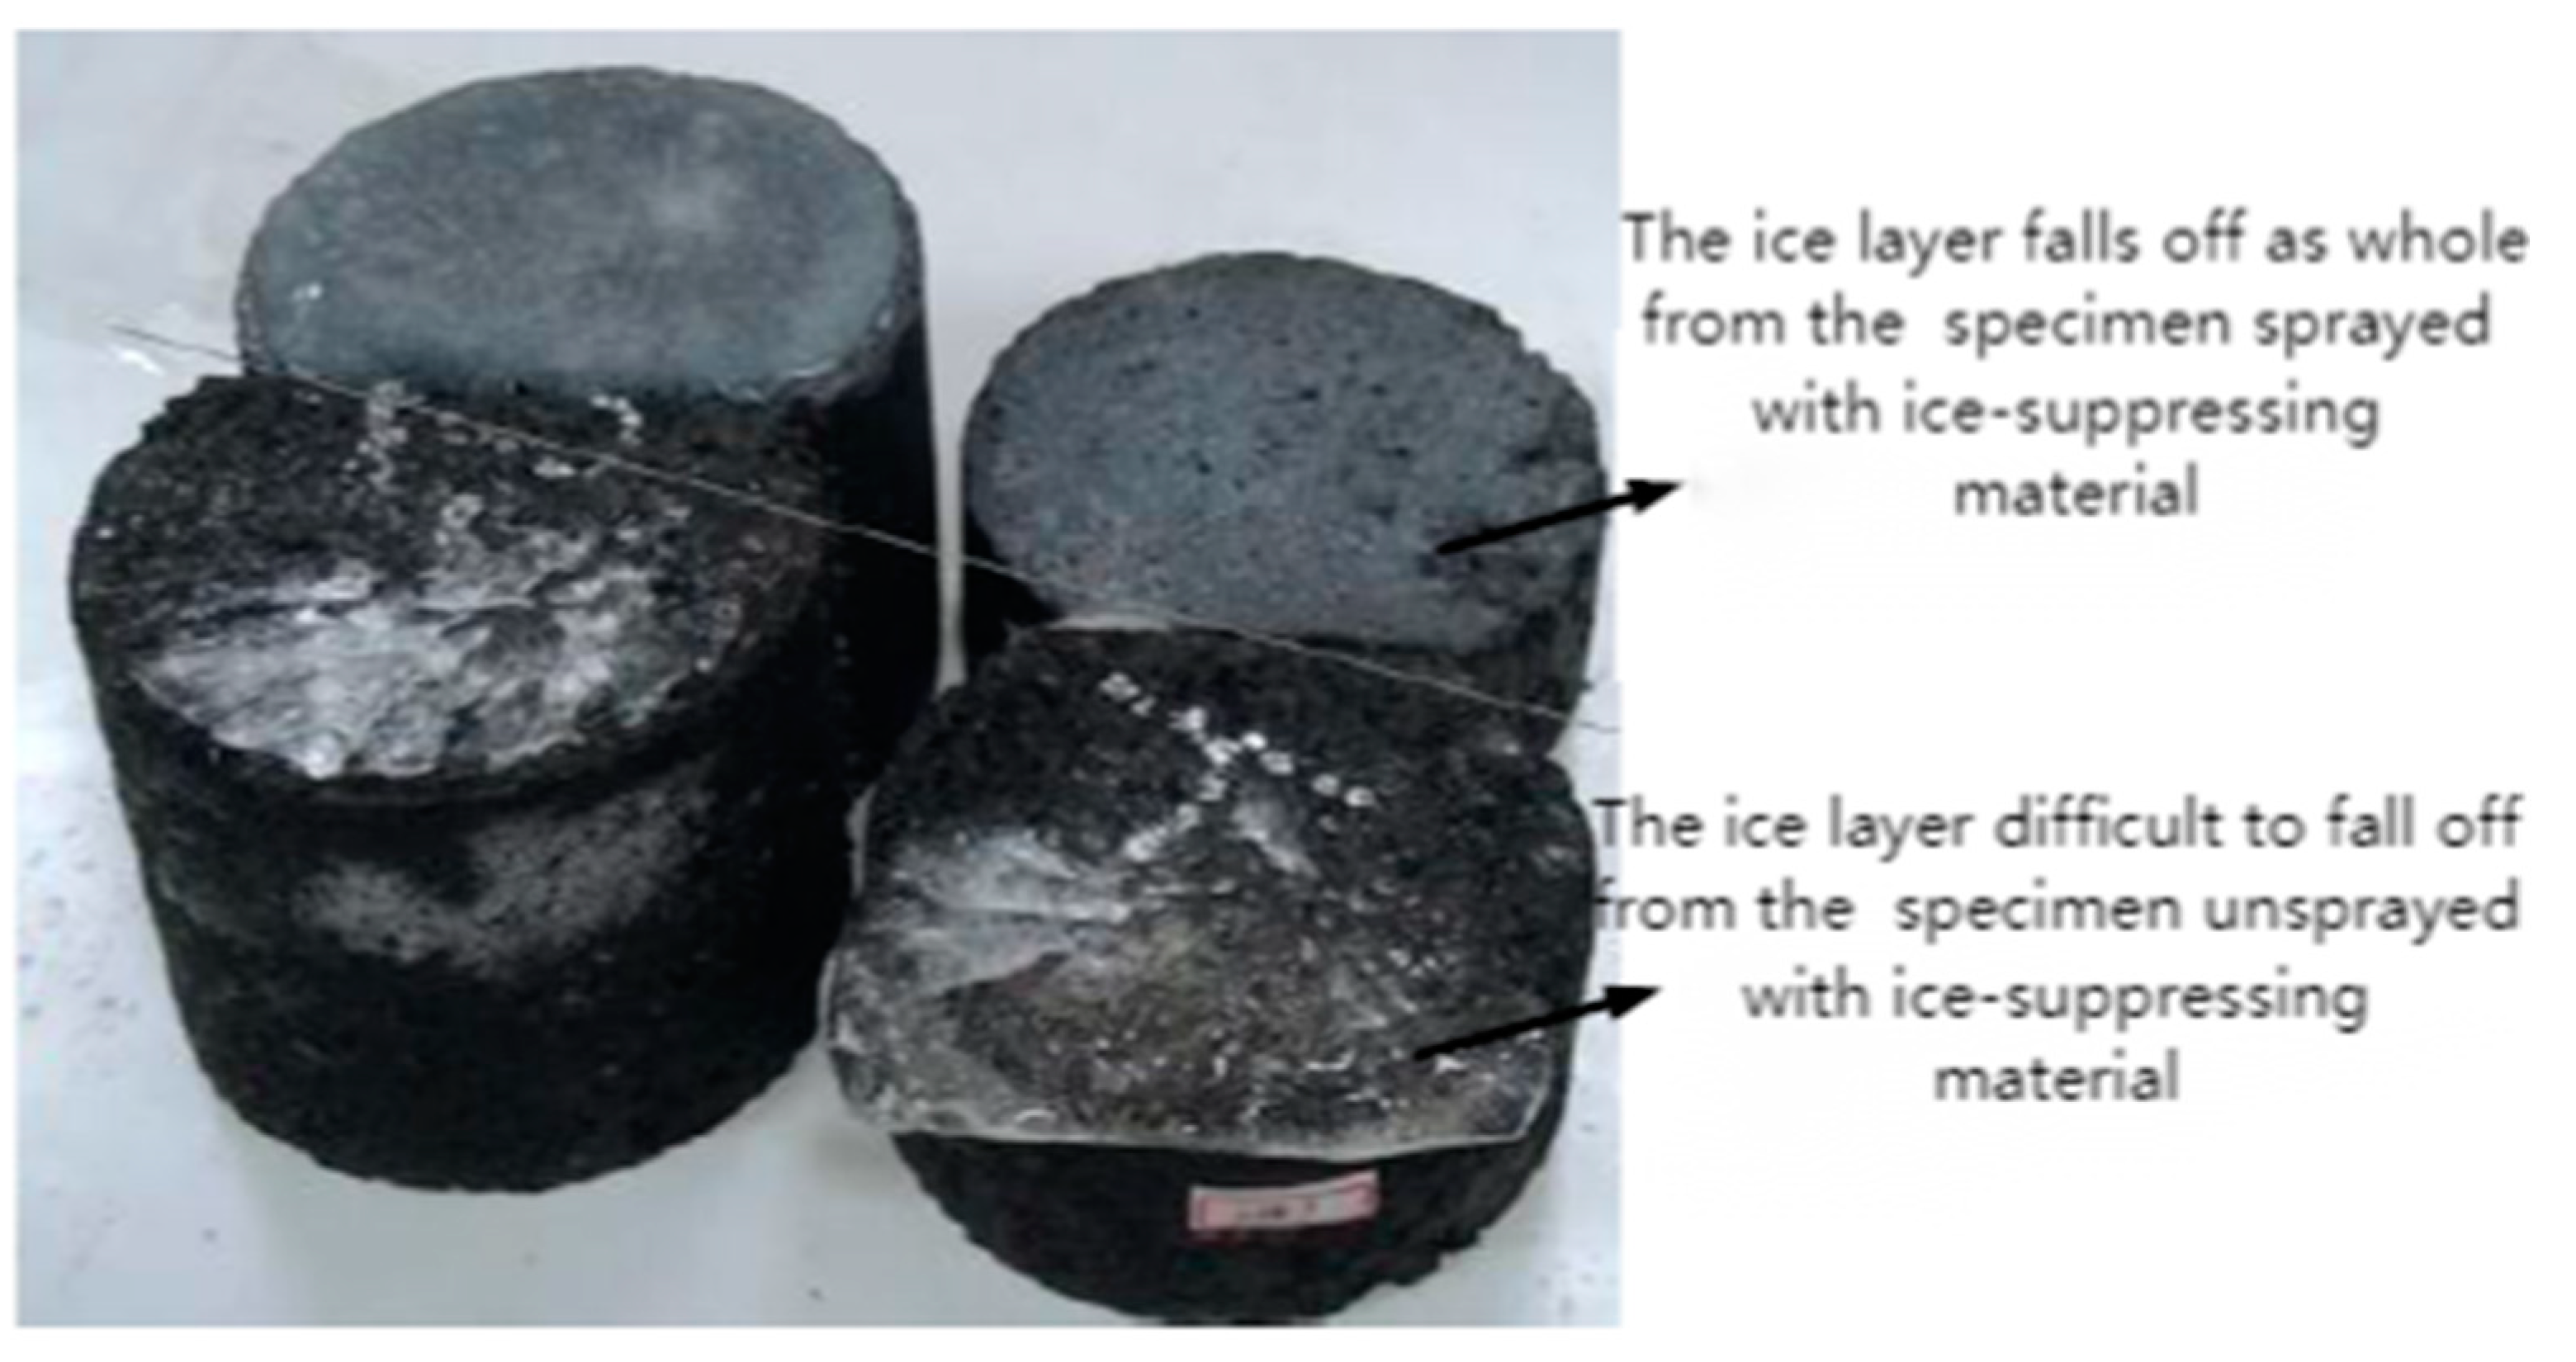
It can be seen from
Figure 6 that the ice layer on the surface of the sprayed Marshall specimen can be removed as a whole after being struck by gravity, and there is no dark ice on the surface of the test piece, while the Marshall specimen in the contrast group(unsprayed) has a lot of dark ice, hence, it can qualitatively be assessed that the adhesion between the ice layer and the Marshall test piece in the contrast group is greater than the adhesion between the ice layer and the test piece in the spraying group.
From the falling ball impact test of the rutting plate specimen as shown in
Figure 7, it can be concluded that the ice layer of the rutting plate specimen in the contrast group appears to fall off partly in a small area after the impact, and most of the ice layer is attached to the rutting plate specimen, while the ice layer of the rutting plate specimen sprayed with ice-suppressing material appears to fall off in a large area, and there is no dark ice on the rutting plate after the falling, which means that the ice-suppressing material plays a good role in isolating the ice layer and the specimen. The ice layer of the specimen sprayed with ice-suppressing material is very easy to fall off.
3.2. Analysis of hydrophobic performance test results
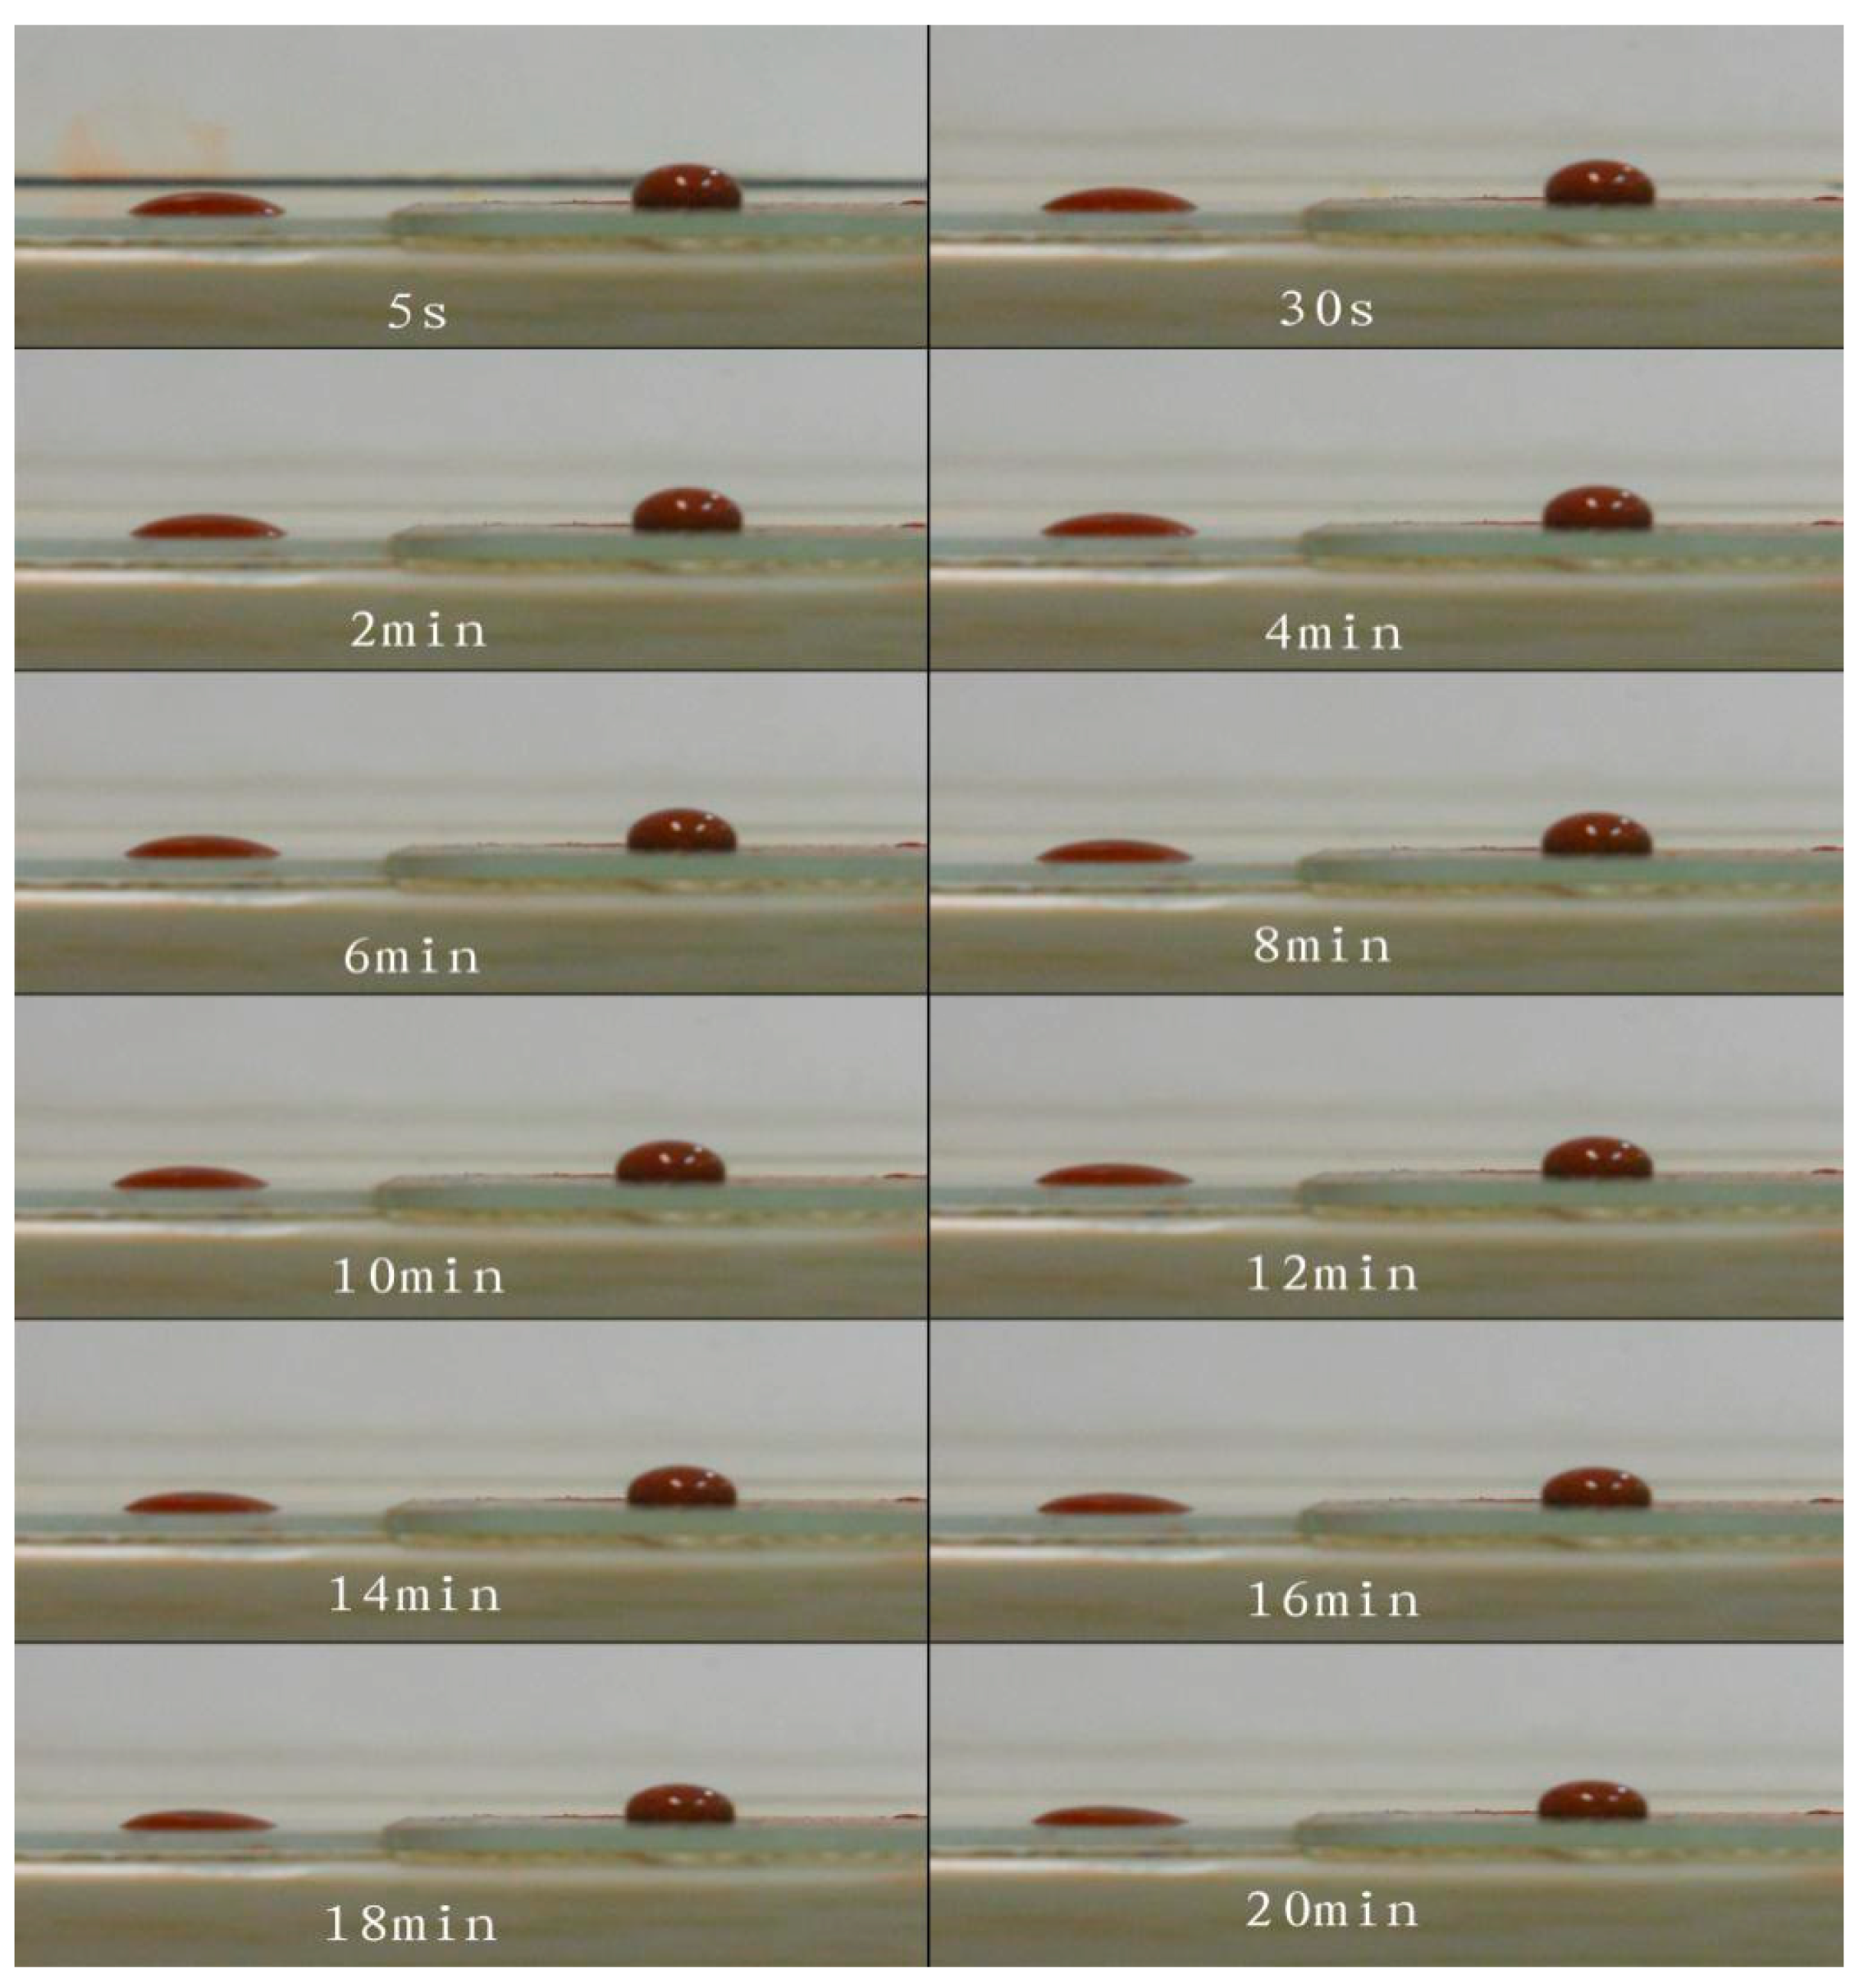
According to the test procedure of droplet image analysis method, water drops were placed on the surface of glass slides not coated with the ice-suppressing material and glass slides coated with the ice-suppressing material, and photographed at different times (5s, 30s, 2min, 4min, 6min, 8min, 10min, 12min, 14min, 16min, 18min, 20min). Comparison of the static contact angle of the test results are shown in
Figure 8, where in each picture, the droplets on the left side are on ordinary glass slides (contrast group), and the droplets on the right side are on slides coated with ice-suppressing material (spraying group), and the change of droplet contact angle with time is shown in
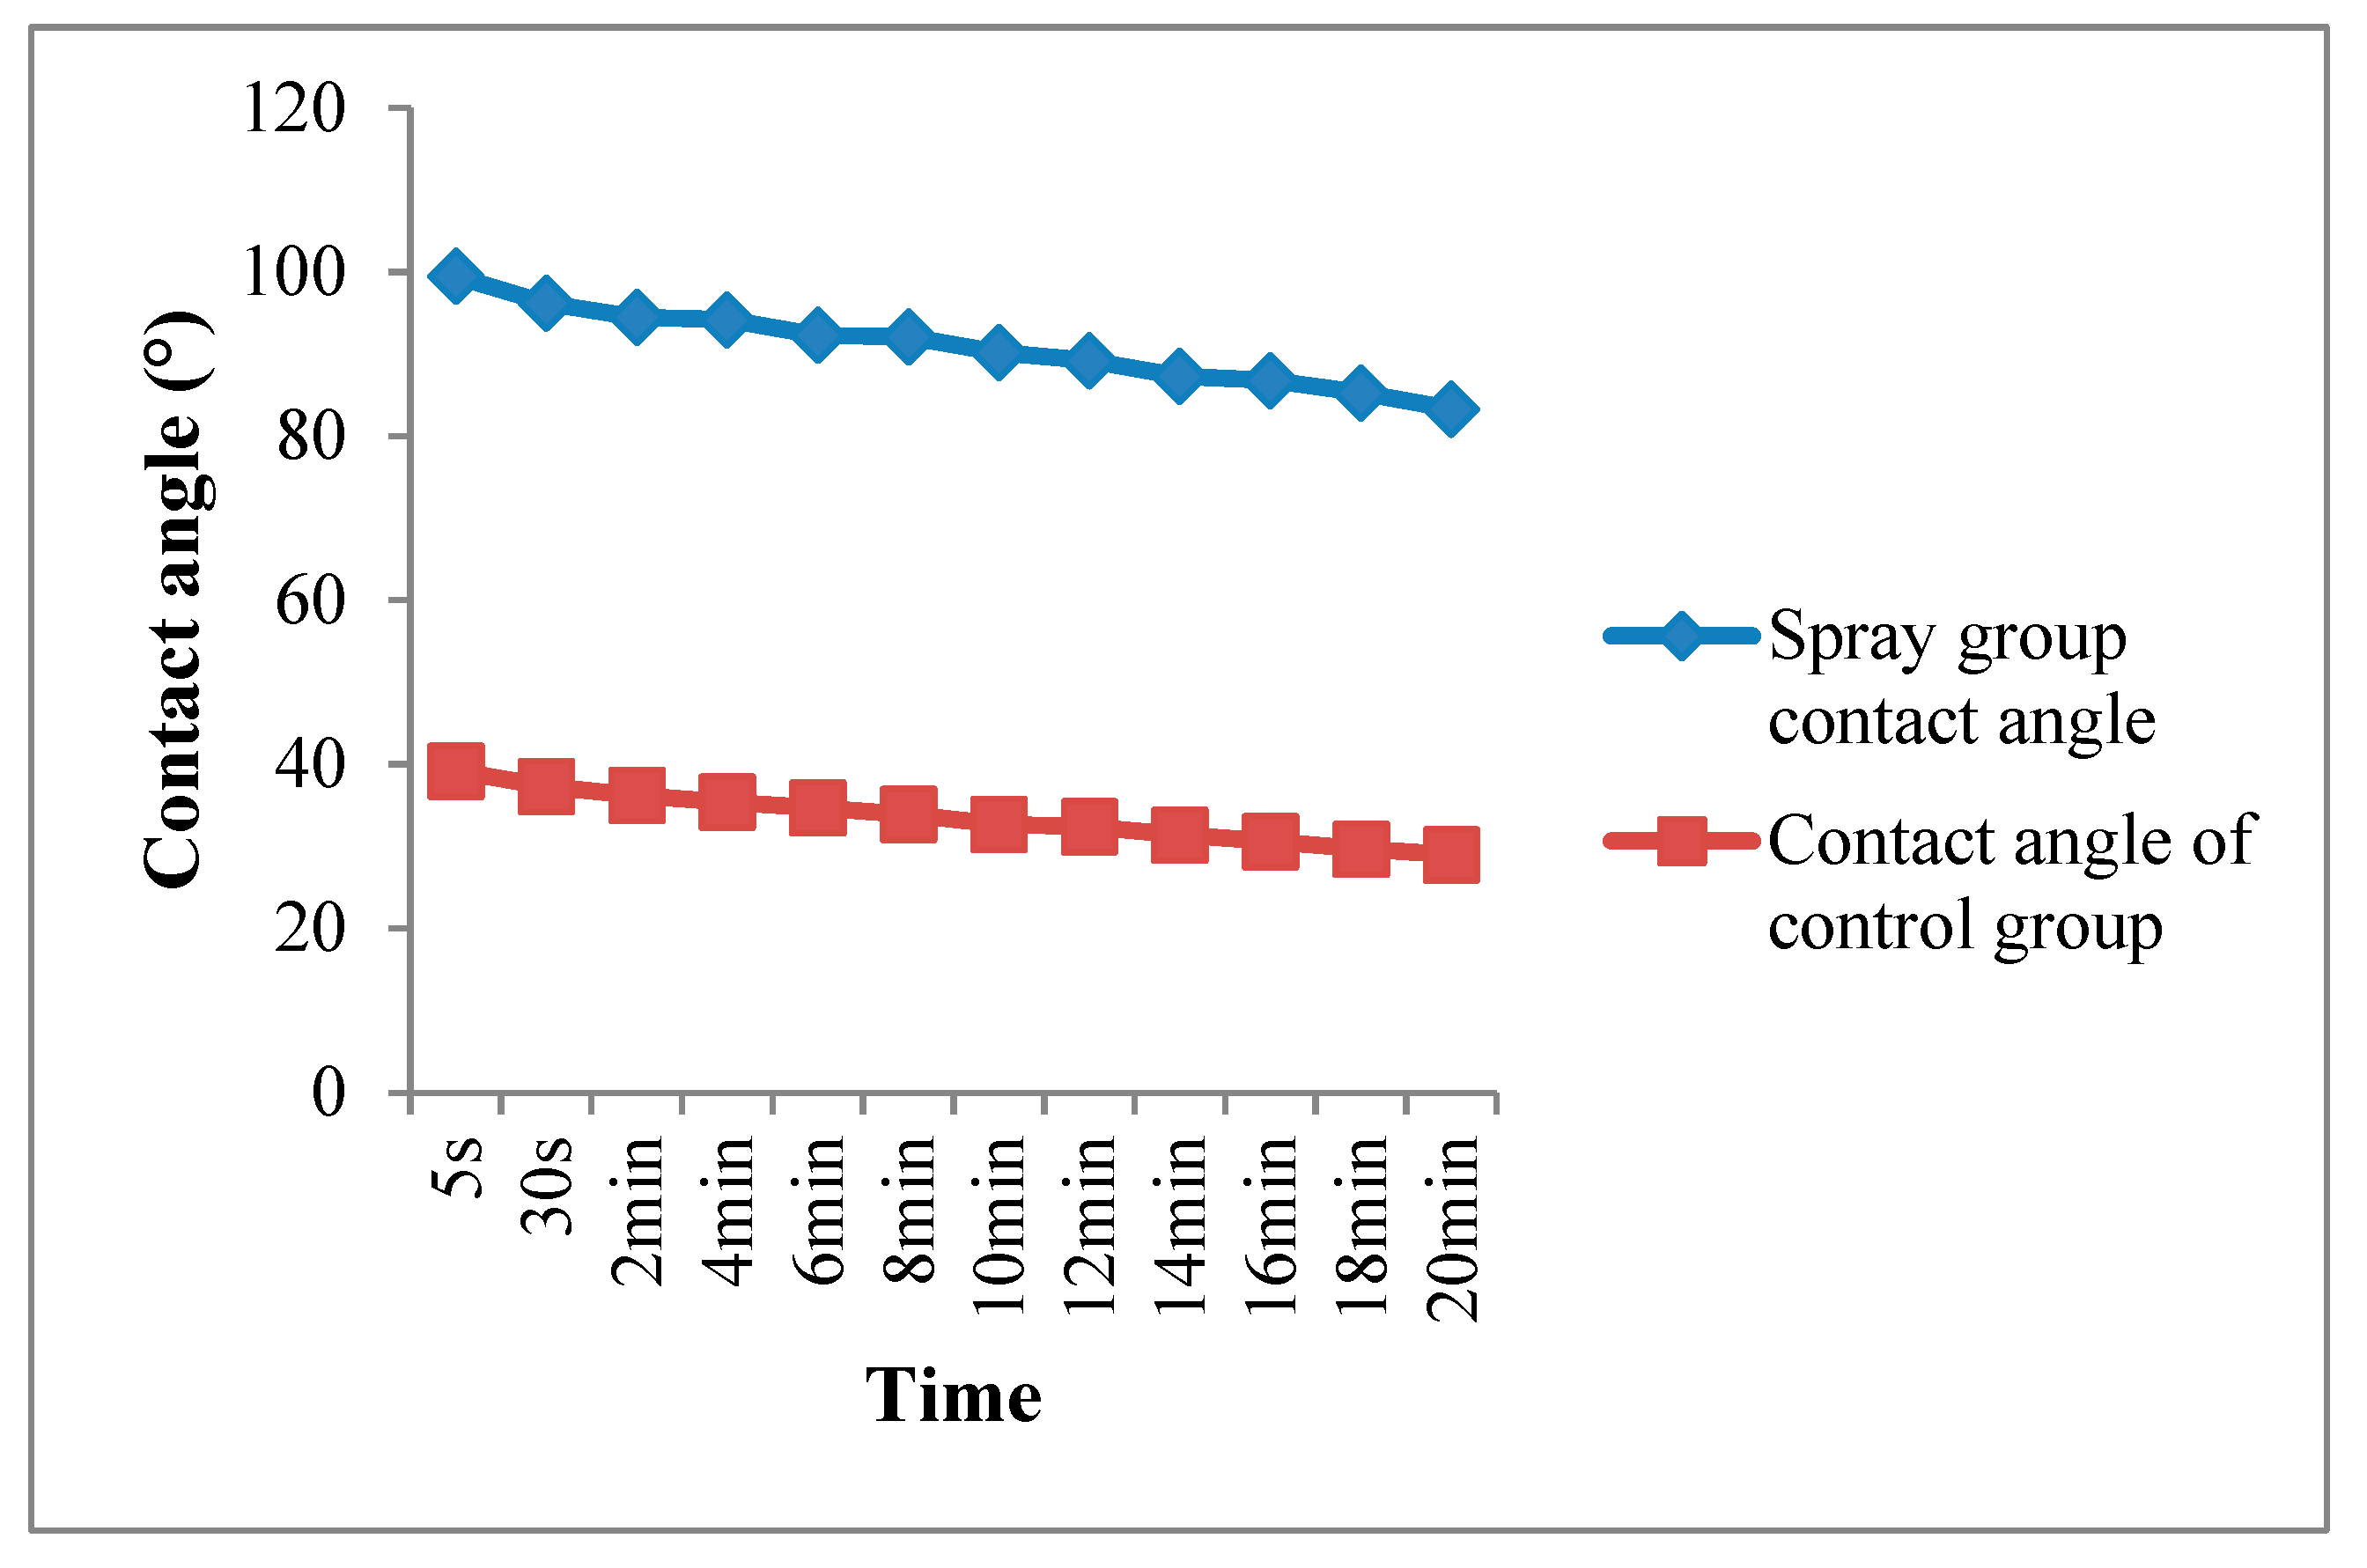
Figure 9.
Figure 9 illustrates the change in the contact angle of droplets over time. The contact angle gradually decreases with the gradual increase of time, the reason for the decrease of contact angle is mainly due to the evaporation of droplets of water and the gradual expansion of droplets with the plane of the slide, therefore, in order to reduce errors and obtain a more realistic contact angle, the time to measure the contact angle is as short as possible. The contact angle of droplets on slides coated with ice-suppressing material was 99.5°at 5s, which became smaller gradually with the increase of time and was 83.3° at 20min. The contact angle of droplets on ice-suppressing material varied from 99.5° to 83.3°, while the contact angle of droplets on clean slides varied from 39.2° to 29°. From the data comparison, it can be concluded that the ice-suppressing material has good hydrophobic properties and can significantly reduce the adhesion between the ice layer and the road surface.
3.3. Analysis of adhesion performance test results
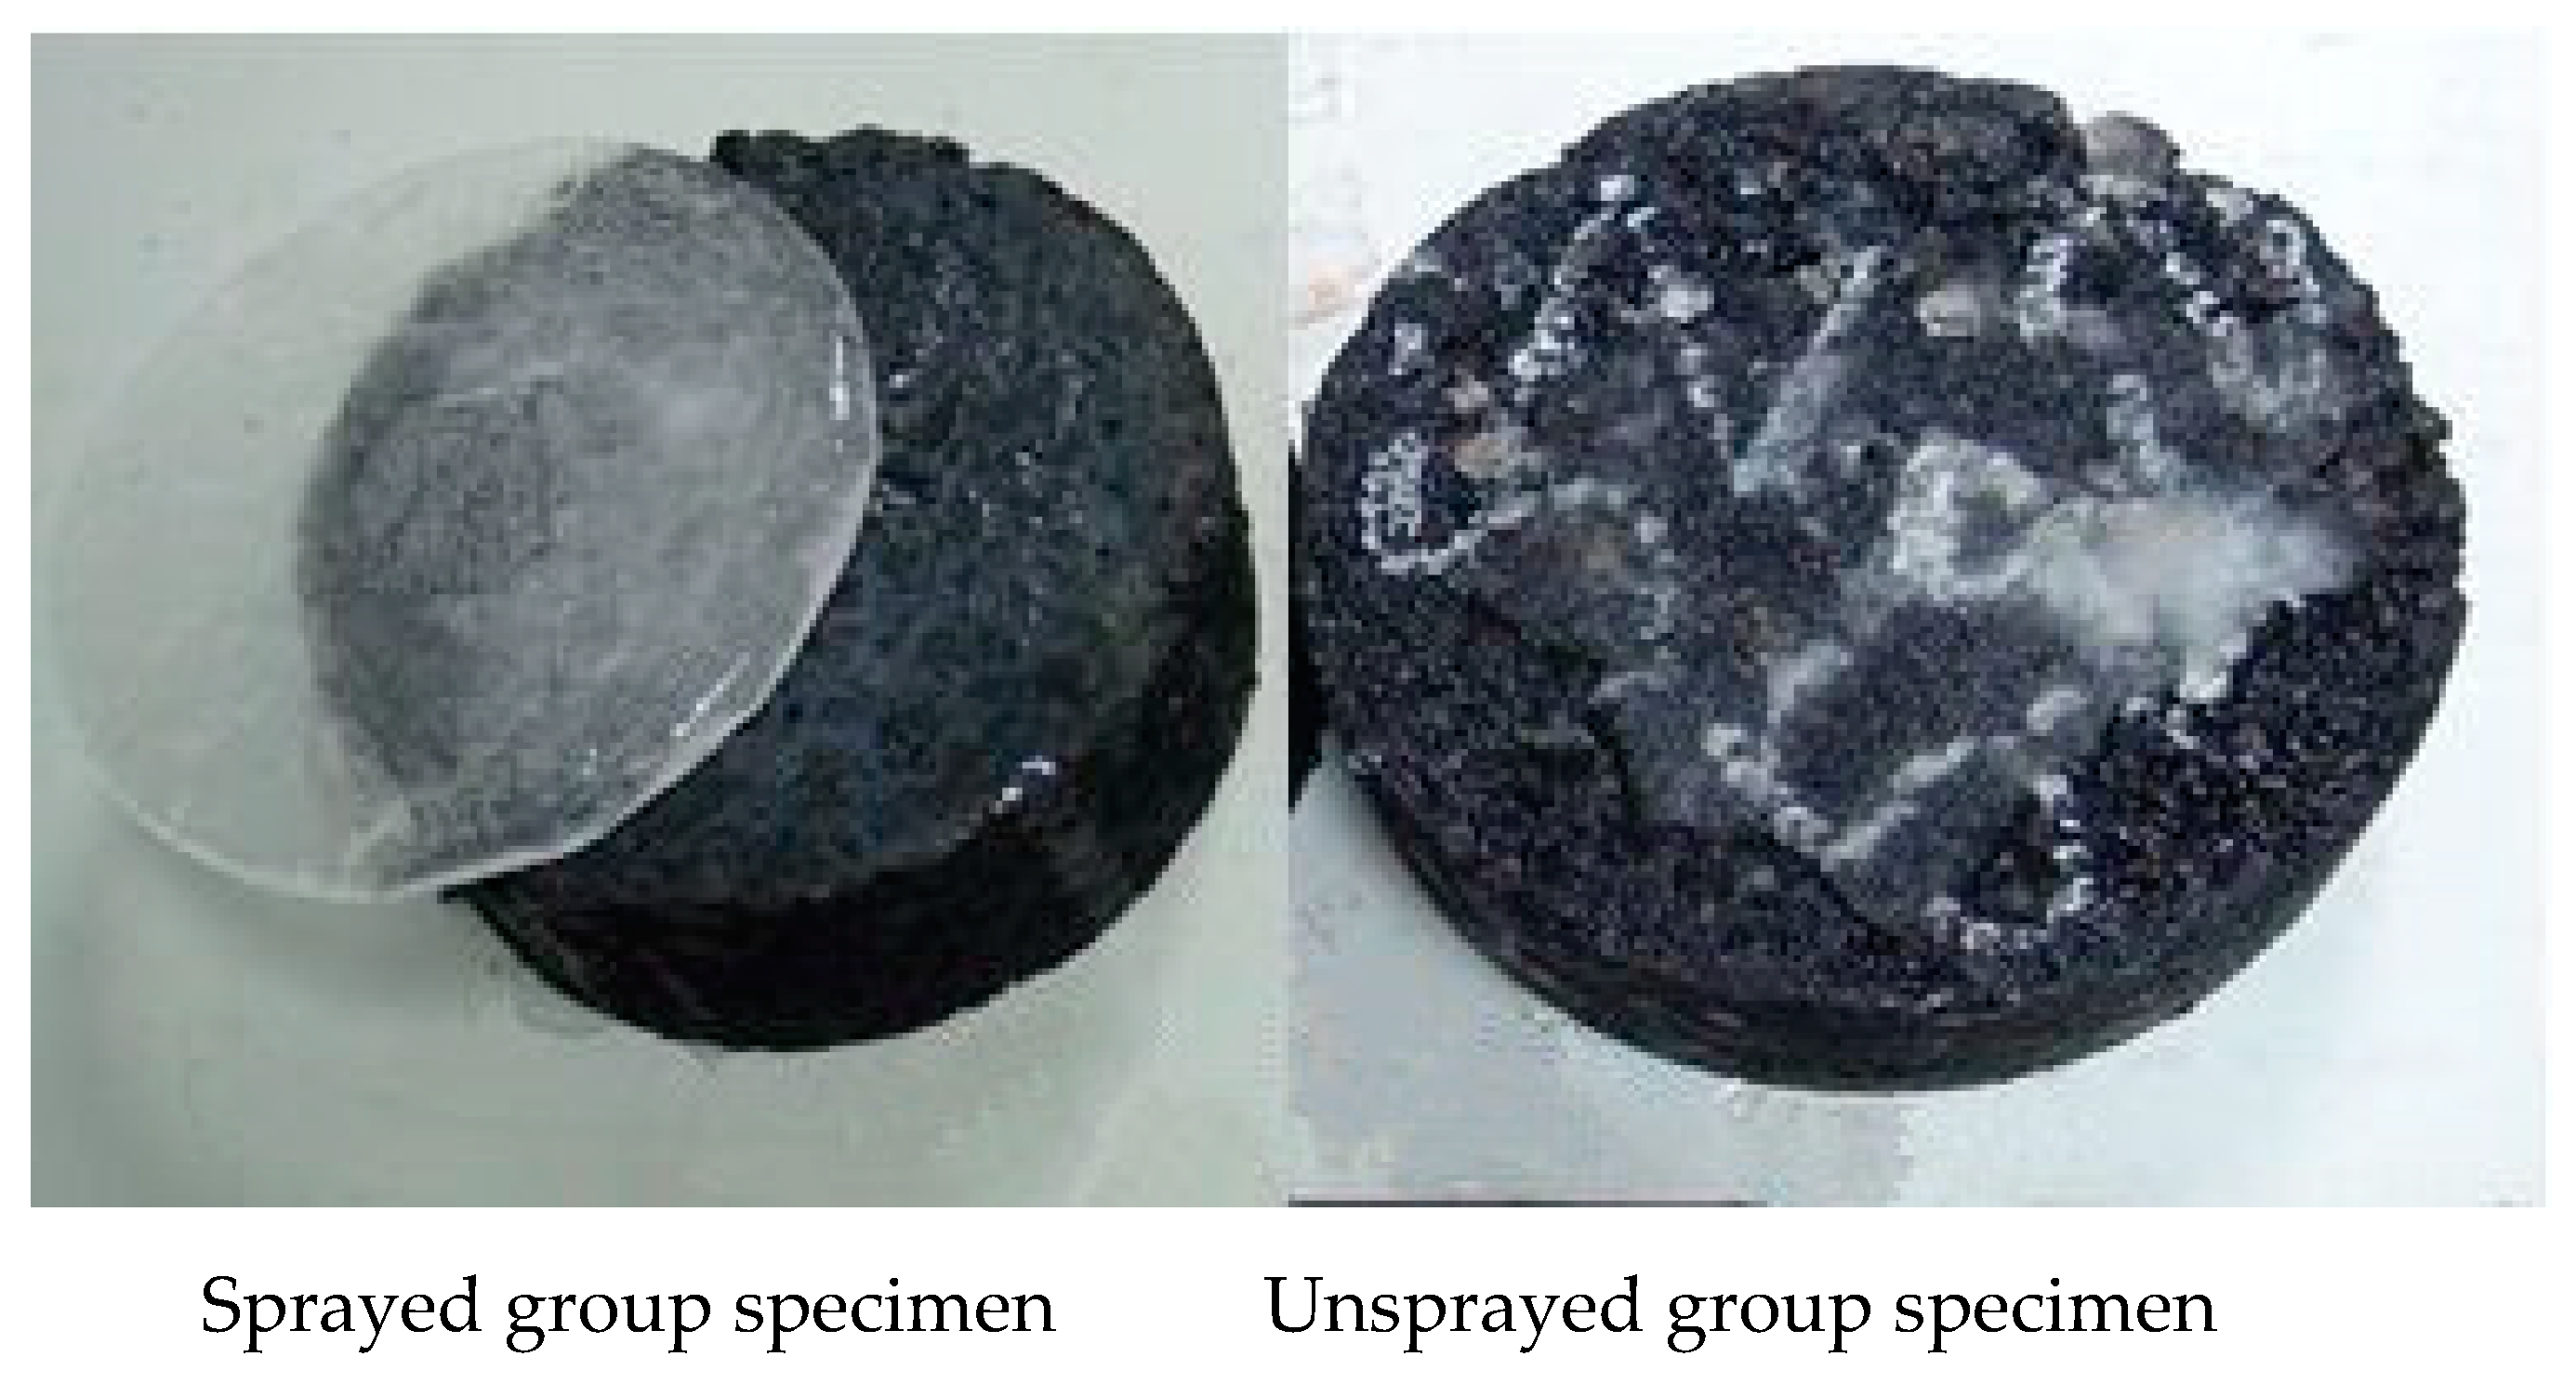
According to the test methods and procedures of adhesion performance, the tensile test and shear test of the sprayed asphalt mixture specimens and the unsprayed contrast asphalt mixture specimens were produced. The interface between the ice layer and the specimens after tensile and shear tests are shown in
Figure 10 and
Figure 11, the results of tensile and shear tests are shown in
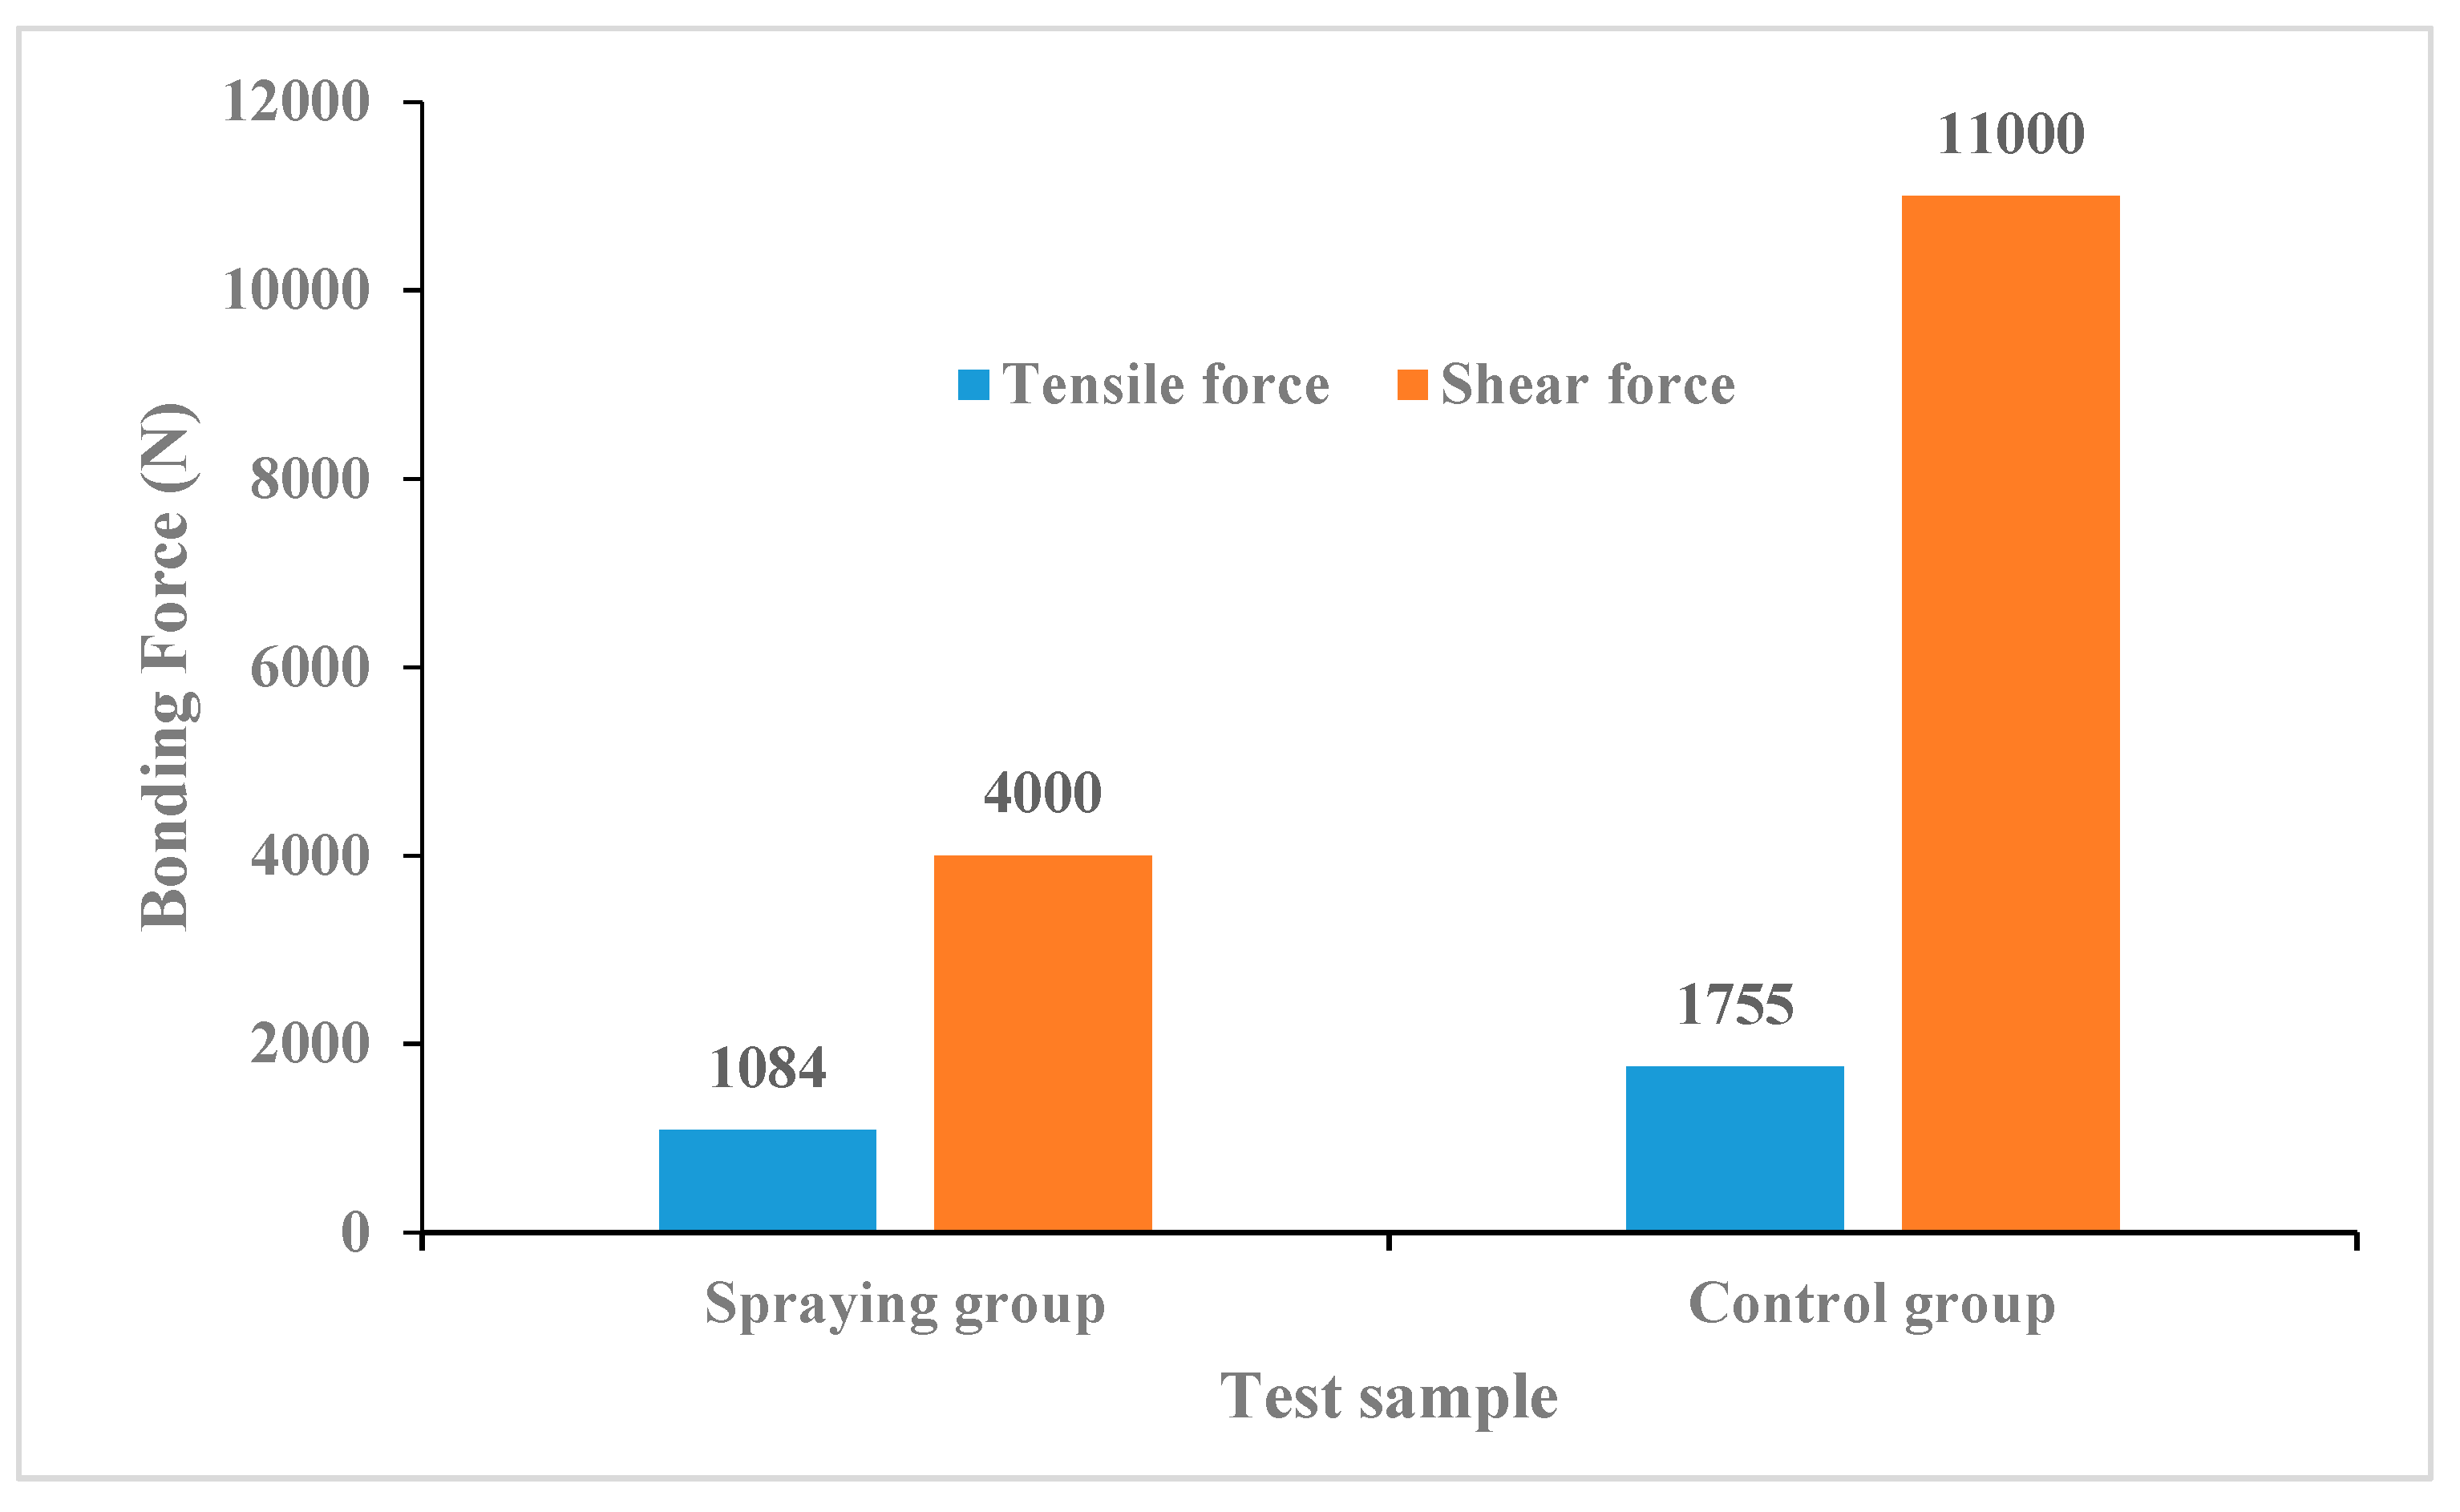
Figure 12.
The tensile test results from
Figure 12 show that when the tensile force of the sprayed group specimen is 1084N, the ice layer is detached from the specimen, and almost no dark ice exists on the surface of the specimen, and the cross-section is flat, which is due to the chemical action of the freezing point inhibitor resulting in the strength of the interface becoming less than the strength of the ice. The fracture occurs at the interface. And when the tensile force between the ice layer and the specimen of the unsprayed contrast group specimen reaches 1755N, the ice layer is detached from specimen, and the two specimens are broken from the middle of the ice layer. A large amount of dark ice still existed on the surface of the specimen, and the cross section between the test piece and the ice layer is conical. The tensile force between the ice layer and the surface of the test piece after brushing with the ice-suppressing material is 38.2%, lower than that between the ice layer and the test piece without the ice-suppressing material. The lower tensile force indicates that the adhesive force between the ice-suppressing material test piece and the ice layer is lower, and the ice layer is easier to remove.
Shear test results show that when the spraying group specimens under shear force reached 4000N, the specimen and the ice layer detached, and almost no dark ice exists on the surface of the specimen, the cross-section is flat. The unsprayed contrast group specimens under the tensile force reached 11000N, the specimen and the ice layer detached, the two specimens are broken from the middle of the ice layer, A large amount of dark ice still existed on the surface of the specimen, and the cross section between the test piece and the ice layer is conical, the test results are similar to the tensile test results. The shear force between the ice layer and the surface of the specimen is reduced by 63.6% after the ice-suppressing material is applied. A lower shear force is favorable for the wheel to crush the ice layer.
3.4. Ice melting performance test and result analysis
The ice melting performance of ice-suppressing material is the key factor affecting the separation of ice and asphalt pavement, as a result the ice-suppressing material melt the lower surface of the ice layer, thus making the ice layer separated from the asphalt pavement, in order to simulate the melting performance of ice-suppressing materials on the ice layer.
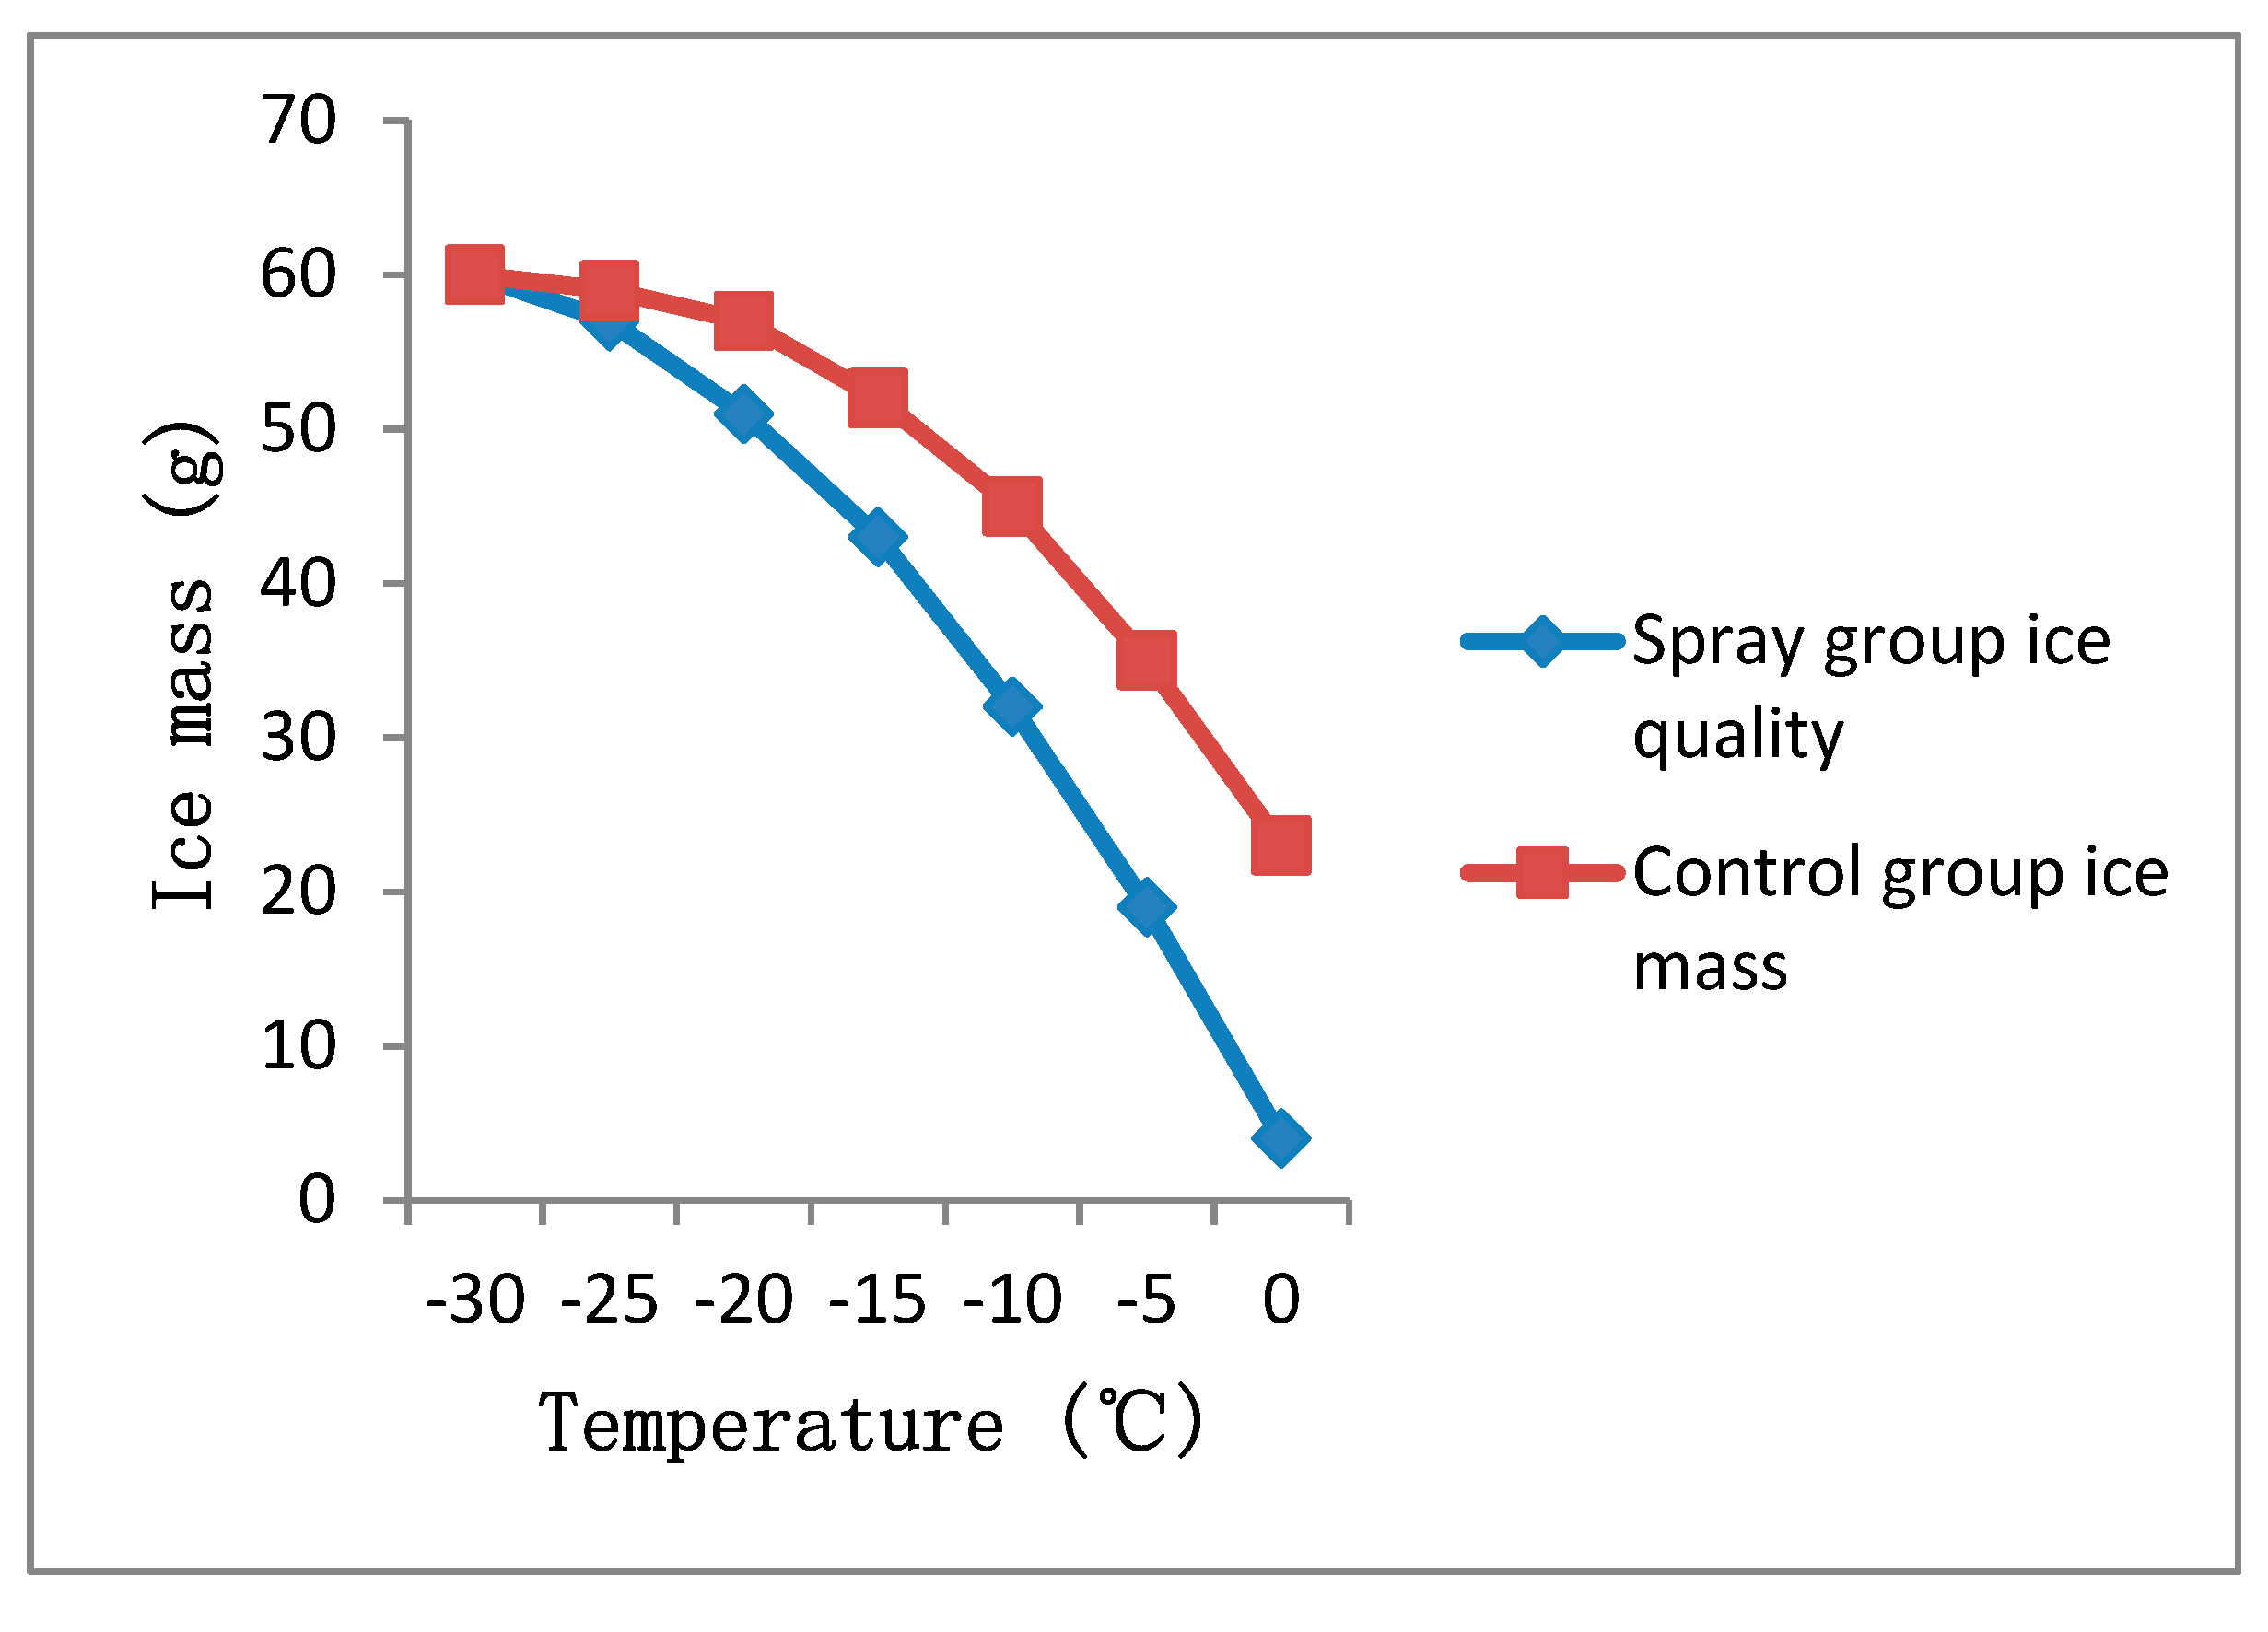
According to the test method and procedure of ice melting performance test, the Marshall test pieces of the spraying group and the Marshall test pieces of the unsprayed contrast group were made respectively. The ice mass of the two groups of test pieces was 60g at -30℃, and the temperature increased by 2℃ every hour. In order to reduce the impact of temperature increase on the change of ice mass, the maximum temperature was increased up to 0℃. The ice melting performance test results are shown in Table 4 and
Figure 13.
Table 4.
Ice melting performance test results.
Table 4.
Ice melting performance test results.
| Temperature (℃) |
Sprayed group ice mass (g) |
Unsprayed group ice mass (g) |
| -30 |
60 |
60 |
| -25 |
57 |
59 |
| -20 |
51 |
57 |
| -15 |
43 |
52 |
| -10 |
32 |
45 |
| -5 |
19 |
35 |
| 0 |
4 |
23 |
It can be seen from
Figure 13 that with the increase of temperature, the mass of ice cubes decreases gradually, and the rate of mass reduction increases gradually; at the same temperature, the mass reduction rate of the unsprayed group’s ice cube is significantly lower than that of the sprayed group’s ice cube. Excluding the influence of temperature rise on the change of ice cube’s mass, indicating that the ice-suppressing material has a good ice melting performance.
4. Conclusions
In view of the characteristics of the ice-suppressing material, the test method for the deicing performance of the ice-suppressing material, the key technologies of the ice-suppressing material and the selection principle of the key component materials are proposed. Through the evaluation of the deicing performance method, the composition proportion of each component of the ice-suppressing material is obtained. Its performance is studied and analyzed from the aspects of its deicing performance and durability. The main conclusions are as follows:
(1) According to the characteristics of the ice suppressing material, an evaluation method for the deicing performance is proposed. The hydrophobicity of the material was evaluated by measuring the contact angle using the droplet image analysis method. Tensile test and shear test were used to evaluate the adhesion of the material to the ice layer.
(2) According to the characteristics of the ice-suppressing material, the proposed evaluation method for the deicing performance is used to design the components of the ice-suppressing material. Through analysis, the mass ratio of component A, component B and component C is mA: mB: mC=97:2:3.
(3) The ice-suppressing material has a good isolation effect on the ice layer and the test piece, and the ice layer of the test specimen sprayed with ice-suppressing material is very easy to fall off.
(4) The contact angle of water droplets on glass slide coated with ice-suppressing material θ with a variation range of 99.5°~83.3°, while the contact angle of water droplets on the clean glass slide is 39.2°~29°. The larger the contact angle is, the stronger the hydrophobicity is, thus the stronger the ice-suppressing material’s hydrophobicity.
(5) The tensile strength of the ice layer and the coated ice-suppressing material specimen decreased by 38.2%, the shear strength decreased by 63.6% compared with the uncoated ice-suppressing material specimen, indicating that the ice-suppressing material can effectively reduce the adhesion between the ice layer and the specimen, making it easier for the ice layer to remove.
(6) Under external conditions with temperature lower than 0℃, at the same temperature, the mass reduction rate of the uncoated group’s ice cube is obviously lower than that of the coated group’s ice cube. The influence of temperature rise on the change of ice cube’s mass is ruled out, which indicates that the ice-suppressing material has good ice melting performance.
(7) The ice-suppressing material has a good slow-release performance, and still has good deicing performance after 7 cycles of tests.
Author Contributions
Conceptualization, Yemao Zhang; methodology, Yemao Zhang; software, Yemao Zhang; validation, Mulian Zheng; formal analysis, Mulian Zheng; investigation, Xijuan Zhao; resources, Mulian Zheng; data curation, Xijuan Zhao; writing—original draft preparation, Xijuan Zhao; writing—review and editing, Xijuan Zhao; visualization, Xijuan Zhao; supervision, Xijuan Zhao; project administration, Mulian Zheng; funding acquisition, Mulian Zheng All authors have read and agreed to the published version of the manuscript.
Funding
This research was funded by the project was supported by the introduction of talents and scientific research start-up Fund of Nanjing Institute of Technology, grant number No.YKJ201834 and the project was supported by the Open Research Fund of NJIT Institute of Industrial Economy and Innovation Management (No.JGKA202204).
Conflicts of Interest
The authors declare no conflict of interest.
References
- Shen, F.; Wei, G.; Pang, R.; Liu, F.; Fang, S. In Performance Evaluation of a Hydrophobically Modified Anti-Slide and Anti-icing Coating, IOP Conference Series: Materials Science and Engineering, 2019; IOP Publishing: 2019; p 033004.
- Wang, T.; Dra, Y.A.S.S.; Cai, X.; Cheng, Z.; Zhang, D.; Lin, Y.; Yu, H. Advanced cold patching materials (CPMs) for asphalt pavement pothole rehabilitation: State of the art. Journal of Cleaner Production 2022, 133001. [Google Scholar] [CrossRef]
- Pytka, J. Determination of snow stresses under vehicle loads. Cold regions science and technology 2010, 60, 137–145. [Google Scholar] [CrossRef]
- Xu, S.; Zhou, Z.; Feng, L.; Cui, N.; Xie, N. Durability of pavement materials with exposure to various anti-icing strategies. Processes 2021, 9, 291. [Google Scholar] [CrossRef]
- Ma, T.; Geng, L.; Ding, X.; Zhang, D.; Huang, X. Experimental study of deicing asphalt mixture with anti-icing additives. Construction and Building Materials 2016, 127, 653–662. [Google Scholar] [CrossRef]
- Huang, K.; Liu, J.; Wang, J.; Shi, X. Characterization and Mechanism of a New Superhydrophobic Deicing Coating Used for Road Pavement. Crystals 2021, 11, 1304. [Google Scholar] [CrossRef]
- Pei, Z.; Yi, J.; Li, Y.; Cheng, P.; Zhu, Y.; Feng, D. Material design and performance analysis of the anti-ice and antiskid wear layer on pavement. Construction and Building Materials 2021, 282, 122734. [Google Scholar] [CrossRef]
- Yang, M. In Research on Application Technology of Self Melting Ice Fine Surface Treatment, Hydraulic and Civil Engineering Technology VI: Proceedings of the 6th International Technical Conference on Frontiers of HCET 2021, 2021; IOS Press: 2021; p 348.
- Ma, R.; Sun, H.; Tian, Z. Study on preparation and performance of slow-release pavement snow melting salt. In Frontier Research: Road and Traffic Engineering, CRC Press: 2022; pp 383-388.
- Yang, Y.; Chen, G.; Yang, Y.; Yue, L.; Xu, J. Advances in Salt-Storage Materials, Road and Anti-Freezing Performances of Salt-Storage Asphalt Mixture: A Review. Coatings 2022, 12, 1323. [Google Scholar] [CrossRef]
- Wang, T.; Wei, X.; Zhang, D.; Shi, H.; Cheng, Z. Evaluation for Low Temperature Performance of SBS Modified Asphalt by Dynamic Shear Rheometer Method. Buildings 2021, 11, 408. [Google Scholar] [CrossRef]
- Yu, W.; Yi, X.; Guo, M.; Chen, L. State of the art and practice of pavement anti-icing and de-icing techniques. Sci. Cold Arid Reg 2014, 6, 14–21. [Google Scholar]
- Yu, H.; He, Z.; Qian, G.; Gong, X.; Qu, X. Research on the anti-icing properties of silicone modified polyurea coatings (SMPC) for asphalt pavement. Construction and Building Materials 2020, 242, 117793. [Google Scholar] [CrossRef]
- Chen, Y.; Tan, Y.; She, H.; Zhang, M.; Jiang, X.; Guo, P.; Li, Y.; Zhang, Y. Characteristics of slow-release ice and snow melting micro-surfacing materials. International Journal of Pavement Engineering 2022, 1–16. [Google Scholar] [CrossRef]
- Zhong, K.; Sun, M.; Chang, R. Performance evaluation of high-elastic/salt-storage asphalt mixture modified with Mafilon and rubber particles. Construction and Building Materials 2018, 193, 153–161. [Google Scholar] [CrossRef]
- Zheng, M.; Zhou, J.; Wu, S.; Yuan, H.; Meng, J. Evaluation of long-term performance of anti-icing asphalt pavement. Construction and Building Materials 2015, 84, 277–283. [Google Scholar] [CrossRef]
- Chen, J.; Ma, X.; Wang, H.; Xie, P.; Huang, W. Experimental study on anti-icing and deicing performance of polyurethane concrete as road surface layer. Construction and Building Materials 2018, 161, 598–605. [Google Scholar] [CrossRef]
- Zhou, L.; Ding, L.; Yi, X., A review of snow melting and de-icing technologies for trains. Proceedings of the Institution of Mechanical Engineers, Part F: Journal of Rail and Rapid Transit 2022, 09544097211059631.
- Shan, L.; Li, Z.; Tian, D.; Tan, Y. Effect of anti-icing additives on the stability of emulsified asphalt binders. Construction and Building Materials 2021, 275, 121951. [Google Scholar] [CrossRef]
- Zhang, H.; Guo, R. Investigation of Long-Term Performance and Deicing Longevity Prediction of Self-Ice-Melting Asphalt Pavement. Materials 2022, 15, 6026. [Google Scholar] [CrossRef] [PubMed]
- Zheng, M.; Wu, S.; Wang, C.; Li, Y.; Ma, Z.; Peng, L. A study on evaluation and application of snowmelt performance of anti-icing asphalt pavement. Applied Sciences 2017, 7, 583. [Google Scholar] [CrossRef]
- Peng, C.; Yu, J.Y.; Dai, J.; Zhao, Z.J.; Fu, J.Y.; Zhao, M.L.; Wang, W. In Synthesis and property of a green melting-snow additive for asphalt pavement, Applied Mechanics and Materials, 2014; Trans Tech Publ: 2014; pp 85-89.
- Wang, T.; Weng, Y.; Cai, X.; Li, J.; Xiao, F.; Sun, G.; Zhang, F. Statistical modeling of low-temperature properties and FTIR spectra of crumb rubber modified asphalts considering SARA fractions. Journal of Cleaner Production 2022, 374, 134016. [Google Scholar] [CrossRef]
- Peng, C.; Yu, J.; Zhao, Z.; Dai, J.; Fu, J.; Zhao, M.; Wang, W. Synthesis and properties of a clean and sustainable deicing additive for asphalt mixture. PloS one 2015, 10, e0115721. [Google Scholar] [CrossRef]
- Wu, S.; Zheng, M.; Chen, W.; Bi, S.; Wang, C.; Li, Y. Salt-dissolved regularity of the self-ice-melting pavement under rainfall. Construction and Building Materials 2019, 204, 371–383. [Google Scholar] [CrossRef]
- Wang, W.; Yu, J.Y.; Yi, Y.; Chen, X. In Effect of De-Icing Additives on Aging Properties of Bitumen, Materials Science Forum, 2016; Trans Tech Publ: 2016; pp 418-424.
- Wang, Z.; Zhang, T.; Shao, M.; Ai, T.; Zhao, P. Investigation on snow-melting performance of asphalt mixtures incorporating with salt-storage aggregates. Construction and Building Materials 2017, 142, 187–198. [Google Scholar] [CrossRef]
- Akbari, R.; Antonini, C. Contact angle measurements: From existing methods to an open-source tool. Advances in Colloid and Interface Science 2021, 294, 102470. [Google Scholar] [CrossRef]
Figure 1.
Principle diagram of falling ball impact test.
Figure 1.
Principle diagram of falling ball impact test.
Figure 2.
Contact angle determined by image processing software.
Figure 2.
Contact angle determined by image processing software.
Figure 3.
Tensile test schematic.
Figure 3.
Tensile test schematic.
Figure 4.
Shear test schematic.
Figure 4.
Shear test schematic.
Figure 5.
Marshall specimens after falling ball impact test.
Figure 5.
Marshall specimens after falling ball impact test.
Figure 6.
Marshall specimens after gravity knockdown test.
Figure 6.
Marshall specimens after gravity knockdown test.
Figure 7.
Rutting plate specimens after falling ball impact.
Figure 7.
Rutting plate specimens after falling ball impact.
Figure 8.
Real time image of liquid drop contact angle.
Figure 8.
Real time image of liquid drop contact angle.
Figure 9.
Plot of droplet contact angle over time.
Figure 9.
Plot of droplet contact angle over time.
Figure 10.
Ice-sample interface after tensile test damage.
Figure 10.
Ice-sample interface after tensile test damage.
Figure 11.
Ice-sample interface after shear test damage.
Figure 11.
Ice-sample interface after shear test damage.
Figure 12.
Test results of adhesion performance of specimens in spraying group(left) and unsprayed contrast group(right).
Figure 12.
Test results of adhesion performance of specimens in spraying group(left) and unsprayed contrast group(right).
Figure 13.
Ice melting performance test results graph.
Figure 13.
Ice melting performance test results graph.
Table 1.
Anti-icing effect evaluation method.
Table 1.
Anti-icing effect evaluation method.
| Anti-icing effect |
Ice surface condition |
| Excellent |
Significant breakage and peeling on the ice surface |
| Good |
Small amount of breakage and cracks on the ice surface |
| Medium |
Only a few cracks on the ice surface |
| Bad |
The only marks on the ice surface are from the impact of the steel ball |
Table 2.
Adsorption performance test results.
Table 2.
Adsorption performance test results.
| Time (h) |
Drying adsorption carrier qualitym0 (g) |
Drying weight m1
(g) |
Adsorption rate
(%) |
| 2 |
100 |
122.21 |
22.21 |
| 4 |
100 |
134.31 |
34.31 |
| 6 |
100 |
144.33 |
44.33 |
| 8 |
100 |
149.42 |
49.42 |
| 10 |
100 |
152.17 |
52.17 |
| 12 |
100 |
153.32 |
53.32 |
| 14 |
100 |
154.02 |
54.02 |
| 16 |
100 |
154.33 |
54.33 |
| 18 |
100 |
154.45 |
54.45 |
| 20 |
100 |
154.45 |
54.45 |
| 22 |
100 |
154.45 |
54.45 |
| 24 |
100 |
154.45 |
54.45 |
Table 3.
Modified ice suppression component C composition ratio.
Table 3.
Modified ice suppression component C composition ratio.
| Ingredients |
Proportion of each component (%) |
| Complex freezing point inhibitor C1 |
54 |
| Porous adsorption carrier C2 |
100 |
| Carbon Black C3 |
2.5 |
| Modified silane coupling agent C4 |
1.6 |
Table 4.
Hydrophobic and adhesion test results.
Table 4.
Hydrophobic and adhesion test results.
| Silicone Rubber Emulsion (g) |
Diluent
(g) |
Contact angle (°) |
Hydrophobic grade |
Tensile force
(N) |
Shear force (N) |
| 100 |
20 |
90.2 |
HC1 |
1644 |
10506 |
| 100 |
60 |
96.3 |
HC1 |
1478 |
8056 |
| 100 |
100 |
102 |
HC1 |
1354 |
6537 |
| 100 |
140 |
108.5 |
HC1 |
1259 |
5245 |
| 100 |
180 |
112.1 |
HC1 |
1215 |
4165 |
| 100 |
220 |
109.3 |
HC1 |
1242 |
5148 |
| 100 |
260 |
107.4 |
HC1 |
1340 |
6449 |
| 100 |
300 |
98.2 |
HC1 |
1537 |
8730 |
Table 5.
Composition ratio of film-forming component A.
Table 5.
Composition ratio of film-forming component A.
| Ingredients |
Proportion of each component (%) |
| Silicone rubber emulsion A1 with a solid content of 20~60% |
100.0 |
| Reinforcing agent A2 |
4.0 |
| Packing A3 |
3.0 |
| Film-forming agent A4 |
4.0 |
| Plasticizer A5 |
4.2 |
| Catalyst A6 |
1.7 |
| Levelling agent A7 |
3.0 |
| Defoamer A8 |
0.3 |
| Diluent A9 |
180.0 |
| Anti-slip quartz sand A10 |
3.0 |
Table 6.
Composition ratio of gluing component B.
Table 6.
Composition ratio of gluing component B.
| Ingredients |
Proportion of each component (%) |
| Cross-linking agent B1 |
29 |
| Coupling agent B2 |
71 |
Table 7.
Falling ball impact test results.
Table 7.
Falling ball impact test results.
| (A+C) Component mass (g) |
Mass of component B (g) |
Post-curing time (h) |
Breakage rate (%) |
| 100 |
0.5 |
7.2 |
17.9 |
| 100 |
1.0 |
5.3 |
17.8 |
| 100 |
1.5 |
3.8 |
17.7 |
| 100 |
2.0 |
3.1 |
17.6 |
| 100 |
2.5 |
2.5 |
15.5 |
| 100 |
3.0 |
1.7 |
12.4 |
| 100 |
3.5 |
0.6 |
9.9 |
| 100 |
4.0 |
0.2 |
6.2 |
Table 8.
Falling ball impact test and bonding performance test.
Table 8.
Falling ball impact test and bonding performance test.
| Mass of component A (g) |
Mass of component C (g) |
Mass of component B (g) |
Breakage rate (%) |
Tensile force(N) |
Shear force (N) |
| 99.5 |
0.5 |
2.0 |
5.8 |
1753 |
10513 |
| 99.0 |
1.0 |
2.0 |
9.8 |
1629 |
9238 |
| 98.5 |
1.5 |
2.0 |
12.9 |
1537 |
8295 |
| 98.0 |
2.0 |
2.0 |
15.4 |
1454 |
7450 |
| 97.5 |
2.5 |
2.0 |
17.4 |
1379 |
6697 |
| 97.0 |
3.0 |
2.0 |
18.2 |
1304 |
6148 |
| 96.5 |
3.5 |
2.0 |
18.4 |
1237 |
5685 |
| 96.0 |
4.0 |
2.0 |
18.6 |
1181 |
5282 |
| 95.5 |
4.5 |
2.0 |
18.7 |
1151 |
4906 |
| 95.0 |
5.0 |
2.0 |
18.7 |
1129 |
4549 |
| 94.5 |
5.5 |
2.0 |
18.7 |
1110 |
4275 |
| 94.0 |
6.0 |
2.0 |
18.7 |
1095 |
4034 |
|
Disclaimer/Publisher’s Note: The statements, opinions and data contained in all publications are solely those of the individual author(s) and contributor(s) and not of MDPI and/or the editor(s). MDPI and/or the editor(s) disclaim responsibility for any injury to people or property resulting from any ideas, methods, instructions or products referred to in the content. |
© 2023 by the authors. Licensee MDPI, Basel, Switzerland. This article is an open access article distributed under the terms and conditions of the Creative Commons Attribution (CC BY) license (http://creativecommons.org/licenses/by/4.0/).
