Introduction
Coral reefs are considered an important part of marine ecosystems, not only because of their biodiversity, but also because of their geomorphological contributions, such as preventing erosion and protecting coastlines from hurricanes and tropical storms [
1,
2]. Coral reefs also contribute to the stability of the marine environment [
3,
4,
5]. However, coral reefs are declining globally [
6,
7,
8]. Habitat degradation can be defined as a “change in states between one where the provision of resources leads to an ecosystem with high complexity and species diversity, to a state where the resources do not support communities of high diversity”. The lack of suitable shelters for reef fish can threaten the stability of the entire marine ecosystem [
5,
8,
9] and lead to the local extinction of highly specialized species [
7,
10]. Many researchers believe that human intervention is necessary to maintain the stability of the marine environment, where coral reefs suffer substantial damage [
11].
The active restoration approach [
12,
13,
14] proposes creating artificial shelters for the reef fish [
15]. With the right design, artificial shelters can resemble the natural reef and allow fish to continue key processes important to their survival [
11]. Additionally, as is often the case with a natural reef, the right substrate allows for the growth of natural fauna on and within the shelters. A recent study [
16] evaluated the success of artificial shelters and showed that artificial reefs (AR) can provide the same functions and benefits to the marine environment as natural reefs. AR was found to increase fish abundance, improve habitat abundance or coral cover, preserve target species, mitigate stressors, provide coral nursery habitat for source populations, and address socio-cultural and economic values. Higgins et al. (2022) [
16] also found that the use of AR in diverse habitats can provide benefits to both benthic and pelagic communities by reducing anthropogenic pressure on natural habitats [
17] and providing protection from predators and human disturbance. Furthermore, AR can be used for mariculture [
11]. Several methods have been implemented by building artificial coral reefs with different configurations [
17,
18], sinking various artificial structures [
19], or introducing artificial shelters that mimic the reef structures [
15]. The goal is to create an alternative habitat for organisms that rely on the unique and complex structure of corals, such as fish, and motile invertebrates.
Active restoration is gaining popularity, and considerable research has been conducted in the field. However, researchers and practitioners still face a major challenge in attempting to create optimal designs of ARs, as fish distribution and shelter choice are difficult to predict. It has been suggested that an individual is likely to choose the habitat in which its chances of success (survival, fitness; [
20]) are greatest [
21,
22]. In coral reefs, researchers are also trying to understand which habitats are considered ideal for reef fish, i.e., which enable key processes, guilds, and niches. Some studies examine the preference of the reef fish population in a particular area studied or draw conclusions about specific groups such as systematic or functional [
4,
23,
24,
25,
26]. Some studies have focused on general characteristics found to be beneficial for most reef fish species, such as relative size or the ratio between fish size and shelter size [
5,
27,
28,
29,
30], complexity [
5,
31,
32], number of holes [
24,
27,
29,
33], connectivity between shelters [
34,
35], etc. Specific AR features determine the communities’ presence [
26] and understanding them is valuable. However, drawing conclusions from a specific location and shelter design may not be beneficial to other sites in the world and other designs. Moreover, the observed fish communities include many different species with different behavioral patterns, predation, and habitat characteristics needs [
36,
37]. These features will ultimately have different effects on the disturbance of the individuals of each species. We suggest that inference on fish preferences should be made for each species separately rather than considering the entire community in the area [
36,
37]. Focusing on the preferences of each of the predominant species in the area can help design a more appropriate AR that can lead to greater success in restoring damaged coral reefs. Yet, characterizing the preferences of individual species in the study area can be challenging and cost a lot of time, effort, and money. Moreover, small shelters, which are common in the natural reef [
24,
38], often have inherently low fish numbers and present a problem in terms of the statistical tests that can be performed the low data volume.
W designed small round artificial shelters (RAS), which we placed on an abandoned oil jetty at selected locations and monitored for 10 months. To uncover reef fish preferences for specific shelters, we focused on examining two of the commonly studied characteristics of reef fish shelters: size and spatial distribution. Using the data we collected, we were able to determine species-specific preference for 17 of the dominant species in the study area. We overcame the statistical challenges for low-volume data by using a unique four-step analysis of our own design, in which we crossed the preferences of functional (diet) and systematic (family) groups and combined both to determine species-specific preferences.
Methods
Location and experimental design of the shelters
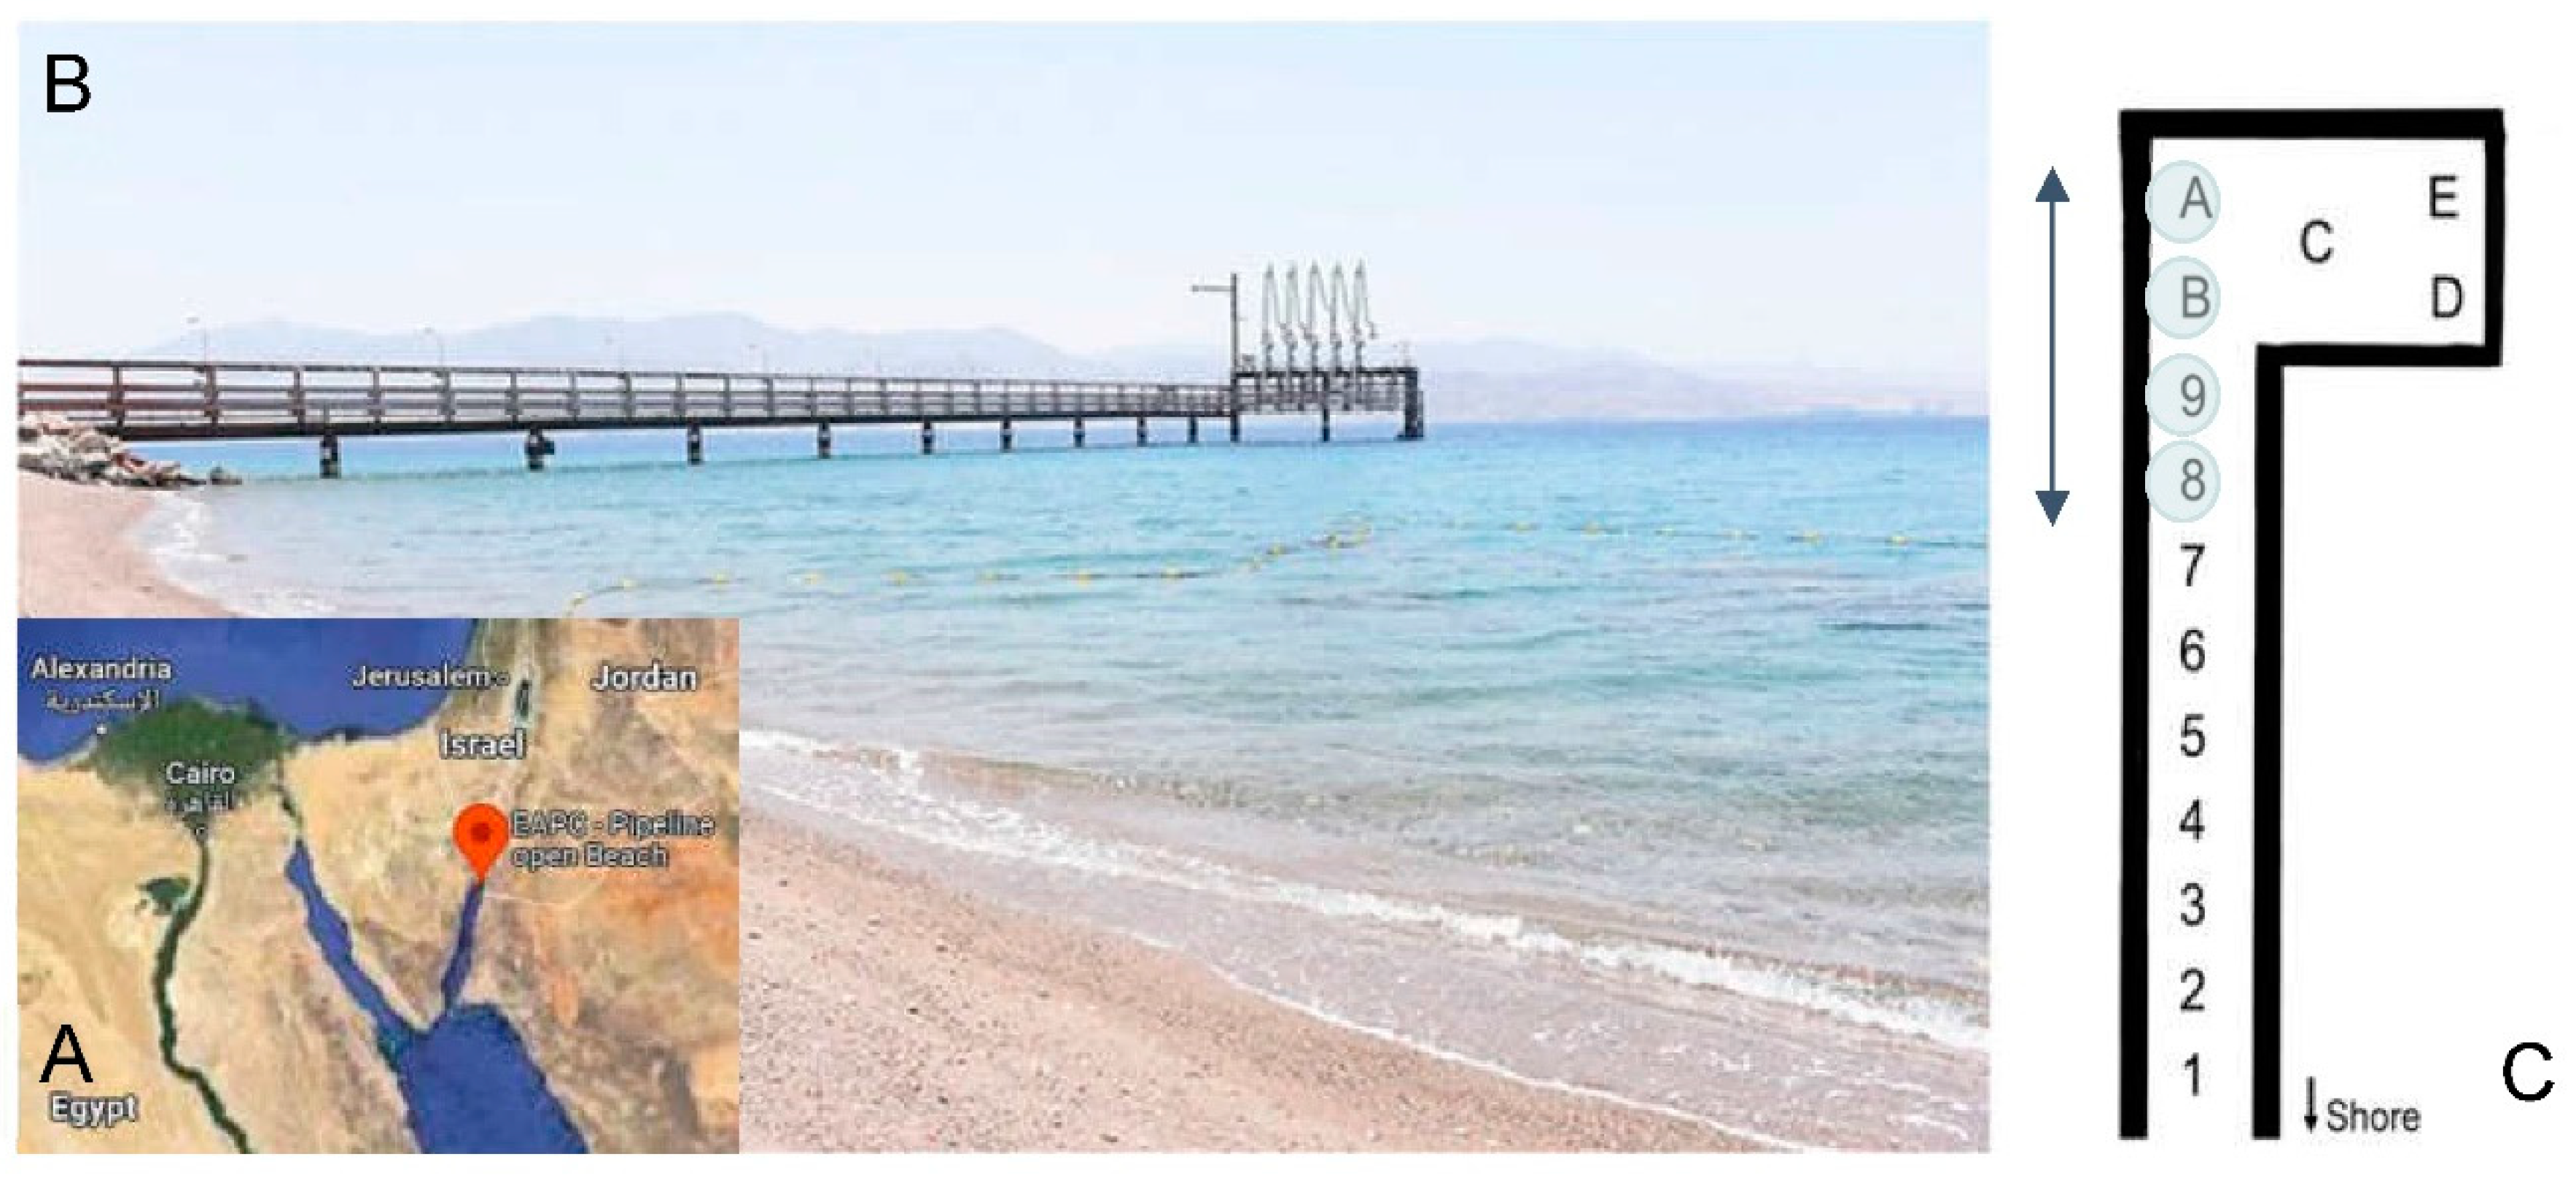
To understand the preferences of reef fishes, any shelter with different characteristics can be used depending on the desired preferences to be explored, particularly for each study site. In this research, the study was conducted at Katza Beach, Gulf of Eilat, Israel (29°
31′24.9′’N, 34°56′09.1′’E). The site is an abandoned oil terminal with support columns anchored to the seabed. We installed balcony-like structures around the columns furthest from the shore (
Figure 1). The column diameters are ca. 1 m, and the balcony diameter was 3 m. Each balcony was made of galvanized steel with white epoxy paint coating. The maximum depth around the columns was about 16 m. The balconies were at depths of 8 to 12.5 m. Column A is about 140 m from the shore.
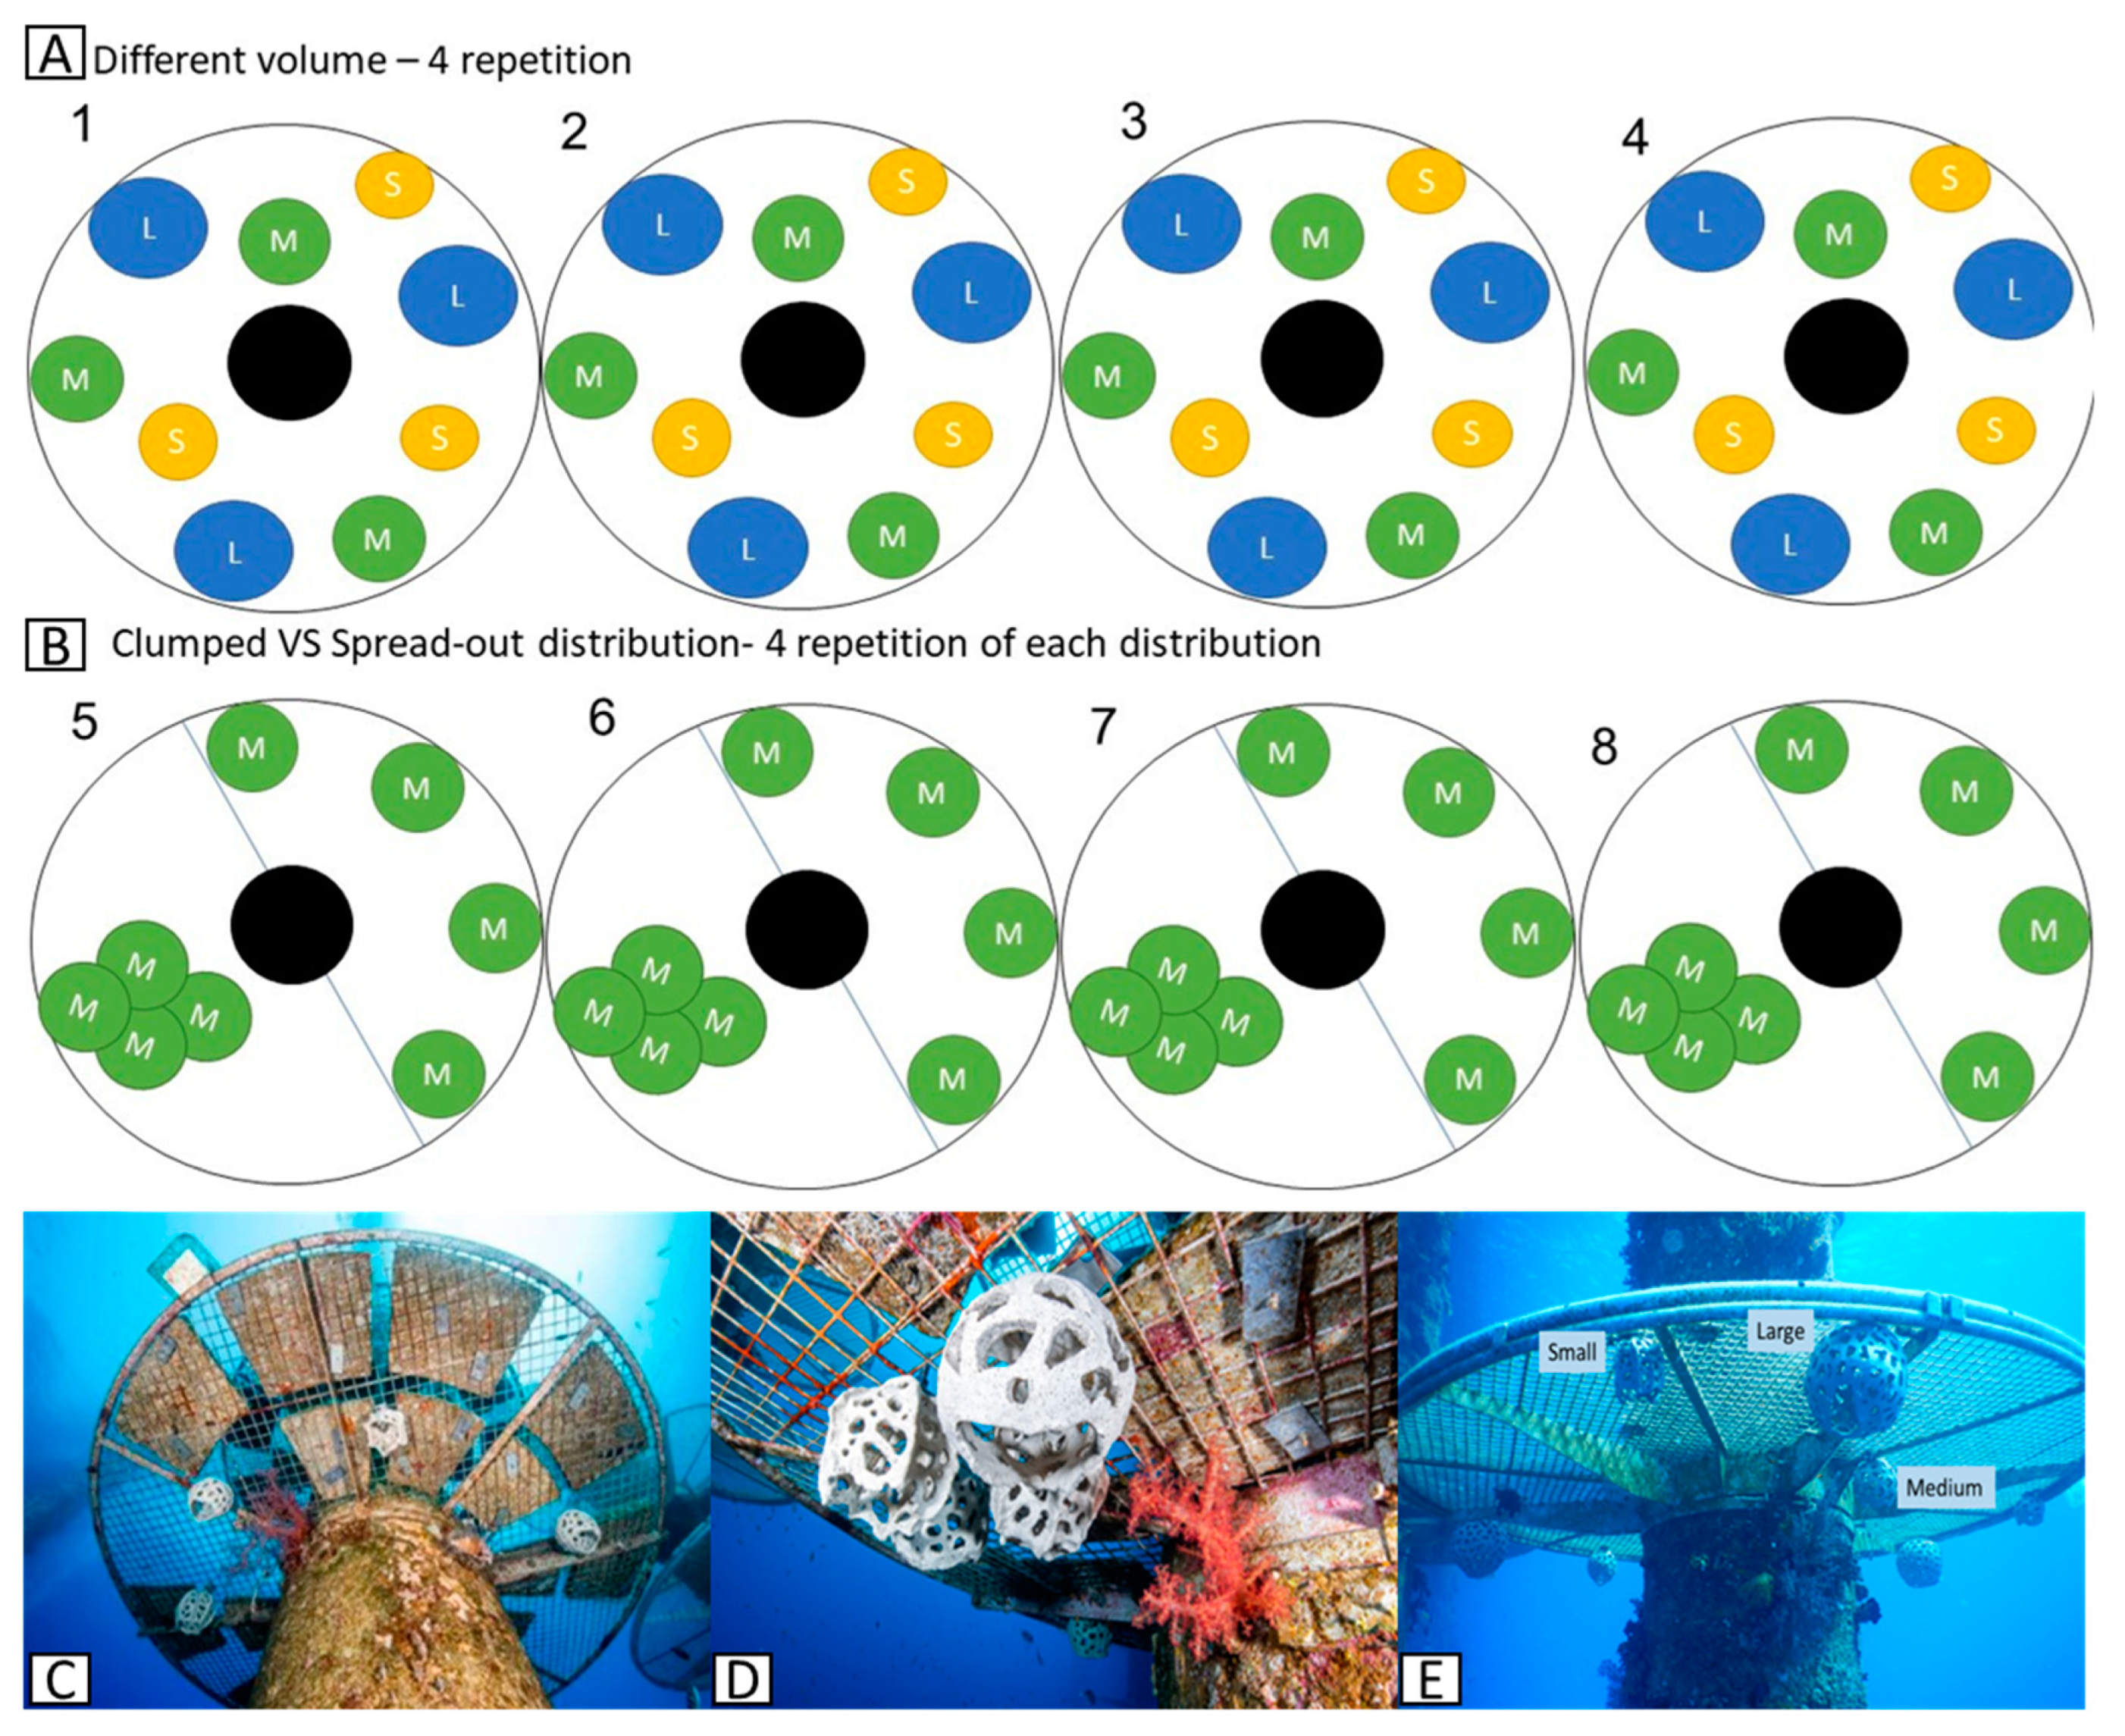
As mentioned, we chose examined fish preferences between three different sized shelters and different spatial distributions (clumped or dispersed) of shelters. Towards this, we installed 68 round clay artificial shelters (RAS)with three different sized volumes – large (10306 cm
3, 27 cm diameter), medium (3315 cm
3, 18.5 cm diameter), and small (1437 cm
3, 14 cm diameter). The large RAS had an average of 145 holes, the medium 91 holes, and the small 65 holes. Entry-hole diameters were similar in all RAS. The various RAS were screwed to the underside of eight balconies on columns 8, 9, A and B (
Figure 1). The balconies were located at an average depth of 10.2 m (
+ 1.4 SD, range 8-12.5; Supplementary-
Table S1).
Experimental configuration for dispersed versus clumped RAS
We compared reef fish recruitment between clumped and dispersed RAS. The design included 32 medium-sized RAS, placed around columns 8, 9, and B, Supplementary-
Table S1). On each balcony we used two arrangements: (a) four clumped RAS and (b) four dispersed, i.e., total of eight RAS on each balcony. The clumped array was placed halfway across the balcony area and the RAS were arranged in a cross shape in the middle. The dispersed array was placed on the other half of the balcony and placed as far apart as possible (
Figure 2B,C,D).
Experimental configuration for the different sized RAS
We compared reef fish recruitment and settlement between small, medium and large RAS. The design included 36 RAS: 12 small, 12 medium, and 12 large (
Figure 2). The RAS were placed on the balconies of columns A and B (Supplementary-
Table S1). On each balcony we placed nine RAS, three of each size, as far apart as possible (
Figure 2 A,D).
Monitoring procedure and sampled areas - The monitoring procedure was identical for both experiments. The fish communities on the RASs and balconies were monitored weekly for two months, every two weeks for the next two months, once a month for the last three months, and again three months later for a total of 10 months. Sampling sessions on each balcony were defined as a four-minute observation on each balcony, followed by one observation on each RAS on the same balcony. The night observations took place once a month for a period of 9 months. The sampling area for the balconies was defined as the balcony boundary and the circumference of half a meter around it or a volume of 2.92 m3 for the observation area. The sampling area for each RAS was defined as the RAS itself and the radius of the RAS around it. The total observation volume for each RAS was: 8244cm3 for the large RAS, 26522 cm3 for the medium and 11494 cm3 for the small RAS. Sampling included data on species abundance and diversity. All sampling sessions were conducted using scuba diving.
Survey Technique - All surveys were conducted by two divers, TS as the lead diver and a dive buddy. All observations were documented by writing on a slate and taking still images with one of two cameras (Panasonic LUMIX DC-FT7, Nikon Coolpix W300). All fish passing through or inhabiting the study area were documented. All fish found in the study were identified to the species level. Some species were difficult to distinguish and were therefore grouped together: Acanthurus nigrofuscus and Ctenochaetus striatus, Caesio lunaris and Caesio suevica, Kyphosus cinerascens and Kyphosus vaigiensis, Parupeneus forsskali and parupeneus macronema, Corythoichthys flavofasciatus and Corythoichthys schultzi. Each survey consisted of two parts: the first was the surveillance of the balcony and the second of the shelters.
Balcony surveillance - Each survey began with the divers hovering about two meters from the balcony, positioned opposite to each other and moving in opposite directions. Both divers documented all fish visible from this distance so as not to disturb the fish. As the survey continued, divers approached the balconies to identify and document the smaller fish (Gobiidae and Blenniidae). The total duration of the observation was four minutes. If there were differences in the number of fish recorded by the two divers, the lead diver’s assessment was used for the final record. Fish identification, abundance, and documentation as well as fish records were then confirmed using images captured during the survey.
RAS monitoring - The RAS were monitored solely by the lead diver TS, were not time-based, and involved an initial observation by hovering near the balcony and then circling it twice, in a specific order through all the RAS. To minimize disturbance to the fish, the first loop was performed approximately one meter from the balcony during day dives and 0.6 meters during night dives. During the first dive, the diver documented from the outside all the fish that passed through or inhabited the RAS. The second loop was performed in the same order, the lead diver swam as close to the shelters as possible to observe them through the shelter entrance.
Data analyses to categorize the different species.
First, we created an accumulation curve to assess species saturation during day and night to ensure that we were able to capture all fish species present at the study site. In addition, statistical tests and manipulations were performed to determine whether there was a significant difference between the fish’s preferences for the different-sized RAS and their distributions. Unfortunately, it was not possible to use a parametric test to compare the abundance of different species because the number of individuals entering shelters was small (average {all species included}/shelter/survey N = 1.45 day, N = 0.74 night).
To formulate the specific occurrence of each fish species, we grouped the different species using two divisions- systematically by family, and functionally by diet. By grouping some species, we obtain a higher total number of individuals, which allows us to successfully examine group frequencies using nonparametric tests. All analyses and comparisons were performed using Excel software and RStudio software. The classification of species into dietary classes was as follows:
Relative abundance was calculated for each species by dividing the number of individuals of the species recorded in all surveys by the total number of fish recorded in all surveys. Relative abundance was calculated from the observations of both experiments (including the control balcony “A-low”) as both experiments took place in the same study area, and was calculated separately for day and night as some species are nocturnal and others are diurnal.
All species with a relative abundance of >10% (during day or night) were functionally grouped based on their reported diet in the literature; data from both experiments were used. The relative contribution of a diet group to total fish abundance was calculated as the number of individuals from each diet group divided by the total number of individuals. Species were assigned to five trophic categories: planktivores (N = 8 species), corallivores (N = 2), herbivores (N = 9), benthivores (N = 14), and piscivores (N = 8), a total of 41 species examined. The species were divided into families as follows:
The relative contribution of each family was calculated as the number of individuals from each family divided by the total number of individuals in both surveys. The five most abundant families were taken into account, and for each family all species recorded in the surveys were examined. A total of 35 species were examined in the families: Pomacentridae (N = 9 species), Serranidae (N = 7), Labridae (N = 11), Acanthuridae (N = 3), and Scaridae (N = 5). After defining the family and diet group for each species, we created a table that allowed us to study each species from the dominant species using a four-step analysis. All tests for the different families were performed using the raw data. The four-step analysis includes:
1. For each family of the five most abundant families in the surveys, we examined preferences for particular shelters by comparing fish abundance at RAS of different sizes (using the Wilcoxon rank sum test), and fish abundance at the different distributions of RAS’s (using the Sign test).
2. We repeated the first step for each of the five dietary groups, i.e., we examined the preferences for certain shelters groups. We examined the preferences for certain shelters by comparing the fish abundances across RASs of different sizes (using the Wilcoxon rank sum test), and comparing fish abundances across the different distributions of RAS’s (using Sign test).
3. We then examined 19 species. For each species we assigned predicted preferences in a table according to species family and dietary association. For each species, the overlaying preferences of both groups (family, diet) were highlighted in the table. For example, the species Pseudanthias squamipinnis which belongs to the family Serranidae and is classified as a planktivore, was predicted to have the same preferences as the other species from the family Serranidae and the other species classified as planktivore.
4. As mentioned above, due to the small number of individuals entering the shelters, it was not possible to conduct a parametric statistical analysis to determine the shelter preferences of each species. Therefore, to test the predictions for each species recorded in the previous steps for each species, we used the sum of total fish numbers from all surveys conducted during the 10-month experiment found in each shelter size or for each distribution type. The total number of fish for each species was recorded in the table and compared to predictions for each species by family and dietary group to determine whether the results were consistent with predicted preferences.
Results
Section 1-General
A total of 66 dives were conducted, with each dive lasting approximately one hour. The first experiment examined the presence of fish in the different RASs. The experiment included five preliminary dives (four ‘day’, one ‘night’), 21 day dives and nine night dives. The second experiment, examined different RAS sizes and included five preliminary dives (four ‘day’, one ‘night’), 18 day dives, and eight night dives. From the surveys of both experiments, a total of 92 species from 30 families were recorded over a period of approximately 1
0 months (Supplementary-
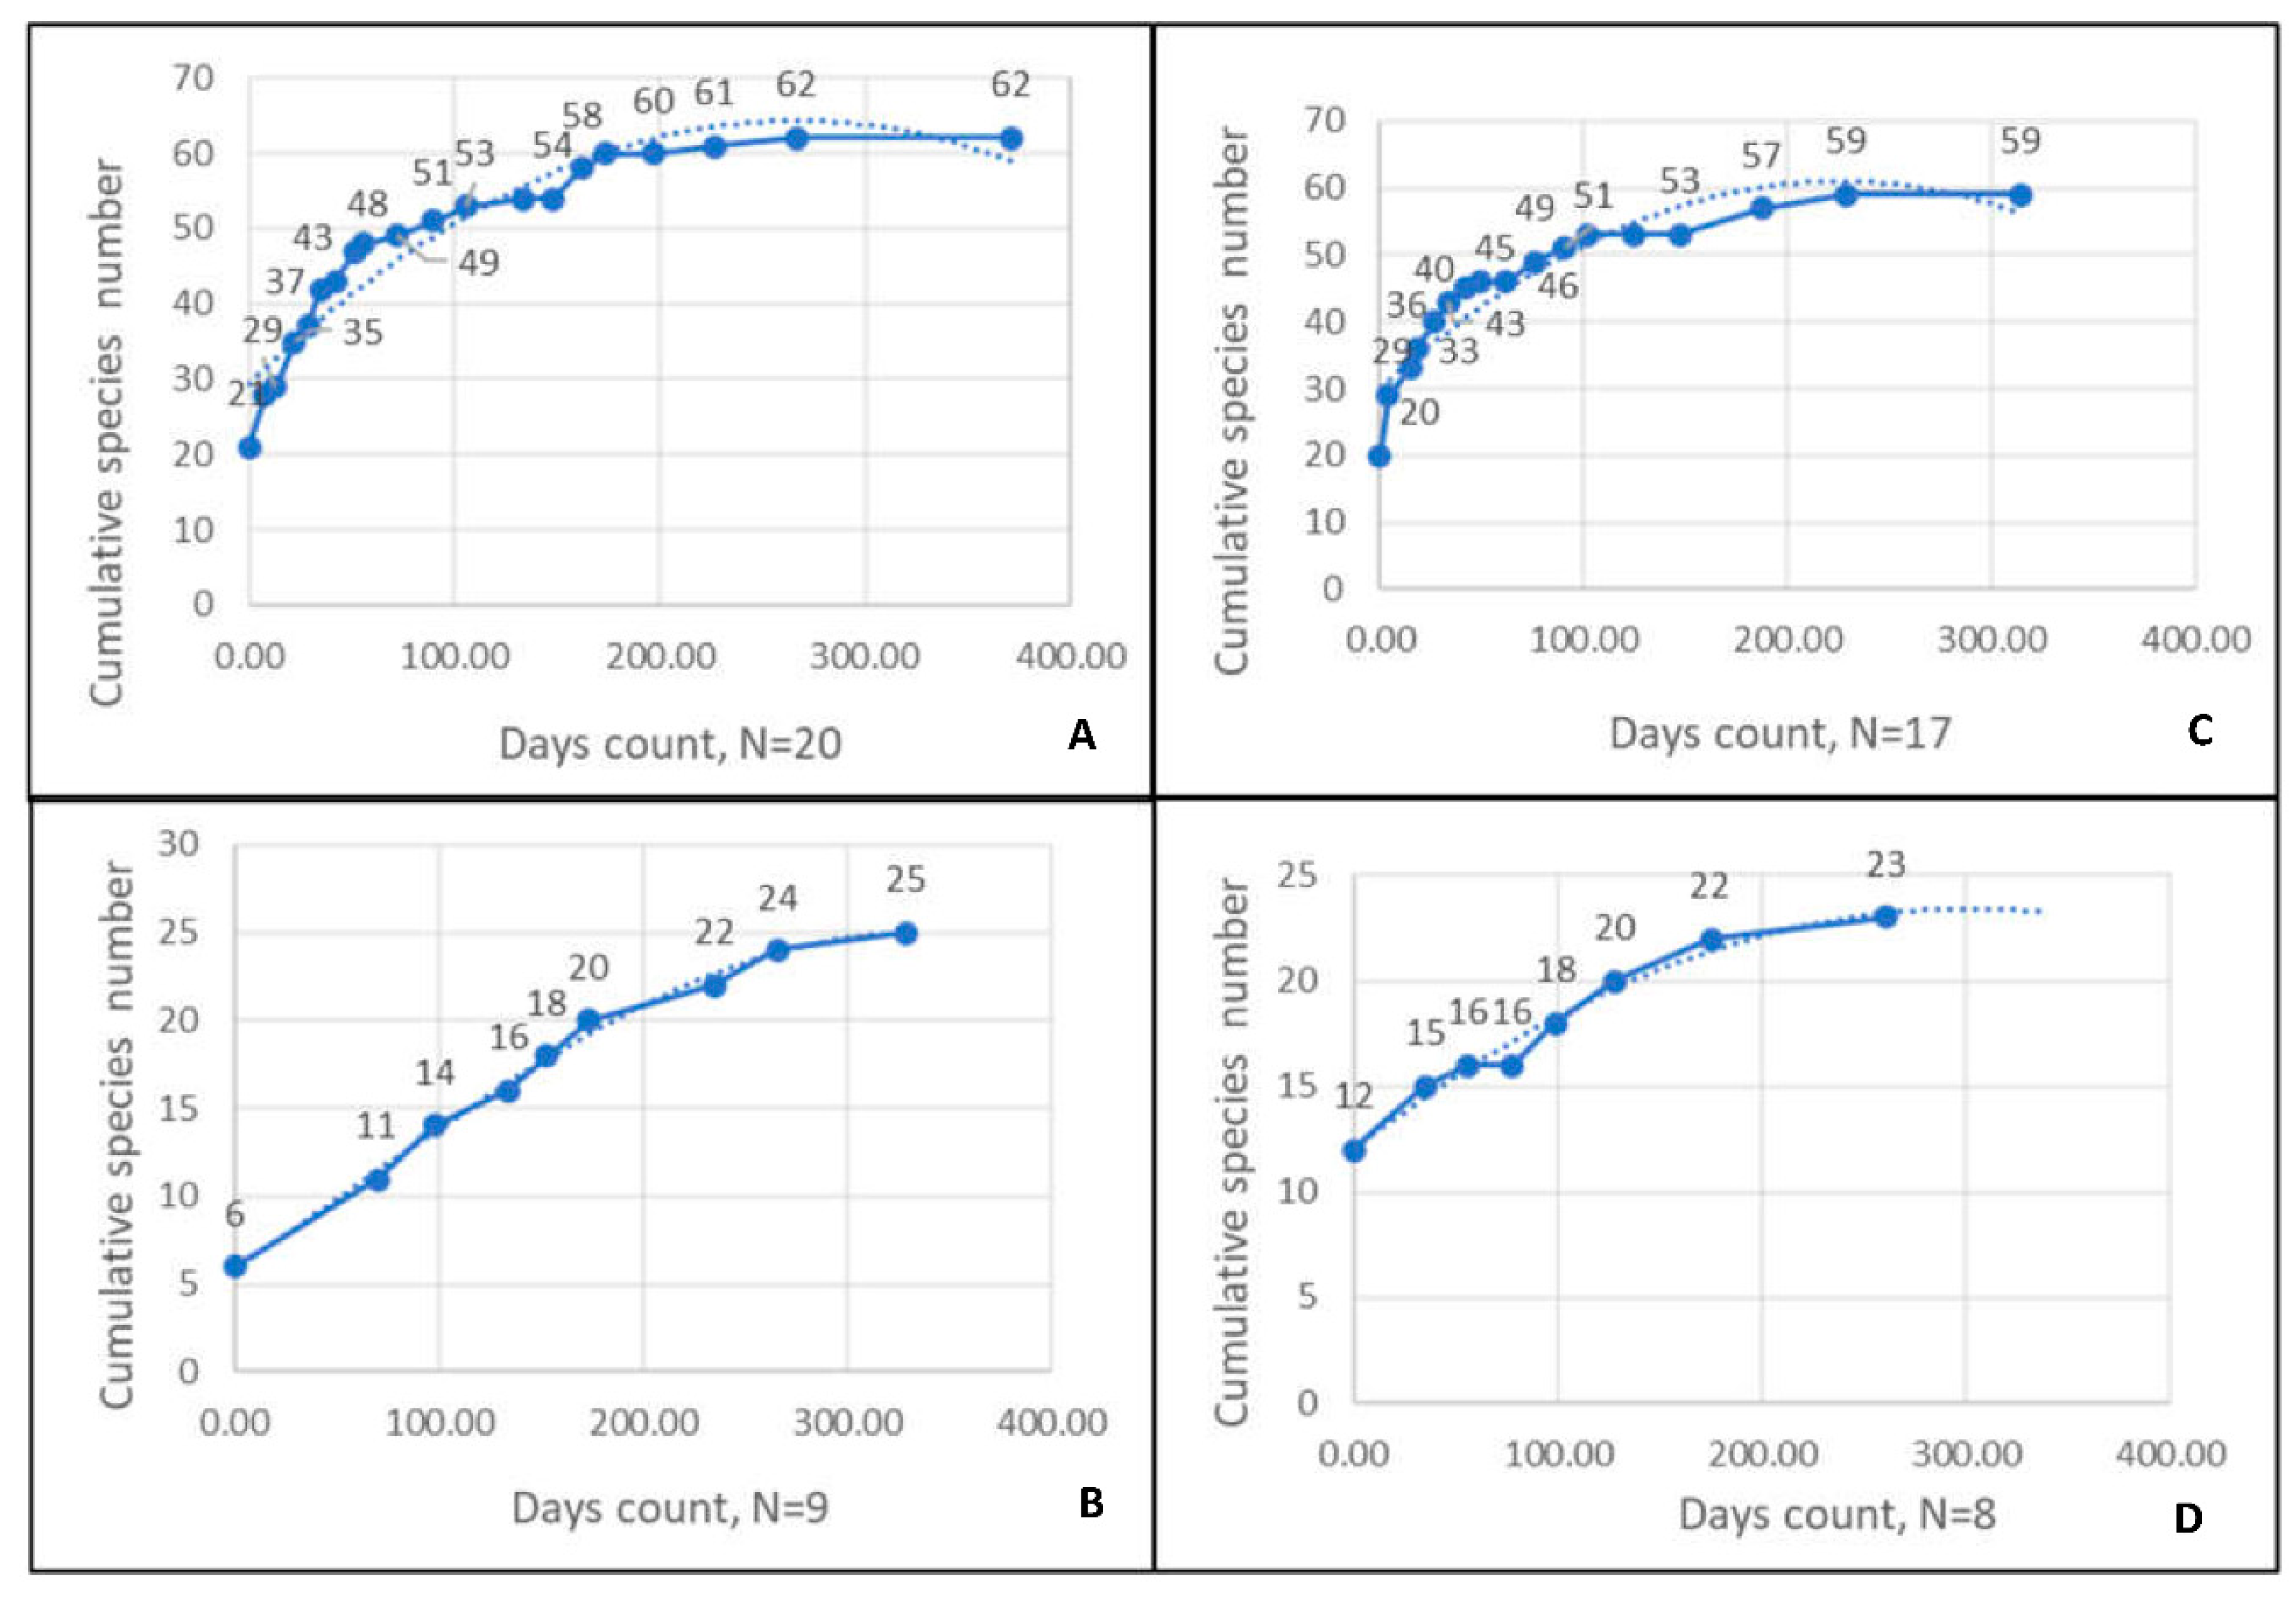
Table S2). The species accumulation curves most likely indicate that all species occurring in the area during the day and at night were recorded in both experiments (
Figure 3).
Profiling species-specific preferences
As described in the methods section, we combined species based on functional (diet) or systematic (family) traits to reveal the specific preferences of each fish species. We examined each species using the four-step analysis (see Methods), with the following results:
- I.
Analyze preferences for shelters across different families.
We examined the preferences of each of the most abundant families at the study site: Pomacentridae (40%), Serranidae (35.4%), Labridae (13.1%), Acanthuridae (3.1%), Scaridae (1.9%). The family Serranidae consists mainly of
Pseudanthias squamipinnis (99%) (Supplementary-
Table S3)
Pomacentridae - During the day, the medium and large RAS showed higher reef fish abundance values than the small RAS L>S (P = 0.004), M>S (P = 0.056, N = 68). At night the spread-out dispersal RAS had higher fish numbers than the clumped dispersal (P = 0.043, N = 36).
Serranidae - During the day, the clumped RAS had higher numbers of fish than the spread-out RAS (P = 0.049), N = 80. At night, the clumped RAS had higher fish numbers than the spread-out dispersal (P = 0.021, N = 36).
Labridae - During the day, the medium RAS showed higher fish abundance than the small and large RAS M>S (P = 0.0003), M > L (P = 0.006, N = 68). At night, the spread-out dispersal had higher fish count than the clumped RAS (P = 0.007, N = 36).
Acanthuridae - During the day, the spread-out dispersal had higher fish abundance than the clumped RAS (P = 0.004, N = 80). No fish were observed at night.
Scaridae - During the day, the medium sized RAS showed higher fish count than the small RAS; M > S(
P = 0.006, N = 68). No individuals were observed at night (
Table 1).
- II.
Analyze preferences for shelters across diet groups.
Diet group percentage was calculated as the total number of fish from each group in all surveys divided by the total number of individuals recorded. The five dietary groups were: planktivores (N = 8 species, 74%), benthivores (N = 14, 6.6%), herbivores (N = 9, 6%), piscivores (N = 8, 3%), and corallivores (N = 2, ~0%) (Supplementary-
Table S4)
Planktivore - During the day, the large RAS showed higher fish density values than the small RAS; L > S (P = 0.05, N = 68). No individuals were observed at night.
Benthivore - During the day, the medium-sized RAS showed higher fish density than the small RAS; M > S (P = 0.0001, N = 68). At night, the spread-out dispersal had higher fish density than the clumped configuration (P = 0.026, N=36). No individuals were observed at night.
Herbivore - During the day, the medium RAS had higher fish density values than the small RAS M > S (P = 0.005, N=68). Furthermore, the spread-out dispersal had higher fish density than the clumped dispersal ones (P = 0.003, N=80). No individuals were observed at night.
Piscivore During the day, the medium-sized RAS showed higher fish density values than the large RAS; M > L (P = 0.002, N=68). No individuals were observed at night.
Corallivore – The sample size was too small for the analysis (
Table 2).
- III.
Using the two previous steps to profile the preference of each species.
For 16 out of 19 species, the results of the family and diet group tests showed an overlap for each species, i.e., they showed the same preference for size or distribution for both family and the dietary group, suggesting distinct preferences. The sample size of the three remaining species (
Aethaloperca rogaa, Larabicus quadrilineatus, Cephalopholis miniata) did not allow statistical analysis. There was no apparent contradiction between species preferences in the different categories, i.e., in no case did species show opposite preferences for shelter size or mode of distribution between family and dietary group. For example, the species
Pseudocheilinus hexataenia was assigned to the table, recording the preferences of its family (Labridae) and dietary group (Benthivore). We found an overlap between family and dietary group preferences both during the day and at night. During the day, we found a preference for medium-sized shelters over small ones, in both Labridae and benthivore groups. Similarly, we found a mutual preference for spread-out dispersal over clumped configurations during the night. We also found the Labridae preffered medium sized shelters over large ones (
Table 3).
- IV.
Compare the total number of fish of each species to see if the results are consistent with the predicted preferences.
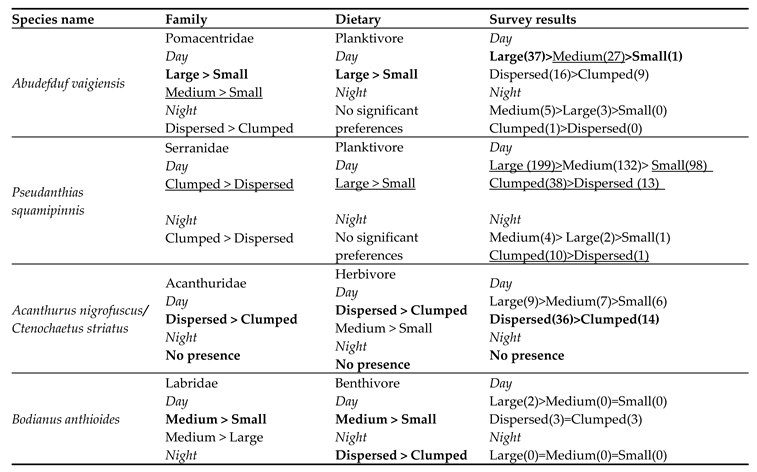
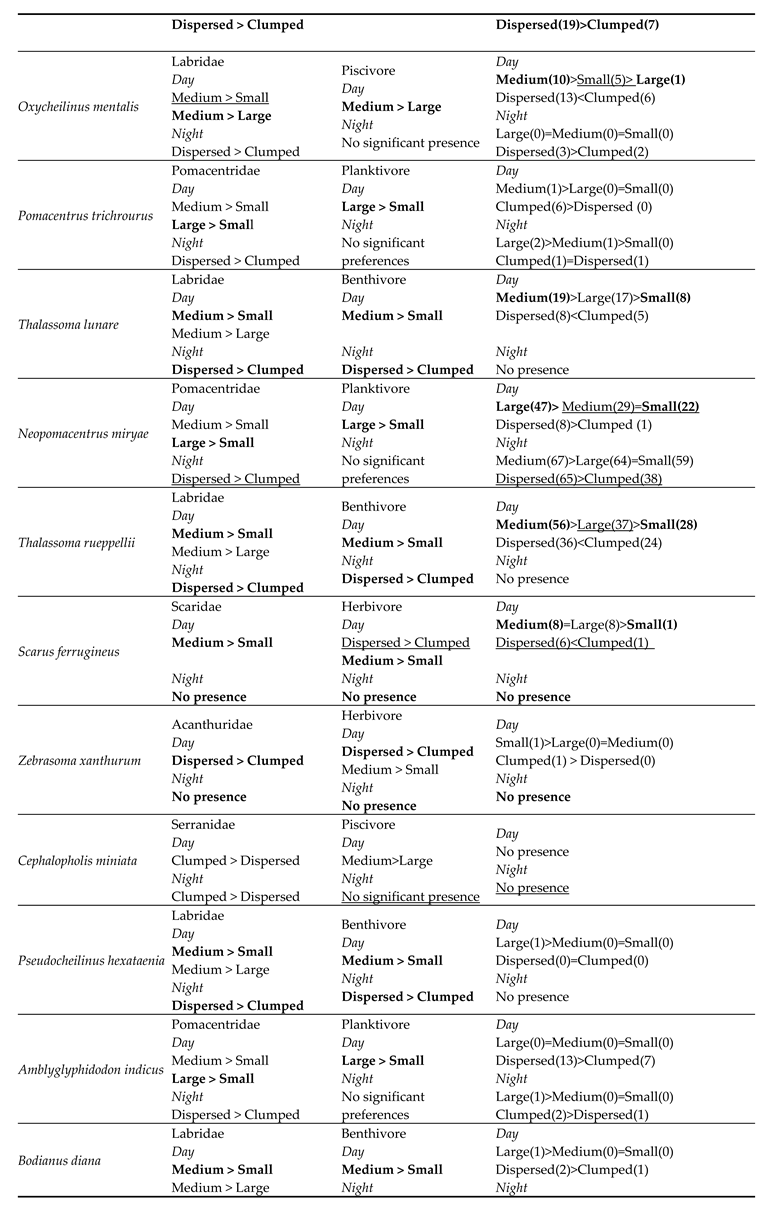
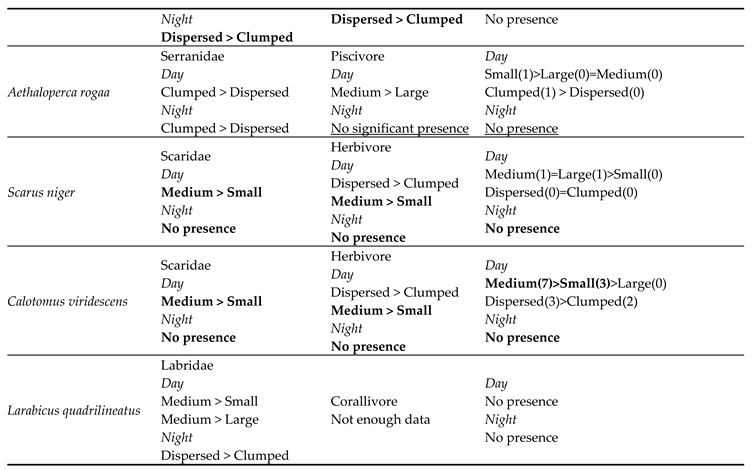
Since it was impossible to examine species preferences in statistical tests (parametric or non-parametric) due to the small number of individuals entering the shelters in both experiments, to verify our results, we examined the preferences of each species based on the total number of individuals counted in each shelter size or configuration. The number of individuals in each shelter was intended to assess the accuracy of each species preference which was determined based on the species’ family and diet.
The total fish count results for the species were consistent with the mutual overlap of categories in 12 of 19 observed species. For the five remaining species we were unable to make an assessment due to insufficient data, and for two additional species no occurrence at all was recorded. The results consisted of the preference predictions for the overlapping test scores (crossing the two categories) and the partial sub-scores (only one of the categories matched) in each comparison with at least three individuals (N ≥ 3,
Table 4).
Discussion
Traditional conservation measures (e.g., no take-zones, nature reserves, marine protected areas) are failing to achieve conservation goals as coral reefs continue to deteriorate [
9,
16], leading to increasing efforts at ‘active’ restoration [
6,
9,
14]. Active management involves the placement of artificial shelters (AR) to provide reef fish with the shelter they need to protect themselves from predators or human disturbance and to facilitate key processes for their survival [
5,
27,
28,
29,
35,
38,
40,
41]. Our goal was to use the Katza oil pier’s artificial structures to uncover the factors necessary for an artificial shelter to be successful in terms of the abundance of desired species.
By collecting data on the fish community over a period of 10-months, we were able to examine aspects of the RAS placed and the behavioral component of the different fish species at the study site. The species accumulation curves from both experiments show that all species occurring in the study area were recorded (
Figure 3). Furthermore, functional diet grouping results were similar to those in the Gulf of Aqaba (Khalaf and Kochzius 2002, Khalaf et al. 2006). The most abundant families were Pomacentridae (40%), Serranidae (35%), and Labridae (13%). These results are similar to other studies conducted in the Gulf of Aqaba over both short (five months, [
42]) and long (six years, [
25]) periods. This supports the contention suggested by Higgins [
16] that a year-long survey like ours is effective for monitoring fish populations for ARs because many fish species have short lifespans. In both studies, the Pomacentridae account for 44% of all fish observed, again similar to other studies of fish populations in the coastal habitat of the Jordanian part of the Gulf of Aqaba [
25,
42]. Most Pomacentrid species are highly site-attached and have small territories or home ranges [
43], meaning that successful shelter may provide a long-term solution for this community.
While it is important to study fish preference as a community, much remains unclear regarding the shelter preferences of specific species. Research has shown that there is no perfect shelter that can accommodate all fish species. Each species requires a different habitat characteristic [
36,
37] and these characteristics ultimately affect the fish community that gathers in the shelters. Therefore, it is important to provide shelter for the benefit of numerous species, design preferences should be determined before broad implementation [
11] . Unfortunately, characterizing the preferences of each specific species in the study area can be challenging and time, effort, and money consuming.
Furthermore, small shelters such as coral heads or knolls are common in the natural reef and should be investigated. However, examining small shelters limits the statistical analysis because the individual numbers are too small. In this study we faced this problem as we were unable to detect significant differences between species-specific shelter preferences. We have overcome this obstacle by forming groups that share a common base, taxonomy, and diet. To our surprise, both classes gave a very clear and meaningful preference regarding the different RAS sizes and distributions. We profiled each fish species using both group classifications, and again compared the results of the relevant groups for each species. The analysis was successful and resulted in a unique preference profile for each species. In some cases, the same preference for shelter size or mode of dispersal was repeated in both groups of the same species. For example, Oxycheilinus mentalis was found to prefer medium-sized shelters during the day, both by family group (Labridae) and by dietary group (piscivores); Acanthurus nigrofuscus and Ctenochaetus striatus also preferred the dispersed distribution during the day, both by family (Acanthuridae) and dietary group (herbivores). In some cases, species preferences were not identical between the twoclasses, but never contradicted each other between groups. In Thalassoma lunare, the family (Labridae) was found to prefer medium-sized shelters over large shelters during the day, a preference not observed in its functional group (benthivores). When both classes were examined, they were found to prefer medium-sized shelters over small shelters, by family (Labridae) and dietary group (benthivores). The different preferences for each species extracted from the systematic and functional groups did not contradict each other in any case.
We then used on-site surveys to check whether all preferences were verified and correct. Because it was impossible to perform statistical tests on individual numbers for some species, we summarized the abundance of each fish species across all surveys for each shelter size or dispersal type. The results of the number of fish found in the shelters agreed with the results of the statistical tests in the two classes. Some of the results were similar (for both classifications) and partial (for one). The results were found to be correct whenever the difference in fish numbers between comparisons was greater than two individuals.
During the 10-month study, we found that the individual fish and species presented different yet specific choices of shelter [
24,
28,
41] These are likely to be due to a range of variables, such as individual size, shelter size, diet, and individual preferences. [
5,
27,
28,
29,
30,
31,
32,
35,
44,
45]. We found that each species has unique shelters size preferences, and we were unable to identify a pattern common to all species. Furthermore, our results suggest that the shelter preferences of species at night differ from the preferences of the same species during the day. For example, shelter may provide protection from diurnal predators, solar radiation, or currents in the water column during the day, which may not be a problem at night[
46] . The behavior of reef-fish at night remains a mystery in many cases and there is still a lot we don’t know, as it is more difficult to study as visibility is limited. We found that during the day only four of the 17 species showed a preference for large shelters over medium and small shelters and a preference for medium vs. small shelters (large>medium>small). Six out of 17 species preferred medium-sized shelters over large and small ones. At night, only individuals of the species
Neopomacentrus miryae preferred medium-sized shelters over large and small RAS (medium>large>small).
The significant differences in the numbers of fish present in the different shelters during the day and at night suggest that the placement and distribution of individuals is not random. It is likely that the species observed made conscious choices and preferred specific features of the different shelters [
24,
28,
41]. An example from our study illustrates the selection process - The species
Neopomacentrus miryae, family Pomacentridae, is a planktivore and is active during the day, when individuals form schools of several hundred fish that feed on zooplankton ([
42]; Figure 7). It is possible that for this reason
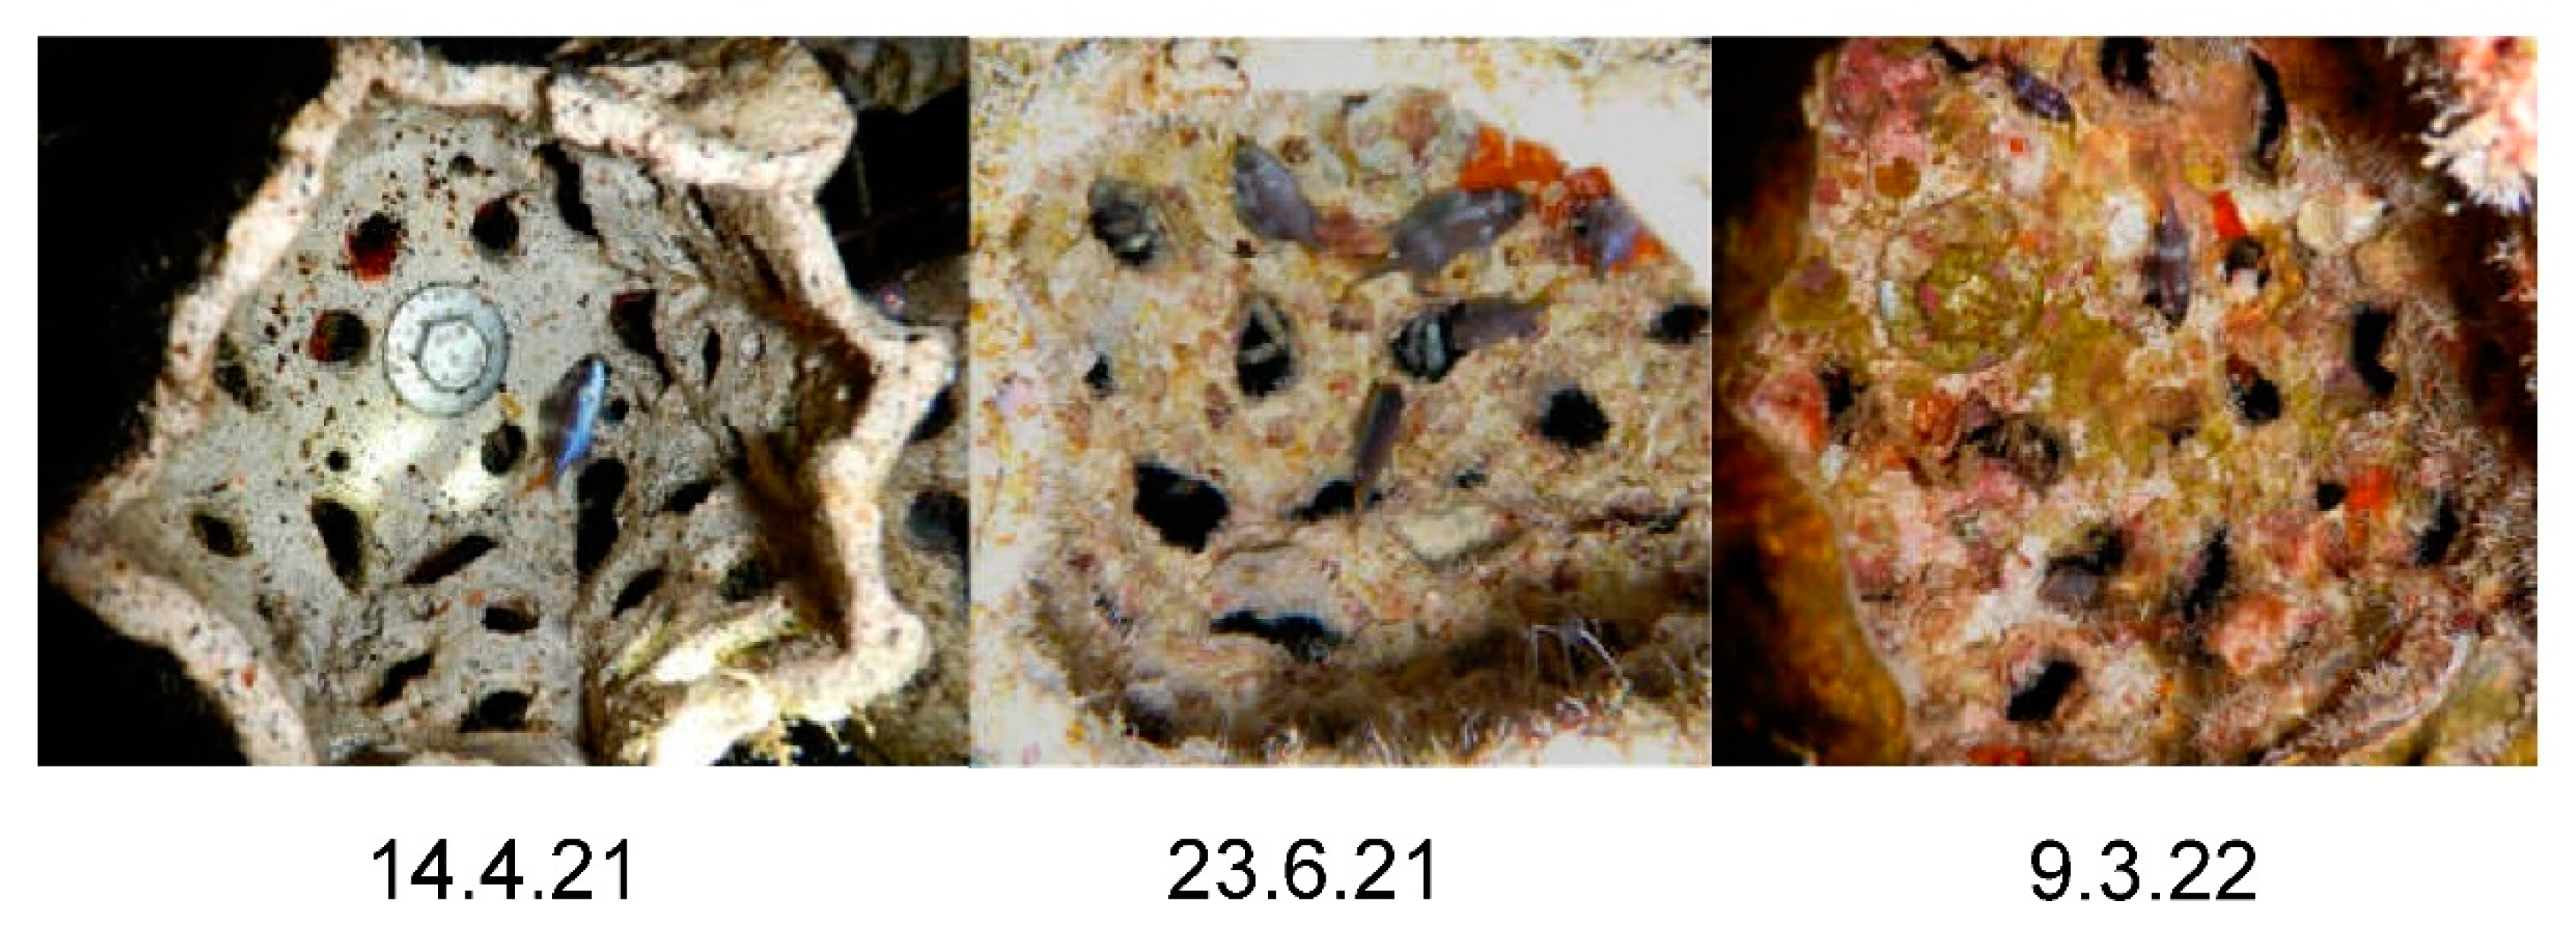
N. miryae were observed in the shelters especially at the night, when they are not feeding but looking for a hiding place to rest. During day surveys, the number of this species reached 200-300 individuals grouped near the balconies. The high abundance of individuals and their tendency to group led us to expect similar grouping during the night in the shelters, but at night, the group spread and in most surveys we observed an average of only two individuals in each shelter, regardless of its size. Since there were only 36 shelters in this experiment, this means that the majority of individuals chose to disperse and seek more distant shelters to avoid clustering in the shelters. The physical size of the shelters did not pose a limitation on individuals, as the small shelters can accommodate 20-25 individuals of the species. Furthermore, in both experiments we observed a pattern in this species where, in the first few weeks, the average fish count was around one individual per shelter. Several weeks later, individuals were observed at a higher density of approximately four individuals in the same shelter. Over the next few months, the observed density decreased to one or two individuals in each shelter and remained the same for the coming month of experiments. The same behavior was exhibited by both small (juveniles) and large individuals over the study period, so it is safe to assume that the size of the individuals was not responsible for the densities observed. The fish’s deliberation and decision to avoid aggregation at the expense of constantly searching for more distant shelters, is an example of the decision-making process of individuals when selecting a shelter for the night (
Figure 4).
For certain species, we found an advantage for a particular size or distribution. For example, the species
Bodianus anthioides, that similar to
N. miryae used the shelters primarily at night, but unlike
N. miryae had
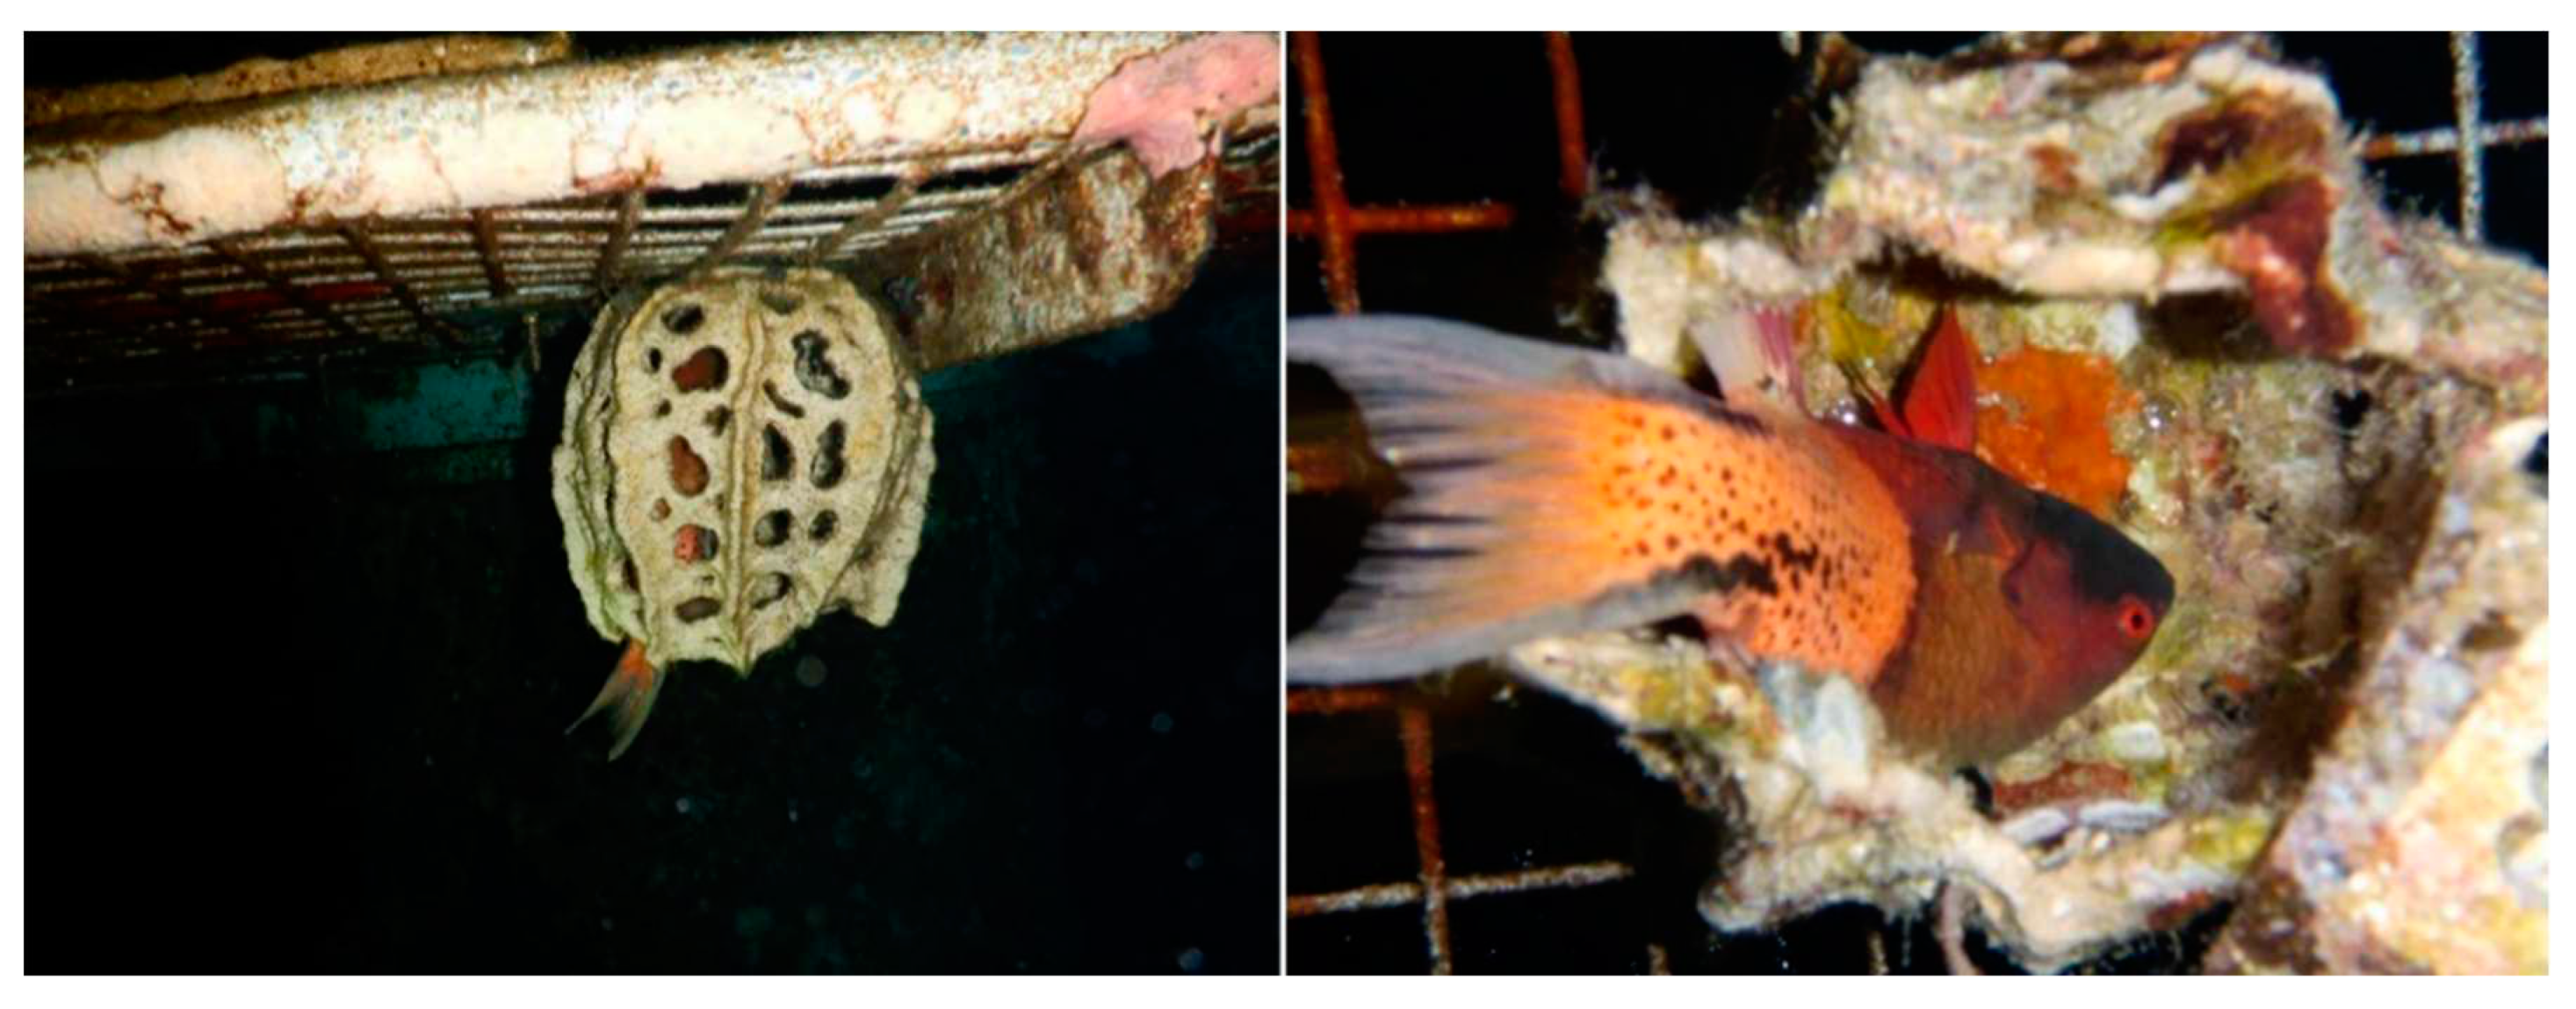
a preference for the spread-out dispersal over the clumped during the night, and used the shelters vertically in a manner that seems almost unnatural (
Figure 5). The results suggest that certain shelters were preferred by certain species. According to species sorting theory, a species occurs in a place if the environment, which can be biotic or abiotic, is favourable. Species-sorting can result in the formation of separated niches containing one or more specific species [
47]. To avoid separation in the design of artificial shelters, we must consider the heterogeneity of artificial shelters, i.e., distribute different shelters throughout the habitat or the study area to achieve optimal diversity.
We conclude that when designing artificial shelters, we need to consider natural constraints such as space availability, changing structural topography, and budget constraints. Our data provides practical answers to which shelter features should be prioritized within these constraints. If we focus on our goals, define the problems and limitations, and take the time to understand the solutions, we can use artificial shelters more intelligently and purposefully, avoiding waste of our limited resources. The advantage of our method is that it reveals common characteristics and preferences of different groups that would otherwise remain hidden. Furthermore, it provides a way to characterize specific fish species preferences for shelters using small-scale data that is typically insufficient to perform statistical tests. By knowing the preferences for a particular species, we can design appropriate shelters for target species, for example to support key species in the region or to support species that are in decline. We may be able to discover additional preference patterns with additional subclasses, such as age or group size. This approach can improve the design of artificial reefs by first installing the small amount of shelters prior to the rest. By identifying the predominant species in the area, profiling their preferences, and making informed decisions about the best design for a given location, AR settings are likely to benefit the fish community and other marine organisms. By using this model, researchers can draw conclusions about their own specific design in their own study site by investing minimal resources while increasing their chances of success.
Acknowledgments
We are grateful for the assistance of Dr. Natalie Chernihovsky, Prof. Roi Holzman, Prof. Gil Rilov, and Prof. Daniel Golani fish identification and in focusing on getting into the minds of the fish. Prof. Rilov was especially helpful In sharing his expertise regarding the study site. We also thank the many individuals who gladly helped with the data collection in the field - Reem Neri, Inbal Kahan, Omer Waizman, Lior Benzer, Ron Jano, Lisa Schmidt, Keren Or Rinkov, Dr. Natalie Chernihovsky, Neil Brosh, Saurav Dutta, Roi Feinstein, Tom Leu, Tomer Ketner, Asa Oren, Dr. Dor Shefy, Clara Seinsche, Almog Ben-Natan, Josey Cory Wright, Kerem Çıtak, Inbal Carmel, and Ian Segal.
Figure 1.
The Katza abandoned oil jetty study site. A) Location Google Earth), B) viewed from the south . C) A sketch depicting the columns of jetty; the columns included in our study are denoted by circles.
Figure 1.
The Katza abandoned oil jetty study site. A) Location Google Earth), B) viewed from the south . C) A sketch depicting the columns of jetty; the columns included in our study are denoted by circles.
Figure 2.
Round artificial shelters (RAS) arrangement on the experimental platforms. A- upper panel): distribution of the different volume RAS - S (small), M (medium), L (large), total of four balconies and four replicates. B -middle panel): clumped versus dispersed distribution, a total of four balconies and four replicates. C- in situ distribution experiment dispersed arrangement. Picture by Boaz Samorai. D: in situ distribution experiment - clumped arrangement. Picture by Boaz Samorai. E: in situ positioning of large, medium, and small sized RAS. Picture by TS.
Figure 3.
Species accumulation curves. Panel A- day surveys of the experiment with different distributions, B - night surveys of the experiment with different distributions, C - day surveys of the experiment with different sizes, D - night surveys of the experiment with different sizes.
Figure 3.
Species accumulation curves. Panel A- day surveys of the experiment with different distributions, B - night surveys of the experiment with different distributions, C - day surveys of the experiment with different sizes, D - night surveys of the experiment with different sizes.
Figure 4.
Changes of Neopomacentrus miryae fish in the shelters at night over 11 months. Note accumulation of both fish and of live coverage on the RAS over time.
Figure 4.
Changes of Neopomacentrus miryae fish in the shelters at night over 11 months. Note accumulation of both fish and of live coverage on the RAS over time.
Figure 5.
A Bodianus anthioides inside a shelter from the spread-out dispersal at night. Note that the fish does not fit entirely in the shelter but still tries to hide inside it with the tail sticking out.
Figure 5.
A Bodianus anthioides inside a shelter from the spread-out dispersal at night. Note that the fish does not fit entirely in the shelter but still tries to hide inside it with the tail sticking out.
Table 1.
Family preferences regarding the size or distribution type of the shelter. “L” stands for large shelters, “M” stands for medium, and “S” for small. “Cl.” stands for clumped dispersal “Sp.” stands for spread out dispersal, and “NA” means that no significant preferences were found or the data were insufficient to perform statistical tests.
| Families |
Pomacentridae |
Serranidae |
Labridae |
Acanthuridae |
Scaridae |
Sizes
preferences |
Day
L>S
M>S |
Night
NA |
Day
NA |
Night
NA |
Day
M>S
M>L |
Night
NA |
Day
NA |
Night
NA |
Day
M>S
|
Night
NA |
Dispersal
preferences |
Day
NA |
Night
Cl. > Sp. |
Day
Cl. > Sp. |
Night
Cl. > Sp. |
Day
NA |
Night
Sp. > Cl. |
Day
Sp. > Cl. |
Night
NA |
Day
NA |
Night
NA |
Table 2.
Dietary group preferences regarding shelter size or distribution. “L” stands for large shelters, “M” for medium, and “S” for small RAS. “Cl.” stands for clumped dispersal “Sp.” stands for spread-out dispersal, “NA” means that no significant preferences were found or the data was insufficient to perform statistical tests.
| Diet |
Planktivore |
Benthivore |
Herbivore |
Piscivore |
Corallivore |
Sizes
preferences |
Day
L>S |
Night
NA |
Day
M>S |
Night
NA |
Day
M>S |
Night
NA |
Day
M>L |
Night
NA
|
Day
NA
|
Night
NA
|
Dispersal
preferences |
Day
NA |
Night
NA |
Day
NA |
Night
Sp. > Cl. |
Day
Sp. > Cl. |
Night
NA |
Day
NA |
Night
NA
|
Day
NA
|
Night
NA
|
Table 3.
Present the predicted preferences for the species Pseudocheilinus hexataenia, corresponding to the preferences found for the species family and dietary group, for both day and night. “L” stands for large shelters, “M” for medium, and “S” for small. “Cl.” stands for clumped dispersal and “Sp.” stands for spread-out dispersal.
Table 4.
Shelter preferences of different species from all surveys conducted for each shelter size (large, medium, small) or dispersal (spread-out, clumped). From left to right, the first column lists the observed species, the second column lists the shelter preferences for each family, the third shows the shelter preferences for the dietary groups, and the last column shows the predicted preferences resulting from the two included categories. The sums of the number of individuals of the same species, counted at each shelter size or dispersal, is in parentheses. The common results of the different classes are highlighted in bold; the partial results of only one of the categories are underlined.
