Preprint
Article

Synergistic Effects of Zeolite-Sewage Sludge Blends and Reduced Nitrogen Doses on Soil Carbon Fractions, Nutrient Index, and Plant Growth of Rice in Controlled Environment

Submitted:

30 November 2023

Posted:

01 December 2023

You are already at the latest version

Abstract
: Alluvial soils naturally possess abundant soil nutrients. Nevertheless, excessive nitrogen addition and inappropriate use of nitrogen fertilizers lead to conditions where soil nutrients become immo-bilized, ultimately reducing productivity. This study investigates the potential of natural nano-material zeolite which is important land resources to improve nutrient utilization efficiency and mitigate the harmful effects of excessive fertilizer application. Specifically, the research ex-plores the incorporation of clinoptilolite zeolite and processed sewage sludge blends, alongside reduced recommended nitrogen fertilizer doses, to evaluate their impact on soil quality and plant growth. A greenhouse experiment was conducted (three-year study), comprising eight treatments with varying proportions of zeolite and sewage sludge. The efficacy of these treatments in en-hancing soil carbon pools, nutrient indices, and plant growth responses was assessed. Results in-dicate that a combination of 50% recommended fertilizer dose, 4-6% zeolite, and 5-10% sewage sludge significantly improved multiple aspects of plant growth, including leaves, tillers, culms, and panicles, leading to increased straw and grain yields. The addition of 6% zeolite in conjunc-tion with sewage sludge positively influenced plant tillering capacity. Certain treatment combina-tions exhibited a greater impact on plant height at different growth stages. For example, the treatment with 75% recommended fertilizer dose, 4% zeolite, and 5% sewage sludge significantly affected plant height at 40 and 55 days after treatment. Additionally, the combination of 50% recommended fertilizer dose, 6% zeolite, and 10% sewage sludge promoted plant height, carbon levels, and various yield parameters in later stages. Principal component analysis effectively dis-tinguished treatments incorporating zeolite and sewage sludge based on plant responses. The combination of 6% zeolite and 10% sewage sludge, along with a 50% recommended fertilizer dose, positively influenced soil carbon fractions, nutrient levels, and the growth response of rice plants.
Keywords: 
Subject: 
Environmental and Earth Sciences  -   Soil Science

1. Introduction

The Green Revolution undoubtedly alleviated the food security concerns of developing nations [1]. However, the intensive use of inorganic fertilizers and extensive cultivation have led to issues such as nutrient immobilization and declining productivity in the soils of these nations [2]. With only 2.4% arable land, Indian agriculture systems face the daunting task of feeding a population of 1.3 billion people, with the demand for food continuously rising[3]. This puts immense pressure on land for cultivation. Therefore, there is an urgent need to assess soil function, particularly regarding nutrient immobilization, while simultaneously meeting the increasing food demand. Among various agricultural commodities, rice holds a year-long tradition and is the largest produced commodity in India. Over the years, rice production has gradually declined, with major causes identified as erratic soil carbon status, improper fertilizer use, pest infestation, and farmer socioeconomic status[4]. In the current scenario, it is crucial to restore soil health through efficient nutrient mineralization and enhance productivity. Recent soil research suggests that amendments with nano-materials improve soil reactions, increase surface area, and enhance nutrient dynamics. Natural nanomaterials like zeolite amplify the reactive surfaces of soil for biogeochemical reactions, enhance soil cation exchange capacity [5], improve nutrient and water retention efficiency[6,7], and exhibit molecular sieving and absorption capabilities. These properties are highly desirable for stabilizing soil nutrient mineralization and function. Additionally, zeolite as a soil amendment enhances plant metabolic activity, reduces nitrogen loss, solubilizes phosphate, and improves soil nutrient release potential [8].
Erratic soil carbon status is considered a significant concern for rice productivity. Sewage sludges, rich in organic matter, ameliorate water holding capacity, contain nitrogen, phosphorus, potassium, and other micronutrients. Thus, applications of sewage sludge improve the physical and chemical properties of soil and significantly enhance biological activities[9]. Various nano-enabled strategies have been proposed to enhance crop production and meet the increasing global demands for food, feed, and fuel while practicing sustainable agriculture[10] . Recent research has demonstrated the role of clinoptilolite zeolite as a soil amendment in enhancing cation exchange capacity and yields[11]. Studies have also shown that clinoptilolite zeolite plays a crucial role in retaining soil nutrients and stabilizing nutrient mineralization[12]. When combined with organic effluents, it improves soil pH, cation exchange capacity, organic carbon, and nutrient availability [13]. The application of clinoptilolite zeolite has a long-term positive impact on enhancing yield [14] and improving the physical, chemical, and biological properties of soil [15].
The synergistic application of sewage sludge organic matter and clinoptilolite zeolite has the potential to stabilize soil nutrient mineralization and may change the soil carbon fractions, thus ensuring the availability of essential nutrients throughout all stages of plant growth. Therefore, the objective of this study was to assess the effects of combining sewage sludge and zeolite on soil health indicators and plant growth parameters in a three year controlled greenhouse environment experiment.

2. Materials and Methods

2.1. Experimental Design

The experiment was conducted during the Kharif seasons of 2017-2018, 2018-2019 and 2019-2020 at a greenhouse located in the agriculture research farm of the Department of Agronomy, Lovely Professional University, Phagwara, India. A Complete Randomized Design (CRD) was employed, with rice variety PR126 grown in pots as the experimental units. The study consisted of eight different treatments, each replicated three times and three year pooled data has been used for interpretation. The treatments used were as follows:- T0- Control (No Fertilizers); T1-RDF100 (100% Recommended Dose of Fertilizer); T2- RDF100+Z4+SS5 (100% Recommended Dose of Fertilizer + 4% Zeolite + 5% Sewage Sludge); T3- RDF100+Z6+SS10 (100% Recommended Dose of Fertilizer + 6% Zeolite + 10% Sewage Sludge); T4- RDF75+Z4+SS5 (75% Recommended Dose of Fertilizer + 4% Zeolite + 5% Sewage Sludge); T5- RDF75+Z6+SS10 (75% Recommended Dose of Fertilizer + 6% Zeolite + 10% Sewage Sludge); T6- RDF50+Z4+SS5 (50% Recommended Dose of Fertilizer + 4% Zeolite + 5% Sewage Sludge); T7- RDF50+Z6+SS10 (50% Recommended Dose of Fertilizer + 6% Zeolite + 10% Sewage Sludge).
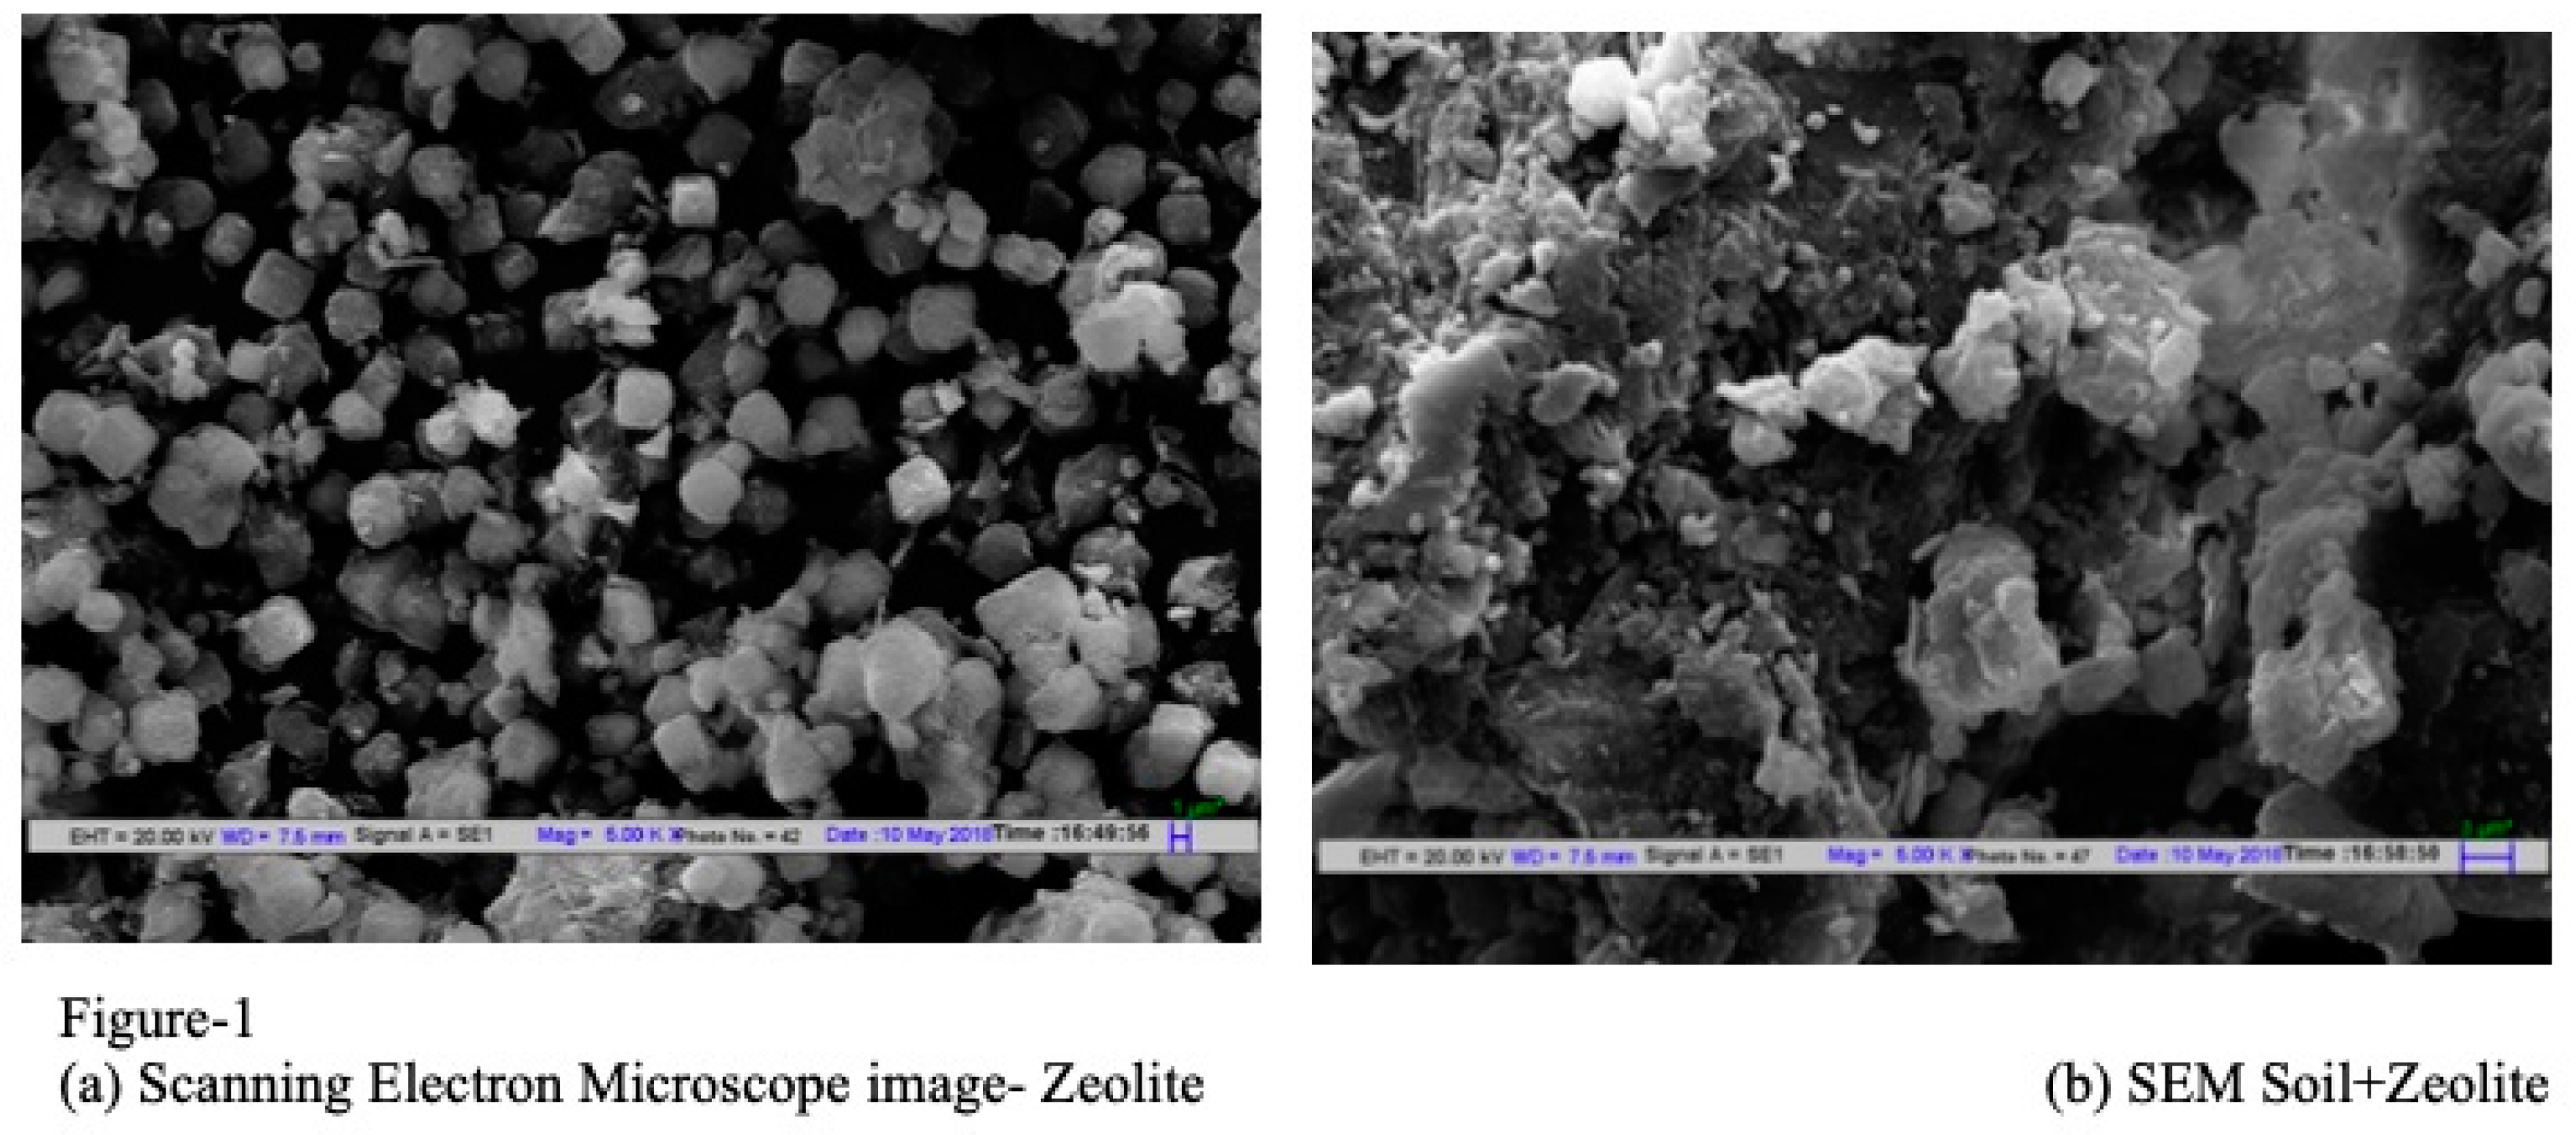
Alluvial soil (Sandy Loam Soil) was collected from the agricultural farm of Lovely Professional University in Punjab, India (31.25° N, 75.70° E). The top 25 cm of soil was used for the pot experiment. Soil samples were collected from randomly selected points in each pot at different time intervals: 25, 40, 55, 70, and 85 days after transplanting 25-day-old rice saplings. The collected soil samples were air-dried, sieved, and analyzed. Electron microscopic images were also captured for the creation of zeolite-soil matrix studies (Figure 1).

2.2. Soil Analysis

The determination of soil organic carbon was carried out using the Walkley-Black chromic acid wet oxidation method, as described by Allison et al [16]. In this method, 1g of soil was weighed and mixed with 10 ml of 0.1667M K2Cr2O7 solution and 20 ml of concentrated H2SO4. The unreduced dichromate was then back-titrated with 0.5M FeSO4 solution. Soil microbial biomass carbon (Cmic) was determined following the procedure outlined by Vance et al; [17]. This involved the extraction of organic carbon (C) from fumigated and unfumigated soils using K2Cr2O7. For this, 20g of soil was subjected to fumigation and unfumigation conditions. The soil was then extracted with 75ml of 0.5M K2Cr2O7 in a 250 ml flask, and the organic C in the extract was measured using dichromate digestion. The amount of labile carbon present in the soil was determined according to the method given by Blair et al [18]. This involved taking 2.0g of soil in a centrifuge tube and oxidizing it with 25 ml of 333 mM KMnO4 solution by shaking it on a mechanical shaker for 1 hour. The concentration of KMnO4 was measured at a wavelength of 565 nm using a spectrophotometer, and the change in concentration was used to estimate the amount of carbon oxidized. Soil available nitrogen was determined following the Subbiah and Asija [19] method. In this method, 10g of air-dried soil was mixed with 100 ml each of 0.32% KMnO4 and 2.5% NaOH solutions in a Kjeldahl's flask. The distillate collected was titrated with 0.02M NaOH solution to a colorless endpoint after adding 25 ml of 0.01M H2SO4 and a few drops of methyl red indicator. Soil-available phosphorus was determined using the Olsen method [20]. A 2.5g sample of soil was weighed into a 250ml shaking bottle and mixed with a pinch of phosphorus-free activated charcoal and 50 ml of extractant solution (0.5M sodium bicarbonate, pH 8.5). A mixture of 5ml of soil extract and 5ml of 1.5% ammonium molybdate was then prepared, and the intensity of the blue color was measured spectrophotometrically at 660nm. The available potassium in the soil was determined according to the method described by Toth and Prince [21]. In this method, 25ml of 1M ammonium acetate solution at pH 7.0 was added to a 5g soil sample, and the potassium content in the filtrate was measured using a flame photometer. Micronutrients such as zinc (Zn), copper (Cu), iron (Fe), and manganese (Mn) were estimated using the atomic absorption spectrophotometer method. Soil extracts were prepared using diethylenetriaminepentaacetic acid (DTPA). For this, 10g of soil and 20ml of the DTPA extraction solution were mixed, and the resulting filtrate was used for analysis, following the procedure outlined by Vocasek and Friedericks [22].

2.3. Plant Analysis

The measurements of plant height and tiller numbers were taken at specific intervals after transplanting, specifically at 25, 40, 55, 70, and 85 days. Plant height was determined by measuring the distance from the base to the tip of the highest leaf, while tillers were individually counted to determine the number of tillers per plant. The number of leaves per plant was also counted at the same intervals. The stem girth was measured using a Vernier caliper meter at 25, 40, 55, 70, and 85 days after transplanting. The stem girth measurement involved measuring the diameter of the basal portion of the whole plant. Additionally, the length of the culm was measured from the soil surface to the base node of the panicle, and the panicle length was measured from the base node to the end of the panicle. These measurements were taken at the same intervals. At 80 and 100 days after transplanting, the panicle length and number of panicles were recorded. The number of seeds per panicle was counted at 85 and 100 days after transplanting. Grain weight was determined by weighing the grains per pot for each treatment at the time of harvest. The straw yield of each pot was also recorded separately at the time of harvest, which was conducted 20 days after reaching 85 days after transplanting.

2.4. Statistical Analysis

The collected data was analyzed using standard procedures in SPSS 22. Duncan's Multiple Range Test (DMRT) was conducted to determine the significance level, with a threshold of P<0.05. Different letters were used to indicate significant differences or separations of means in all tables and graphs.To assess the correlation between plant and soil parameters, Pearson Correlation analysis was performed. The software utilized for principal component analysis was Past 4.0 [23].

3. Results and Discussion

The control pot exhibited a soil organic carbon (SOC) content of 0.42%, indicating a marginal or poor status of nutrient mineralization. However, treatments incorporating zeolite and sewage sludge resulted in a significant increase in SOC. At 25 days after transplanting (DAT), treatment T6 showed an SOC of 0.83% (Table 1), while treatment RDF50+Z6+SS10 displayed 0.85% SOC. The highest and significant SOC values were observed in treatment RDF50+Z4+SS5 (0.87) and RDF50+Z6+SS10 (0.91) at 40 DAT. Zeolite plays a role in enhancing soil surface area, which facilitates the release of organic carbon. Studies conducted by Aminiyan et al [24] also demonstrated that the application of zeolite in combination with certain plant residues efficiently enhances carbon pools.
To investigate soil carbon pools, labile carbon was determined at different intervals in the pot soils (Table 2). At 25 DAT, treatment RDF50+Z6+SS10 exhibited significantly higher labile carbon content (1.27 mg/kg). At 40 DAT, treatment RDF75+Z6+SS10 recorded higher labile carbon values (1.4 mg/kg), while at 55 DAT, RDF50+Z6+SS10 showed the highest labile carbon values (1.39 mg/kg), followed by RDF75+Z6+SS10 (1.33 mg/kg) and RDF50+Z4+SS5 (1.30 mg/kg). At 70 DAT, labile carbon was again found to be higher in treatment RDF50+Z6+SS10 (1.48 mg/ kg), followed by RDF50+Z4+SS5 (1.38 mg/kg). Zeolite-treated pots exhibited a 156% improvement in labile carbon compared to pots treated with the recommended dose of fertilizer alone, indicating the nutrient and carbon retention properties of zeolite. The application of sewage sludge in combination with microporous nanomaterials like zeolite enhanced the soil's reactive surface area and consequently increased labile carbon levels. Long-term studies [25] have shown significantly higher carbon management levels in soils treated with sewage sludge. Soil organic carbon levels were significantly correlated with soil labile carbon, highlighting the precise role of zeolite in amplifying soil reaction rates. The enhancement of surface area improves soil microbial functions and protects soil organic matter, leading to a greater accumulation of labile carbon [12]. Treatment RDF50+Z4+SS5 and RDF50+Z6+SS10 exhibited significantly higher microbial biomass carbon compared to the other treatments (Table 3). The microbial biomass carbon was positively correlated with soil organic carbon and labile carbon, indicating that the combination of clinoptilolite zeolite and sewage sludge enhances microbial population and, consequently, microbial biomass carbon. A study conducted by Aminiyan and Akhgar [26] yielded similar findings, demonstrating the positive impact of zeolite on the soil carbon fractions through the promotion of microbial growth.

3.1.

The initial available nitrogen content in the soil was 0.098 g/kg, which significantly increased after soil treatment. At 25 DAT, treatment RDF50+Z6+SS10 displayed significantly higher available nitrogen values (0.30 g/kg), and similar trends were observed at 40 DAT (Table 4). The period between 25 and 40 DAT was crucial, as it coincided with the peak activity of plant roots, which absorb nitrogen for vegetative growth. At 55 DAT, treatment RDF75+Z6+SS10 exhibited significantly higher available nitrogen values (0.23) compared to the other treatments. Treatments RDF50+Z4+SS5 and RDF50+Z6+SS10 showed a tendency to enhance soil available nitrogen, particularly during the early stages of crop growth, and later stabilized nutrient mobilization. This could be attributed to the efficient nutrient absorption and reduced leaching characteristics of zeolite. Studies have shown that zeolite, when combined with organic manures, prevents ammonia leaching by providing a structural matrix-like framework, thereby improving soil nutrient retention [27]. The initial available phosphorus content, which is crucial for plant functions, was recorded at 0.015 g/kg. Treatment RDF75+Z6+SS10 consistently showed higher significant values of available phosphorus throughout the cultivation period (Table 5). This suggests that zeolite, along with organic matter, creates a reactive matrix that efficiently holds and stabilizes available nutrients, even at higher concentrations of mineral fertilizers. According to research by Omogbohu and Akinkunmi [28], an appropriate concentration of phosphorus is required to satisfy soil sorption sites, enabling phosphorus to be made available to plants. Zeolite-like nanomaterials provide the framework to hold such crucial soil nutrients throughout cultivation [8]. Soil-available potassium, another crucial element for plant biochemical reactions, was initially reported at 0.075 g/gm and significantly increased among the treatments at later stages (25 DAT). Treatment RDF50+Z6+SS10 exhibited significantly higher available potash values.
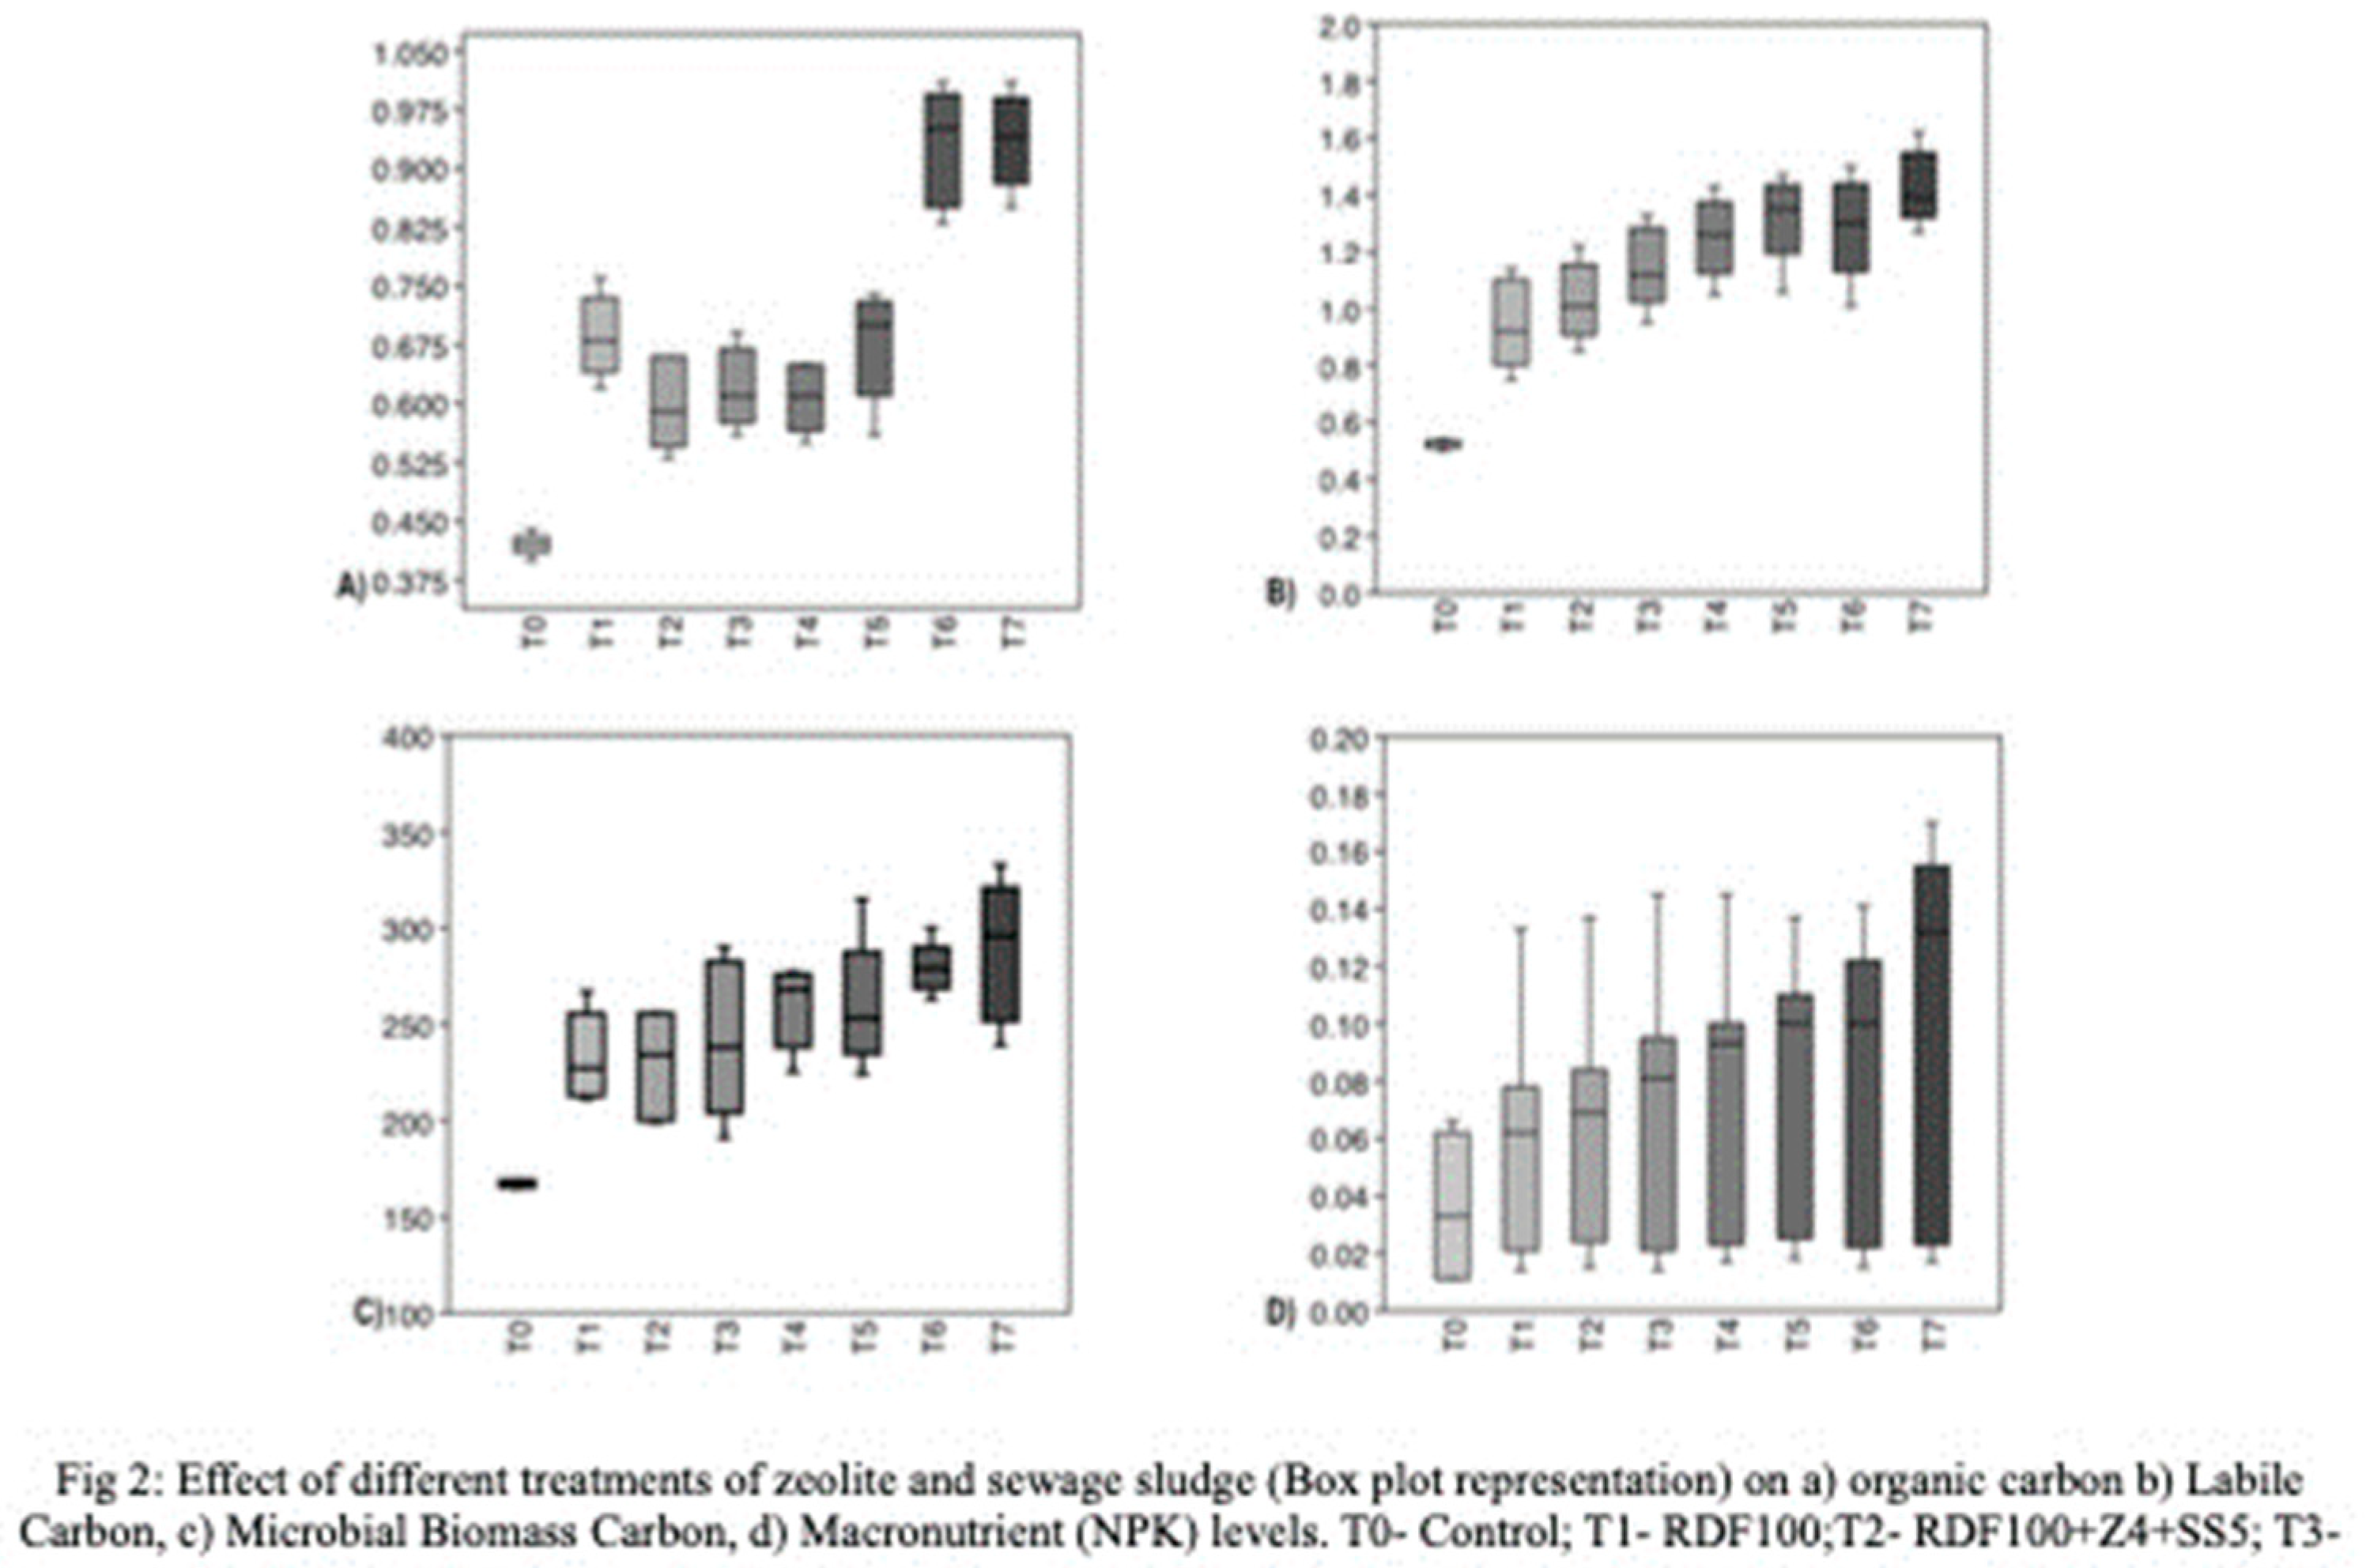
The utilization of zeolite has a tendency to improve the availability of potassium in the soil [29] due to its slow nutrient release characteristics and increased surface area for oxidation (Table 6). Treatment RDF50+Z6+SS10, despite receiving only 50% of the recommended fertilizer dose, benefits from the organic carbon provided by sewage sludge and the enhanced soil reactions facilitated by zeolite, leading to more stable nutrient mineralization and availability [8]. To compare soil carbon with soil available macronutrients (NPK), box plots were constructed using data from soil carbon pools and macronutrient measurements taken at 25, 40, 55, 70, and 85 DAT (Figure 2). It is evident that treatments RDF50+Z4+SS5 and RDF50+Z6+SS10, which received 50% RDF, 4-6% zeolite, and 5-10% sewage sludge, significantly influenced soil carbon pools (SOM, LB, MBC). The levels of soil carbon also have an impact on the availability of soil macronutrients (NPK).
The box plots depicting macronutrients (NPK) demonstrate that the soil treated solely with mineral fertilizer exhibits substantial variation in nutrient availability throughout the cultivation period. However, treatments incorporating a higher percentage of zeolite and sewage sludge ensure nutrient availability and stability during the cultivation period.
Treatment RDF50+Z6+SS10 exhibited significantly higher levels of Zinc (0.0046 g/kg). The concentration of soil iron during the initial stages was measured at 0.0072 g/kg, and later on, significantly higher levels were observed in treatment T6 (Data not shown). The incorporation of zeolite and sewage sludge in the treatments improved the concentration of copper and manganese in the soil. Zeolite, with its enhanced cation exchange properties, facilitated the mobilization of micronutrients in the soil, thereby increasing their concentration [30]. Additionally, the use of organic matter such as sewage sludge may contribute to the stabilization of the ability to absorb positively charged ions. Principal component analysis of soil micronutrients segregated the treatments into two groups: those with combinations of zeolite and sewage sludge (RDF 100 +Z 6 +SS 10, RDF 75 +Z 6 +SS 10, RDF 50 +Z 4 +SS 5, and RDF50+Z6+SS10), and those without zeolite and sewage sludge (Control and RDF100). This further confirms the role of zeolite in retaining micronutrients in the soil. The count of leaves per plant was conducted at 25, 40, 55, 70, and 85 days after transplanting. The treatment RDF100 exhibited the maximum number of leaves, with 65 recorded, indicating that the addition of zeolite and sewage sludge enhances soil nitrate availability, leading to an increase in leaf numbers [31]. At 40 days after transplanting, the leaf count was significantly higher in treatment RDF50+Z6+SS10, suggesting a proportional reduction in RDF combined with the use of nanomaterials that enhance soil nutrient availability [32]. The incorporation of zeolite, RDF, and sewage sludge in all treatments at 40 days after transplanting resulted in a 137% higher leaf count compared to the control. Such an increase in leaf number is crucial during the vegetative growth stage of plants[33]. The number of tillers indicates the efficiency of plant nutrient uptake, and the observations from the experiment revealed that the number of tillers was significantly higher in treatment RDF50+Z6+SS10, with a count of 18.33 at 25 days after transplanting. Similar trends were observed at 40 and 85 days after transplanting. At 55 days after transplanting, treatment T7 exhibited the highest number of tillers (35.33), followed by RDF50+Z4+SS5 (32). The results at 70 and 85 days after transplanting also showed significantly higher numbers of tillers in the pots treated with RDF50+Z6+SS10, with values of 36.66 and 38, respectively. All pots treated with zeolite and sewage sludge demonstrated a positive impact compared to treatments without fertilizer or only RDF without zeolite and sewage sludge.
At 25 days after transplanting (DAT), the plant height was significantly higher in treatment RDF75+Z6+SS10 (56.33) and RDF100+Z4+SS5 (56.75). However, in later stages of growth, the plant height was significantly higher in treatment RDF50+Z6+SS10, possibly due to the slow nutrient release activity of sewage sludge, which stabilizes the nutrient flow during the later stages of plant growth. Another study by Rabai et al [34] also suggests that zeolite amendments improve plant height in later stages. The culm length was significantly higher in treatment RDF100+Z4+SS5 (18.67) and lowest in the control (12.37). At 40 days after transplanting, the culm length was significantly higher in treatment RDF50+Z6+SS10 (21.04), probably due to the impact of sewage sludge and RDF provided during the earlier stages of plant growth. The highest significant value for culm length was found in treatment RDF50+Z4+SS5 (23.33) at 55 DAT and 70 DAT (28.66). After 25 DAT, there was no significant growth in culm length for the next two crop stages; however, after 70 DAT, the culm length steeply increased.
This study highlights the role of organic matter in stabilizing the soil nutrient flow and enhancing culm length during the later stages of cultivation. At the initial stages of crop growth, leaf length was high in treatment RDF100+Z4+SS5, RDF75+Z6+SS10, and RDF50+Z6+SS10 (25 DAT); however, at later stages, treatment RDF75+Z6+SS10 consistently showed higher positive impacts and enhanced leaf length. The vegetation growth period (40 and 50 DAT) of the crop was most crucial in determining yield. In the control pot, leaf length was significantly lower (43.7 and 48.4 cm) respectively. Leaf length was comparatively good in RDF75+Z6+SS10 at 25, 40, and 50 DAT. There was not much difference between the highest two treatments (RDF100+Z4+SS5 and RDF50+Z6+SS10) compared to treatment RDF75+Z6+SS10 (Data not shown). The reason why RDF75+Z6+SS10 showed the maximum significantly higher values may be attributed to the absorption of nutrients by the zeolite in earlier stages and their release at later stages for the plant. Zeolite application promotes leaf area and overall plant height [35]. Stem girth was recorded significantly higher in treatment RDF50+Z6+SS10, measuring 49.06 mm at 25 DAT, compared to the control, which had significantly lower values. It is evident that an increased number of tillers enhance stem girth and nutrient availability. Zeolite mediates continuous nutrient availability and improves stem girth [36].
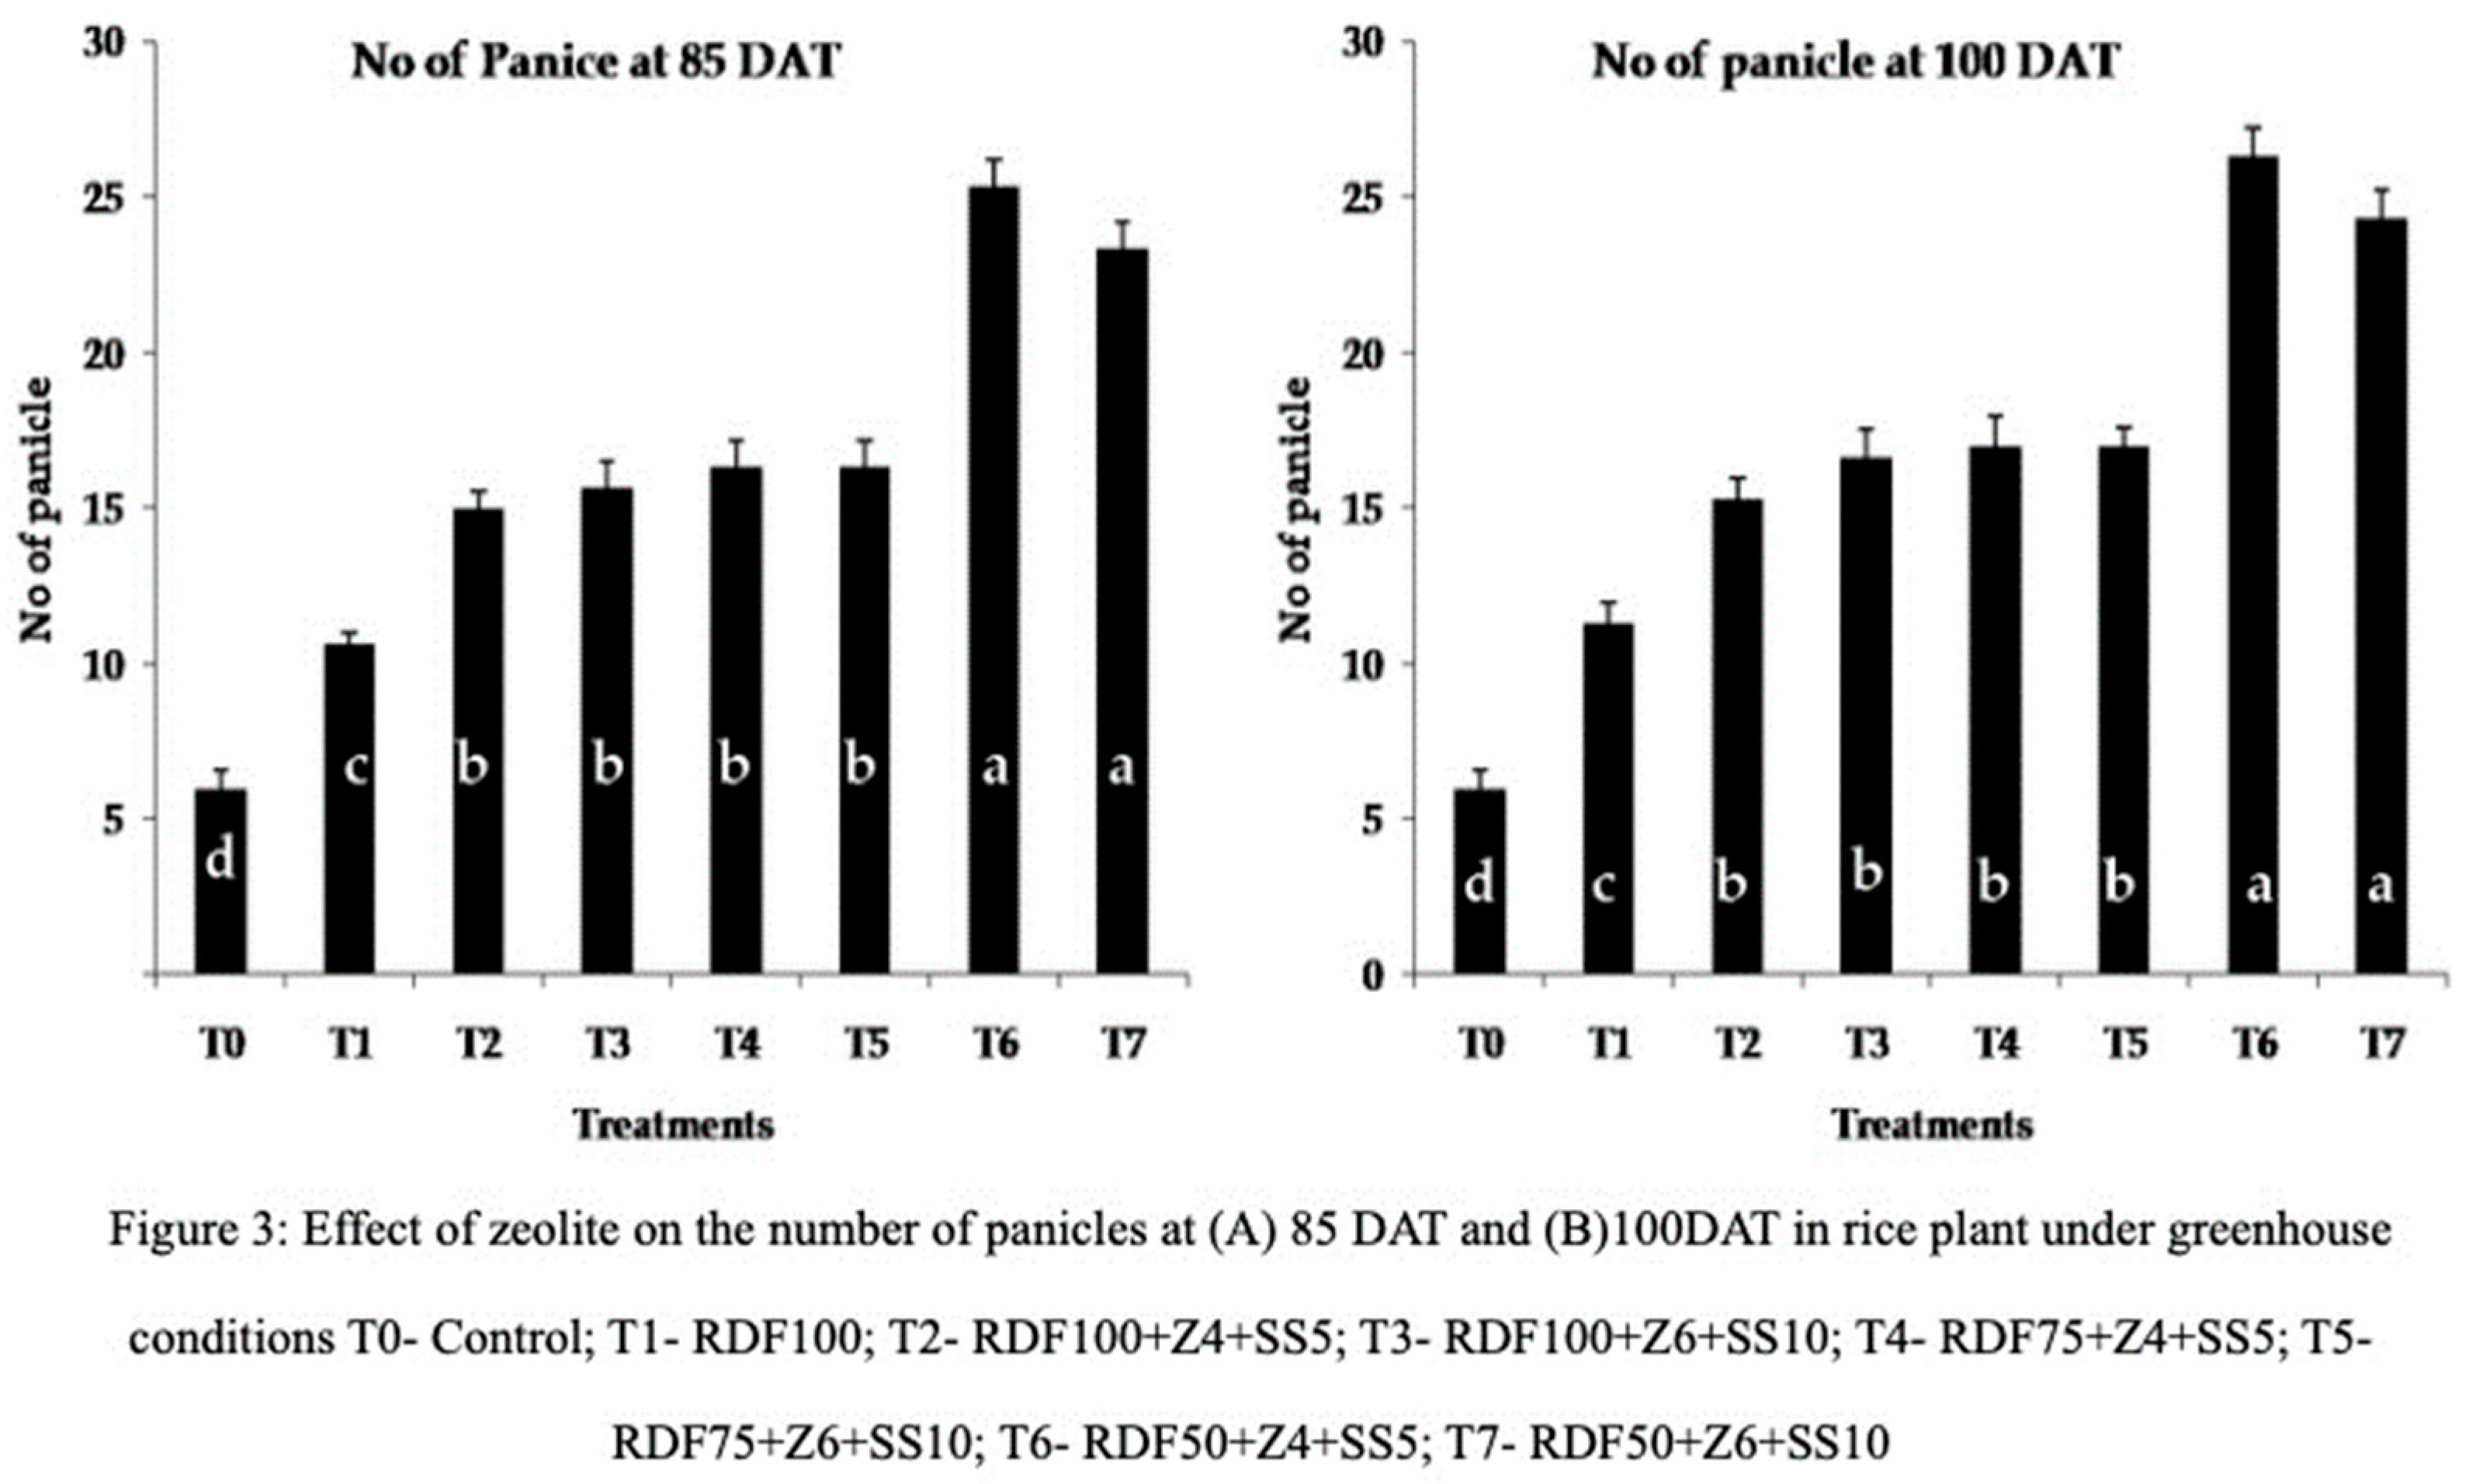
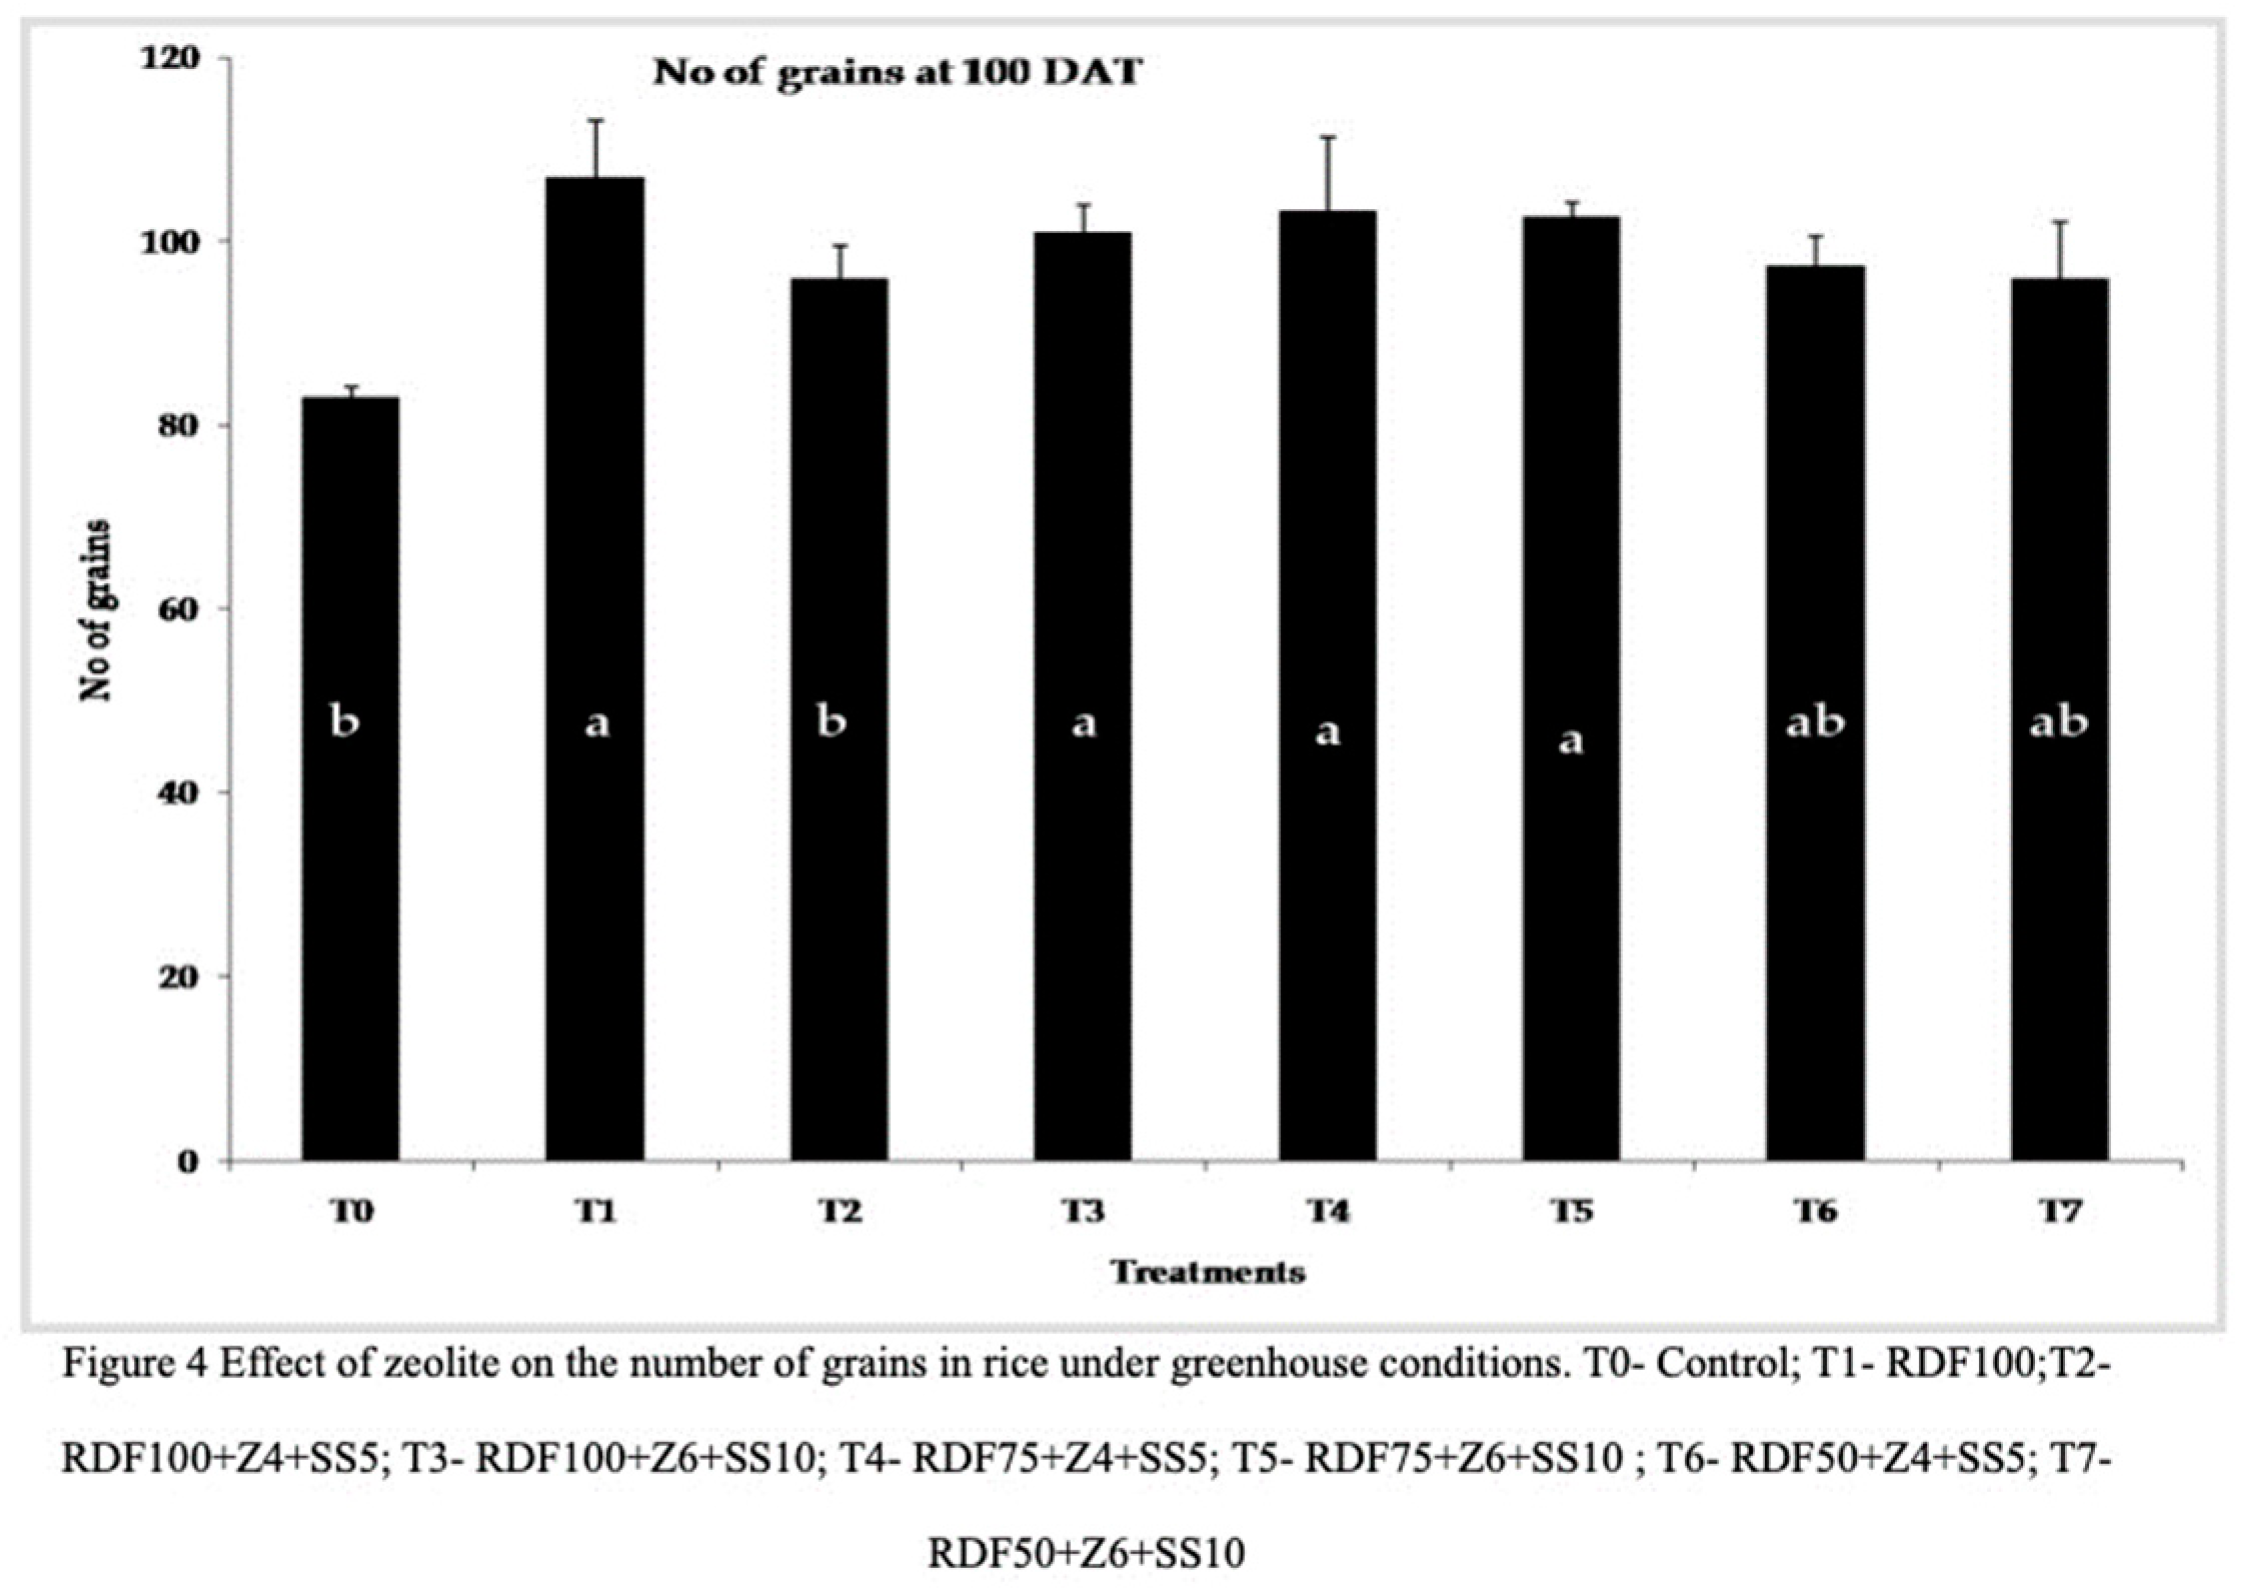
The count of panicles, which represents a fraction of yield, was conducted at 85 and 100 days after transplanting (DAT). The highest numbers of panicles were observed in treatment RDF50+Z4+SS5 (25.33 and 26.33) and treatment RDF50+Z6+SS10 (25.33 and 24.33) at 85 and 100 DAT, respectively (Figure 3). These results indicate that both RDF50+Z4+SS5 and RDF50+Z6+SS10 had a significant impact on panicle development. In both treatments, the recommended dose of fertilizer was reduced while additional zeolite and sewage sludge were provided, which may have enhanced soil nutrient mineralization. Zheng et al [37] explained the role of zeolite in promoting the number of panicles and overall rice yield. Treatment RDF100+Z6+SS10 (101), RDF75+Z4+SS5 (103.33), and RDF75+Z6+SS10 (102.66) significantly influenced the number of grains at 100 DAT, while the control treatment (83) and RDF100+Z4+SS5 (96) had the lowest effect. Zeolite and sewage sludge amended pots showed an average increase of fourteen percent compared to the control treatment and RDF100 (Figure 4). The application of zeolite may contribute to the controlled release of nutrients throughout the various stages of crop growth, thereby enhancing yield parameters [38].
Treatment RDF50+Z6+SS10 (330.33) exhibited the highest grain yield, followed by RDF50+Z4+SS5 (309.5). The increase in the number of panicles positively influenced the grain yield (Figure 5). The zeolite-treated pot showed a significantly higher grain yield compared to the control, which aligns with the findings of Zheng et al. [37]. According to Sepaskhah and Barzegar [39], the application of nitrogen with zeolite facilitated the slow release of fertilizer, leading to improved rice crop yield. The straw yield in the zeolite-treated pot was 103 percent higher, indicating that the application of zeolite along with sewage sludge enhanced plant biomass and dry weight. Previous research by Aainaa et al [36] supports the positive impact of zeolite application on yield parameters, and incorporating organic matter may provide a standardized approach for further investigation of the precise impact of nano-materials.
There is a significant correlation between soil nutrients, organic carbon, labile carbon, microbial biomass carbon, and plant growth and yield parameters (Table 7). Total organic carbon exhibited a significant correlation with available nitrogen (0.76**), available phosphorus (0.60**), and available potassium (0.64**). Similarly, labile carbon showed a significant impact on available nitrogen (0.527**), available phosphorus (0.78**), and available potassium (0.81**). The organic carbon fraction displayed a strong correlation with leaf number (0.6**), tiller number (0.71**), plant height (0.8*), clum length (0.51*), and stem girth (0.76**). Soil carbon fractions (labile carbon, organic carbon, and microbial biomass carbon) exhibited a strong correlation with growth and yield parameters, indicating that the use of nanomaterials may improve rice growth and yield. Bybordi and Ebrahimian [40] suggested that zeolite application significantly affected macronutrients (NPK) and micronutrients such as Zn and Fe. Long-term experiments conducted by Brock et al [41] demonstrated a positive correlation between soil organic matter and yield in organic farming, with potential variations in correlations under conventional farming systems.
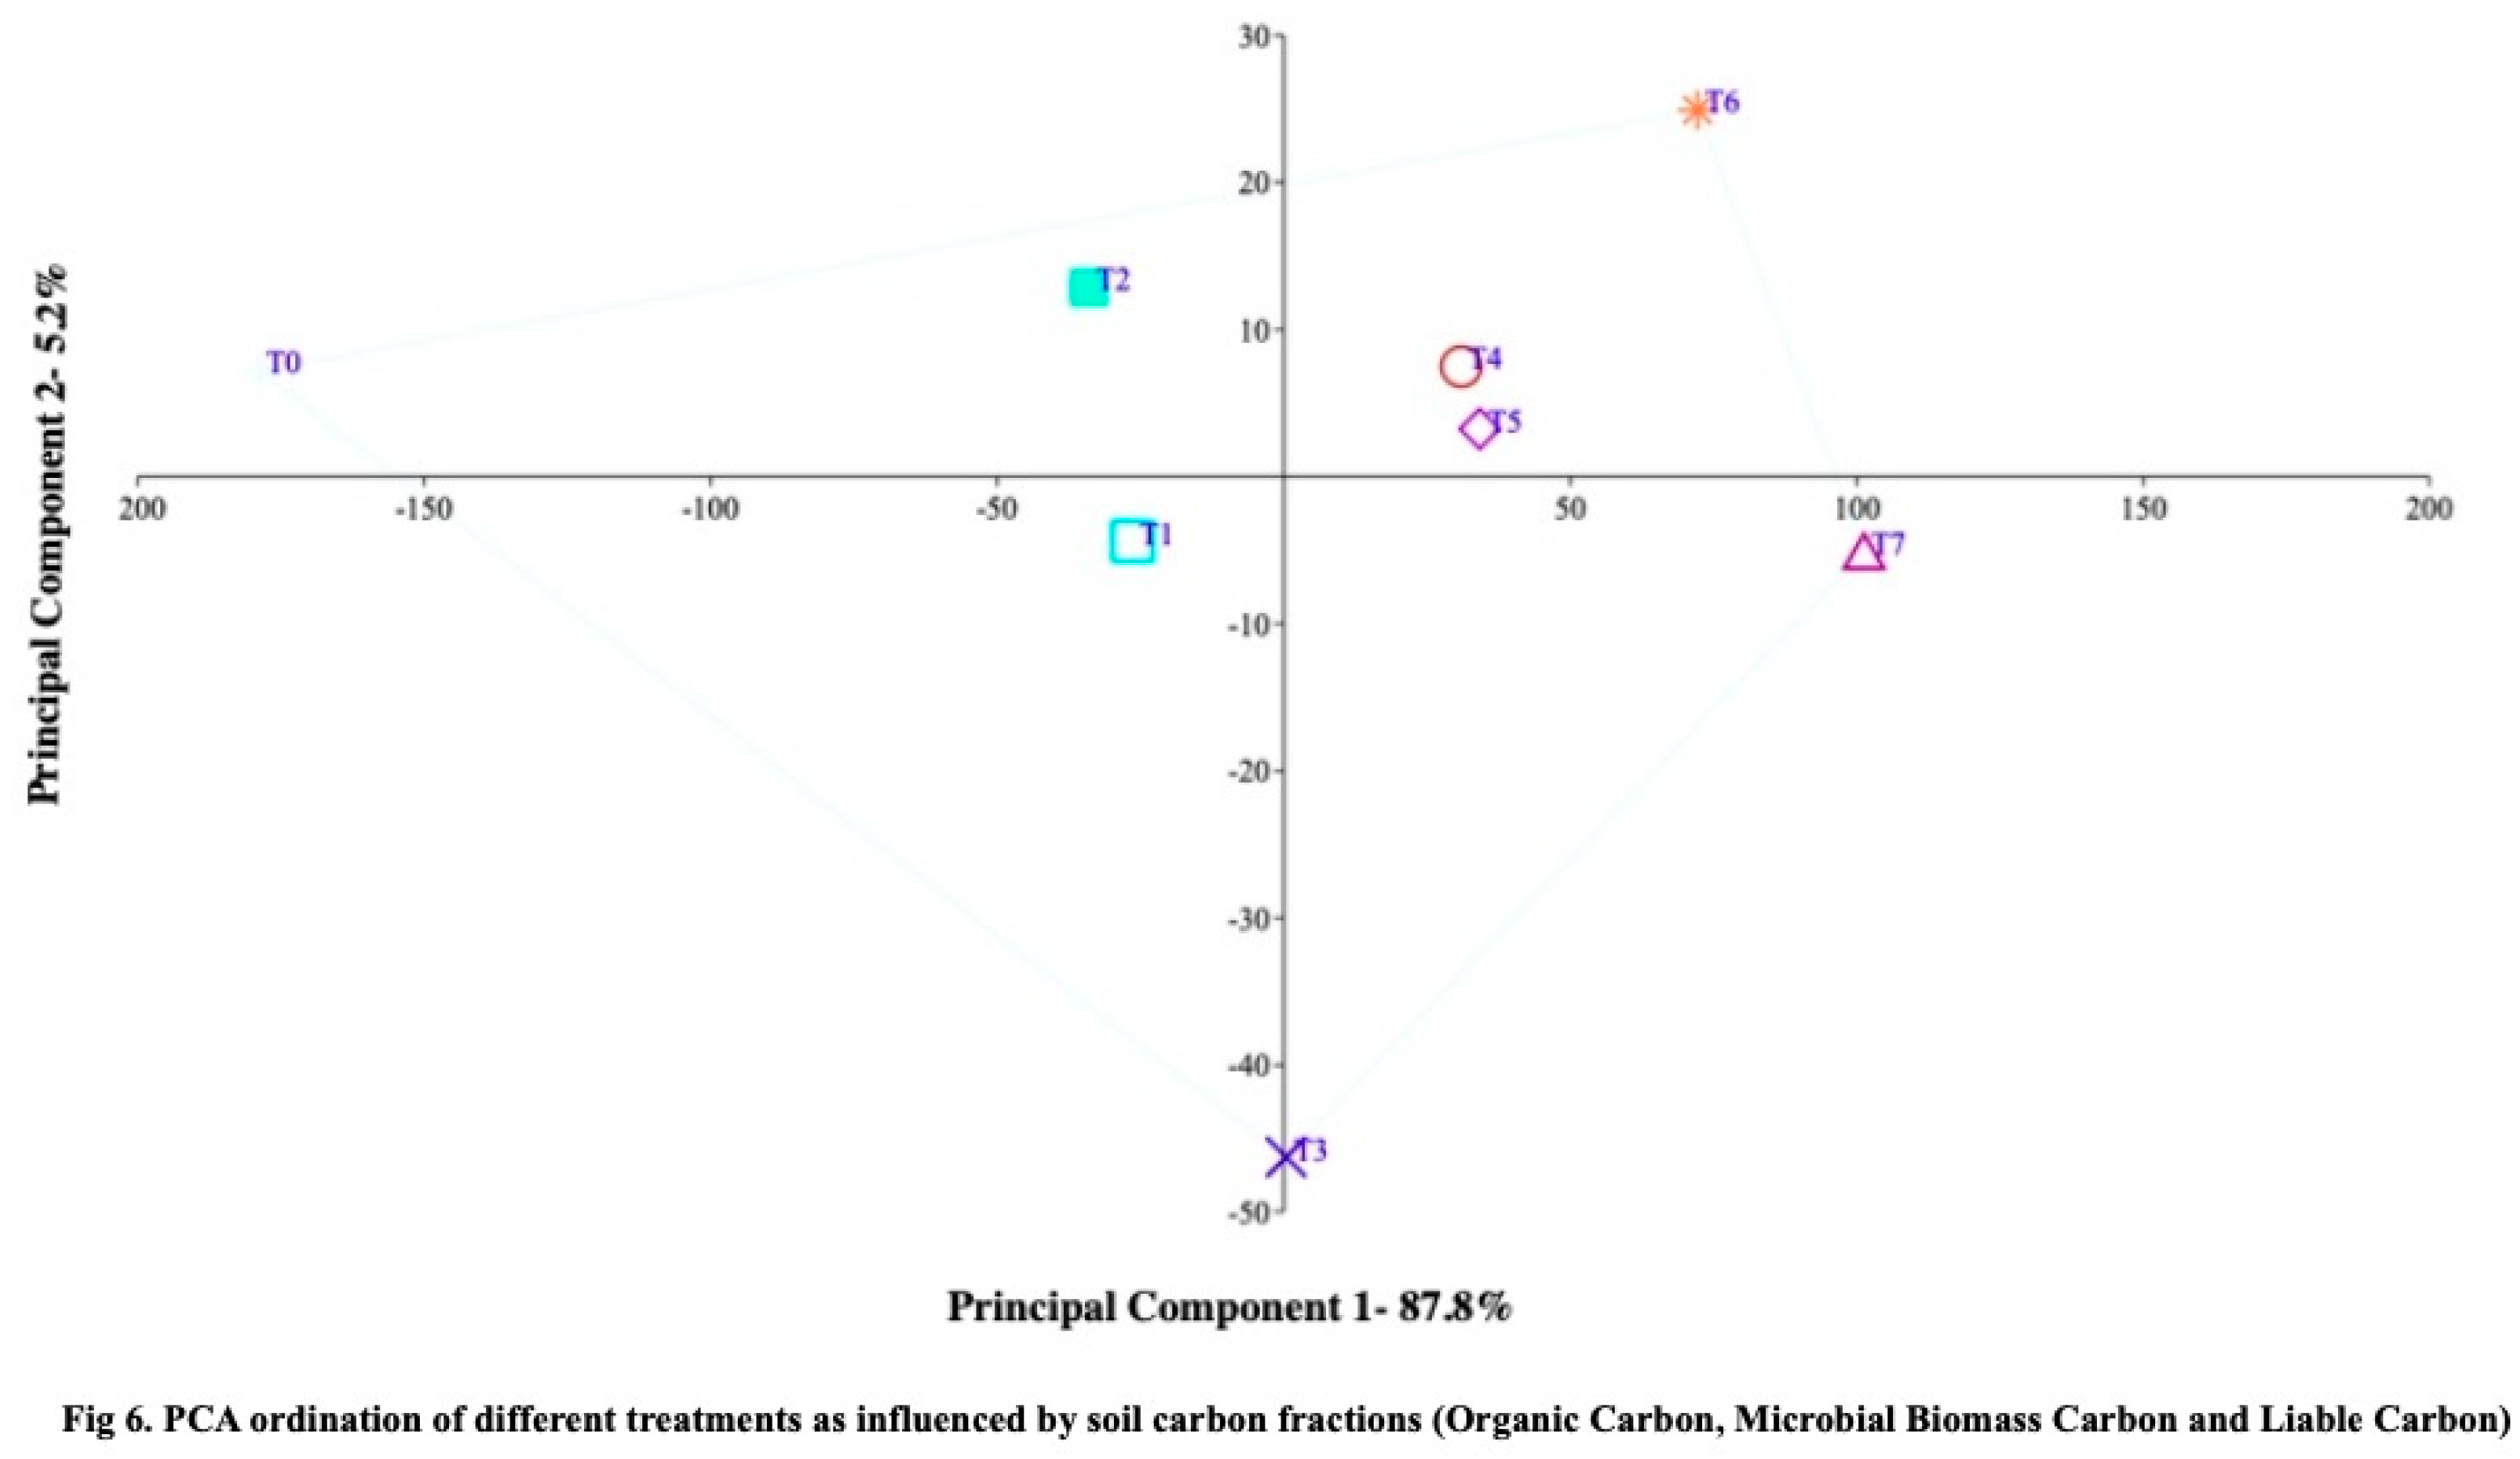
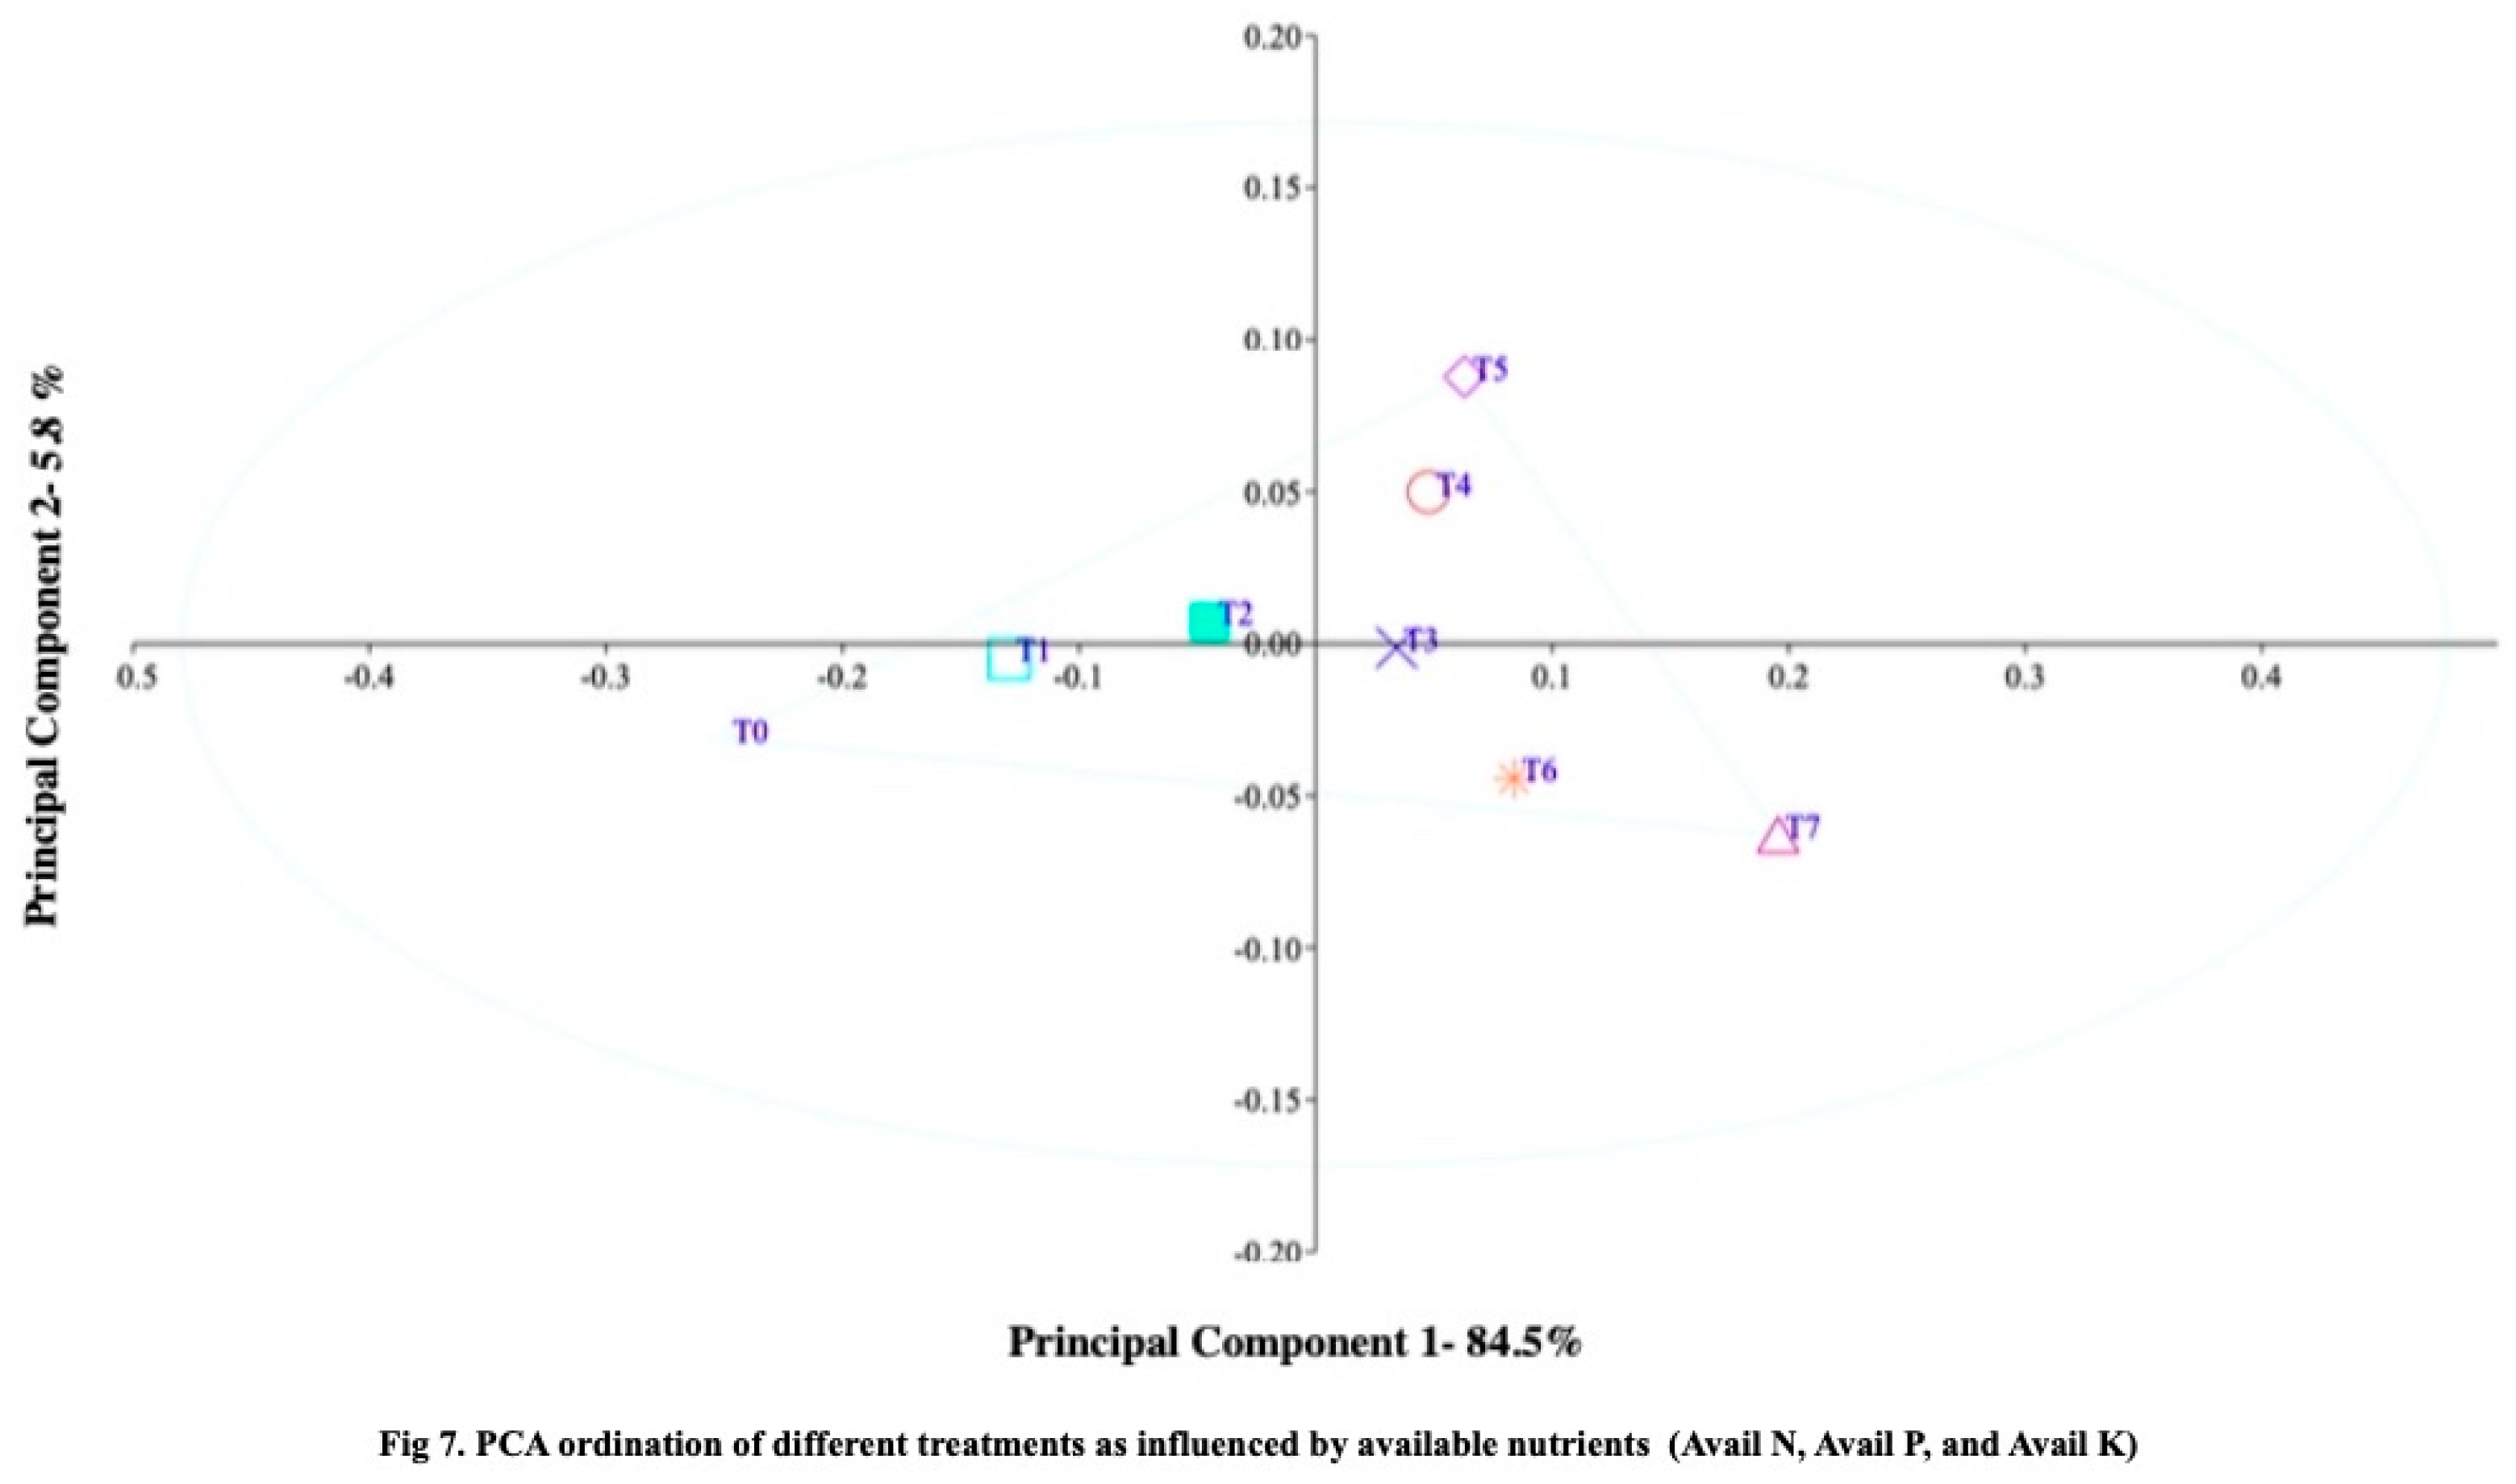
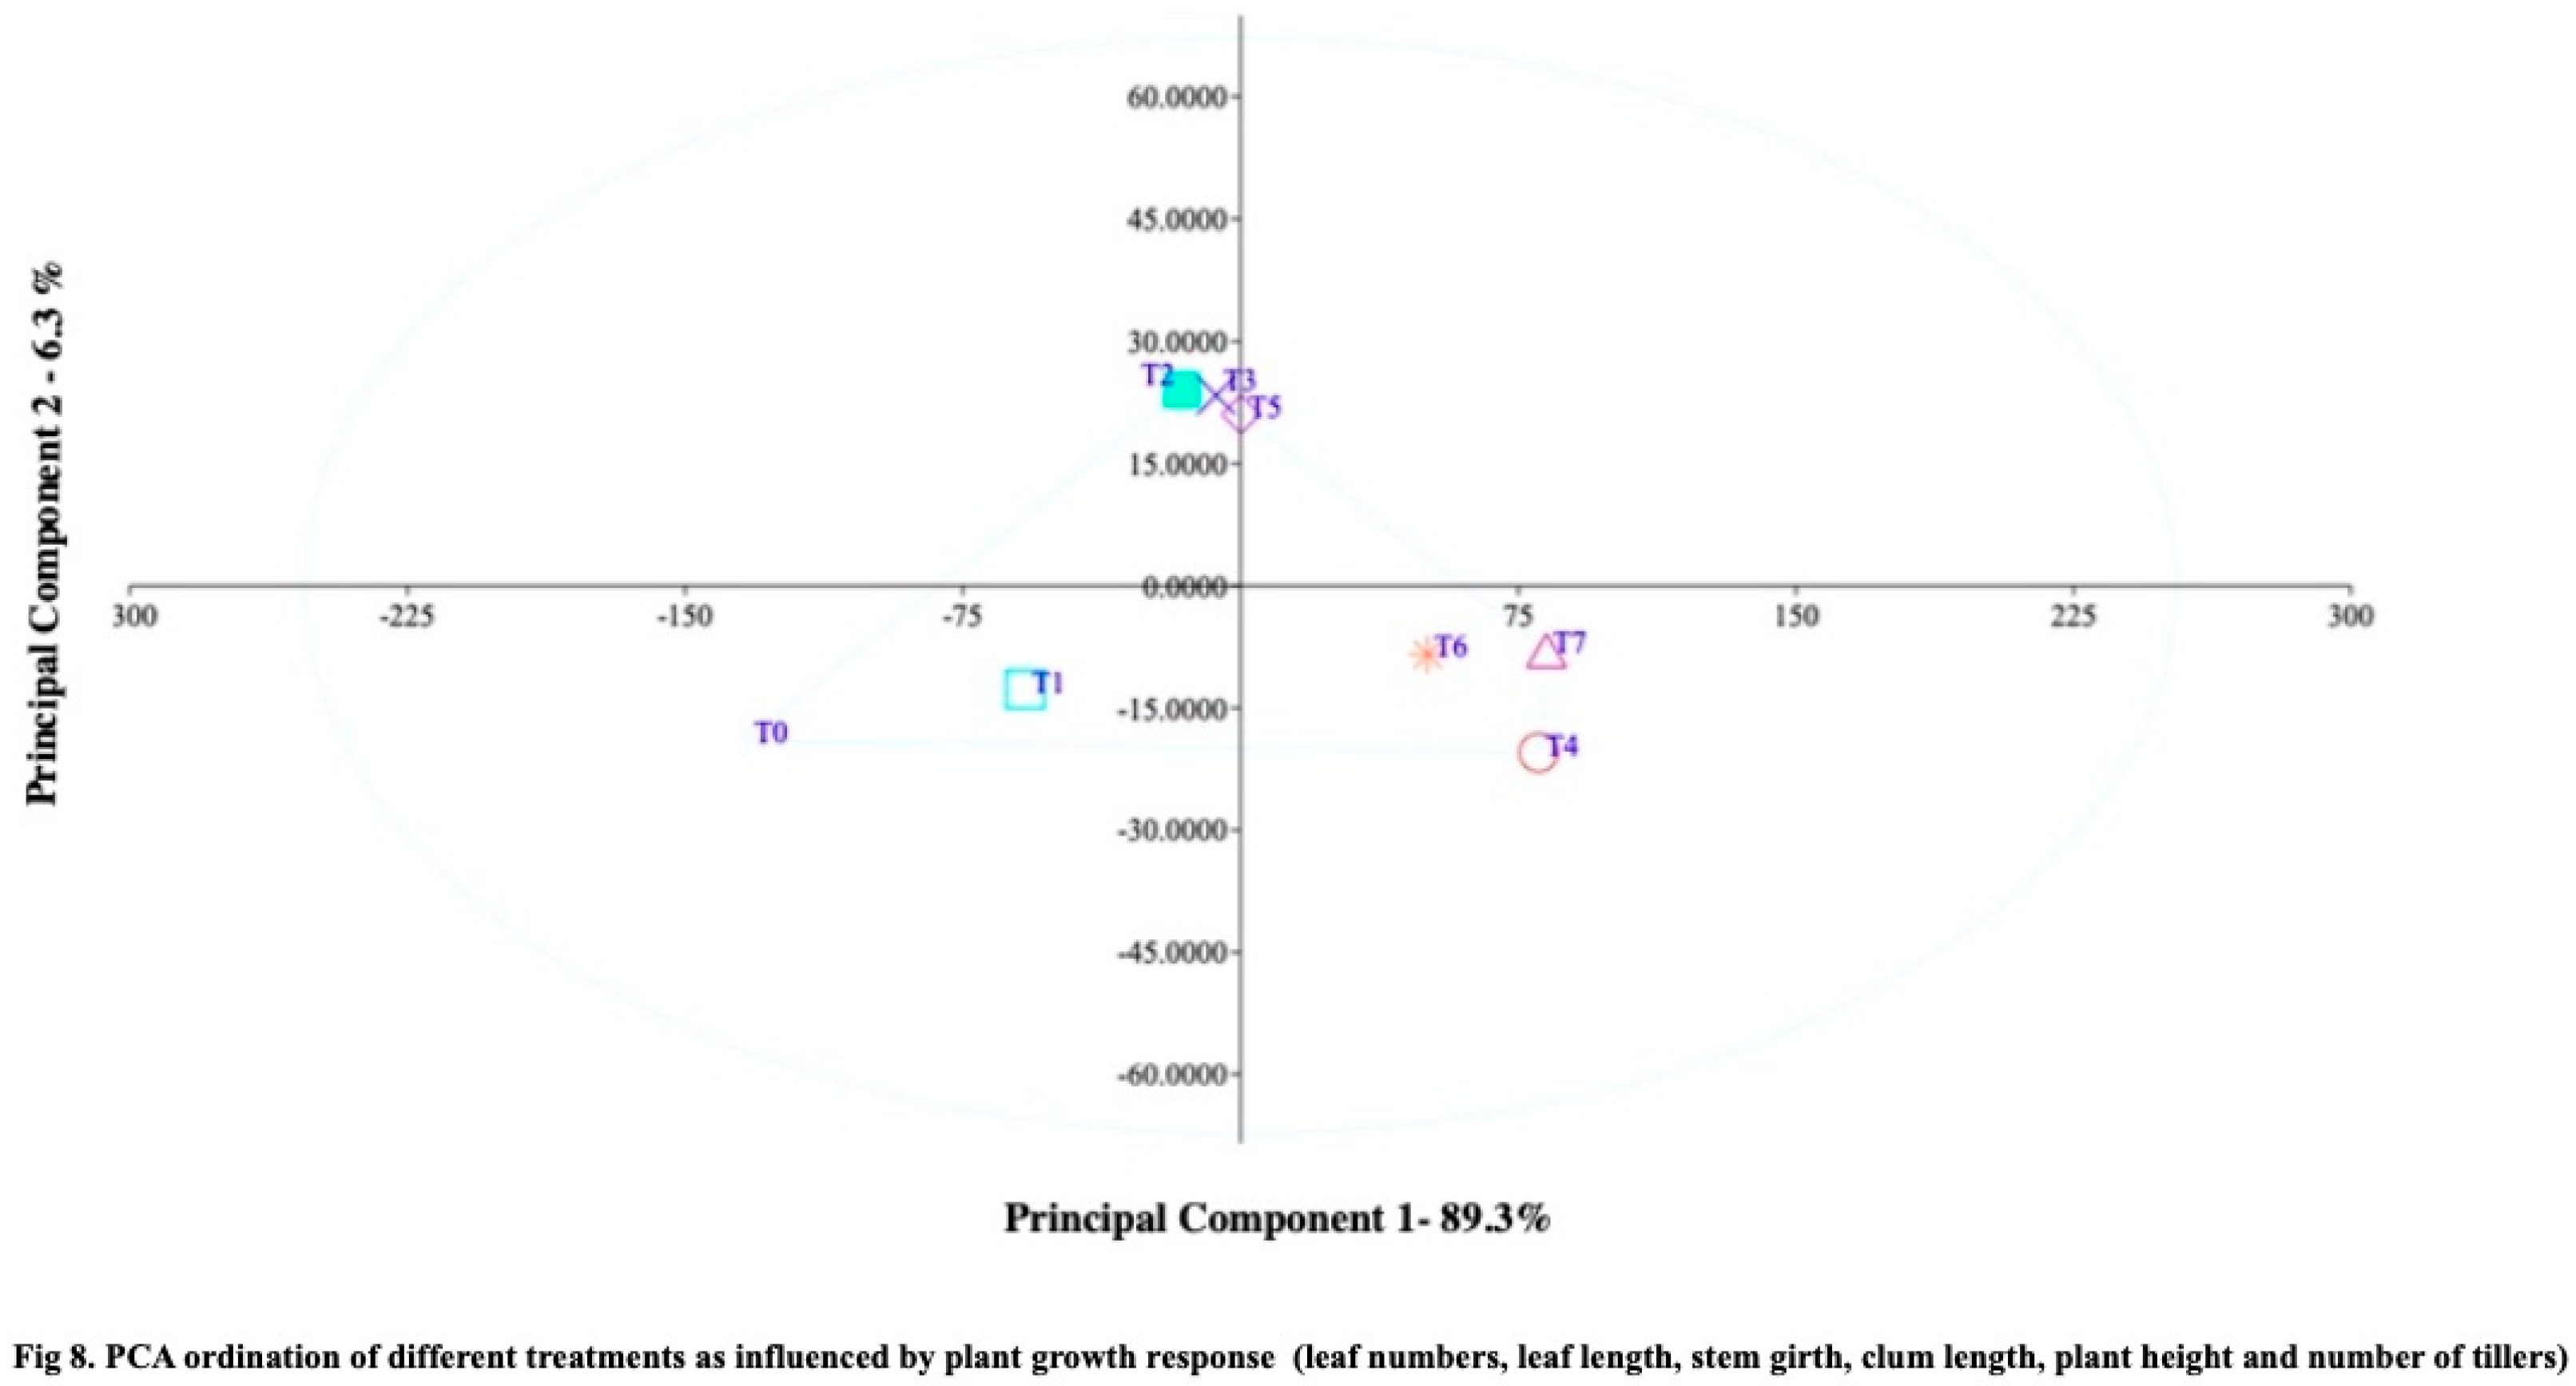
Principal component analysis (PCA) has been commonly employed as a multivariate method for classifying treatments, as demonstrated in a study by Ullah et al [42]. In a recent investigation conducted by Sachin and Isler [43], PCA was utilized to classify the differences in zinc and iron treatments and their effects on soybean yield components. The results of the research study demonstrate that treatment T7-RDF50+Z6+SS10 exhibited higher values for soil carbon fractions (organic carbon, microbial biomass carbon, and liable carbon) compared to the other treatments (Figure 6), indicating that zeolite application may enhance soil carbon stability during the cultivation period. The principal component ordination analysis of major macronutrients (available nitrogen, phosphorus, and potassium) in the soil showed significantly higher values for treatment T7-RDF50+Z6+SS10, suggesting that zeolite application may also improve soil nutrient availability (Figure 7). The Principal Component Analysis (PCA) plot of plant growth response revealed significant differences among the treatments, with Treatment T0 showing more negative scores and Treatment RDF50+Z6+SS10 exhibiting higher positive scores. The Principal Component Analysis (PCA) plot effectively differentiated the treatments based on the variations observed in growth and yield data. Principal component 1, representing the plant growth response, accounted for a substantial 89.3% of the overall variation (Figure 8), highlighting significant distinctions among the treatments. Specifically, the Control and RDF100 treatments stood apart from the other treatments. By comparing the PCA scores of PC1 and PC2, it was evident that treatment T0 exhibited predominantly negative scores, while treatment RDF50+Z6+SS10 demonstrated notably higher positive scores.
Moreover, treatments RDF100+Z4+SS5, RDF100+Z6+SS10, and RDF75+Z6+SS10 clustered together, while treatments RDF75+Z4+SS5, RDF50+Z4+SS5, and RDF50+Z6+SS10 also formed a distinct cluster, exhibiting enhanced positive values of plant growth response. The findings of this study validate the effectiveness of Principal Component Analysis (PCA) in assessing and establishing relationships among treatments, particularly in the context of nano-material soil applications. PCA proves to be an efficient tool for evaluating the impact and effectiveness of nano materials in relation to soil parameters and rice yield. Based on the findings of the present study, it can be concluded that the application of zeolite at a concentration of 6% and sewage sludge at a concentration of 10%, along with a 50% recommended dose of fertilizer, elicit positive responses in rice plant growth. Additionally, the use of zeolite at 4% and sewage sludge at 5% of the recommended dose of fertilizer also results in improved plant growth.
The study highlights the significant role of soil carbon fractions, namely labile carbon, soil organic carbon, and microbial biomass carbon, in influencing the growth and yield characteristics of rice plants. Changes in soil carbon fractions have a direct impact on plant growth, indicating that the utilization of nano-materials in soil has the potential to enhance soil carbon fractions and contribute to more sustainable utilization of natural resources. However, further research focusing on soil molecular studies is necessary to gain a deeper understanding of the changes in soil microbial ecology resulting from the application of zeolite and sewage sludge.
Supplementary Materials

The following supporting information can be downloaded at the website of this paper posted on Preprints.org.

Author Contributions

Author contributions in the research paper were as follows: Conceptualization was done by J.T., A.K.K., S.K.S., and B.S.B. Methodology was developed by J.T., B.S.B, and A.K.K. Investigation was carried out by J.T. and A.K.K. Formal analysis was performed by S.K.S., V.K.S. and A.K.K. Data curation was managed by J.J. Software based statistical analysis was done by J.J., J.T., V.K.S. and O.S. Supervision was provided by S.K.S. and A.K.K. The original draft was prepared by A.K.K, J.T., B.S.B and V.K.S. Validation was conducted by S.K.S. Writing review and editing were done by A.K., S.K.S., B.S.B., V.K.S. and O.S. Funding acquisition was coordinated by S.K.S. All authors have reviewed and approved the published version of the manuscript.

Funding

Researchers Supporting Project number (RSP2024R118), King Saud University.

Data Availability Statement

All data generated or analyzed during this study are included in the paper.

Acknowledgments

The first author is highly thankful to Lovely Professional University, Phagwara, Punjab, India for providing Research Fellow Scholarship and support for this research. The authors would like to thank Researchers Supporting Project number (RSP2024R118), King Saud University, Riyadh, Saudi Arabia.

Conflicts of Interest

The authors declare no conflict of interest

References

  1. Pingali, P. L. Green Revolution: Impacts, Limits, and the Path Ahead. Proc. Natl. Acad. Sci. USA 2012, 109, 12302-12308. [CrossRef]
  2. Nelson, A. E.; Ravichandran, K.; Antony, U. The Impact of the Green Revolution on Indigenous Crops of India. J. Ethn. Foods 2019, 6, 1-10. [CrossRef]
  3. Hinz, R.; Sulser, T. B.; Hüfner, R.; Mason-D’Croz, D.; Dunston, S.; Nautiyal, S.; Schaldach, R. Agricultural Development and Land Use Change in India: A Scenario Analysis of Trade-offs Between UN Sustainable Development Goals (SDGs). Earth's Future 2020, 8(2), e2019EF001287. [CrossRef]
  4. Balasubramanian, V.; Bell, M.; Sombilla, M. Yield, Profit, and Knowledge Gaps in Rice Farming: Causes and Development of Mitigation Measures. In Bridging the Rice Yield Gap in the Asia-Pacific Region 2000, 163.
  5. Bhattacharyya, T.; Chandran, P.; Ray, S. K.; Pal, D. K.; Mandal, C.; Mandal, D. K. Distribution of Zeolitic Soils in India. Curr. Sci. 2015, 1305-1313.
  6. Jarosz, R.; Szerement, J.; Gondek, K.; Mierzwa-Hersztek, M. The Use of Zeolites as an Addition to Fertilisers–A Review. Catena 2022, 213, 106125. [CrossRef]
  7. Nakhli, S. A. A.; Delkash, M.; Bakhshayesh, B. E.; Kazemian, H. Application of Zeolites for Sustainable Agriculture: A Review on Water and Nutrient Retention. Water, Air, & Soil Pollut. 2017, 228, 1-34. [CrossRef]
  8. Leggo, P. J. An Investigation of Plant Growth in an Organo-Zeolitic Substrate and Its Ecological Significance. Plant Soil 2000, 219(1-2), 135-146. [CrossRef]
  9. Hudcová, H.; Vymazal, J.; Rozkošný, M. Present Restrictions of Sewage Sludge Application in Agriculture Within the European Union. Soil Water Res. 2019, 14(2), 104-120. [CrossRef]
  10. Kah, M.; Tufenkji, N.; White, J. C. Nano-Enabled Strategies to Enhance Crop Nutrition and Protection. Nat. Nanotechnol. 2019, 14(6), 532-540. [CrossRef]
  11. Kavvadias, V.; Ioannou, Z.; Katsaris, P.; Kardimaki, A.; Vavoulidou, E.; Theocharopoulos, S. Use of Zeolites in Agriculture: Effect of Addition of Natural Zeolite-Clinoptilolite and Compost on Soil Properties and Crop Development. In Soil Amendments for Sustainability; CRC Press, 2018; pp 201-212.
  12. Mondal, M.; Biswas, B.; Garai, S.; Sarkar, S.; Banerjee, H.; Brahmachari, K.; Hossain, A. Zeolites Enhance Soil Health, Crop Productivity and Environmental Safety. Agronomy 2021, 11(3), 448. [CrossRef]
  13. Zaidun, S. W.; Jalloh, M. B.; Awang, A.; Sam, L. M.; Besar, N. A.; Musta, B.; Latifah, O. M. Biochar and Clinoptilolite Zeolite on Selected Chemical Properties of Soil Cultivated with Maize (Zea mays L.). Eur. J. Soil Sci. 2019, 8(1), 1-10. [CrossRef]
  14. Gevrek, M. N.; Tatar, O.; Yağmur, B.; Özaydın, S. The Effects of Clinoptilolite Application on Growth and Nutrient Ions Content in Rice Grain. Turk. J. Field Crops 2009, 14(2), 79-88.
  15. Girijaveni, V.; Reddy, K. S.; Sharma, K. L.; Moulika, G. Zeolites Are Emerging Soil Amendments for Improving Soil Physical and Chemical Properties in Agriculture: A Review. Int. J. Agric. Environ. Biotechnol. 2018, 11(6), 841-849. [CrossRef]
  16. Allison, L. E.; Bollen, W. B.; Moodie, C. D. Total Carbon. In Methods of Soil Analysis: Part 2 Chem. Microbiol. Prop., Vol. 9; pp 1346-1366.
  17. Vance, E. D.; Brookes, P. C.; Jenkinson, D. S. An Extraction Method for Measuring Soil Microbial Biomass C. Soil Biol. Biochem. 1987, 19(6), 703-707. [CrossRef]
  18. Blair, G. J.; Lefroy, R. D.; Lisle, L. Soil Carbon Fractions Based on Their Degree of Oxidation, and the Development of a Carbon Management Index for Agricultural Systems. Aust. J. Agric. Res. 1995, 46(7), 1459. [CrossRef]
  19. Subbiah, B. V.; Asija, G. L. A Rapid Method for the Estimation of Nitrogen in Soil. Curr. Sci. 1956, 26, 259-260.
  20. Olsen, S. R. Estimation of Available Phosphorus in Soils by Extraction with Sodium Bicarbonate (No. 939). US Department of Agriculture, 1954.
  21. Toth, S. J.; Prince, A. L. Estimation of Cation-Exchange Capacity and Exchangeable Ca, K, and Na Contents of Soils by Flame Photometer Techniques. Soil Sci. 1949, 67(6), 439-446. [CrossRef]
  22. Vocasek, F. F.; Friedericks, J. B. Soil Micronutrient Extraction by Mehlich-3 Compared to CaCl2-DTPA. Commun. Soil Sci. Plant Anal. 1994, 25(9-10), 1583-1593. [CrossRef]
  23. Hammer, O.; Harper, D. A. T.; Ryan, P. D. PAST: Paleontological Statistical Software Package for Education and Data Analysis. Paleontol. Electron. 2001, 4, 9.
  24. Aminiyan, M.; Akhgar, A. The Effect of Zeolite and Plant Residues on Soil Microbial Characteristics-Incubation Study. Agric. Adv. 2014, 3(6), 6-12.
  25. Kalisz, B.; GÅ‚adyszewska, B. Influence of Clinoptilolite on Nitrate Accumulation in Lettuce (Lactuca sativa L.). Fresenius Environ. Bull. 2017, 26(3), 1488-1492.
  26. Aminiyan, M.; Akhgar, A. Impact of Organic and Inorganic Amendments on Soil Microbial Activity under Drought Stress. J. Water Environ. Nanotechnol. 2015, 1(4), 323-331.
  27. Kavoosi, M. Effect of Clinoptilolite on Growth and Quality of Forage Maize and Its Impact on Zeolite Ion Composition. J. Plant Nutr. 2007, 30(11-13), 1947-1962.
  28. Omogbohu, K. O.; Akinkunmi, E. O. Zeolite and Phosphorus Interaction: Effects on Maize (Zea mays L.) Growth and Phosphorus Use Efficiency in a Tropical Alfisol. Am. J. Plant Sci. 2012, 3(03), 371.
  29. Abdi, D.; Afyuni, M.; Khoshgoftarmanesh, A. H.; Schulin, R. The Effect of Zeolite and Iron-enriched Zeolite on Iron and Nutrient Uptake by Barley (Hordeum vulgare L.) in a Calcareous Soil. Aust. J. Soil Res. 2008, 46(8), 665-672.
  30. Ozbahce, A.; Filik, G.; Sert, S.; SaÄŸlam, M. Investigation of the Effect of Clinoptilolite on Growth and Nutrient Element Uptake of Tomato Seedlings. Eurasian J. Soil Sci. 2015, 4(1), 42-47.
  31. Li, H. Y. Application of Clinoptilolite to Agriculture and Sustainable Environment Development in China. Microporous Mesoporous Mater. 2003, 61(1-3), 181-193.
  32. Ramesh, K.; Reddy, T. Y.; Prakash, N. B. Ameliorative Effect of Clinoptilolite on Growth, Yield, and Quality of Tomato (Lycopersicon esculentum Mill.) Grown in Saline Soil. Commun. Soil Sci. Plant Anal. 2010, 41(7), 873-887.
  33. Bybordi, A.; Ebrahiman, A. Investigation on Effects of Soil, Water and Foliar Application of Zeolite on Water Use Efficiency, Growth and Yield of Canola (Brassica napus L.) in Iran. Acta Agric. Slovenica 2013, 101(2), 241-251.
  34. Rabai, H.; Ebrahimi, F. Effect of Zeolite on Soil Physical Properties and Nutrient Availability in a Calcareous Soil. Int. J. Agric. Sci. Res. Technol. Extension Educ. Syst. 2018, 8(1), 83-96.
  35. Khan, M. A.; Li, S. S.; Zhang, Z. Y. The Research of Clinoptilolite on the Growth of Chlorella vulgaris. J. Wuhan Bot. Res. 2008, 26(3), 277-281.
  36. Aainaa, F. I. A.; Mohd Hanif, A. M.; Anuar, A. R. The Effect of Zeolite on Nitrogen Leaching and Nitrate Accumulation in Soilless Culture System. Middle-East J. Sci. Res. 2014, 21(9), 1470-1474.
  37. Zheng, Z.; Zhang, Y.; Chao, Y. The Impact of Modified Natural Zeolite on Growth of Maize (Zea mays L.) in Sandy Soil. IOP Conf. Ser. Earth Environ. Sci. 2015, 28(1), 012041.
  38. Polat, E.; Karaca, A.; Gökçe, Z. N.; Çolak, M. Effect of Zeolite on Yield and Nutrient Uptake of Lettuce (Lactuca sativa L.) Grown in a Greenhouse. Plant Soil 2004, 265(1-2), 363-372.
  39. Sepaskhah, A. R.; Barzegar, M. Evaluation of Zeolite and Polyacrylamide for Amelioration of Soil and Water Conservation in Irrigated Maize. J. Irrig. Drain. Eng. 2018, 144(1), 04017072.
  40. Bybordi, A.; Ebrahimian, A. The Study of Nitrate Leaching Reduction and Yield Increase of Canola (Brassica napus L.) Using Different Levels of Zeolite and Nitrogen. Environ. 2008, 28(3), 292-298.
  41. Brock, T. C. M.; Arts, G. H. P.; Maltby, L.; Van den Brink, P. J.; Gatesoupe, F. J. Aquatic Risks of Plant Protection Products in the Regulatory Context. SETAC Press 2006.
  42. Ullah, M. A.; Harper, D. M.; Vanni, M. J. Does the Quality of Resource Inputs Influence the Strength and Nature of Allochthonous Subsidies between Habitats? Freshw. Biol. 2013, 58(2), 300-311.
  43. Sachin, N.; Isler, H. O. Kinetics and Equilibrium Studies of the Removal of Basic Dye from Aqueous Solution by Low-cost Adsorbent: Application of Response Surface Methodology. Water, Air, Soil Pollut. 2015, 226(8), 243.
Preprints 91894 g001
Preprints 91894 g002
Preprints 91894 g003
Preprints 91894 g004
Preprints 91894 g006
Preprints 91894 g007
Preprints 91894 g008
Table 1. Soil Organic Carbon (%) as affected by Zeolite-Sewage Sludge applications during critical stages of rice growth.
Treatments 25DAT 40DAT 55DAT 70DAT 85DAT
Control 0.40d 0.42d 0.42d 0.44d 0.42e
RDF100 0.62b 0.66b 0.68b 0.71b 0.76b
RDF100+Z4+SS5 0.53c 0.56c 0.59c 0.66c 0.66d
RDF100+Z6+SS10 0.56c 0.59c 0.61c 0.65c 0.69cd
RDF75+Z4+SS5 0.55c 0.58c 0.61c 0.65c 0.65d
RDF75+Z6+SS10 0.56c 0.66b 0.70b 0.72b 0.74bc
RDF50+Z4+SS5 0.83a 0.87a 0.95a 0.98a 1.01a
RDF50+Z6+SS10 0.85a 0.91a 0.94a 0.97a 1.01a
Table 2. Labile Carbon (mg kg-1) as affected by Zeolite-Sewage Sludge applications during critical stages of rice growth.
Treatments 25DAT 40DAT 55DAT 70DAT 85DAT
Control 0.50e 0.53e 0.52e 0.53e 0.54e
RDF100 0.75d 0.85d 0.92d 1.07d 1.14d
RDF100+Z4+SS5 0.85cd 0.96d 1.01d 1.09d 1.22d
RDF100+Z6+SS10 0.95bc 1.12c 1.1c 1.24c 1.33c
RDF75+Z4+SS5 1.05b 1.20c 1.26bc 1.32bc 1.43bc
RDF75+Z6+SS10 1.06b 1.4a 1.33ab 1.35bc 1.47b
RDF50+Z4+SS5 1.01b 1.25bc 1.30abc 1.38ab 1.50b
RDF50+Z6+SS10 1.27a 1.37ab 1.39a 1.48a 1.62a
Table 3. Microbial biomass carbon (mg C kg-1) in soil as affected by Zeolite-Sewage Sludge applications during critical stages of rice growth.
Treatments 25DAT 40DAT 55DAT 70DAT 85DAT
Control 169h 169h 166h 168g 165h
RDF100 214e 211g 227f 244e 267f
RDF100+Z4+SS5 201f 199g 256d 234f 255g
RDF100+Z6+SS10 191g 238d 217g 275c 290d
RDF75+Z4+SS5 225d 251c 268c 275c 277e
RDF75+Z6+SS10 253b 224e 245e 260d 315b
RDF50+Z4+SS5 263a 274a 279b 280c 300c
RDF50+Z6+SS10 239c 264b 296a 309a 333a
Table 4. Soil available nitrogen (g/kg) as affected by Zeolite-Sewage Sludge applications during critical stages of rice growth.
Treatments 25DAT 40DAT 55DAT 70DAT 85DAT
Control 0.093f 0.071c 0.035d 0.035d 0.028d
RDF100 0.12f 0.11c 0.074d 0.077c 0.084c
RDF100+Z4+SS5 0.16cde 0.16b 0.13c 0.12b 0.10c
RDF100+Z6+SS10 0.21bc 0.19b 0.16bc 0.14b 0.14b
RDF75+Z4+SS5 0.18cd 0.18b 0.20ab 0.14b 0.17b
RDF75+Z6+SS10 0.15de 0.19b 0.23a 0.16b 0.19b
RDF50+Z4+SS5 0.25b 0.21b 0.14b 0.16b 0.19b
RDF50+Z6+SS10 0.30a 0.26a 0.16bc 0.22a 0.25a
Table 5. Soil available phosphorus (g/kg) as affected by Zeolite-Sewage Sludge applications during critical stages of rice growth.
Treatments 25DAT 40DAT 55DAT 70DAT 85DAT
Control 0.011c 0.011e 0.011c 0.013c 0.011c
RDF100 0.014b 0.015cd 0.017b 0.021b 0.022b
RDF100+Z4+SS5 0.015ab 0.016bcd 0.0186b 0.024ab 0.0280b
RDF100+Z6+SS10 0.015ab 0.014d 0.017b 0.021ab 0.0273b
RDF75+Z4+SS5 0.017ab 0.018ab 0.0196ab 0.023ab 0.0270b
RDF75+Z6+SS10 0.018a 0.019a 0.021a 0.025a 0.036a
RDF50+Z4+SS5 0.015ab 0.016bcd 0.0190ab 0.022ab 0.0276b
RDF50+Z6+SS10 0.017ab 0.017abc 0.0196ab 0.023ab 0.0283b
Table 6. Soil available potassium (g/kg) as affected by Zeolite-Sewage Sludge applications during critical stages of rice growth.
Treatments 25DAT 40DAT 55DAT 70DAT 85DAT
Control 0.066f 0.066f 0.064f 0.062g 0.062f
RDF100 0.069e 0.078e 0.126c 0.131de 0.133e
RDF100+Z4+SS5 0.072e 0.084d 0.122d 0.126f 0.137d
RDF100+Z6+SS10 0.081c 0.095c 0.128b 0.138bc 0.145b
RDF75+Z4+SS5 0.083c 0.099b 0.132a 0.139b 0.145b
RDF75+Z6+SS10 0.086b 0.093c 0.118e 0.129ef 0.137d
RDF50+Z4+SS5 0.077d 0.094c 0.122d 0.134cd 0.141c
RDF50+Z6+SS10 0.089a 0.106a 0.132a 0.144a 0.155a
Table 7. Relationship of soil indicators with rice growth and yield parameters as influenced by zeolite sewage sludge formulations.
OC Avil P AvilK Zn Fe Mn Cu LC Avil N Tot N MBC LN LT PH CL LL
Avil P .529**
Avil K .615** .846**
Zn .687** .747** .783**
Fe .739** .803** .869** .854**
Mn .469** .843** .829** .725** .779**
Cu .690** .672** .746** .827** .839** .787**
LC .789** .788** .810** .865** .856** .781** .825**
Avil N .586** .286 .246 .595** .427** .332* .527** .681**
Tot N .767** .282 .318* .586** .480** .280 .479** .720** .873**
MBC .853** .816** .841** .848** .885** .774** .799** .969** .630** .716**
LN .608** .569** .786** .686** .673** .704** .677** .796** .420** .502** .779**
LT .714** .480** .698** .678** .648** .625** .683** .816** .538** .658** .793** .939**
PH .399* .718** .765** .401* .582** .677** .418** .548** -.076 -.009 .584** .622** .533**
CL .516** .881** .839** .617** .755** .744** .596** .653** .041 .085 .715** .536** .446** .864**
LL .273 .578** .628** .234 .426** .576** .295 .429** -.150 -.089 .443** .581** .477** .952** .705**
SG .760** .635** .771** .833** .764** .717** .786** .920** .640** .722** .894** .915** .932** .505** .528** .417**
Disclaimer/Publisher’s Note: The statements, opinions and data contained in all publications are solely those of the individual author(s) and contributor(s) and not of MDPI and/or the editor(s). MDPI and/or the editor(s) disclaim responsibility for any injury to people or property resulting from any ideas, methods, instructions or products referred to in the content.
Copyright: This open access article is published under a Creative Commons CC BY 4.0 license, which permit the free download, distribution, and reuse, provided that the author and preprint are cited in any reuse.
Alerts
Prerpints.org logo

Preprints.org is a free preprint server supported by MDPI in Basel, Switzerland.

Subscribe

© 2025 MDPI (Basel, Switzerland) unless otherwise stated