Submitted:
30 November 2023
Posted:
01 December 2023
You are already at the latest version
Abstract
Keywords:
1. Introduction
2. Materials and Methods
2.1. CuSe nanoparticles synthesis.
2.2. Preparation of nanostructured CuSe nanoparticles coatings.
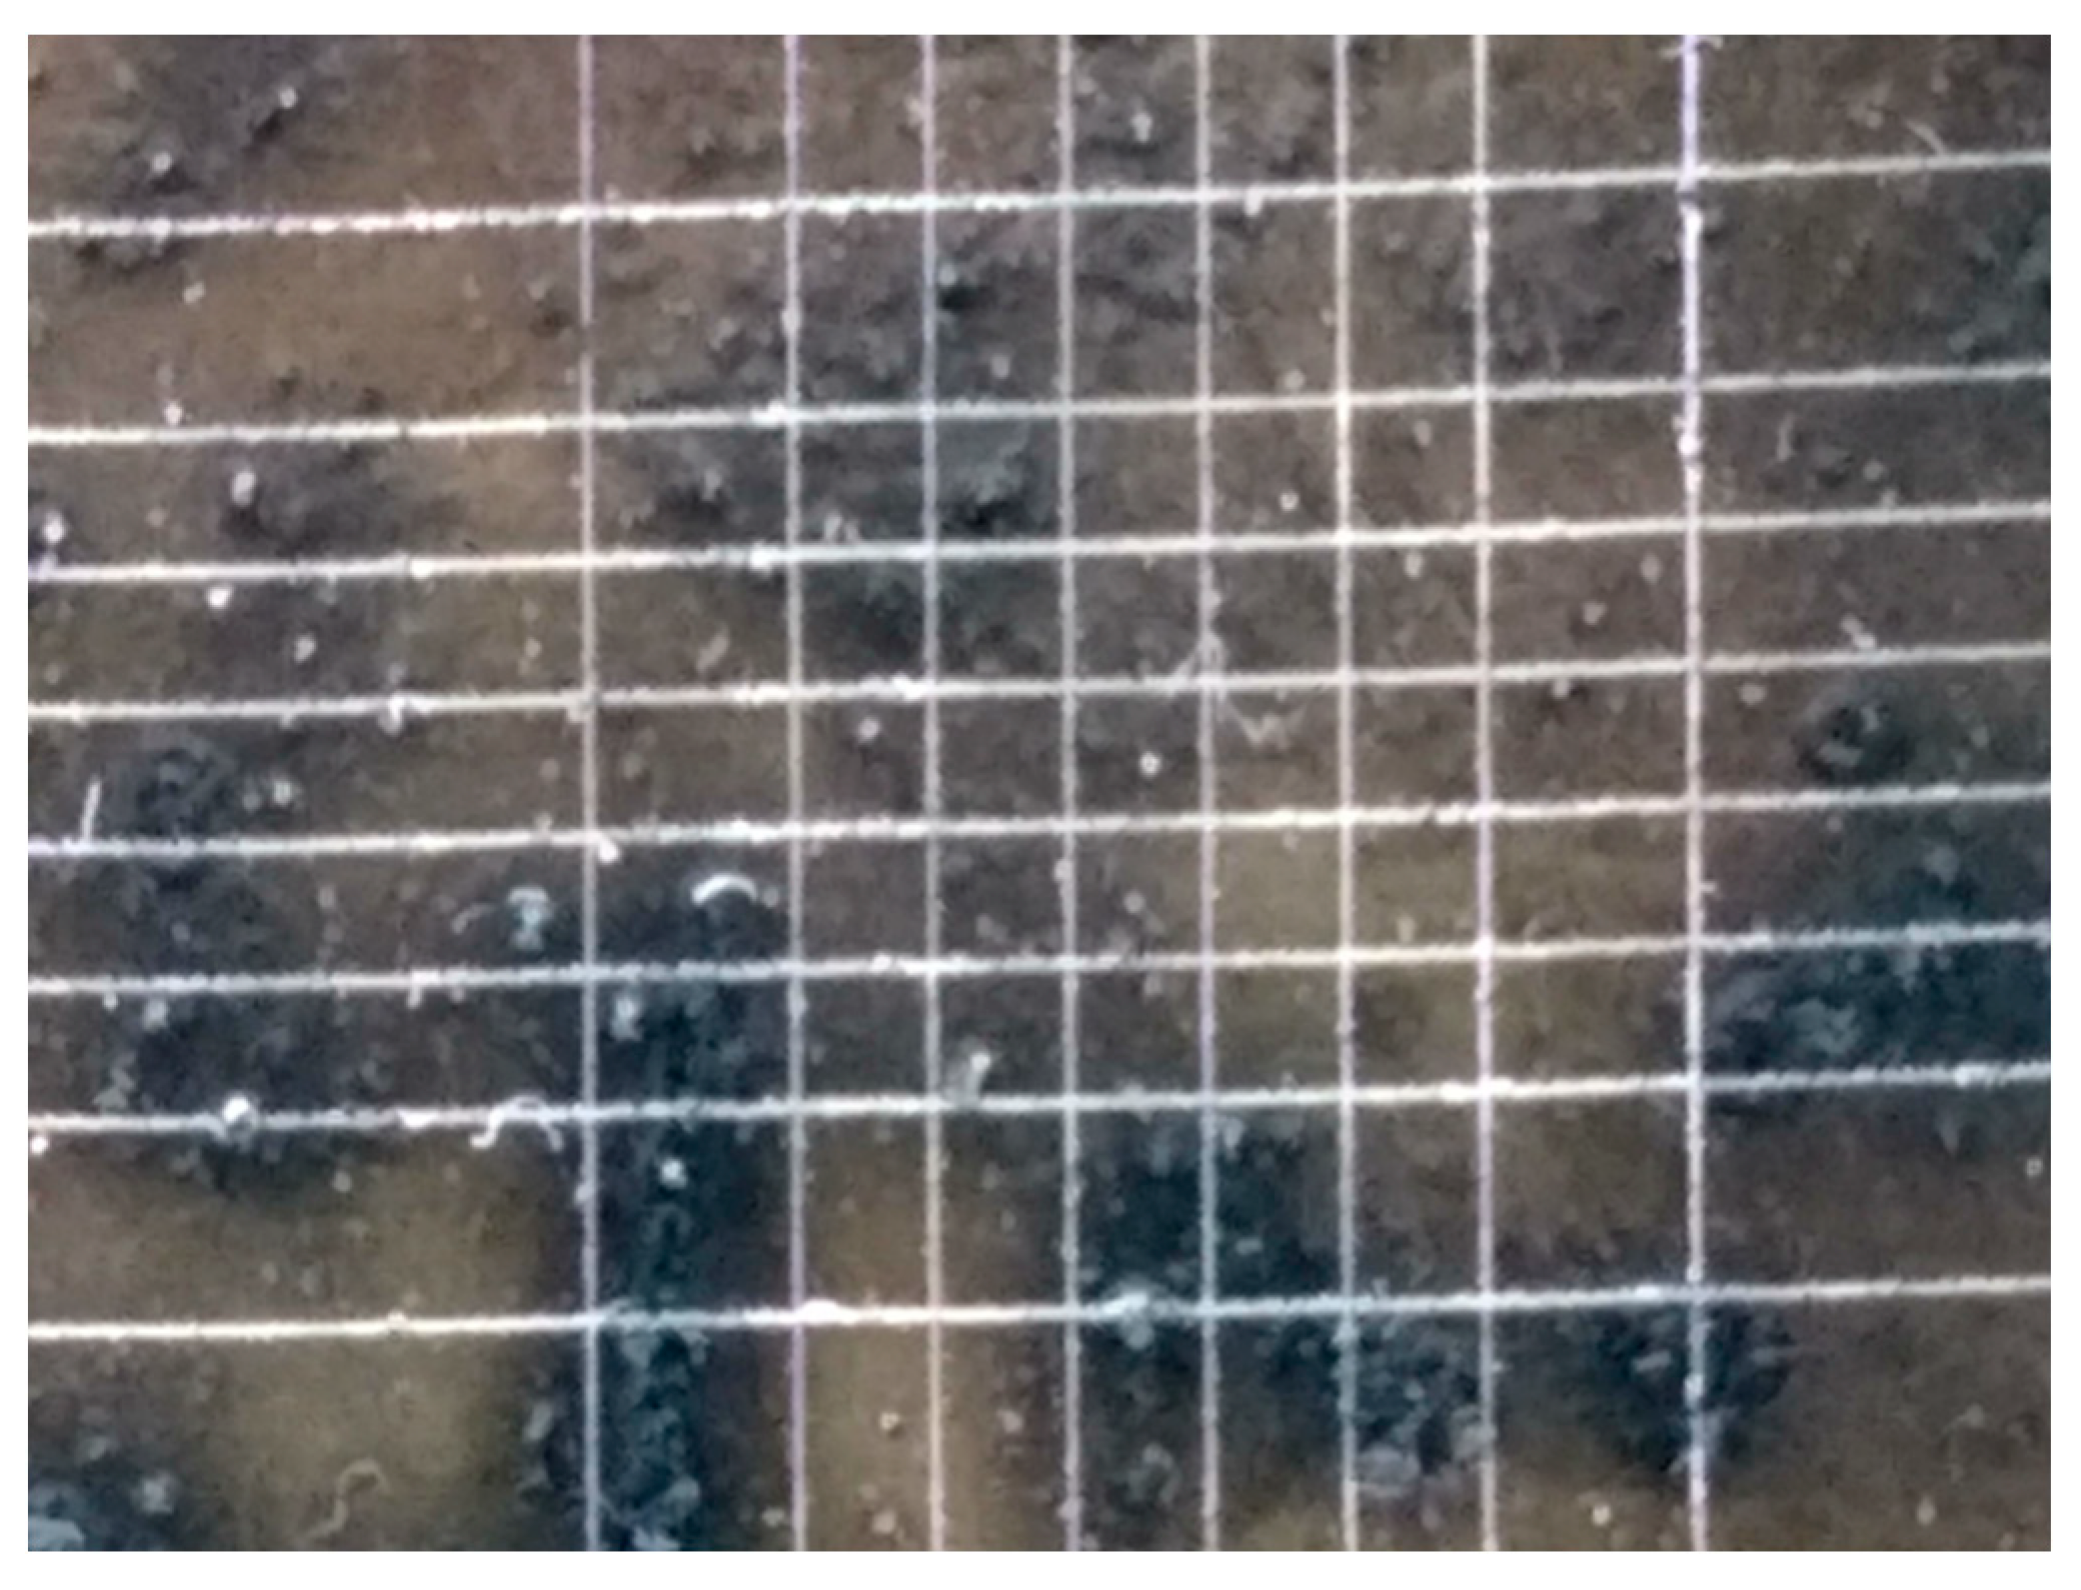
2.4. Mechanical performance tests.
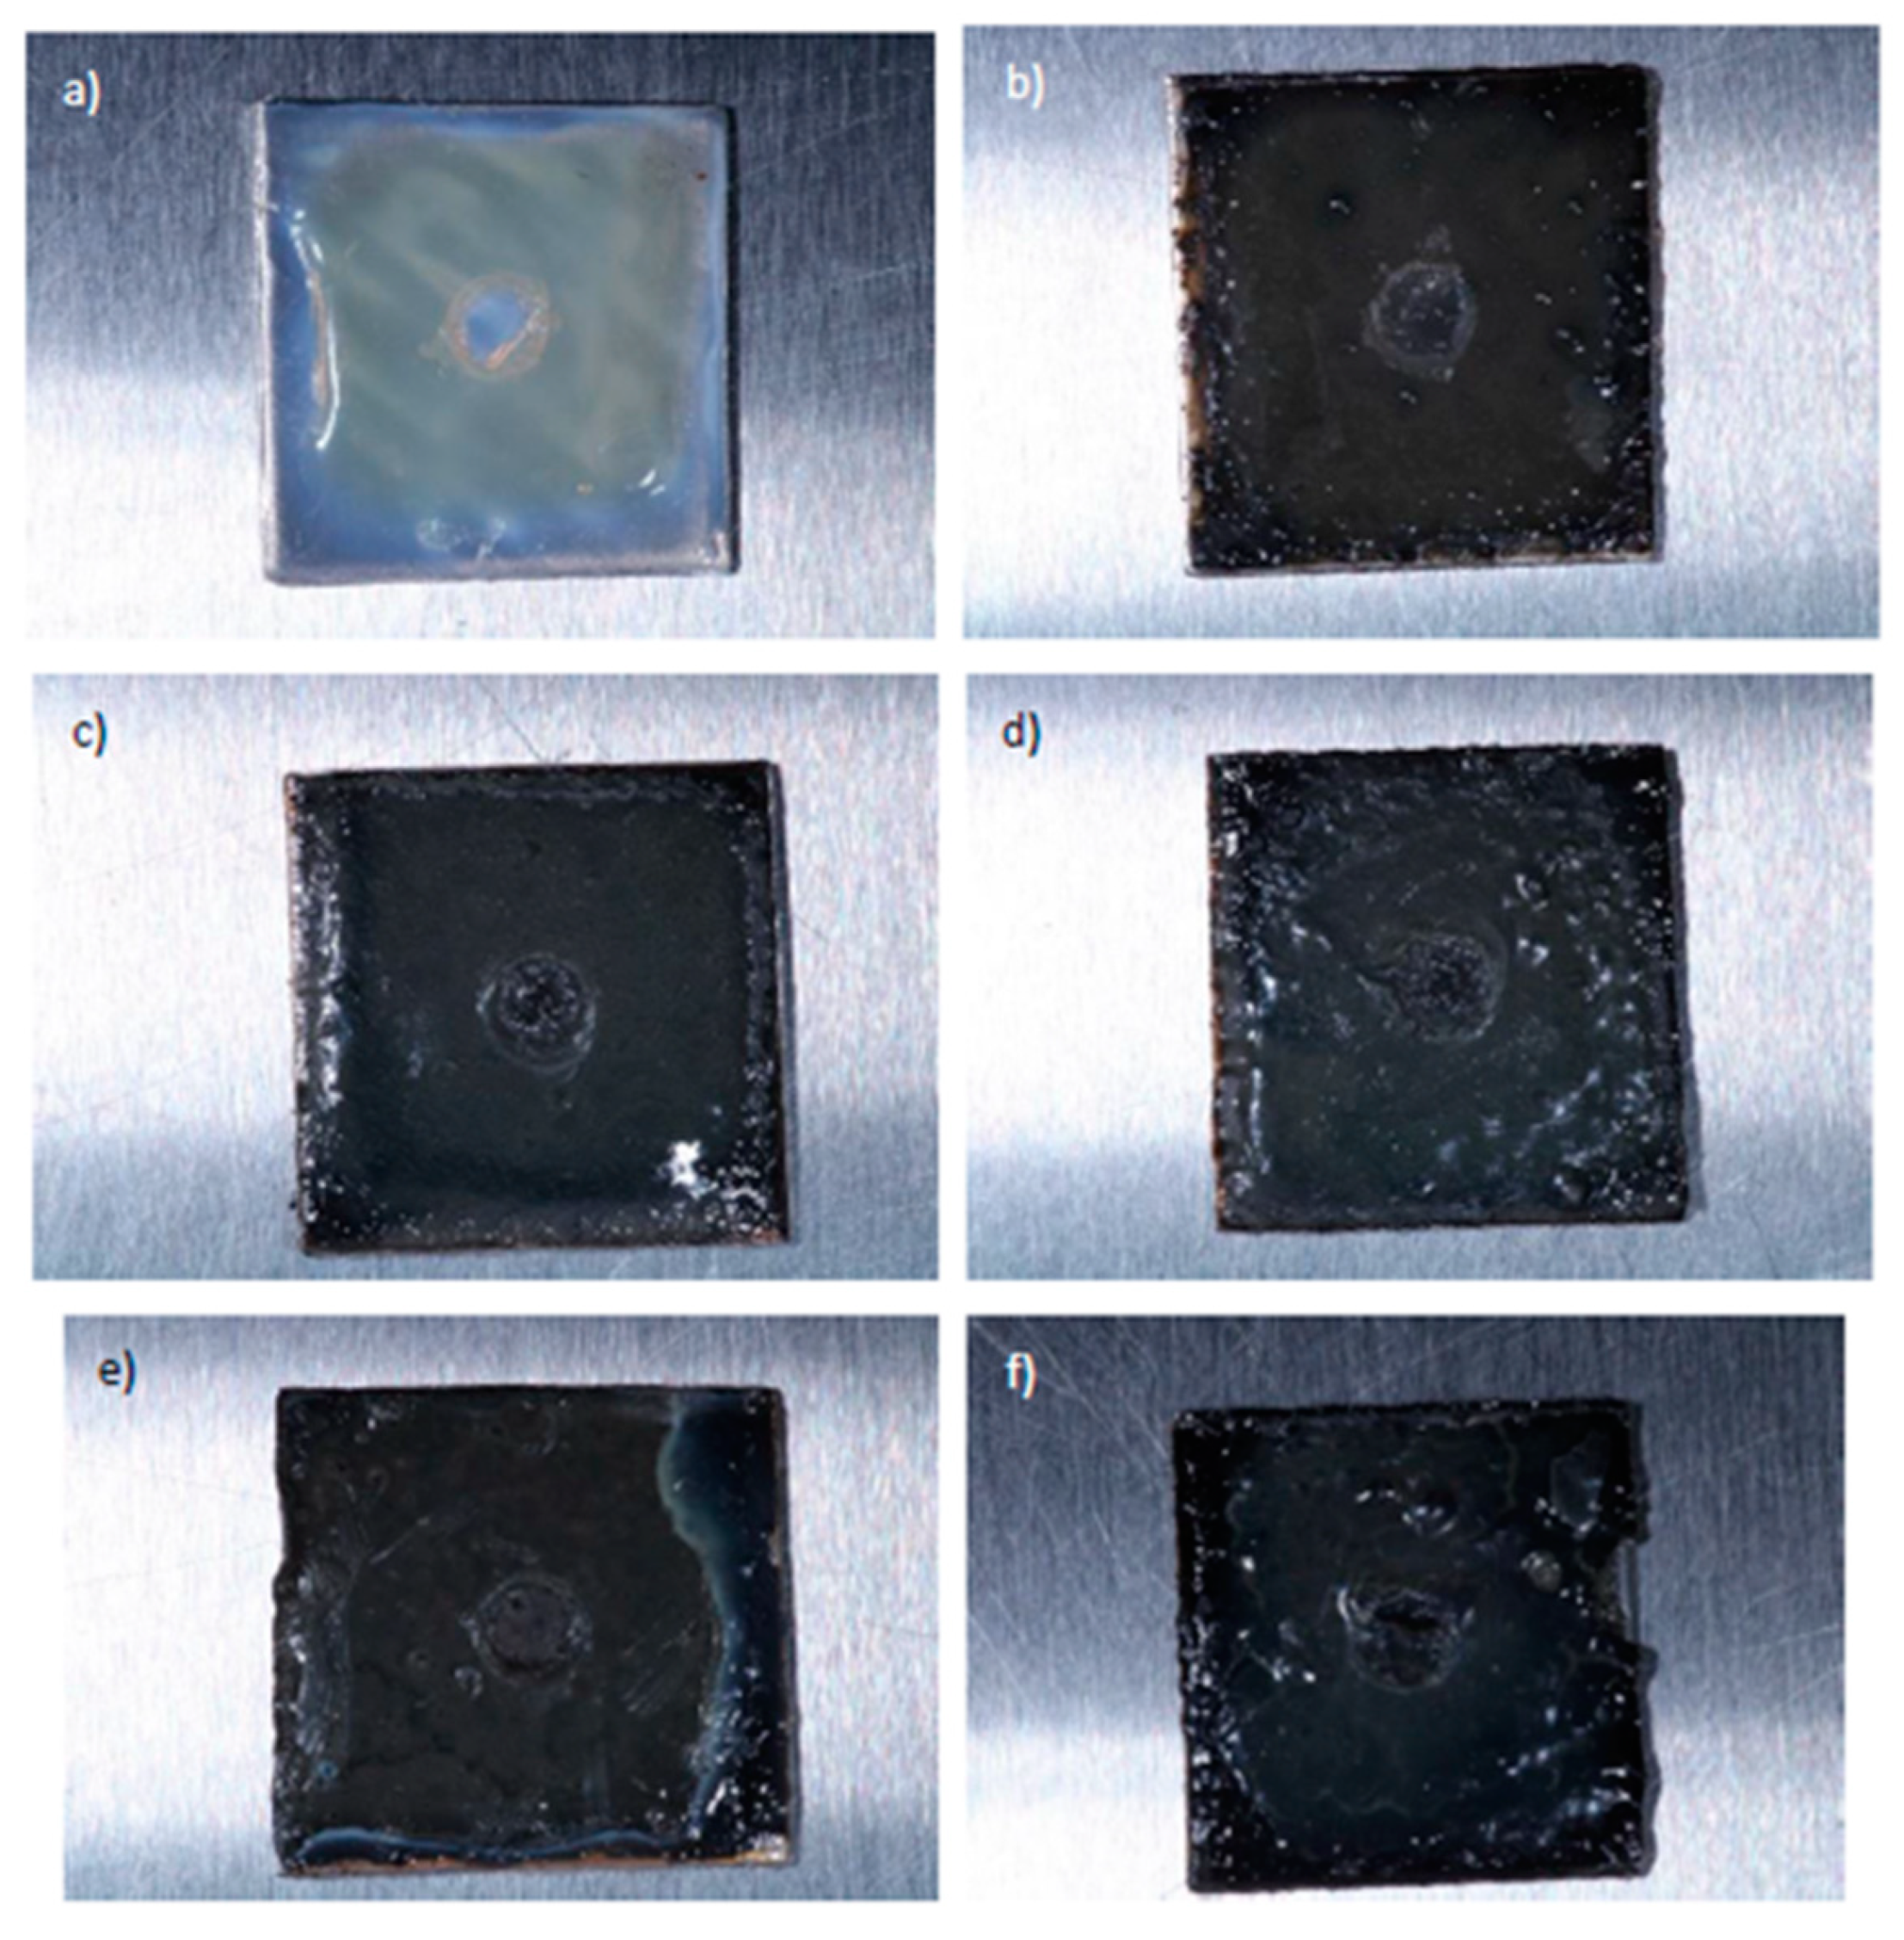
2.5. Microbiological test.
3. Results and discussion
3.1. CuSe nanoparticles coatings characterization
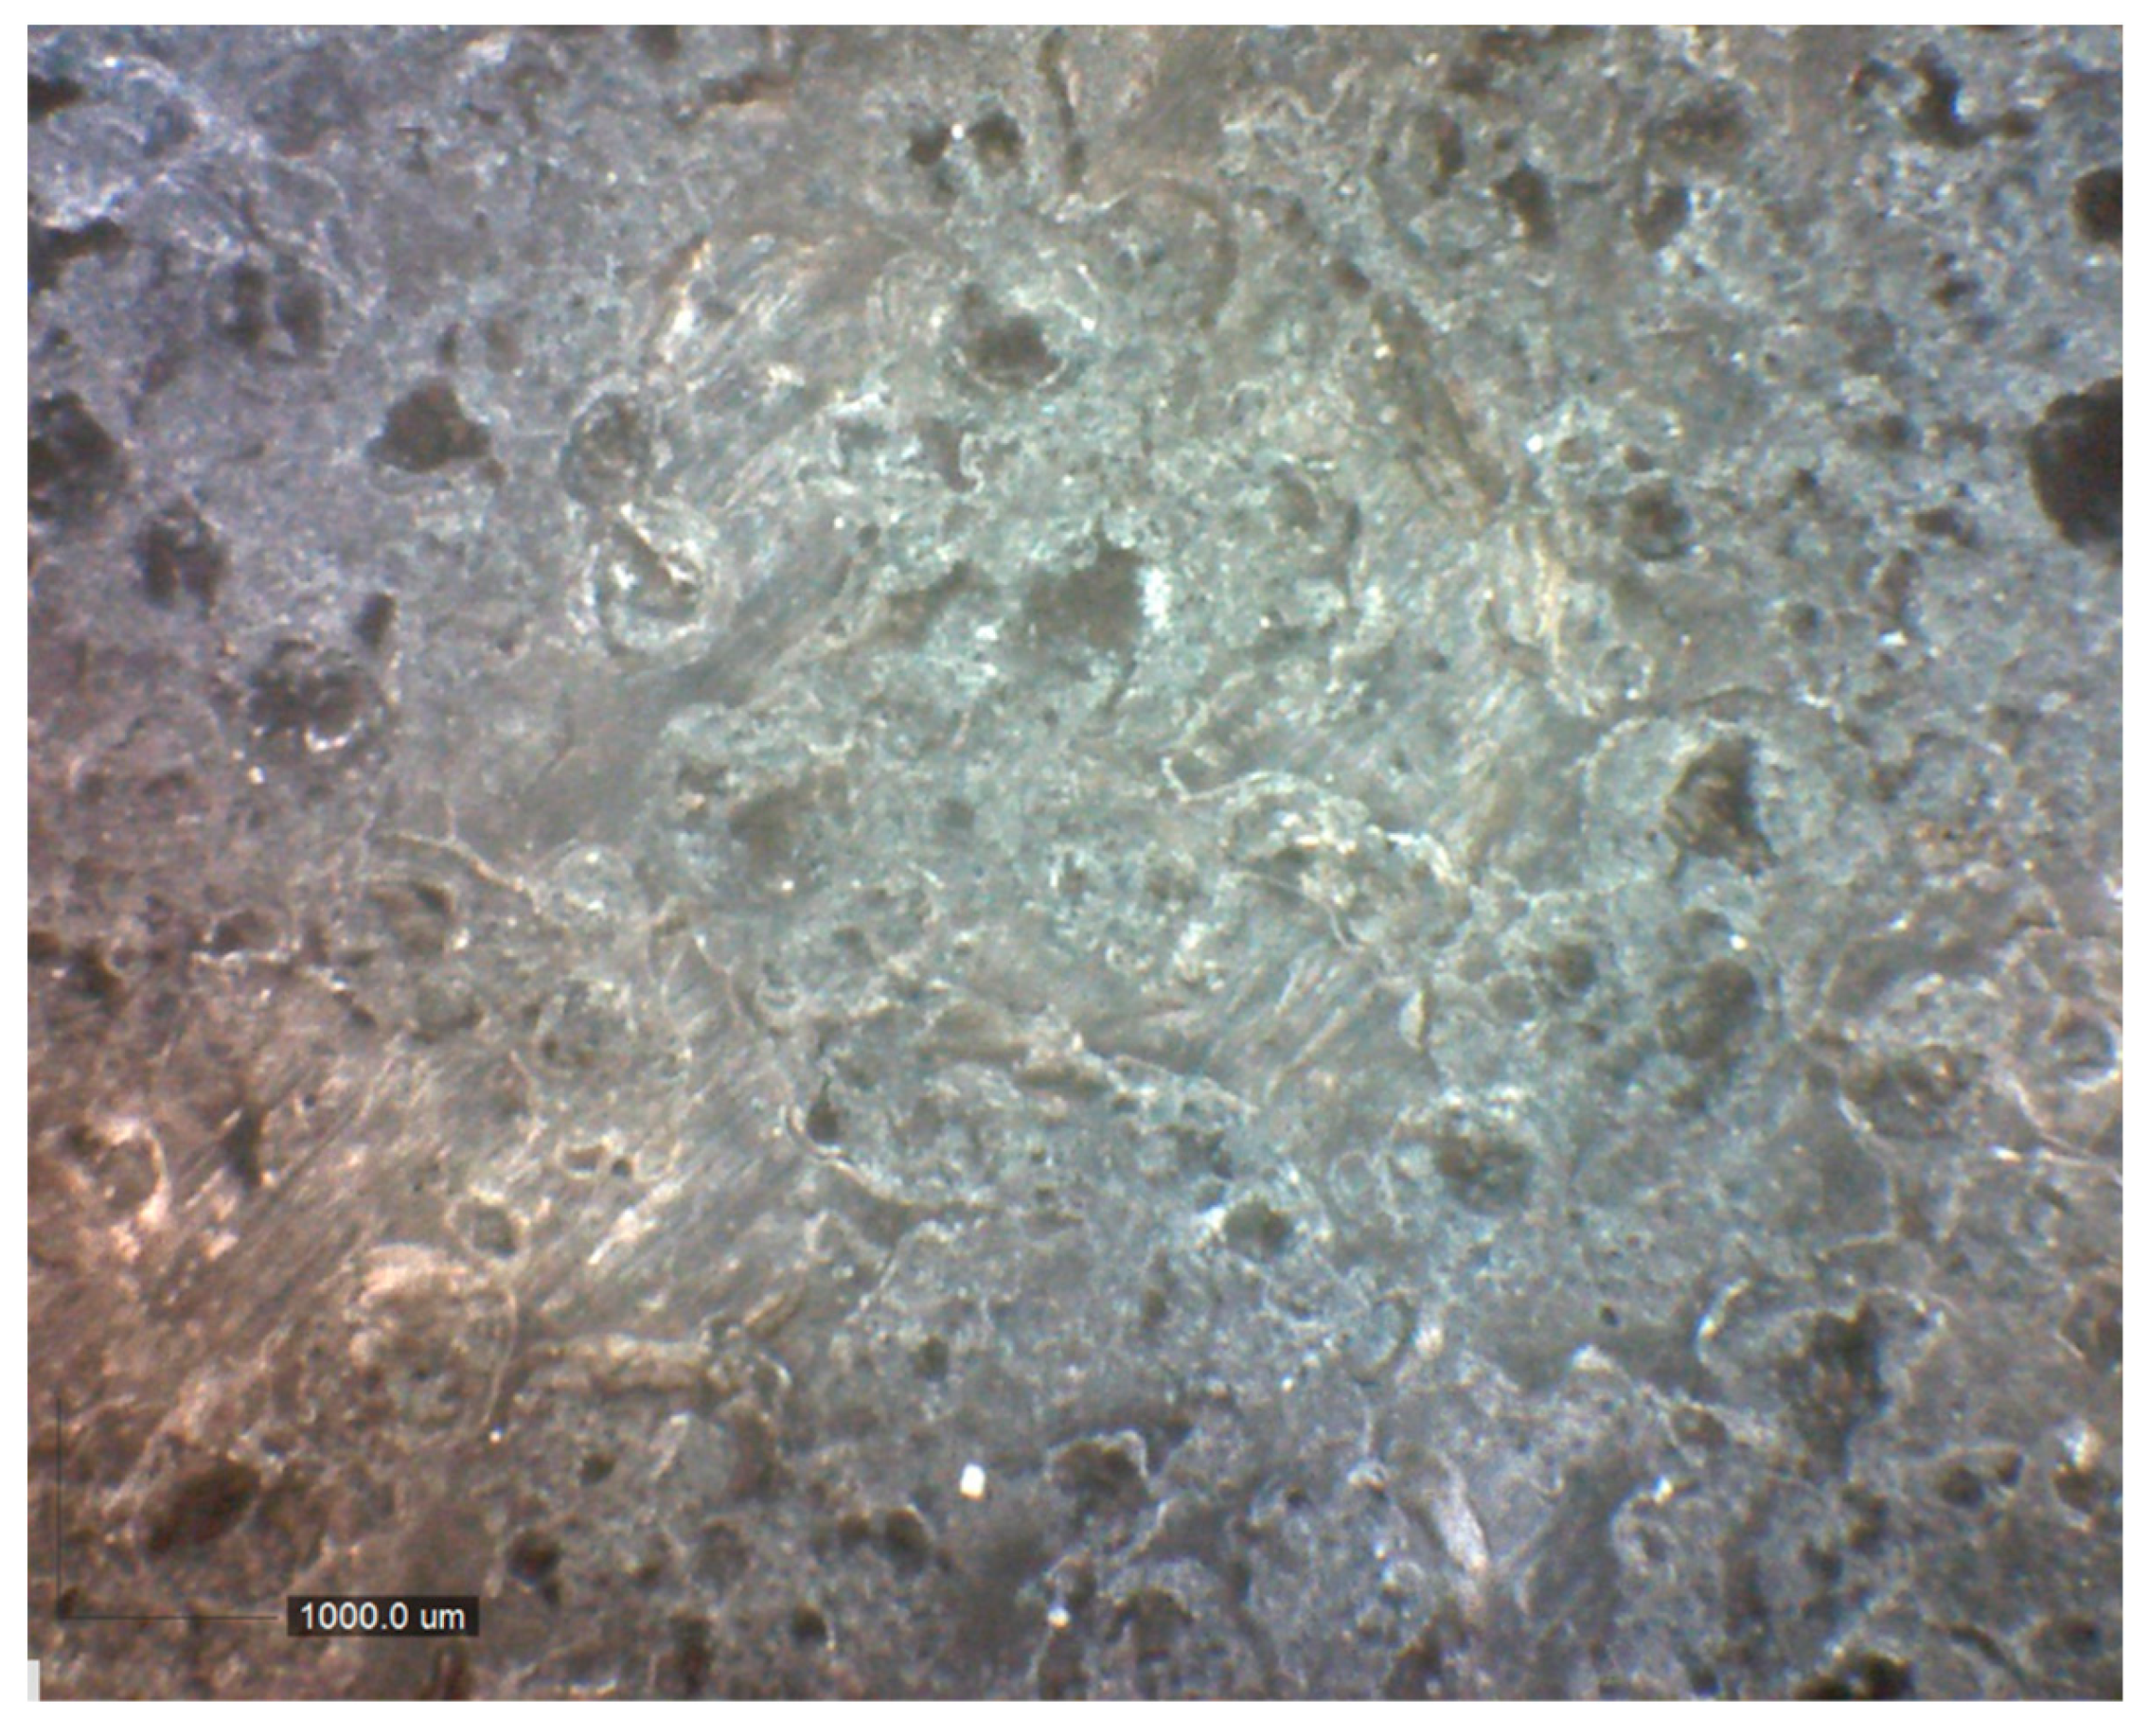

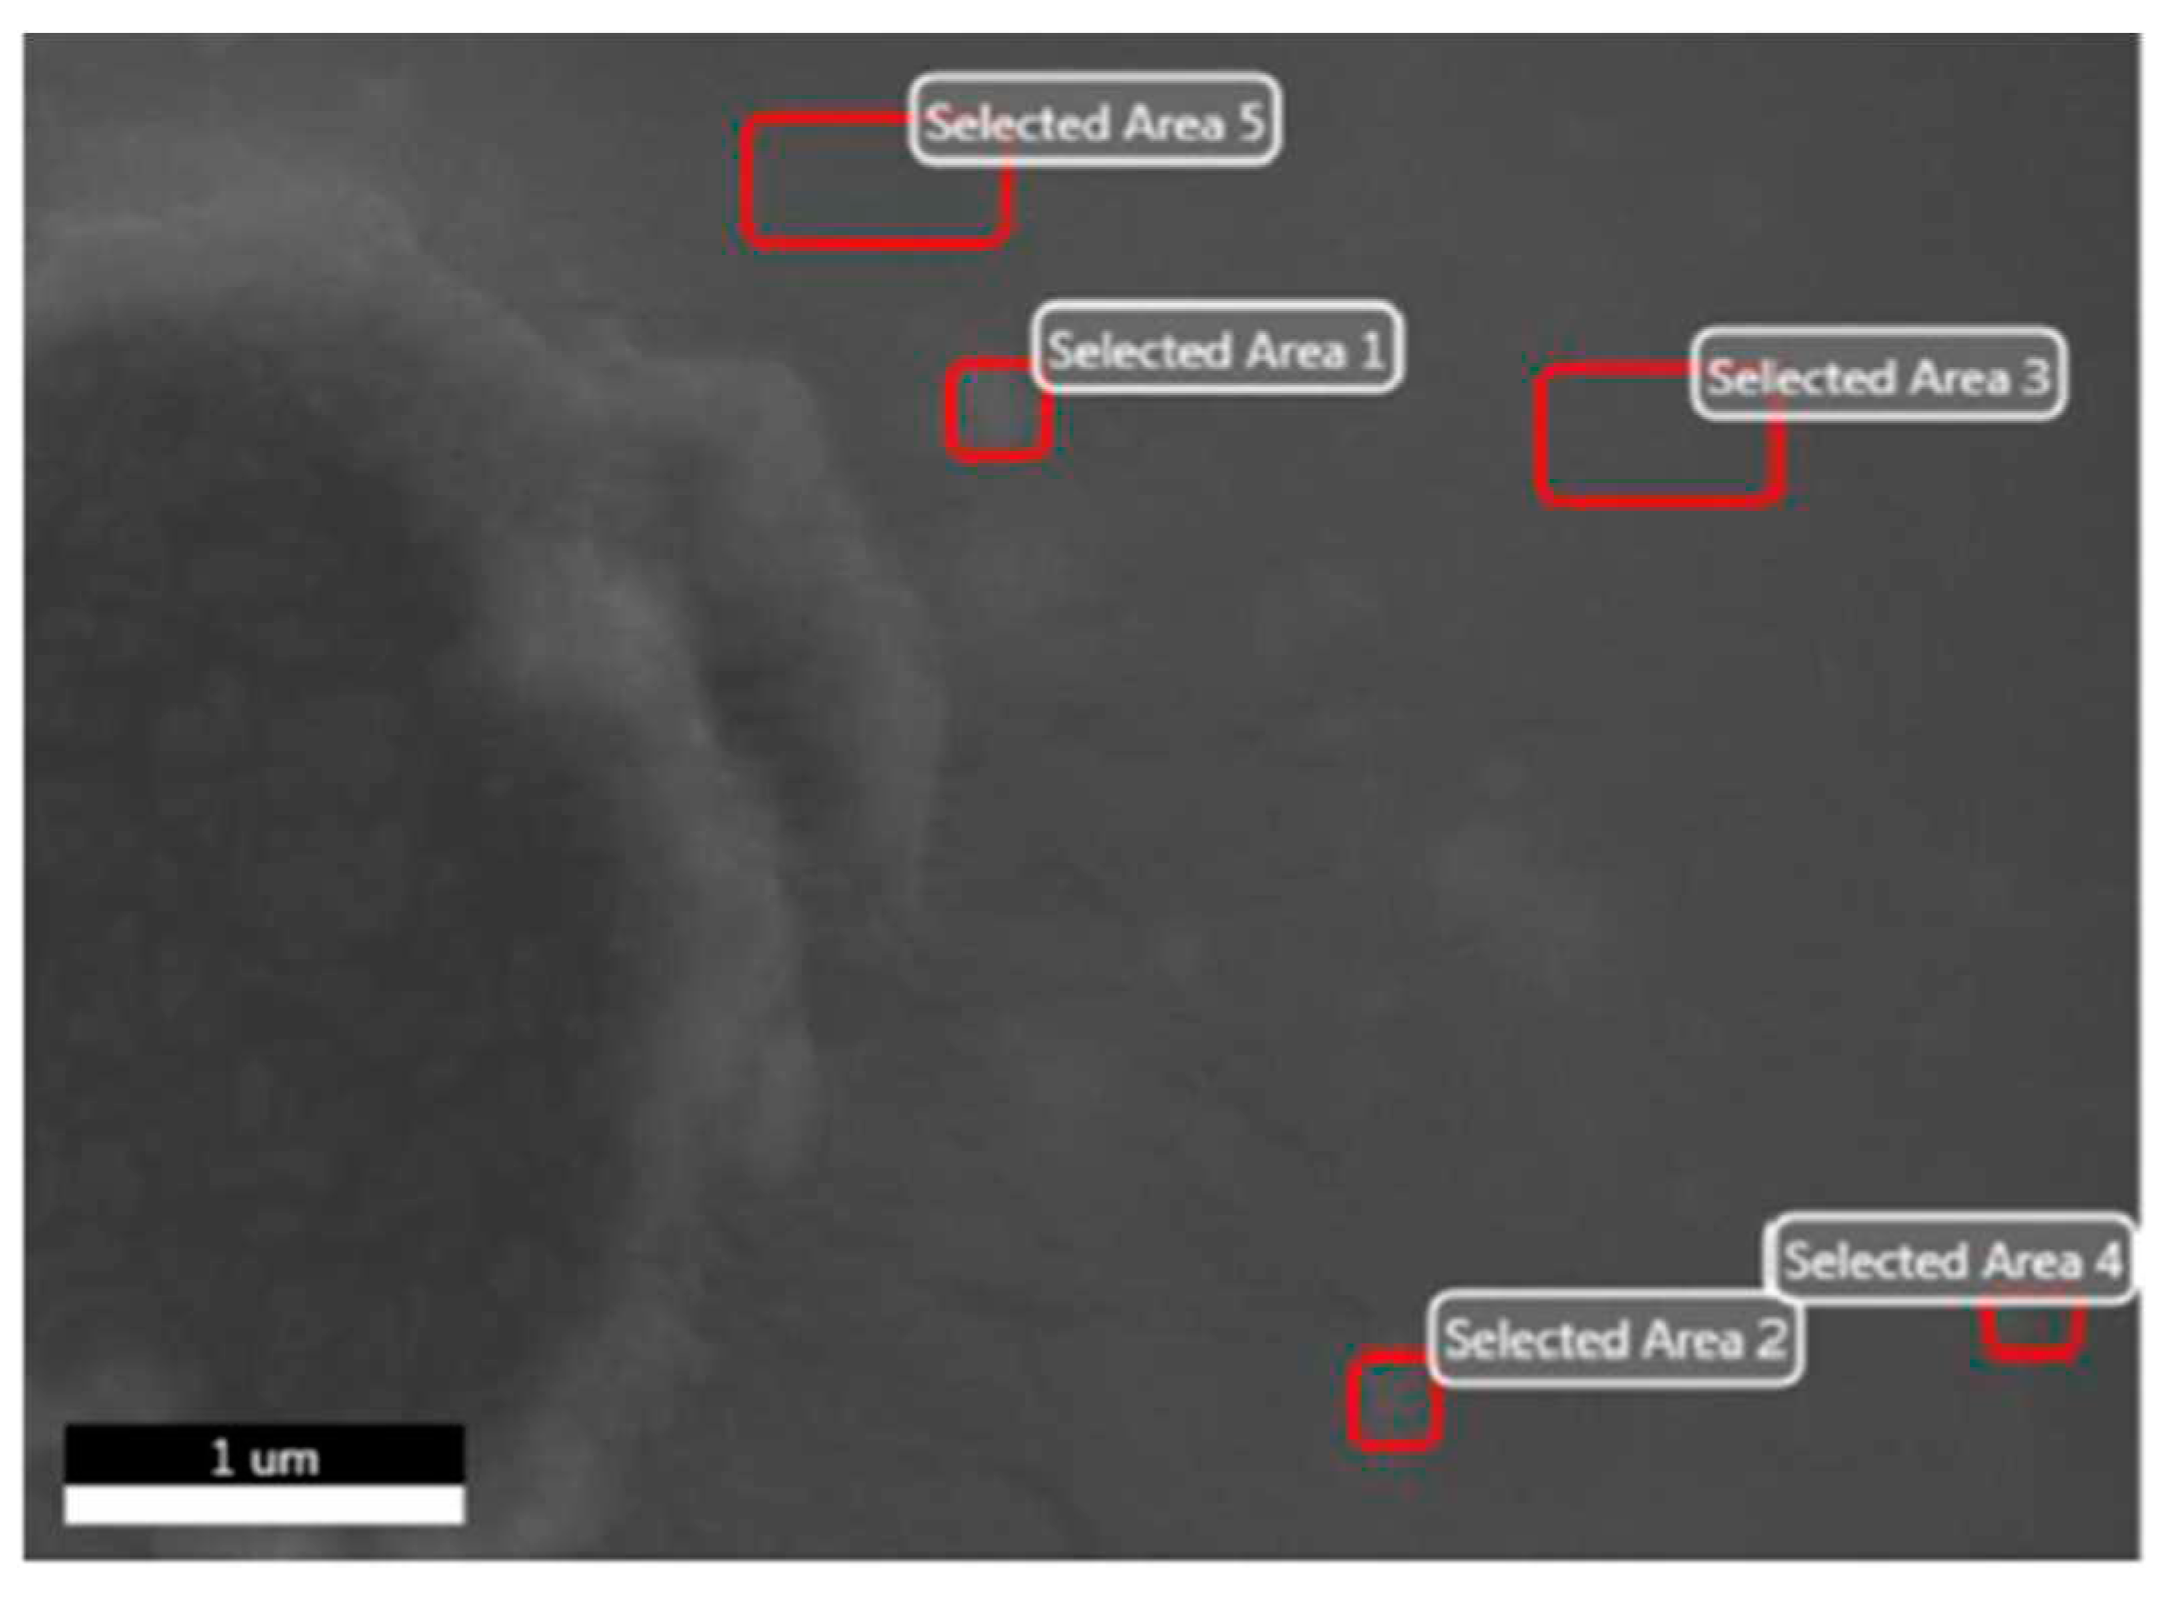
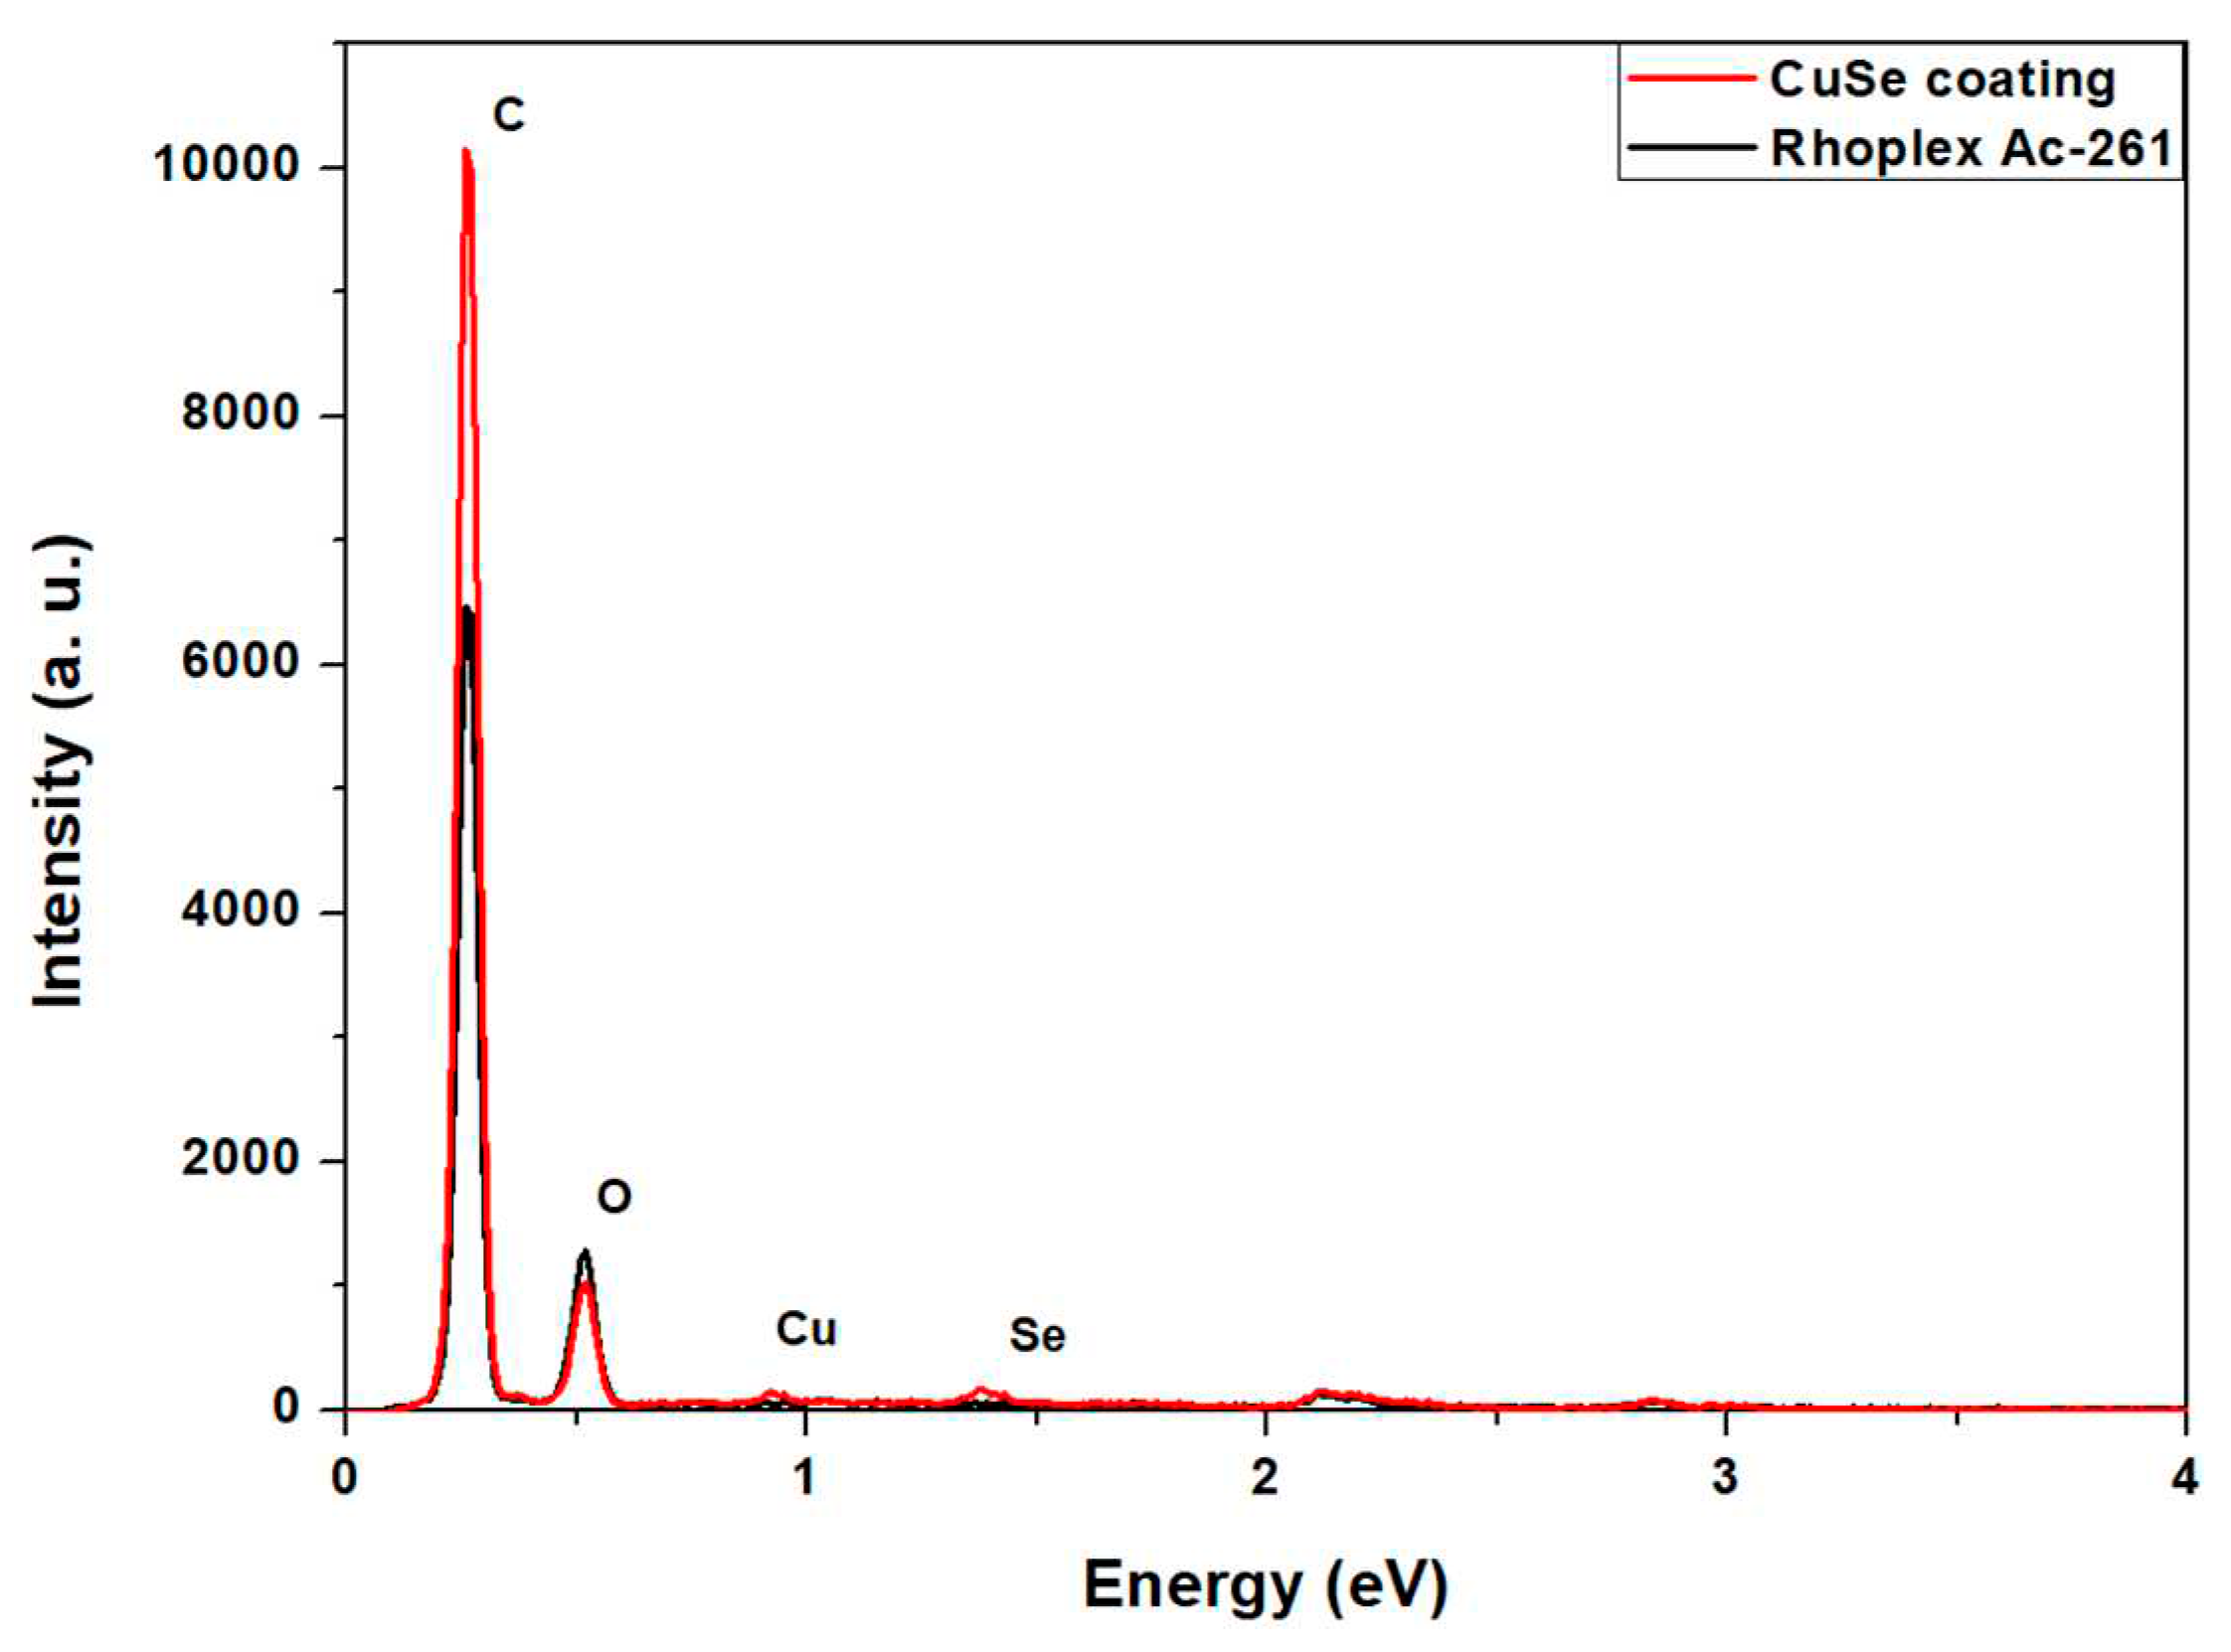
| Element | Wt. % |
|---|---|
| Oxygen | 77.4 |
| Carbon | 20.62 |
| Selenium | 1.14 |
| Copper | 0.84 |
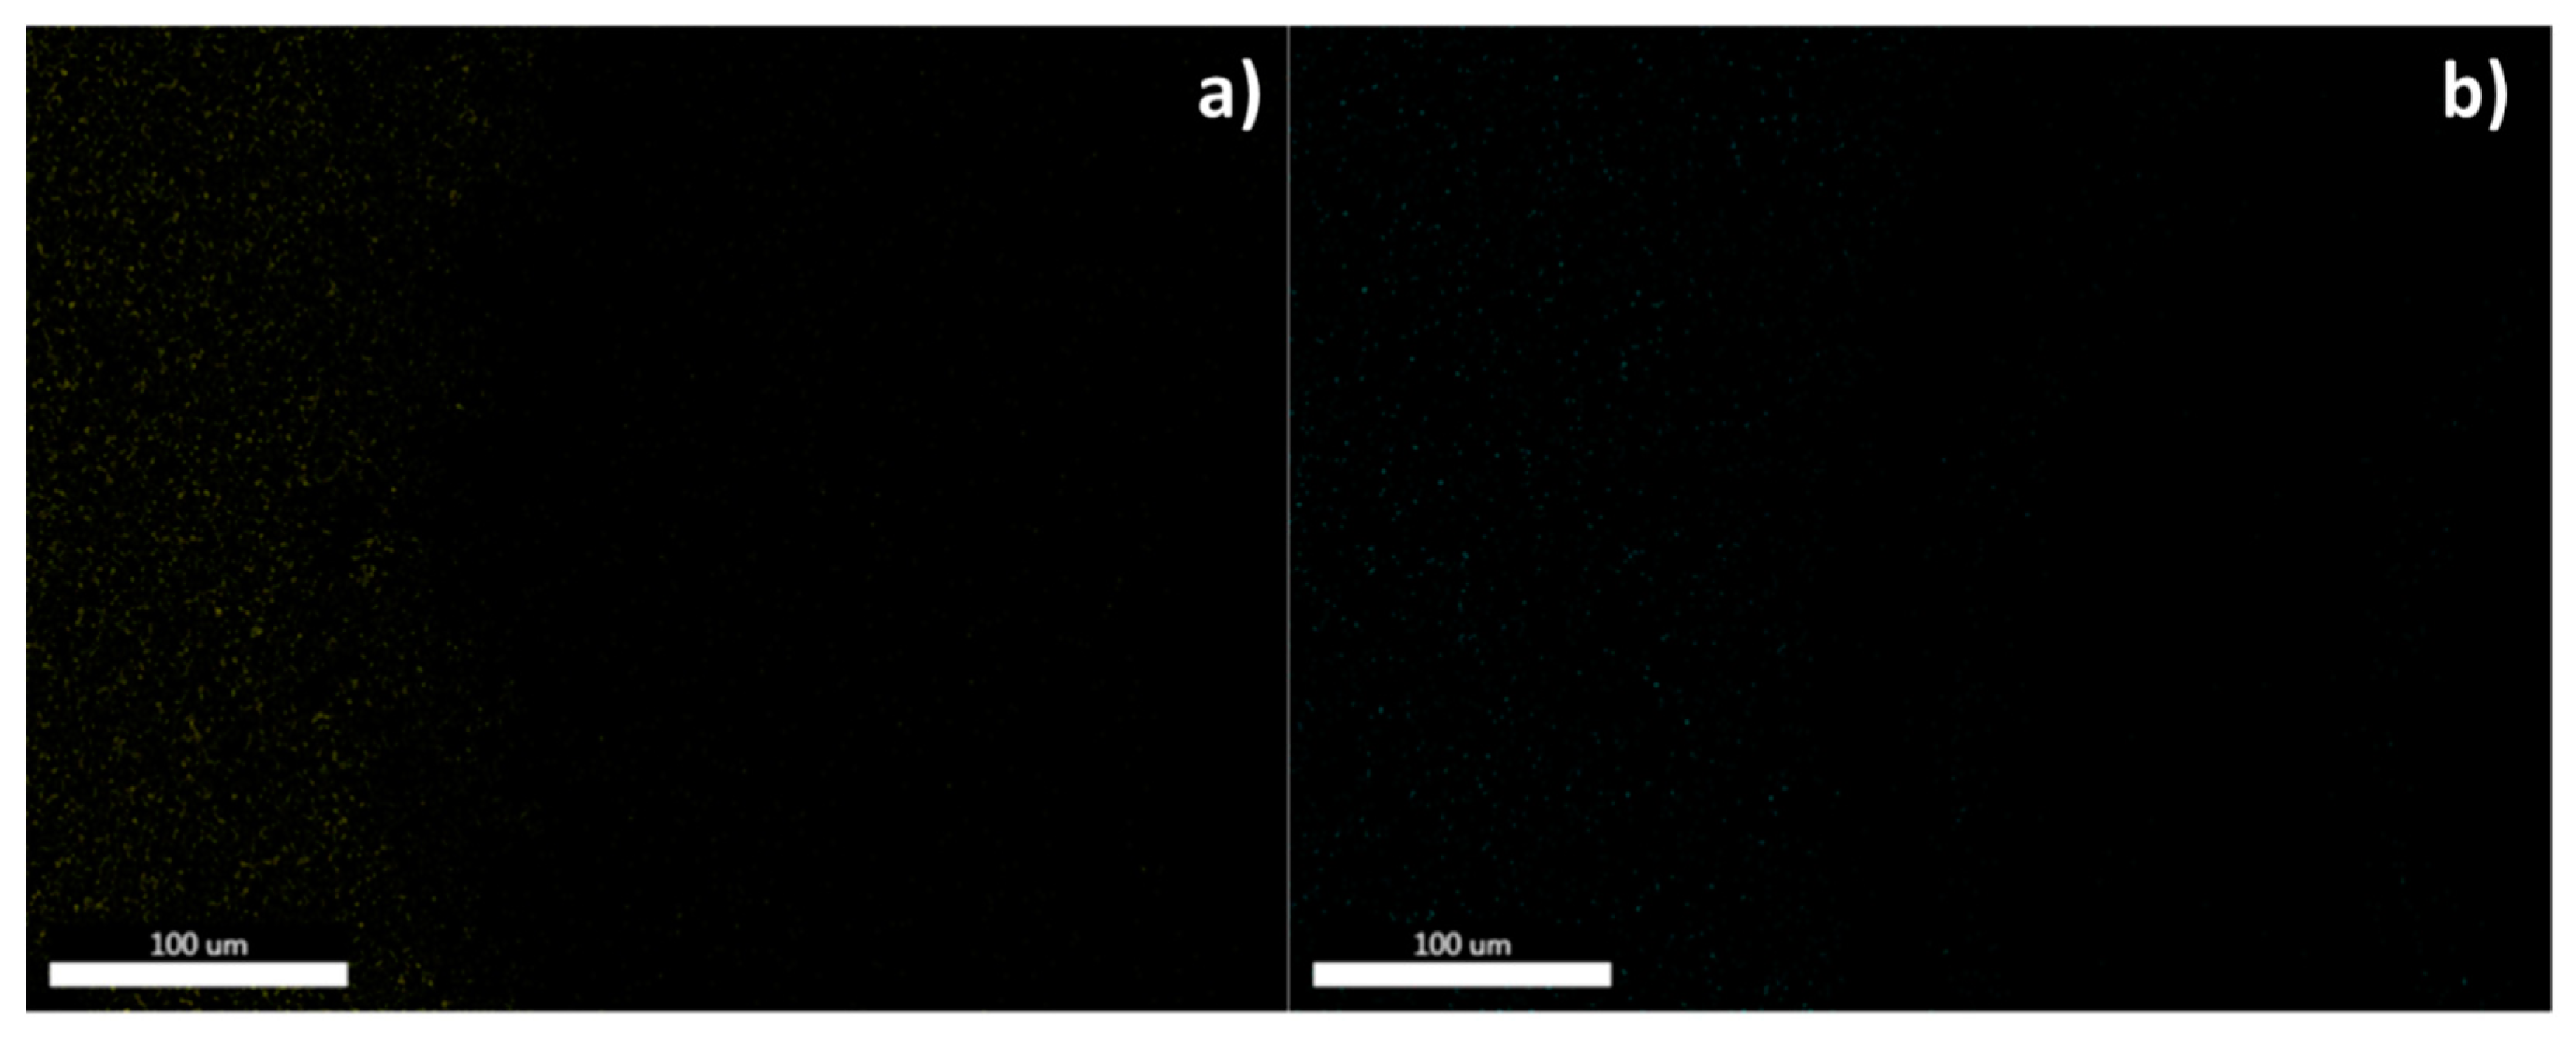
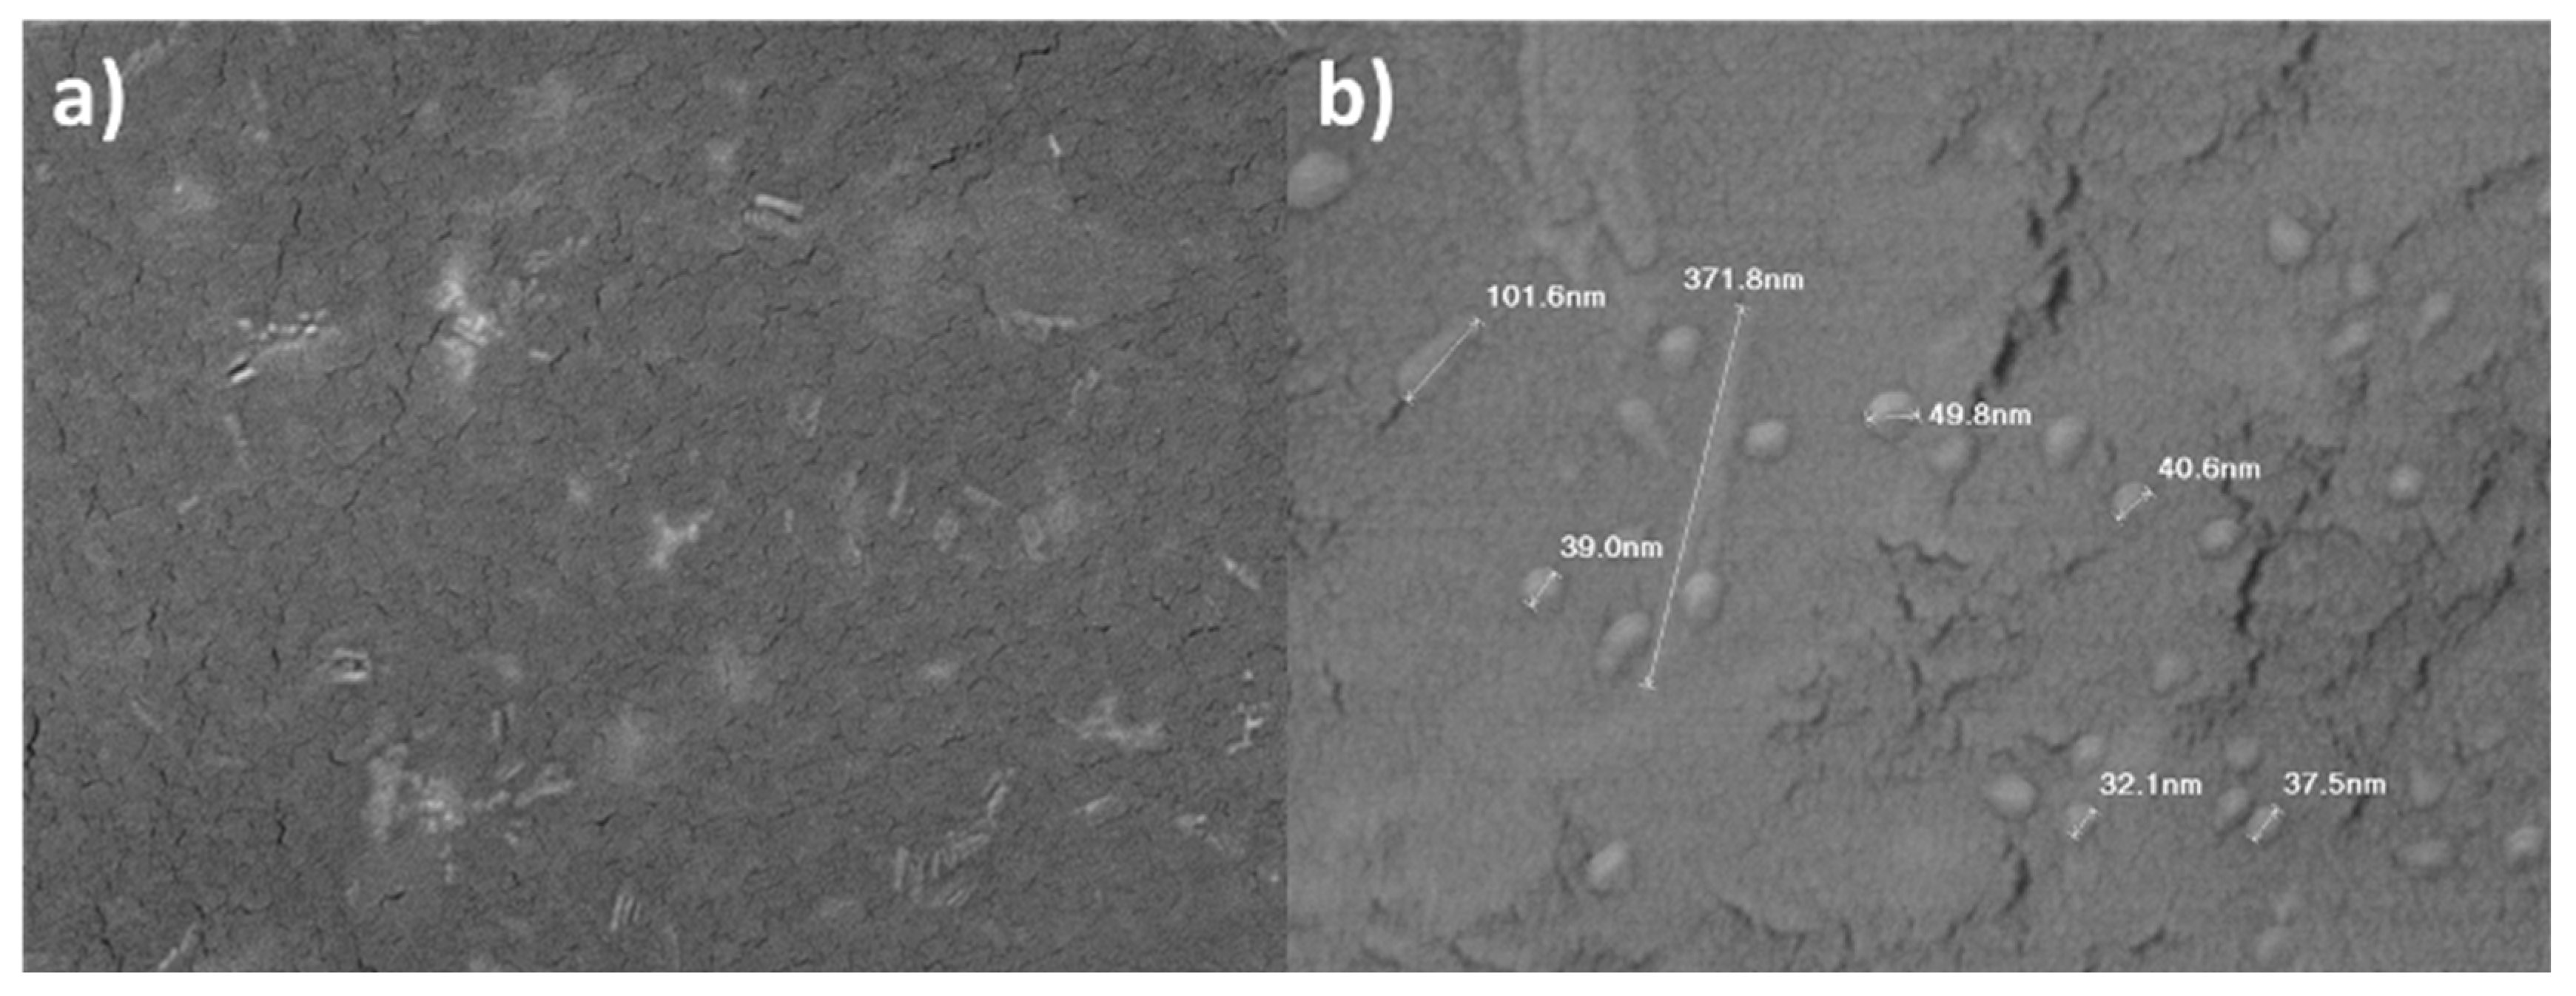
| Sample supernatant | Se (ppm) | Cu (ppm) |
|---|---|---|
| Blank (distilled water) | 0 | 0 |
| Black 5 days | 0.088 | 0.009 |
| Black 10 days | 0.125 | 0.014 |
| Black 20 days | 0.414 | 0.034 |
| Black 40 days | 0.737 | 0.047 |
| Black 80 days | 0.519 | 0.132 |
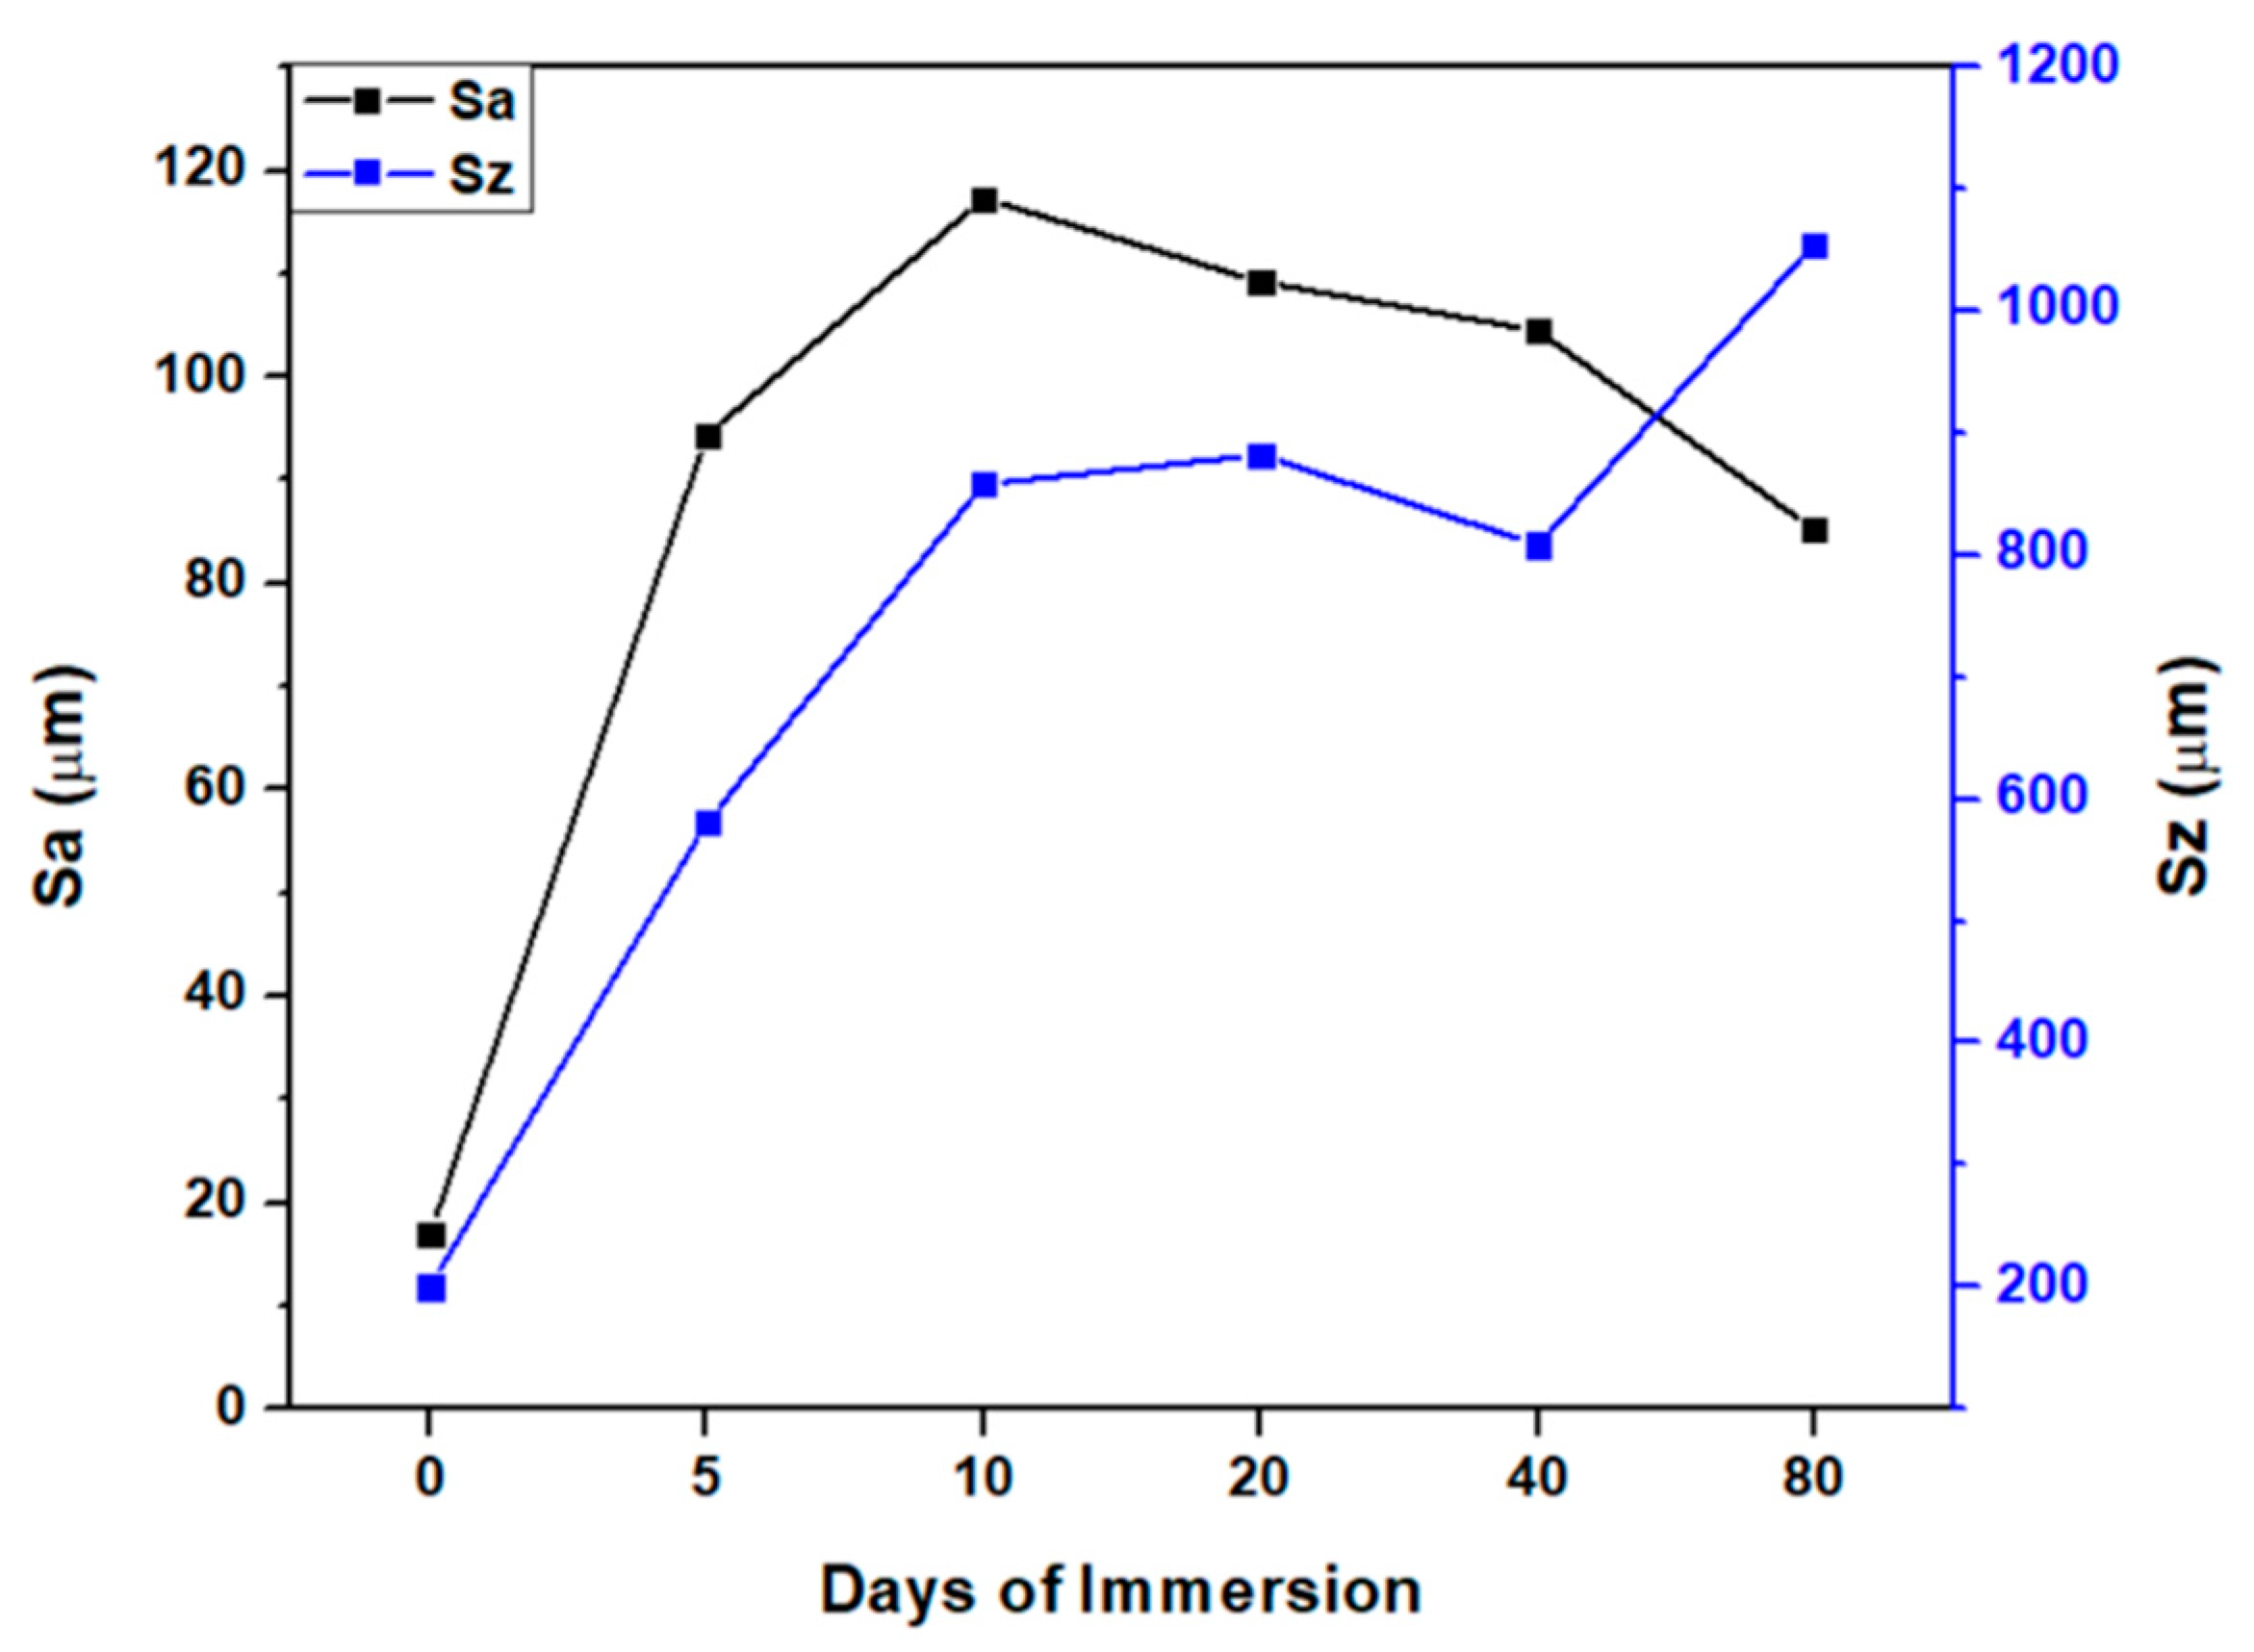
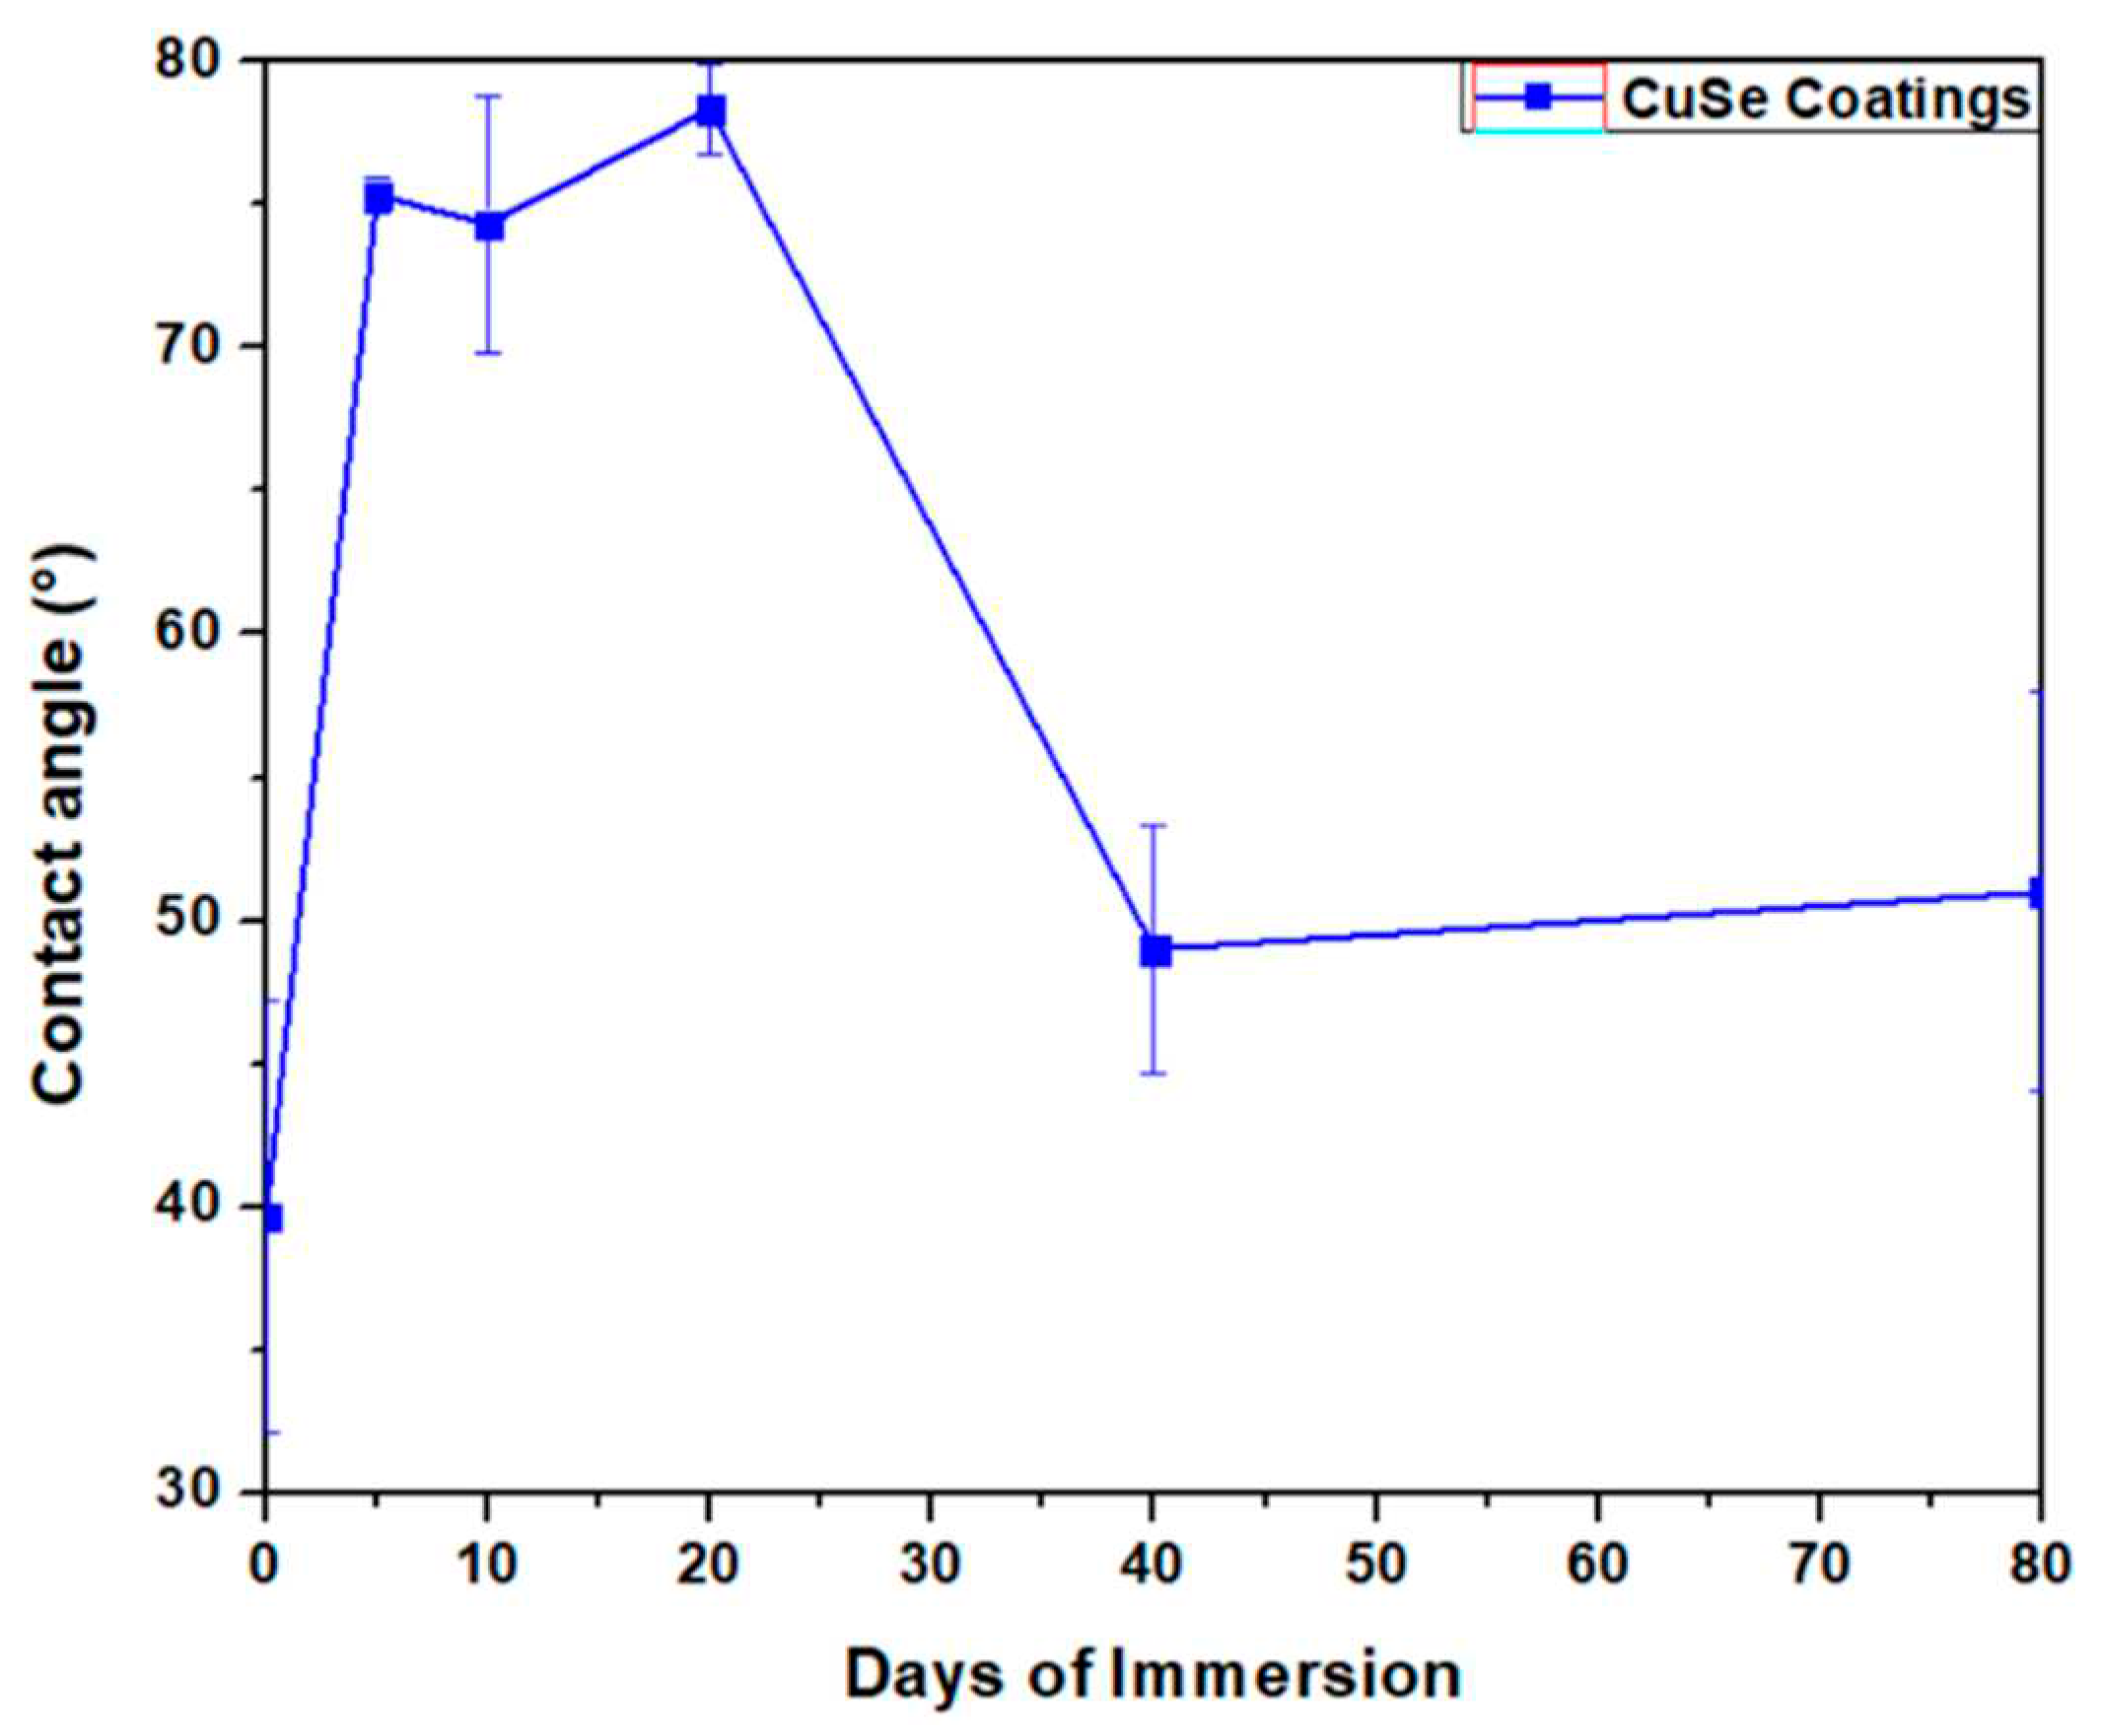
3.2. Mechanical tests analysis
3.3. Microbiological tests results

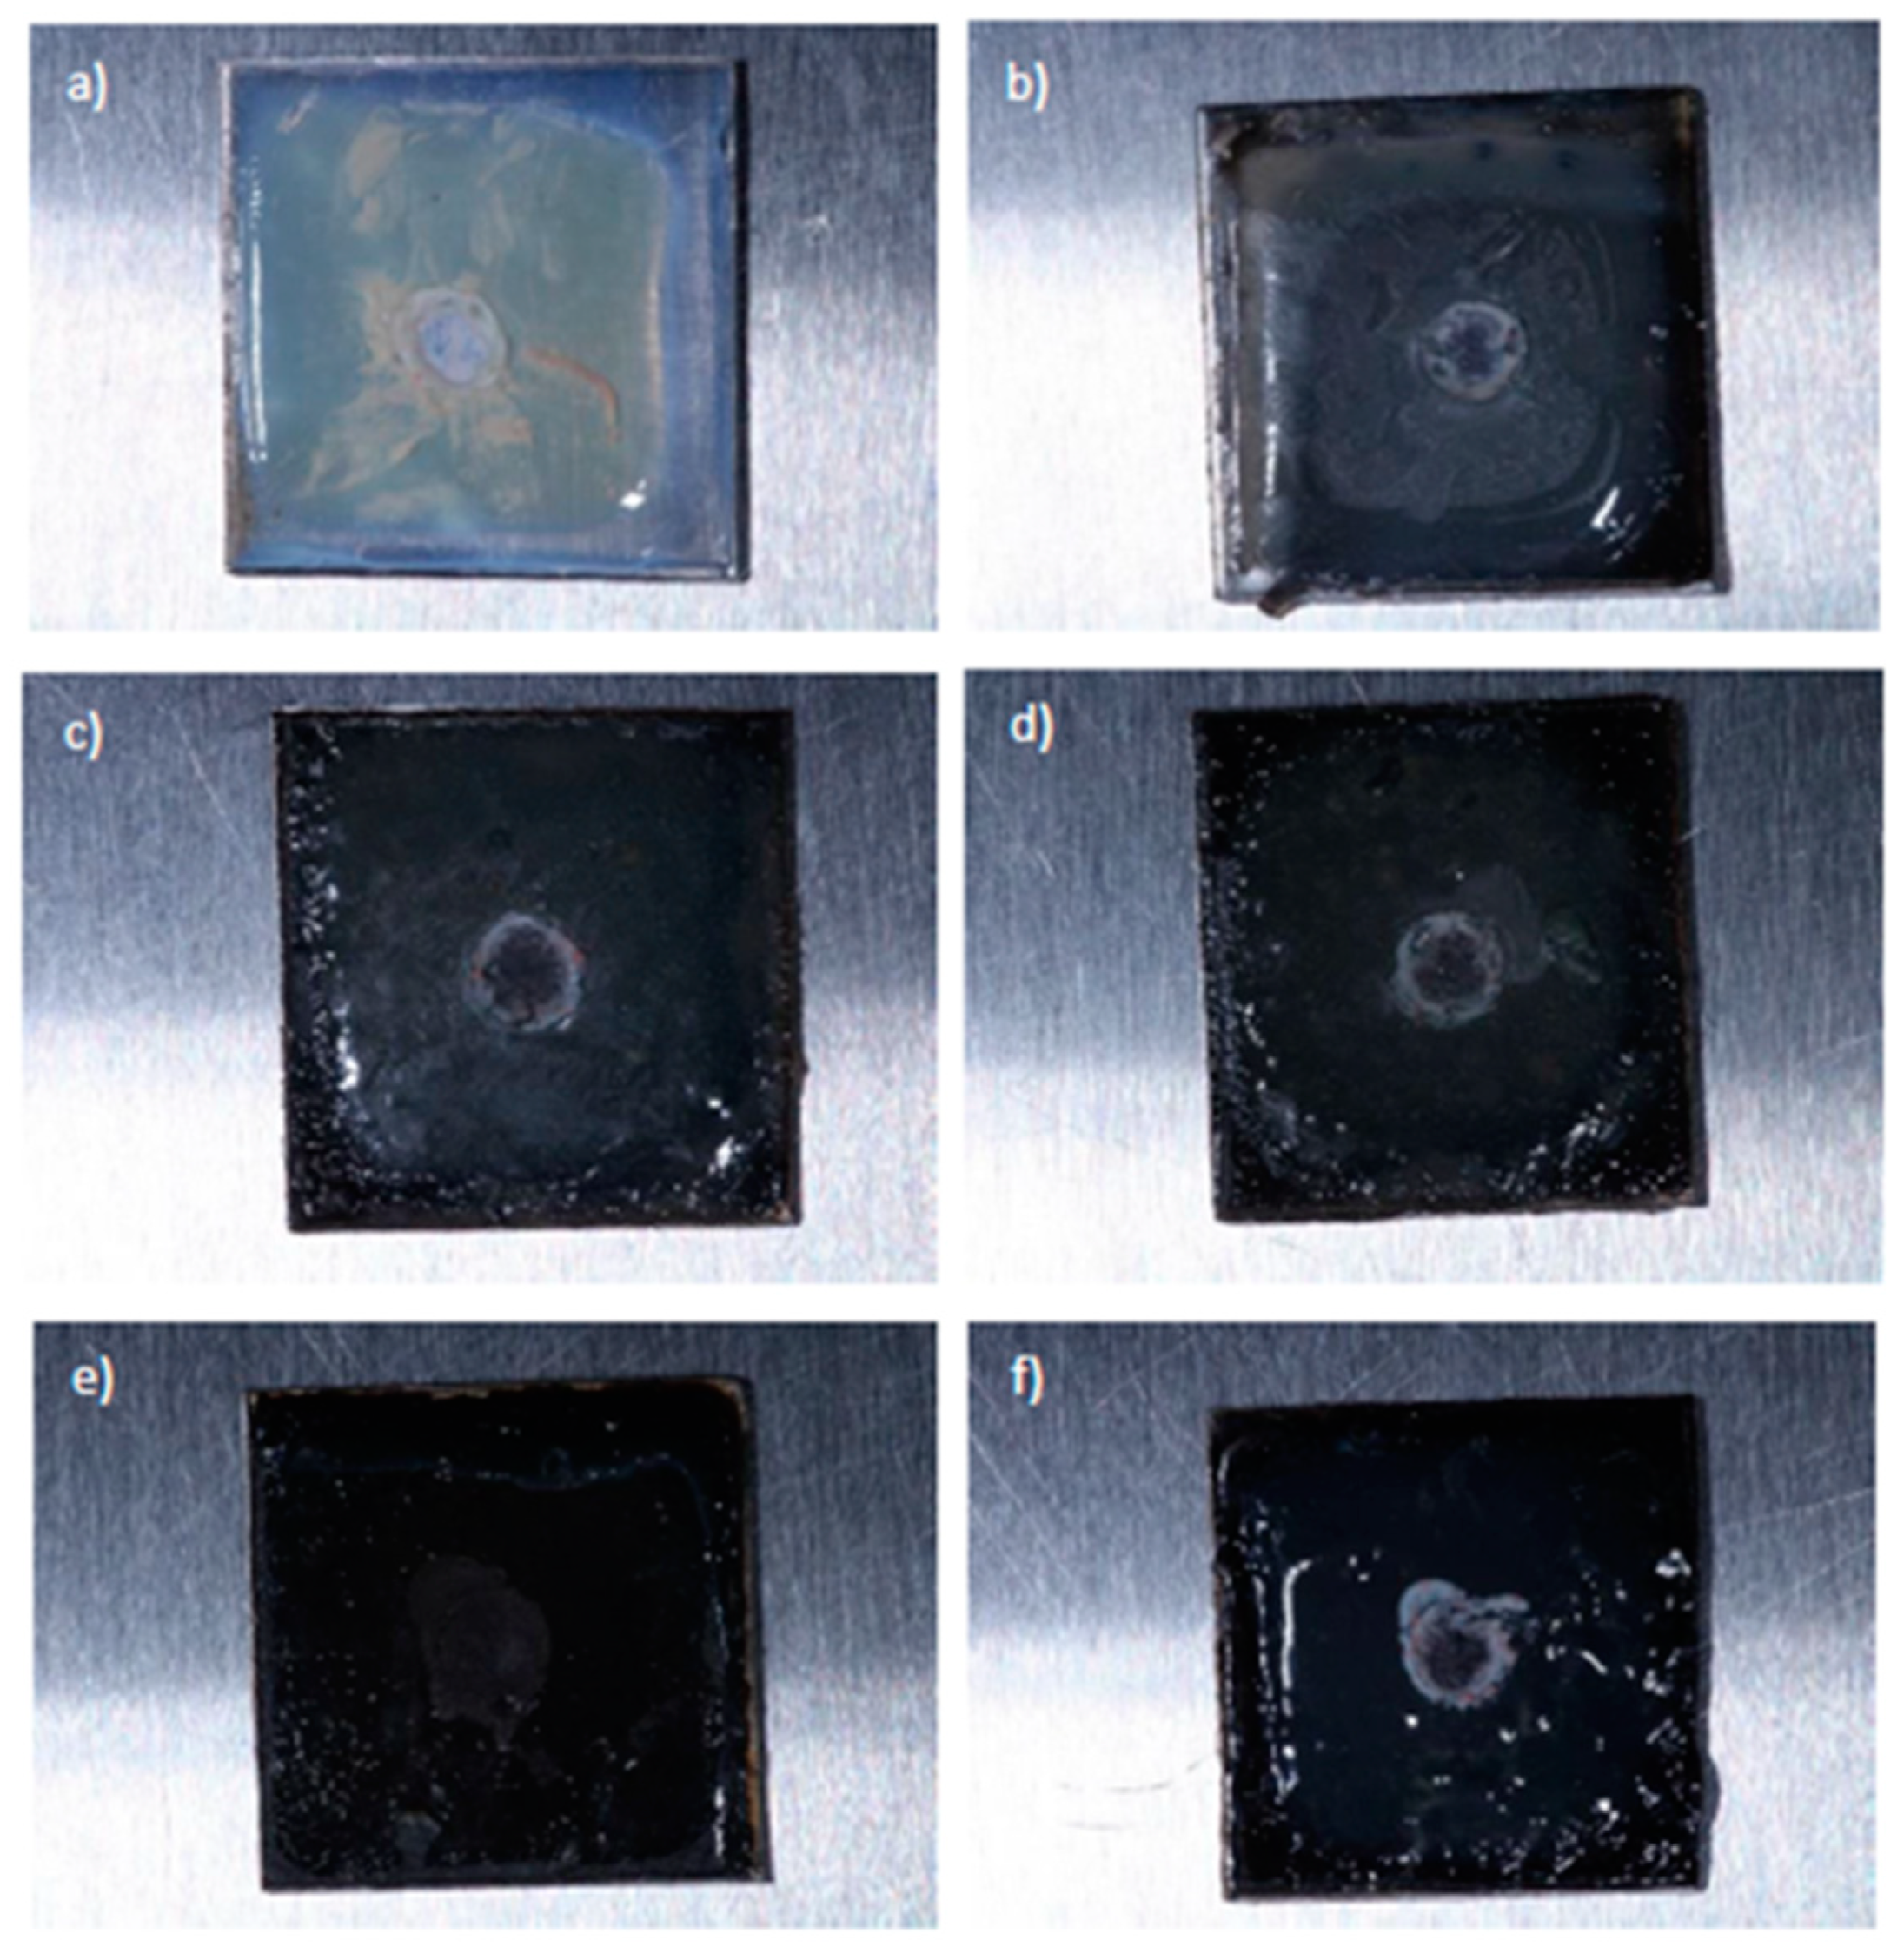
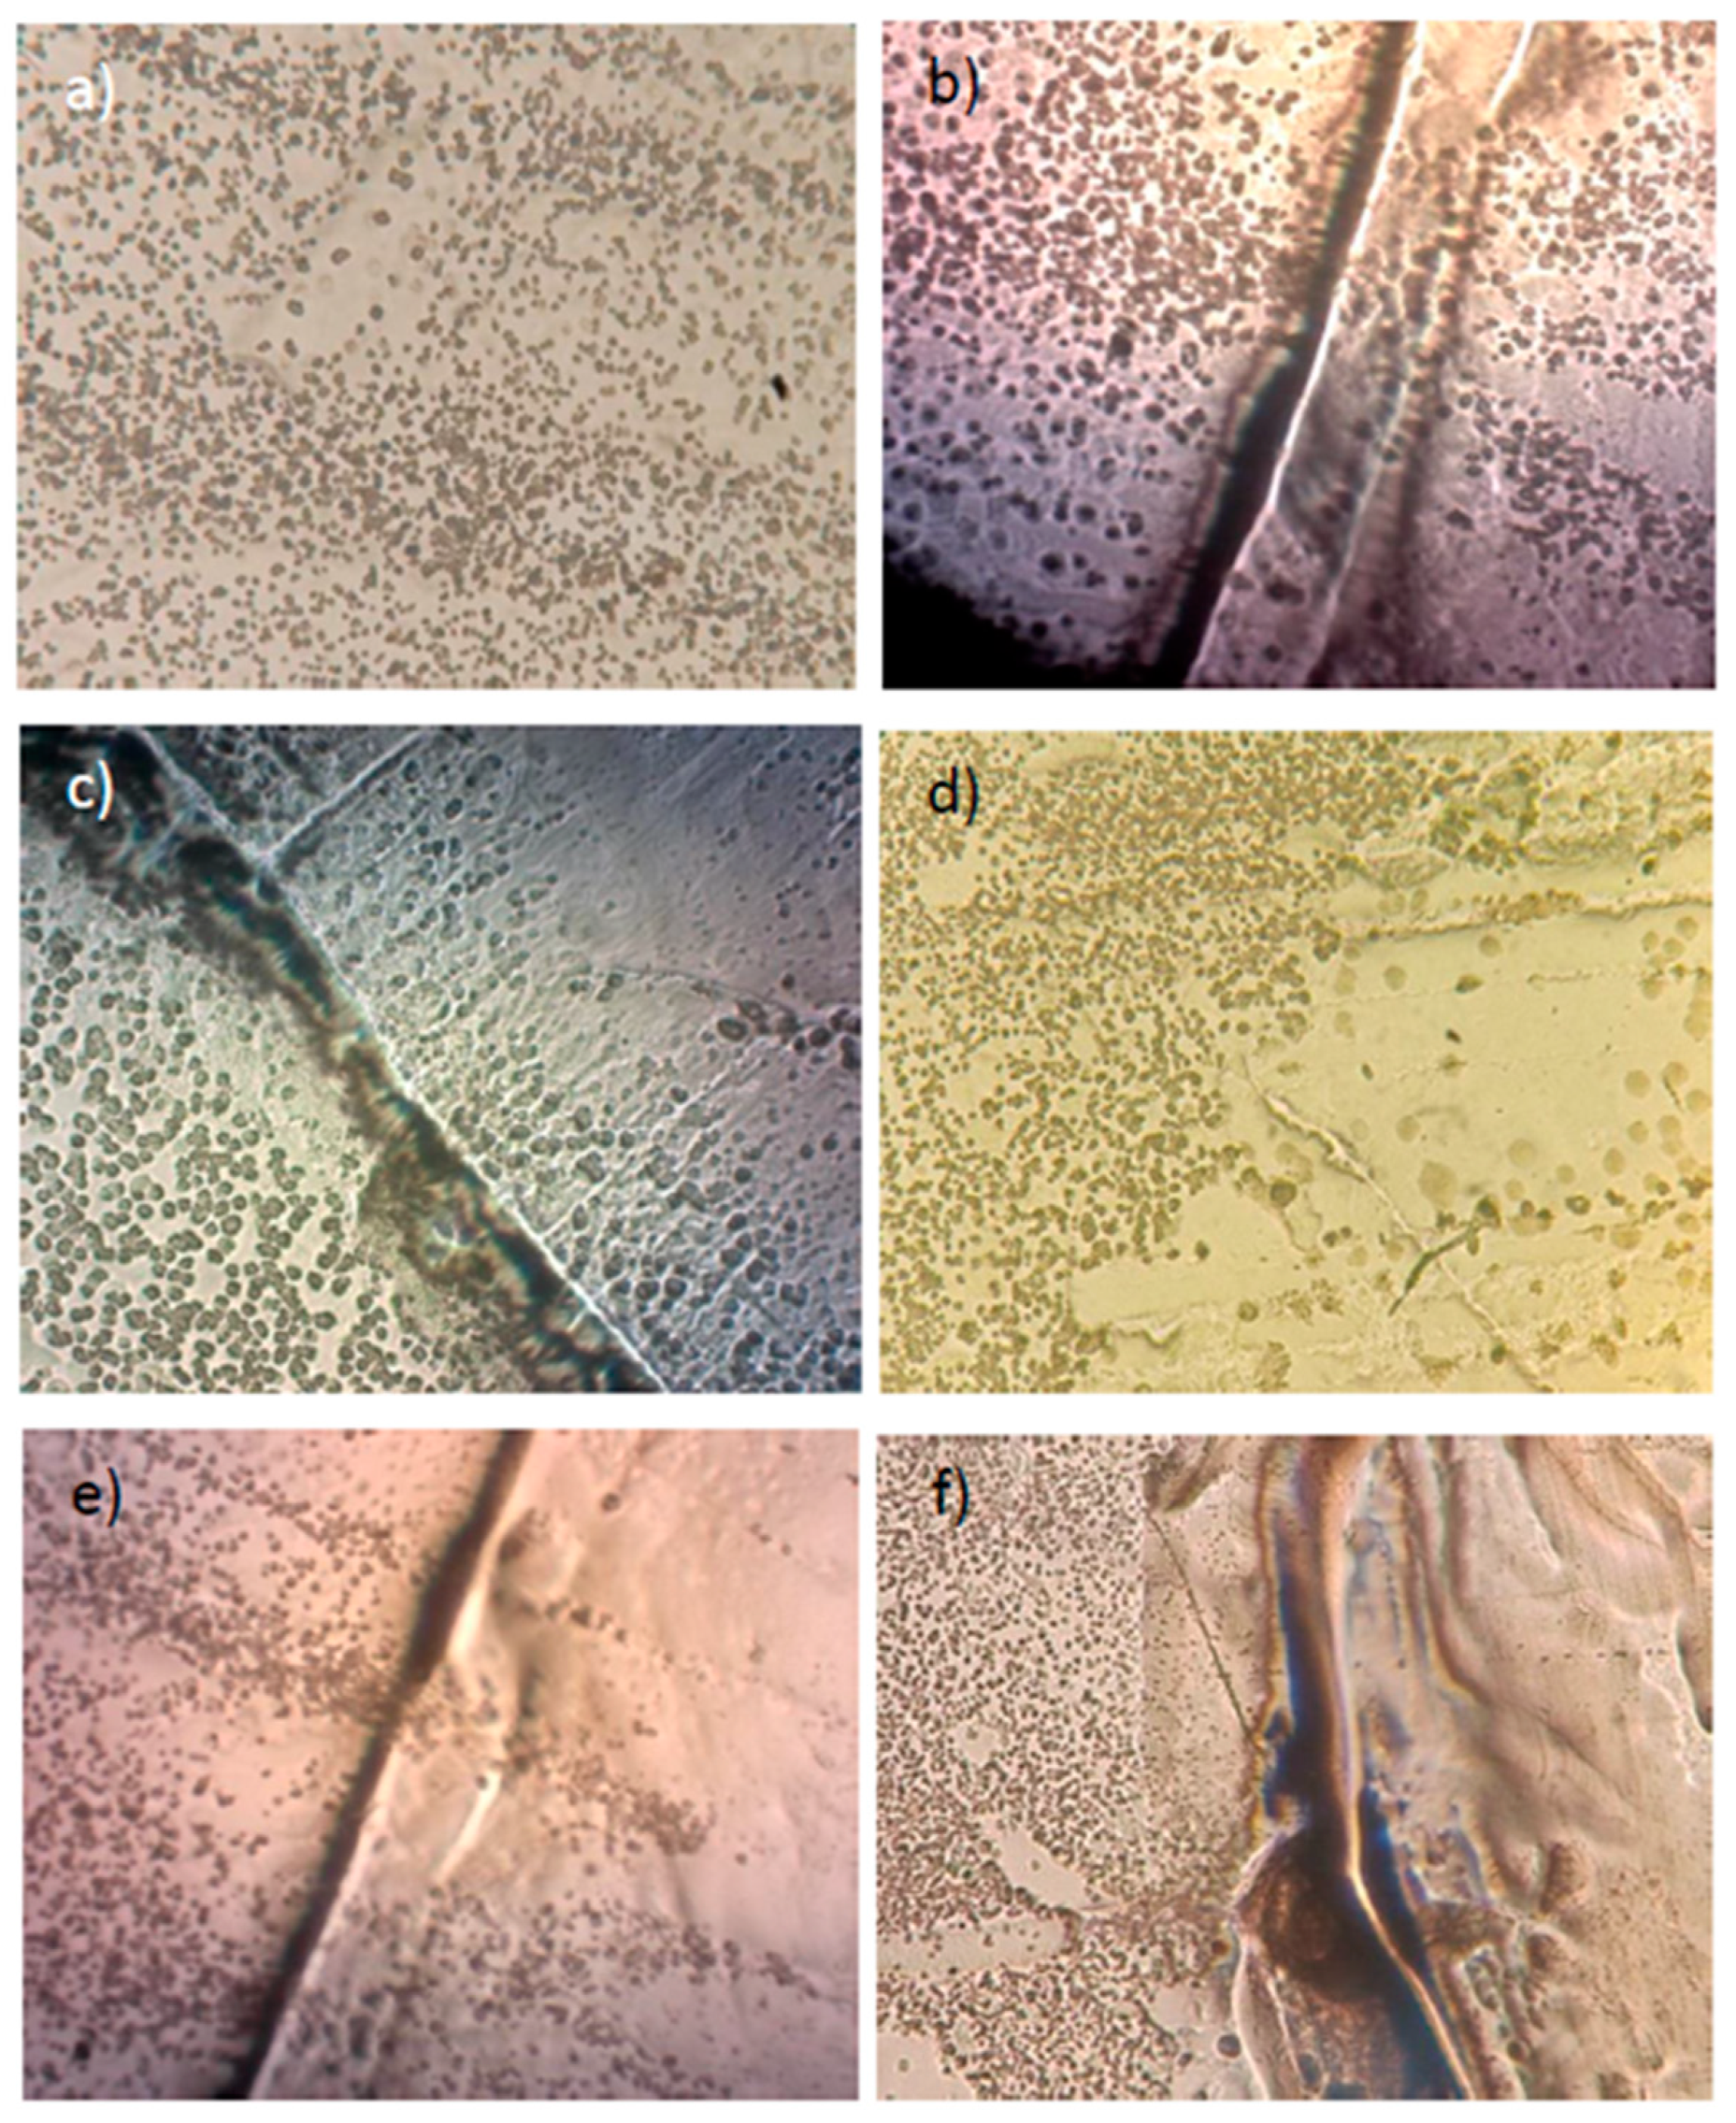
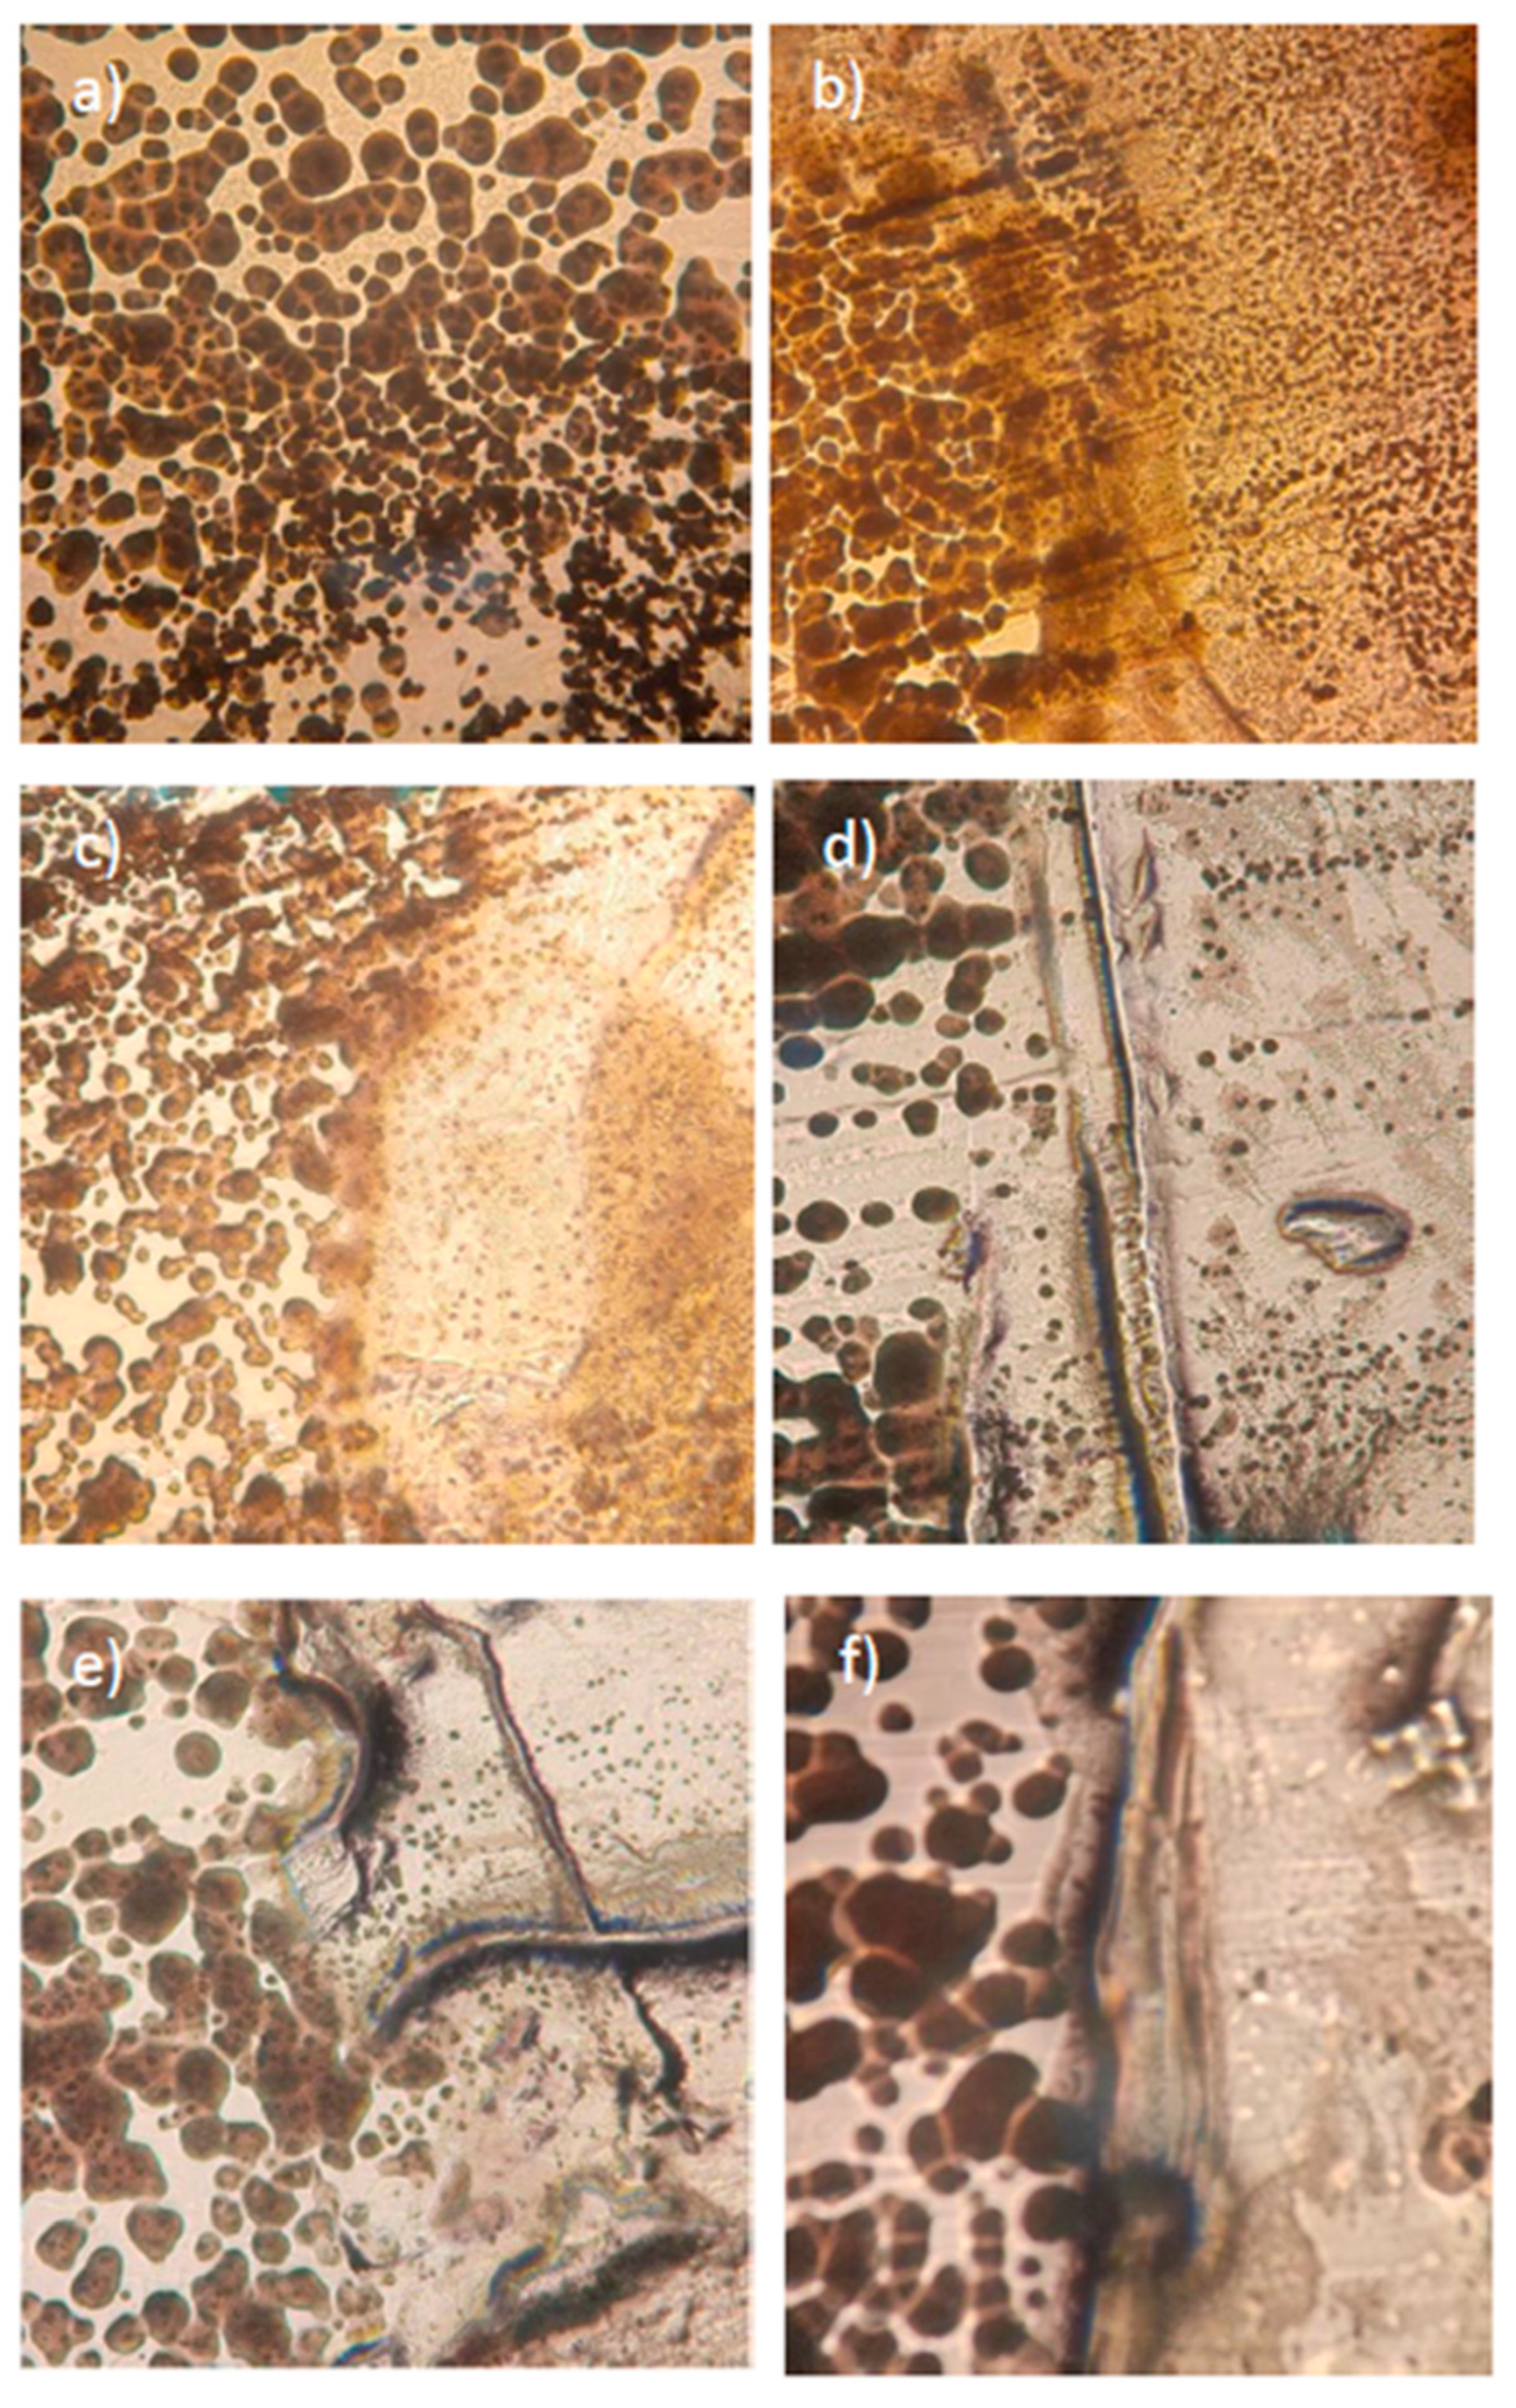
4. Conclusions
Author Contributions
Funding
Institutional Review Board Statement
Data Availability Statement
Acknowledgments
Conflicts of Interest
References
- Jardón-Maximino, N.; Pérez-Alvarez, M.; Cadenas-Pliego, G.; Lugo-Uribe, L.E.; Cabello-Alvarado, C.; Mata-Padilla, J.M.; Barriga-Castro, E.D. Synthesis of Copper Nanoparticles Stabilized with Organic Ligands and Their Antimicrobial Properties. Polymers 2021, 13, 2846. [Google Scholar] [CrossRef] [PubMed]
- Li, Y.; Ning, C. Latest research progress of marine microbiological corrosion and bio-fouling, and new approaches of marine anti-corrosion and anti-fouling. Bioactive Materials 2019, 4, 189–195. [Google Scholar] [CrossRef] [PubMed]
- Yang, W.J.; Neoh, K.-G.; Kang, E.-T.; Teo, S.L.-M.; Rittschof, D. Polymer brush coatings for combating marine biofouling. Progress in Polymer Science 2014, 39, 1017–1042. [Google Scholar] [CrossRef]
- Callow, J.A.; Callow, M.E. Trends in the development of environmentally friendly fouling-resistant marine coatings. Nature Communications 2011, 2, 244. [Google Scholar] [CrossRef] [PubMed]
- Venettacci, S.; Ponticelli, G.S.; Tagliaferri, F.; Guarino, S. Environmental and Economic Impact of an Innovative Biocide-Free Antifouling Coating for Naval Applications. Materials 2023, 16, 748. [Google Scholar] [CrossRef]
- Gu, Y.; Yu, L.; Mou, J.; Wu, D.; Xu, M.; Zhou, P.; Ren, Y. Research Strategies to Develop Environmentally Friendly Marine Antifouling Coatings. Mar Drugs, 2020, 18. [Google Scholar] [CrossRef] [PubMed]
- Cao, S.; Wang, J.; Chen, H.; Chen, D. Progress of marine biofouling and antifouling technologies. Chinese Science Bulletin 2011, 56, 598–612. [Google Scholar] [CrossRef]
- Ao, B.; Du, Q.; Liu, D.; Shi, X.; Tu, J.; Xia, X. A review on synthesis and antibacterial potential of bio-selenium nanoparticles in the food industry. Front Microbiol, 2023, 14, 1229838. [Google Scholar] [CrossRef]
- Calabrese, C.; La Parola, V.; Testa, M.L.; Liotta, L.F. Antifouling and antimicrobial activity of Ag, Cu and Fe nanoparticles supported on silica and titania. Inorganica Chimica Acta 2022, 529, 120636. [Google Scholar] [CrossRef]
- Howell, D.; Behrends, B. A review of surface roughness in antifouling coatings illustrating the importance of cutoff length. Biofouling 2006, 22, 401–410. [Google Scholar] [CrossRef]
- Gittens, J.E.; Smith, T.J.; Suleiman, R.; Akid, R. Current and emerging environmentally-friendly systems for fouling control in the marine environment. Biotechnology Advances 2013, 31, 1738–1753. [Google Scholar] [CrossRef]
- Buskens, P.; Wouters, M.; Rentrop, C.; Vroon, Z. A brief review of environmentally benign antifouling and foul-release coatings for marine applications. Journal of Coatings Technology and Research 2013, 10, 29–36. [Google Scholar] [CrossRef]
- Pistone, A.; Scolaro, C.; Visco, A. Mechanical Properties of Protective Coatings against Marine Fouling: A Review. Polymers 2021, 13, 173. [Google Scholar] [CrossRef] [PubMed]
- Poornima Vijayan, P.; Formela, K.; Saeb, M.R.; Chithra, P.G.; Thomas, S. Integration of antifouling properties into epoxy coatings: a review. Journal of Coatings Technology and Research 2022, 19, 269–284. [Google Scholar] [CrossRef]
- Cioffi, N.; Torsi, L.; Ditaranto, N.; Tantillo, G.; Ghibelli, L.; Sabbatini, L.; Bleve-Zacheo, T.; D'Alessio, M.; Zambonin, P.G.; Traversa, E. Copper Nanoparticle/Polymer Composites with Antifungal and Bacteriostatic Properties. Chemistry of Materials 2005, 17, 5255–5262. [Google Scholar] [CrossRef]
- Zhang, H.; Cao, J.; Sun, L.; Kong, F.; Tang, J.; Zhao, X.; Tang, Y.; Zuo, Y. Comparative Study on the Degradation of Two Self-Polishing Antifouling Coating Systems with Copper-Based Antifouling Agents. Coatings 2022, 12, 1156. [Google Scholar] [CrossRef]
- Pérez-Alvarez, M.; Cadenas-Pliego, G.; Pérez-Camacho, O.; Comparán-Padilla, V.E.; Cabello-Alvarado, C.J.; Saucedo-Salazar, E. Green Synthesis of Copper Nanoparticles Using Cotton. Polymers 2021, 13, 1906. [Google Scholar] [CrossRef] [PubMed]
- Sierra-Ávila, R.; Pérez-Alvarez, M.; Valdez-Garza, J.; Avila-Orta, C.A.; Jiménez-Regalado, E.J.; Mata-Padilla, J.M.; Soto-Castruita, E.; Cadenas-Pliego, G. Synthesis and Thermomechanical Characterization of Nylon 6/Cu Nanocomposites Produced by an Ultrasound-Assisted Extrusion Method. Advances in Materials Science and Engineering 2018, 2018, 4792735. [Google Scholar] [CrossRef]
- Medellín-Banda, D.I.; Navarro-Rodríguez, D.; Fernández-Tavizón, S.; Ávila-Orta, C.A.; Cadenas-Pliego, G.; Comparán-Padilla, V.E. Enhancement of the thermal conductivity of polypropylene with low loadings of CuAg alloy nanoparticles and graphene nanoplatelets. Materials Today Communications 2019, 21, 100695. [Google Scholar] [CrossRef]
- Jardón-Maximino, N.; Cadenas-Pliego, G.; Ávila-Orta, C.A.; Comparán-Padilla, V.E.; Lugo-Uribe, L.E.; Pérez-Alvarez, M.; Tavizón, S.F.; Santillán, G.d.J.S. Antimicrobial Property of Polypropylene Composites and Functionalized Copper Nanoparticles. Polymers 2021, 13, 1694. [Google Scholar] [CrossRef]
- Cota-Ungson, D.; González-García, Y.; Cadenas-Pliego, G.; Alpuche-Solís, Á.G.; Benavides-Mendoza, A.; Juárez-Maldonado, A. Graphene–Cu Nanocomposites Induce Tolerance against Fusarium oxysporum, Increase Antioxidant Activity, and Decrease Stress in Tomato Plants. Plants 2023, 12, 2270. [Google Scholar] [CrossRef] [PubMed]
- Montaño-Herrera, A.; Santiago-Saenz, Y.O.; López-Palestina, C.U.; Cadenas-Pliego, G.; Pinedo-Guerrero, Z.H.; Hernández-Fuentes, A.D.; Pinedo-Espinoza, J.M. Effects of Edaphic Fertilization and Foliar Application of Se and Zn Nanoparticles on Yield and Bioactive Compounds in Malus domestica L. Horticulturae 2022, 8, 542. [Google Scholar] [CrossRef]
- Sariñana-Navarrete, M.d.l.Á.; Morelos-Moreno, Á.; Sánchez, E.; Cadenas-Pliego, G.; Benavides-Mendoza, A.; Preciado-Rangel, P. Selenium Nanoparticles Improve Quality, Bioactive Compounds and Enzymatic Activity in Jalapeño Pepper Fruits. Agronomy 2023, 13, 652. [Google Scholar] [CrossRef]
- Kong, H.; Yang, J.; Zhang, Y.; Fang, Y.; Nishinari, K.; Phillips, G.O. Synthesis and antioxidant properties of gum arabic-stabilized selenium nanoparticles. International Journal of Biological Macromolecules 2014, 65, 155–162. [Google Scholar] [CrossRef] [PubMed]
- Bisht, N.; Phalswal, P.; Khanna, P.K. Selenium nanoparticles: a review on synthesis and biomedical applications. Materials Advances 2022, 3, 1415–1431. [Google Scholar] [CrossRef]
- Khurana, A.; Tekula, S.; Saifi, M.A.; Venkatesh, P.; Godugu, C. Therapeutic applications of selenium nanoparticles. Biomed Pharmacother 2019, 111, 802–812. [Google Scholar] [CrossRef]
- Zhang, A.; Ma, Q.; Wang, Z.; Lu, M.; Yang, P.; Zhou, G. Controllable synthesis of copper selenide nanocrystals through a green paraffin-acetate method. Materials Chemistry and Physics 2010, 124, 916–921. [Google Scholar] [CrossRef]
- Hussain, R.A.; Hussain, I. Copper selenide thin films from growth to applications. Solid State Sciences 2020, 100, 106101. [Google Scholar] [CrossRef]
- Shitu, I.G.; Talib, Z.A.; Chi, J.L.Y.; Kechick, M.M.A.; Baqiah, H. Influence of tartaric acid concentration on structural and optical properties of CuSe nanoparticles synthesized via microwave assisted method. Results in Physics 2020, 17, 103041. [Google Scholar] [CrossRef]
- Liu, K.; Jing, M.; Zhang, L.; Li, J.; Shi, L. Characterization of the phases and morphology in synthesizing Cu2-xSe and CuSe films. Integrated Ferroelectrics, 2018, 189, 71–77. [Google Scholar] [CrossRef]
- Hasanzadeh, I.; Barikani, M.; Mahdavian, A.R. Ultrasound-assisted emulsion polymerization of poly(methyl methacrylate-co-butyl acrylate): Effect of initiator content and temperature. Polymer Engineering & Science 2016, 56, 214–221. [Google Scholar] [CrossRef]
- Avcı, M.Z.; Sarac, A.S. Transparent poly(methyl methacrylate-co-butyl acrylate) nanofibers. Journal of Applied Polymer Science, 2013, 130, 4264–4272. [Google Scholar] [CrossRef]
- Avc, M.Z.; Sarac, A.S. Transparent poly (methyl methacrylate-co-butyl acrylate) nanofibers. J Appl Polym Sci 2013, 130, 4264–4272. [Google Scholar] [CrossRef]
- Al-Ansari, M.M.; Al-Dahmash, N.D.; Ranjitsingh, A.J.A. Synthesis of silver nanoparticles using gum Arabic: Evaluation of its inhibitory action on Streptococcus mutans causing dental caries and endocarditis. Journal of Infection and Public Health 2021, 14, 324–330. [Google Scholar] [CrossRef] [PubMed]
- Sandoval, P.B., Y.; Aragón, M.; Rosas, J.; Ponce, L. Overall Mechanisms that Rule the Active Pharmaceutical Ingredient´s Delivery Process from Hydrophilic Matrices Elaborated with Ether Cellulose. Revista Colombiana de Ciencias Químico Farmacéuticas. 2008, 37, 105–121. [Google Scholar]
- Caro, F.L.; López-Mendoza, J.; Monal, W.; Goycoolea, F.; Carvajal, E.; López, Y. Métodos de Preparación de Nanopartículas de Quitosano: Una Revisión. Biotecnia 2019, 11, 13–25. [Google Scholar] [CrossRef]
- Kumari, A.; Yadav, S.K.; Yadav, S.C. Biodegradable polymeric nanoparticles based drug delivery systems. Colloids and Surfaces B: Biointerfaces 2010, 75, 1–18. [Google Scholar] [CrossRef] [PubMed]
- Calderón, L.L., E.; Harris, R.; López, M.; Acosta, N.; Heras, A. Chemical Properties of Chitosan as a Marine Cosmeceutical. Marine Cosmeceuticals Trends and Prospects, 2011; 39–51. [Google Scholar]
- Aragón, J.; González, R.; Fuentes, G. Cinética de Liberación de Cefalexiana desde un Biomaterial Compuesto por HAP-200/POVIAC/CaCO3. Acad. Nac. Farm., 2009, 75, 345–363. [Google Scholar]
- Tian, Y.; Jiang, L. Intrinsically robust hydrophobicity. Nature Materials 2013, 12, 291–292. [Google Scholar] [CrossRef]
Disclaimer/Publisher’s Note: The statements, opinions and data contained in all publications are solely those of the individual author(s) and contributor(s) and not of MDPI and/or the editor(s). MDPI and/or the editor(s) disclaim responsibility for any injury to people or property resulting from any ideas, methods, instructions or products referred to in the content. |
© 2023 by the authors. Licensee MDPI, Basel, Switzerland. This article is an open access article distributed under the terms and conditions of the Creative Commons Attribution (CC BY) license (http://creativecommons.org/licenses/by/4.0/).


