Preprint
Article

Large Eddy Simulation of Pulsed Film Cooling with Dielectric Barrier Discharge Plasma Actuator

Altmetrics

Downloads

85

Views

23

Comments

0

A peer-reviewed article of this preprint also exists.

This version is not peer-reviewed

Submitted:

16 November 2023

Posted:

01 December 2023

You are already at the latest version

Alerts
Abstract
The effects of the coolant pulsation and the film cooling with the plasma aerodynamic actuation (PAA) could be herein explored via large eddy simulations. The electrohydrodynamic force derived from the PAA was solved through the phenomenological plasma model. The Strouhal number of the sinusoidal coolant pulsation and the averaged pulsation blowing ratio were 0.25 and 1.0, respectively. Comprehensive analyses were carried out on the time-averaged flow fields, and the results revealed that the pulsed cooling jet might cause a deeper penetration into the crossflow, and this phenomenon could be remarkably mitigated by the downward force of the PAA. Furthermore, because of the coolant pulsation, the counter rotating vortex pair (CRVP) expanded to lifted off the wall less well, and the PAA lessened the negative lift-off impact and entrapment from the CRVP. Then, the spatial-temporal development of the coherent structures was figured out by the alterations of the centerline temperature, reflecting formation of the intermittent coherent structures rather than hairpin vortices due to the coolant pulsation, and their size and upcast behaviors were reduced by the PAA. Consequently, there was a basic suppression of the turbulent mixing of the cooling fluid with the crossflow. Finally, the three-dimensional streamlines confirmed that the coherent structure dynamic behaviors were significantly regulated by the PAA for alleviating the adverse influences of the coolant pulsation. In summary, through controlling how the dominating coherent structures evolve throughout time and space, the PAA can effectively increase the pulsed film cooling efficiency.
Keywords: 
Subject: Engineering  -   Aerospace Engineering

1. Introduction

The broad utilization of gas turbine engines is highly advantageous, and their thrust-weight ratio and thermal efficiency are significantly affected by the turbine inlet temperature, which has exceeded 2000K. For the purposes of reducing thermal loading of the gas turbine blades and extending their life time, protection of the turbine blades against extremely hot gases is typically carried out via film cooling. The extraction of coolant from compressor is undertaken in the film cooling, followed by injection of coolant into the hot gas in the blade surface, and the interaction of coolant with the hot gas is made, which may lead to formation of complicated vortex structures. Hence, the film cooling is a convective heat transfer problem dominated by the vortex structures, especially the major counter rotating vortex pair (CRVP) lifts the coolant off the wall surface and entrains the hot gas beneath the coolant, resulting in a greatly reduction of the film cooling efficiency (FCE). Therefore, improving the FCE through controlling the vortex structures of the film cooling is crucial for gas turbine engines.
Scholars have presented diverse strategies to enhance FCE, and among these, the employment of shaped cooling holes emerges as a particularly efficacious. Goldstein et al. [1] originally found that the film cooling efficiency could be noticeably improved using fan-shaped holes, which could enhance the adherence and the lateral coverage of the coolant. Thereafter, numerous scholars have concentrated on the shaped holes and proposed various shaped holes. Later, Bunker et al. [2] reviewed the origins of the classical shaped film cooling holes and summarized the concerning knowledge of the shaped film cooling holes, and demonstrated that the shaped film cooling hole also had some drawbacks (e.g., high aerodynamic mixing losses). Recently, it was attempted [3] to further figure out the effects of inclination angle, expansion angle, and length of inlet cylindrical section on the FCE of the fan-shaped holes, and reported that the changes of geometrical parameters could significantly affect the FCE. Other than the shaped holes, auxiliary mechanisms devices were suggested in order weaken the destructive features of the vortex structures for enhancing the FCE. The double-jet holes were invented with compound angles to improve the FCE, and it was revealed that the CRVPs of the double-jet hole were mutually interfered and counteracted with each other, thereby enhancing the FCE, while the double-jet holes required a reasonable arrangement [4]. In order to stop the CRVP development by forming another vortex group, a ramping vortex generator was positioned downstream from the cooling hole. As a result, the cooling fluid was positioned near the wall surface and extended downstream [5]. Recently, the film cooling performance (FCP) of a novel furcate hole was examined, and it was found that the lateral coverage of the coolant was more comprehensive than that of the traditional cylindrical holes [6].Generally, the previously mentioned approaches constitute passive flow control techniques, yet their effectiveness is inherently restricted. The dynamic nature of film cooling flow highlights the need for an active film cooling control methodology, which is a flow control method that can make modifications in real-time during different flow phases.
Scholars attempted to propose pulsed film cooling to optimize the film cooling efficiency. Ekkad et al. [8] firstly used solenoid valves to directly control the cooling jet for improving the FCE, and found that the effects of pulsed jets on film cooling showed promising outcomes. Thereafter, the FCE and flow field temperature were examined at different BRs for a variety of pulsing frequencies and duty cycles, and it was revealed that pulsing at high frequencies was beneficial to reduce overall jet lift-off in some cases, thereby improving the FCE, whereas pulsing at low frequencies tended to produce the adverse effect [9]. The influences of duty cycle and Strouhal number on the pulsed FCE, particularly at high BRs were numerically figured out [10], and it was observed which pulsing significantly decreased the recirculation region, leading to the increment of the FCE. Multiple scholars [11] examined how pulsed film cooling affected the heat flux in the turbine blades, and superiority of the steady film cooling was to the pulsed film cooling at low BRs was confirmed, while pulsed film cooling could be beneficial at high BRs, confirming the flat plate film cooling. The LES was employed to indicate how the square-wave pulsating film cooling jet could be interacted with recirculation vortexes, and the noticeable role of entraining recirculation vortexes in the near-wall region (NWR) was figured out [12]. In recent years, the coolant pulsation, as one of the active control techniques, has exhibited a great efficiency that could improve the FCE, while further clear conclusive outcomes are essential [13], and evidence is required to prove the role of coolant pulsation in enhancing the FCE. It is noteworthy that the hot gas unsteadiness would inevitably cause coolant pulsation in the real engines, as well as the large-scale pulsed film cooling vortex structures were more complicated than those of the steady film cooling. Therefore, exploring active flow control techniques to effectively improve the pulsed FCE may be advantageous for the gas turbine engines.
There are many fields where the dielectric barrier discharge (DBD) plasma actuator (DBDPA) is being effectively used [14,15]. Yang et al. [16] assessed the influence of the DBDPA on the whole spatial-temporal development (STD) of flow field in quiescent air. For the purpose assessment of integrating the plasma and fluid dynamics, the phenomenological model and First-principles-based model of the DBD were proposed, facilitating the integration of multi-dimensional plasma dynamics with the fluid dynamics [17]. Thus, the phenomenological model appeared highly advantageous. Hence, Roy and Wang [17,18] firstly utilized the DBD PAA to improve the film cooling efficiency, and numerical findings revealed the actively alteration of flow structures by the plasma aerodynamics near the DBDPA, thereby inducing attachment of the coolant to the wall surface. Later, He et al. [19,20,21] greater understanding of the PAA mechanism for increasing the FCE by examining the impacts of the location, energy information, quantity, and shape of the DBDPA on the FCP. Lately, Dolati et al. [23] employed neural networks to generalize the complicated communication that involved variables (e.g., flow, geometric and electrical variables), thus gaining a useful correlation with different input-output parameters. Accordingly, Audier et al. [24] explored the ability of the PAA for the film cooling efficiency enhancement through an experimental set-up, and the experimental results confirmed the advantages of the PAA for improving the film cooling efficiency, as predicted by the abovementioned numerical findings. More recently, it was demonstrated that the PAA could actively control the large-scale coherent structures (LSCSs), as well as the coherent structure reduced in size and number, making them beneficial for the film cooling [25,26]. In general, the promising potentials of the PAA for the film cooling efficiency enhancement has been well demonstrated in the film cooling numerically and experimentally. However, it is essential to indicate how the PAA can control a pulsed film cooling.
In the current research, the pulsed film cooling flow coupled with the PAA was simulated via LES, and then, comparative evaluation of the time-averaged flows was made in an effort to identify the full impact of both the PAA and coolant pulsation on the efficiency from film cooling. In order to provide more insight into how coolant pulsation and PAA may affect the coolant-gas interaction, the STD of these LSCSs was then measured.

2. Domain of computation and boundary conditions (BCs)

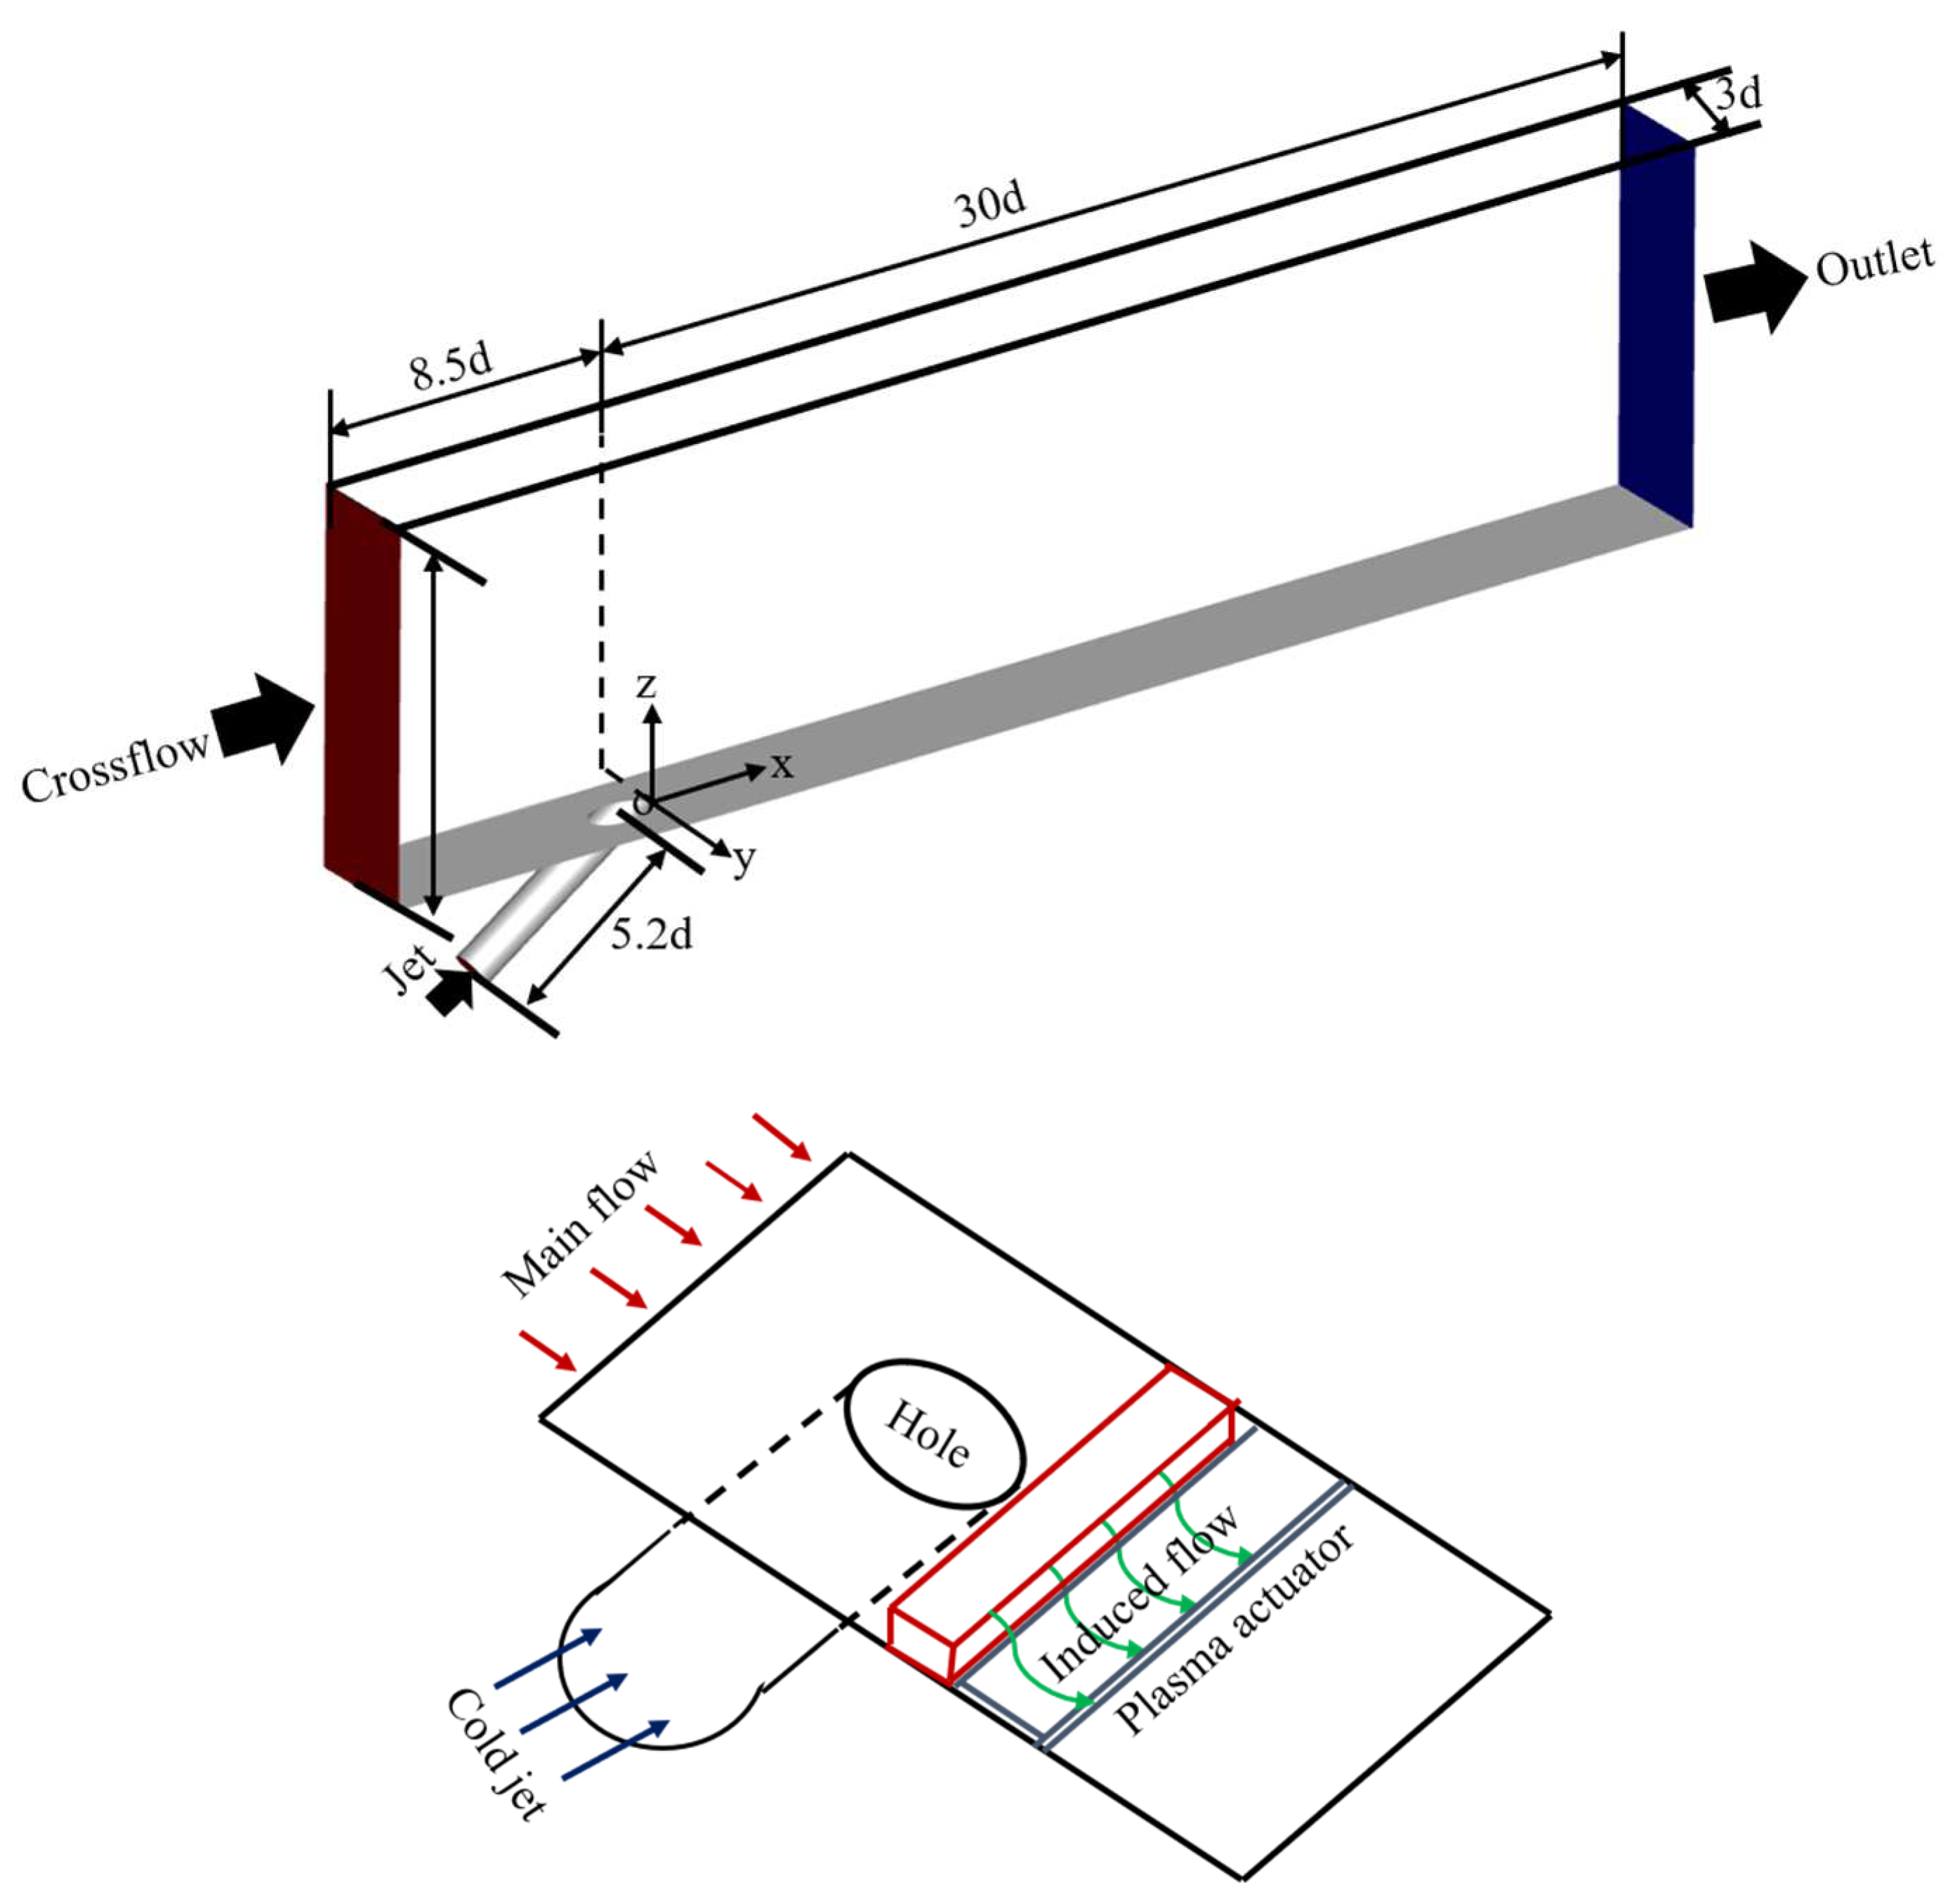
The research of Kohli and Sinha et al. [27,28] served as the basis for defining the computational domain for the current investigation. Figure 1 shows the computational domain of the film cooling and the arrangement of the DBDPA, and the computational domain consisted of a cooling hole (diameter of the cooling hole (d = 12.5 mm), its length (5.2 d), and the streamwise angle of the cooling hole (35°)) and a crossflow channel. The height, width, and length of the crossflow channel were 10 d, 3 d, and 38.5 d, respectively. The cooling hole exit’s trailing edge was considered to place the Cartesian coordinate system’s origin, and the computational domain's streamwise, lateral, and normal directions were denoted by x-, y-, and z-axis, respectively. At the end of the cooling hole is where the DBDPA is placed.
The ANSYS CFD software was utilized for generating hexahedral meshes of the computational domain (Figure 2). Near the flat plate's walls and the cooling hole, the grid points are incredibly finely tuned, and y+ of the first layer mesh near the walls was less than 1.0. To avoid generation of excessive meshes, the stretching factor was about 1.05 in the wall-normal direction, and about 7 million meshes could be generated.
The BCs utilized in the current research were consistent with those presented in Kohli and Sinha et al.’s research [27,28], in which the crossflow atmosphere was ambient and the cooling jet was the mixture of CO2 and N2 at the temperature of 188 K. At the crossflow channel inlet, the boundary conditions were set, taking into account variables such as the velocity of the crossflow (u=20 m/s), temp 298 K, as well as border layer thicknesses 1.0 d. At the crossflow channel outlet, an effort was made to provide pressure-outlet boundary conditions that included static pressure 101325 Pa, Reynolds number 15625, and kinematic viscosity 1.6×10⁻⁵m2/s. Periodic conditions were imposed along the lateral direction of the crossflow channel to take into consideration how it affects from adjacent cooling jets. For every wall, adiabatic and non-slip conditions were assigned.
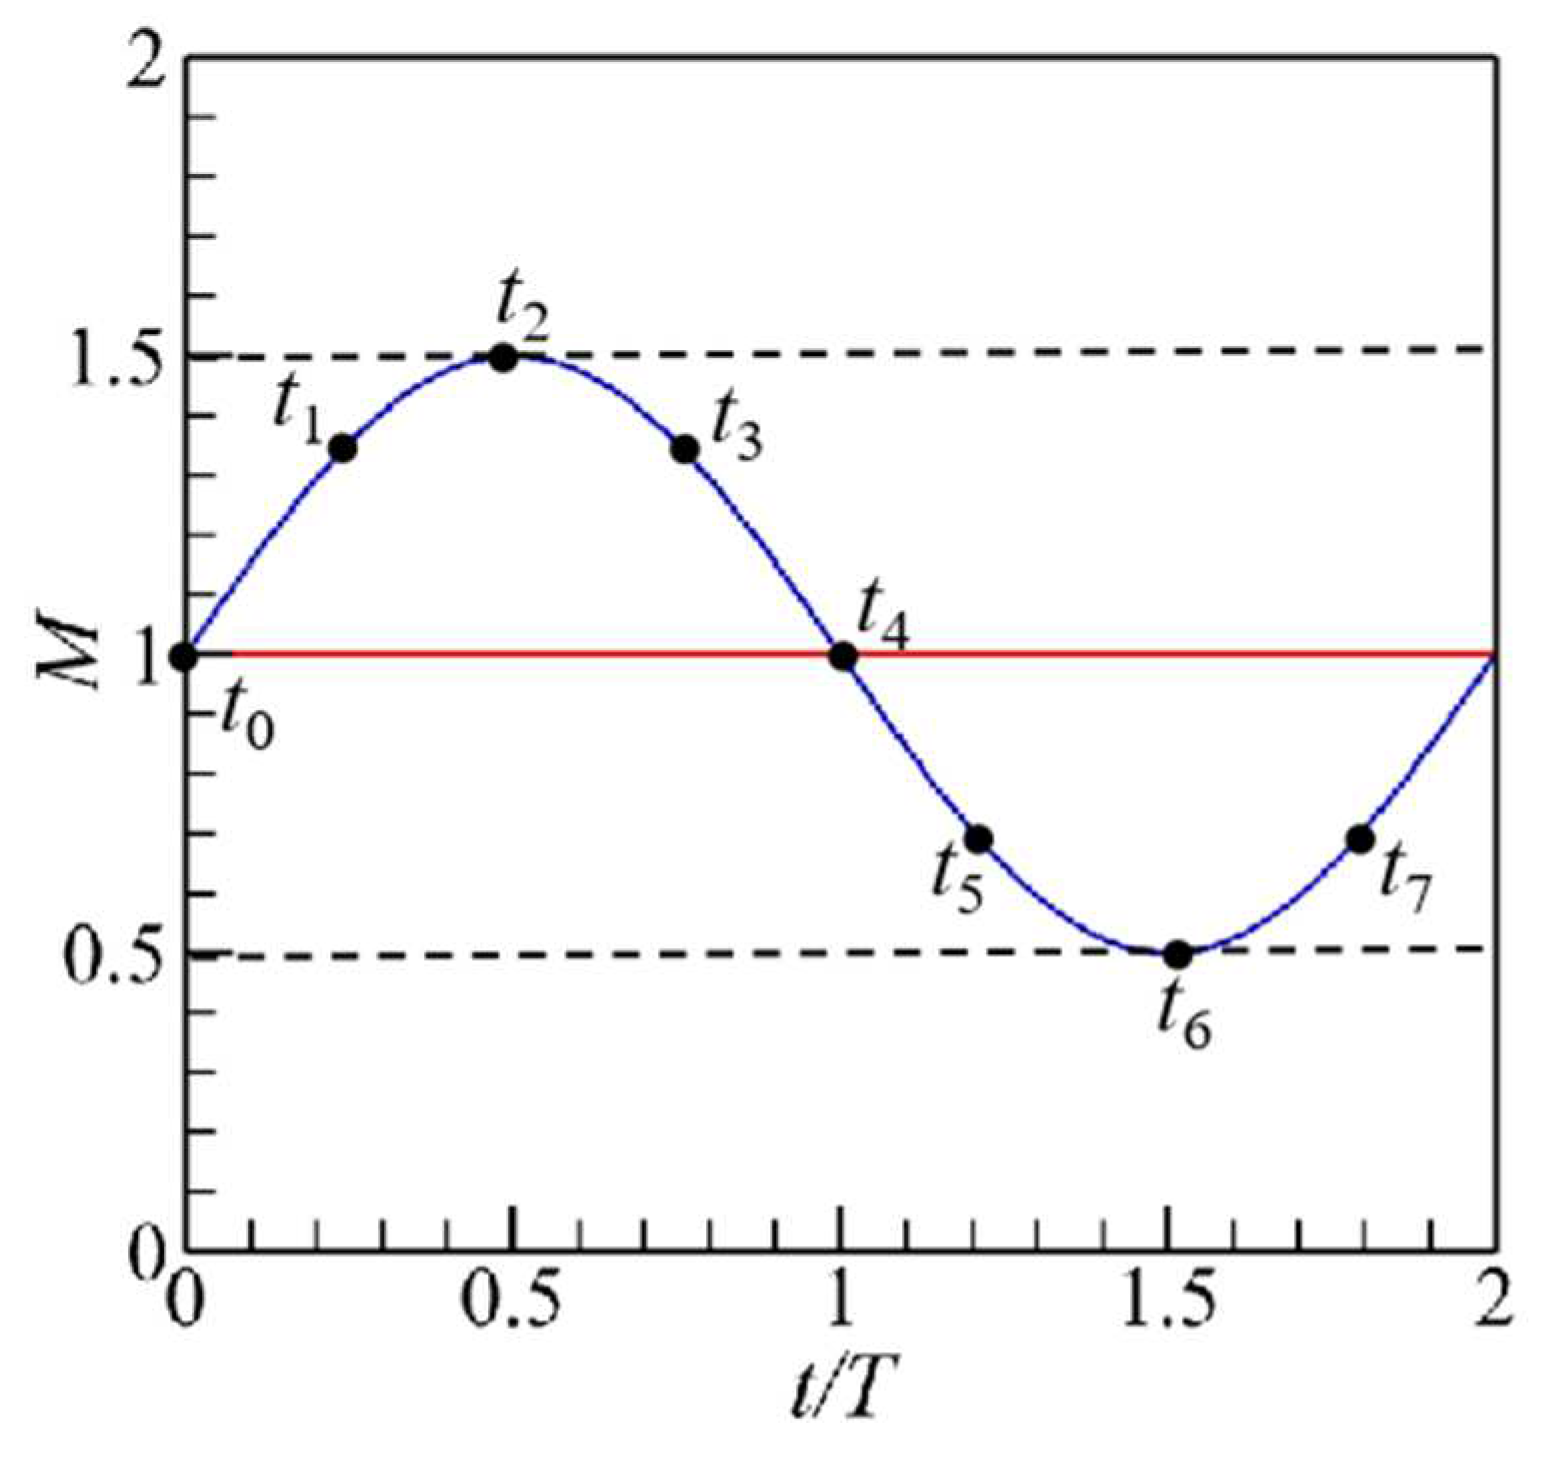
The density ratio (DR) was equal to 1.6 (ρc/ρ), application of the velocity-inlet boundary occurred at the cooling hole's inlet, and the adjustment od coolant inlet velocity was on the basis of BR (M = ρcuc/ρu). For the un-pulsed film cooling, the BR was 1.0, thus, 12.5 m/s was allocated to the cooling jet velocity (uc). For the pulsed film cooling, the total amount of the coolant was the same as the un-pulsed film cooling in an operating cycle, thus, the time-averaged BR of the pulsed film cooling was 1.0, and the BR was in the range of 0.5-1.5 in a cycle (Figure 3). Therefore, the cooling jet velocity was specified as uc(1.0+0.5sin(2πft)), where f is the pulsation frequency of the cooling jet. The Strouhal number (St) of the coolant pulsation was defined as St=df/u, and St was set to 0.25.
The asymmetric installation of the DBDPA was carried out at cooling hole exit’s downstream (x/d=0.0). The widths of the exposed electrode and covered electrode were 5 and 10 mm, respectively, l=0.25 mm was indicative of the gap between the two electrodes, and a noticeable number of polyimide films were involved in dielectric barrier. The length of the two electrodes was 3d to avoid the restriction on the plasma generation along the lateral direction. The power supply of the DBDPA had a high frequency (6.0 kHz) and a high voltage (8.0 kVpp), so an estimate of the electrohydrodynamic (EHD) force of roughly 2 kN/m3 was made, that is consistent with an amount that had been previously obtained. [27,28] and no power consumption was taken into account. Notably, two thin copper electrodes were involved in the DBDPA (thickness, 440 μm), therefore, the geometric effects of the DBDPA were herein regarded.
3. phenomenological plasma model
The LES can directly solve the LSCSs and simulate the sub-grid scale vortex structures via sub-grid model approximately, thus, the influences of the pulsation and the PAA on the LSCSs can be perfectly figured out, dominating the coolant-hot gas interaction. The Algebraic Wall-Modeled LES (WMLES) model [29] was herein employed to assess the subgrid scale dynamic effects, where the equation can be expressed as
ρ t + x j ( ρ u j ) = 0
t ( ρ u i ¯ ) + x j ( ρ u i u j ¯ ) = x j ( σ i j ) P ¯ x i τ i j x j + F i
t ( ρ E ¯ ) + x j ( ρ u j ¯ E ¯ ) = p ¯ u j ¯ x j + x i u i ( σ i j τ i j ) x j ( λ T ¯ x j ρ v s g s Pr s g s T ¯ x j )
In the equation (2), the subgrid-scale and viscous stress terms are defined as τ i j = ρ u i u j ¯ ρ u i u j ¯ and σ i j = [ μ ( u i ¯ / X j + u j ¯ / X i ) ] 2 / 3 δ i j μ ( u k ¯ / X k ) respectively. In the equation (3), the eddy viscosity is defined as v s g s = min [ ( k d w ) 2 , ( C S m a g Δ ) 2 ] S { 1 exp [ ( y + / 25 ) 3 ] } , and more detailed parameters can be found in Ref. [29]. Fi is the EHforce vector generated by the DBDPA.In the following sections, an attempt will be made to describe the phenomenological plasma model.
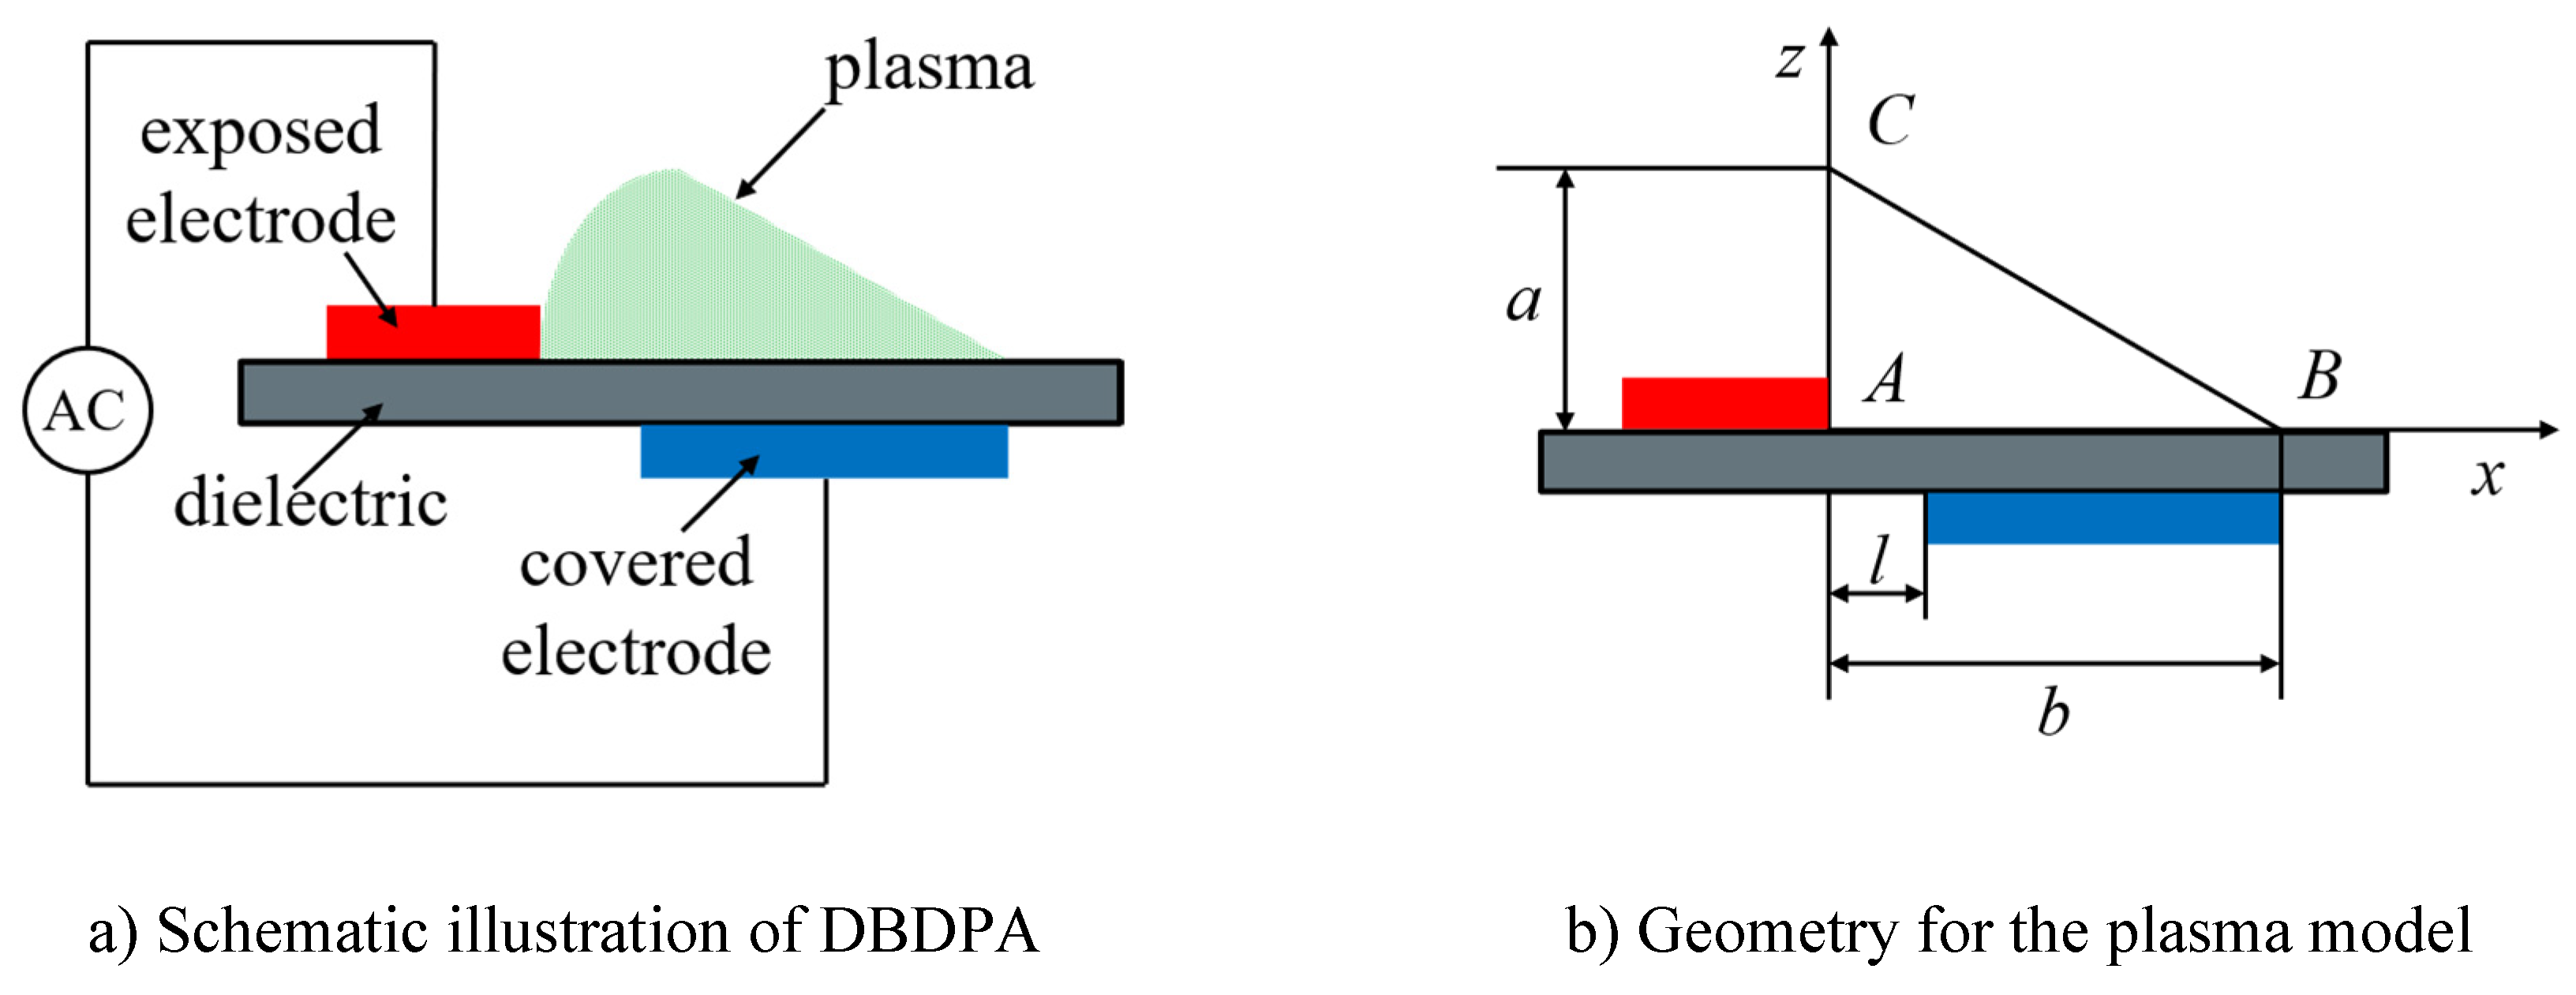
A typical DBDPA is schematically illustrated in Figure 4, which comprises a pair of electrodes positioned on the wall surface and separated by a dielectric barrier. Following the application of a strong voltage alternation to the exposed electrode, a non-thermal plasma barrier forms upon the covered electrode and the surrounding air is weakly ionized as a result of the barrier discharge [30]. It was previously revealed that EHD forcegenerated by the DBDPA is the main mechanism of active flow control [31]. The Shyy et al.’s phenomenological plasma model [32] was herein utilized to account for the EHD force, neglecting the momentum collision between the charged particles and the airflow. Hence, less computational resources are essential for this model and it was successfully exerted to diverse plasma-based flow control applications [33]. Film cooling flows were herein simulated via LES requiring numerous demands upon computational resources, confirming the appropriateness of the phenomenological plasma model for solving the EHD force [34]. The plasma occurs mainly in a tiny region just downstream the exposed electrode and over the covered electrode (Figure 4a). Therefore, it was assumed that the DBDPA-generated EHD force acts on the airflow only in the triangular region ABC, whose height and length were denoted by a and b, respectively (Figure 4b). The point A was the location of maximum electric field intensity (E0 = Vpp/l), where l is the space between the two electrodes in the x-axis. The linear decrease of electric field intensity is achievable with its movement from the source A, and the electric field intensity fluctuates that can be formulated as
E = E 0 k 1 x k 2 z
In equation (4), the field strength of Eb=30 kV/cm is employed to assess k1=(E0-Eb)/b and k2=(E0-Eb)/a at the plasma boundary. Hence, the electric field intensity components in diverse directions are formulated as
E z = E k 1 / k 1 2 + k 2 2   .   E x = E k 2 / k 1 2 + k 2 2
The plasma discharge occurs at only one-half cycle, and the time tp is about 67 μs during which the plasma formation, thus, the EHD force components in the x and z directions can be formulated as
F e x = ζ ρ e e E x ϑ t p   .   F e z = ζ ρ e e E z ϑ t p
where ρe=1017/m3 is the electron number density, ϑ=6.0kHz is the applied voltage frequency, and ζ is the collision efficiency explanatory factor. High frequency of the plasma discharge (6.0 kHz) is correlative with the EHD force acting on the airflow as a constant, and therefore, the DBDPA-generated EHD force is assumed as a steady-state body force acting on the film cooling flow.
User-defined function (UDF) was employed to add EHD force components (i.e., body force terms) into the momentum equations, carrying the effects of the plasma discharge on the film cooling. The pressure interpolation was undertaken via the body force weighted scheme. The momentum and energy equations were solved discretely using bounded central scheme and second-order upwind scheme, respectively. The solvation of transient equations was carried out by the bounded second-order implicit scheme (time step, 1.0×10⁻⁵ s; maximum number of iterations, 40/time step). When a quasi-steady state could be reached by the film cooling flow, six cycles were allocated to the flow field to obtain time-averaged statistical information, where one cycle was shown by the time that it took the crossflow across the flow path.
The adiabatic film cooling efficiency was herein formulated as
η ( x / d , y / d ) = ( T T aw ( x / d , y / d ) ) / ( T T c )
The adiabatic FCE was tried to be averaged along the whole lateral length for a lateral-averaged FCE, which could be written as
η lat = 1 3 1.5 1.5 η ( x / d , y / d ) d ( y / d )
The UBL case was representative of un-pulsed film cooling flow, the PBL-off case and the PBL-on case represent the on/off switch of DBDPA, respectively, in the current research.

4. Validation of the model

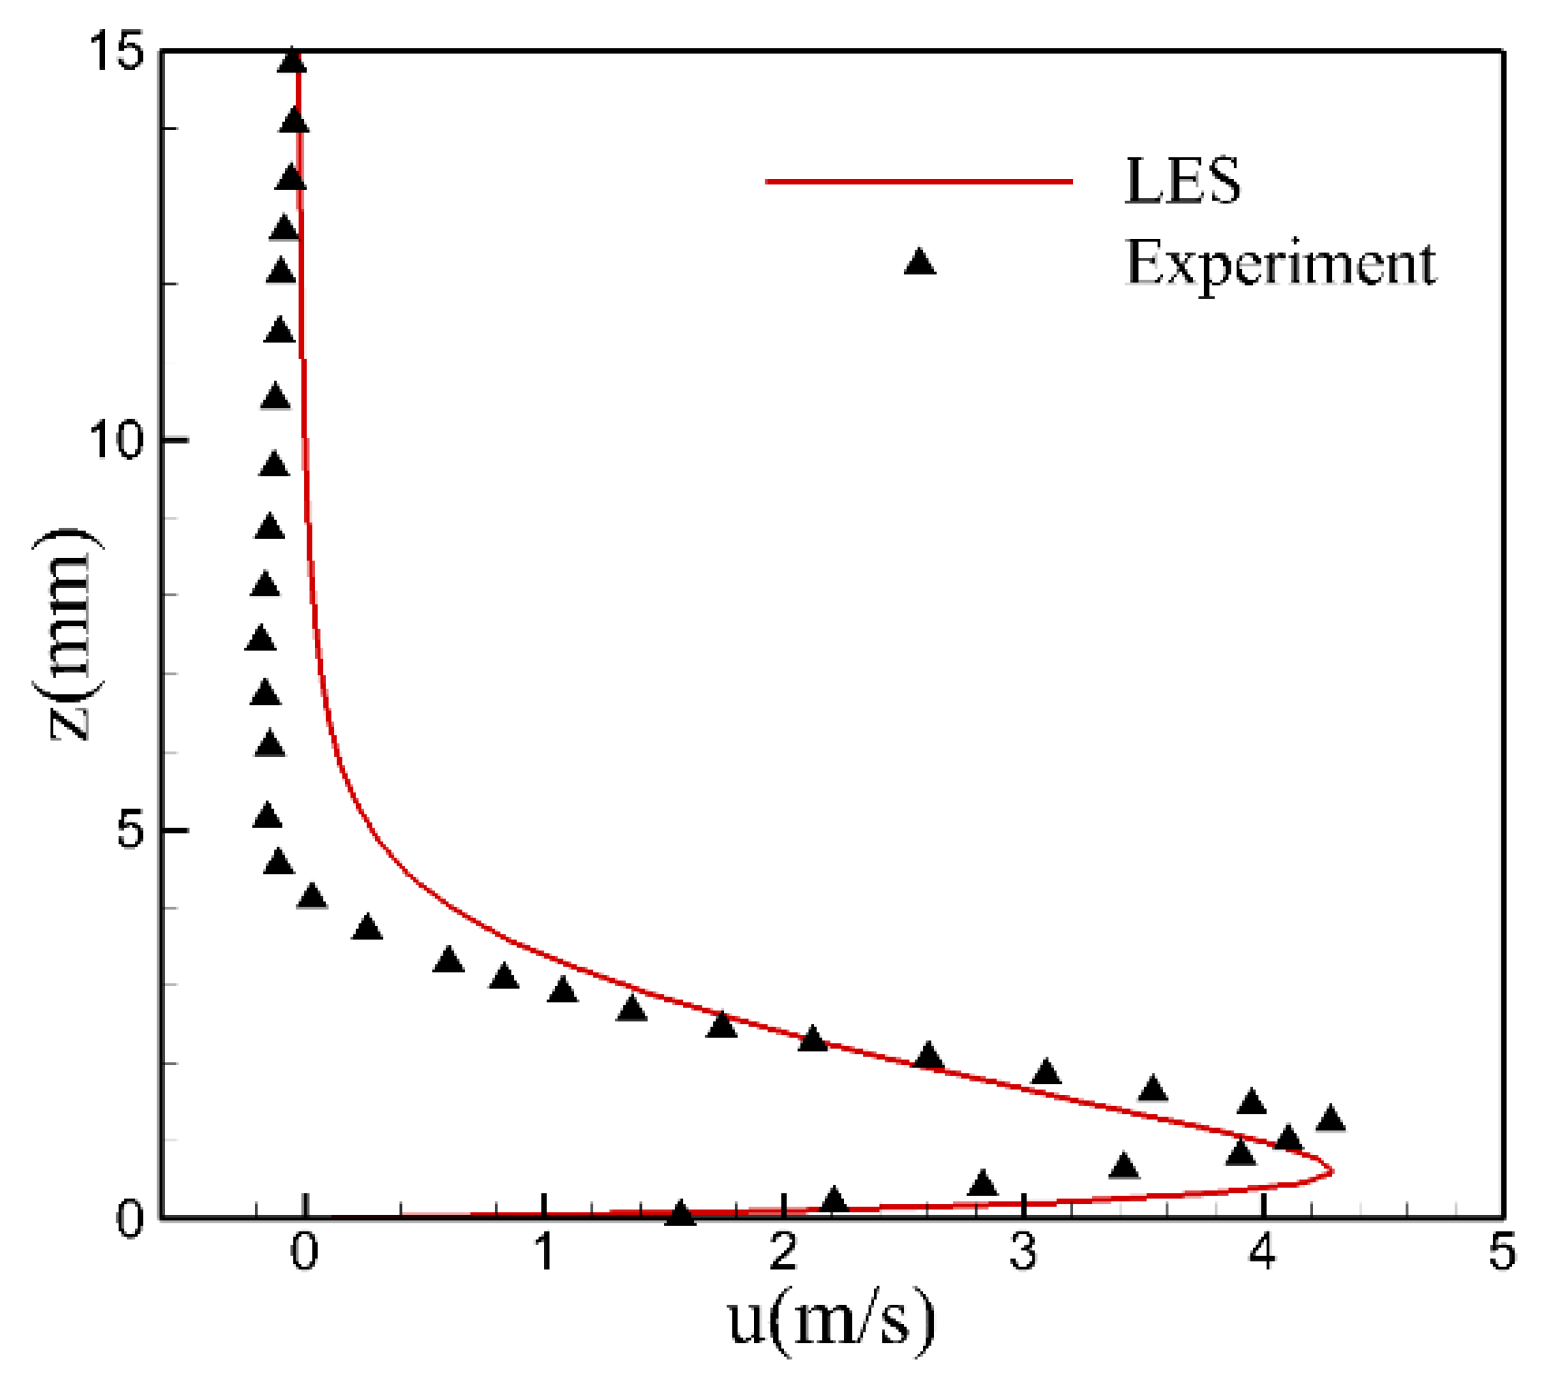
To confirm that the model used in this investigation is reliable, the streamwise velocity profile of the numerical simulation results is compared with the results of shyy et al. [32]. Figure 5 shows that the comparison of the numerical streamwise velocity and the experimental data, it can be seen that the maximum value of the streamwise velocity predicted by the phenomenological model is well agree with the experimental data, and the vertical perturbation range affected by the DBD plasma is about 3mm, which is in good agreement with the experimental measurement. As a result, the phenomenological model employed in this study is capable of precisely forecasting the impact caused by DBDPA with the flow field.
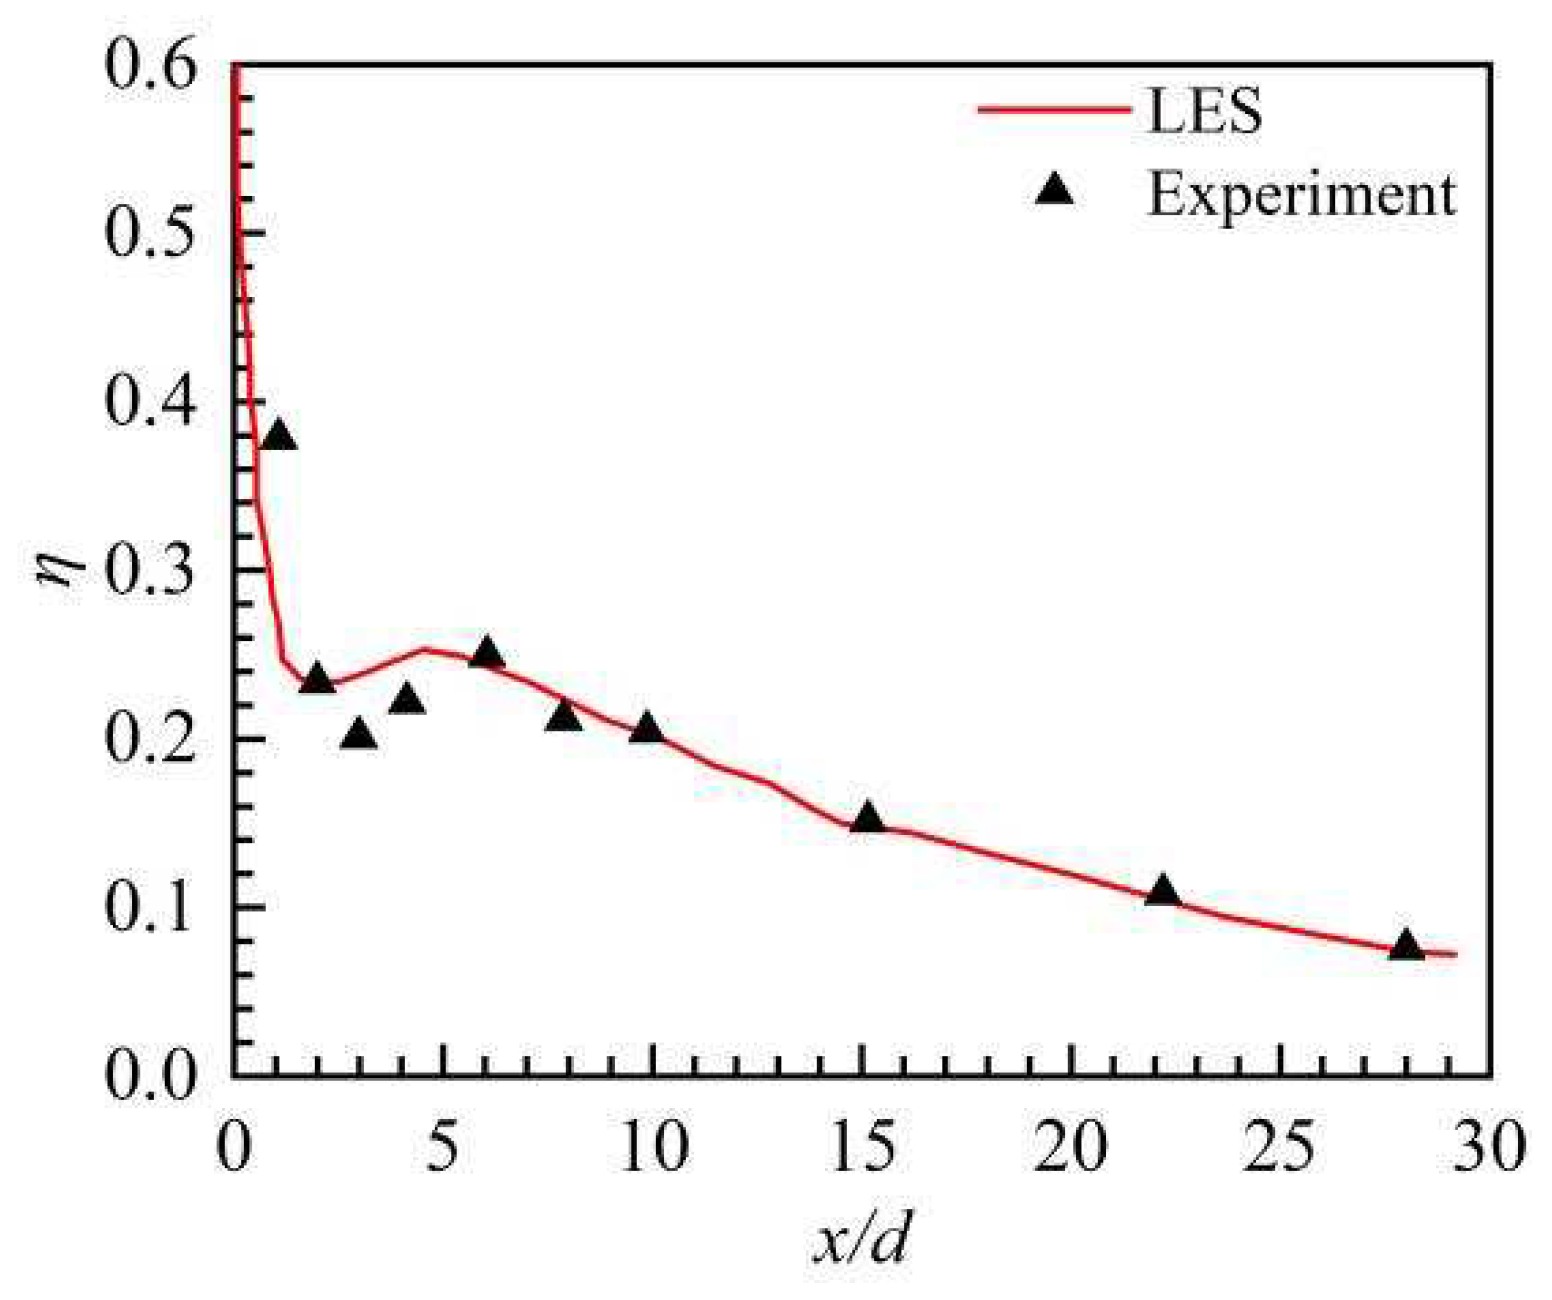
In order to verify the accuracy of LES in this study, the centerline FCE predicted by the LES is contrasted with Kohli and Sinha's experimental findings [27,28]. It is evident from Figure 6 that there is considerable agreement among the streamwise changes in centerline FCE as well as the experimental data, LES predictions and experimental measurement of the centerline FCE along the streamwise direction, and some differences can be found downstream at 3 < x/d < 5, where the recirculation region is formed and the reverse flow is complicated. This might be explained by the fact that the cool hole length is somewhat longer than in the experiments and that the computing region of the LES lacks a plenum. Therefore, the LES calculation procedure of the present study is feasible and acceptable.

5. Results analysis

5.1. Time-averaged flow fields

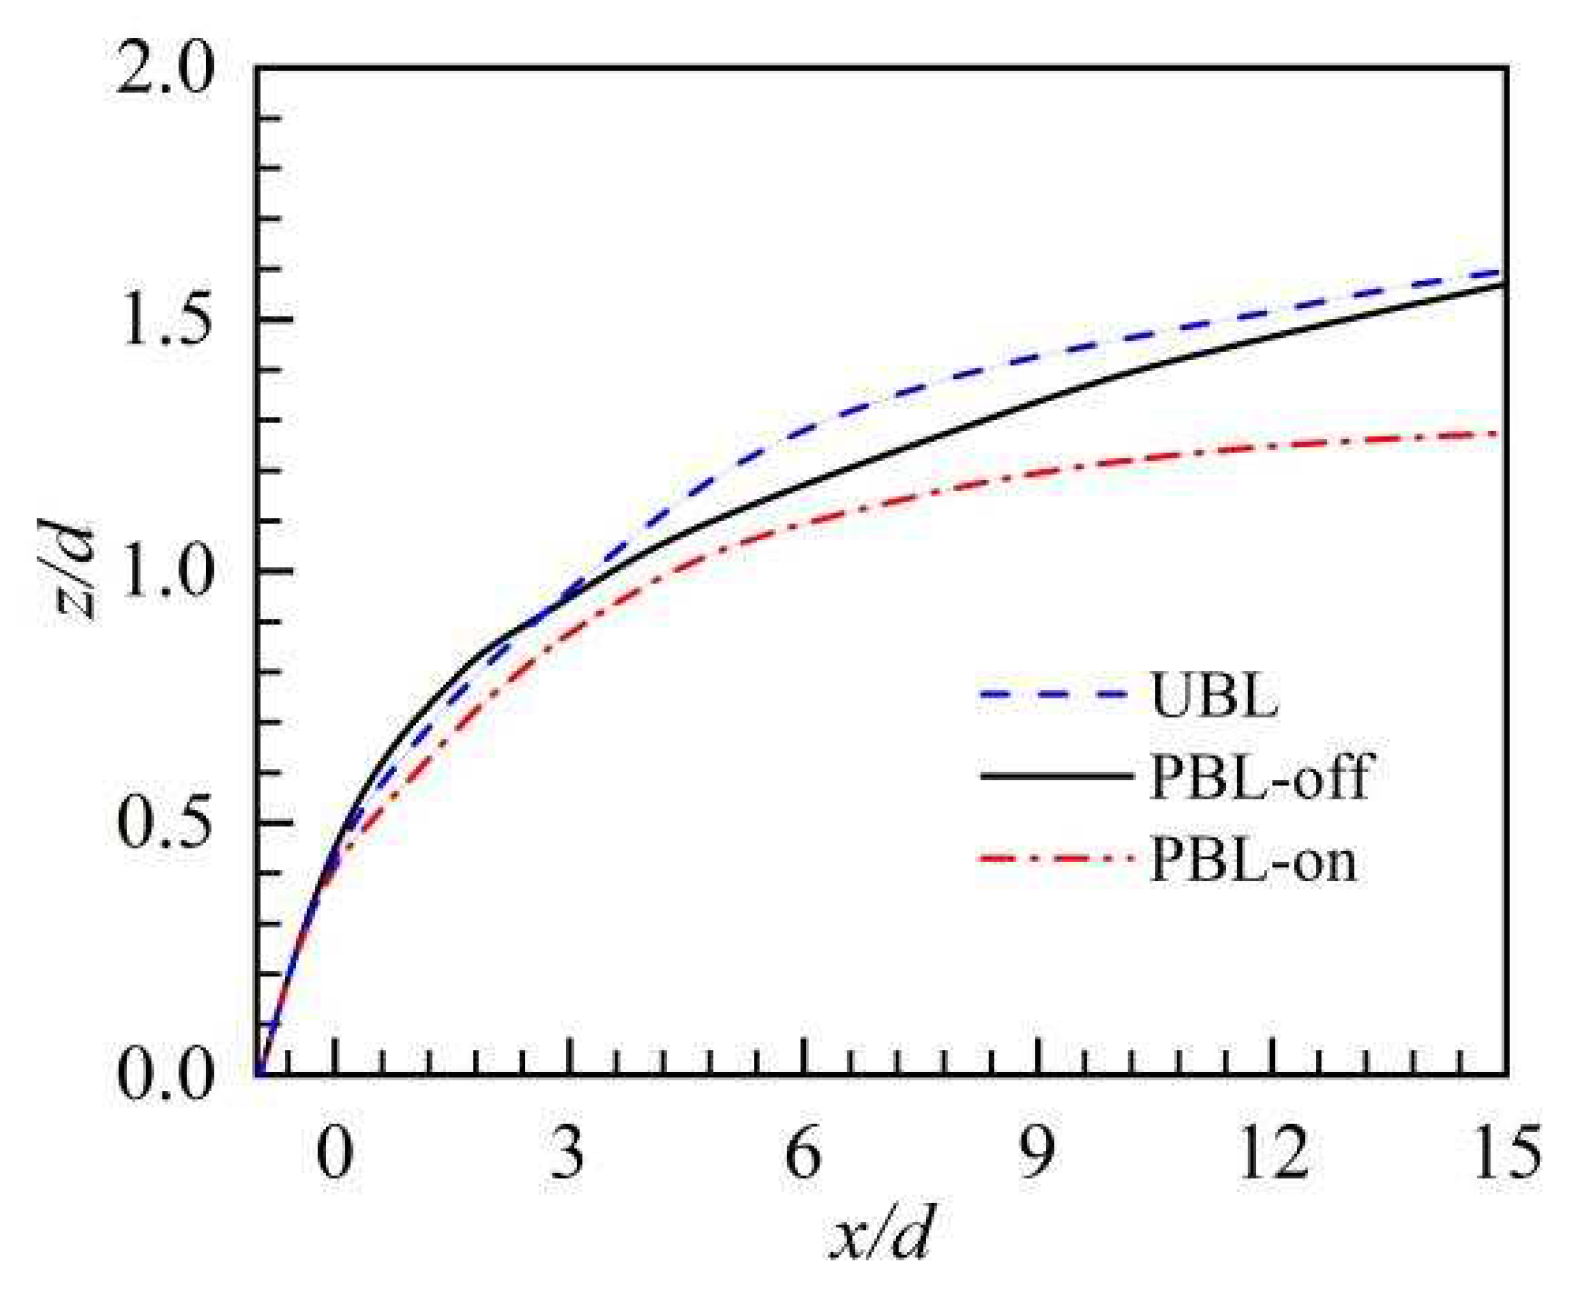
Jet trajectory provides a direct description of the cooling jet's infiltration depth within the flow, which is important in understanding the film cooling. A time-averaged streamline that may come from the cooling hole exit's center is referred to as a jet trajectory (Figure 7). The area around the cooling hole, the same path of jet trajectories could be attributable to the high cooling jet exit momentum. While approaching downstream, momentum is gradually loosen by the cooling jet, followed by deflection in the downstream direction because of the pressure difference. Exit at the cooling hole's trailing edge, the PBL-off case has exhibited to have a taller jet trajectory height versus the UBL case, this presumably results from that the pulsed cooling jet has larger exit momentum at some times in a cycle, yielding adverse effects on the film cooling performance. Conversely, at downstream x/d > 3, the jet trajectory height of the PBL-off case is lower than that of the UBL case, this may be due to that the pulsed cooling jet aggravates the coolant's interaction with the crossflow. More importantly, versus the other two cases, it is apparent that the jet trajectory height of the PBL-on case is remarkably shorter, demonstrating the improvement of the adherence of the coolant to the wall surface by PAA.
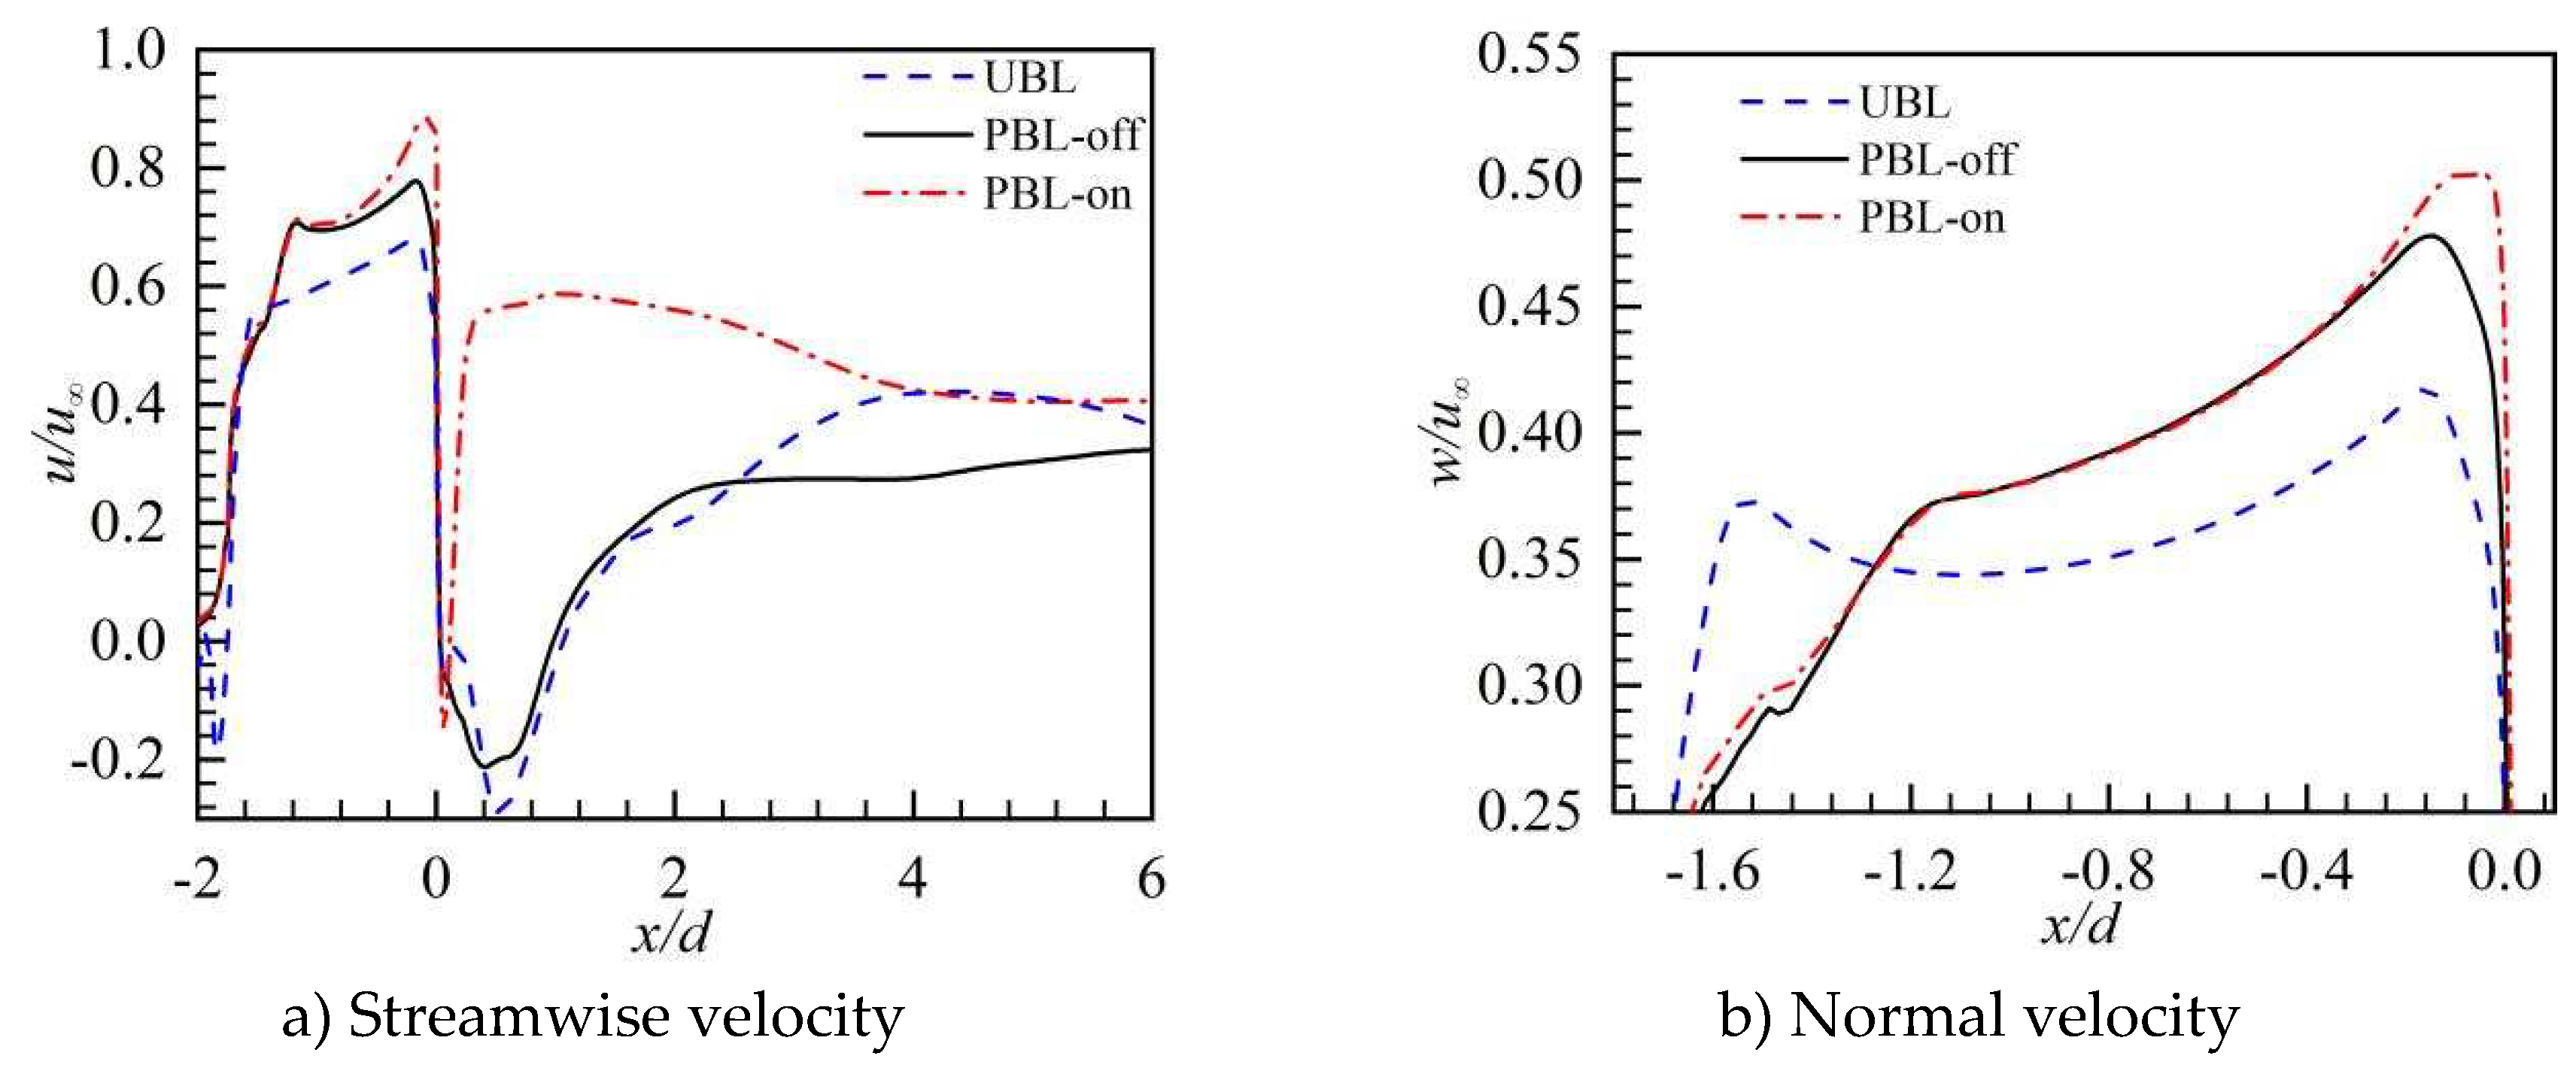
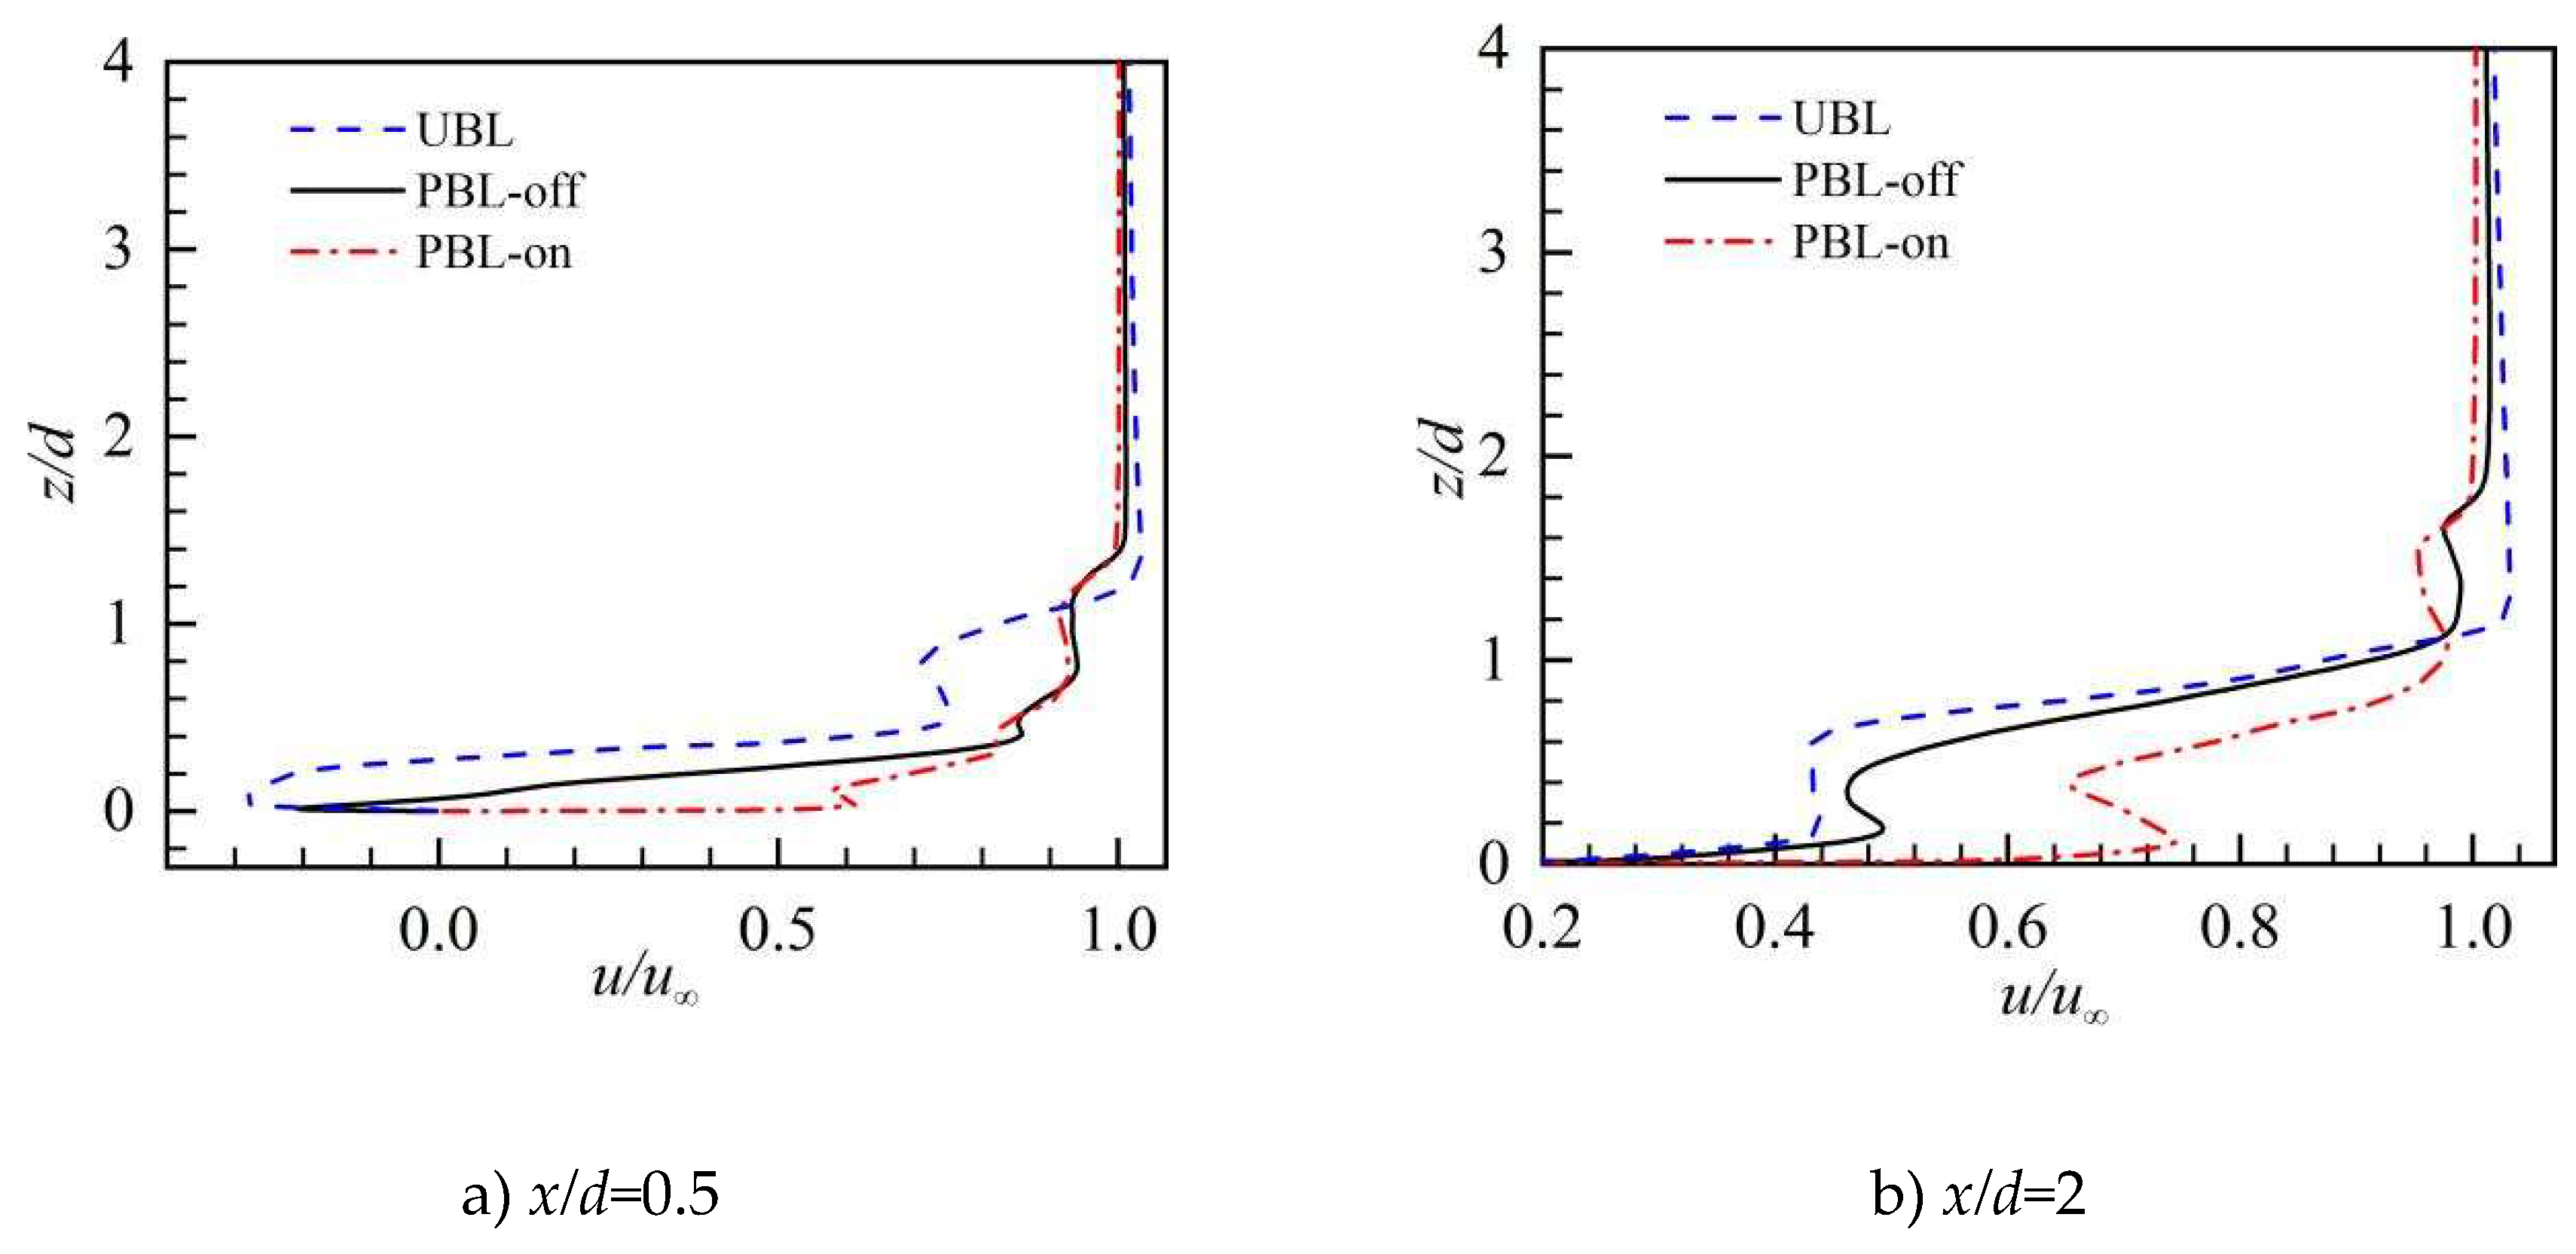
At the cooling hole exit, time-averaged velocity profiles are illustrated in Figure 8. Once the crossflow would be approached, the affection of the hole exit velocity profile occurs, so the maximum values of the streamwise and normal velocities are shifted to the trailing edge of the hole exit. Near the trailing edge, the streamwise velocity of the PBL-off case was remarkably greater than that of the UBL case (Figure 8a), positively influencing the streamwise coverage of the coolant. Furthermore, the streamwise velocity becomes larger that would be attributed to the PAA. Downstream the cooling hole, the streamwise velocity of the UBL case and the PBL-off case are negative, suggesting that here is where a recirculation zone forms. The PAA would be responsible for the increase in streamwise velocity in the PBL-on case, in close proximity to the trailing edge, versus the UBL case, a noticeably higher normal velocity of the PBL-off case could be found (Figure 8b), this aggravates the interaction of the cooling jet with the crossflow, and the normal velocity has opposite characteristics near the leading edge. Moreover, versus the PBL-off case, a noticeably higher normal velocity of the PBL-on case could be noted, which could be attributed to the PAA-generated downward force.
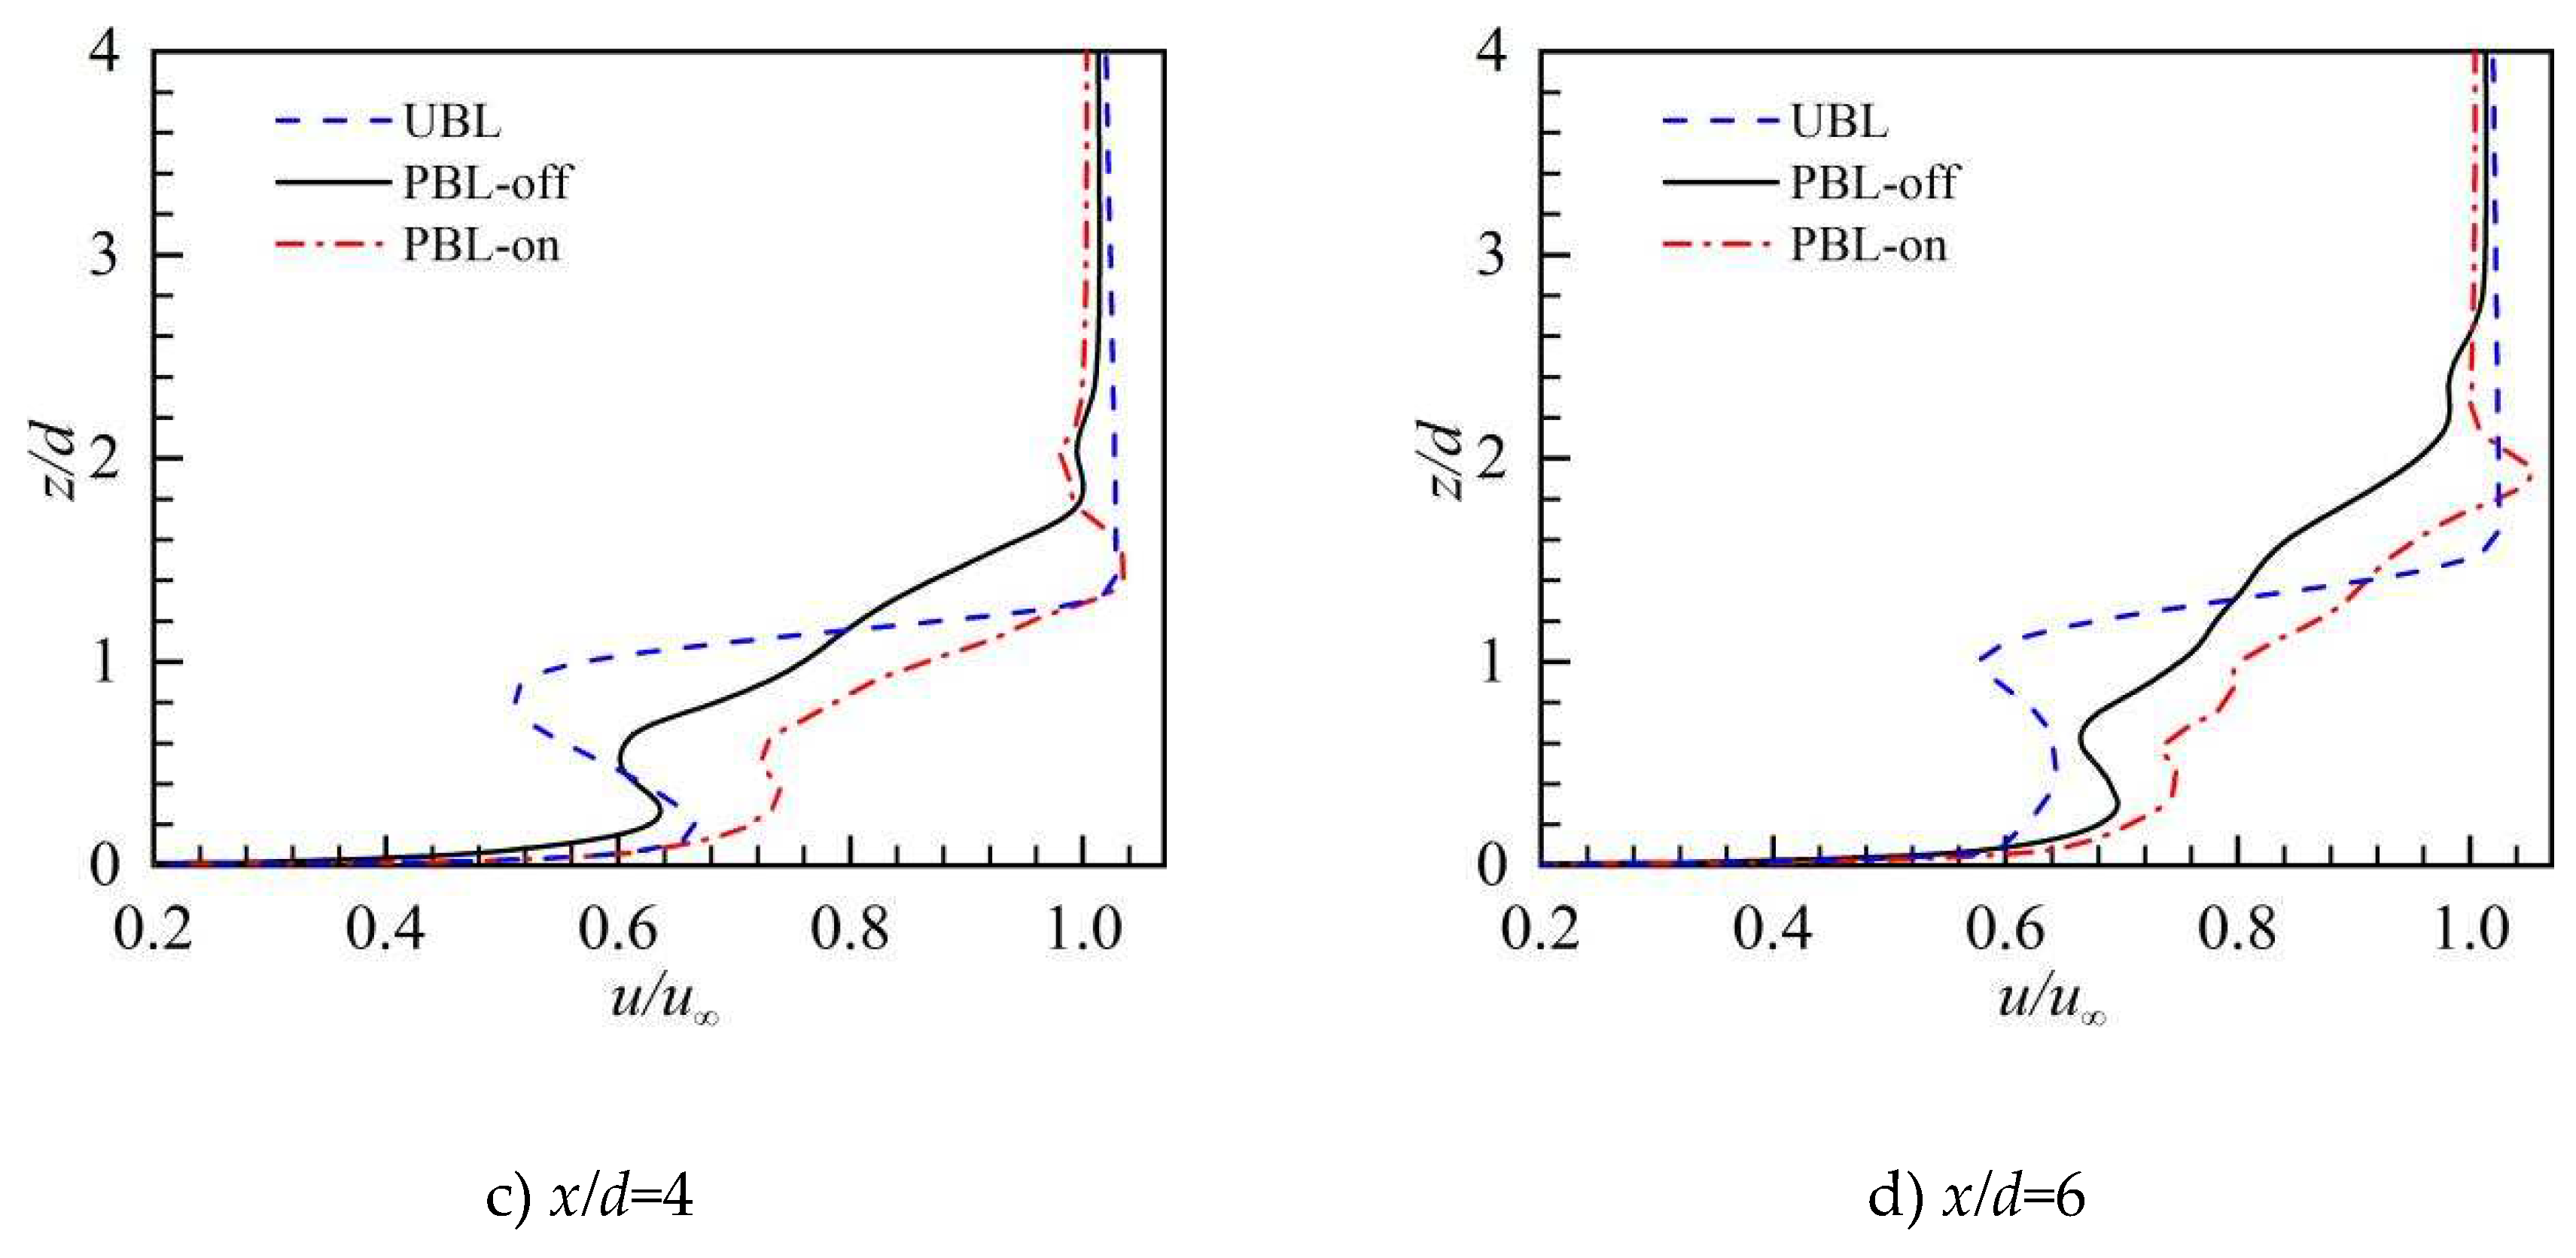
The profiles of the time-averaged streamwise velocity (u) at different values of (x/d, y/d) are illustrated in Figure 9. At the downstream of the cooling x/d=0.5, there were negative values of the streamwise velocity in the near wall region for the UBL case, reflecting the detachment of the coolant flow off the surface of the wall and the establishment of a recirculation region that would be the conditioning hole's immediate outflow. For the PBL-off case, the negative values are slightly decreased due to the coolant pulsation. Because from the streamwise momentum injection effects produced via PAA, the streamwise velocity values for the PBL-on that grow from negative to positive. This indicates that the recirculation region is disappeared. At farther downstream x/d=0.5, the streamwise velocity in the near wall region is positive and large, signifying that the cooling jets already reattach to the wall surface. Moreover, the streamwise velocity values of the PBL-on case is significantly larger than those of other two cases thanking to the PAA, demonstrating how the PAA encourages the coolant to flow downstream. While approaching downstream, the streamwise velocity values of the three cases get closer, this due to that the influences of the coolant pulsation and the PAA become weaker.
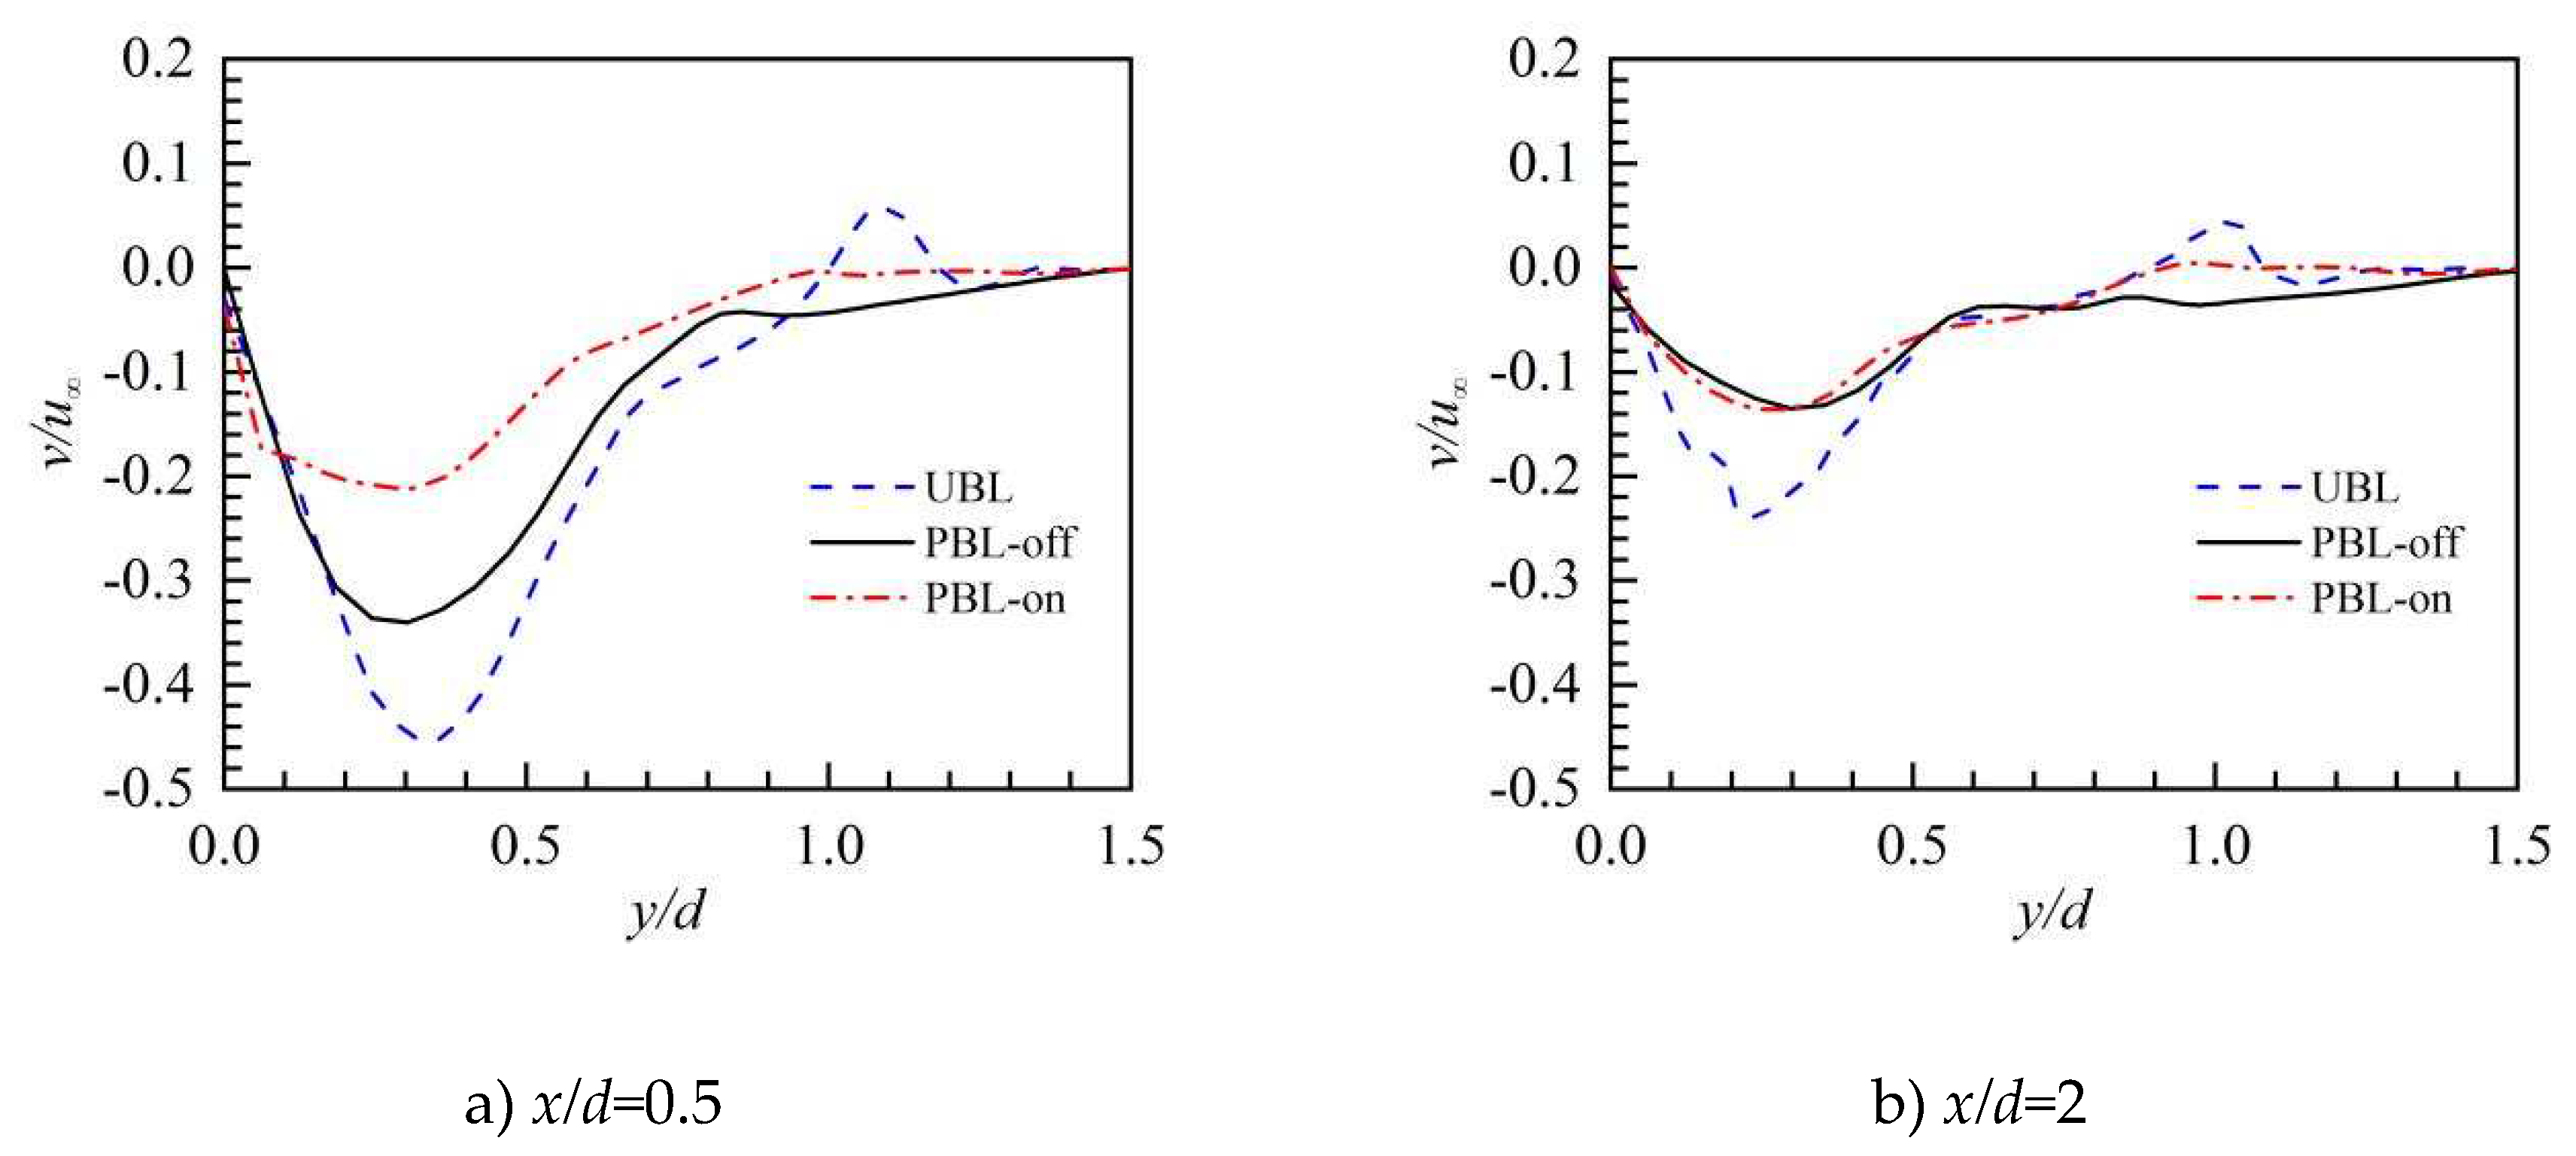
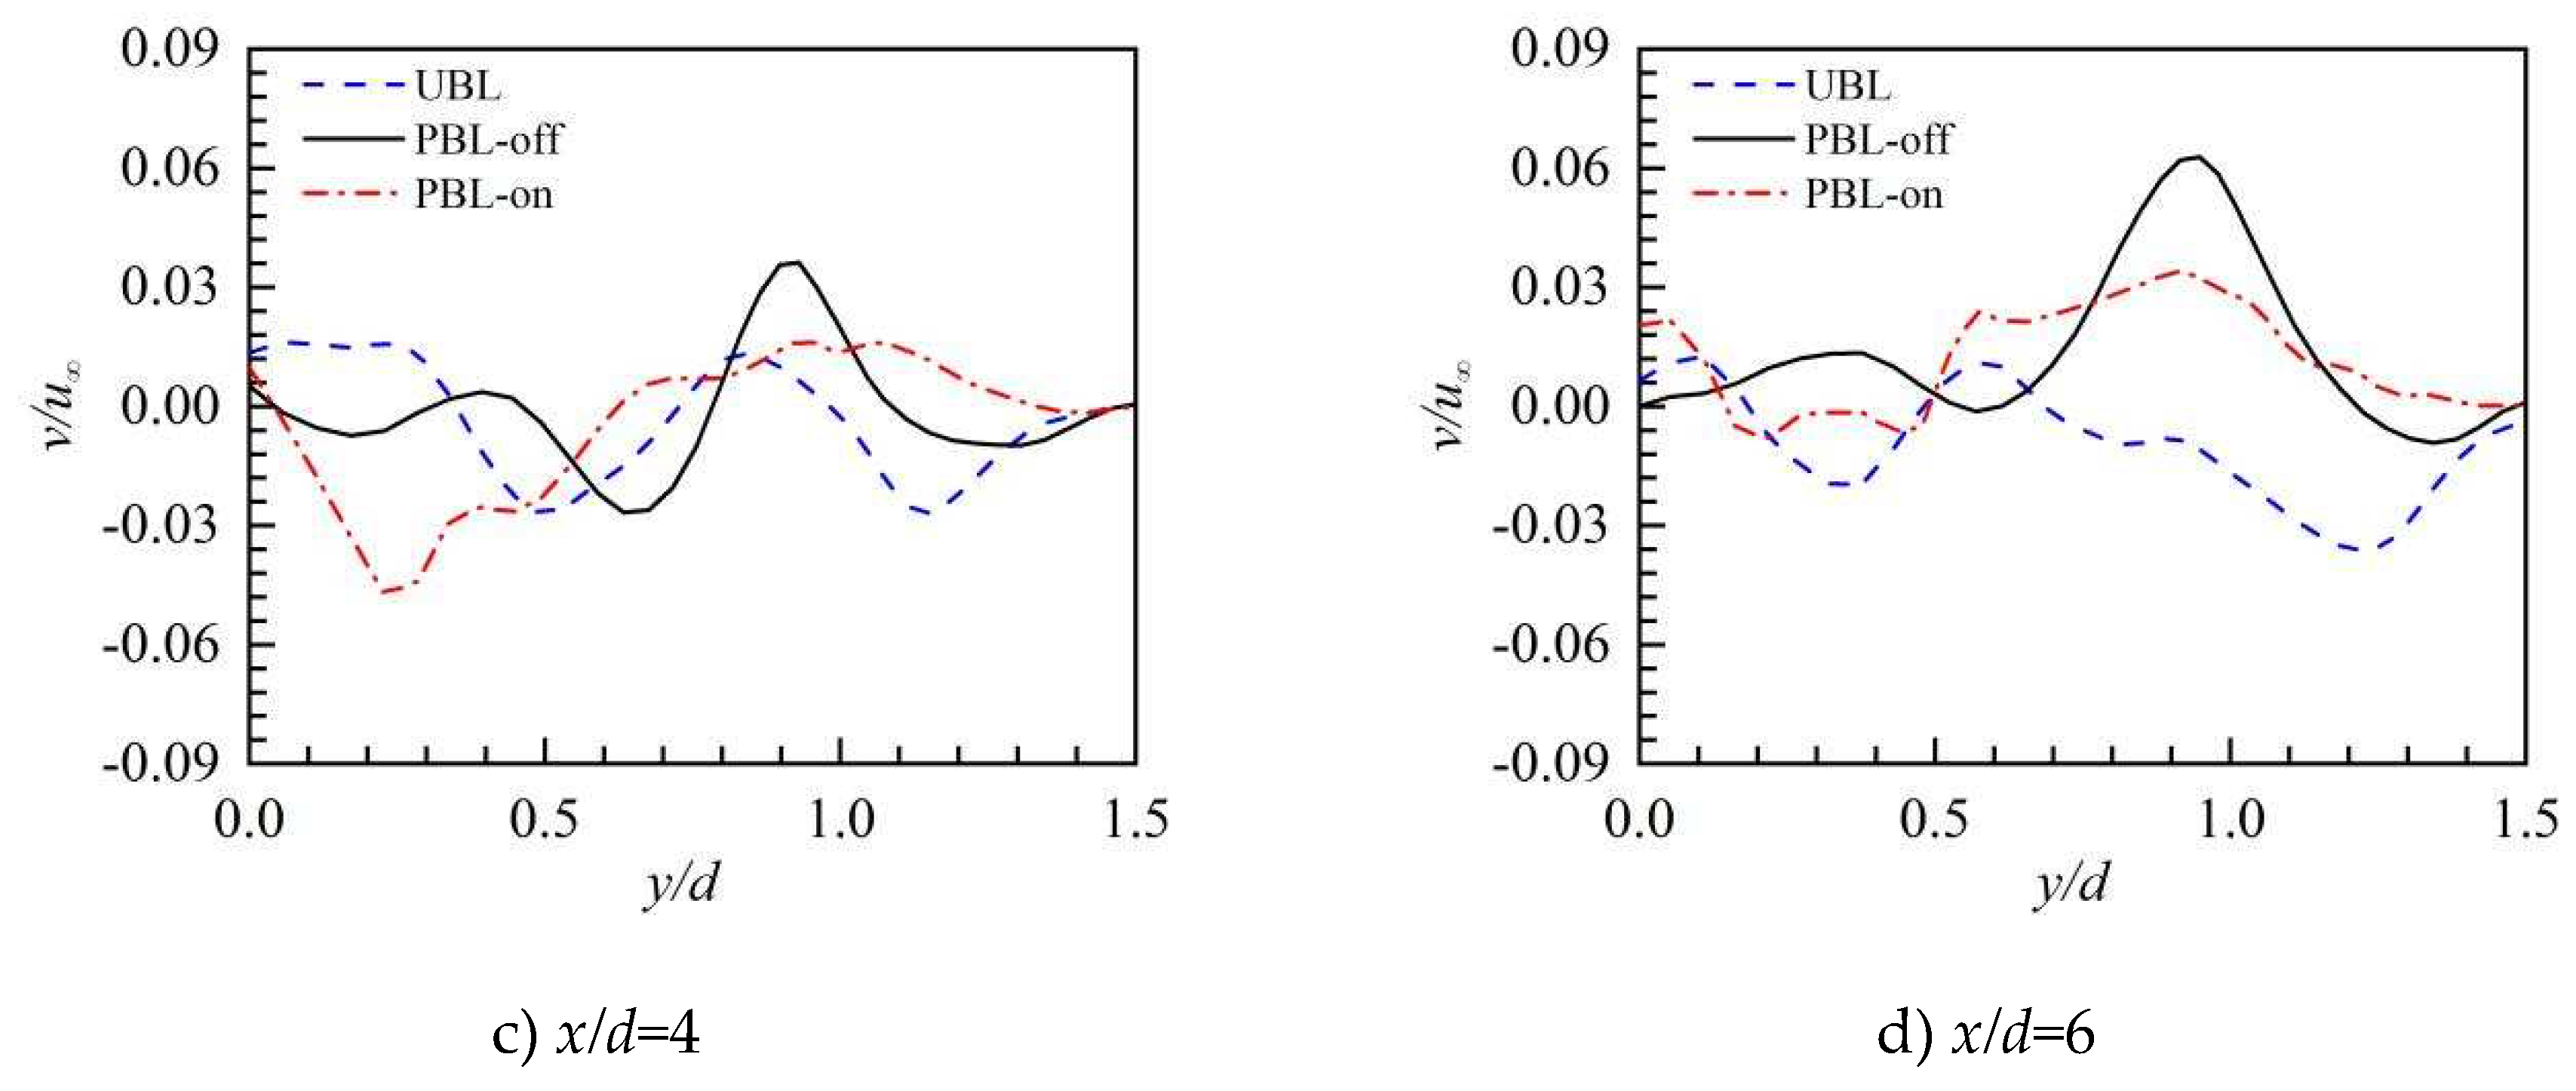
The time-averaged lateral velocity (v) profiles for various values of (x/d, z/d) are displayed in Figure 10. In the UBL case, lateral velocity was substantial and positive at x/d=0.5, highlighting that the hot crossflow moves inward along the lateral direction and suppresses the lateral coverage of the coolant and this results from the entrainments the of the CRVP. The coolant pulsation in the PBL-off case noticeably lowers the lateral velocity, which is advantageous for the coolant's lateral coverage. Because of the PAA, the lateral velocity in the PBL-on case is much reduced, this demonstrates that the PAA weakens the entrainments of the CRVP. Significantly, when the lateral velocity propagates downstream, its absolute values decrease, indicating that the vortex structures weaken and the PAA's impacts become less pronounced. The PBL-off scenario has a smaller range of positive lateral velocity at downstream x/d=4 and x/d=4. This may be because the horseshoe vortex, which is created by the pulsed cooling jet, is larger, pushing the coolant to flow outward along the lateral direction. In the PBL-on scenario, the PAA causes a broad range of positive lateral velocity, which causes the coolant to somewhat flow outside in the lateral direction and increase its lateral coverage.
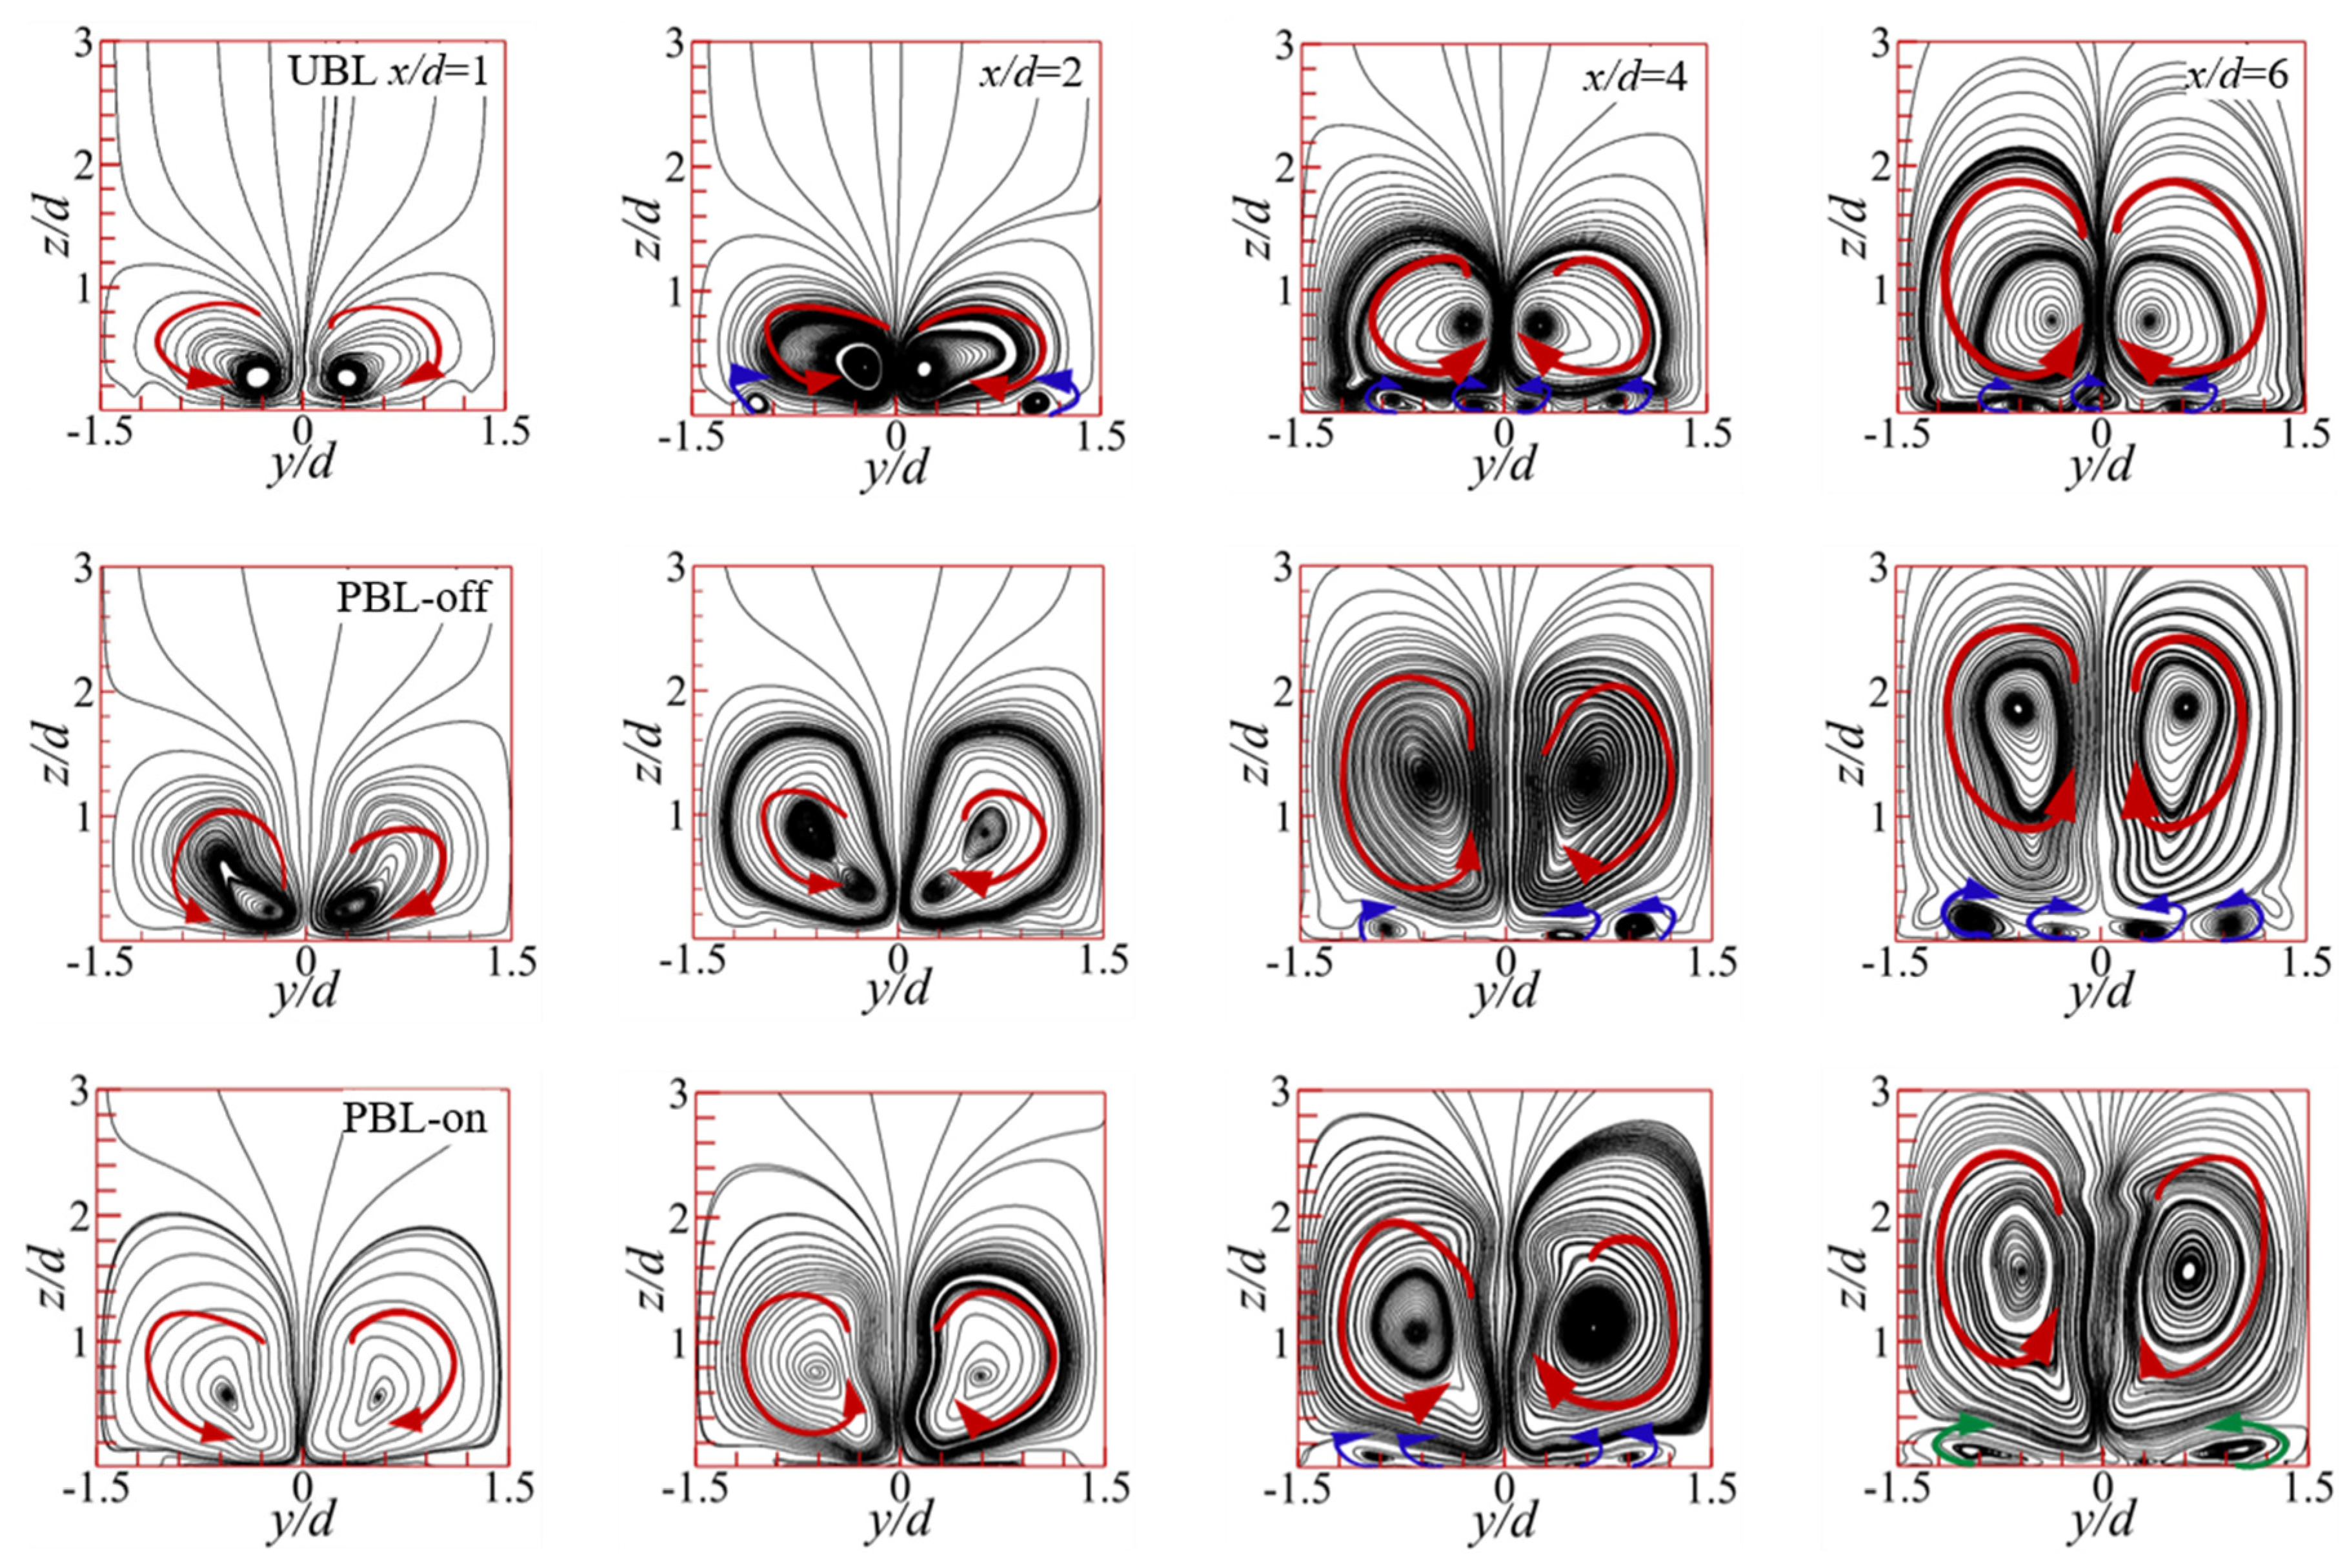
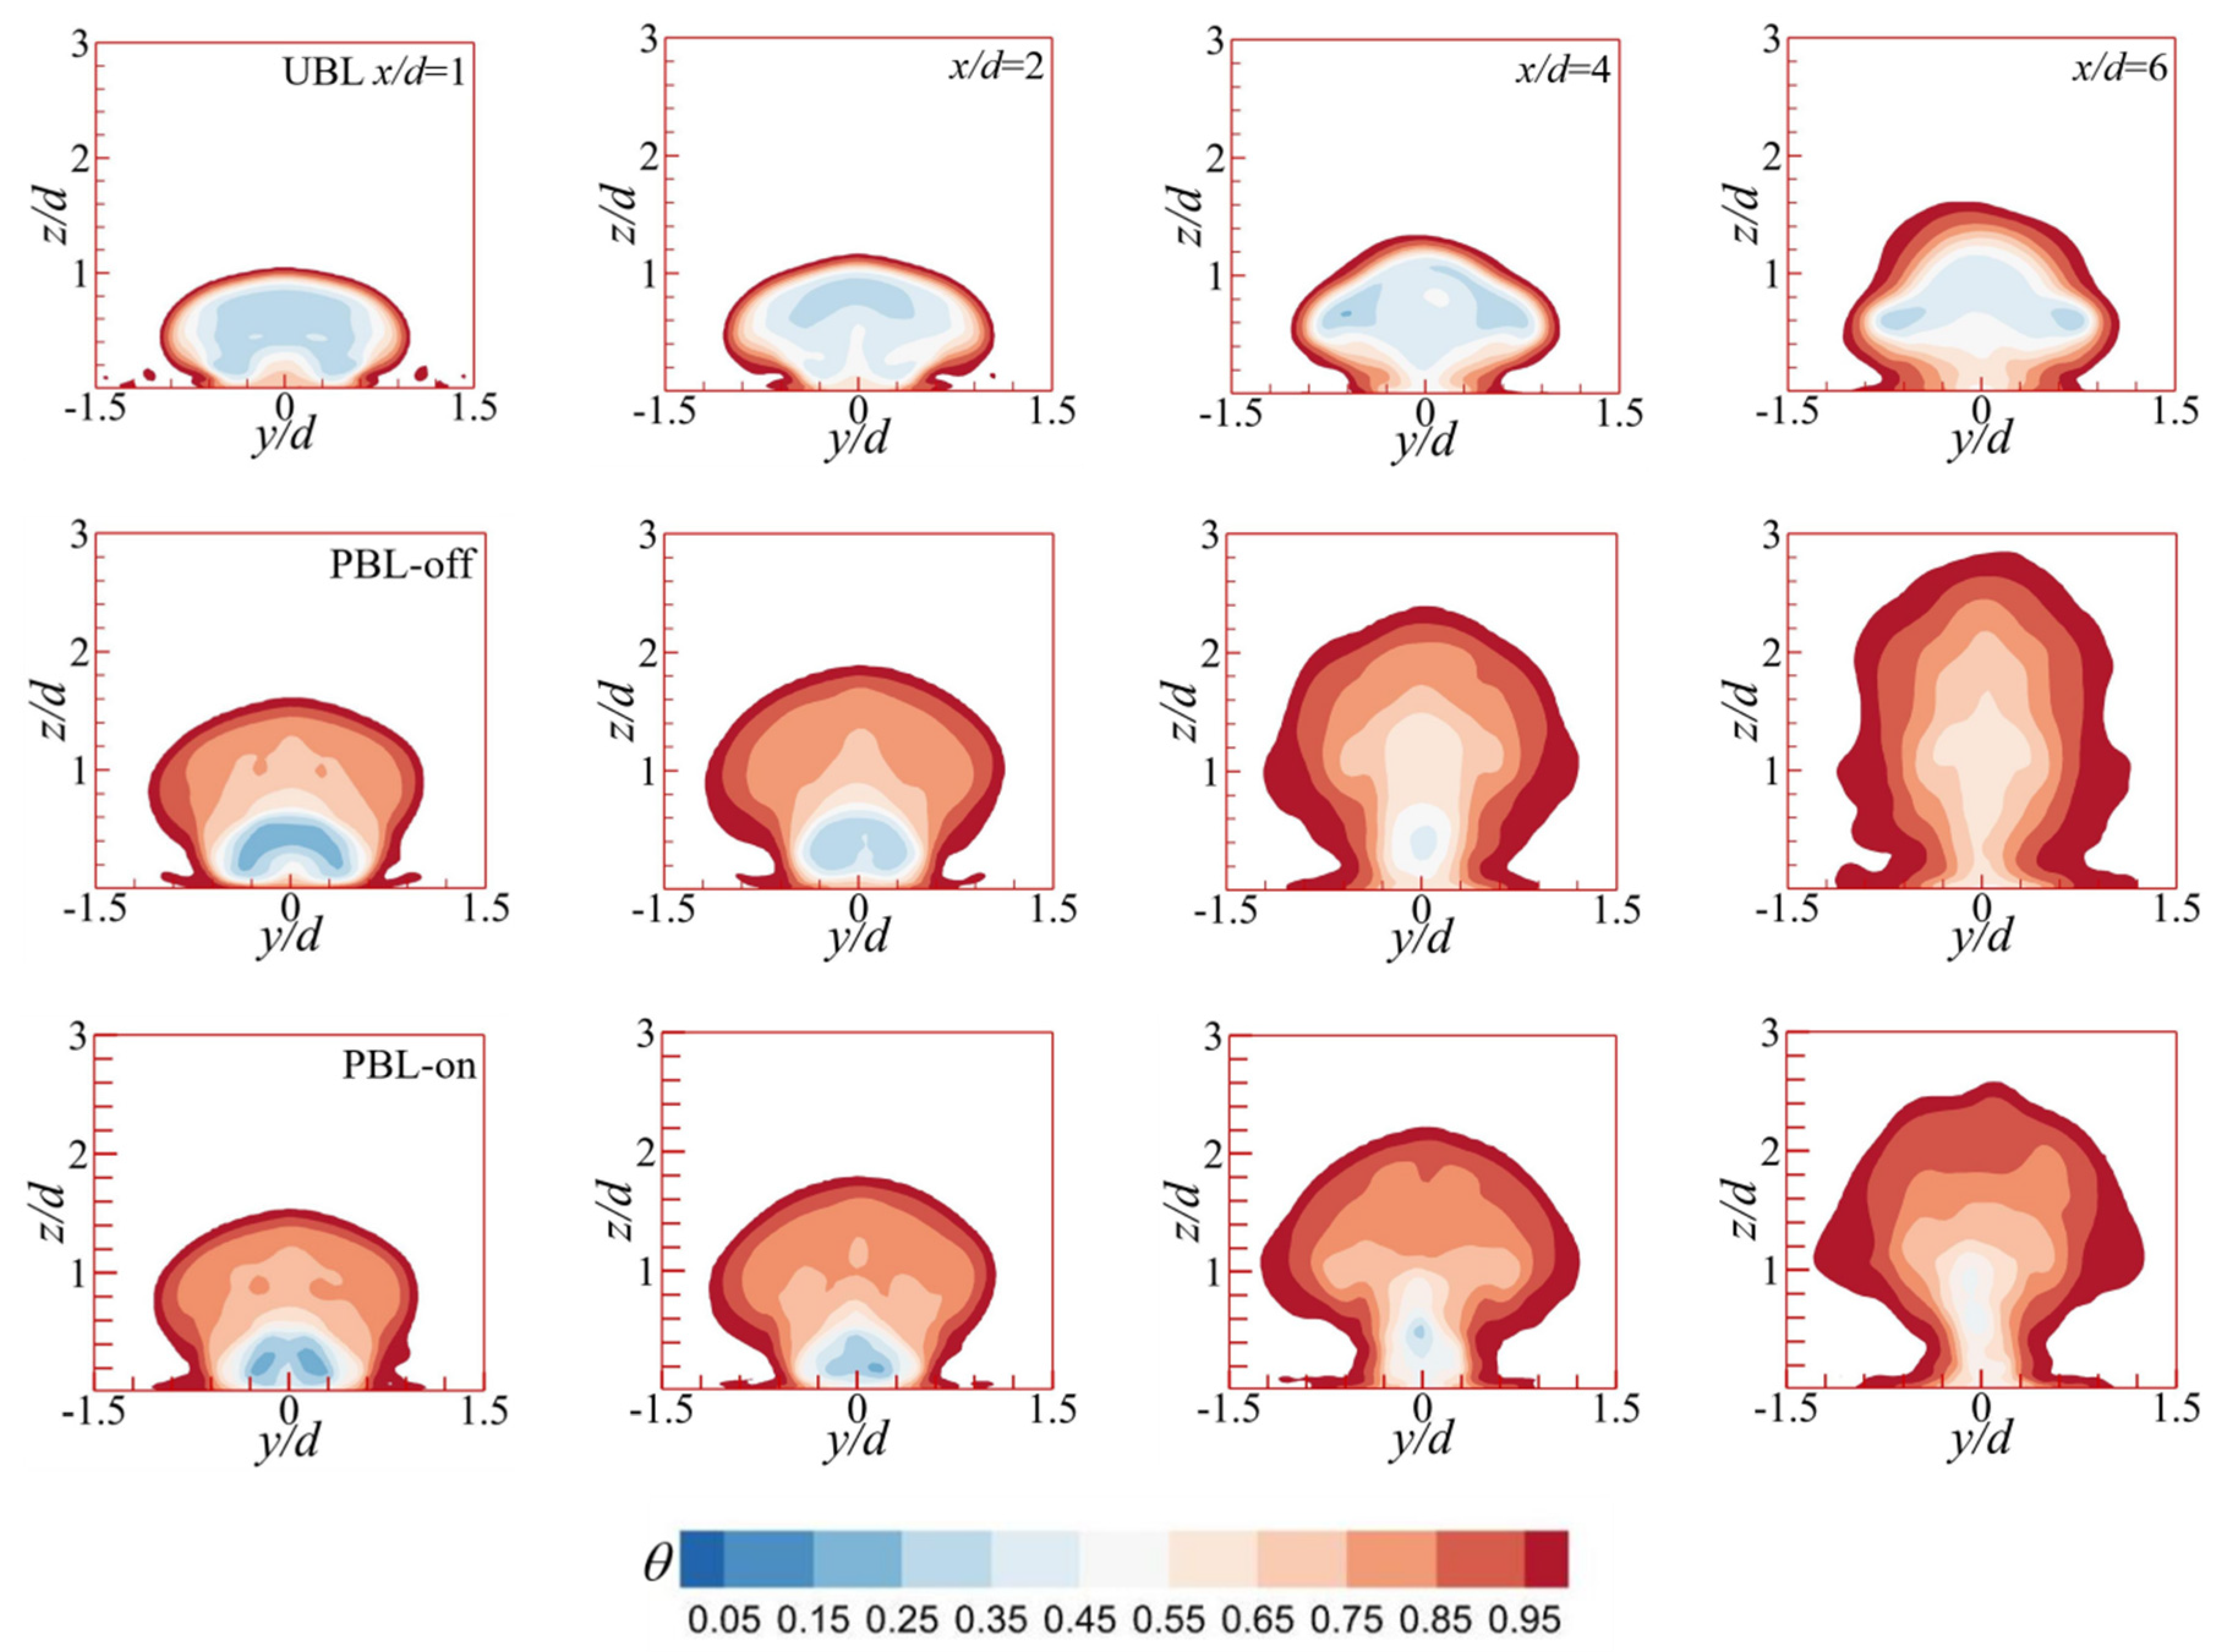
Figure 11 and Figure 12 illustrate the evolutions of the vortex structures and the temperature fields downstream the cooling hole. At x/d=1, a symmetrical CRVP can be clearly observed in the UBL case (Figure 11), followed by entraining the crossflow by CRVP underneath the cooling jet and lifting the cooling jet off the wall, thereby negatively influencing the FCP. Consequently, the high temperature region rises upward at the midspan due to the upwash effects of the CRVP (Figure 12). In the PBL-off case, the influence region of the CRVP is larger than that of the UBL case, since the coolant pulsation intensifies the interaction of the cooling jet with the crossflow, and the core region of the cooling jet is enlarged (Figure 12). The influence zone of the CRVP is further expanded in the PBL-on case, most likely as a result to that PAA's momentum injection effects. A tiny vortex pair (horseshoe vortex) revolving in the opposite direction as the CRVP might be detected in the NWR around x/d=1 in the UBL case, as well as delivering the coolant to the wall, thereby positively influencing the FCP. In the PBL-off and PBL-on cases, there is no small vortex pair in the NWR. While evolving downstream, the CRVP gradually grows in structural size and moves away from the wall. Consequently, the shifting of low temperature core region of the coolant jet from the wall occurs (Figure 12), yielding a worse FCE. At farther downstream x/d=4, the small-scale horseshoe vortex also can be observed in the PBL-off and PBL-on cases, and the horseshoe vortex structural size of the PBL-off case is larger than those of the other two case, this also explains why there is a narrow positive lateral value in the Figure 10. Furthermore, in the UBL case, in the NWR, there is a little new pair of vortex (i.e., wall vortex), which encourages the coolant to propagate laterally, whereas the coolant pulsation and the PAA may suppress the formation of the wall vortex. At x/d=6, the wall vortex is formed beneath the cooling jet in the PBL-off case, and the structural size of the horseshoe vortex is enlarged in the PBL-on case, these are beneficial to the lateral coverage of the coolant. Versus PBL-off case, the reduced height of the low temperature region could be noted in the PBL-off case (Figure 12), which could be attributable to the PAA-generated downward force. In addition, the core region of the cooling jet has the trend to split into two regions, and the CRVP-held region is gradually away from the wall, where the remarkable coolant-crossflow interaction occurs, resulting in the elevation of the temperature, and the NWR is affected by the horseshoe vortex and the wall vortex, where the coolant stays close to the wall surface. In addition to aiding in the lateral coolant coverage, the PAA lessens the lift-off effect caused by the CRVP. As a result, the cooling jet was positioned closer to the wall surface, increasing its lateral coverage of a low temperature (Figure 12).
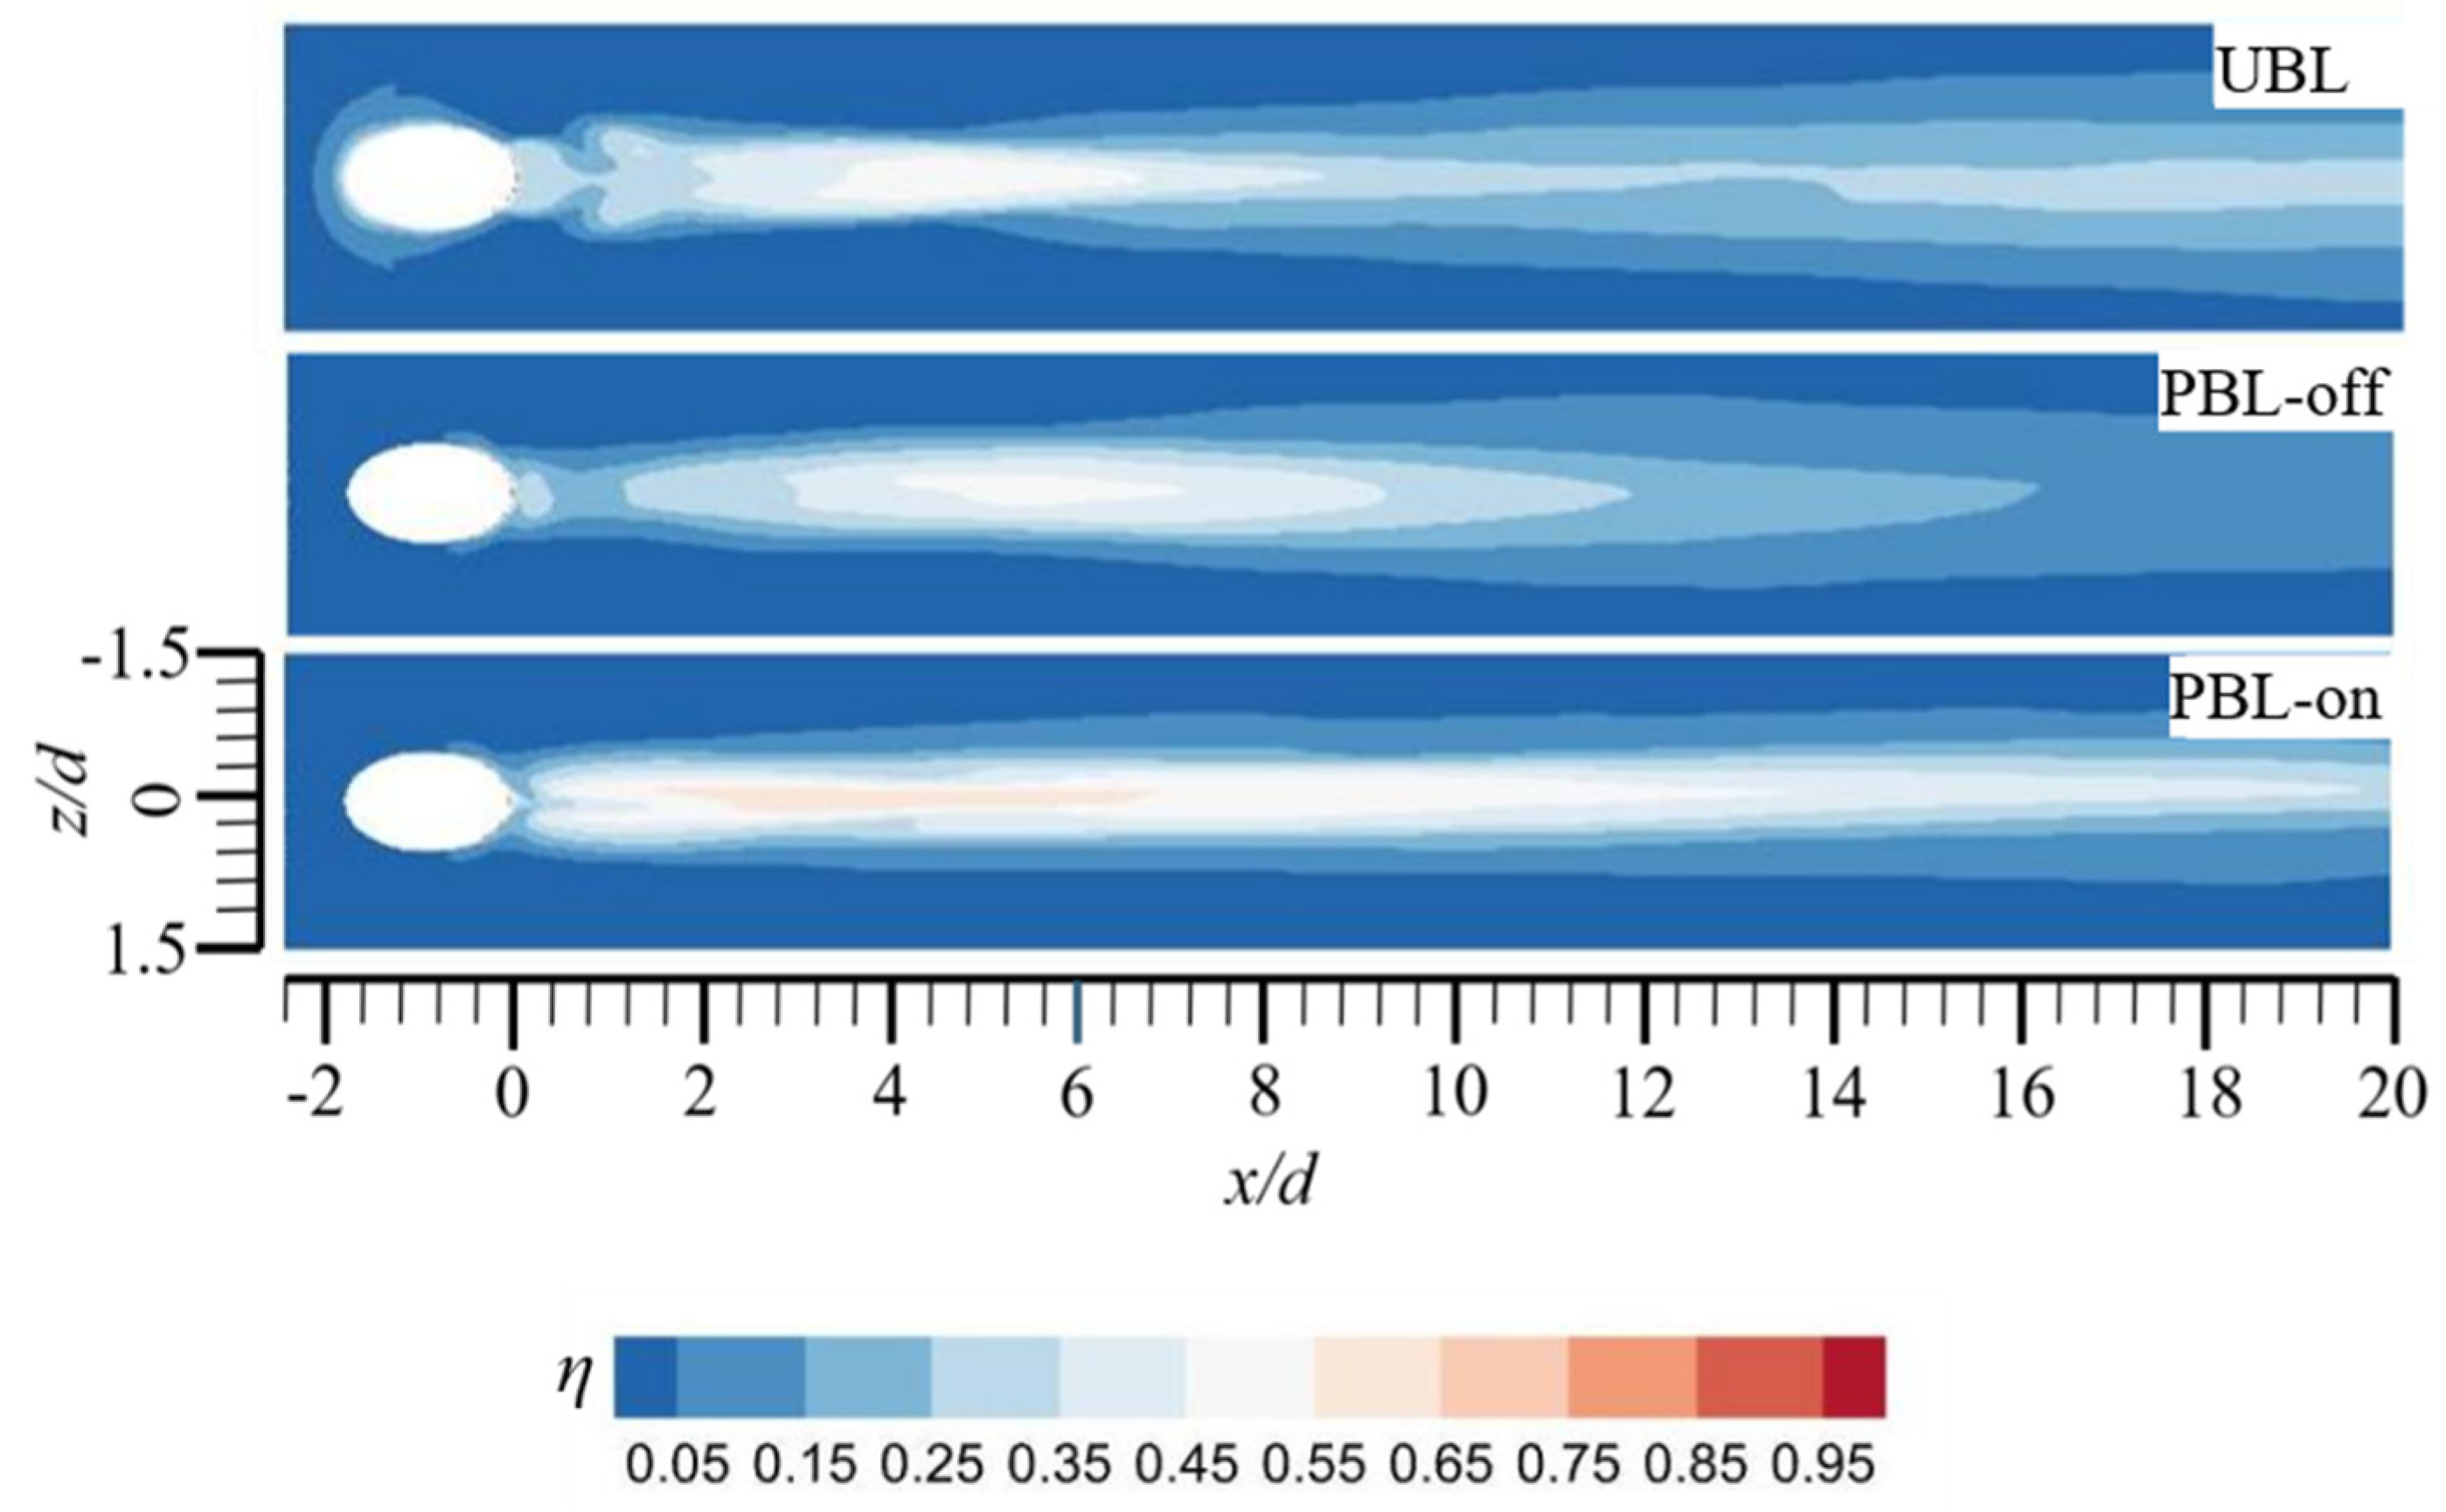
On the wall surface, Figure 13 illustrates the contours of the time-averaged FCE . For the UBL case, the FCE is fairly low just downstream of the cooling hole due to the blowing off of the cooling jet, then the FCE is rapidly increased thanks to the reattachments of the cooling jet. Thereafter, the gradual reduction of FCE is noted, while it is approached to downstream as the coolant continually mixes with the crossflow. Versus the UBL case, in the 2 < x/d < 6 region, the reduced FCE of the PBL-off case could be noted, indicating that the coolant pulsation aggravates the blowing off effects and postpones the reattachment of the cooling jet. For the PBL-on case, the noticeable elevation of the FCE could be found at downstream of the cooling hole, which could be attributed to PAA-generated the momentum injection effect and the downward force suppressing the bowing off of the cooling jet, thereby maintaining the coolant close to the wall surface. Because the PAA may inhibit the mixture of the coolant plus crossflow in the far downstream, the remarkably greater FCE of the PBL-on case could be found versus those of the other two cases.
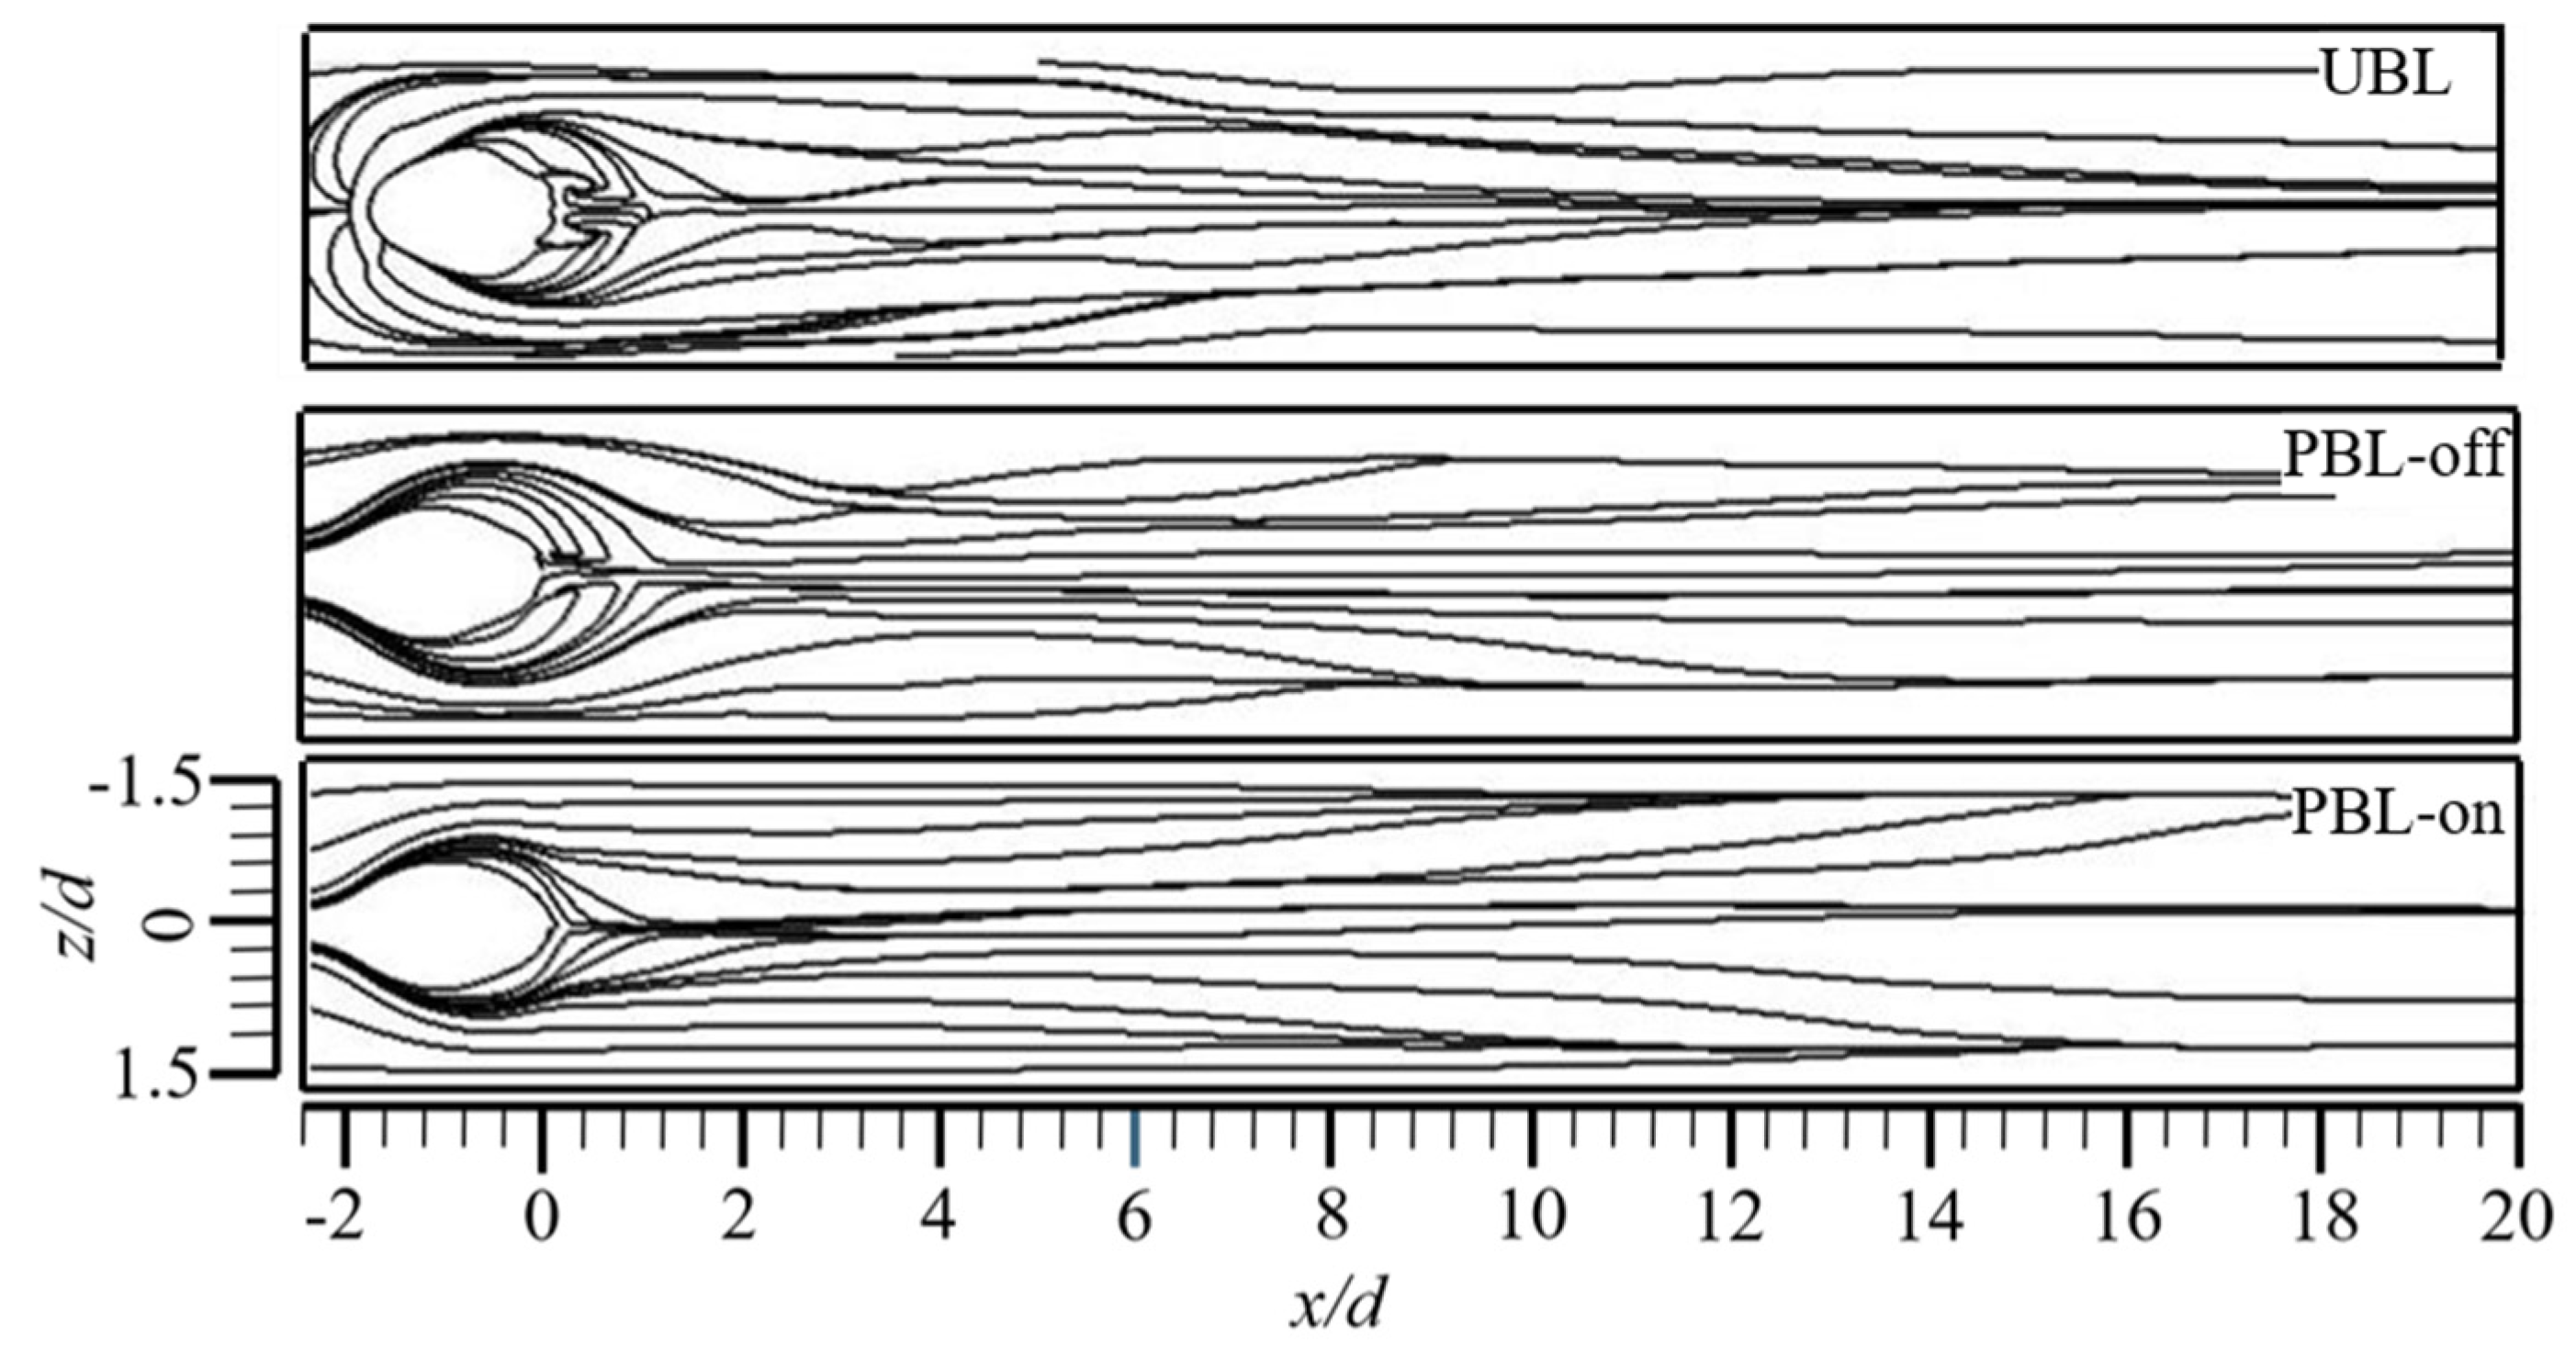
The flow structures have the potential to significantly impact the FCE in the NWR. Figure 14 shows the time-averaged streamlines, especially around the wall. In UBL case, recirculation region could be found at the cooling hole’s just downstream that could be attributed to due to the cooling jet’s blocking influence, which could result in the formation of a downstream spiral separation node (DSSN) vortex pair. The DSSN vortex can exacerbate the mixing of the coolant with the cooling jet, yielding worse FCE (Figure 13). Then, due to the entrainment effective of CRVP, most of the streamlines converge toward the centerline, this is detrimental to the lateral wall coverage of the coolant. Few streamlines diverged outward in a narrow region along the lateral direction as the beneficial effects of the wall vortex and the horseshoe vortex, while this phenomenon disappeared quickly. For the PBL-off case, a recirculation region can also be clearly observed and the distributions of the streamlines are similar to the UBL case, while the converge tendency of the streamlines is weaker than that of the UBL case. The PAA-induced momentum injection effect in the PBL-on case results in the streamlines rapidly converging toward the centerline, with no recirculation zone, and then the streamlines diverge outward while moving downstream, thus improving the lateral coverage of the coolant. This implies that the PAA weakens the detrimental entrainments effects of the CRVP.
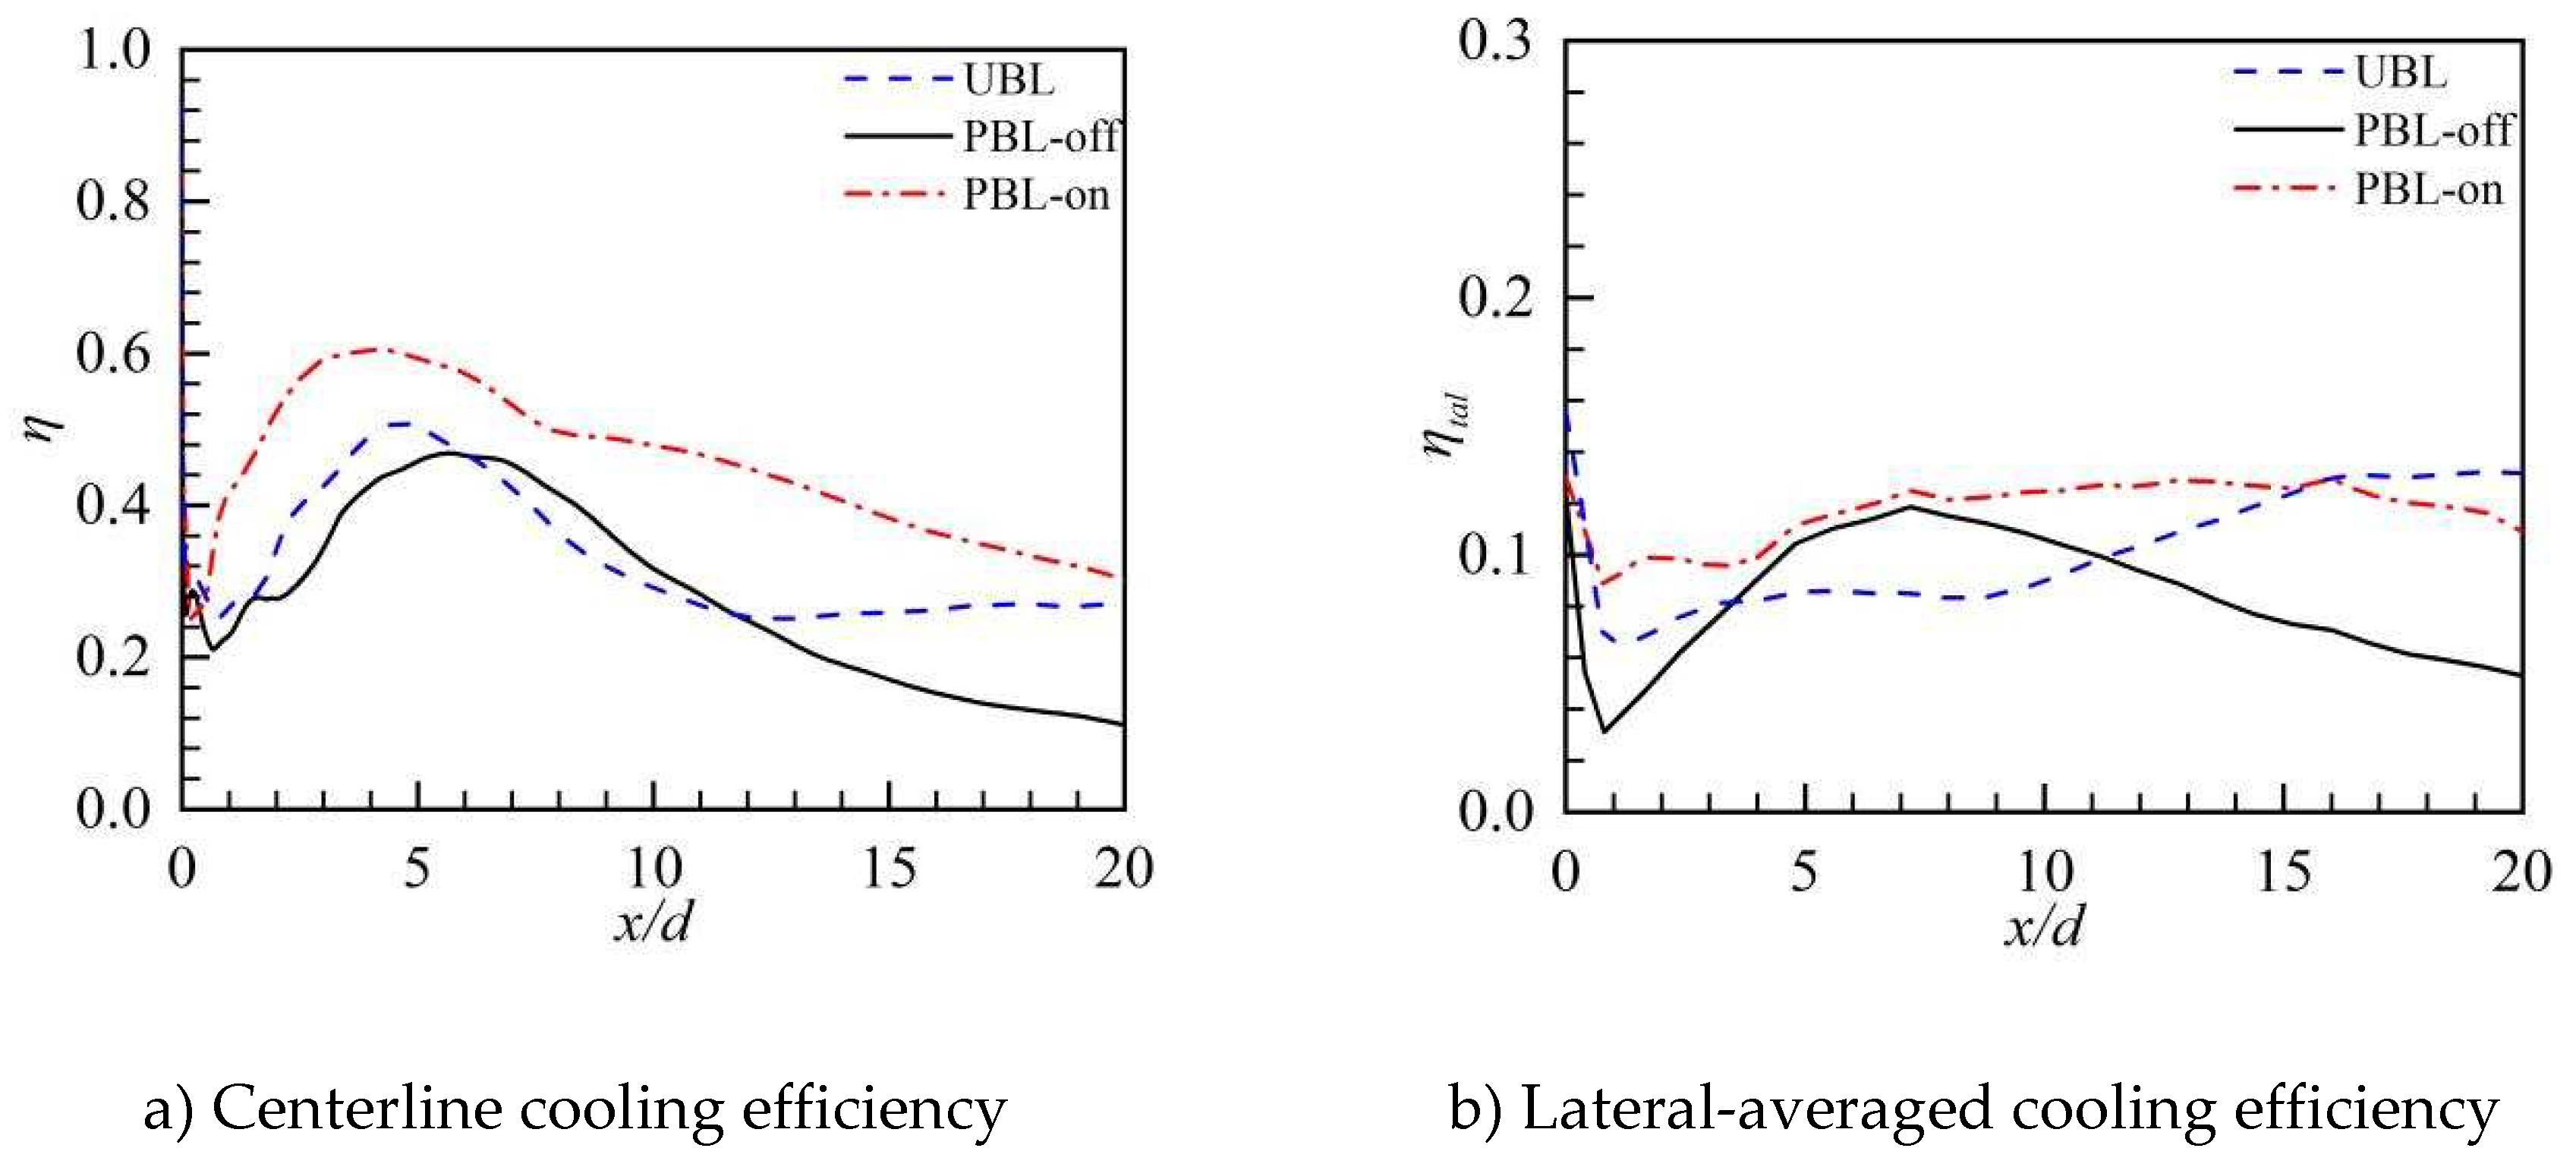
Figure 15 shows the distributions of the centerline and the lateral-averaged FCE along the streamwise direction. As can be seen from Figure 15a, FCE is very poor due to the separation of the cooling jet, and then the centerline FCE is quickly increased to the maximum values thanks to the reattachment of the cooling jet. Subsequently, the centerline FCE continues to be a gradual decline while evolving downstream since the continual mixture of the coolant and the crossflow. For the PBL-off case, the centerline FCE just downstream of the cooling hole is lower than that of the UBL case and the streamwise location of the maximum value is shifted to downstream, this may result from the reduction in the adherence of the coolant. The maximum value is relocated upstream in the streamwise direction for the PBL-on case, and the center of the FCE is greatly enhanced. In the UBL case, the lateral-averaged FCE is the lowest at the recirculation and then is gradually risen while propagating downstream, which is different from the centerline FCE (Figure 15b). However, in the PBL-off case, there is a similarity in the tendency of the lateral-averaged FCE with the centerline FCE. In the PBL-on case, the prominently elevation of the lateral-averaged film cooling could be attributable to the PAA, confirming the results illustrated in Figure 13, and the continues rise of the lateral-averaged FCE up to x/d >15 is noteworthy. When x/d >15, the lateral-averaged FCE is slightly decreased as approaching downstream, this probably because that the coolant is already highly mixed with the crossflow. Generally, the PAA can effectively improve the pulsed FCE, this is beneficial to control the pulsed film cooling flow caused by the main flow unsteadiness in actual engines.

5.2. Instantaneous flow fields

In order to comprehensively reveal the underlying mechanism of the coolant pulsation and the PAA for controlling the film cooling flow, the STD of the coherent structures in the wake flow of the film cooling was comparatively analyzed. The identification of the coherent structures is undertaken using the Q-criterion method and is defined as Q = ( Ω i j Ω i j S i j S i j ) / 2 , where Ω i j = ( u i / x j u j / x i ) / 2 and S i j = ( u i / x j + u j / x i ) / 2 [35]. And eight time points are taken in a pulsation cycle to better interpret the cooling flow field (Figure 3).
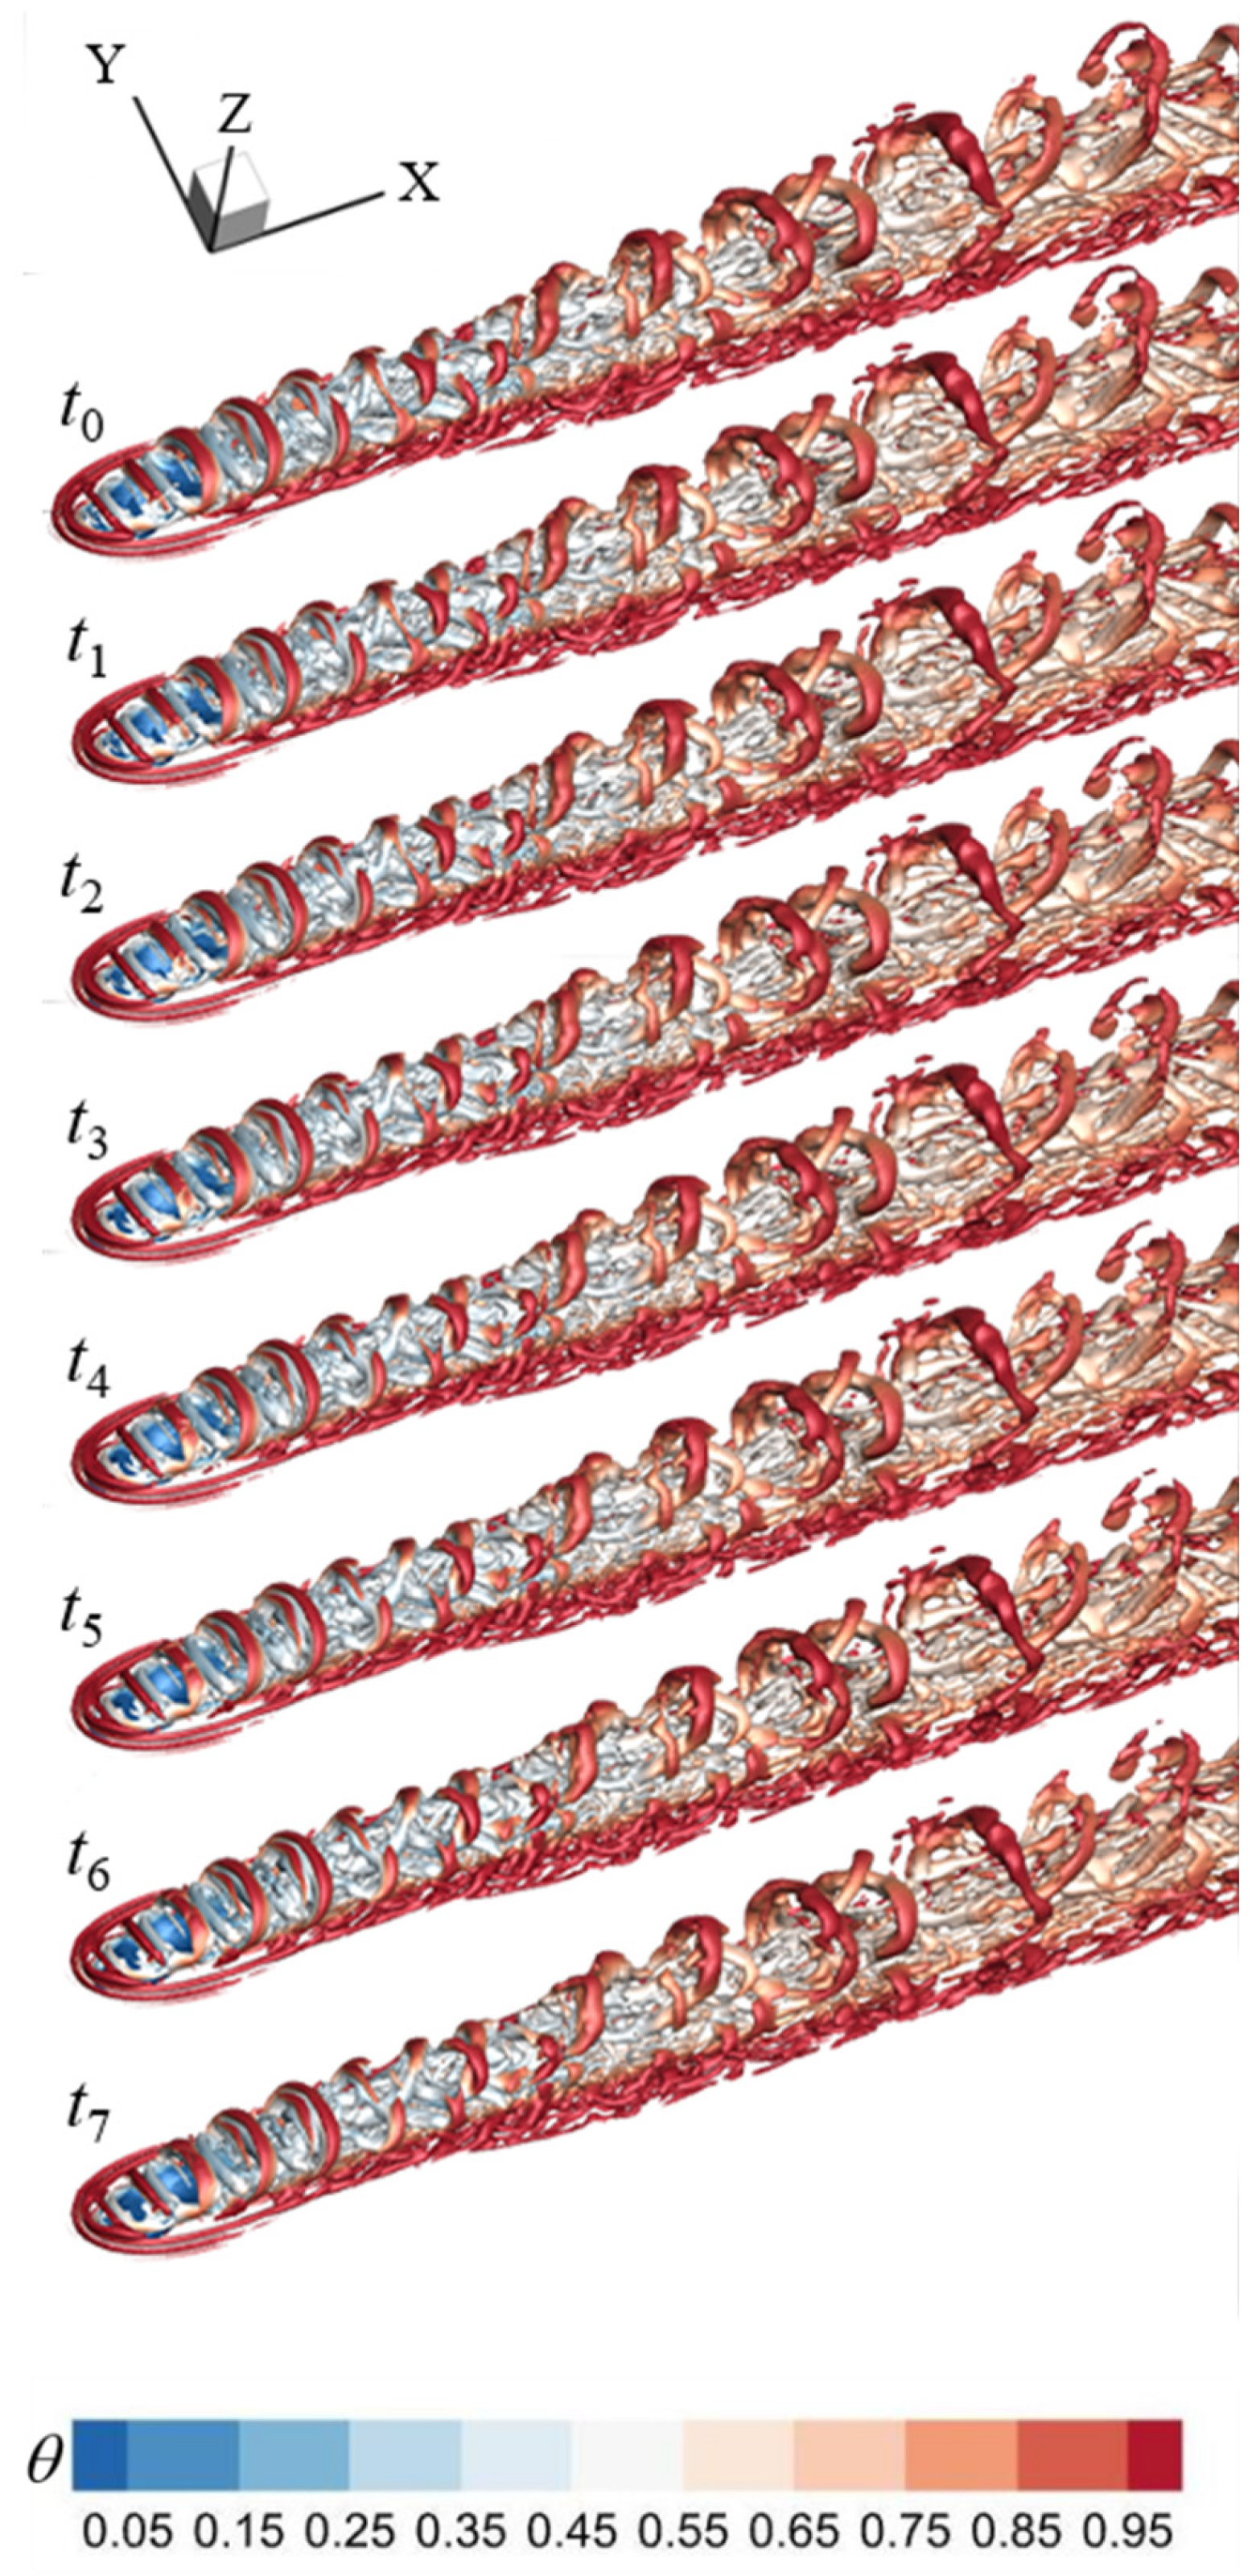
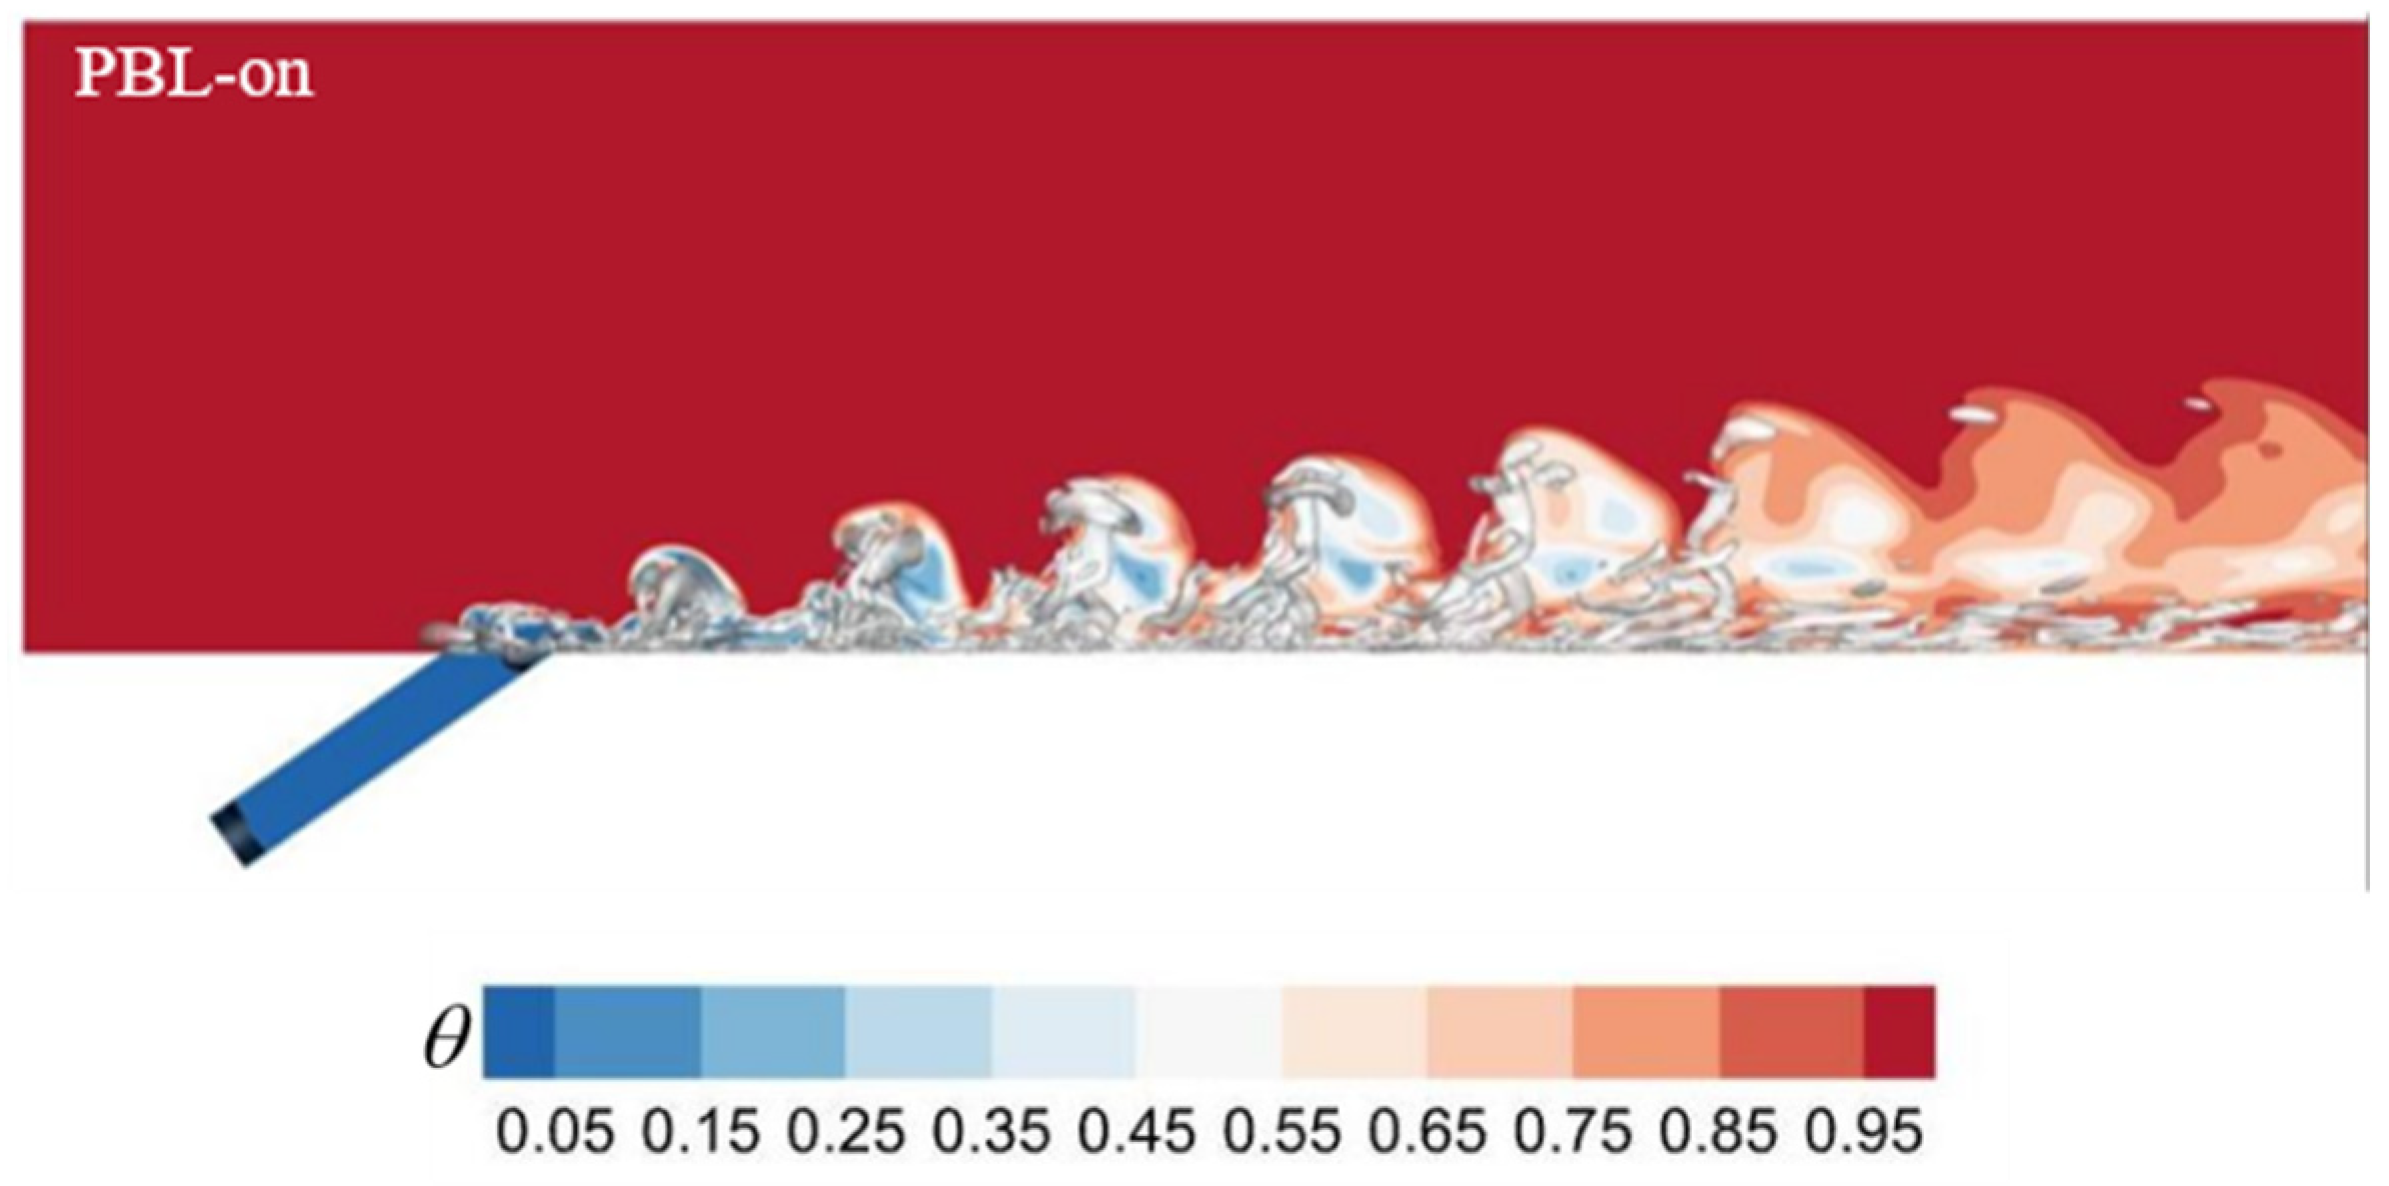
The dimensionless temperature (DT, θ) colors the instantaneous Q iso-surface, where DT (θ) = (T - Tc) /(T - Tc) (Figure 16, Figure 17 and Figure 18). In the UBL case, the classical coherent structures are clearly observed, it can be seen that horseshoe vortices are formed at the upstream of the cooling hole exit due to the pressure gradient. The fluid temperature in the horseshoe vortices is higher, indicating the aggravation of the mixture of the coolant plus crossflow via the horseshoe vortices. Notably, a series of structurally complete hairpin vortices can be clearly identified, and these hairpin vortices actually dominate the entrainment and mixing of the crossflow. The close association of heads, normal legs, and horizontal legs of the hairpin vortices with shear layer vortex, upright wake vortex, and CRVP, respectively [36]. The heads of the hairpin vortices are caused by shearing effect and then leads to a strong entrainment of the coolant with the crossflow. As a result, the increase of the mixed fluid temperature could be found the hairpin vortices. The enlarged size of the hairpin vortices and their shifting from the wall could be gradually found, and small-scale turbulent vortices could be eventually resulted, highlighting their noticeable role in the far field region.
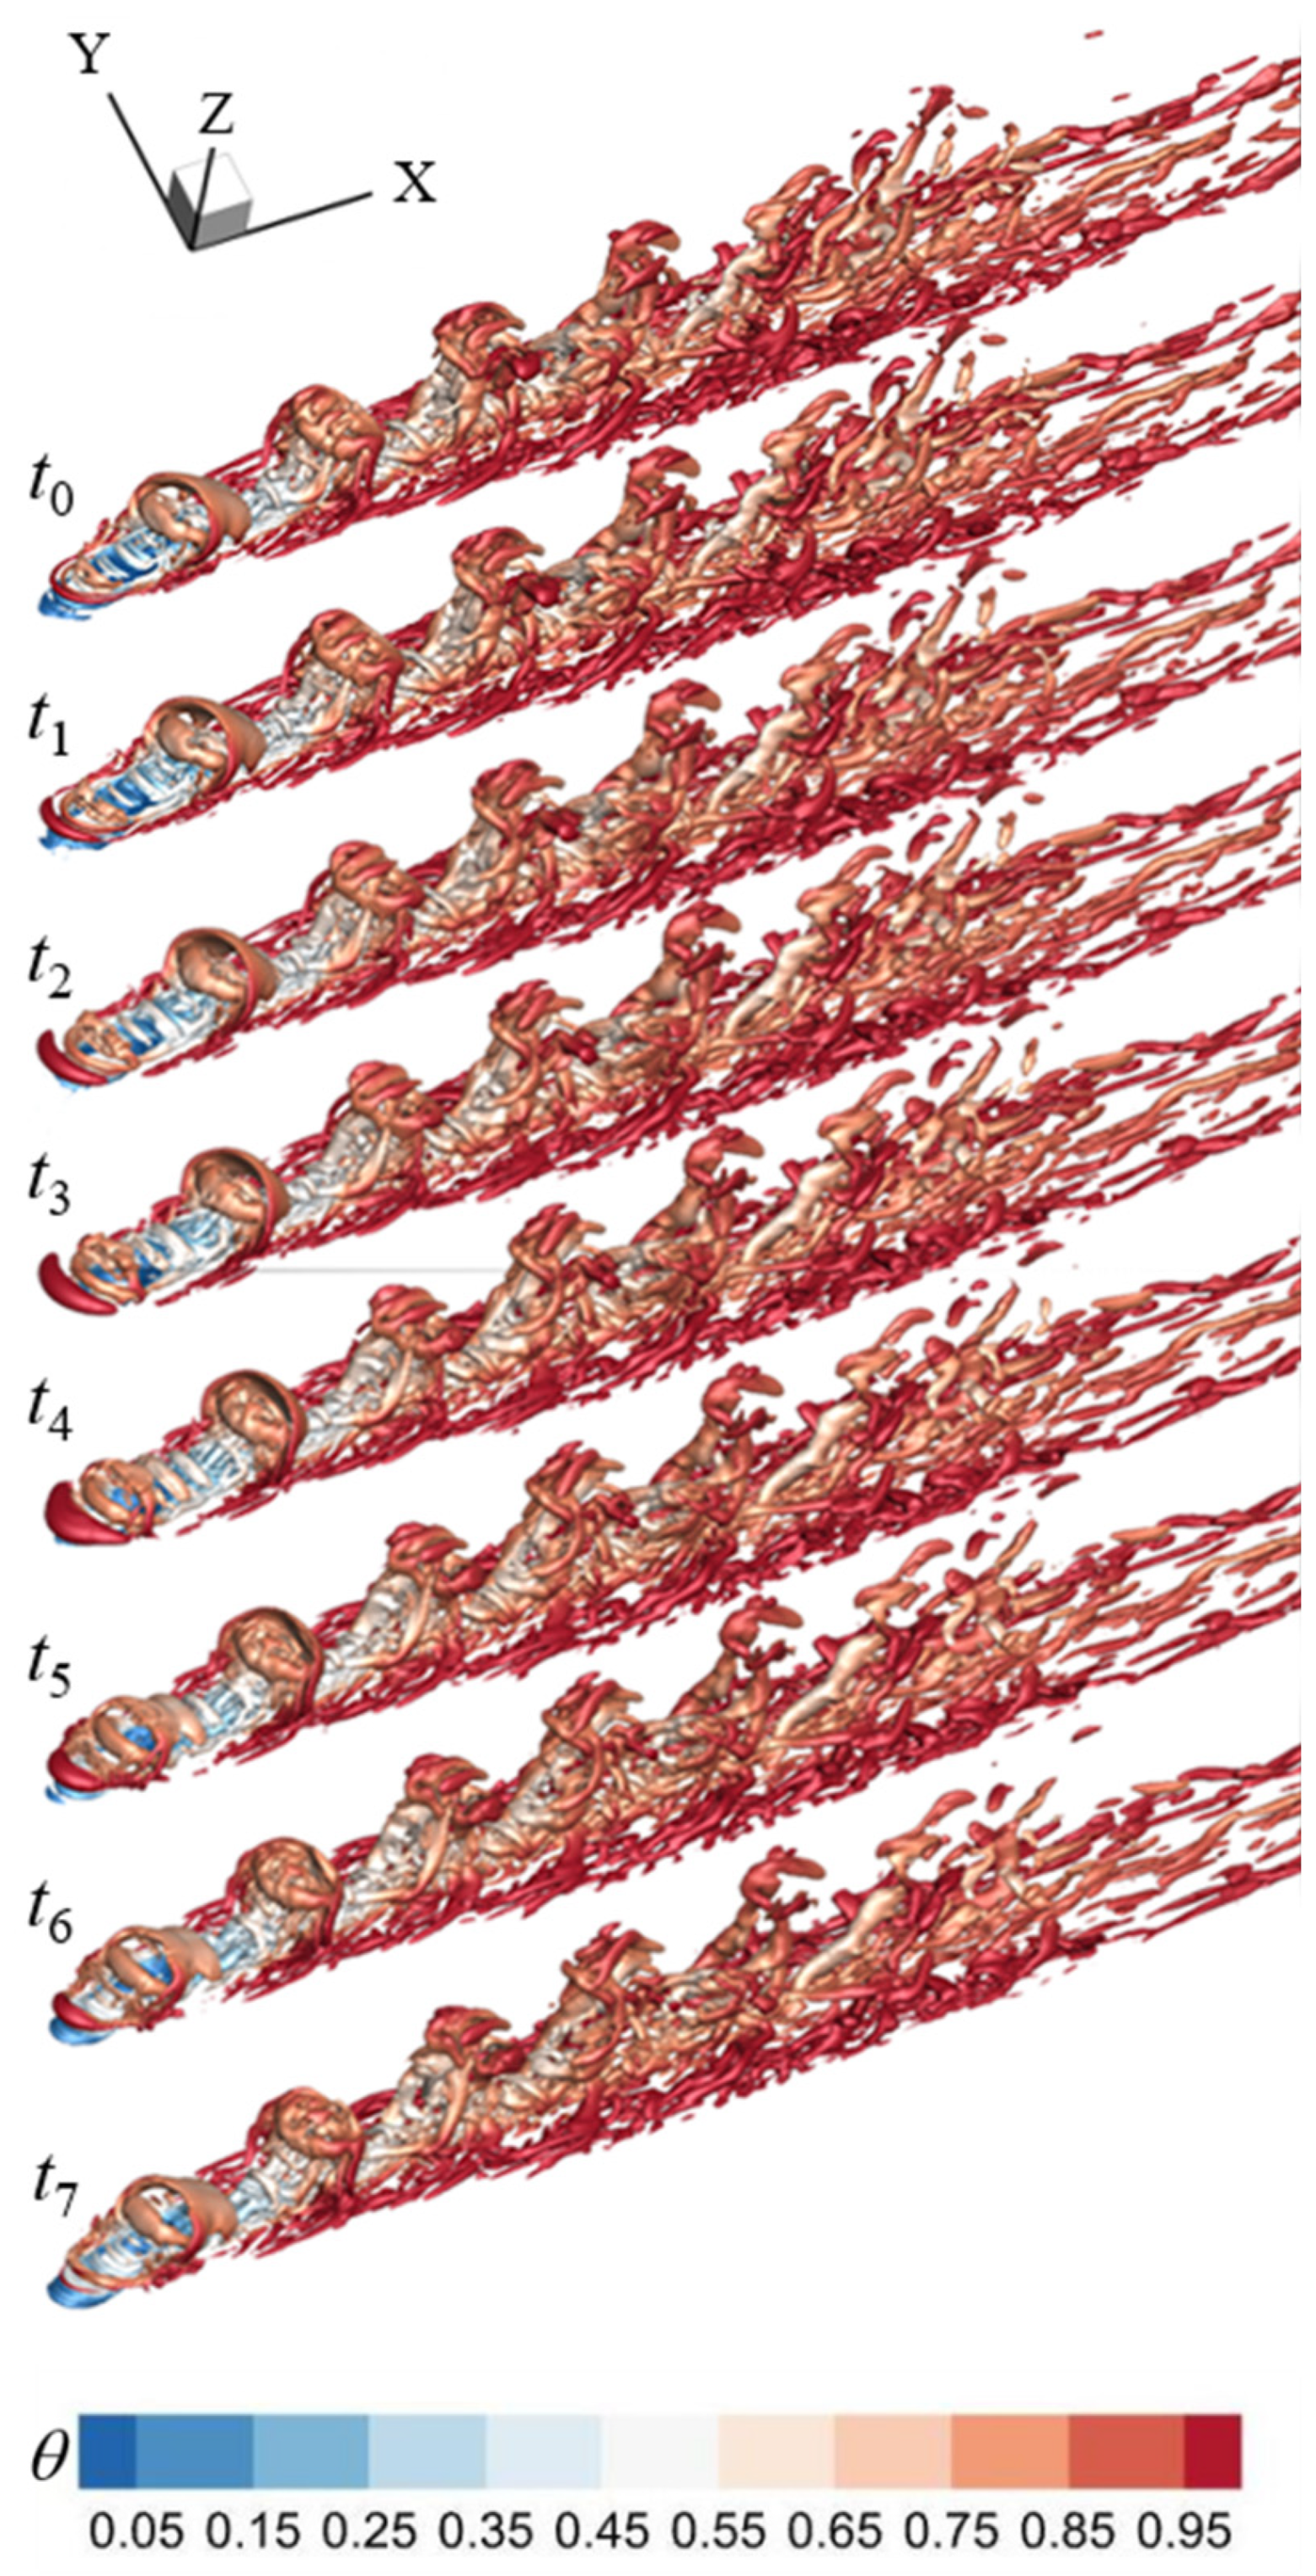
In the PBL-off case, the horseshoe vortices are also found at the cooling hole exit, while their structural sizes are small than that of the UBL case, and their structural sizes are also varied with time due to the pulsation of the cooling jet. Notably, instead of the structurally complete hairpin vortices, the LSCSs are clearly observed, and these coherent structure groups are intermittent distributed in the wake region, which may result from the periodic variations of cooling jet-crossflow the interaction, which caused by the pulsation of the cooling jet. In case of a noticeable BR, the cooling jet-crossflow interaction strongly forms the coherent structure groups; conversely (i.e., a reduced BR), the close position of cooling jet to the wall surface is expected. Moreover, it is possible to see the formation, growth, stretching, distortion, and disintegration of the cohesive structural groups gradually and clearly from t = t0 to t = t7, and the coherent structure groups persist a short downstream distance and happen to breakup earlier, leading to a low FCE in the wake region.
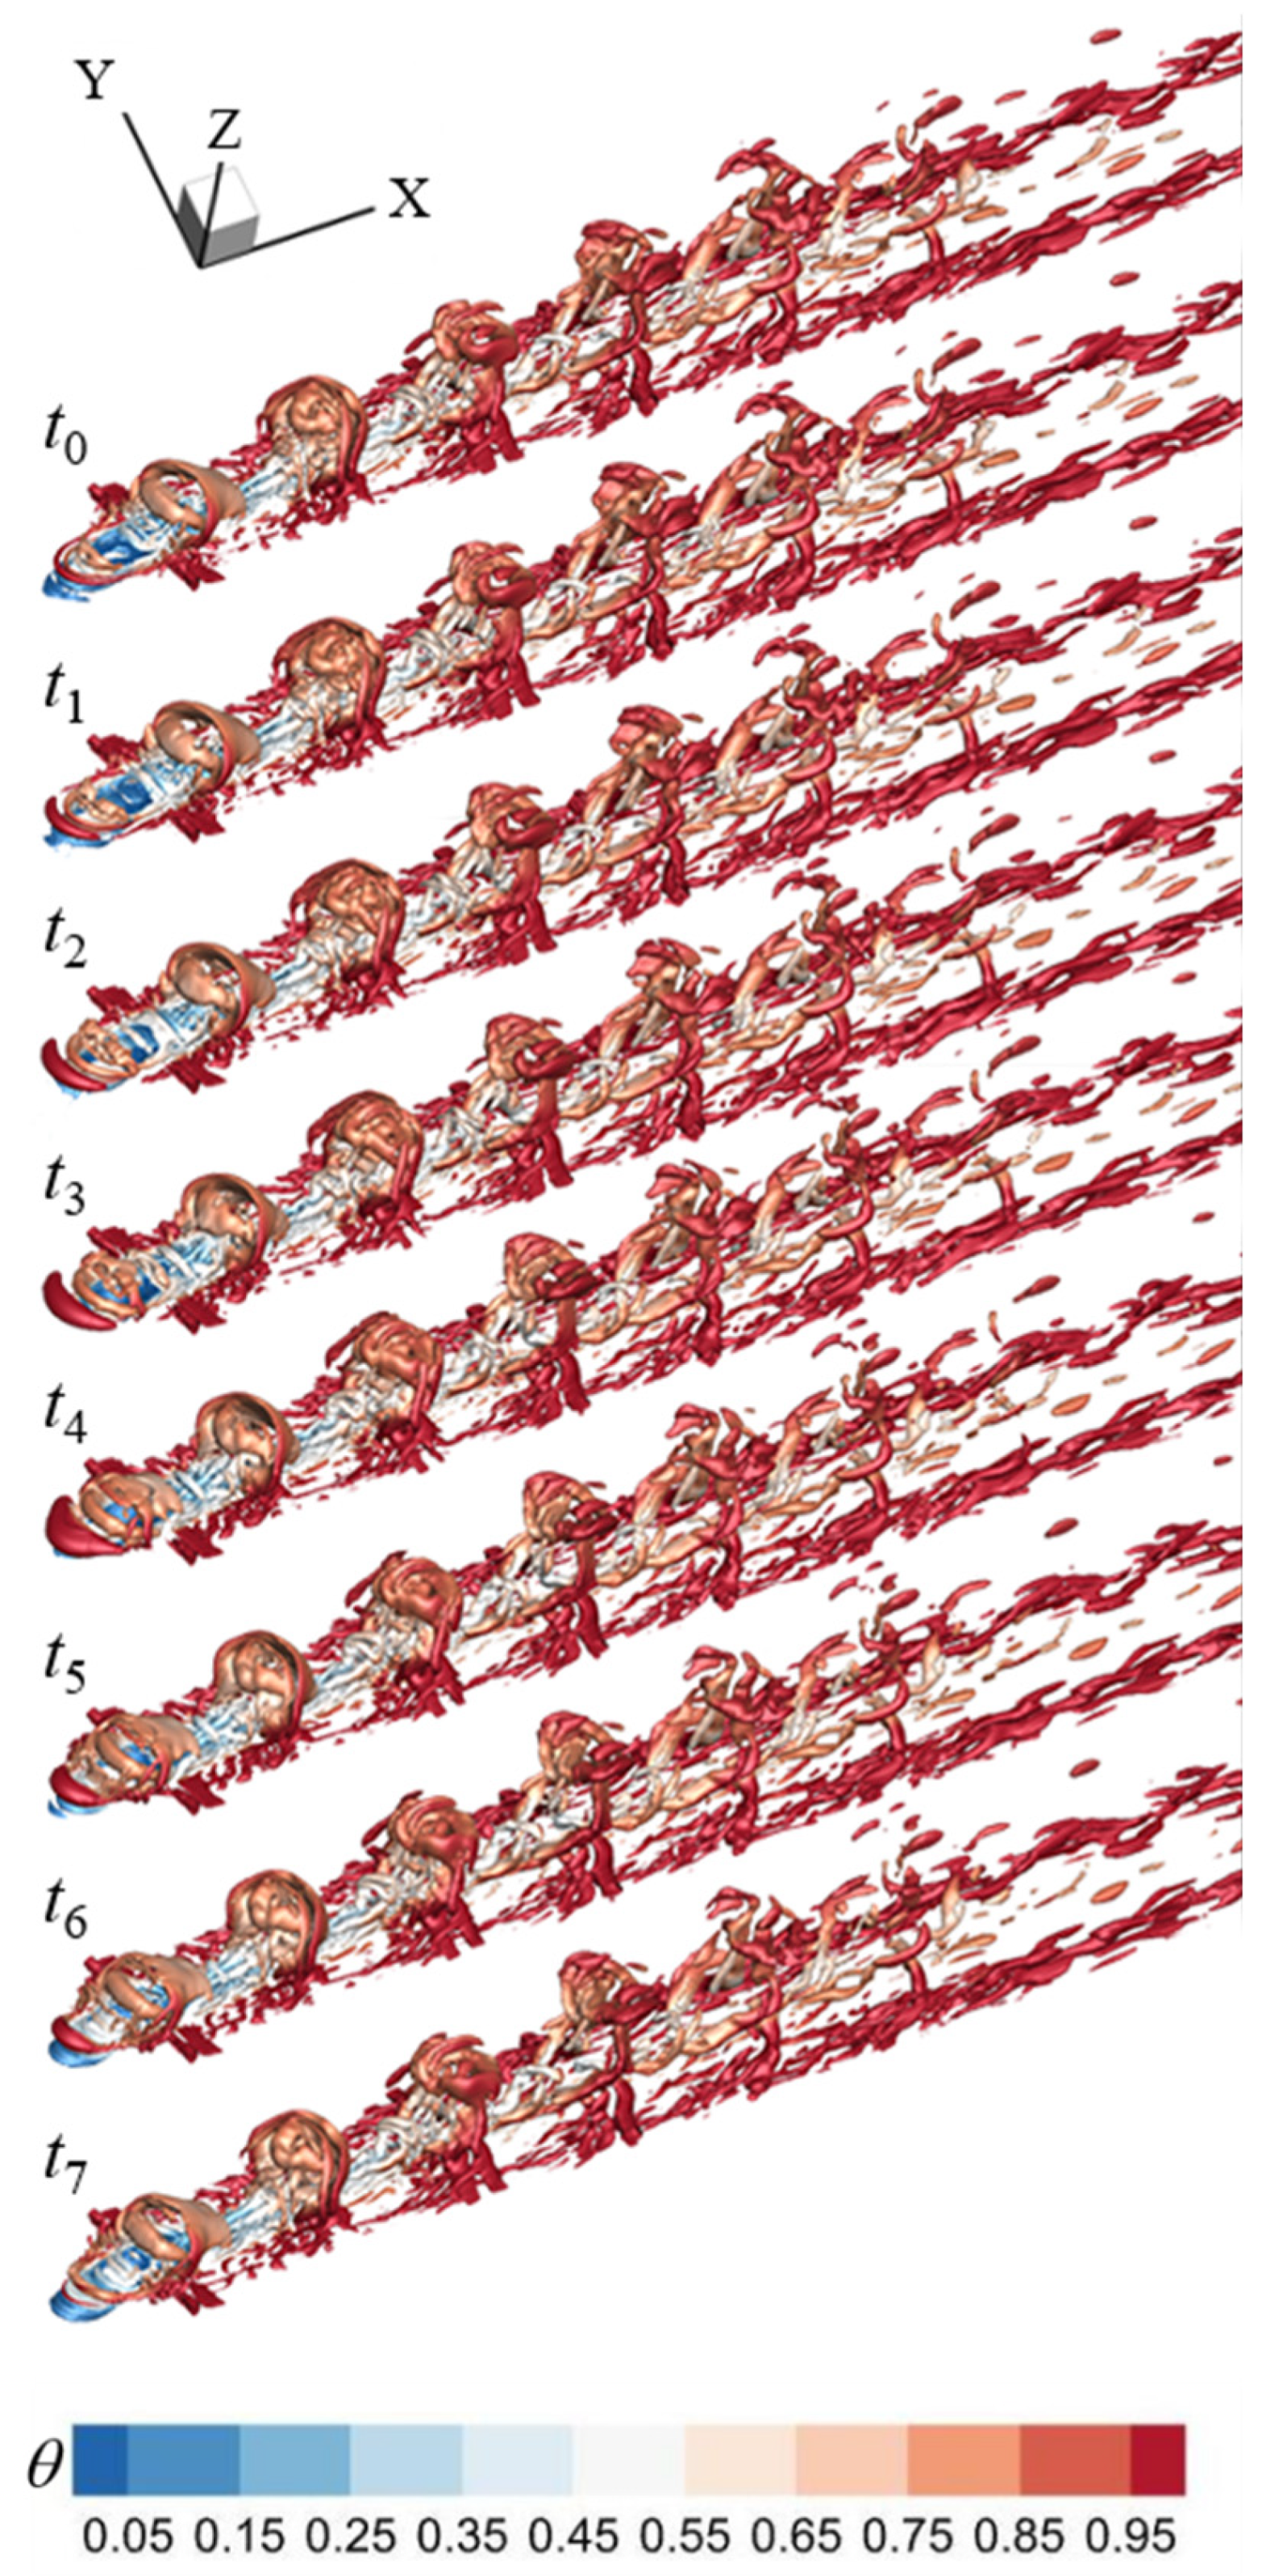
After applying the PAA (Figure 18), the structural sizes of the coherent structure groups are greatly reduced, and the number of LSCSs in the groups is also reduced. These differences could be the consequence of the downward force produced by the PAA preventing the pulsed coolant jet from penetrating the cooling and diminishing that pulsed jet-crossflow connection. Additionally, the downward force deflects the pulsed coolant jet in the direction of the wall appear, bringing coherent structure groups closer to the wall surface. Compared to the PBL-off example, the intermittent coherent structure groups break apart early and endure for a shorter downstream distance. In addition, the turbulent vortices in the far field region have smaller size than that of the PBL-off case, thus reducing the turbulent incorporation of the crossflow with the coolant.
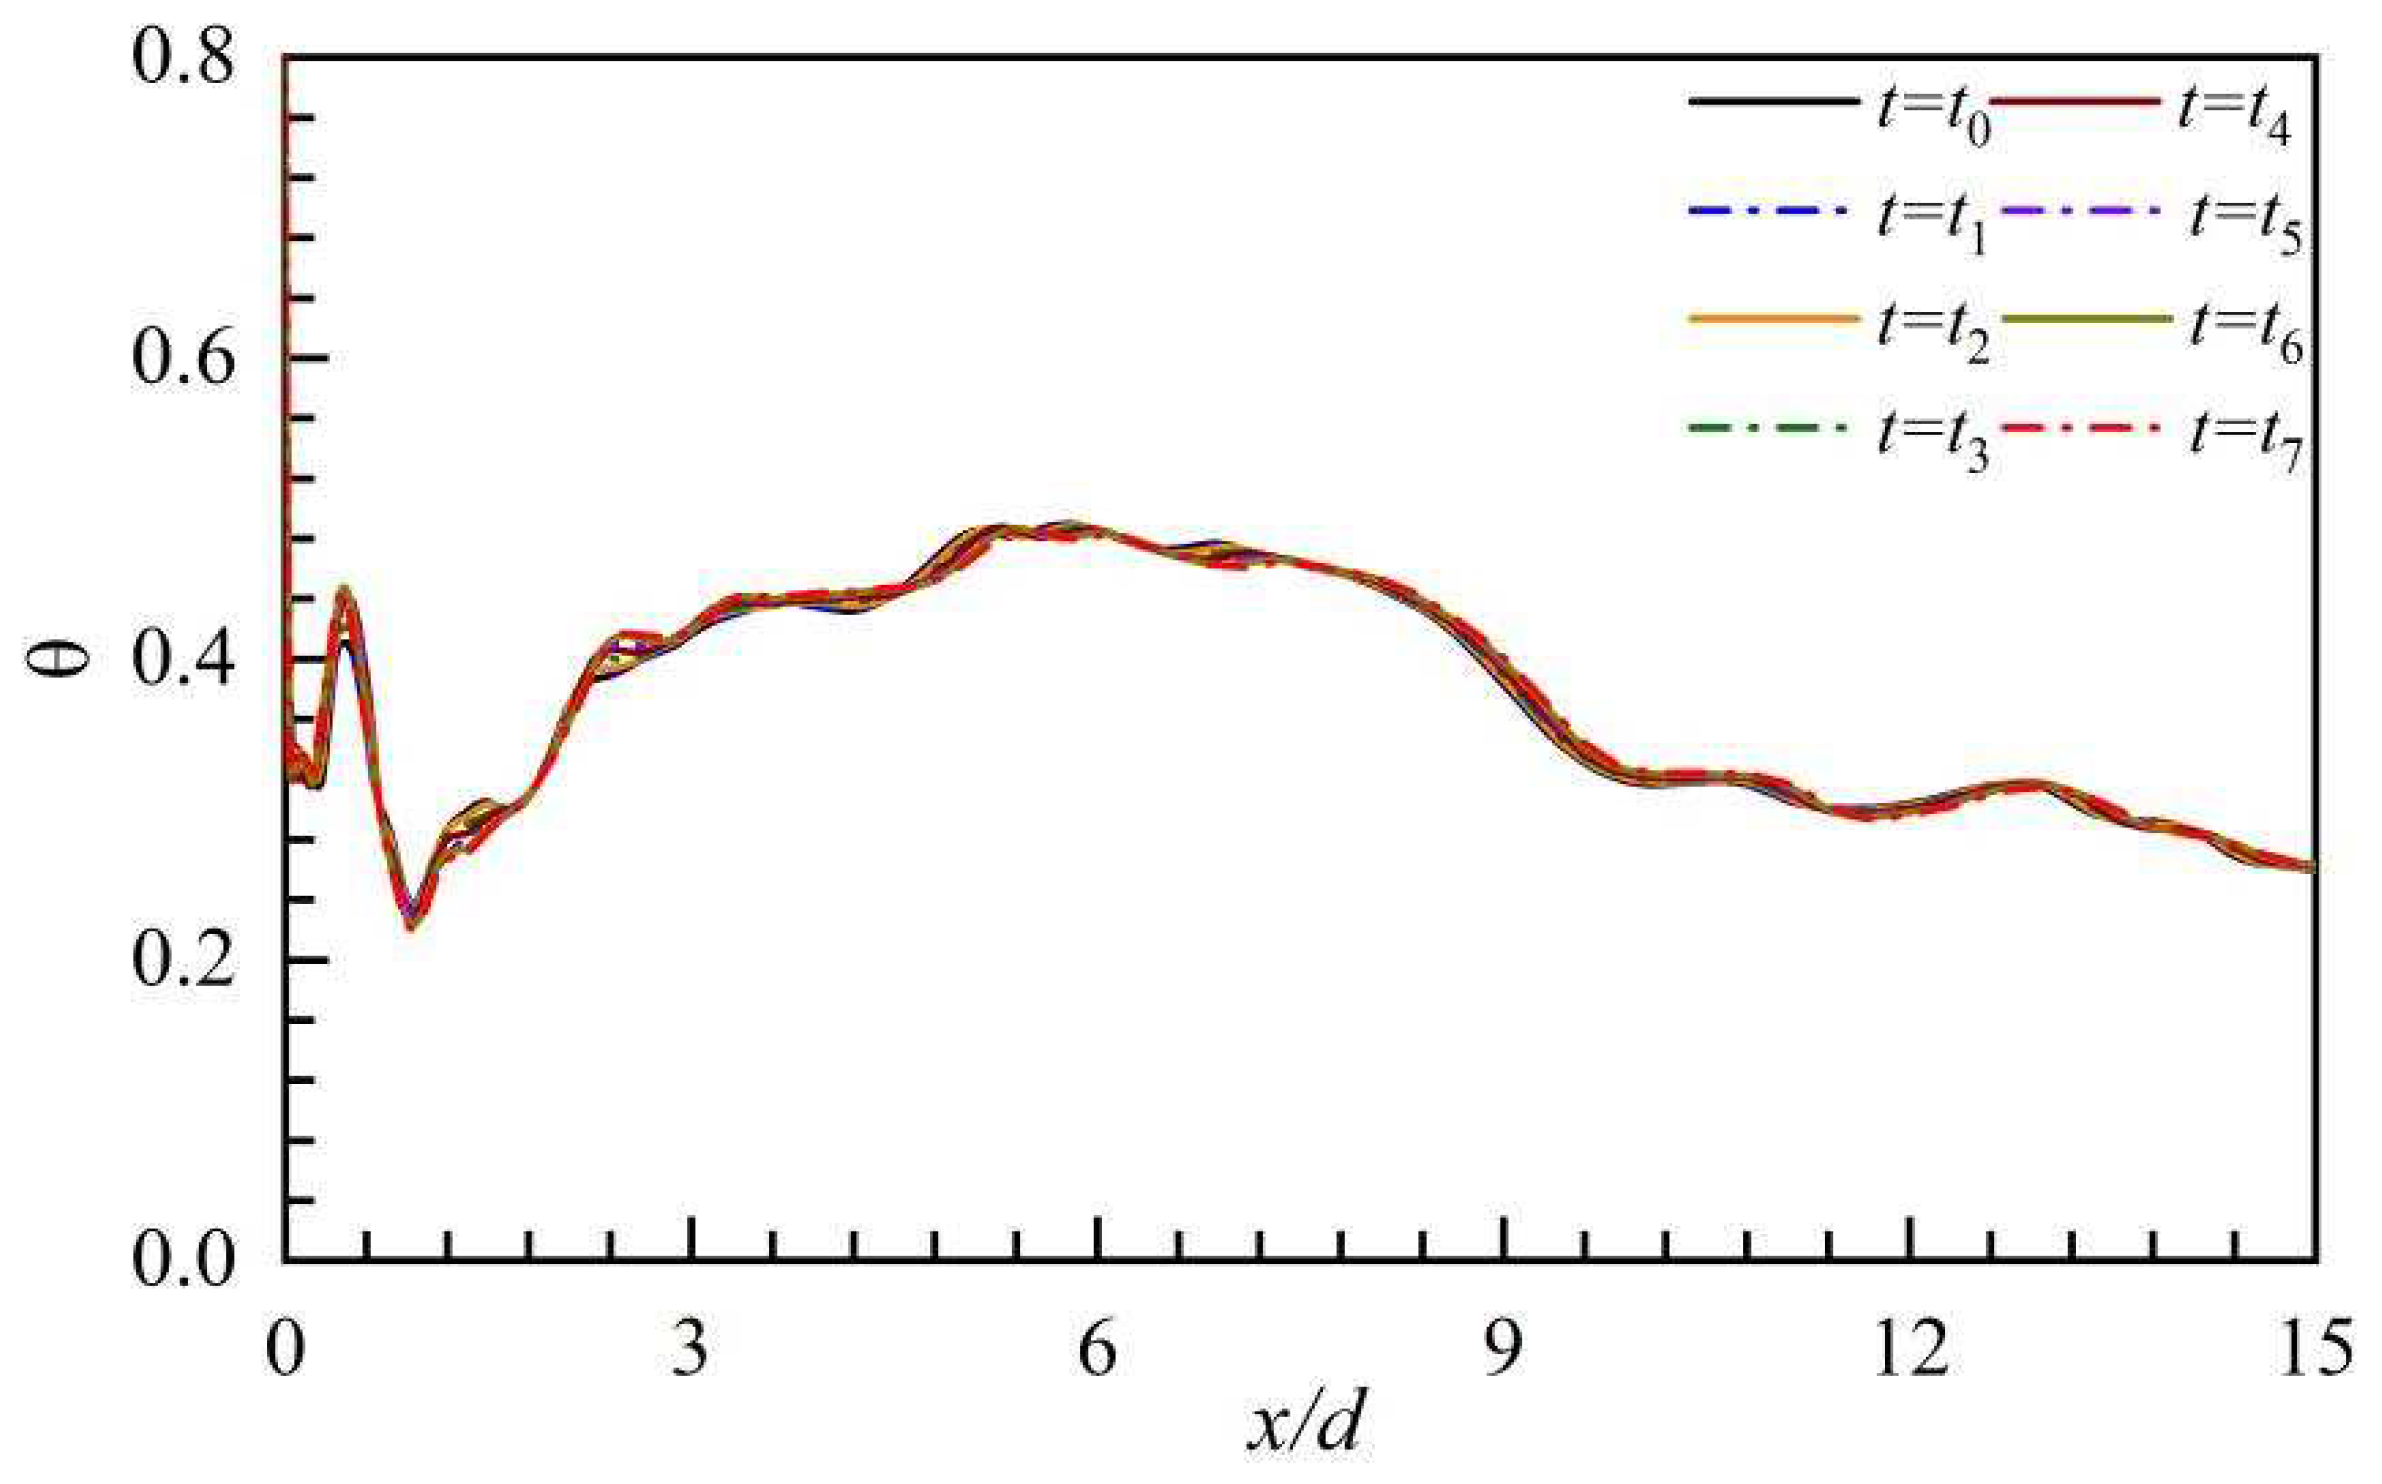
The coherent structures are beneficial to determine temperature distributions, especially in the flat plate, and the fluctuations of the DT, particularly in the hole centerline in a cycle, are illustrated in Figure 19, Figure 20 and Figure 21. The fluctuation of centerline temperature (CT) around the time-averaged values can be found in a cycle, while their distribution trends along the streamwise direction are likely to remain unchanged. In the UBL case, the fluctuation values of the CT are smaller than that of the other two cases, this because the unpulsed film cooling has same BR in a cycle, and the small CT fluctuations are presumably caused by the STD of the coherent structures, which are intermittent distributed in the wake region.
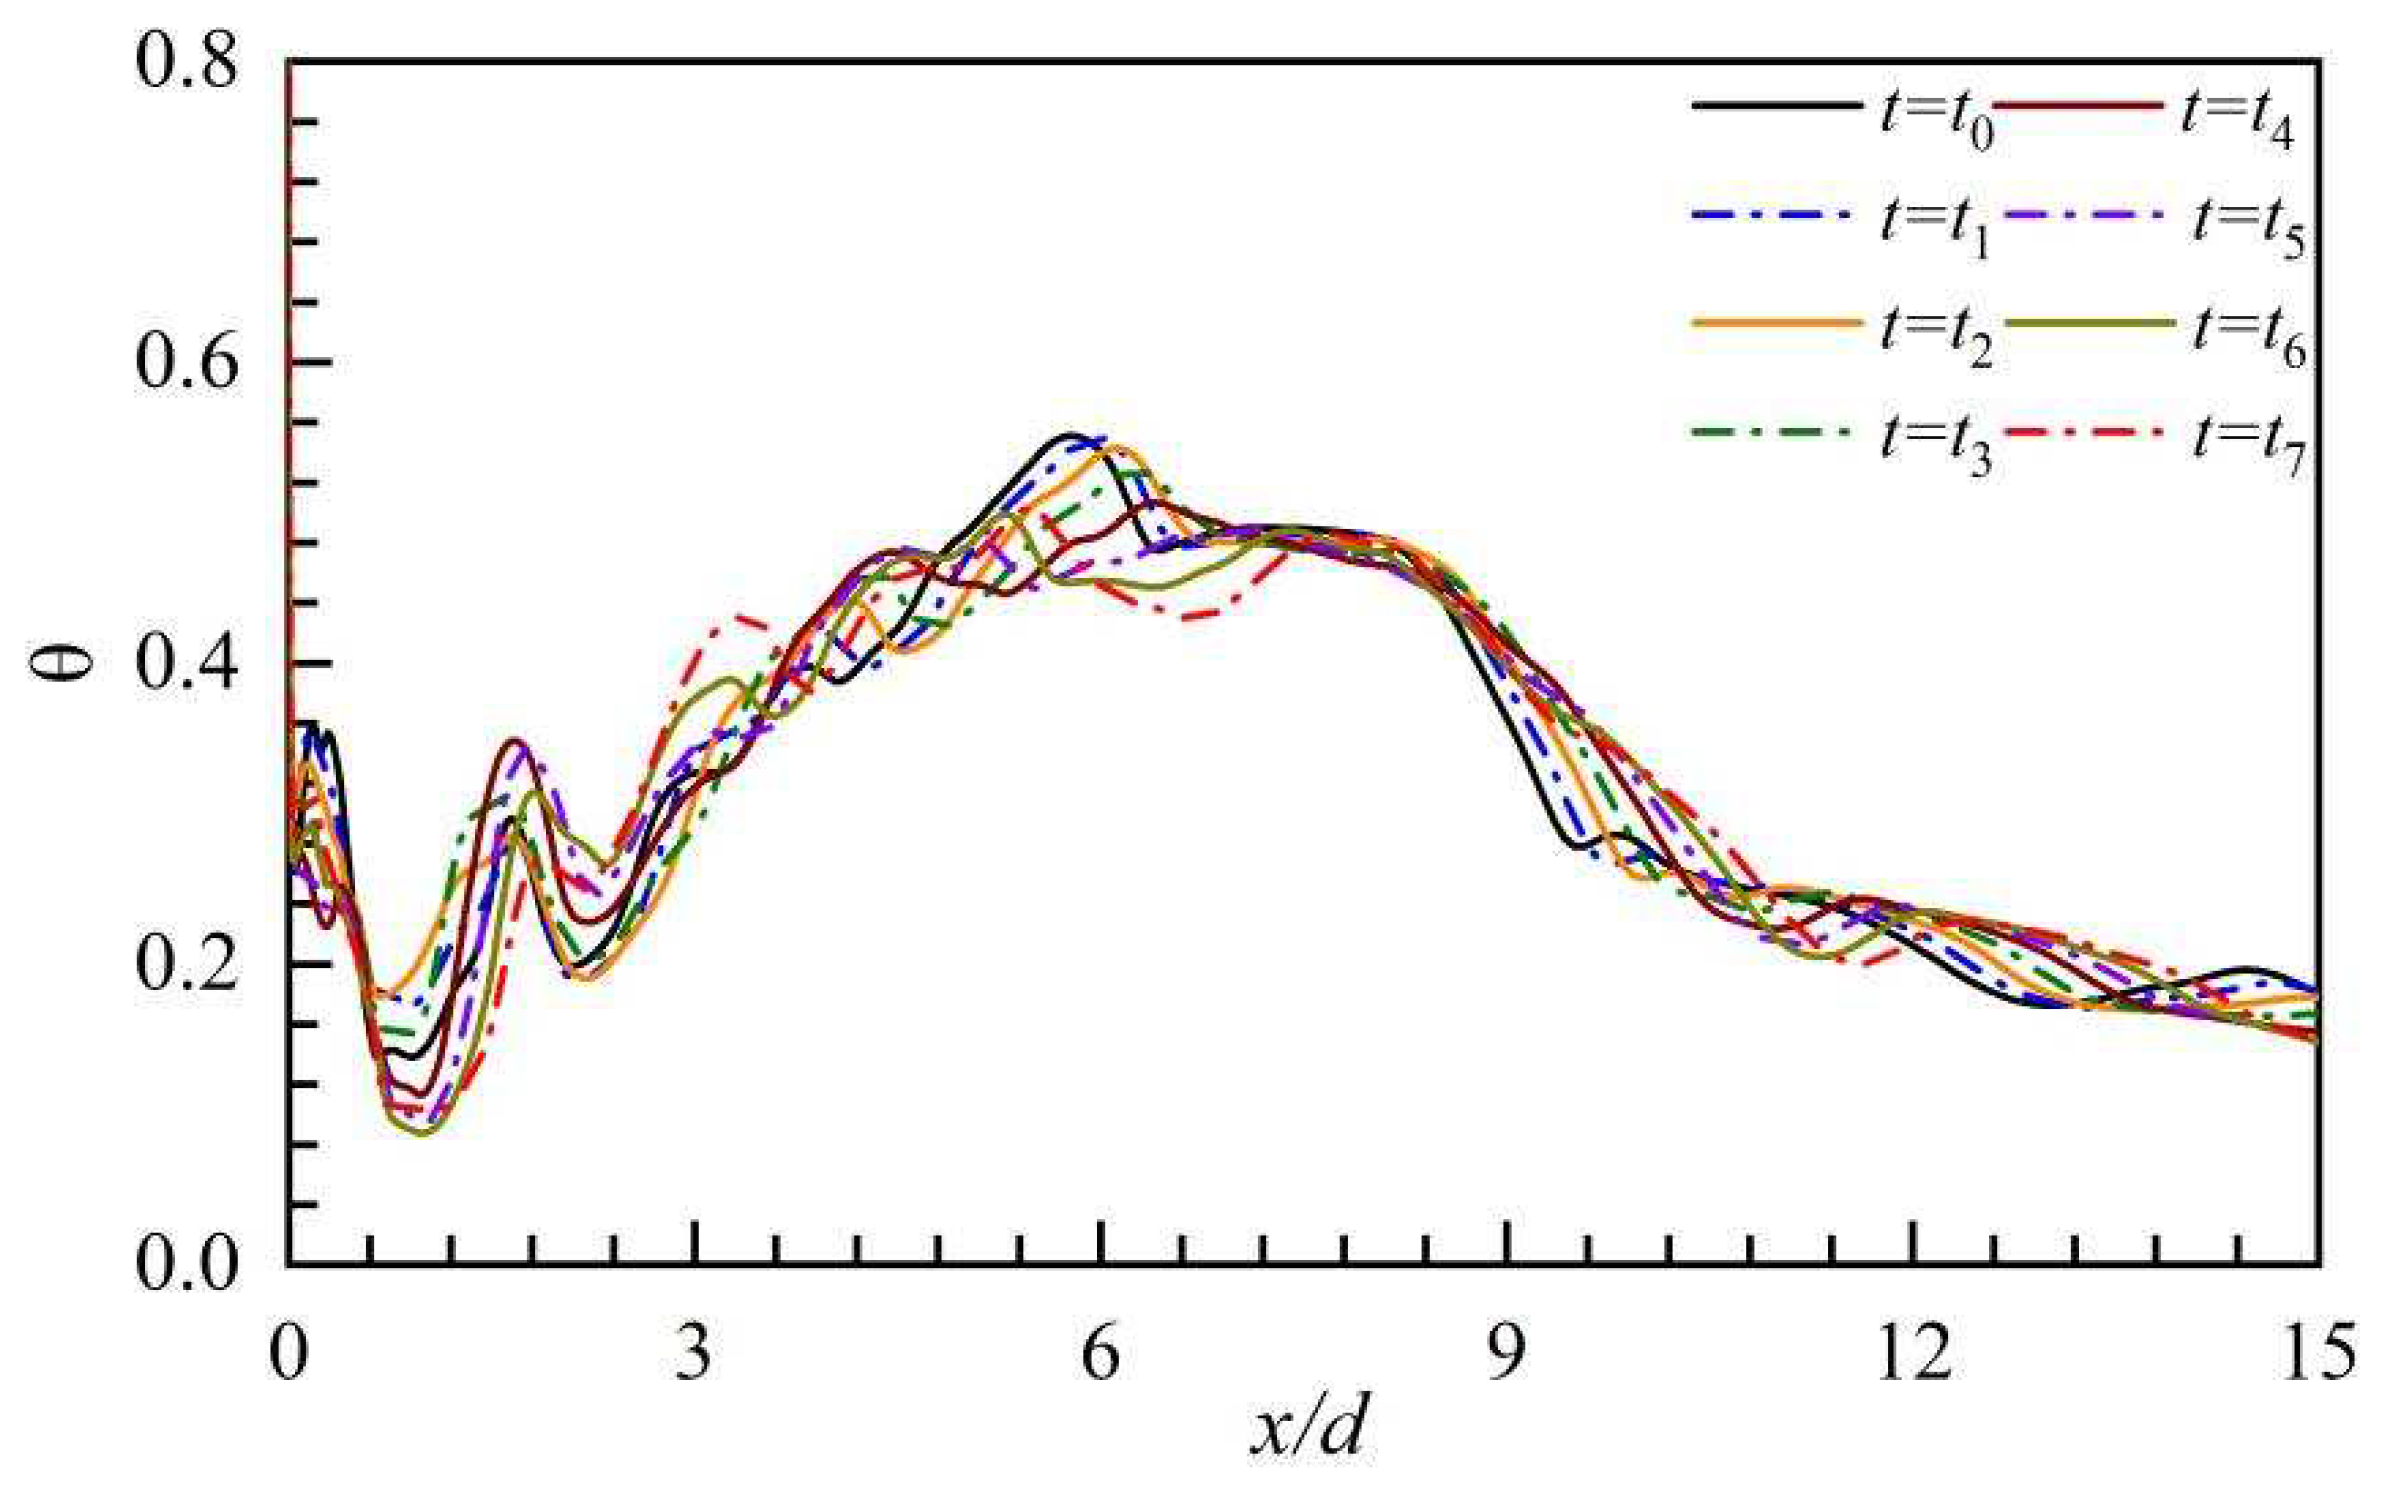
In the PBL-off case, the centerline DT varies regularly with time, and this is very different from the UBL case. The positions of the minimum CT significantly fluctuate with time, which may be seen at the recirculation zone, in which the pulsed cooling jet causes a highly complex reverse flow. While times passes through, the discontinuous coherent structure groups occasionally come downstream accompanying along the pulsed cooling flow, thus contributing to ordered changes of the CT. At t = t0, the coherent structure groups happen to breakup at x/d=6, followed by turbulent incorporation of the coolant plus crossflow that is remarkably enhanced, and the rapid rise of CT is attainable. The last coherent structure group is regularly and gradually extended to downstream, the locations of the minimal CT are accordingly altered in downstream, and the minimal CT has some increment due to the turbulent incorporative effect. In the far field region, the CT is also regularly altered with time as the small-scale turbulent vortices still propagate downstream orderly.
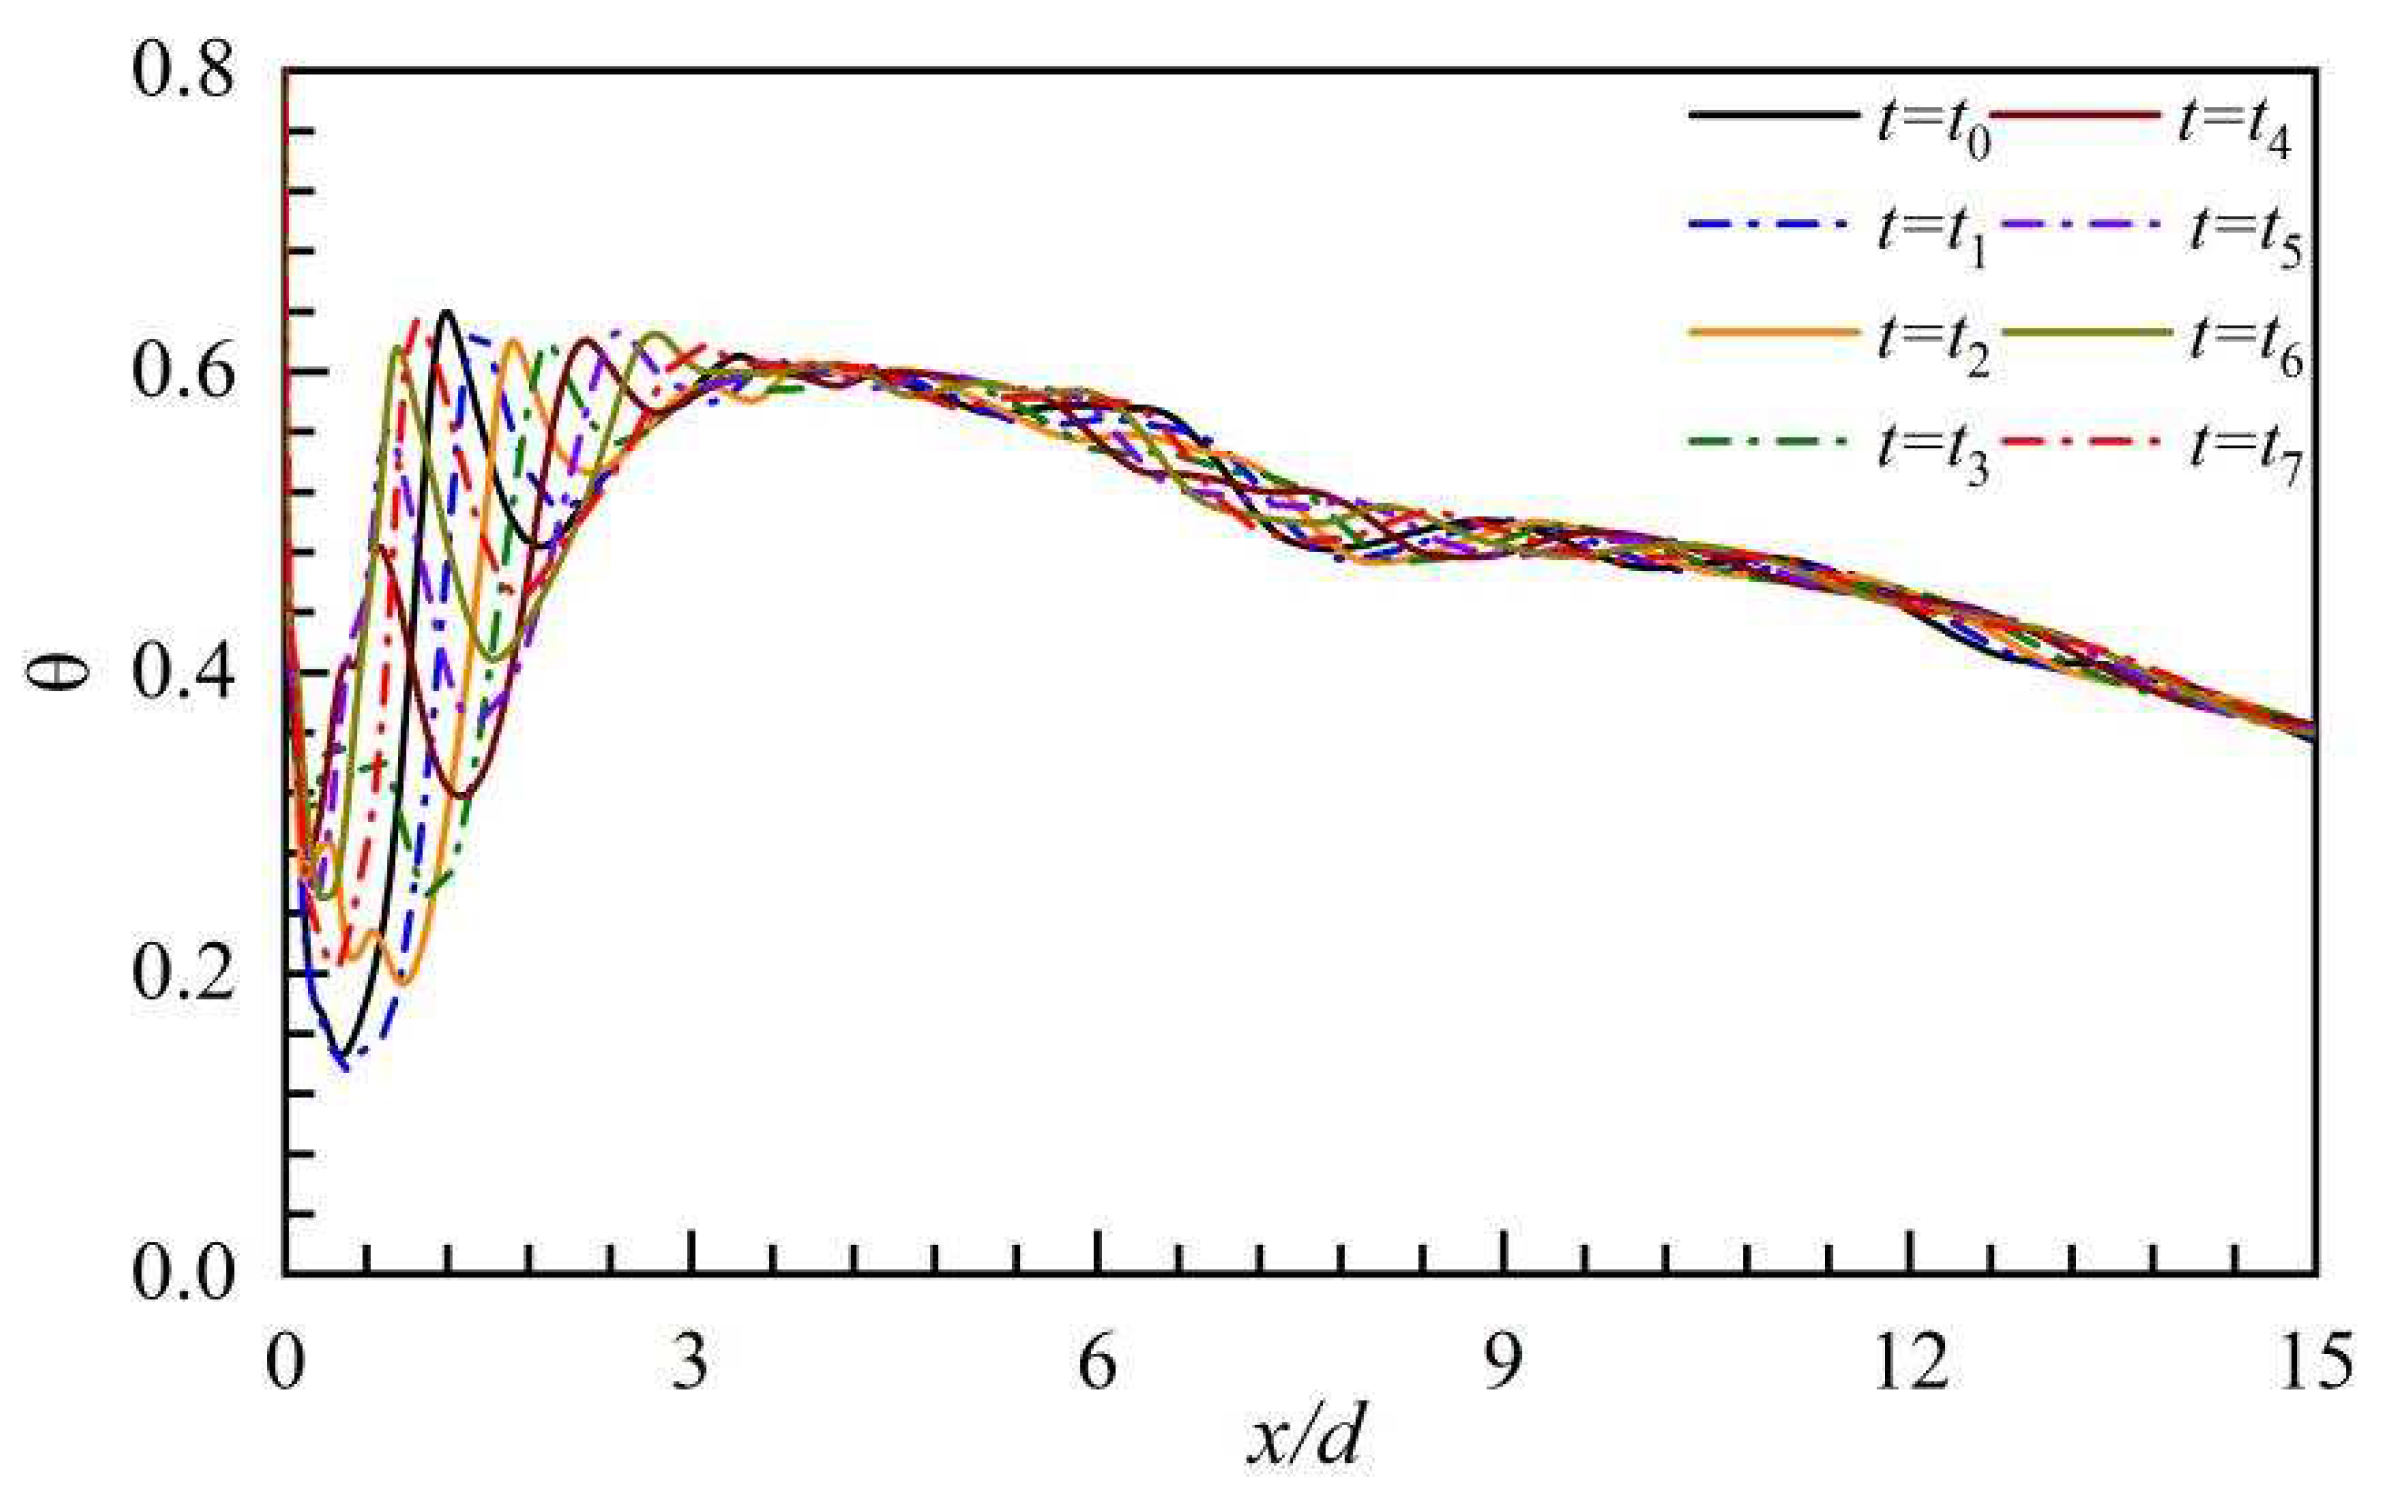
The centerline DT in the PBL-on condition is substantially less than in the PBL-off condition. Clearly, the CT just downstream of the cooling hole remarkably fluctuates with time, because the PAA may effectively terminate the reverse flow just downstream of the cooling hole as the BR is low, and the control effects of the PAA are reduce as the BR is risen. At x/d > 3, versus PBL-off case, the fluctuations of the CT are noticeably lower, because the PAA reduces the strength and size of the coherent structure groups.
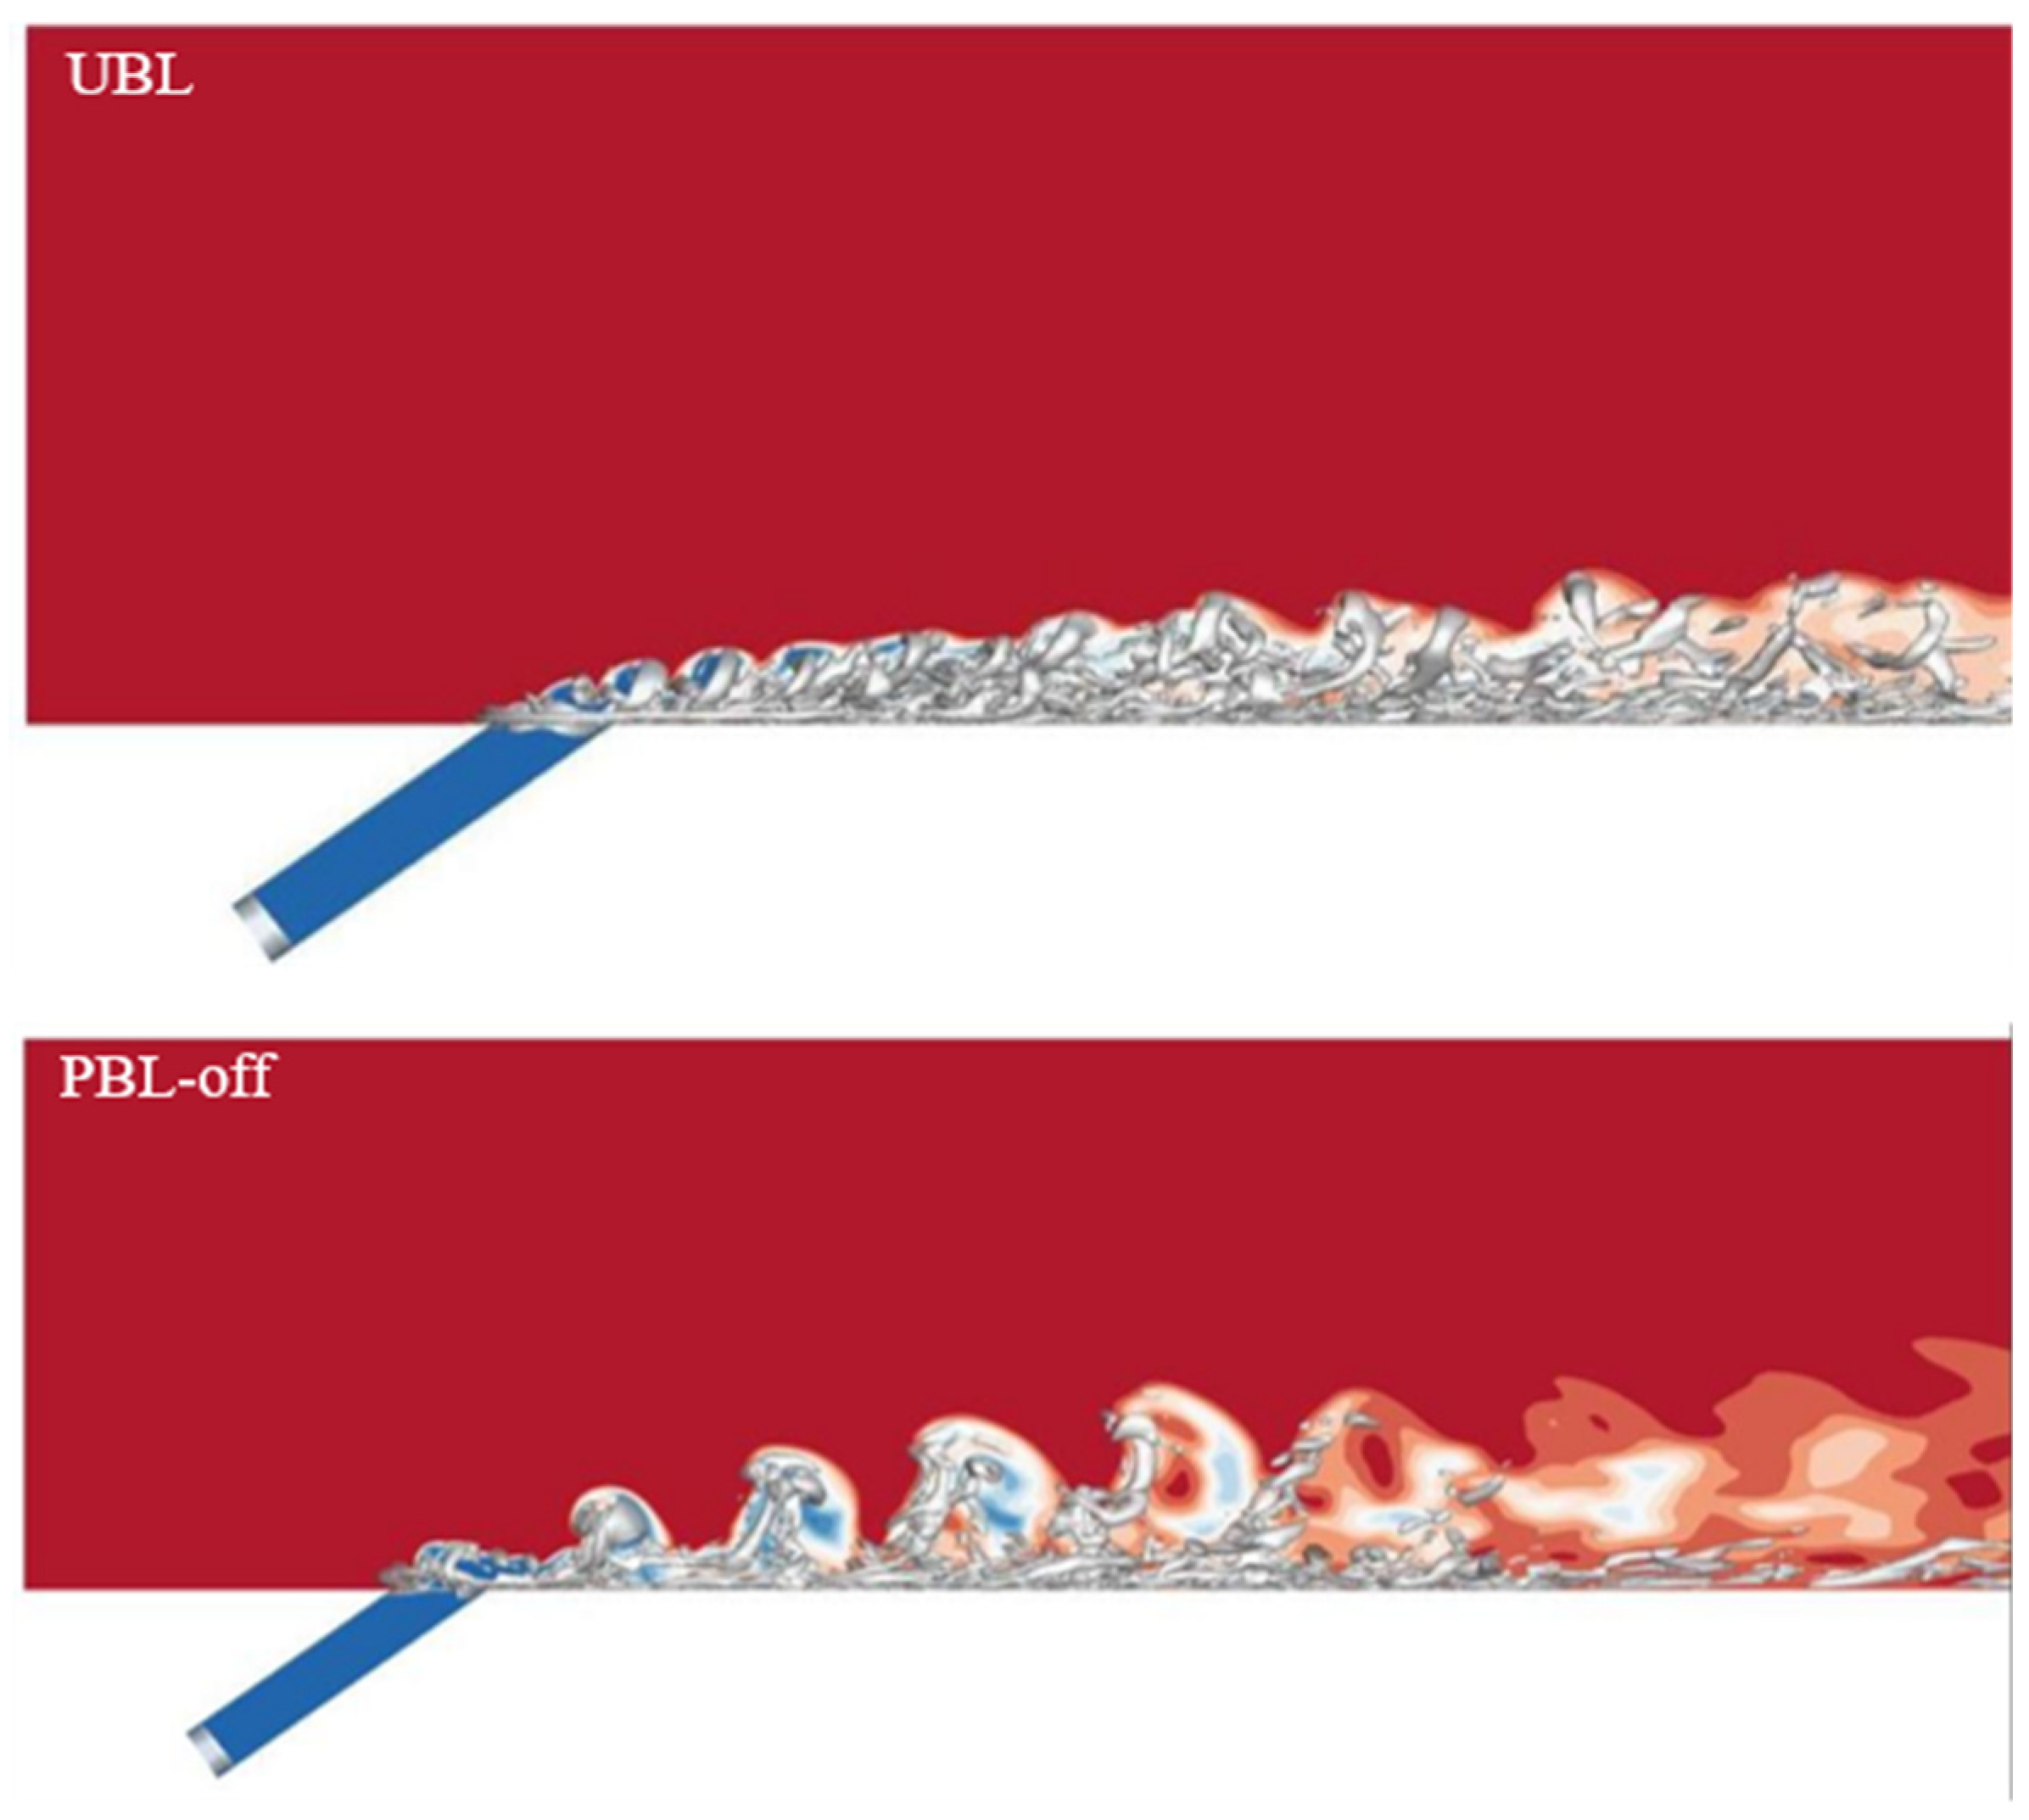
Figure 22 shows the contours of instant DT superimposed with the Q iso-surface, providing a new perspective on understand how the PAA influences the temperature field. Billows form at the interface of the cooling jet and the crossflow in the UBL case because the heads of the hairpin vortices induce high entrainments at the cooling hole exit, which subsequently exacerbate the coolant's mixing with the crossflow.. It is reasonable to infer that the hairpin vortex head has detrimental effects on the FCP. In the PBL-off case, the intermittent coherent structure groups dramatically aggravate the mixing of the coolant with the crossflow, resulting in the low temperature regions out of the wall surface, and the low temperature regions have obviously intermittency due to the pulsed cooling jet. In the PBL-on case, the structural sizes of the coherent structure groups are much smaller than that of the PBL-off case thanks to the PAA. As a result, the low temperature regions stay closer to the wall surface, and the intermittency of the low temperature regions is weakened.
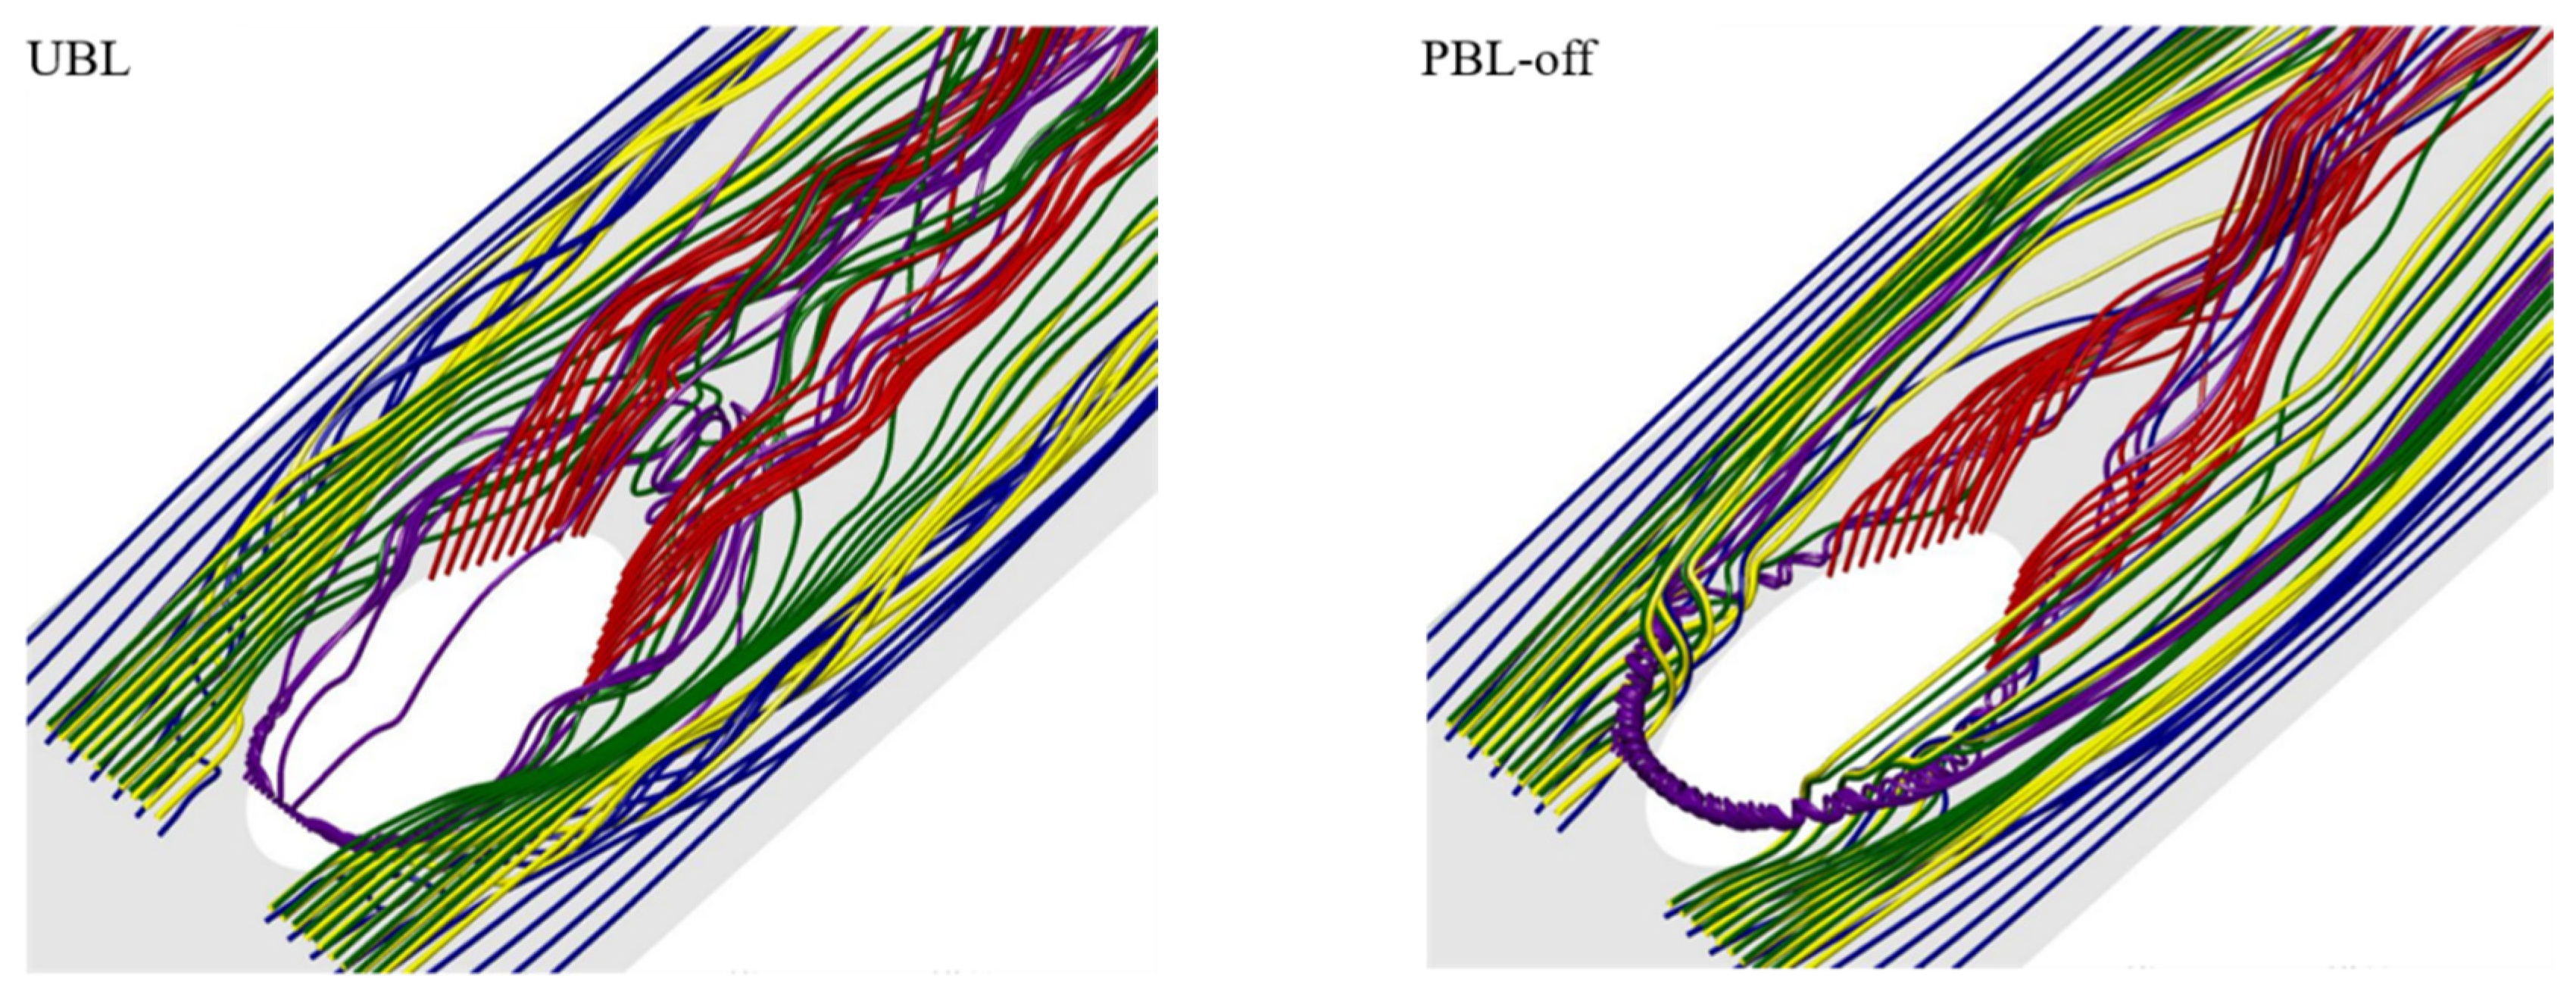
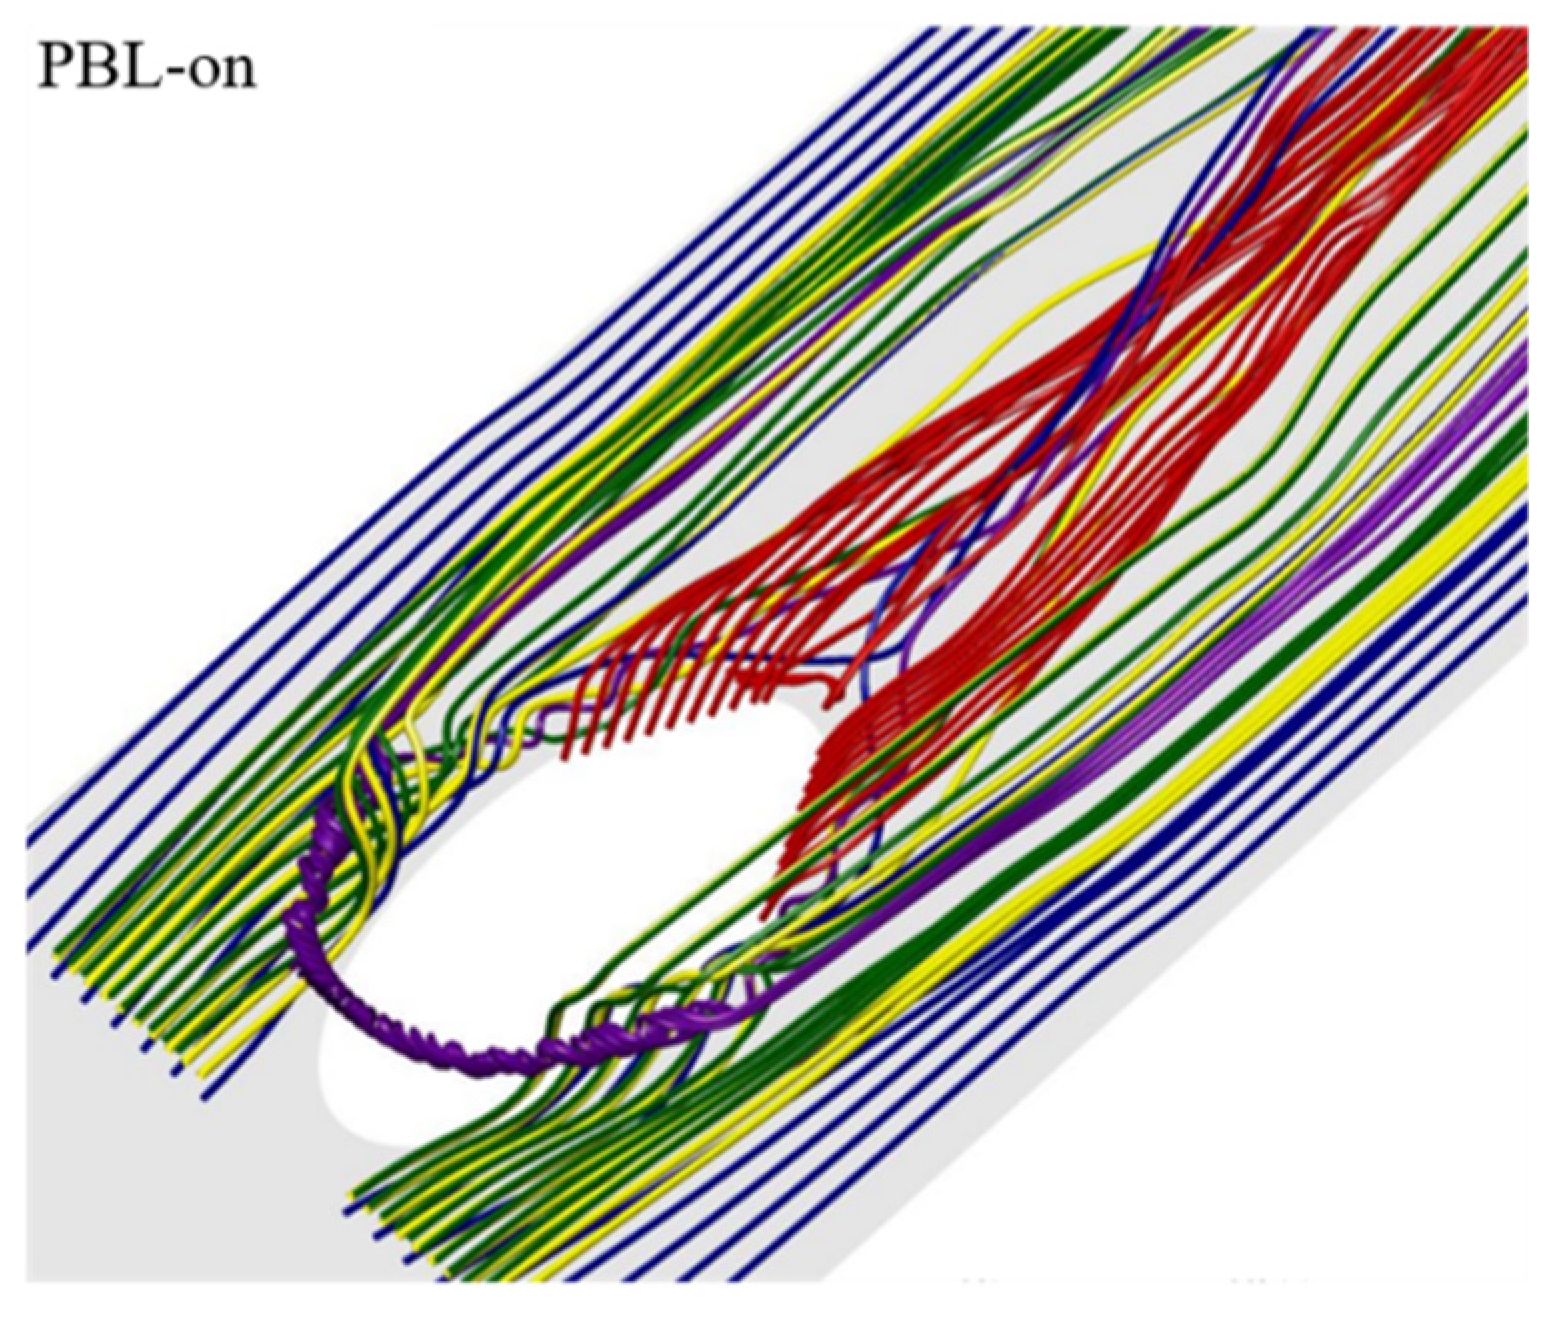
In order to deepen comprehension for the jet-crossflow interactions, the three-dimensional streamlines are drawn in Figure 23. As can be seen from the purple streamlines, the horseshoe vortex is formed at the upstream of the cooling hole exit. In the UBL case, the purple streamlines wrap the cooling jet and then flow into the recirculation region and exacerbate the turbulent mixing, eventually intertwine with the red streamlines and contribute to the development of the CRVP. While approaching to the downstream, the purple streamlines and the red streamlines gradually shift away from the wall together accompanying with cooling jet flow. In the PBL-off case, the purple streamlines have larger heights at the upstream of the cooling hole exit due to the instantaneous larger BR, meaning that the horseshoe vortex has larger strength. The majority of the purple streamlines directly flow downstream, and some of the purple streamlines intertwine with the red streamlines. Moreover, just downstream of the cooling hole exit, the red streamlines stay closer to the wall surface since the BR is low at this moment, and then the red streamlines rapidly move away from the wall surface due to the coherent structure group. In the PBL-on case, the purple streamlines are shifted downstream indicating that the horseshoe vortex is formed at slightly farther downstream. This may result from the PAA-generated downward force that may make the cooling jet closer to the wall surface, thereby attenuating the pressure gradient at the upstream of the cooling hole. Downstream of the cooling hole, the red streamlines and the purple streamlines are closer to the wall surface, indicating that the PAA weakens the lift-off effects of the CRVP.

6. Conclusions

LESs of the pulsed film cooling without and with the PAA are conducted to uncover the underlying control mechanisms. After a qualitative and quantitative analysis of the time-averaged film cooling flow fields, a spatial-temporal evolution of the coherent structures was examined to determine the influences in greater detail. The main conclusions can be summarized as follows:
(1) The coolant pulsation might cause a slight reduction in the film cooling efficiency as the averaged pulsation BR was 1.0, while the PAA could effectively improve the pulsed film cooling efficiency and it would be superior to the steady-state film cooling.
(2) The pulsed cooling jet could penetrate deeper than the steady-state film cooling in the near hole region, thus, the jet-crossflow interactions produced large-scale CRVP, promoting the turbulent integration. Because of PAA, the penetration depth of the pulsed cooling jet was greatly reduced that could be attributable to the downward force, and the detrimental lift-off effect and entrainment of the CRVP were weakened.
(3) Rather than hairpin vortices, the intermittent coherent structure groups formed in the pulsed film cooling, along with their upcast behavior, these groups shifted off of the the wall surface and evolved downstream, thereby aggravating the turbulent integration of the coolant with the crossflow. The coherent structure groups were reduced in size and strength owing to the PAA, and their upcast behaviors were attenuated, thus, the turbulent integration was suppressed fundamentally and the film cooling efficiency was enhanced.
(4) The three-dimensional streamlines also confirmed that the PAA could effectively control the unsteady dynamic behaviors of the LSCSs, and the height of the three-dimensional streamlines was significantly reduced, indicating that the pulsed cooling jet flow was positioned close to the wall surface owing to the PAA.

Acknowledgements

The authors gratefully acknowledge financial support for this study and this work is projected by the National Natural Science Foundation of China (Grant No. 12002335), China Postdoctoral Science Foundation (Grant No. 2022M720166), the Fundamental Research Funds for the Provincial Universities of Zhejiang (Grant No. 2021YW24) and Natural Science Foundation of Zhejiang (Grant No. LQ20E060006).

Conflicts of Interest

The authors declare that they have no known competing financial interests or personal relationships that could have appeared to influence the work reported in this paper.

Nomenclature

E electric field intensity (V/m) Greek symbols
Eb breakdown electric field intensity (V/m) ρ gas density (kg/m3)
E0 electric field intensity at the tip (V/m) λ wavelength of plasma actuator (m)
Es electric field intensity at serrated edge (V/m) α intersection angle of actuator (°)
V0 peak AC voltage (V) β angle of plasma force at the tip (°)
l space between the two electrodes (m) η film cooling efficiency (-)
la distance from the root (m) ζ collision efficiency (-)
f pulsation frequency (Hz) δ thickness of boundary layer (m)
e elementary charge (C) ν kinematic viscosity (m2/s)
Δt space of time (s) νsgs eddy viscosity (m2/s)
a height of plasma region (m) ϑ applied voltage frequency (Hz)
b length of plasma region (m) Subscripts
k constants in plasma model (-) aw adiabatic wall
d diameter of film-cooling hole (m) crossflow
x, y, z cartesian coordinates (m) c jet flow
u, v, w velocity component index (m/s) lat lateral-averaged cooling efficiency
T local fluid temperature (K) p plasma actuation in a cycle
t time (s)
k1, k2 constants in plasma model (-)

References

  1. R.J. Goldstein, E.R.G. Eckert, F. Burggraf, Effects of hole geometry and density on three-dimensional film cooling, Int. J. Heat Mass Transf. 17 (1974) 595–607. [CrossRef]
  2. R.S. Bunker, A review of shaped hole turbine film-cooling technology, J. Heat Transfer 127 (2005) 441–453. [CrossRef]
  3. C. Saumweber, A. Schulz, Effect of geometry variations on the cooling performance of fan-shaped cooling holes, J. Turbomach. 134 (2012) 061008. [CrossRef]
  4. K. Kusterer, D. Bohn, T. Sugimoto, R. Tanaka, Double-jet ejection of cooling air for impr-oved film-cooling, ASME Turbo Expo 2006: Power for Land, Sea, and Air Paper No. GT2006-90854, 2006. [CrossRef]
  5. A.F. Shinn, S. Pratap Vanka, Large eddy simulations of film-cooling flows with a micro-ramp vortex generator, J. Turbomach. 135 (2013) 011004. [CrossRef]
  6. C.L. Liu, L. Ye, F. Zhang, R. Huang, B. Li, Film cooling performance evaluation of the furcate hole with cross-flow coolant injection: A comparative study, Int. J. Heat Mass Transf. 164 (2021) 120457. [CrossRef]
  7. A. Zamiri, S.J. You, J.T. Chung, Large eddy simulation of unsteady turbulent flow structures and film-cooling effectiveness in a laidback fan-shaped hole, Aerosp. Sci. Technol. 100 (2020) 105793. [CrossRef]
  8. S.V. Ekkad, S. Ou, R.B. Rivir, Effect of jet pulsation and duty cycle on film cooling from a single jet on a leading edge model, ASME Paper No. IMECE 2004-60466, 2004. [CrossRef]
  9. S.M. Coulthard, R.J. Volino, K.A. Flack, Effect of jet pulsing on film cooling—part I: Effectiveness and flow-field temperature results, J. Turbomach. 129 (2007) 232–246. [CrossRef]
  10. F. Muldoon, S. Acharya, DNS study of pulsed film cooling for enhanced cooling effecti- veness, Int. J. Heat Mass Transf. 52 (2009) 3118–3127. [CrossRef]
  11. J.L. Rutledge, P.I. King, R.B. Rivir, Influence of film cooling unsteadiness on turbine blade leading edge heat flux, J. Eng. Gas Turbines Power. 134 (2012) 071901. [CrossRef]
  12. Y.A. Wang, L.B. Li, J.Z. Zhang, Study on the interaction between coolant pulsation and recir- culation vortexes by large-eddy simulation, Aerosp. Sci. Technol. 130 (2022) 107951. [CrossRef]
  13. H. Babaee, S. Acharya, X. Wan, Optimization of forcing parameters of film cooling effecti- veness, J. Turbomach. 136 (2014) 061016. [CrossRef]
  14. I. Adamovich, S. Baalrud, A. Bogaerts, P. Bruggeman, M. Cappelli, V. Colombo, U. Czarnetzki, U. Ebert, J. Eden, P. Favia, The 2017 Plasma Roadmap: Low temperature plasma science and technology, J. Phys. D: Appl. Phys. 50 (2017) 323001. [CrossRef]
  15. T.C. Corke, M.L. Post, D.M. Orlov, Single dielectric barrier discharge plasma enhanced aerodynamics: Physics, modeling and applications, Exp. Fluids 46 (2009) 1–26. [CrossRef]
  16. P.Y. Yang, X. Zhang, C. Pan, The spatial-temporal evolution process of flow field generated by a pulsed-DC plasma actuator in quiescent air, Aerosp. Sci. Technol. 118 (2021) 107071. [CrossRef]
  17. S. Roya, C.C. Wang, Plasma actuated heat transfer, Appl. Phys. Lett. 92 (2008)231501.
  18. S. Roya, C.C. Wang, Numerical Investigation of three-dimensional plasma actuation for improving film cooling effectiveness, J. Thermophys. Heat Tr. 27(2013) 489–497. [CrossRef]
  19. T.C. Corke, C.L. Enloe, S.P. Wilkinson, Dielectric barrier discharge plasma actuators for flow control, Annu. Rev. Fluid Mech. 42 (2010) 505–529. [CrossRef]
  20. J.L. Yu, L.M. He, Y.F. Zhu, W. Ding, Y.Q. Wang, Numerical simulation of the effect of plasma aerodynamic actuation on improving film hole cooling performance, Heat Mass Transfer 49 (2013) 897–906. [CrossRef]
  21. S.J. Dai, Y. Xiao, L.M. He, T. Jin, Q. Zhang, P.H. Hou, Z.C. Zhao, Film-cooling of cylindrical hole with downstream surface dielectric barrier discharge actuators, Int. J. Heat Mass Transf. 90 (2015) 825–837. [CrossRef]
  22. Y. Xiao, S.J. Dai, L.M. He, T. Jin, Q. Zhang, P.H. Hou, Investigation of film cooling from cylindrical hole with plasma actuator on flat plate, Heat Mass Transfer 52 (2016) 1571–1583. [CrossRef]
  23. S. Dolati, N. Amanifard, H.M. Deylami, Numerical study and GMDH-type neural networks modeling of plasma actuator effects on the film cooling over a flat plate, Appl. Therm. Eng. 123 (2017) 734–745. [CrossRef]
  24. P. Audier, M. Fénot, N. Bénard, E. Moreau, Film cooling effectiveness enhancement using surface dielectric barrier discharge plasma actuator, Int. J. Heat Fluid Flow 62 (2016) 247–257. [CrossRef]
  25. G.Z. Li, H.J. Zhang, W.W. Yan, Control of the coherent structure dynamics of a film cooling flow by plasma aerodynamic actuation, Int. J. Heat Mass Transf. 137 (2019) 434–445. [CrossRef]
  26. G.Z. Li, Q.Q. Wang, Y.J. Huang, H.J. Zhang, Large eddy simulation of film cooling effectiveness on a turbine vane pressure side with a saw-tooth plasma actuator, Aerosp. Sci. Technol. 112 (2021) 106615. [CrossRef]
  27. A.K. Sinha, D.G. Bogard, M.E. Crawford, Film-cooling effectiveness downstream of a single row of holes with variable density ratio, J. Turbomach. 113 (1991) 442–449. [CrossRef]
  28. A. Kohli, D.G. Bogard, Adiabatic effectiveness, thermal fields, and velocity fields for film cooling with large angle injection, J. Turbomach. 119 (1997) 352–358. [CrossRef]
  29. M.L. Shur, P.R. Spalart, M.K. Strelets, A.K. Travin, A hybrid RANS-LES approach with delayed-DES and wall-modelled LES capabilities, Int. J. Heat Fluid Flow 29 (2008) 1638–1649. [CrossRef]
  30. J.R. Roth, D.M. Sherman, S.P. Wilkinson, Electrohydrodynamic flow control with a glow-discharge surface plasma, AIAA J. 38 (2000) 1166–1172. [CrossRef]
  31. T.C. Corke, M.L. Post, Overview of plasma flow control: Concepts, optimization, and applications, 43rd AIAA Aerospace Sciences Meeting and Exhibit Paper No. 2005-0563, 2005. [CrossRef]
  32. W. Shyy, B. Jayaraman, A. Andersson, Modeling of glow discharge-induced fluid dynamics, J. Appl. Phys. 92 (2002) 6434–6443. [CrossRef]
  33. P.F. Zhang, A.B. Liu, J.Z. Wang, Flow structures in flat plate boundary layer induced by pulsed plasma actuator, Sci. China Tech. Sci. 53 (2010) 2772–2782. [CrossRef]
  34. D.P. Rizzetta, M.R. Visbal, Large eddy simulation of plasma-based turbulent boundary layer separation control, AIAA J. 48 (2010) 2793–2810. [CrossRef]
  35. J.C.R. Hunt, A.A. Wray, P. Moin, Eddies, streams, and convergence zones in turbulent flows. Center for Turbulence Research Proceedings of the Summer Program Paper No. N89-24555, 1988.
  36. C.H. Wang, J.Z. Wang, H.K. Feng, Y. Huang, Large eddy simulation of film cooling flow from a fanshaped hole, Appl. Therm. Eng. 129 (2018) 855–870. [CrossRef]
  37. A.K. Sinha, D.G. Bogard, M.E. Crawford, Film-cooling effectiveness downstream of a single row of holes with variable density ratio, J. Turbomach. 113 (1991) 442–449. [CrossRef]
  38. A. Kohli, D.G. Bogard, Adiabatic effectiveness, thermal fields, and velocity fields for film cooling with large angle injection, J. Turbomach. 119 (1997) 352–358. [CrossRef]
  39. B.T. An, J.J. Liu, C. Zhang, S.J. Zhou, Film cooling of cylindrical hole with a downstream short crescent-shaped block, J. Turbomach. 135 (2013) 031702. [CrossRef]
  40. W. Shyy, B. Jayaraman, A. Andersson, Modeling of glow discharge-induced fluid dynamics, J. Appl. Phys. 92 (2002) 6434–6443. [CrossRef]
  41. C. Wang, Y. Wang, H. Wang, J. Zhang. Effect of coolant pulsation on film cooling performance on flat plate. Applied Thermal Engineering, 219 (2023), 119493. [CrossRef]
  42. Y. Wang, L. Li, J. Zhang. Study on the interaction between coolant pulsation and recirculation vortexes by large-eddy simulation. Aerospace Science and Technology, 130 (2022), 107951. [CrossRef]
Figure 1. The flat plate film cooling physical model.
Preprints 90667 g001
Figure 2. The meshing of computational domain.
Preprints 90667 g002
Figure 3. The BR variations of the pulsed and un-pulsed film cooling.
Preprints 90667 g003
Figure 4. Schematically illustration of DBDPA and the phenomenological plasma model.
Preprints 90667 g004
Figure 5. The flow induced by the DBDPA [25,32].
Preprints 90667 g005
Figure 6. Comparison of centerline film cooling efficiency [25,27,28].
Preprints 90667 g006
Figure 7. Jet trajectories.
Preprints 90667 g007
Figure 8. Time-averaged velocity profiles at the exit of the cooling hole(y/d=0, z/d=0.015).
Preprints 90667 g008
Figure 9. The streamwise velocity profiles with time average in the y/d = 0 plane.
Preprints 90667 g009aPreprints 90667 g009b
Figure 10. The profiles of time-averaged lateral velocity along the lateral direction.
Preprints 90667 g010aPreprints 90667 g010b
Figure 11. The time-averaged streamlines in the cross-sections downstream of the cooling hole.
Preprints 90667 g011
Figure 12. The cross-sectional profiles of the time-averaged dimensionless temperature downstream of the cooling hole.
Preprints 90667 g012
Figure 13. The contours of the time-averaged film cooling efficiency on the wall surface.
Preprints 90667 g013
Figure 14. The time-averaged streamlines on the wall surface.
Preprints 90667 g014
Figure 15. The distributions of the film cooling efficiency along the streamwise direction.
Preprints 90667 g015
Figure 16. The instantaneous Q iso-surface colored by temperature in the UBL case (Q = 5.0×10⁵).
Preprints 90667 g016
Figure 17. The temperature-dependent instantaneous Q iso-surface in the PBL-off case (Q = 5.0×10⁵).
Preprints 90667 g017
Figure 18. The instantaneous Q iso-surface colored by temperature in the PBL-on case (Q = 5.0×10⁵).
Preprints 90667 g018
Figure 19. The variations of the DT on the hole centerline in the UBL case.
Preprints 90667 g019
Figure 20. The variations of the DT on the hole centerline in the PBL-off case.
Preprints 90667 g020
Figure 21. The variations of the DT on the hole centerline in the PBL-on case.
Preprints 90667 g021
Figure 22. The contours of instantaneous temperature in the z/d = 0.0 plane.
Preprints 90667 g022aPreprints 90667 g022b
Figure 23. Interaction of the upstream flow with the jet and the cross at the same moment.
Preprints 90667 g023aPreprints 90667 g023b
Disclaimer/Publisher’s Note: The statements, opinions and data contained in all publications are solely those of the individual author(s) and contributor(s) and not of MDPI and/or the editor(s). MDPI and/or the editor(s) disclaim responsibility for any injury to people or property resulting from any ideas, methods, instructions or products referred to in the content.
Copyright: This open access article is published under a Creative Commons CC BY 4.0 license, which permit the free download, distribution, and reuse, provided that the author and preprint are cited in any reuse.
Prerpints.org logo

Preprints.org is a free preprint server supported by MDPI in Basel, Switzerland.

Subscribe

© 2024 MDPI (Basel, Switzerland) unless otherwise stated