1. Summary
Metabolomics is a discipline dedicated to identifying and quantifying small molecules, known as metabolites, within biological samples such as cells, tissues, or fluids. These molecules encompass the initial, intermediate, and final products of cellular processes, collectively offering a snapshot of the metabolic state in a biological system. Metabolomics serves as a potent tool for comprehending intricate biological systems and plays a pivotal role in the creation of novel diagnostic, therapeutic, and environmental solutions.
Differences in metabolomic compositions signify alterations in specific metabolic pathways, offering insights that can contribute to the development of disease diagnosis methods and treatment strategies. However, obtaining human tissues, especially ocular tissues, poses challenges. Sampling of control human ocular tissues is often difficult or impossible, leading to a reliance on tissues (lens, cornea, aqueous (AH), and vitreous (VH) humors) obtained from cadavers several hours post-mortem in the majority of human metabolomic ophthalmological studies [
1,
2,
3]. Anaerobic reactions and cell lysis caused by disruptions in cell energy status and osmoregulation lead to rapid and significant changes in the metabolomic composition of biological tissues and fluids, causing post-mortem bias in data [
4,
5,
6,
7].
An alternative approach to studying human eye diseases involves the use of experimental animals. Rodents, particularly mice and rats, are commonly employed in ophthalmological studies, especially those related to the lens [
8,
9,
10]. However, a comparison of metabolomic compositions between human and animal lenses suggests that rodents offer limited suitability as models for human ophthalmological diseases. Earlier studies in our lab [
2,
3,
9] have demonstrated substantial differences in the sets of cytoprotective compounds between human and rat lenses. This underscores the critical need to identify an animal model with a lens metabolomic composition closely resembling that of the human lens.
Monkeys and apes, being the species genetically closest to humans, exhibit anatomical structures and functional capabilities in their eyes that resemble those of humans. Given the similarity in the anatomy and functionality of the human and monkey eyes, nonhuman primates are often regarded as the optimal animal models for studying human eye diseases [
11]. Primates have proven effective in investigating ocular diseases and developing treatment methods, encompassing areas such as amblyopia, cataract, and glaucoma [
12,
13,
14,
15]. However, the metabolomic composition of nonhuman primate ocular tissues remains largely unidentified. While occasional references exist regarding the presence and abundance of individual metabolites in monkey ocular tissues, such as UV filters in the monkey lens [
16,
17], a comprehensive quantitative metabolomic analysis is lacking. In this study, we conducted a thorough measurements of the quantitative metabolomic profiles of four tissues from a crab-eating macaque (
Macaca fascicularis) and rhesus macaque (
Macaca mulatta), including blood serum, lens, VH, and AH. The resulting quantitative metabolomic dataset holds significant relevance across a diverse range of fundamental and applied scientific fields, including applications in animal modeling of human diseases, evaluation of medical formulations, and evolutionary studies.
2. Data Description
The dataset consists of two main parts:
1. Raw instrumental data – spectra from 1H Nuclear Magnetic Resonance facility (description of the acquisition protocol is provided below in the methods section).
2. Absolute concentrations of metabolites in samples. Quantitative data presented in the table (csv format), where the columns correspond to samples (n=45), and the rows correspond to metabolites (n=99). Concentrations in the table are given in nmol per gram of wet tissue weight.
3. Metadata describing samples.
2.1. Primate Specimen Description
The following specimen encompass the dataset:
The samples were collected from 18 animals, 15 specimens of Crab-eating macaque (
Macaca fascicularis) and 3 specimens of Rhesus macaque (
Macaca mulatta), and include intravital serum (7 samples), post-mortem serum (6 samples), lens (11 samples), AH (10 samples), and VH (11 samples).
Table 1 summarizes the description of the samples used in the present study.
2.2. Raw Instrumental NMR Data and Metabolite Assignment
The metabolomic compositions of macaque tissues were determined using NMR method. Typical
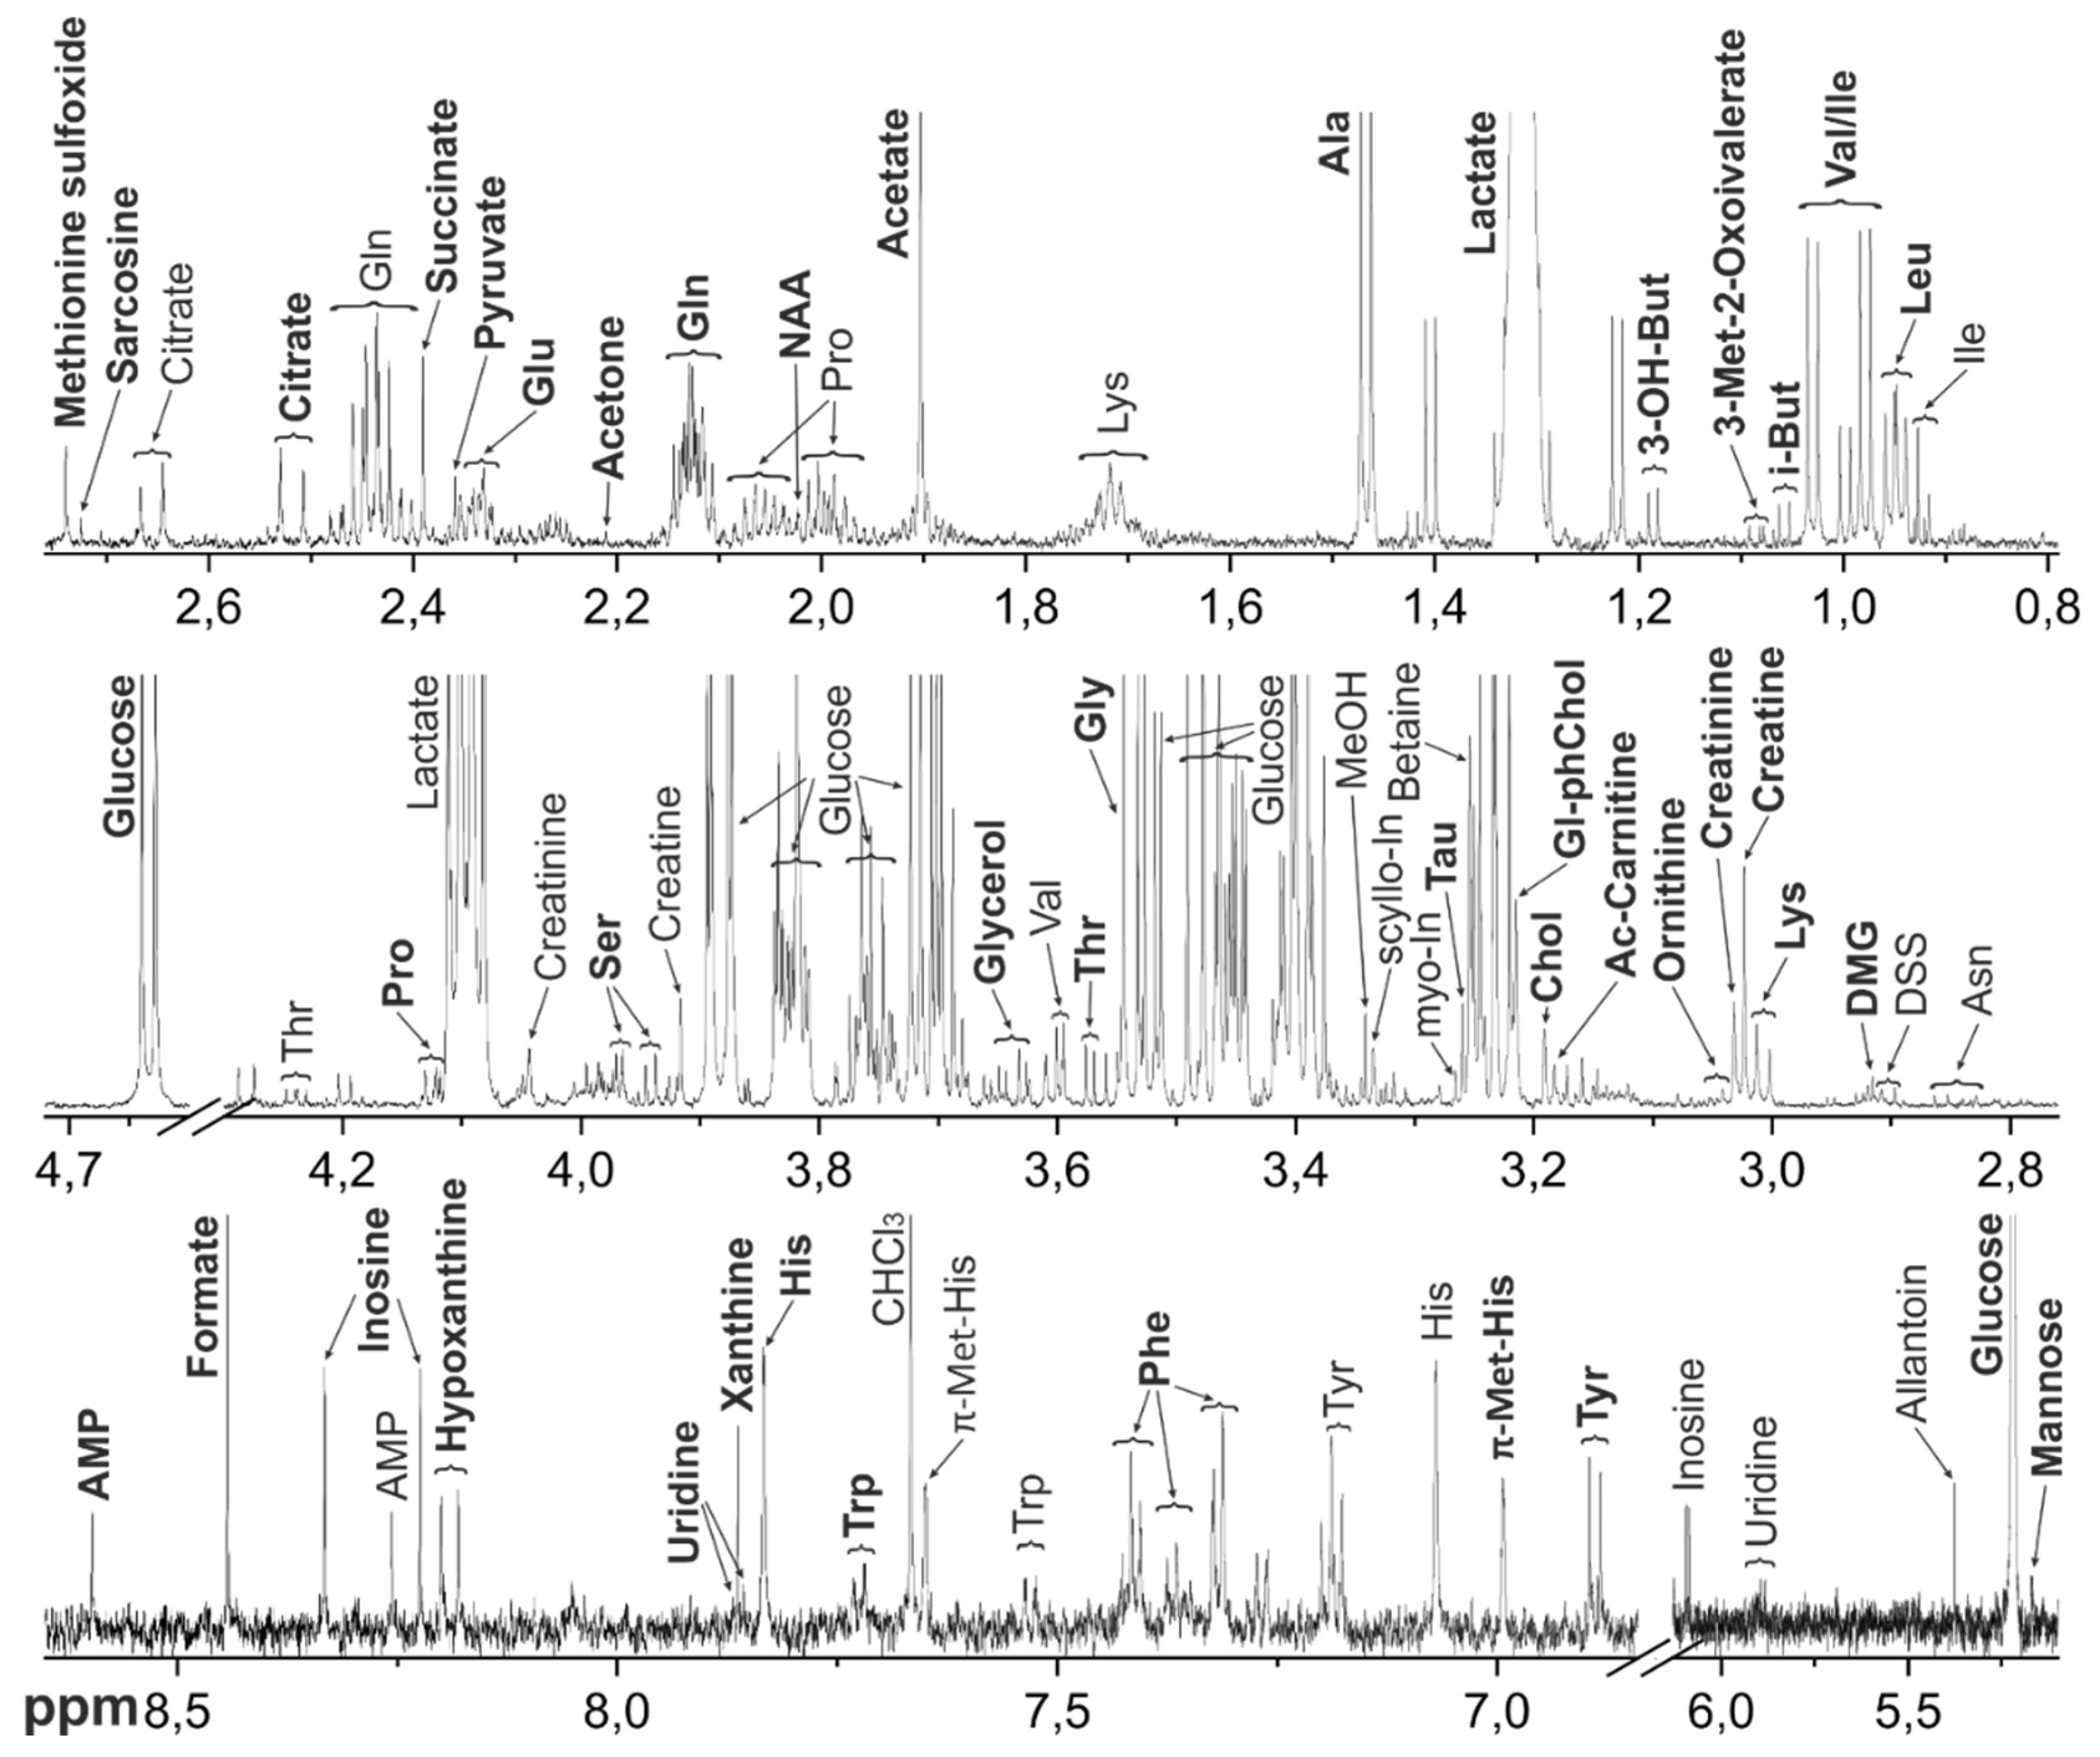
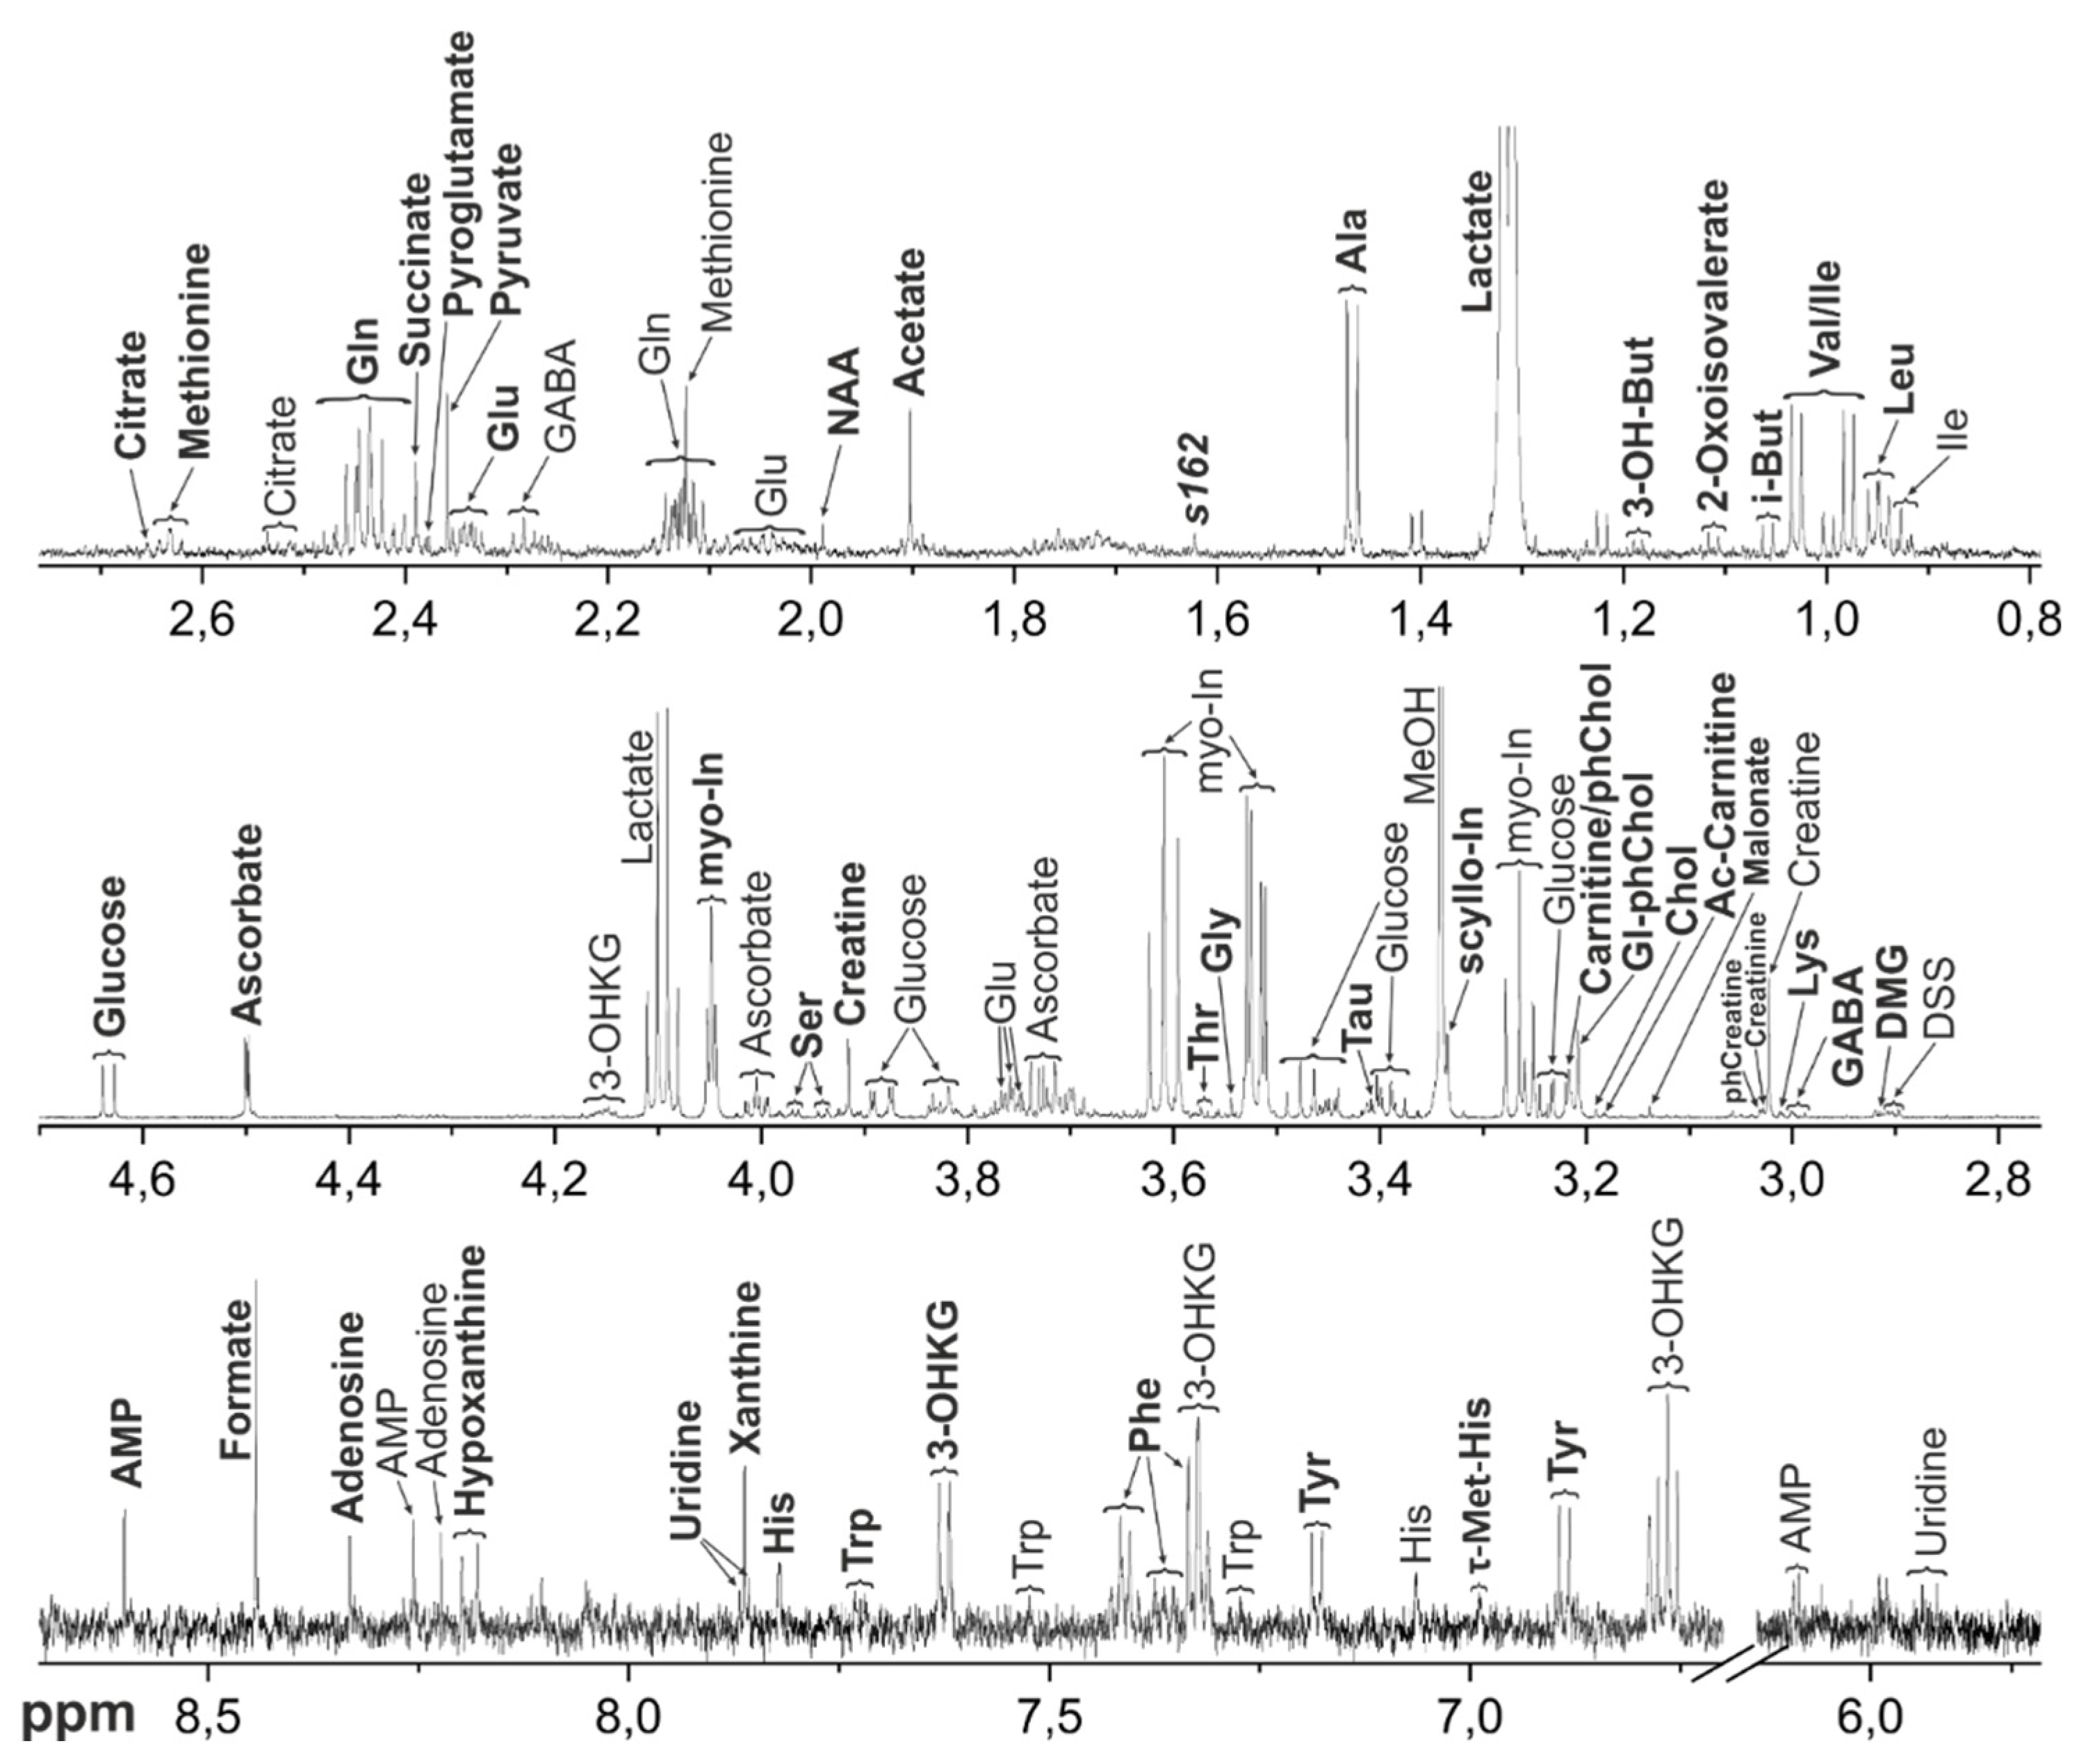
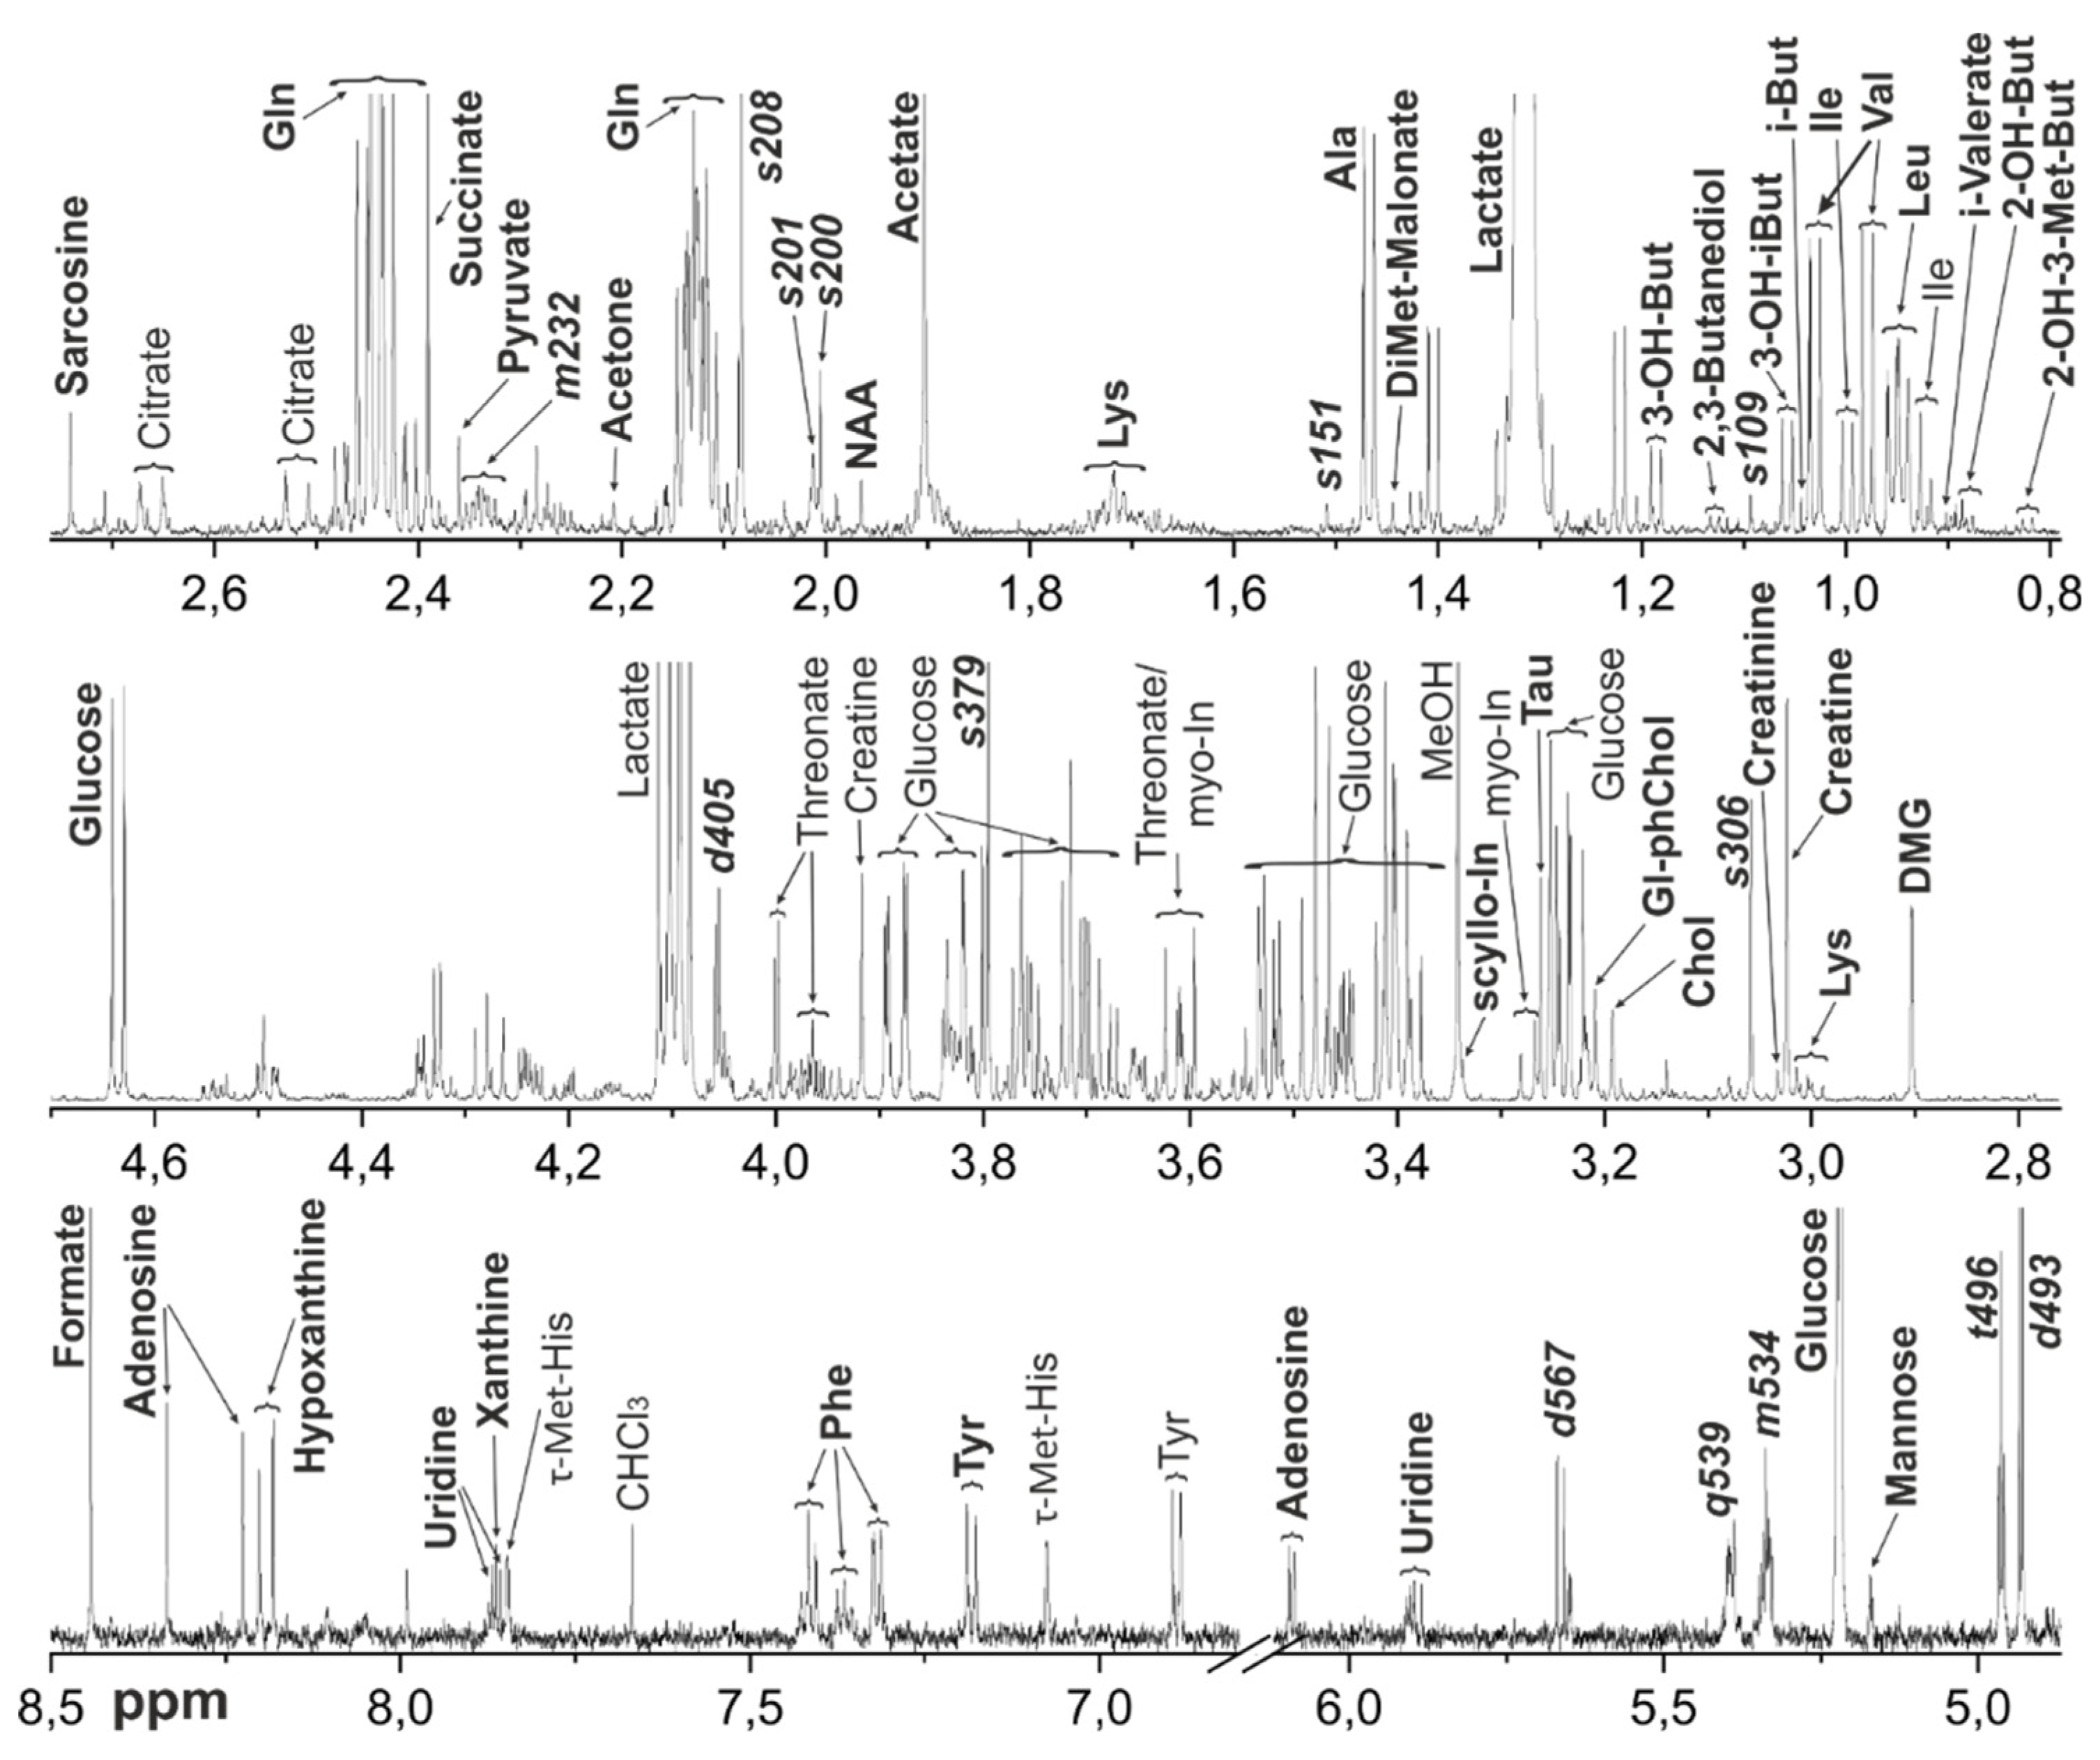
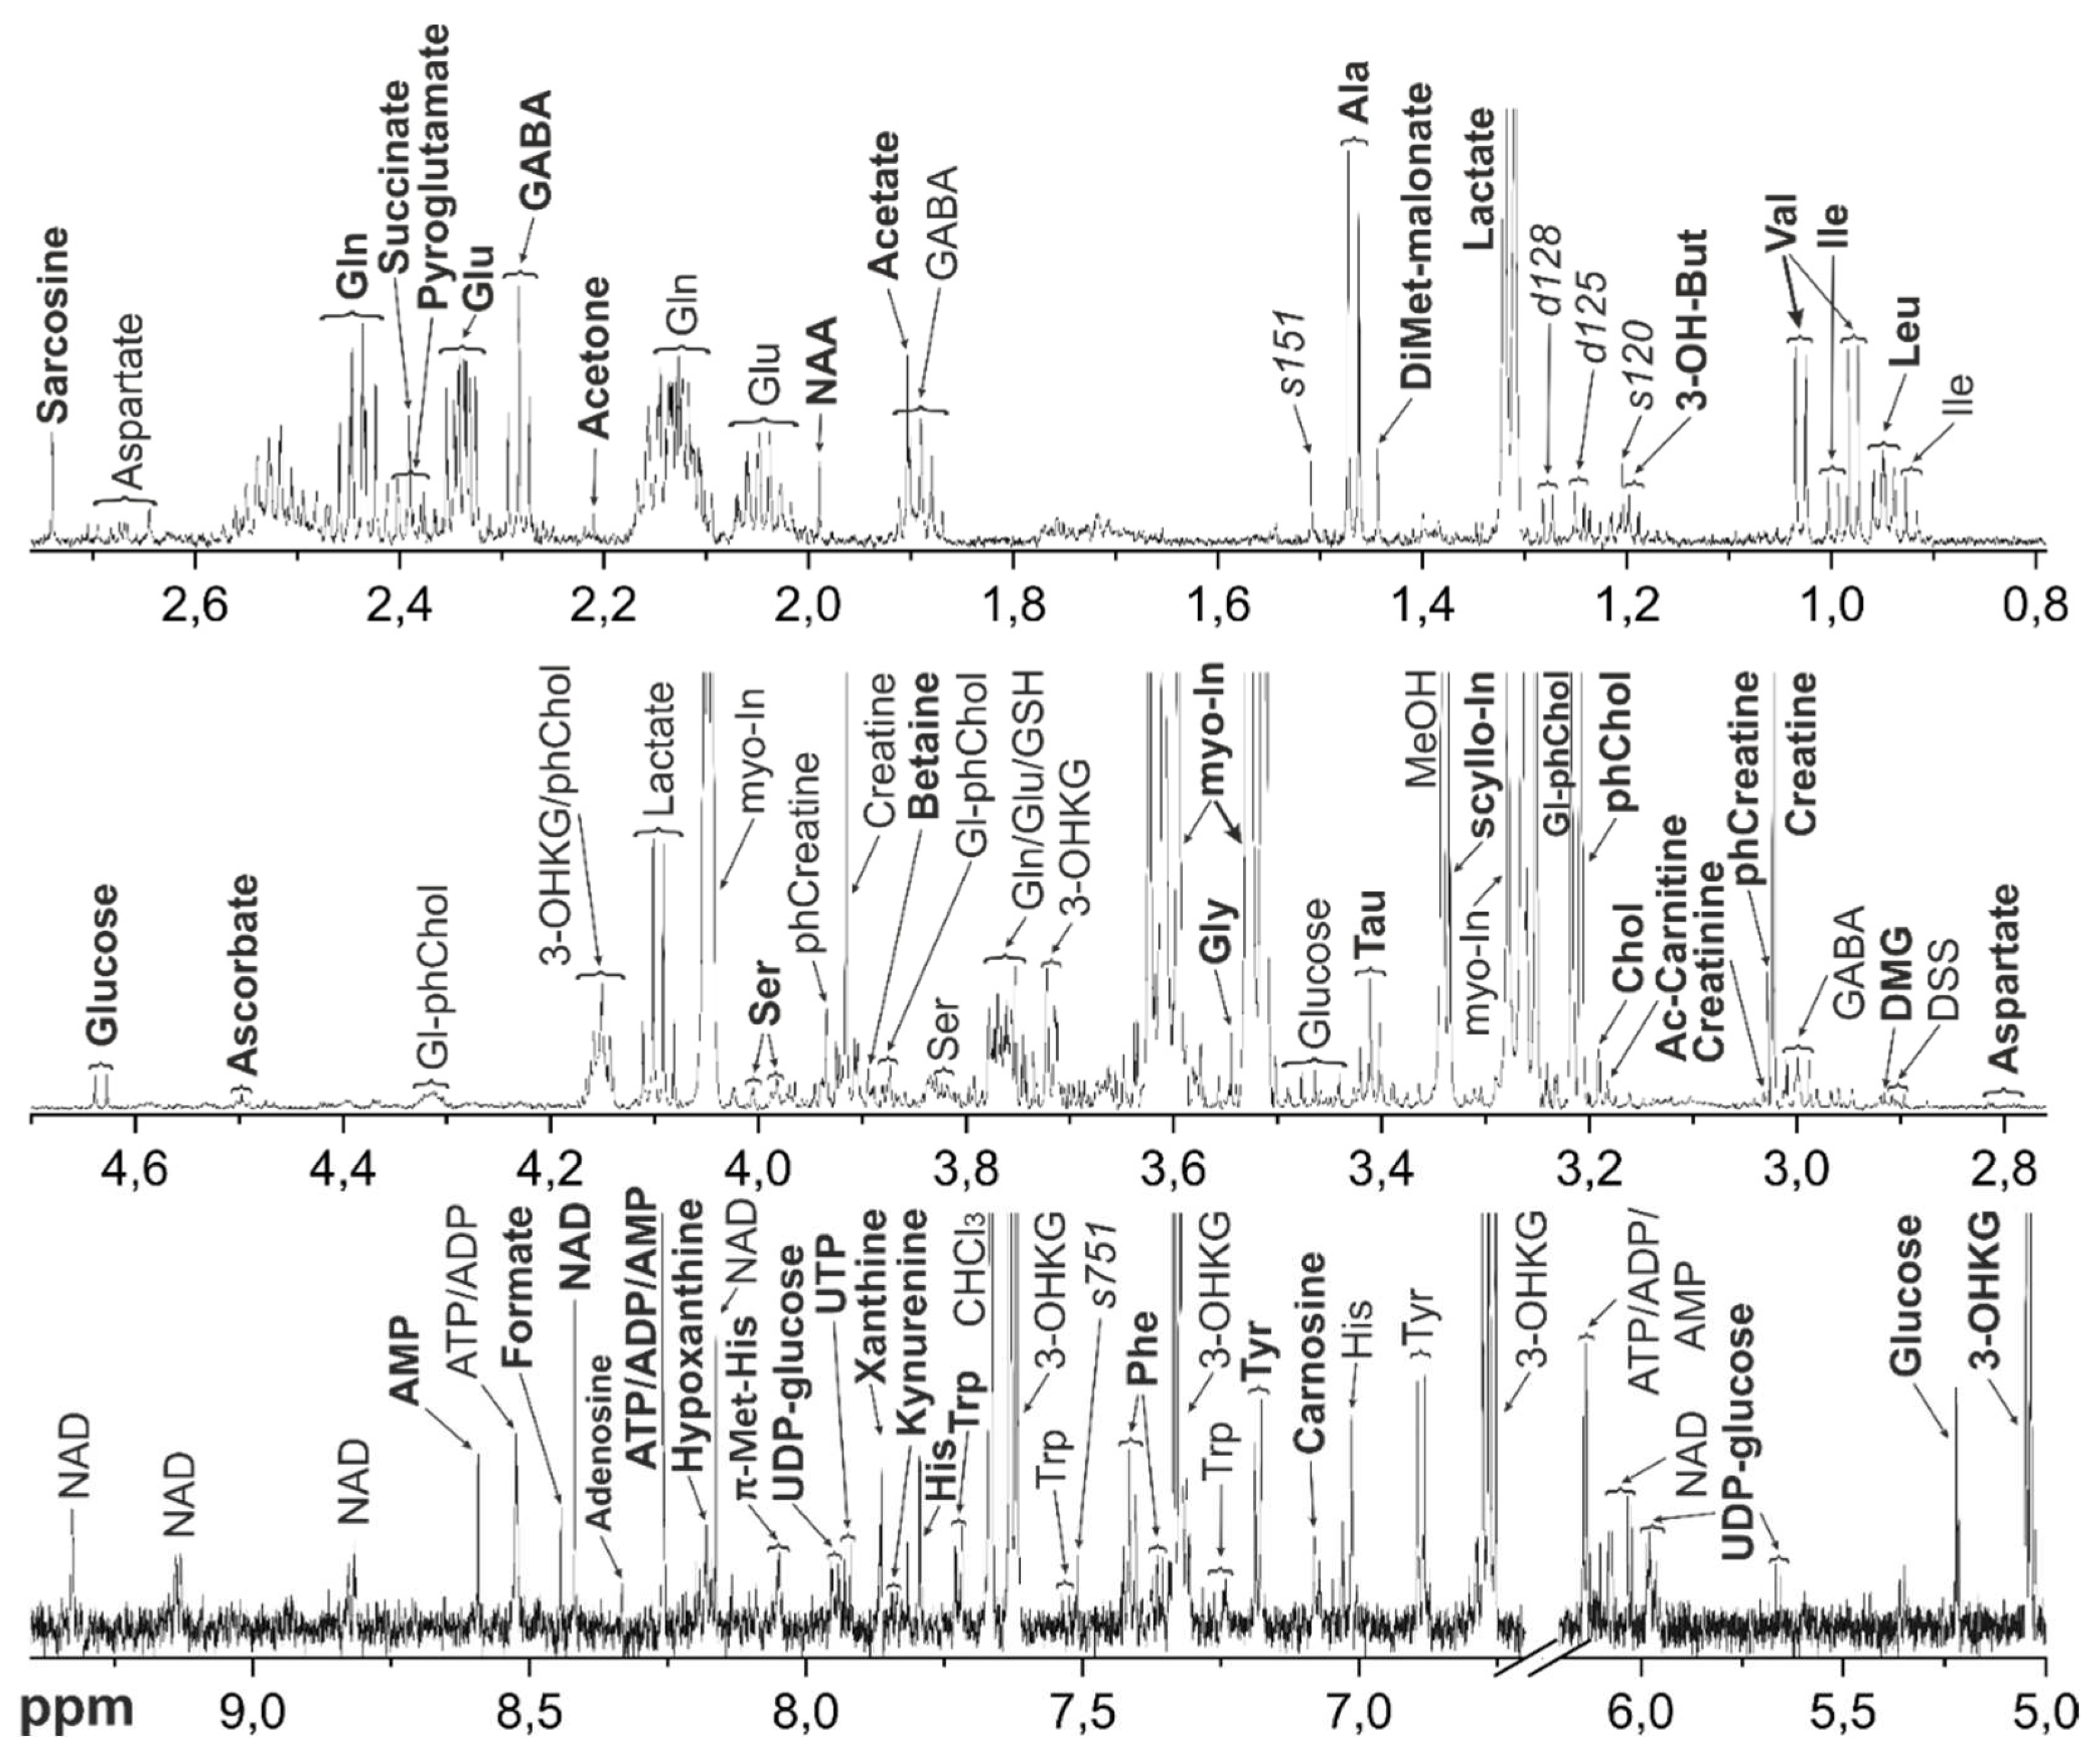
1H NMR spectra with annotated signals corresponding to identified metabolites are presented in
Figure 1 (serum),
Figure 2 (AH),
Figure 3 (VH), and
Figure 4 (lens).
2.3. Quantitative data overview
The majority of the data obtained correspond to young healthy specimens of Crab-eating macaque (M. fascicularis). These data can be considered as the basic metabolomic profiles of the corresponding tissues. The dataset also includes the data on specimens of Rhesus macaque (M. mulatta), and on old animals. This allows for the estimating of the influence of age and taxonomy on metabolic processes in the ocular tissues. The comparison of metabolomic profiles of the serum samples obtained intravital and 15 minutes post-mortem makes it possible to evaluate fast thermal and enzymatic post-mortem reactions occurring in the monkey body.
To overview the data on the concentrations of metabolites in the samples and gain insight into the dataset, we performed preliminary exploratory statistical analysis.
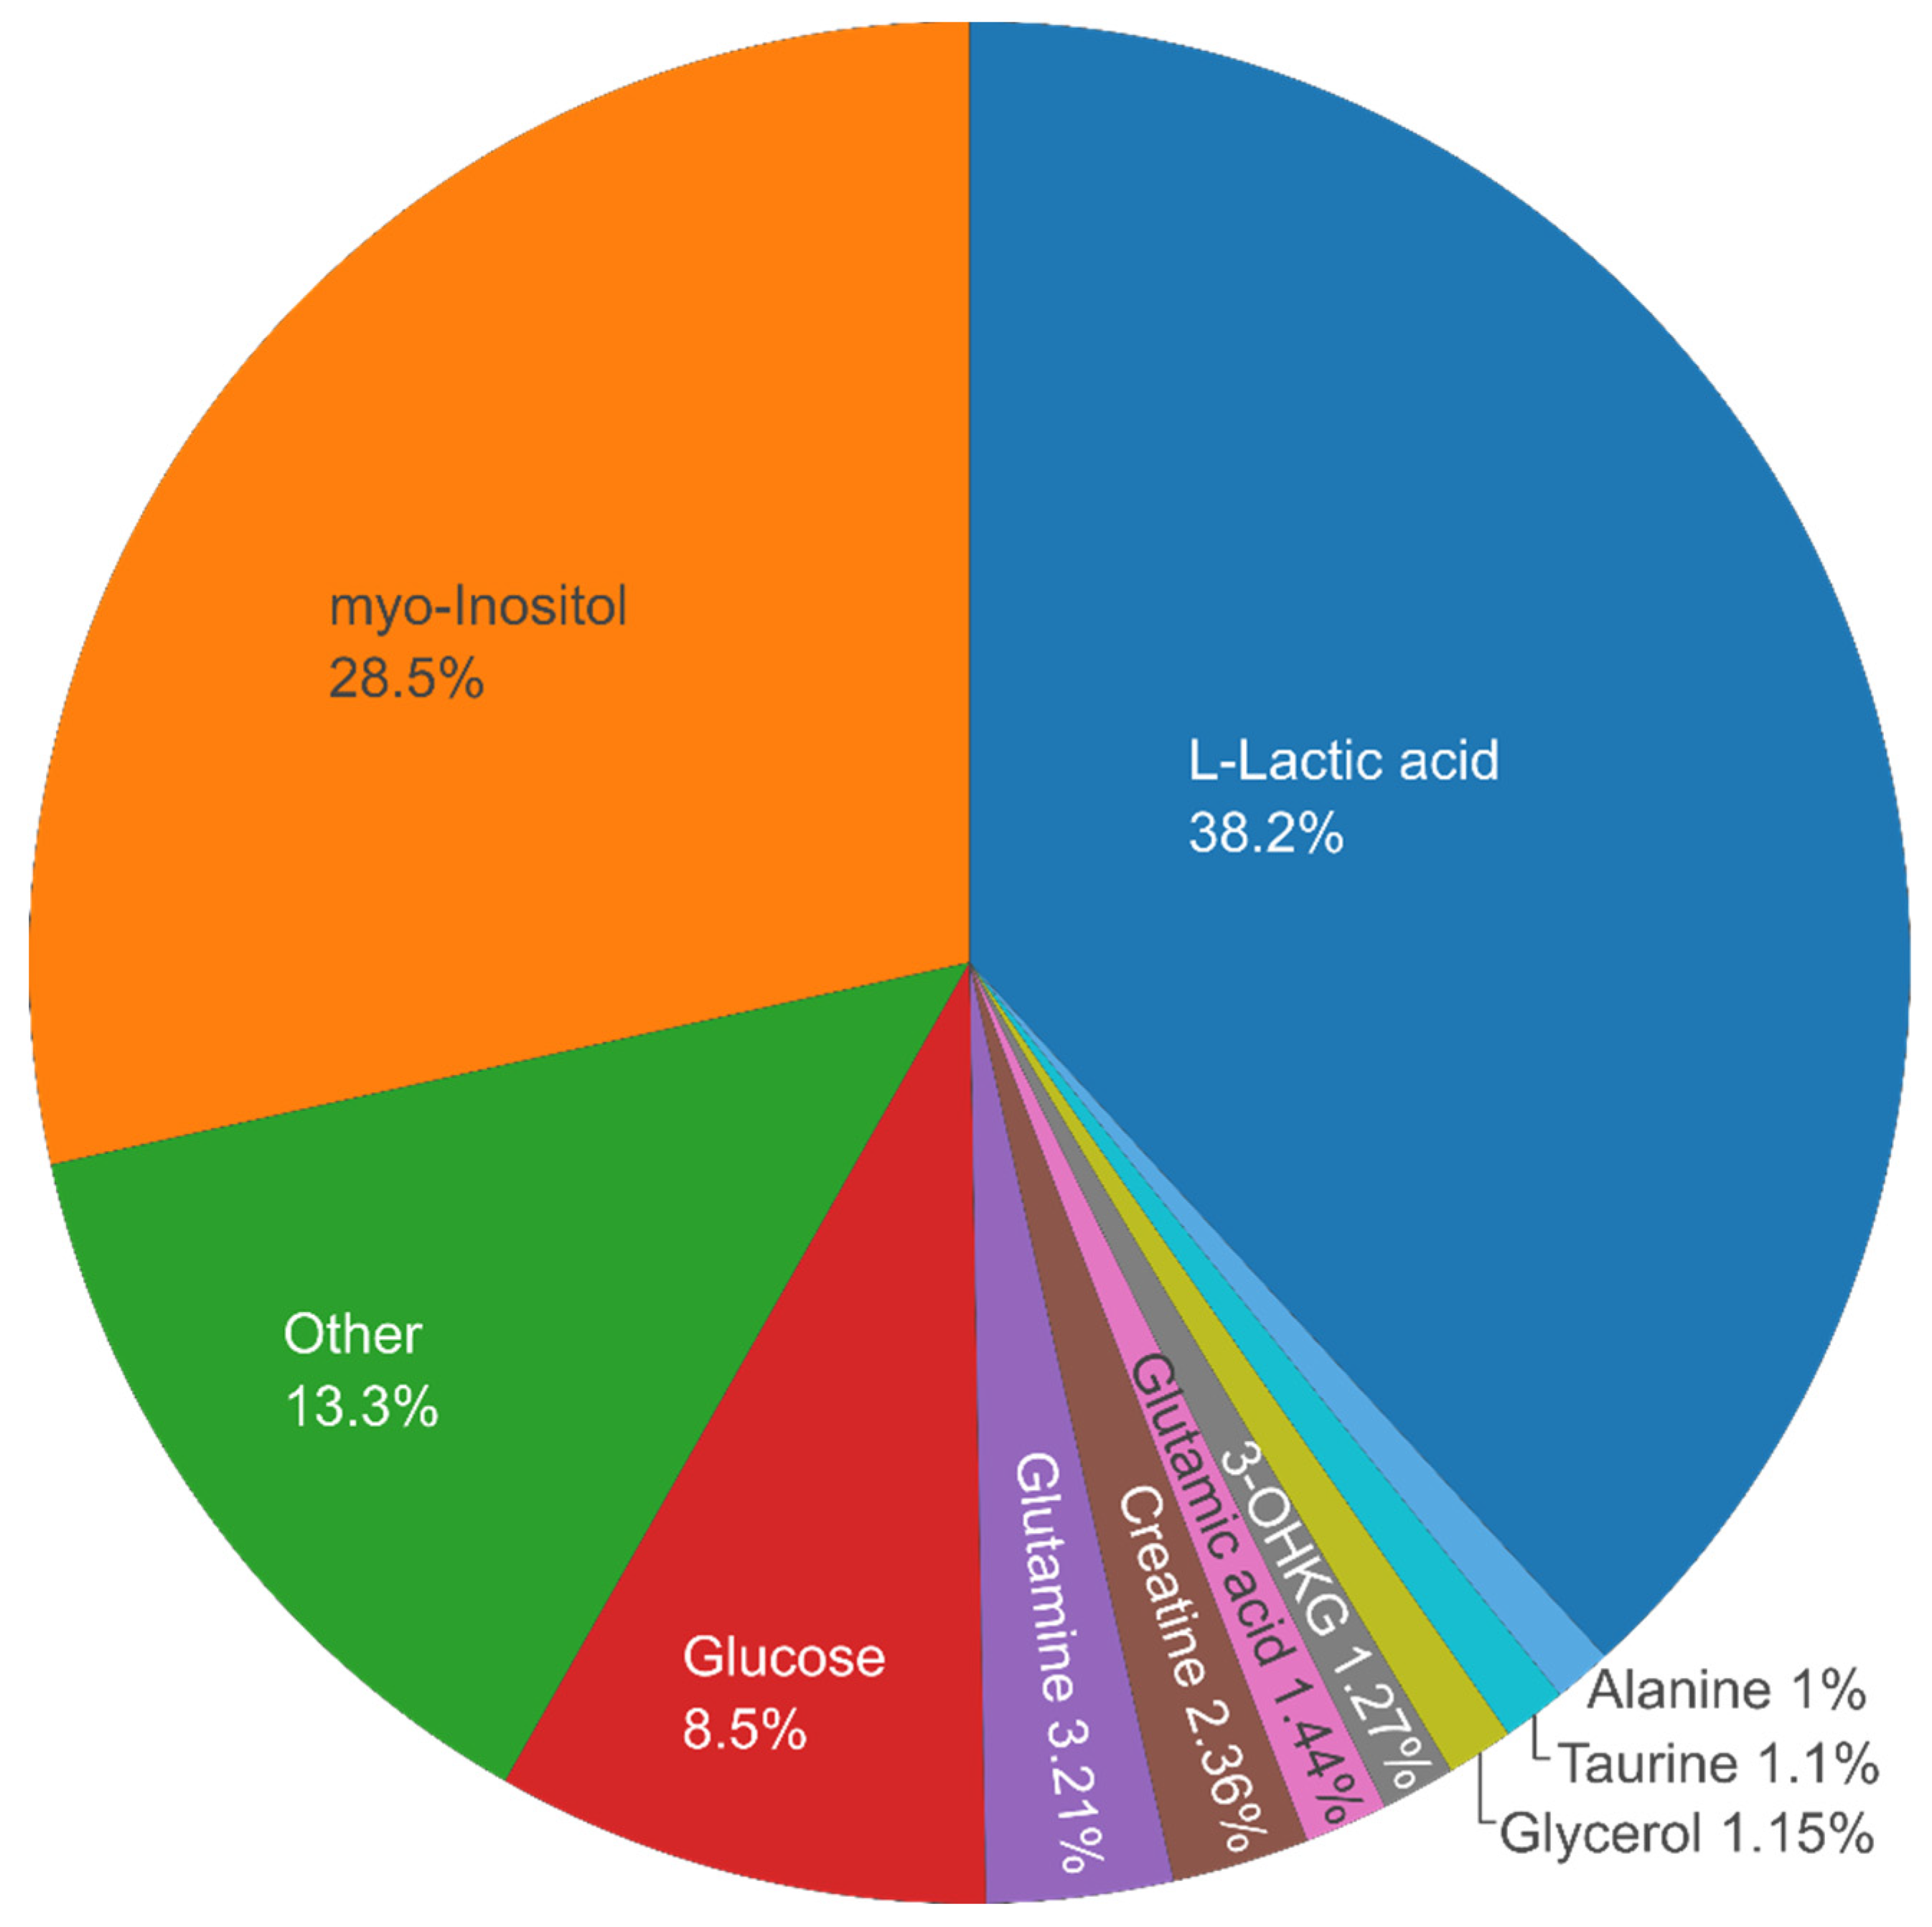
Figure 5 shows a pie chart revealing the 10 top most abundant metabolites in the dataset across all samples in average (in four tissue types and two species) – Lactic acid,
myo-Inositol, Glucose, Glutamine, Creatine, Glutamic acid, 3-Hydroxykynurenine O-β-D-Glucoside (3-OHKG, UV-filter [
18]), Glycerol, Taurine, Alanine – comprising ca. 87% of the total metabolite content.
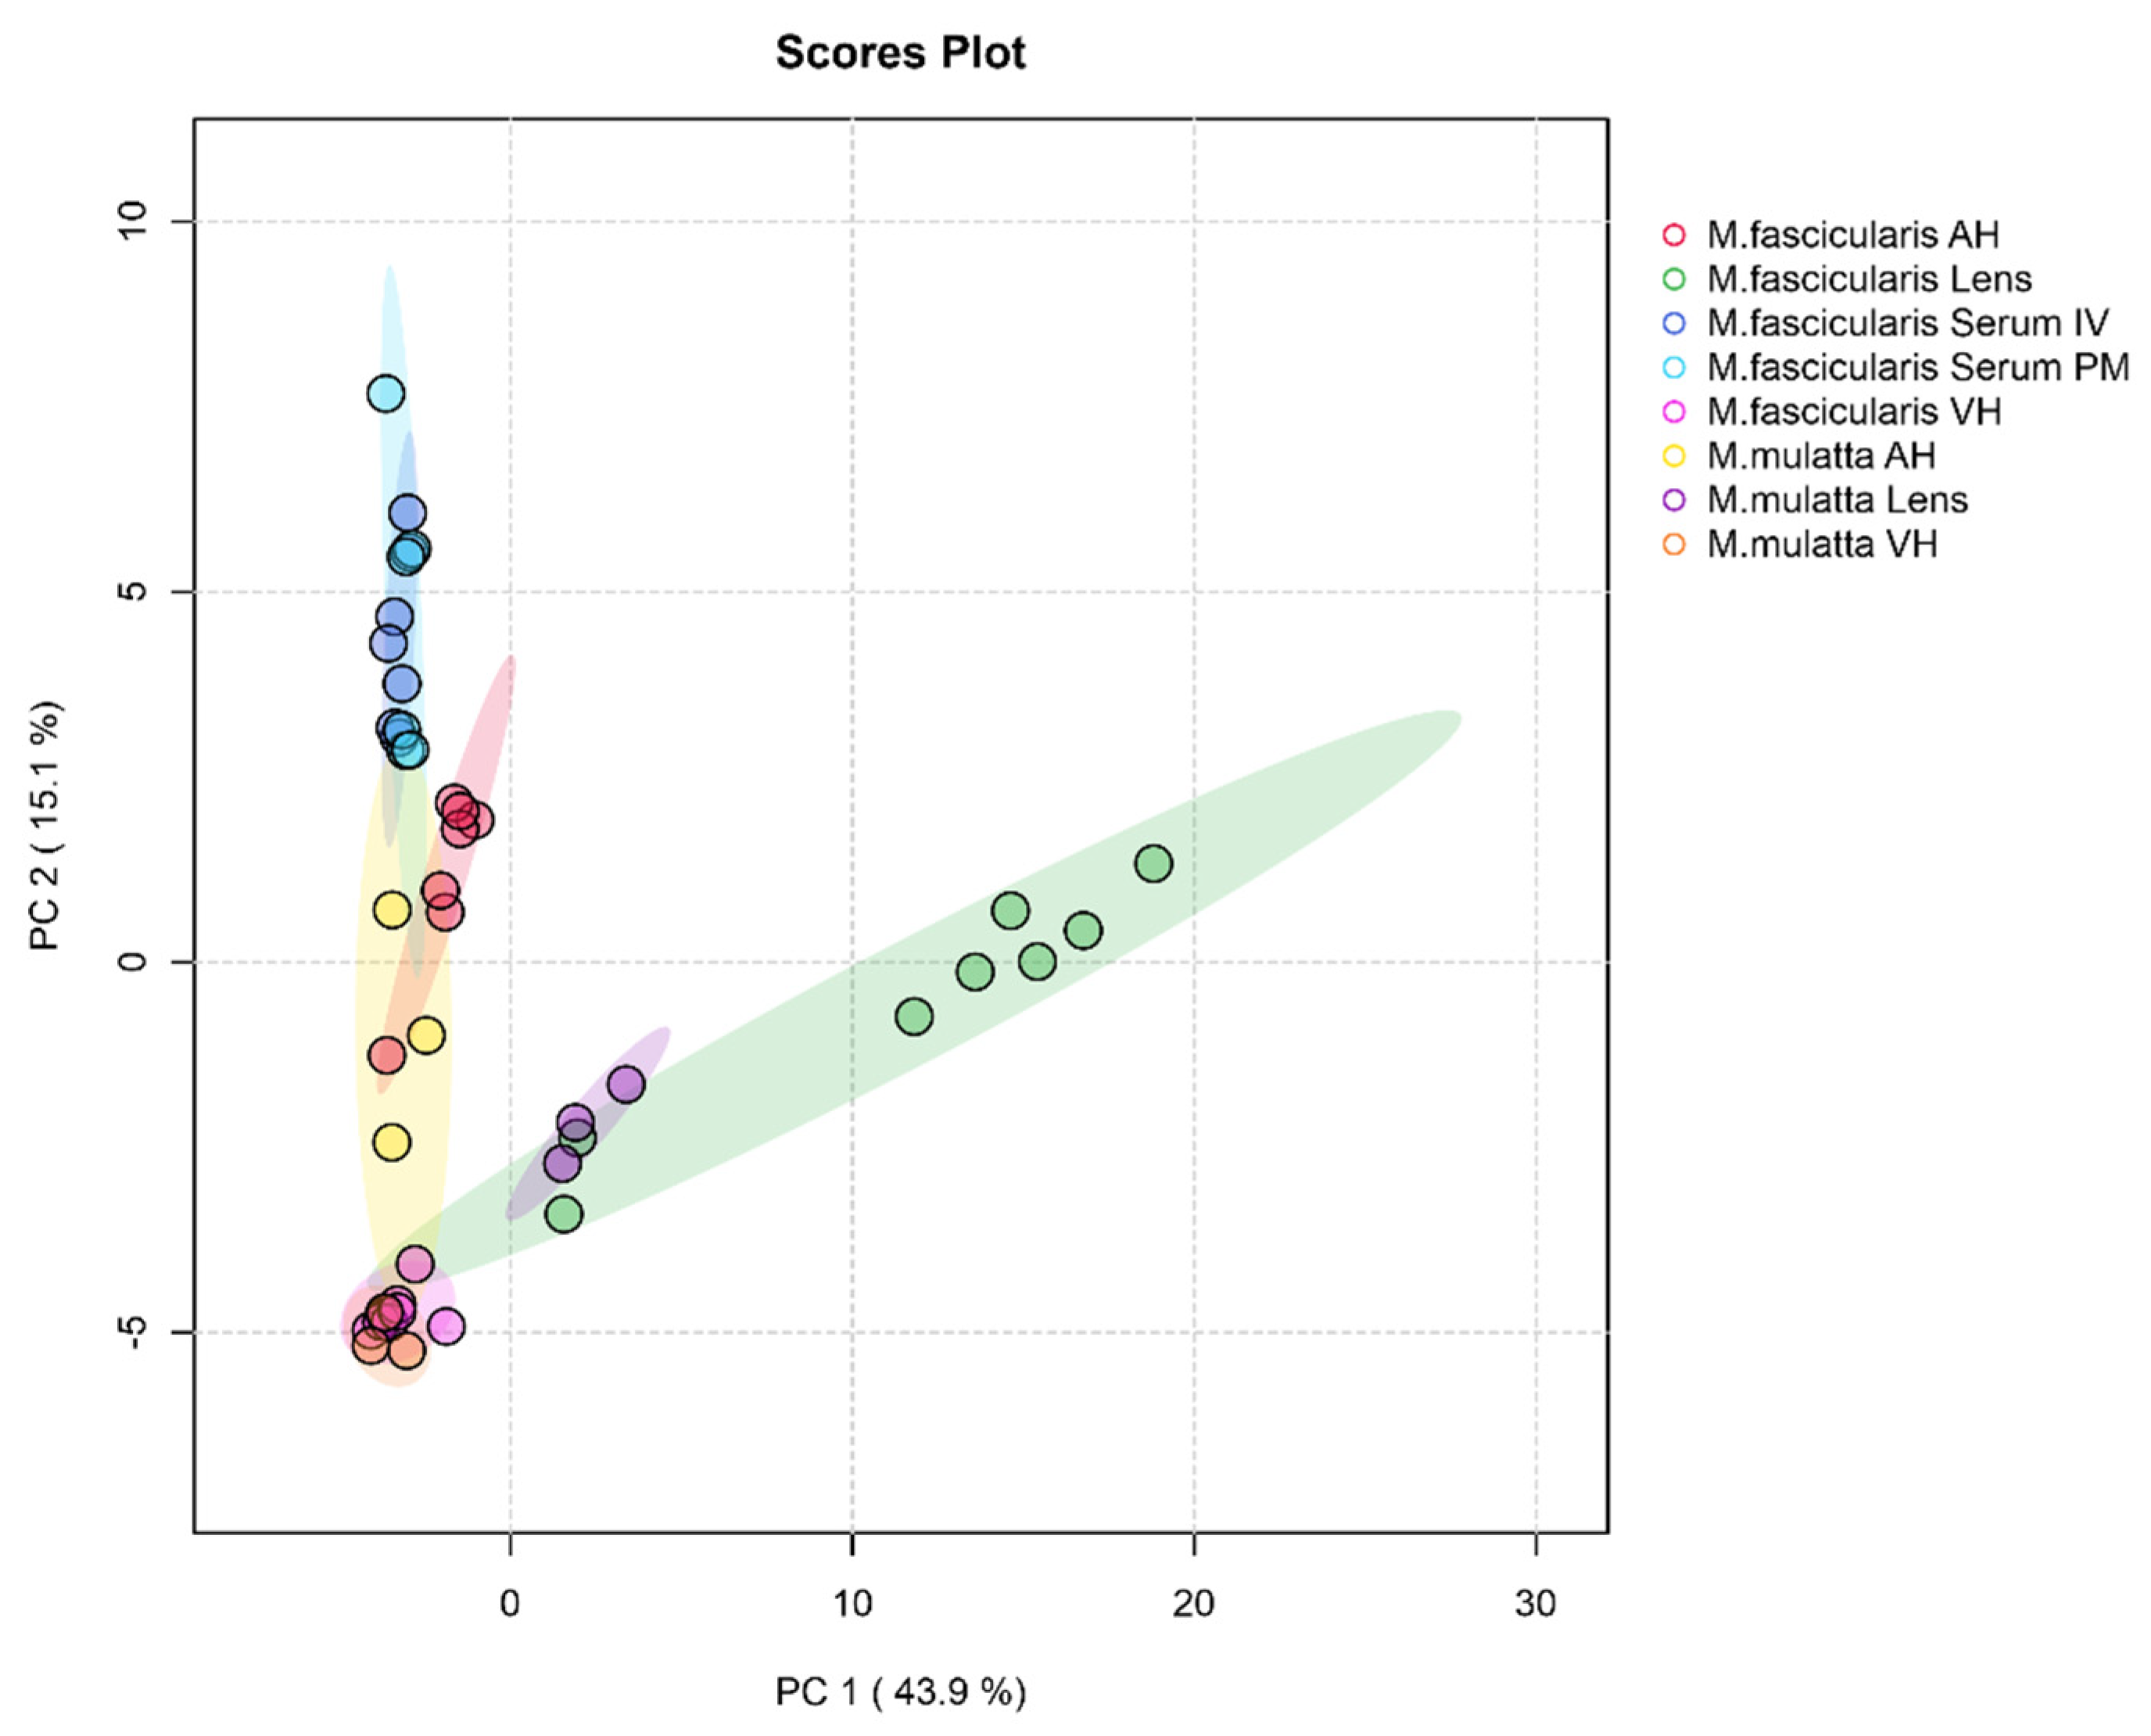
Figure 6 shows score plot of first two principal components from principal component analysis (PCA) which describes the dataset by revealing differences and similarities in samples depending on tissue type and species. The first principal component (PC1) accounts for 43.9% of the total variance, PC2 – 15.1%. The majority of the samples belonging to lenses of
M. fascicularis are rather distant along PC1 from other tissues. Although there are two samples of
M. fascicularis lenses that are much closer to
M. mulatta lenses.
Heatmap showing relative metabolite abundances in the dataset as well as hierarchical clustering of both samples and metabolites is presented in
Figure 7. Heatmap can be used to identify samples or metabolites that are unusually high or low in the dataset. Heatmap confirms observation from PCA that 6 lenses of
M. fascicularis are rather distant from other tissues (upper right red rectangle).
3. Methods.
3.1. Sample collection
The research was carried out in line with the ARVO Statement for the Use of Animals in Ophthalmic and Vision Research and the European Union Directive 2010/63/EU on the protection of animals used for scientific purposes, and approved by bioethics committee of the Research Institute of Medical Primatology (Record 80/1 from 02.12.2021).
We obtained intravital (n=7) and post-mortem blood samples from Crab-eating macaques (Macaca fascicularis) (n=8) by venipuncture using a syringe with a 21G needle. Within 10-15 minutes after the blood collection, blood samples were centrifuged (3000×g, 10 min), and the plasma obtained was transferred into separate vials. The plasma samples were immediately frozen and kept at -70° C until analysis.
Euthanasia was performed for Crab-eating macaques (Macaca fascicularis) (n=8) and Rhesus macaques (Macaca mulatta) (n=3) by intravenous administration of 5.0 ml of Anestofol 5% (Interpharm, Russia) with preliminary general anesthesia by intravenous injection of 0.10 ml/kg of Xila (2% xylazine) (Interchemie Werken "de Adelaar" BV, the Netherlands ) and 0.05 ml/kg of Zoletil® (Virbac Sante Animale, France). The samples of AH were taken from the anterior chamber by the cornea puncture with the 21G needle. Then the cornea was cut along the iris border, the lens was extracted, and VH was collected with the 21G needle. The samples of AH, VH, and lens were frozen and kept at -70° C.
3.2. Sample preparation
The process of preparing the lens samples was carried out following the detailed procedure described in [
19]. Typical lens weight was 90-100 mg, typical plasma volume was 300 µL, VH volume was 600 µL, AH volume was 70 to 200 µL. The lenses were homogenized in glass vials using a TissueRuptor II rotor-stator homogenizer (Qiagen, Venlo, Netherlands) with 1600 µL of cold MeOH (-20°C). AH, VH, and plasma samples were extracted without prior homogenization. The extraction was performed by water/methanol/chloroform mixture as described in [
19]. The metabolomic extracts were vacuum-dried for further analysis.
3.3. NMR measurements
For NMR measurements, the dried extracts were re-dissolved in 600 μL of D2O containing 2 × 10⁻⁵ M of sodium 4,4-dimethyl-4-silapentane-1-sulfonic acid (DSS) as an internal standard and 50 mM of deuterated phosphate buffer (pH 7.2). The 1H NMR measurements were conducted at the "Mass Spectrometric Investigations" Center of Collective Use, SB RAS using an AVANCE III HD 700 MHz NMR spectrometer (Bruker BioSpin, Rheinstetten, Germany). The concentrations of metabolites in the samples were determined by the peak area integration relatively to the internal standard DSS, and then recalculated into metabolite concentrations in the tissue (for the lens, in nmoles per gram of the tissue wet weight, and for AH, VH, and serum, in nmoles per milliliter). The exceptions were UV filters, for which LC-MS and LC-OD methods were used.
3.4. LC–MS and LC-OD Measurements
LC-MS and LC-OD analyses were performed as described in [
3]. The metabolomic extracts were re-dissolved in 100 μL of 10 mM ammonium formate and 0.1% formic acid solution in H
2O. The hydrophilic interaction liquid chromatography (HILIC) method was used for LC separation of the samples, utilizing a TSKgel Amide-80 HR column (4.6 × 250 mm, 5 μm) on an UltiMate 3000RS chromatograph (Dionex, Germering, Germany). A diode array UV-vis detector (DAD, LC-OD) with a 190–800 nm spectral range was used with a flow cell. Concentrations of UV filters 3-Hydroxykynurenine (3-OHKN), 3-Hydroxykynurenine O-β-D-Diglucoside (3-OHKDG), 4-(2-Amino-3-Hydroxyphenyl)-4-Oxobutanoic acid O-β-D-Glucoside (AHBG), 4-(2-Amino-3-Hydroxyphenyl)-4-Oxobutanoic acid O-β-D-Diglucoside (AHBDG), Deaminated 3-OHKG (4-(2-Amino-3-Hydroxyphenyl)-4-Oxocrotonic acid O-β-D-Glucoside, 3-OHCKAG), and Methylated 3-OHKG (Me-3-OHKG) were measured by LC-OD at the 360 nm wavelength assuming that their absorption coefficients at 360 nm are similar, ε(360) = 4.5 × 10
3 M
-1cm
-1 [
3,
20].
3.5. Identification and quantification metabolites
Metabolite identification was conducted by analyzing their NMR spectra, which were sourced from literature, databases (HMDB, METLIN, BMRB, and SpectraBase), and our in-house NMR library [
2,
21,
22] and AMDB [
23]. To identify unknown signals, we either used LC-OD, LC-MS, and LC-MS/MS or fractionated the metabolomic extract by LC and conducted NMR analysis on each fraction, as detailed in [
21]. The baseline processing, identification, and integration of spectral NMR peaks (quantification) were done using the MestReNova v12.0 (Mestrelab Research, A Coruna, Spain). The final table contains 89 reliably identified and quantified metabolites. The raw data could contain more information on yet unidentified metabolites.
Author Contributions
Conceptualization, V.V.Y. and Y.P.T.; methodology, V.V.Y., L.V.Y., M.V.F., and N.A.O.; formal analysis, V.V.Y., M.V.F., and Y.P.T.; investigation, V.V.Y., M.V.F., L.V.Y., and N.A.O.; resources, E.Y.R. and D.V.B.; data curation, visualization, writing—original draft preparation, V.V.Y.; writing—review and editing, L.V.Y., M.V.F., N.A.O., and Y.P.T.; supervision, project administration, funding acquisition, Y.P.T. All authors have read and agreed to the published version of the manuscript.
Funding
This research was funded by the Russian Science Foundation, grant number 22-23-00021, https://rscf.ru/project/22-23-00021/
Institutional Review Board Statement
The research was carried out in line with the ARVO Statement for the Use of Animals in Ophthalmic and Vision Research and the European Union Directive 2010/63/EU on the protection of animals used for scientific purposes, and approved by bioethics committee of the Research Institute of Medical Primatology (Record 80/1 from 02.12.2021).
Informed Consent Statement
Not applicable.
Data Availability Statement
Acknowledgments
We thank the Ministry of Science and Higher Education of the RF for access to
NMR and LC-MS equipment.
Conflicts of Interest
The authors declare no conflict of interest.
References
- Kryczka, T.; Ehlers, N.; Nielsen, K.; Wylegala, E.; Dobrowolski, D.; Midelfart, A. Metabolic Profile of Keratoconic Cornea. Curr. Eye Res. 2013, 38, 305–309. [Google Scholar] [CrossRef] [PubMed]
- Tsentalovich, Y.P.; Verkhovod, T.D.; Yanshole, V.V.; Kiryutin, A.S.; Yanshole, L.V.; Fursova, A.Z.; Stepakov, D.A.; Novoselov, V.P.; Sagdeev, R.Z. Metabolomic Composition of Normal Aged and Cataractous Human Lenses. Exp. Eye Res. 2015, 134, 15–23. [Google Scholar] [CrossRef] [PubMed]
- Yanshole, V.V.; Yanshole, L.V.; Snytnikova, O.A.; Tsentalovich, Y.P. Quantitative Metabolomic Analysis of Changes in the Lens and Aqueous Humor under Development of Age-Related Nuclear Cataract. Metabolomics 2019, 15, 29. [Google Scholar] [CrossRef] [PubMed]
- Donaldson, A.E.; Lamont, I.L. Biochemistry Changes That Occur after Death: Potential Markers for Determining Post-Mortem Interval. PLoS ONE 2013, 8, e82011. [Google Scholar] [CrossRef] [PubMed]
- Palmiere, C.; Mangin, P. Urea Nitrogen, Creatinine, and Uric Acid Levels in Postmortem Serum, Vitreous Humor, and Pericardial Fluid. Int. J. Legal Med. 2015, 129, 301–305. [Google Scholar] [CrossRef] [PubMed]
- Zelentsova, E.A.; Yanshole, L.V.; Melnikov, A.D.; Kudryavtsev, I.S.; Novoselov, V.P.; Tsentalovich, Y.P. Post-Mortem Changes in Metabolomic Profiles of Human Serum, Aqueous Humor and Vitreous Humor. Metabolomics 2020, 16, 80. [Google Scholar] [CrossRef] [PubMed]
- Locci, E.; Stocchero, M.; Noto, A.; Chighine, A.; Natali, L.; Napoli, P.E.; Caria, R.; De-Giorgio, F.; Nioi, M.; d’Aloja, E. A 1H NMR Metabolomic Approach for the Estimation of the Time since Death Using Aqueous Humour: An Animal Model. Metabolomics 2019, 15, 76. [Google Scholar] [CrossRef]
- Zigler, J.S.; Bodaness, R.S.; Gery, I.; Kinoshita, J.H. Effects of Lipid Peroxidation Products on the Rat Lens in Organ Culture: A Possible Mechanism of Cataract Initiation in Retinal Degenerative Disease. Archives of Biochemistry and Biophysics 1983, 225, 149–156. [Google Scholar] [CrossRef] [PubMed]
- Yanshole, V.V.; Snytnikova, O.A.; Kiryutin, A.S.; Yanshole, L.V.; Sagdeev, R.Z.; Tsentalovich, Y.P. Metabolomics of the Rat Lens: A Combined LC-MS and NMR Study. Experimental Eye Research 2014, 125, 71–78. [Google Scholar] [CrossRef]
- Tan, S.Z.; Mullard, G.; Hollywood, K.A.; Dunn, W.B.; Bishop, P.N. Characterisation of the Metabolome of Ocular Tissues and Post-Mortem Changes in the Rat Retina. Experimental Eye Research 2016, 149, 8–15. [Google Scholar] [CrossRef]
- Mustari, M.J. Nonhuman Primate Studies to Advance Vision Science and Prevent Blindness. ILAR Journal 2017, 58, 216–225. [Google Scholar] [CrossRef] [PubMed]
- Rasmussen, C.A.; Kaufman, P.L. Primate Glaucoma Models. Journal of Glaucoma 2005, 14, 311. [Google Scholar] [CrossRef] [PubMed]
- Willoughby, C.L.; Fleuriet, J.; Walton, M.M.; Mustari, M.J.; McLoon, L.K. Adaptation of Slow Myofibers: The Effect of Sustained BDNF Treatment of Extraocular Muscles in Infant Nonhuman Primates. Invest Ophthalmol Vis Sci 2015, 56, 3467–3483. [Google Scholar] [CrossRef] [PubMed]
- Lambert, W.S.; Carlson, B.J.; Ghose, P.; Vest, V.D.; Yao, V.; Calkins, D.J. Towards A Microbead Occlusion Model of Glaucoma for a Non-Human Primate. Sci Rep 2019, 9, 11572. [Google Scholar] [CrossRef] [PubMed]
- Liu, Z.; Liow, S.S.; Lai, S.L.; Alli-Shaik, A.; Holder, G.E.; Parikh, B.H.; Krishnakumar, S.; Li, Z.; Tan, M.J.; Gunaratne, J.; et al. Retinal-Detachment Repair and Vitreous-like-Body Reformation via a Thermogelling Polymer Endotamponade. Nat Biomed Eng 2019, 3, 598–610. [Google Scholar] [CrossRef] [PubMed]
- Gaillard, E.R.; Zheng, L.; Merriam, J.C.; Dillon, J. Age-Related Changes in the Absorption Characteristics of the Primate Lens. Invest Ophthalmol Vis Sci 2000, 41, 1454–1459. [Google Scholar]
- Gaillard, E.R.; Merriam, J.; Zheng, L.; Dillon, J. Transmission of Light to the Young Primate Retina: Possible Implications for the Formation of Lipofuscin. Photochemistry and Photobiology 2011, 87, 18–21. [Google Scholar] [CrossRef] [PubMed]
- Van Heyningen, Ruth. Fluorescent Glucoside in the Human Lens. Nature 1971, 230, 393–394. [Google Scholar] [CrossRef]
- Tsentalovich, Y.P.; Yanshole, V.V.; Yanshole, L.V.; Zelentsova, E.A.; Melnikov, A.D.; Sagdeev, R.Z. Seasonal Variations and Interspecific Differences in Metabolomes of Freshwater Fish Tissues: Quantitative Metabolomic Profiles of Lenses and Gills. Metabolites 2019, 9, 264. [Google Scholar] [CrossRef]
- Tsentalovich, Y.P.; Snytnikova, O.A.; Forbes, M.D.E.; Chernyak, E.I.; Morozov, S.V. Photochemical and Thermal Reactivity of Kynurenine. Exp. Eye Res. 2006, 83, 1439–1445. [Google Scholar] [CrossRef]
- Yanshole, L.; Zelentsova, E.; Tsentalovich, Y. Ovothiol A Is the Main Antioxidant in Fish Lens. Metabolites 2019, 9, 95. [Google Scholar] [CrossRef] [PubMed]
- Tsentalovich, Y.; Zelentsova, E.A.; Yanshole, L.V.; Yanshole, V.V.; Odud, I.M. Most Abundant Metabolites in Tissues of Freshwater Fish Pike-Perch (Sander Lucioperca). Sci Rep 2020, 10, 17128. [Google Scholar] [CrossRef] [PubMed]
- Yanshole, V.V.; Melnikov, A.D.; Yanshole, L.V.; Zelentsova, E.A.; Snytnikova, O.A.; Osik, N.A.; Fomenko, M.V.; Savina, E.D.; Kalinina, A.V.; Sharshov, K.A.; et al. Animal Metabolite Database: Metabolite Concentrations in Animal Tissues and Convenient Comparison of Quantitative Metabolomic Data. Metabolites 2023, 13, 1088. [Google Scholar] [CrossRef] [PubMed]
Figure 1.
Representative 1H NMR spectrum of the metabolomic extract from M. fascicularis serum. Bold letters indicate the signals used for the metabolite quantification. Abbreviations: 3-OH-But - 3-Hydroxybutyrate; Chol – Choline; DMG – Dimethylglycine; Gl-ph-Chol – Glycerophosphocholine; myo-In - myo-Inositol; Tau – Taurine; i-But – Isobutyrate; NAA - N-Acetylaspartate; scyllo-In - scyllo-Inositol; Tau – Taurine; π-Met-His - 3-Methylhistidine; τ-Met-His - 1-Methylhistidine. For amino acids and nucleotides, standard 3-letter symbols are used.
Figure 2.
Representative 1H NMR spectrum of the metabolomic extract from M. fascicularis AH. Bold letters indicate the signals used for the metabolite quantification. Abbreviations: 3-OH-But - 3-Hydroxybutyrate; Chol – Choline; DMG – Dimethylglycine; Gl-ph-Chol – Glycerophosphocholine; myo-In - myo-Inositol; Tau – Taurine; i-But – Isobutyrate; NAA - N-Acetylaspartate; phChol - Phosphocholine; phCreatine - Creatine phosphate; scyllo-In - scyllo-Inositol; Tau – Taurine; π-Met-His - 3-Methylhistidine; τ-Met-His - 1-Methylhistidine. For amino acids and nucleotides, standard 3-letter symbols are used.
Figure 3.
Representative 1H NMR spectrum of the metabolomic extract from M. fascicularis VH. Bold letters indicate the signals used for the metabolite quantification. Abbreviations: 2-OH-3-Met-But - 2-Hydroxy-3-methylbutyrate; 2-OH-But - 2-Hydroxybutyrate; 3-OH-But - 3-Hydroxybutyrate; 3-OH-iBut - 3-Hydroxyisobutyrate; Chol – Choline; DMG – Dimethylglycine; DiMet-malonate – Dimethylmalonate; Gl-ph-Chol – Glycerophosphocholine; myo-In - myo-Inositol; Tau – Taurine; i-But – Isobutyrate; NAA - N-Acetylaspartate; phChol - Phosphocholine; scyllo-In - scyllo-Inositol; Tau – Taurine; π-Met-His - 3-Methylhistidine; τ-Met-His - 1-Methylhistidine. For amino acids and nucleotides, standard 3-letter symbols are used. Unidentified metabolites are signed with a letter denoting the peak multiplicity (s for singlet, d for doublet, t for triplet, etc.) and three significant digits of the chemical shift.
Figure 4.
Representative 1H NMR spectrum of the metabolomic extract from M. fascicularis lens. Bold letters indicate the signals used for the metabolite quantification. Abbreviations: 3-OH-But - 3-Hydroxybutyrate; Chol – Choline; DMG – Dimethylglycine; DiMet-malonate – Dimethylmalonate; Gl-ph-Chol – Glycerophosphocholine; myo-In - myo-Inositol; Tau – Taurine; i-But – Isobutyrate; NAA - N-Acetylaspartate; phChol - Phosphocholine; scyllo-In - scyllo-Inositol; Tau – Taurine; π-Met-His – 3-Methylhistidine; τ-Met-His – 1-Methylhistidine. For amino acids and nucleotides, standard 3-letter symbols are used. Unidentified metabolites are signed with a letter denoting the peak multiplicity (s for singlet, d for doublet, t for triplet, etc.) and three significant digits of the chemical shift.
Figure 5.
Pie chart of the percentage of the most abundant metabolites.
Figure 5.
Pie chart of the percentage of the most abundant metabolites.
Figure 6.
PCA score plot of different tissue types of two macaque species. The data are auto-scaled. Colored ovals indicate 95% confidence regions. Variance explained by the first (PC1) and second (PC2) principal components are indicated on the axis. AH – aqueous humor, VH – vitreous humor, IV – intravital, PM – post-mortem.
Figure 7.
Heatmap for samples and metabolites. The data are auto-scaled. Distance measure – Euclidean, clustering method – Ward. AH – aqueous humor, VH – vitreous humor, IV – intravital, PM – post-mortem, acronym “J” in sample names – Crab-eating macaque (M. fascicularis), “R” – Rhesus macaque (M. mulatta).
Table 1.
Description of species and samples.
Table 1.
Description of species and samples.
| Species ID |
Species |
Age, years |
Gender |
Tissues collected |
Date of sample collection |
Accompanying diseases |
| 704 |
Crab-eating maqacue
(Macaca fascicularis) |
4 |
female |
Serum (post-mortem), lens, AH, VH |
27.10.2021 |
|
| 705 |
Crab-eating maqacue
(Macaca fascicularis) |
4 |
male |
Serum (post-mortem), lens, AH, VH |
27.10.2021 |
|
| 706 |
Crab-eating maqacue
(Macaca fascicularis) |
4 |
male |
Serum (post-mortem), lens, AH, VH |
27.10.2021 |
|
| 707 |
Crab-eating maqacue
(Macaca fascicularis) |
4 |
female |
Serum (post-mortem), lens, AH, VH |
27.10.2021 |
|
| 708 |
Crab-eating maqacue
(Macaca fascicularis) |
4 |
female |
Serum (post-mortem), lens, AH, VH |
27.10.2021 |
|
| 709 |
Crab-eating maqacue
(Macaca fascicularis) |
4 |
male |
Serum (post-mortem), lens, AH, VH |
27.10.2021 |
|
| 781 |
Crab-eating maqacue
(Macaca fascicularis) |
21 |
female |
Lens, AH, VH |
01.12.2021 |
Bilateral bronchopneumonia |
| 11 |
Crab-eating maqacue
(Macaca fascicularis) |
27 |
male |
Lens, VH |
11.01.2022 |
Bilateral bronchopneumonia |
| 19 |
Rhesus macaque
(Macaca mulatta) |
16 |
male |
Lens, AH, VH |
14.01.2022 |
Chronic atrophic gastroenterocolitis |
| 154 |
Rhesus macaque
(Macaca mulatta) |
20 |
female |
Lens, AH, VH |
25.03.2022 |
Chronic atrophic gastroenterocolitis |
| 740 |
Rhesus macaque
(Macaca mulatta) |
1.5 |
male |
Lens, AH, VH |
16.11.2021 |
Chronic atrophic gastroenterocolitis |
| 48495 |
Crab-eating maqacue
(Macaca fascicularis) |
4 |
male |
Serum (intravital) |
15.09.2022 |
|
| 48592 |
Crab-eating maqacue
(Macaca fascicularis) |
4 |
female |
Serum (intravital) |
15.09.2022 |
|
| 48496 |
Crab-eating maqacue
(Macaca fascicularis) |
4 |
female |
Serum (intravital) |
15.09.2022 |
|
| 48588 |
Crab-eating maqacue
(Macaca fascicularis) |
4 |
female |
Serum (intravital) |
15.09.2022 |
|
| 48541 |
Crab-eating maqacue
(Macaca fascicularis) |
4 |
male |
Serum (intravital) |
15.09.2022 |
|
| 48519 |
Crab-eating maqacue
(Macaca fascicularis) |
4 |
male |
Serum (intravital) |
15.09.2022 |
|
| 48518 |
Crab-eating maqacue
(Macaca fascicularis) |
4 |
male |
Serum (intravital) |
15.09.2022 |
|
|
Disclaimer/Publisher’s Note: The statements, opinions and data contained in all publications are solely those of the individual author(s) and contributor(s) and not of MDPI and/or the editor(s). MDPI and/or the editor(s) disclaim responsibility for any injury to people or property resulting from any ideas, methods, instructions or products referred to in the content. |
© 2023 by the authors. Licensee MDPI, Basel, Switzerland. This article is an open access article distributed under the terms and conditions of the Creative Commons Attribution (CC BY) license (http://creativecommons.org/licenses/by/4.0/).
