3.1. Japan's food self-sufficiency rate, feed self-sufficiency rate, food supply and demand, and supply for feed
According to MAFF [
11], food self-sufficiency rate on a calorie supply basis is calculated by dividing the caloric value of domestic food production (caloric value supplied by domestic food) by the caloric value of total domestic food supply (caloric value supplied by all food, including imported food). On the other hand, self-sufficiency rate for livestock feed is based on TDN (Total Digestible Nutrients) weight. The calorie based self-sufficiency rate for livestock products is obtained by multiplying the domestic production rate by the self-sufficiency rate for the feed.
For example, in 2022, the feed self-sufficiency rate is 26% (6,561 thousand TDN tons/ 25,003 thousand TDN tons), hence the food self-sufficiency on a calorie supply basis for beef is 13%, although 47% of beef is produced in Japan. The domestic caloric supply per capita per day is 850 kcal, and the total domestic caloric supply is 2,260 kcal, so Japan's food self-sufficiency on a calorie supply basis is 38% (2022). The food self-sufficiency on a calorie supply basis allows a strict evaluation of the portion that can be produced solely from domestically production (including feed), and thus enables an assessment of the state of food security in Japan.
Next, the current status of Japan's food self-sufficiency ratio and the Japanese government's goals regarding food self-sufficiency are explained. Based on the Basic Act on Food, Agriculture and Rural Areas (1999) [
12], the Ministry of Agriculture, Forestry and Fisheries (MAFF) is mandated to formulate the Basic Plan for Food, Agriculture and Rural Areas, which sets targets for food self-sufficiency. The most recent basic plan was formulated in 2020. The overall food self-sufficiency on a calorie supply basis in 2018, the base year, was 37%, this is to be increased to 45% by the target year, 2030. In addition, the target self-sufficiency rate for feed is set to increase from 25% to 34%. In the previous plan, the self-sufficiency rate for feed was 26% in the base year of 2012, and the target set for 2020 was 38%. In reality, from 2012 to 2021, the self-sufficiency rate for feed stagnated at an average of 26%, with little change.
Feed is composed of roughage (coarse feed) such as grass, silage, and rice straw, as well as concentrated feed made from grains such as corn, barley and rice. Concentrated feed includes "Ecofeed", a term coined by MAFF, referring to feed converted from by-products of food production (e.g., residuals of soy from soy sauce or tofu production, residuals of distilled alcoholic drinks production), unsold food (bread, boxed lunch (bento), etc. that ended up not being eaten), and preparation residues (vegetable scraps and removed parts). Utilisation of farm leftovers (off-spec agricultural products, etc.) is also included in ecofeed [
13].
The basic plan calls for 100% self-sufficiency in roughage by 2030, compared to 76% in 2020, and for 15% in concentrated feed by 2030, compared to 12% domestically produced in 2020. Under the previous plan, the goal was to increase the self-sufficiency rate for roughage from 76% in 2012 to 100% in 2020, and to increase that for domestic concentrated feed from 12% in 2012 to 19% in 2020. In addition to failing to meet the 2020 target, the 2030 target is set lower than the previous plan's target.
Regarding ecofeed, in calculating the self-sufficiency rate of feed, MAFF takes into account the origin of its sources, whether the residues etc. used for ecofeed had been produced domestically or imported. According to MAFF, the total production of ecofeed in 2020 was 1.08 million tons, of which 780,000 tons were made from food of imported origin, such as by-product of tofu (bean curd) made from imported soybeans and removed bread crusts produced when bread made from imported wheat is processed into sandwiches. The remaining 300,000 tons are estimated to have originated from domestically produced food, such as residues from fruit juice production using domestically grown fruits. Only the estimated domestic component of ecofeed is included in the self-sufficiency rate for feed.
In 2020, the supply of concentrated feed was 20.5 million tons, of which 12%, or 2.46 million tons is considered domestic. The domestic component of ecofeed accounts for 300,000 tons, or 12% of domestic concentrated feed. The share of domestic component of ecofeed in the supply of domestic concentrated feed is 12.9% on average from 2012 to 2021. This percentage has also remained flat and unchanged.
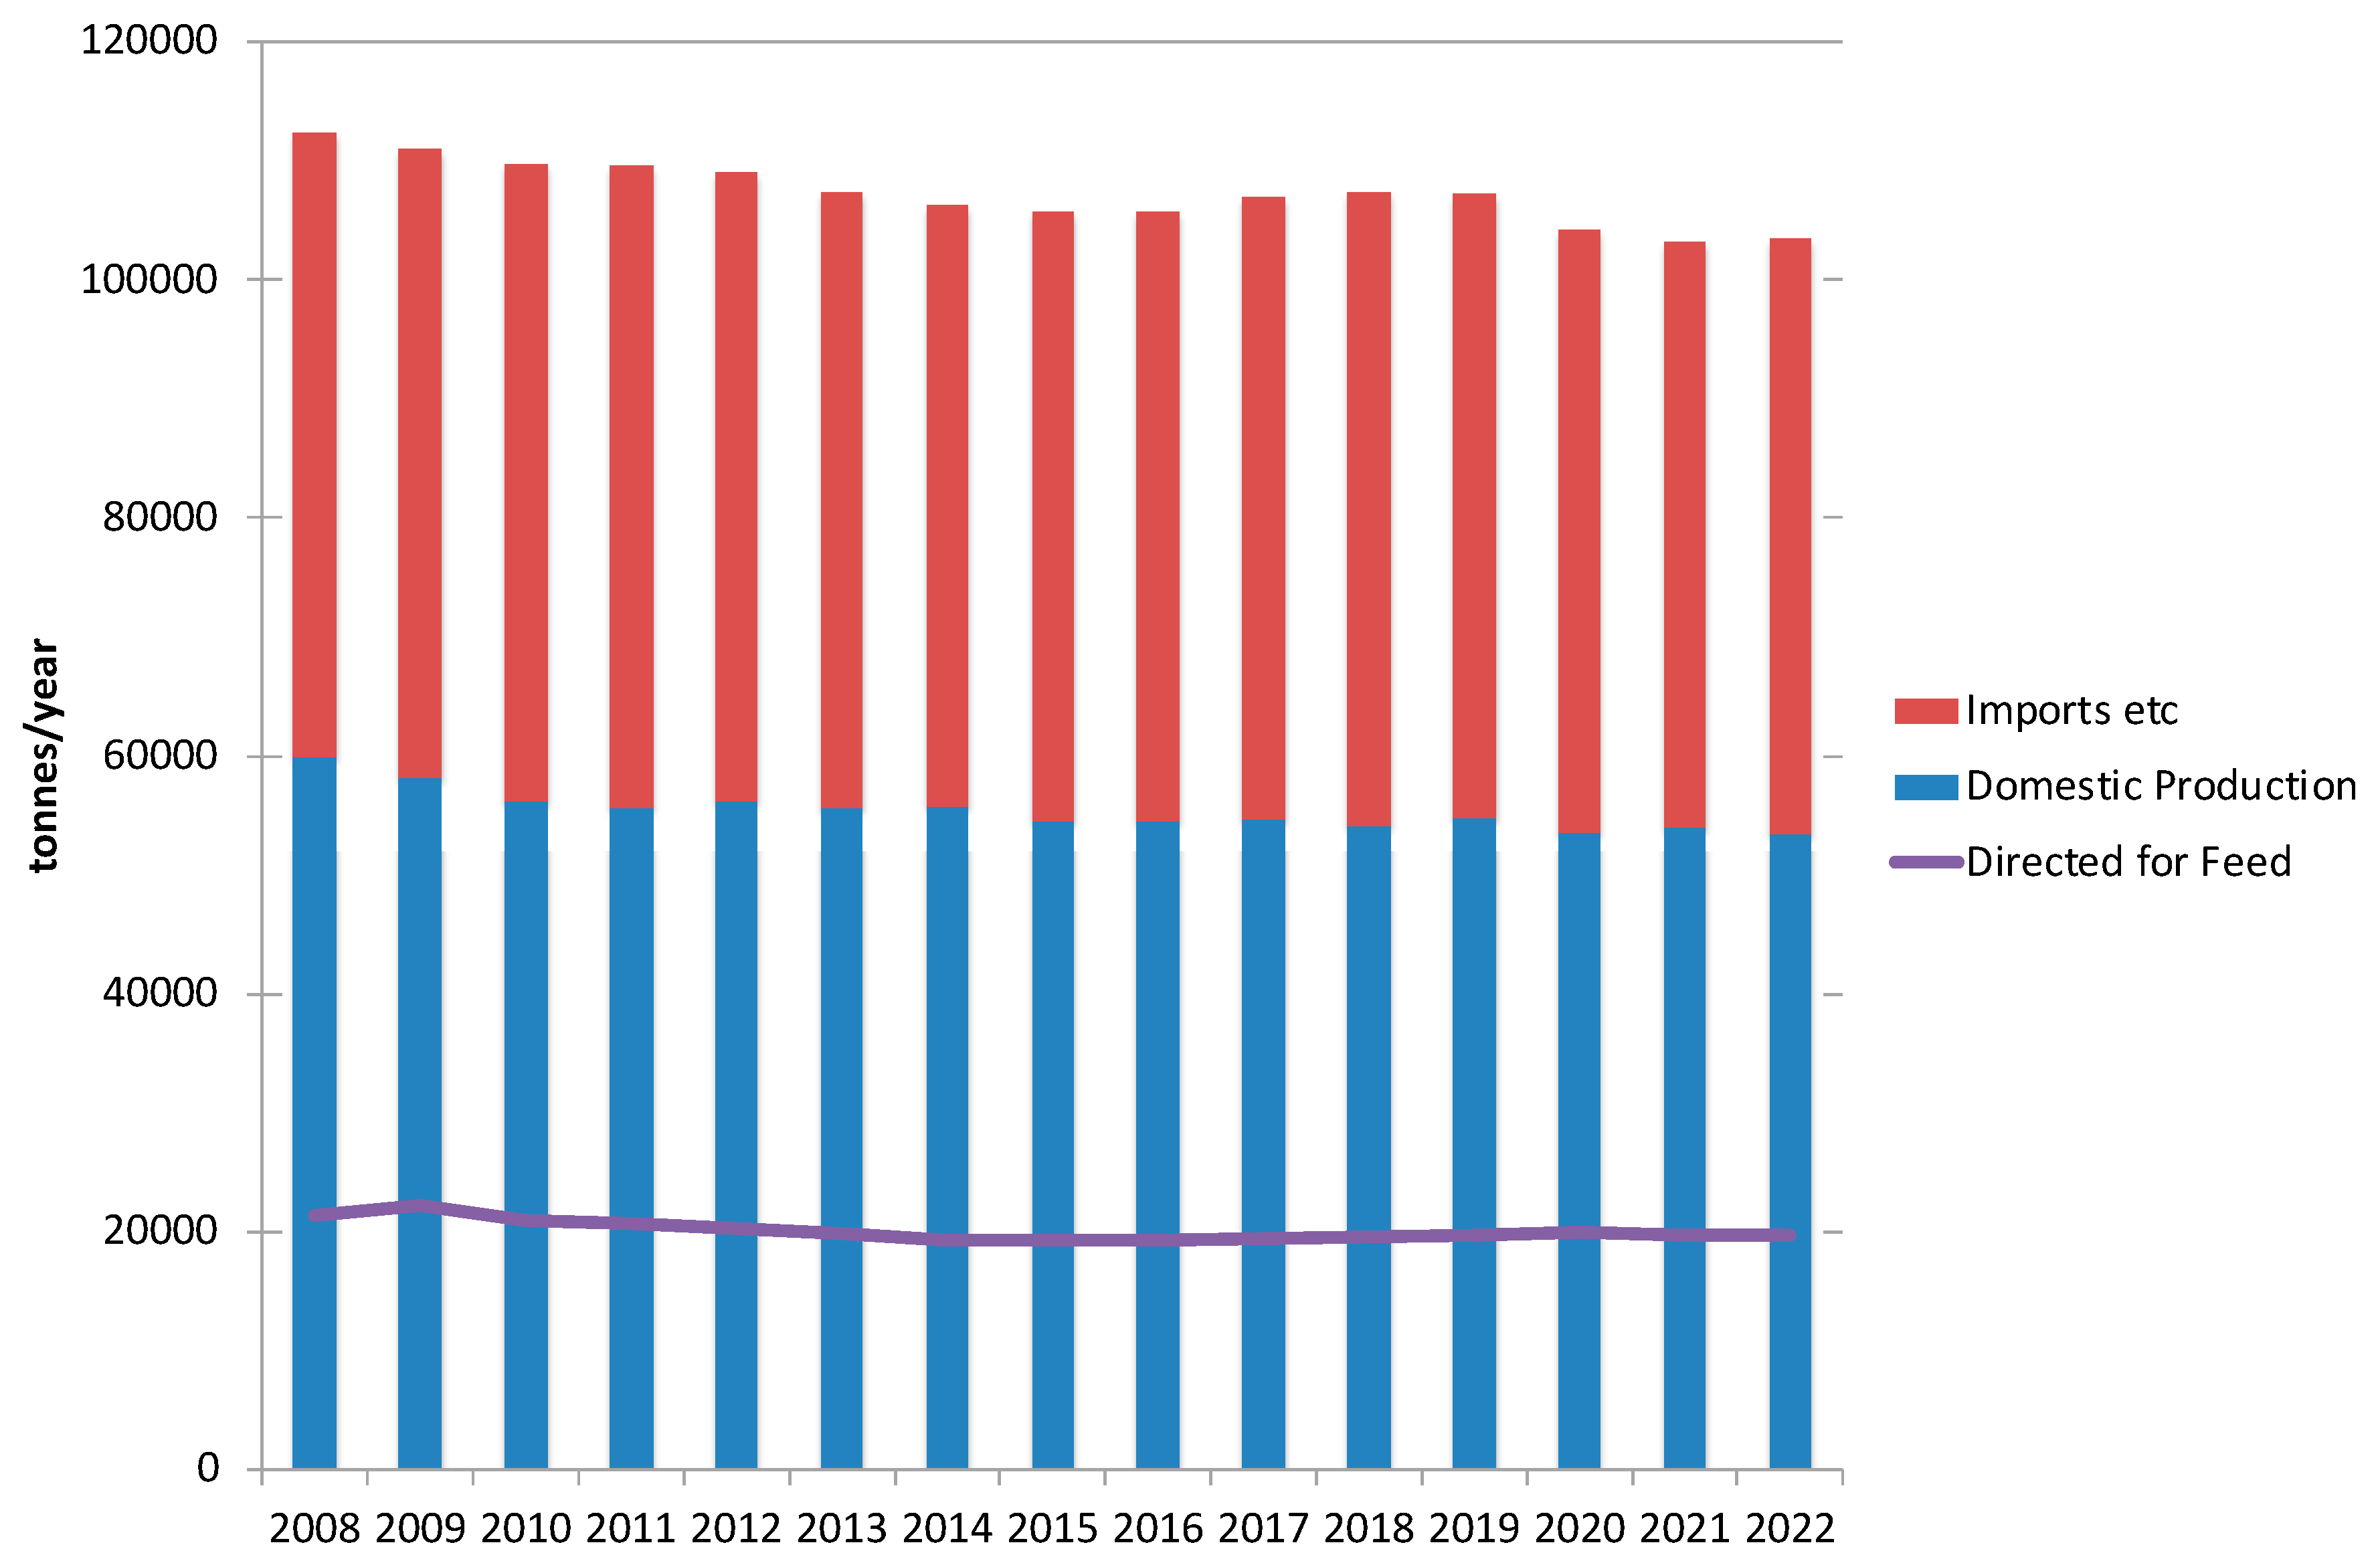
Figure 2 shows the trends of domestic production, imports, and supply for feed from Japan's food balance sheet. The total length of the bar graph shows the total food supply, while the lower part shows the domestic production. The upper part indicates the net import (difference between imports and exports). The line graph shows the amount of food supply that was destined as feed.
In 2020, food supply consisted of 53,553,000 tons of domestic production and 50,577,000 tons of net import. Of the total food supply, approximately 1/5 or 2,200,000 tons was destined for feed.
As can be seen from the graph, Japan's food supply has been on a slight downward trend since FY 2008. After World War II, the total population of Japan continued to increase and exceeded 100 million for the first time in 1967, but began to decline after 2006/2007, when it reached 127.77 million [
14]. Thus, as Japan's population has been declining since 2008, it is only natural that the supply and demand for food have also declined. Food supply has continued to decline slightly from 110 million tons, and the supply for feed for livestock production has remained flat at about 20 million tons.
In Japan, the target for food self-sufficiency on a calorie supply basis has been set at a little less than 50%, but since 2000 it has remained flat at about 40% or less and has not risen at all. In order to achieve the food self-sufficiency target, it is essential to increase the production of domestically produced feed. If they were to achieve this goal, it is necessary to increase the production of domestically produced wheat and soybeans and reduce the relative share of imported food. Even with ecofeed, there will be no increase in its domestic component without an increase in originally domestic sources.
3.2. Trends in Food Waste Recycling under the Food Waste Recycling Law
The Food Waste Recycling Law was enacted in 2000 and became effective in 2001. Its purpose is to promote food waste reduction and recycling, as mentioned in section 1. When the Food Waste Recycling Law was first enacted, it was mandatory for only large generators of food waste to recycle food waste. The recycling mandate was imposed on the food manufacturing, food wholesale, food retail, and food service sectors. Food waste generated from households is not subject to this requirement. In Japan, food waste from food manufacturers is classified as industrial waste, while food waste from wholesalers, retailers, distributors, and restaurants is classified as municipal solid waste (commercial waste). The generator of industrial waste must arrange for recycling or disposal by itself, while the municipality handles the treatment and disposal of commercial waste. Generators of commercial waste bear the fees set by the municipality, but these fees are often subsidised (not covering the full cost of disposal) and lower than what food waste recyclers would charge. In other words, there is little financial incentive for commercial waste generators to recycle food waste.
The Food Waste Recycling Law has been amended four times to date, with the first amendment in 2007 including small and medium-sized food businesses as subject for promotion of food waste recycling. At the same time, the method for estimating the amount of food waste was improved. Until 2007, the survey sample for food wholesalers and food retailers was stratified by employee size. In fact, the relationship between the amount of food waste generated and the number of employees is low, and because of the skewed sample there was an overestimation of food waste generation in these sectors.
The 2007 revision mandated periodic reporting from food-related businesses that generate 100 tons or more of food waste per year [
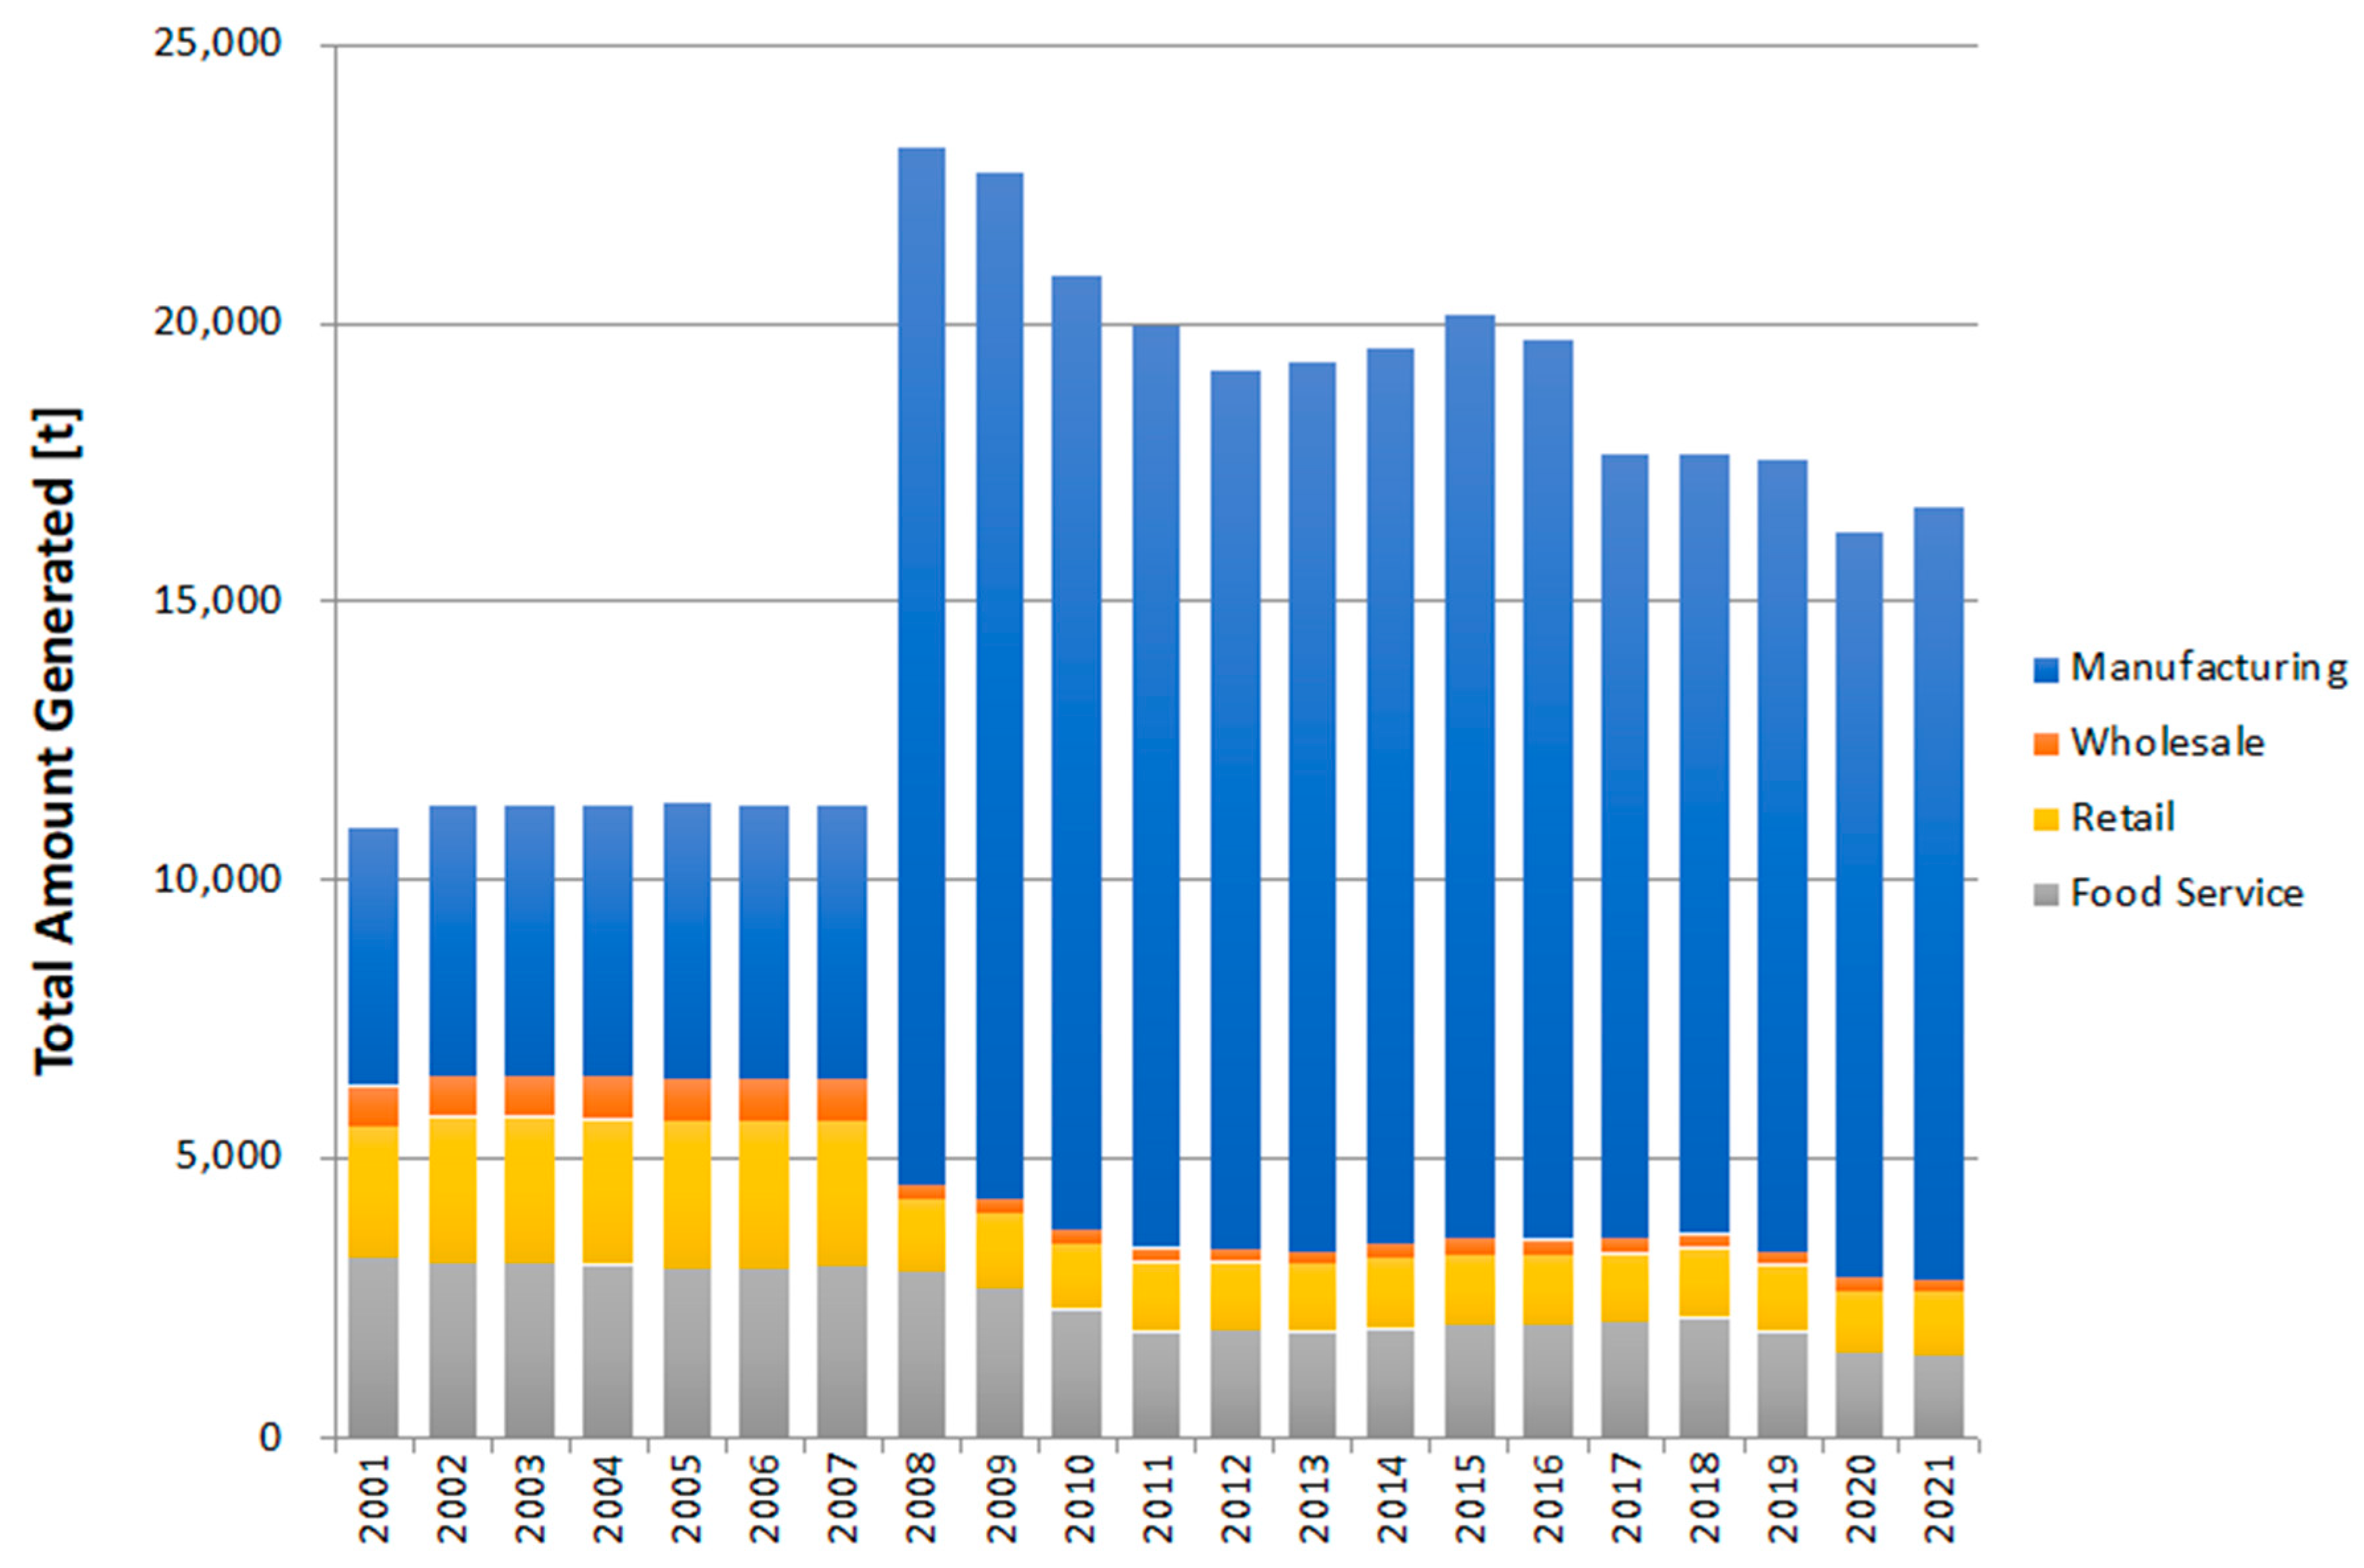
15]. As a result, the estimated amount of food waste generated in the wholesale and retail sectors have decreased significantly since 2008, while in the manufacturing industry it has doubled. Because there are relatively few large businesses in the food service sector, the estimates on the amount of food waste remained the same before and after the law was revised. Although the Food Waste Recycling Law is in its 23rd year now in 2023, only data after 2008 can be regarded reliable. Therefore, this paper also examines mainly the data from 2008 onwards.
The next revision was in 2010, when the scope of waste to be recycled was again expanded to include food waste from hotels and other food waste generated at event venues. The 2015 amendment set reduce, recycling, and energy recovery etc. rate targets, with a 60% target for large food waste generators and a 50% target for small and medium-sized food businesses. In the 2020 revision, the target rates were raised, 70% for large food waste generators and a 60% target for small and medium-sized businesses. By industry sector, the targets were set at 95% for food manufacturers (same as 2015), 75% for food wholesalers (+5%), 60% for food retailers (+5%), and 50% for food service (same as 2015), these targets are to be achieved by 2024.
The 2020 revision also places particular emphasis on reducing the edible portion of food waste, setting a target of halving the amount of edible waste by 2030 compared to the 2000 level. However, since it is difficult for businesses to separately measure edible and inedible parts of food waste, the amount of food waste generated and recycled is reported as a whole, as it has been in the past.
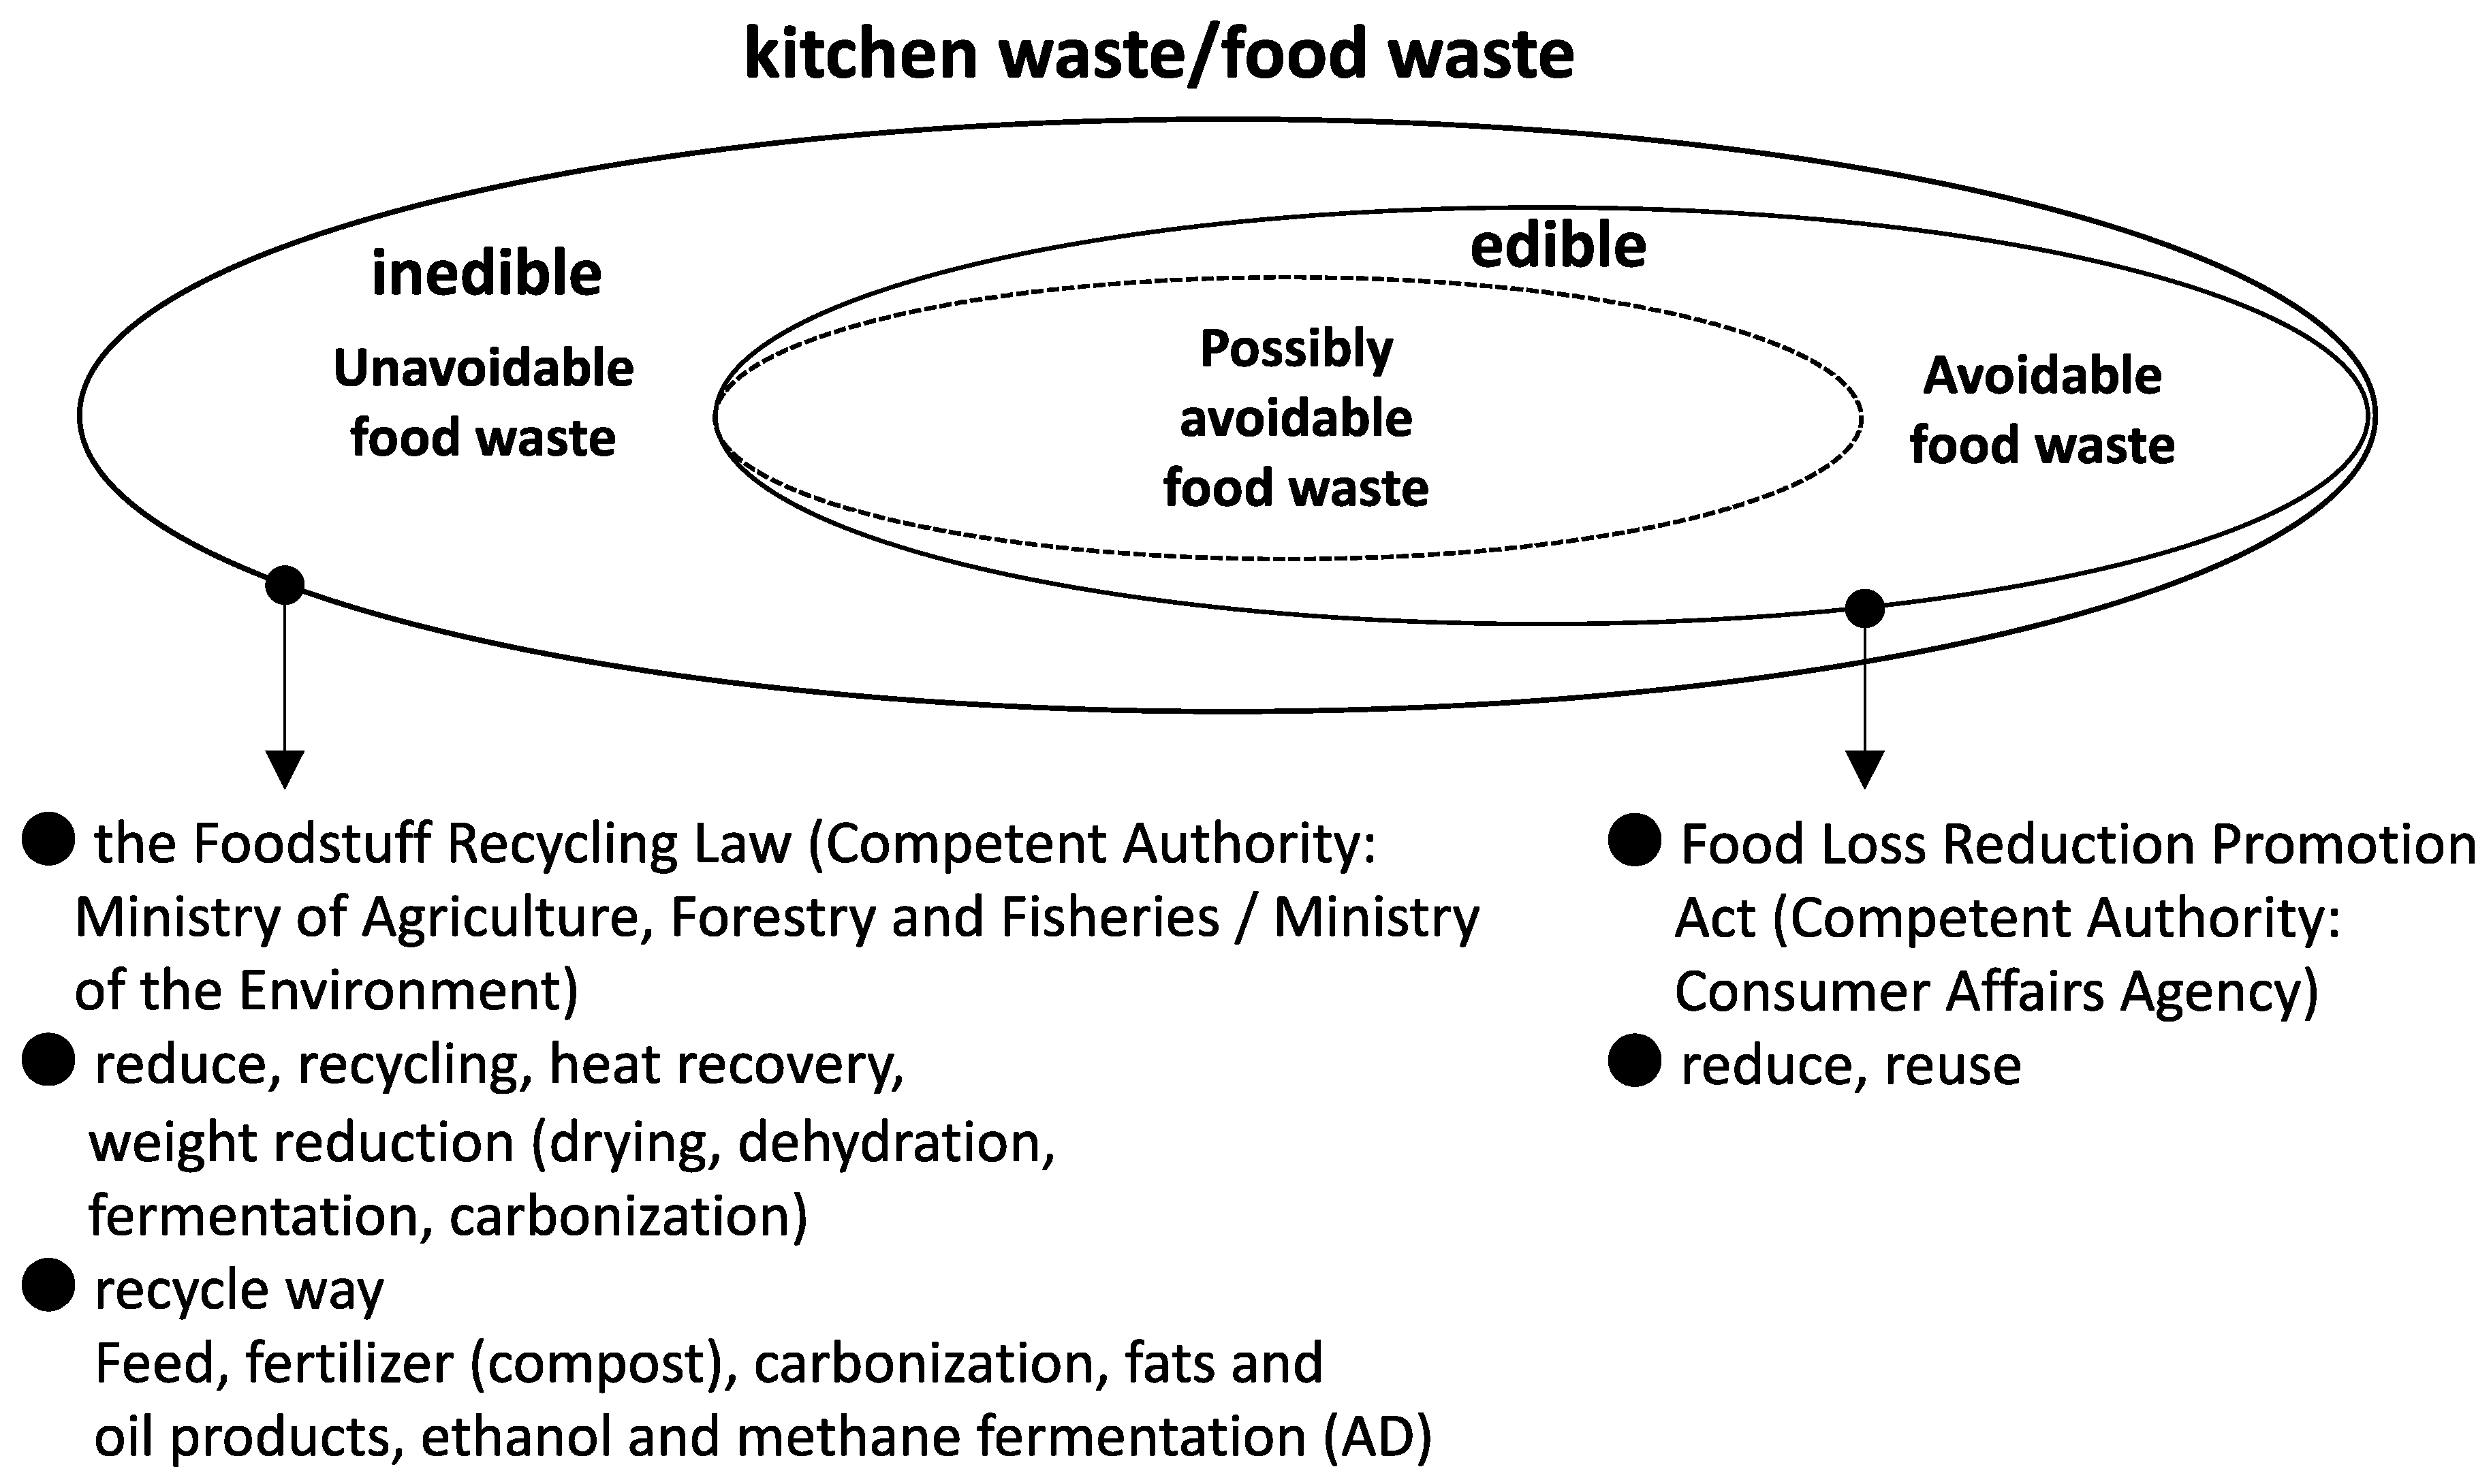
Some of the parts that are considered as avoidable (edible) food waste are not easy to be avoided. For example, in tofu production, "tofu pulp" is generated. Tofu is made by adding coagulation minerals (bittern) to soymilk, which is the liquid made by grinding soybeans into small pieces and squeezing them after boiling. The residual after squeezing the soymilk is the tofu pulp. Traditionally this tofu pulp is destined for human consumption as "okara" (also known as "unohana"). It is made into a dish by cooking it with vegetables in broth or soy-sauce. Since tofu pulp can be processed for human consumption, it is categorised as avoidable (edible) food waste, and is subject to reduction. As tofu pulp is a by-product of tofu production, it is not possible to reduce its generation other than reducing the production of tofu itself. Given the current quantity of tofu production, the supply of tofu pulp by far exceeds the demand for it to be used as an okara dish. In theory, tofu producers should try as much as possible to have the tofu pulp consumed by humans, and only when that is not possible they should utilise it as animal feed, however due to lack of demand, it is not practical for many producers to pursue the human consumption route.
In the guideline, it is also suggested that producers should redirect items returned (rejected or unsold) to human consumption as food. For some items with a longer shelf life this may be possible, but in many cases such as of tofu, by the time the product is returned to the producer it will be deemed not fit for human consumption, and thus this is also prohibitively difficult to implement.
Figure 3 shows the amount of food waste generated by sector [
16]. It shows clearly that the amount of food waste generated from the food manufacturing industry is by far the largest. The amount of food waste is in decrease since 2008. It partly reflects the fact that food supply itself is in decline in the same period. Although not shown in
Figure 3, households generate the second largest amount of food waste after the manufacturing sector.
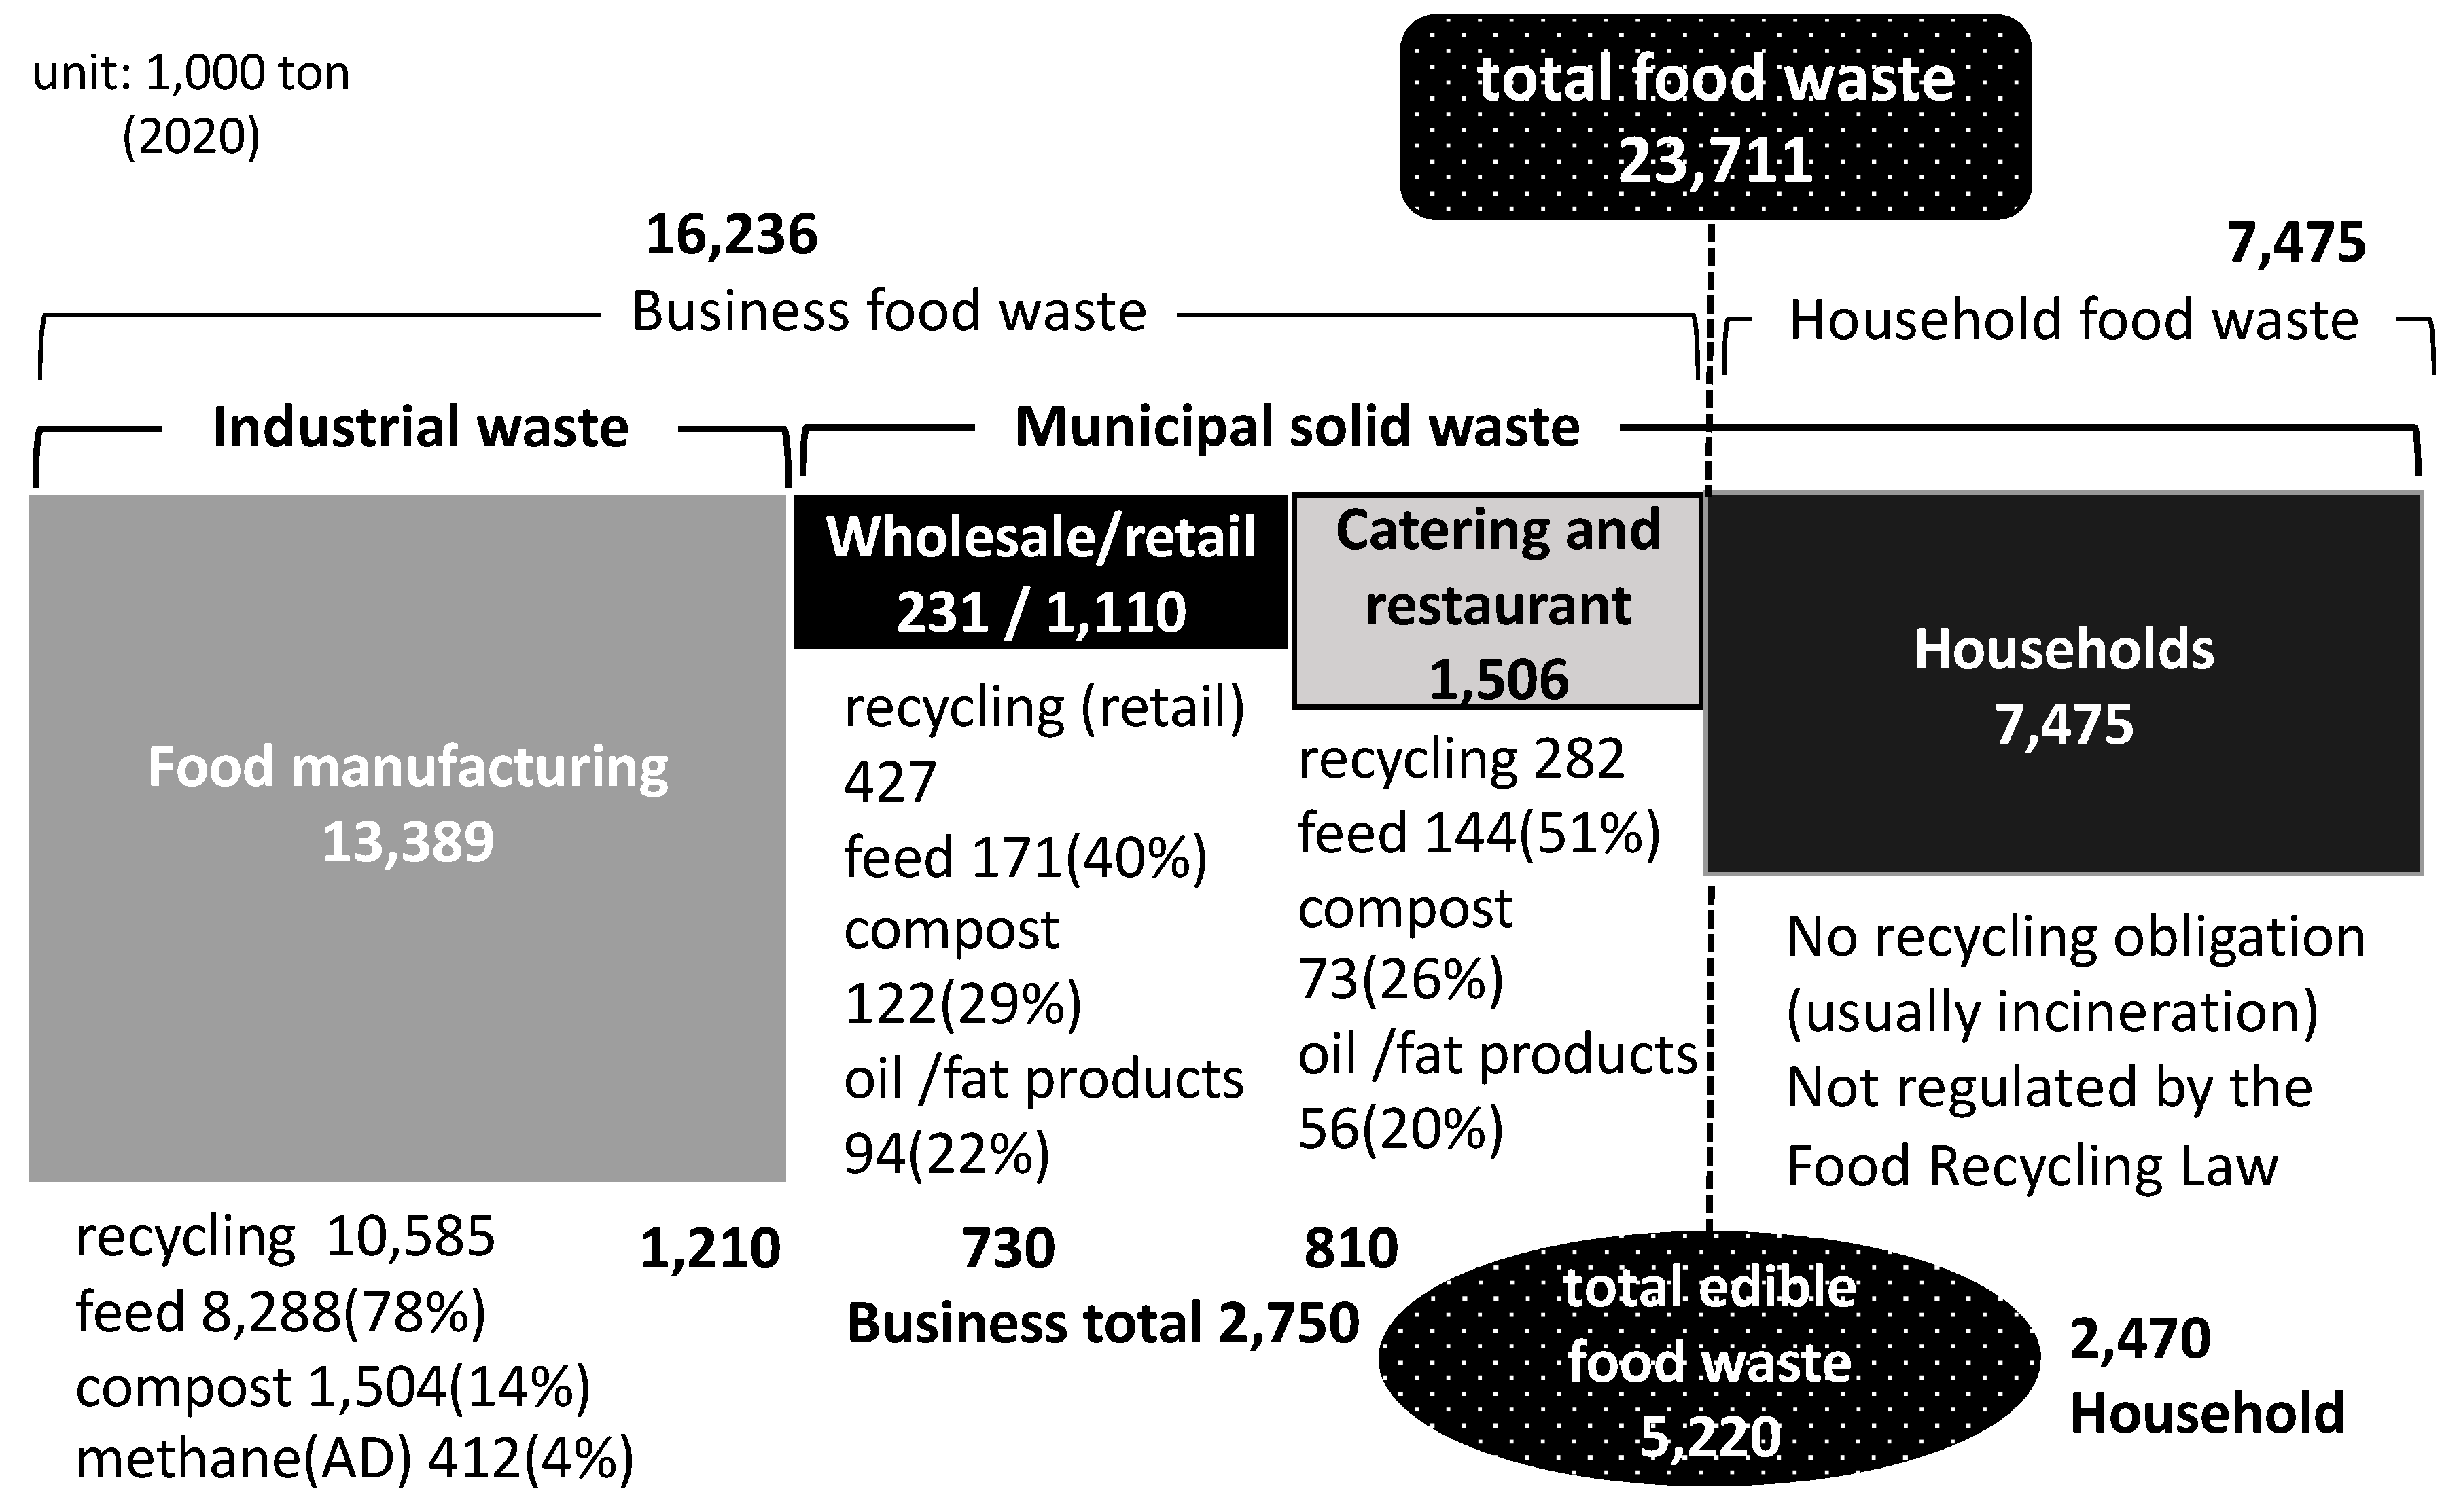
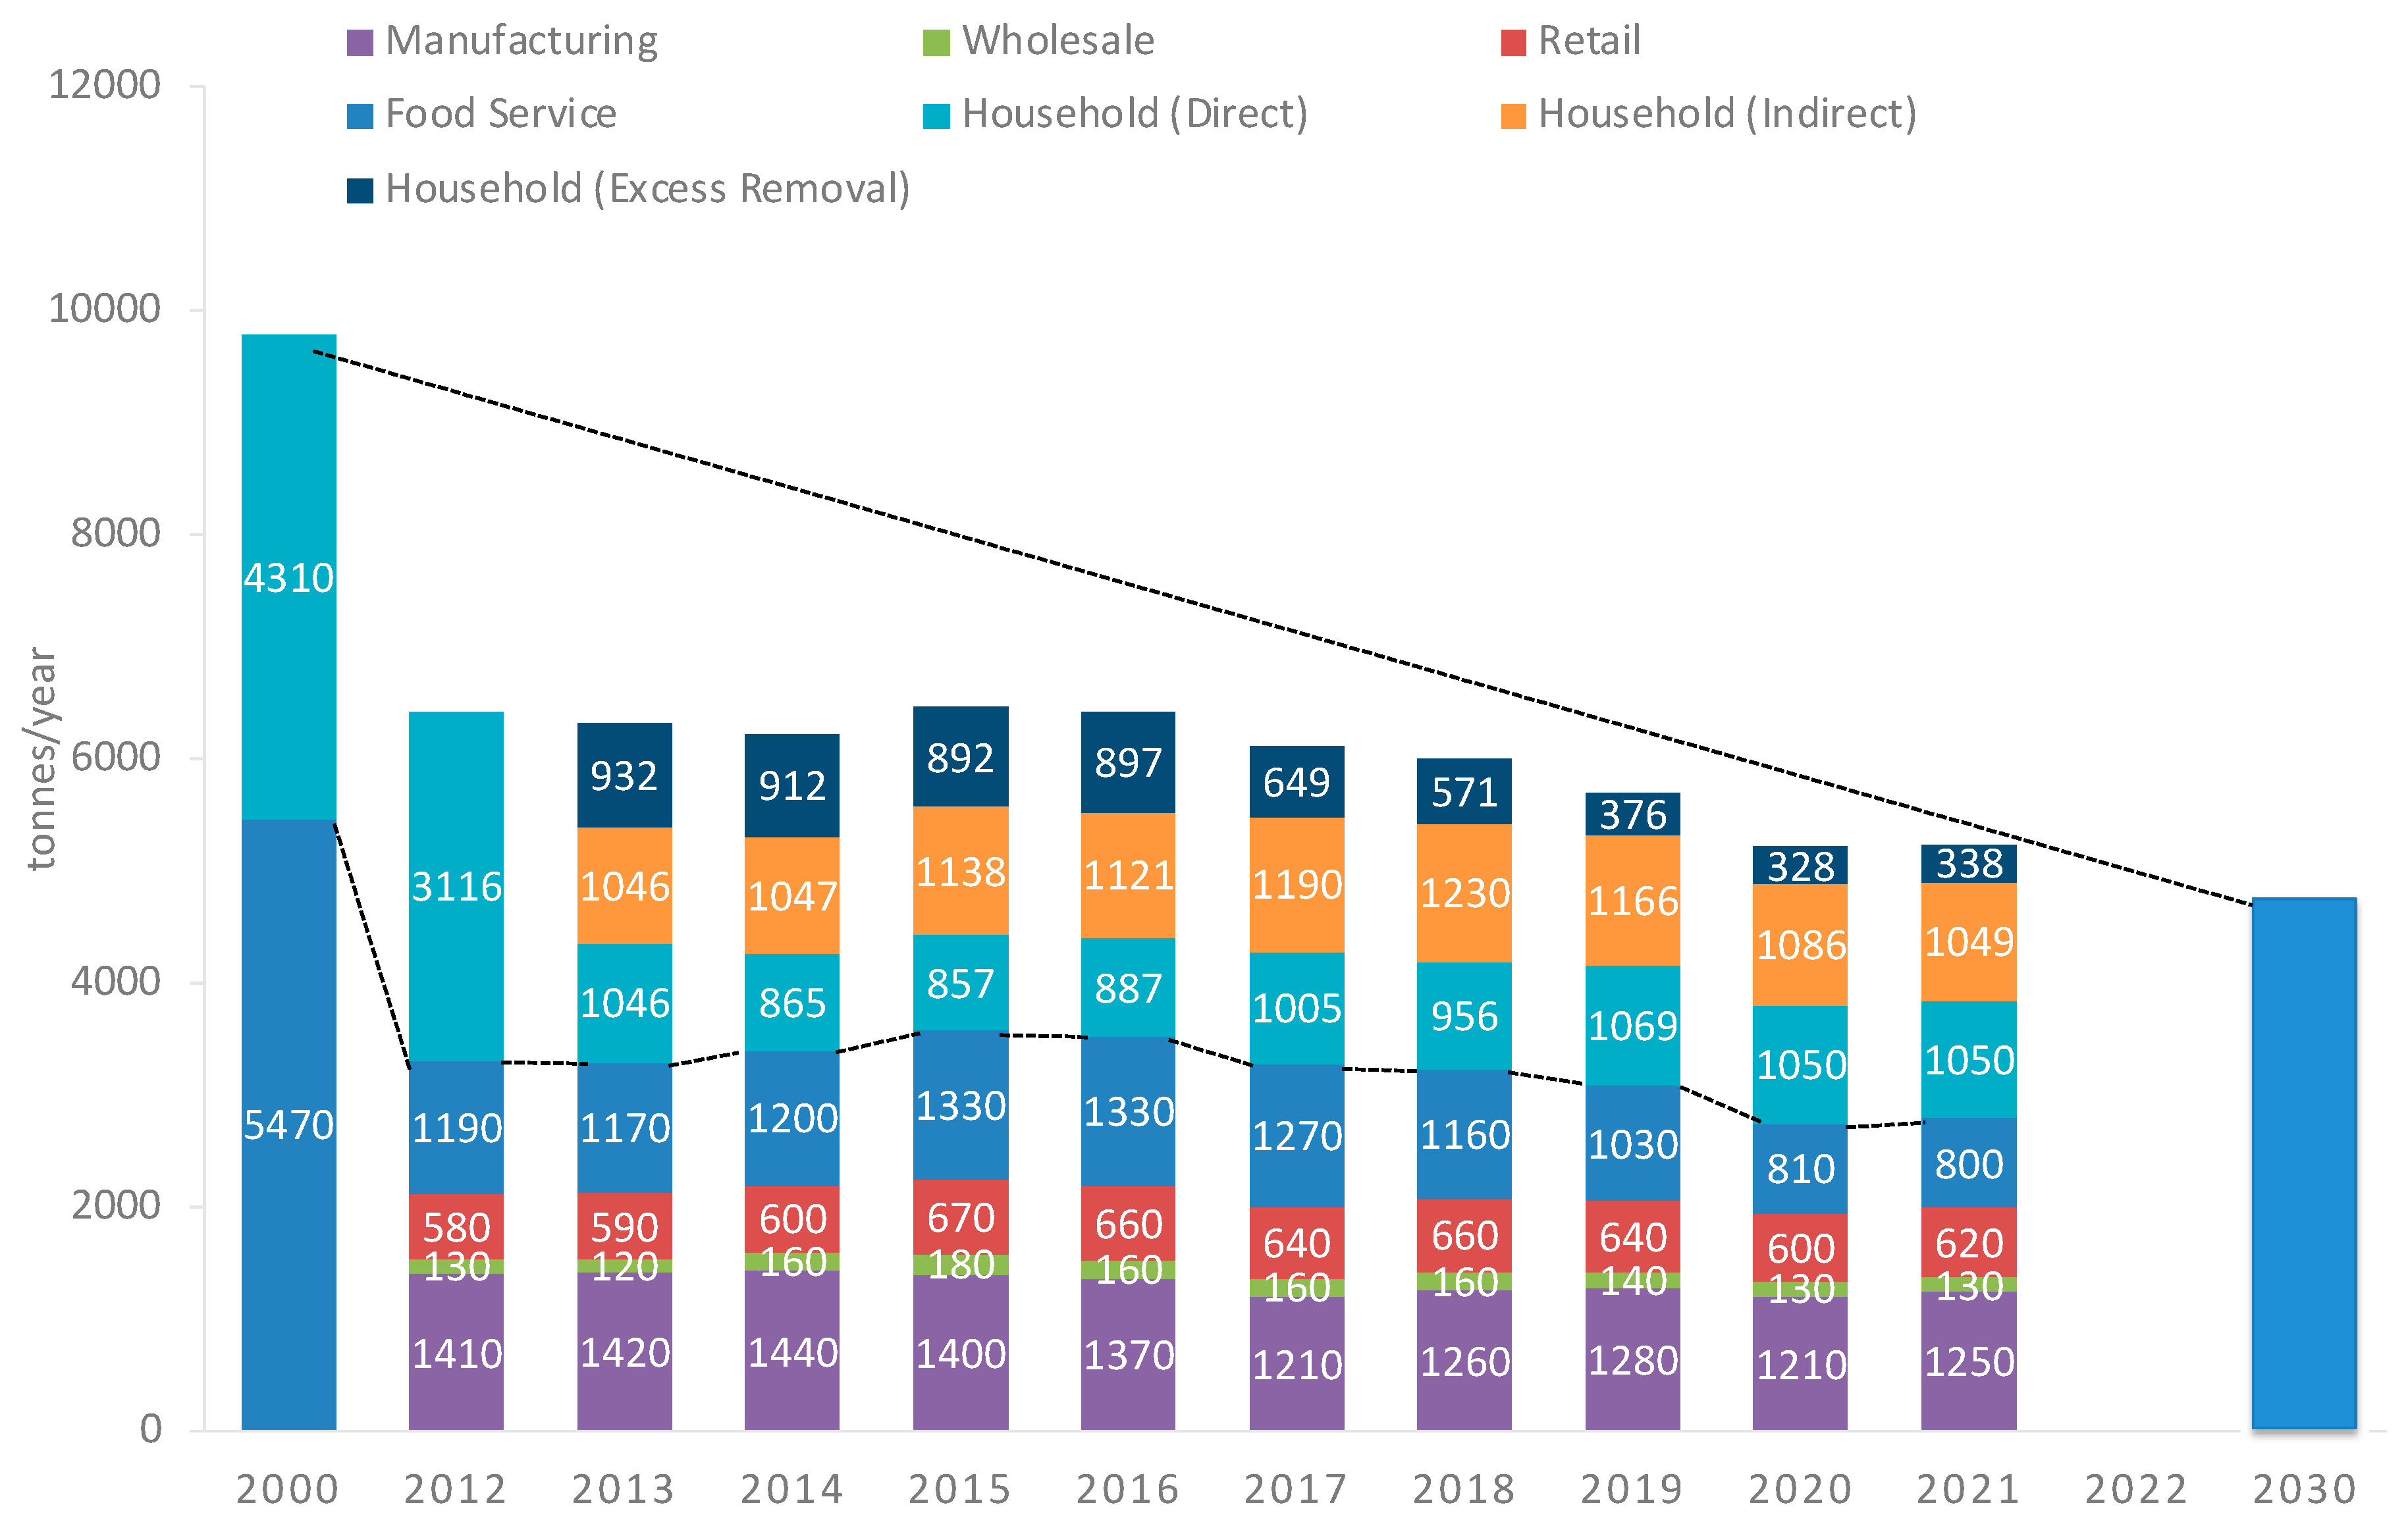
Figure 4 shows the situation including household food waste in 2020.
Figure 4 shows that there is a sizeable generation of household food waste. However, since the
Food Recycling Law targets only businesses, almost all of the food waste generated by households is incinerated. Some cities, such as Nagaoka, Toyohashi, and Machida, generate electricity by anaerobically digesting municipal food waste and using the resulting biogas. There are also several towns that conduct a separate collection of food waste and utilise as compost. These are all small municipalities with 1,000 to 30,000 residents. As a result, household food waste recycling has made little progress on a national scale.
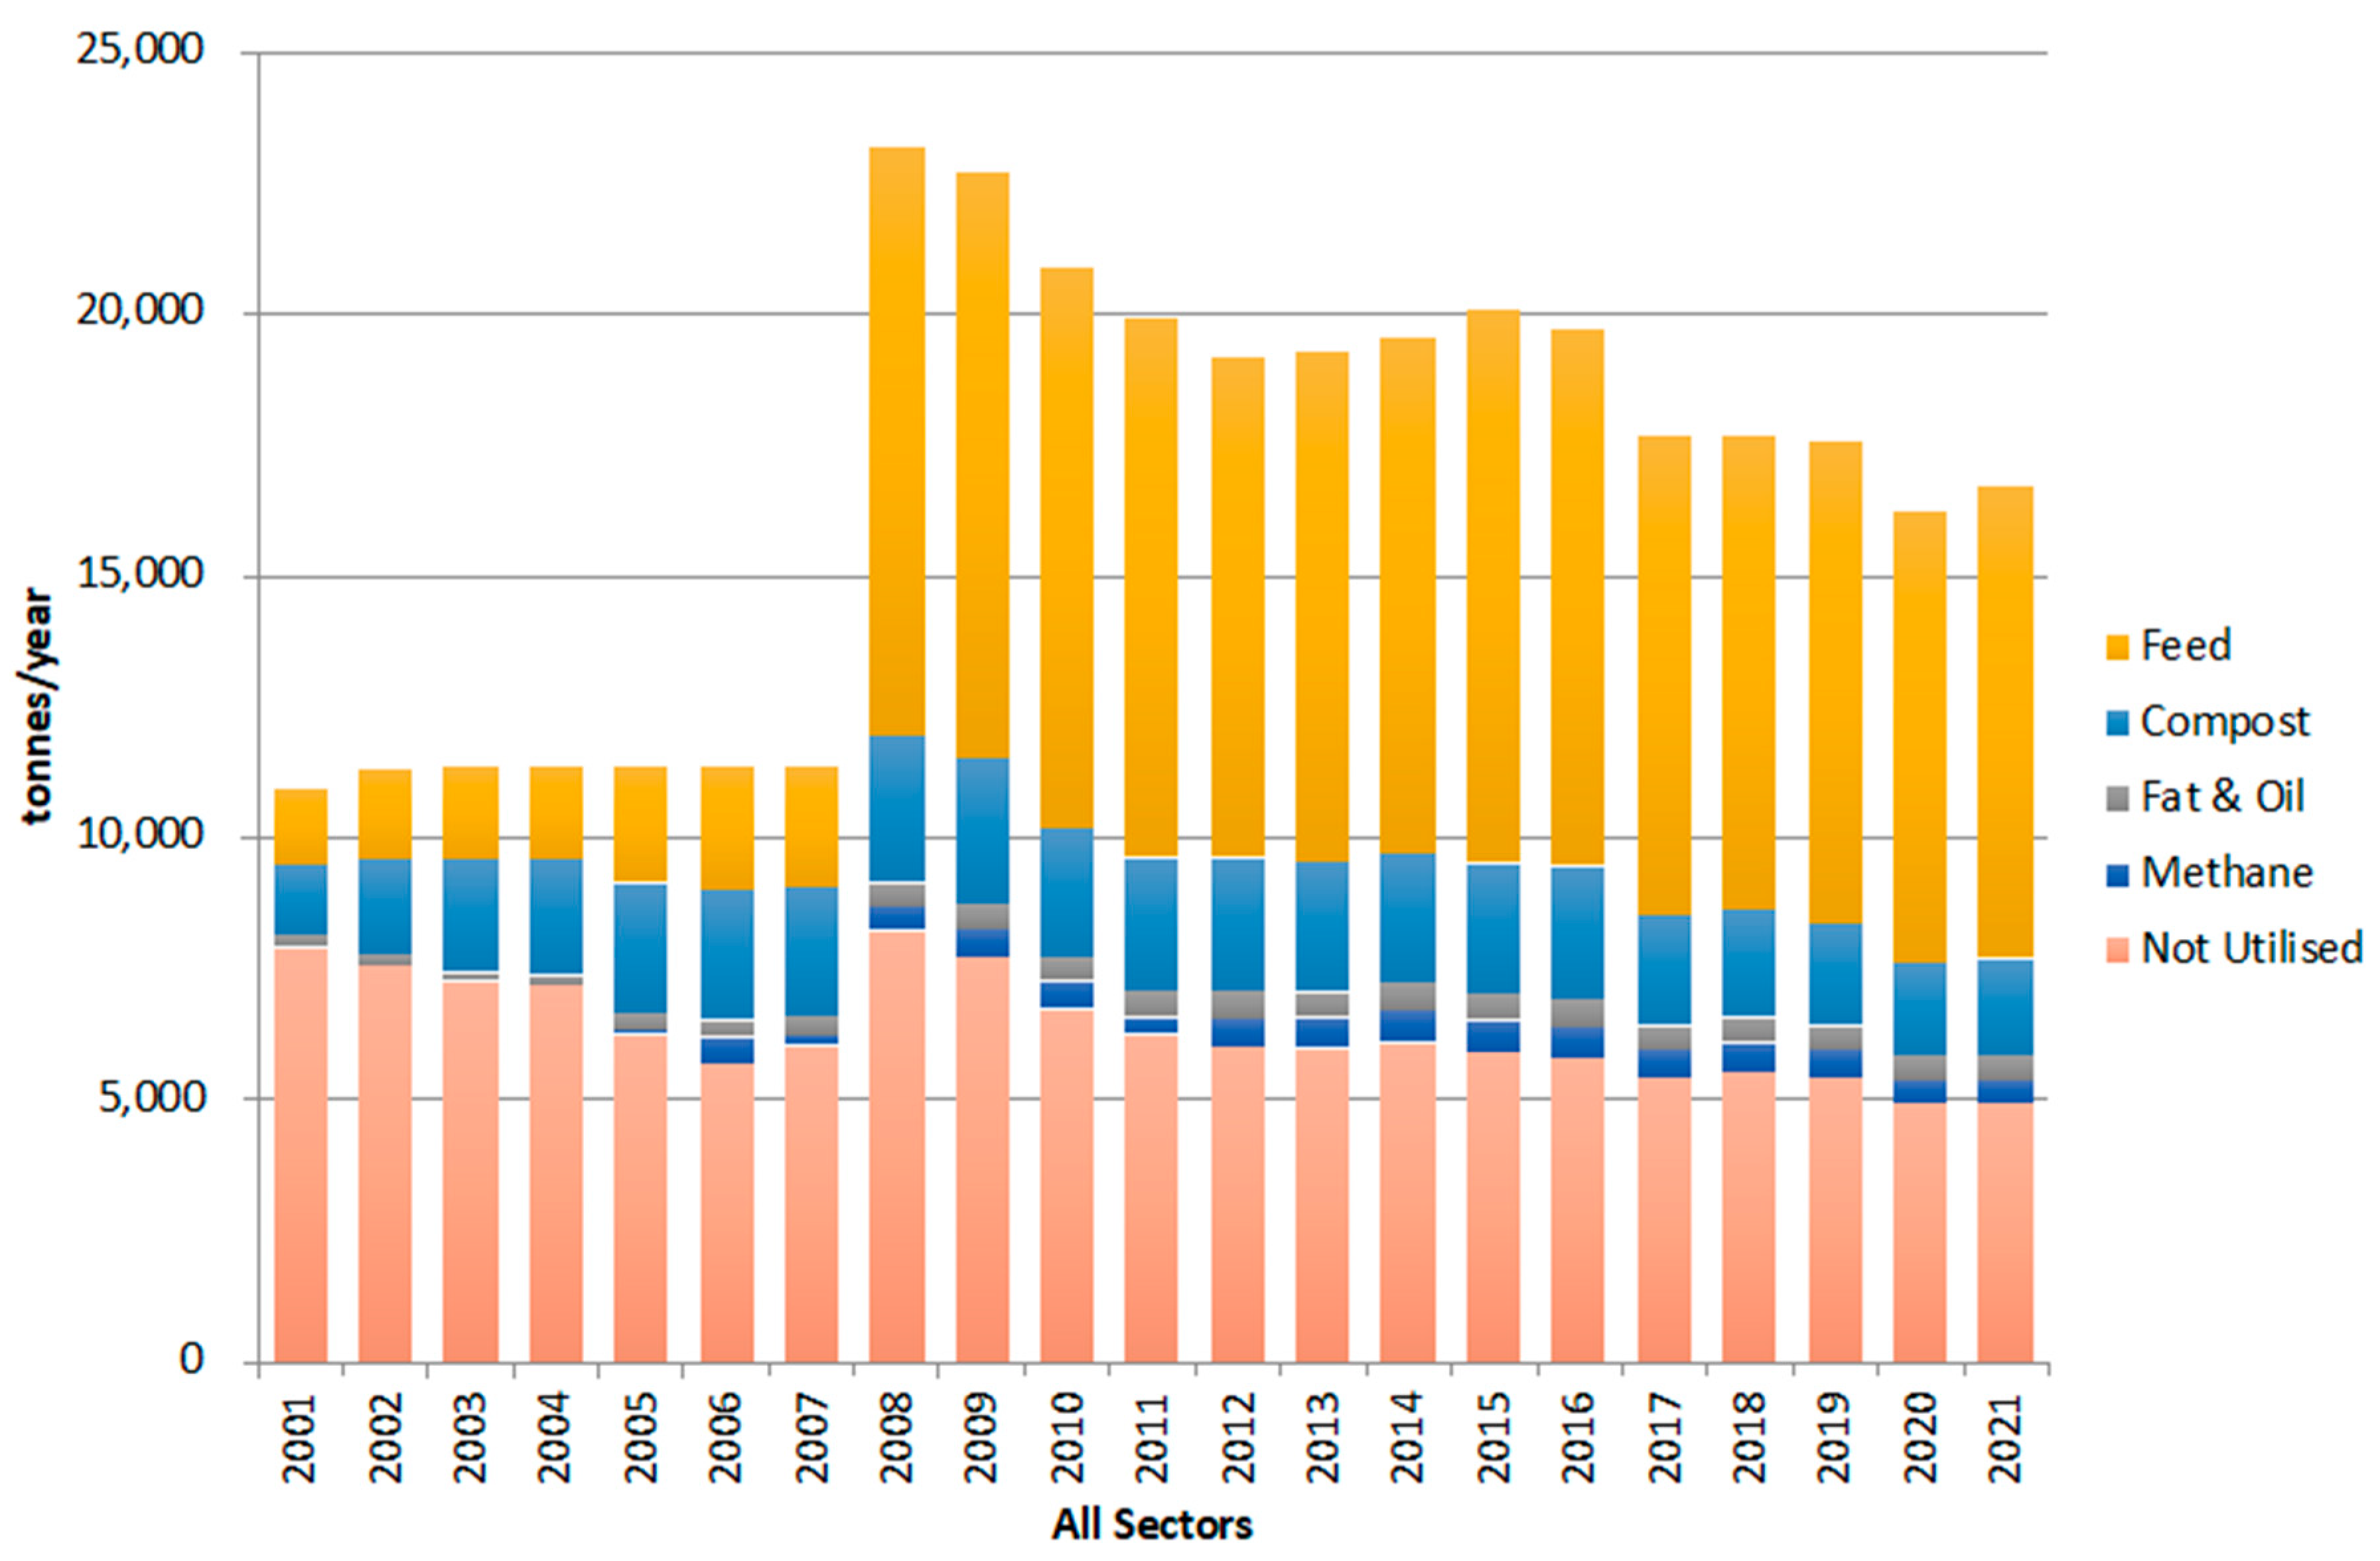
Figure 5 shows the amount of food waste by type of recycling as well as that was not utilised. The most common recycling method is conversion to feed, followed by composting. However, even though the amount of non-utilised food waste is also decreasing, it still accounts for 28.9% of the total amount generated in 2021, and the recycling rate for all businesses is 71.9%.
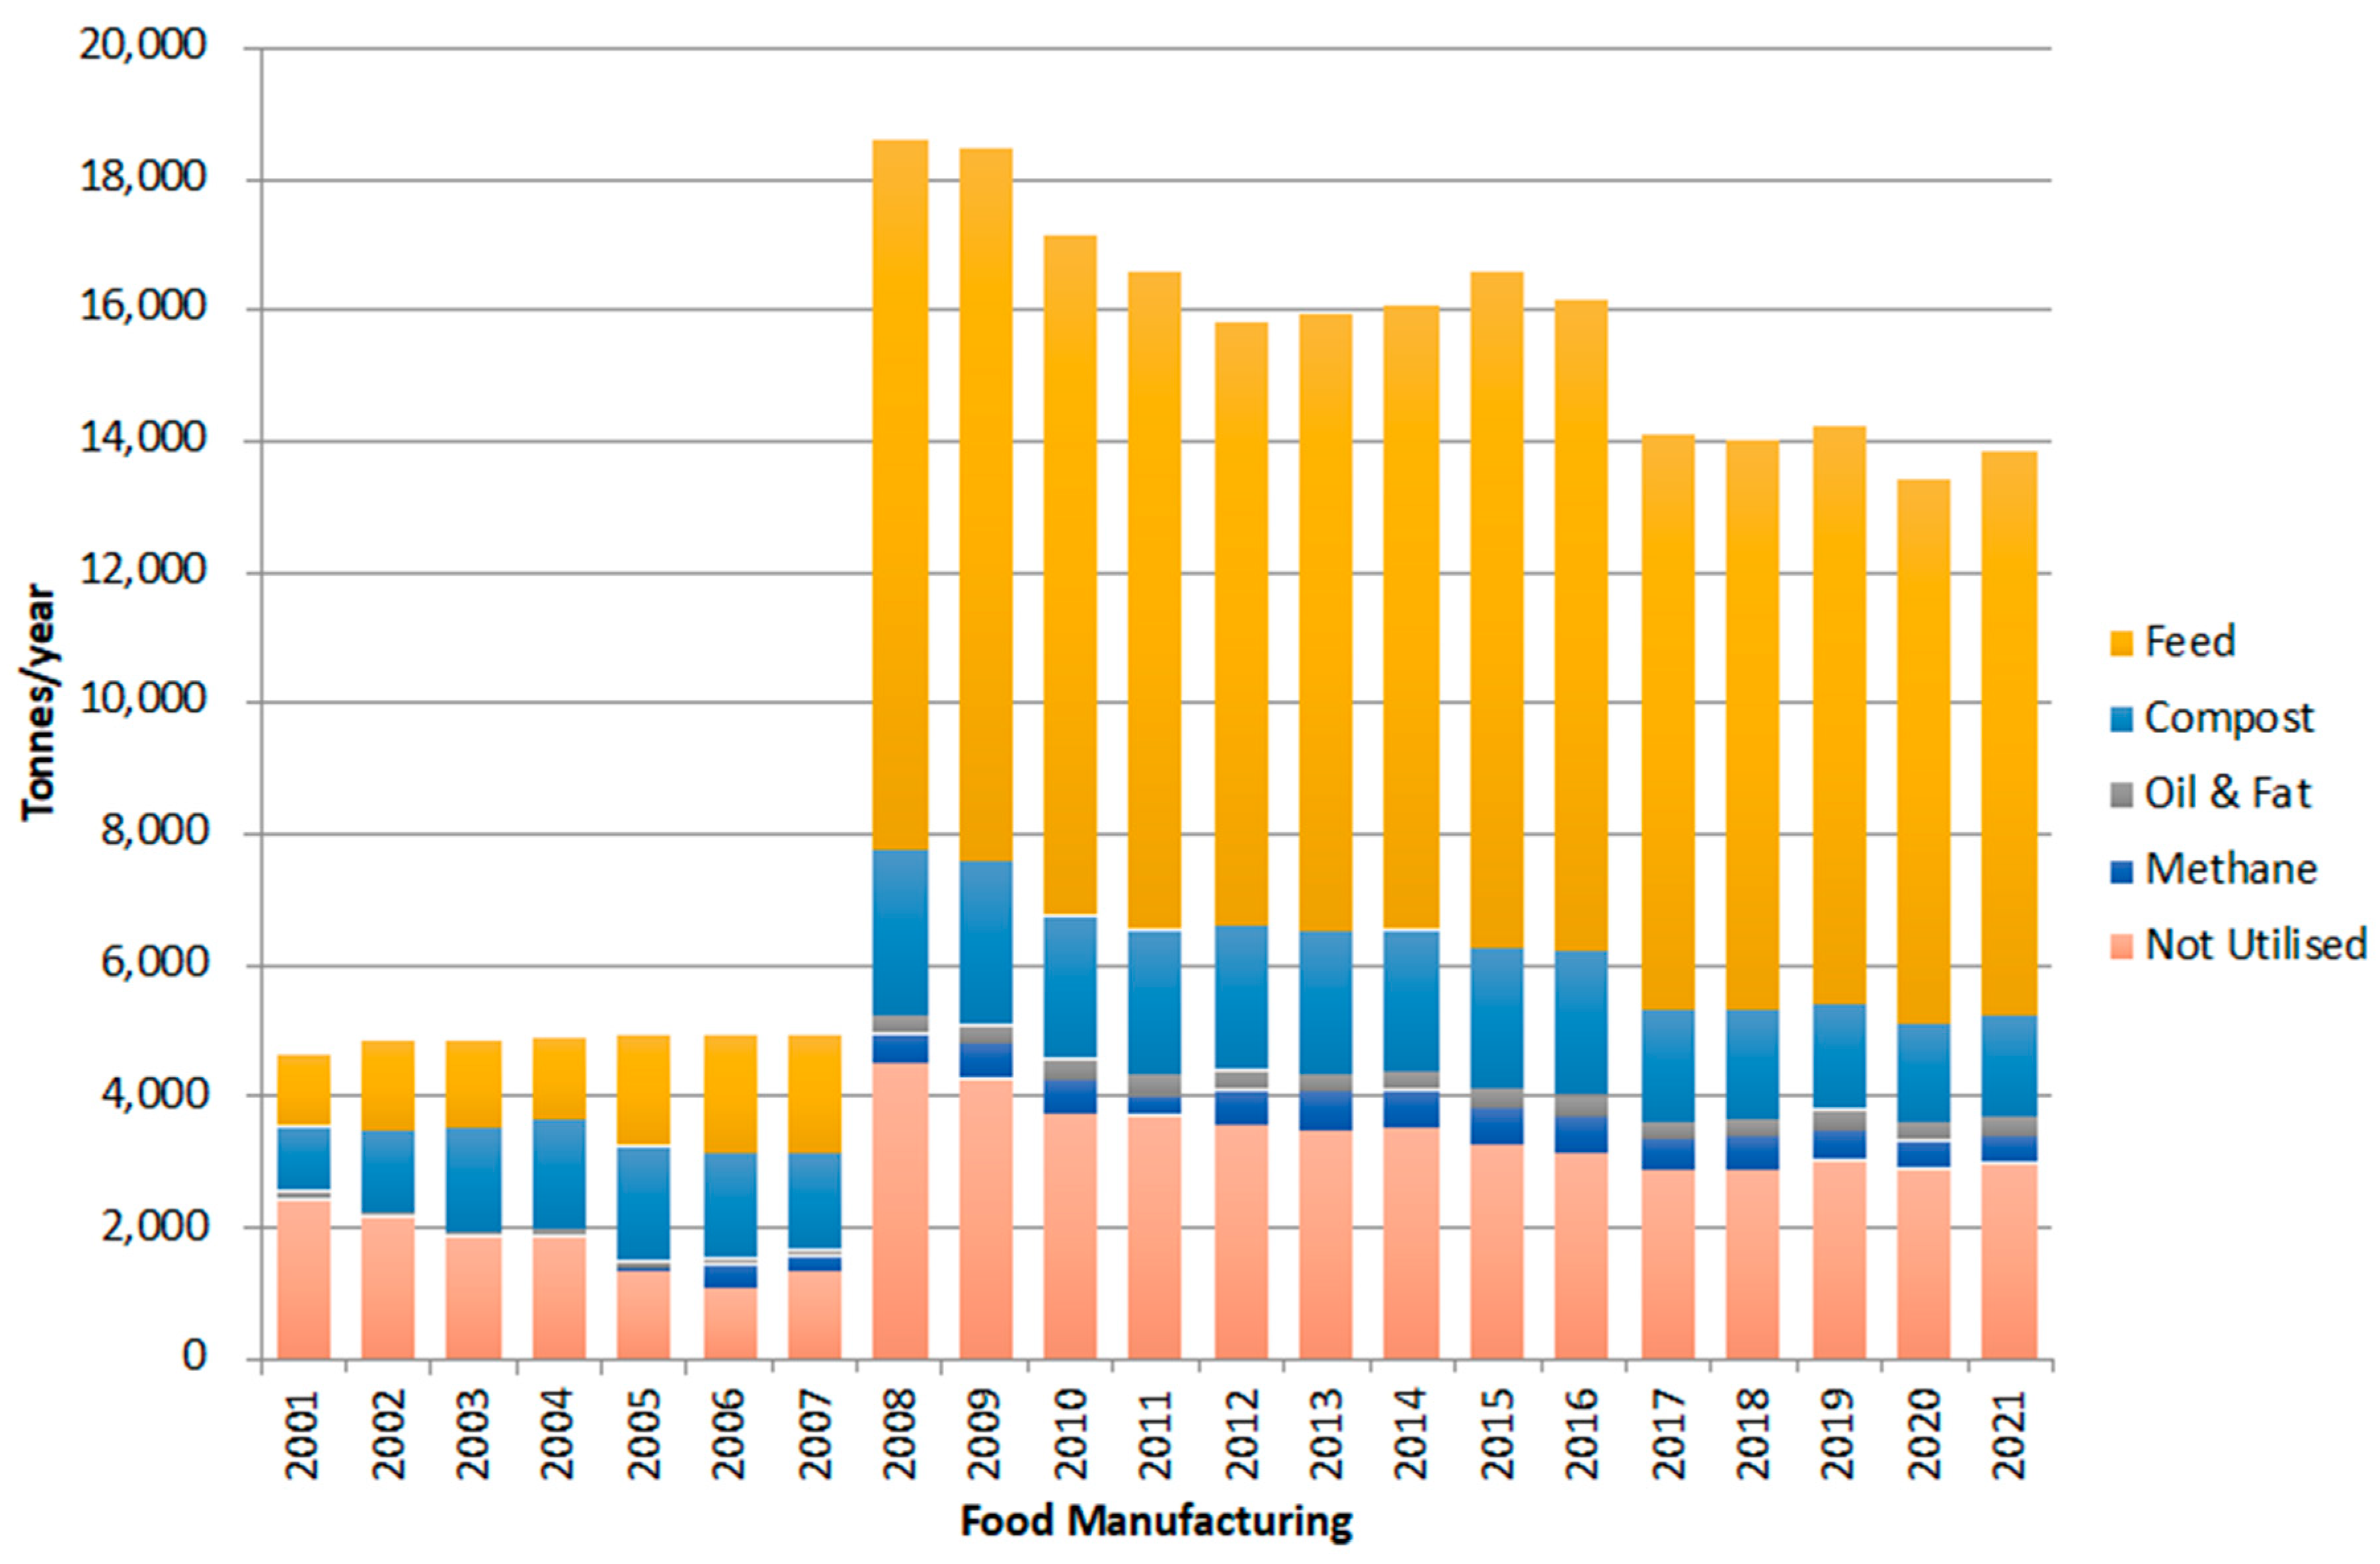
Figure 6 and following show the breakdown of recycling by business type. Food manufacturing industry has the dominant share in total food waste generation, and following the general trend, it has also been gradually decreasing since 2008. The implementation rate of reduction, recycling, and energy recovery etc. in the manufacturing industry has constantly achieved the target value of 95% since 2011 [
16]. In 2021, 62.3% of manufacturers' food waste generation was converted to feed. Of the total amount recycled, 78.8% was recycled as feed. It can be said that food waste from the food manufacturing industry is suitable for feed conversion.
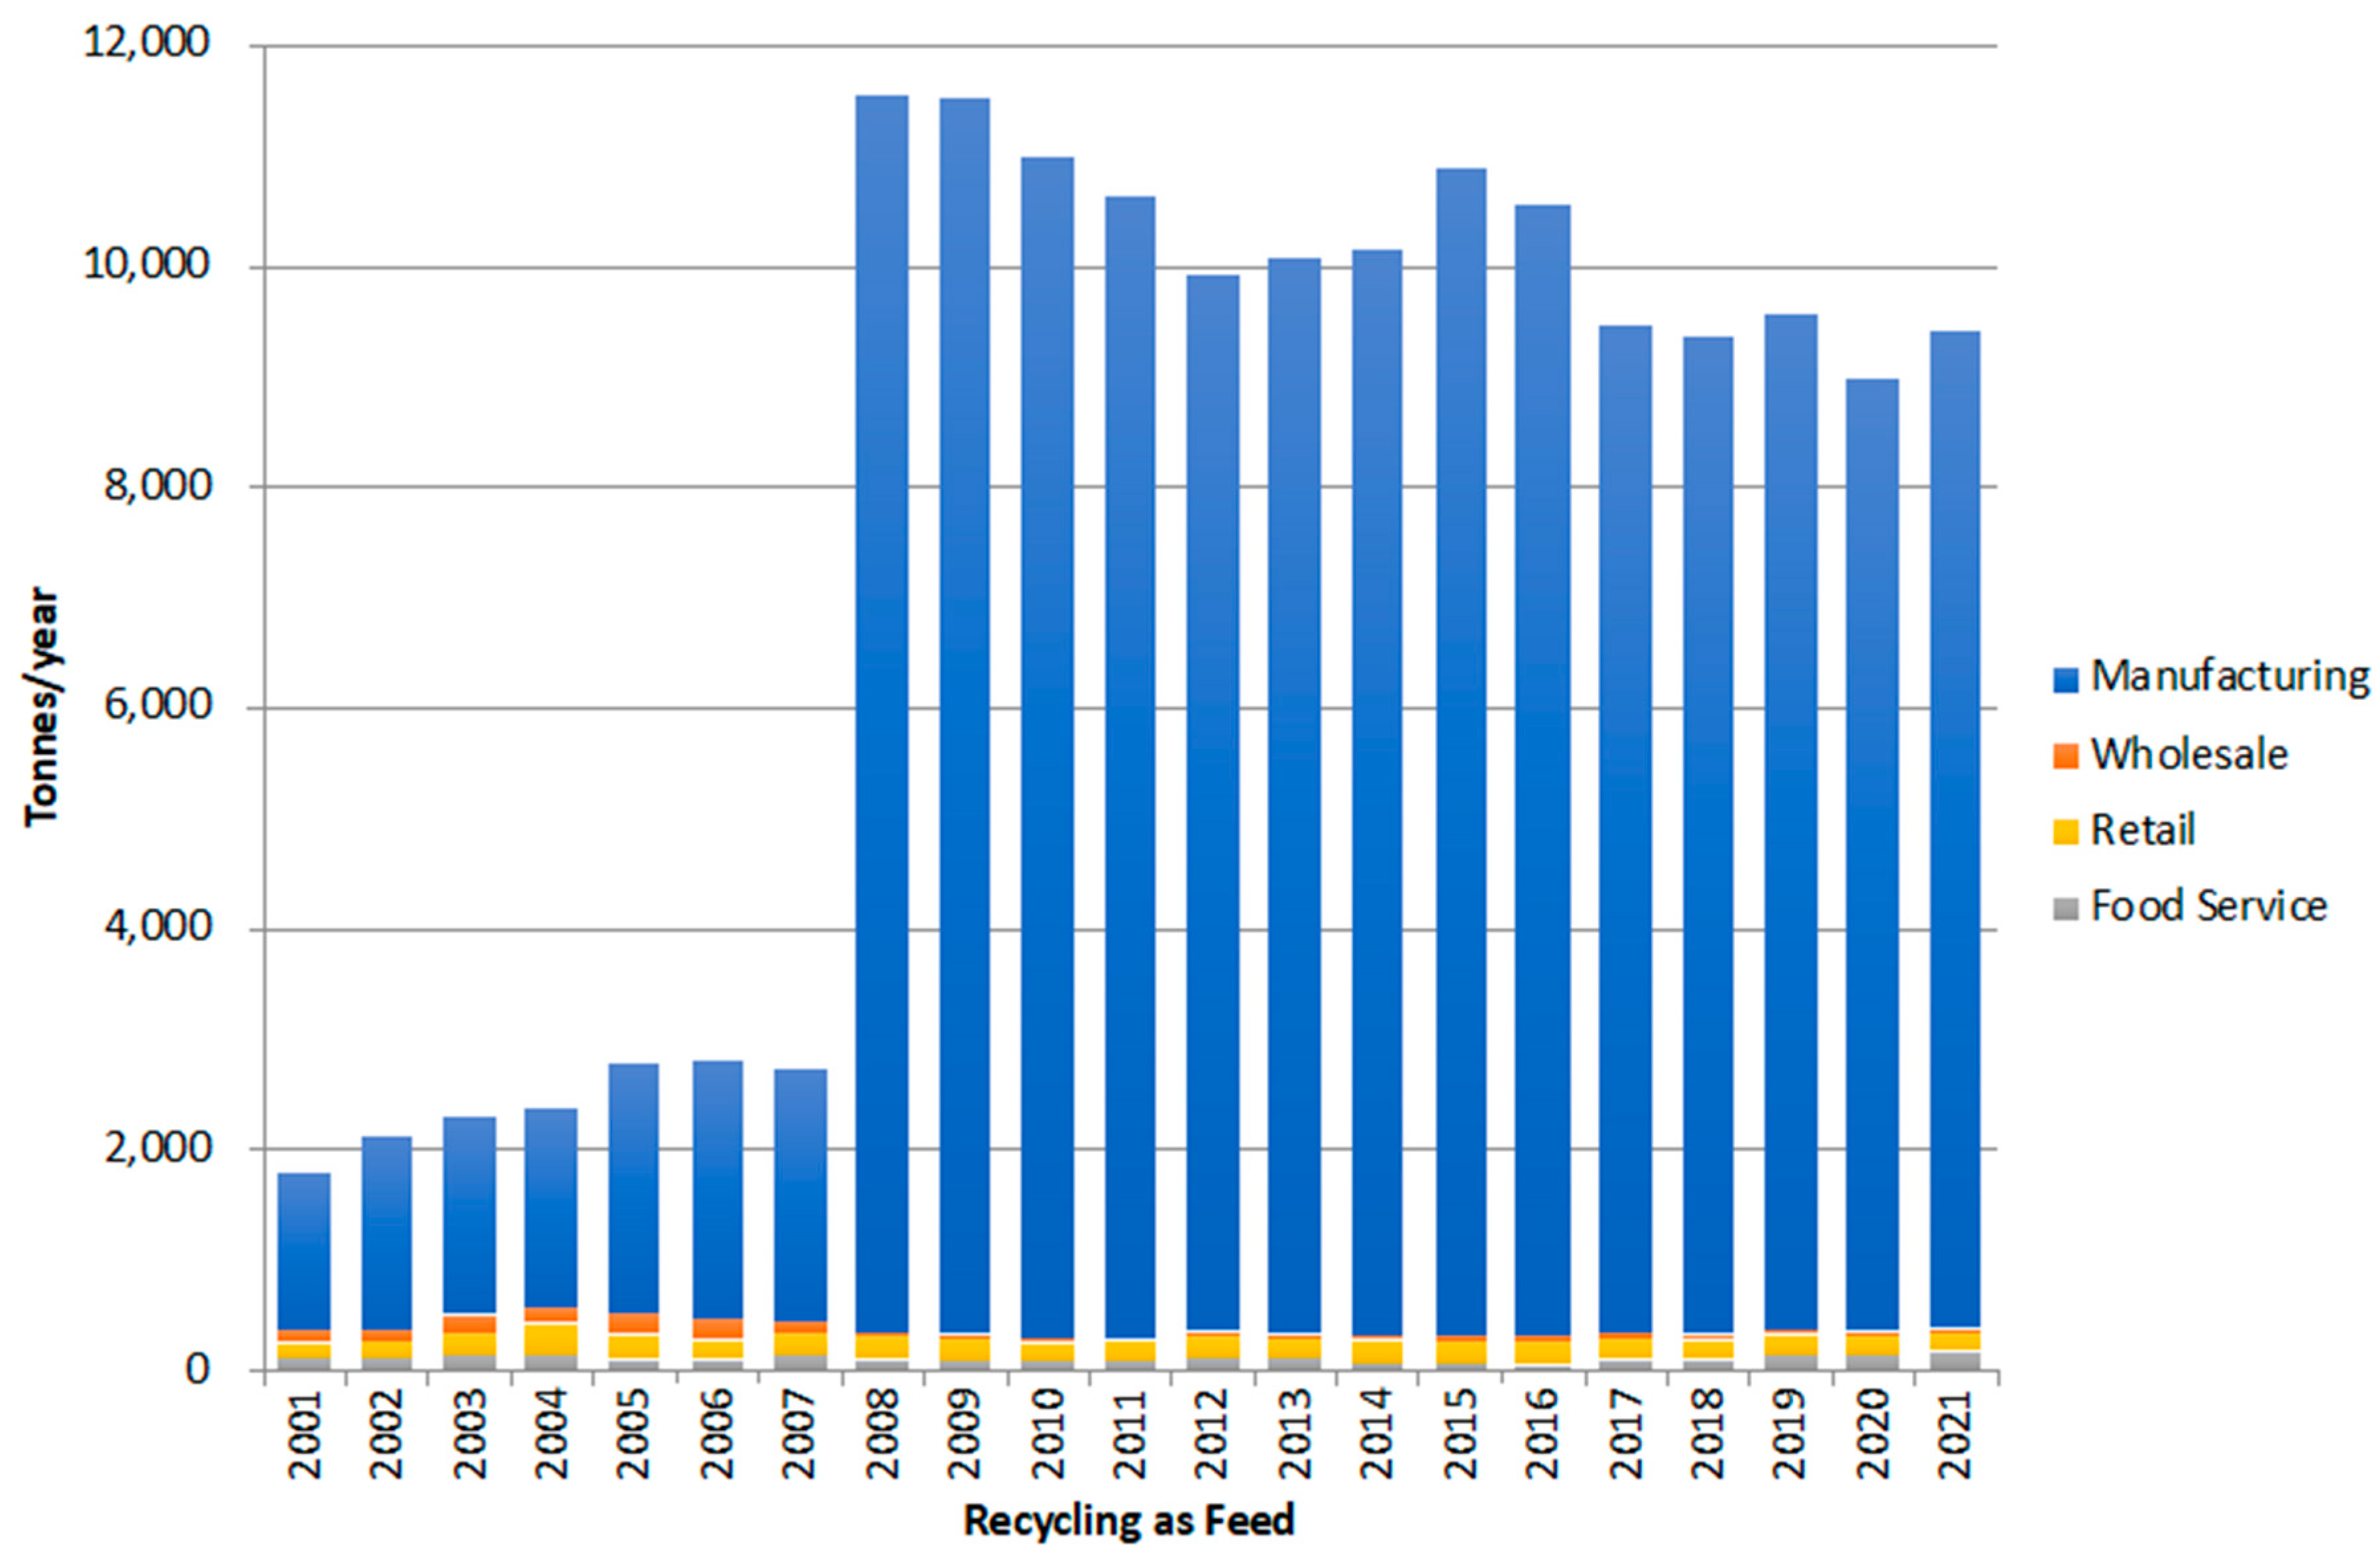
From
Figure 7, it can be observed that the manufacturing sector is the dominant source of food waste converted into feed. The amount of feed recycling has been decreasing along with the amount of food waste generated. The food retail sector also conducts feed recycling, although in terms of volume, it is much smaller than the manufacturing sector.
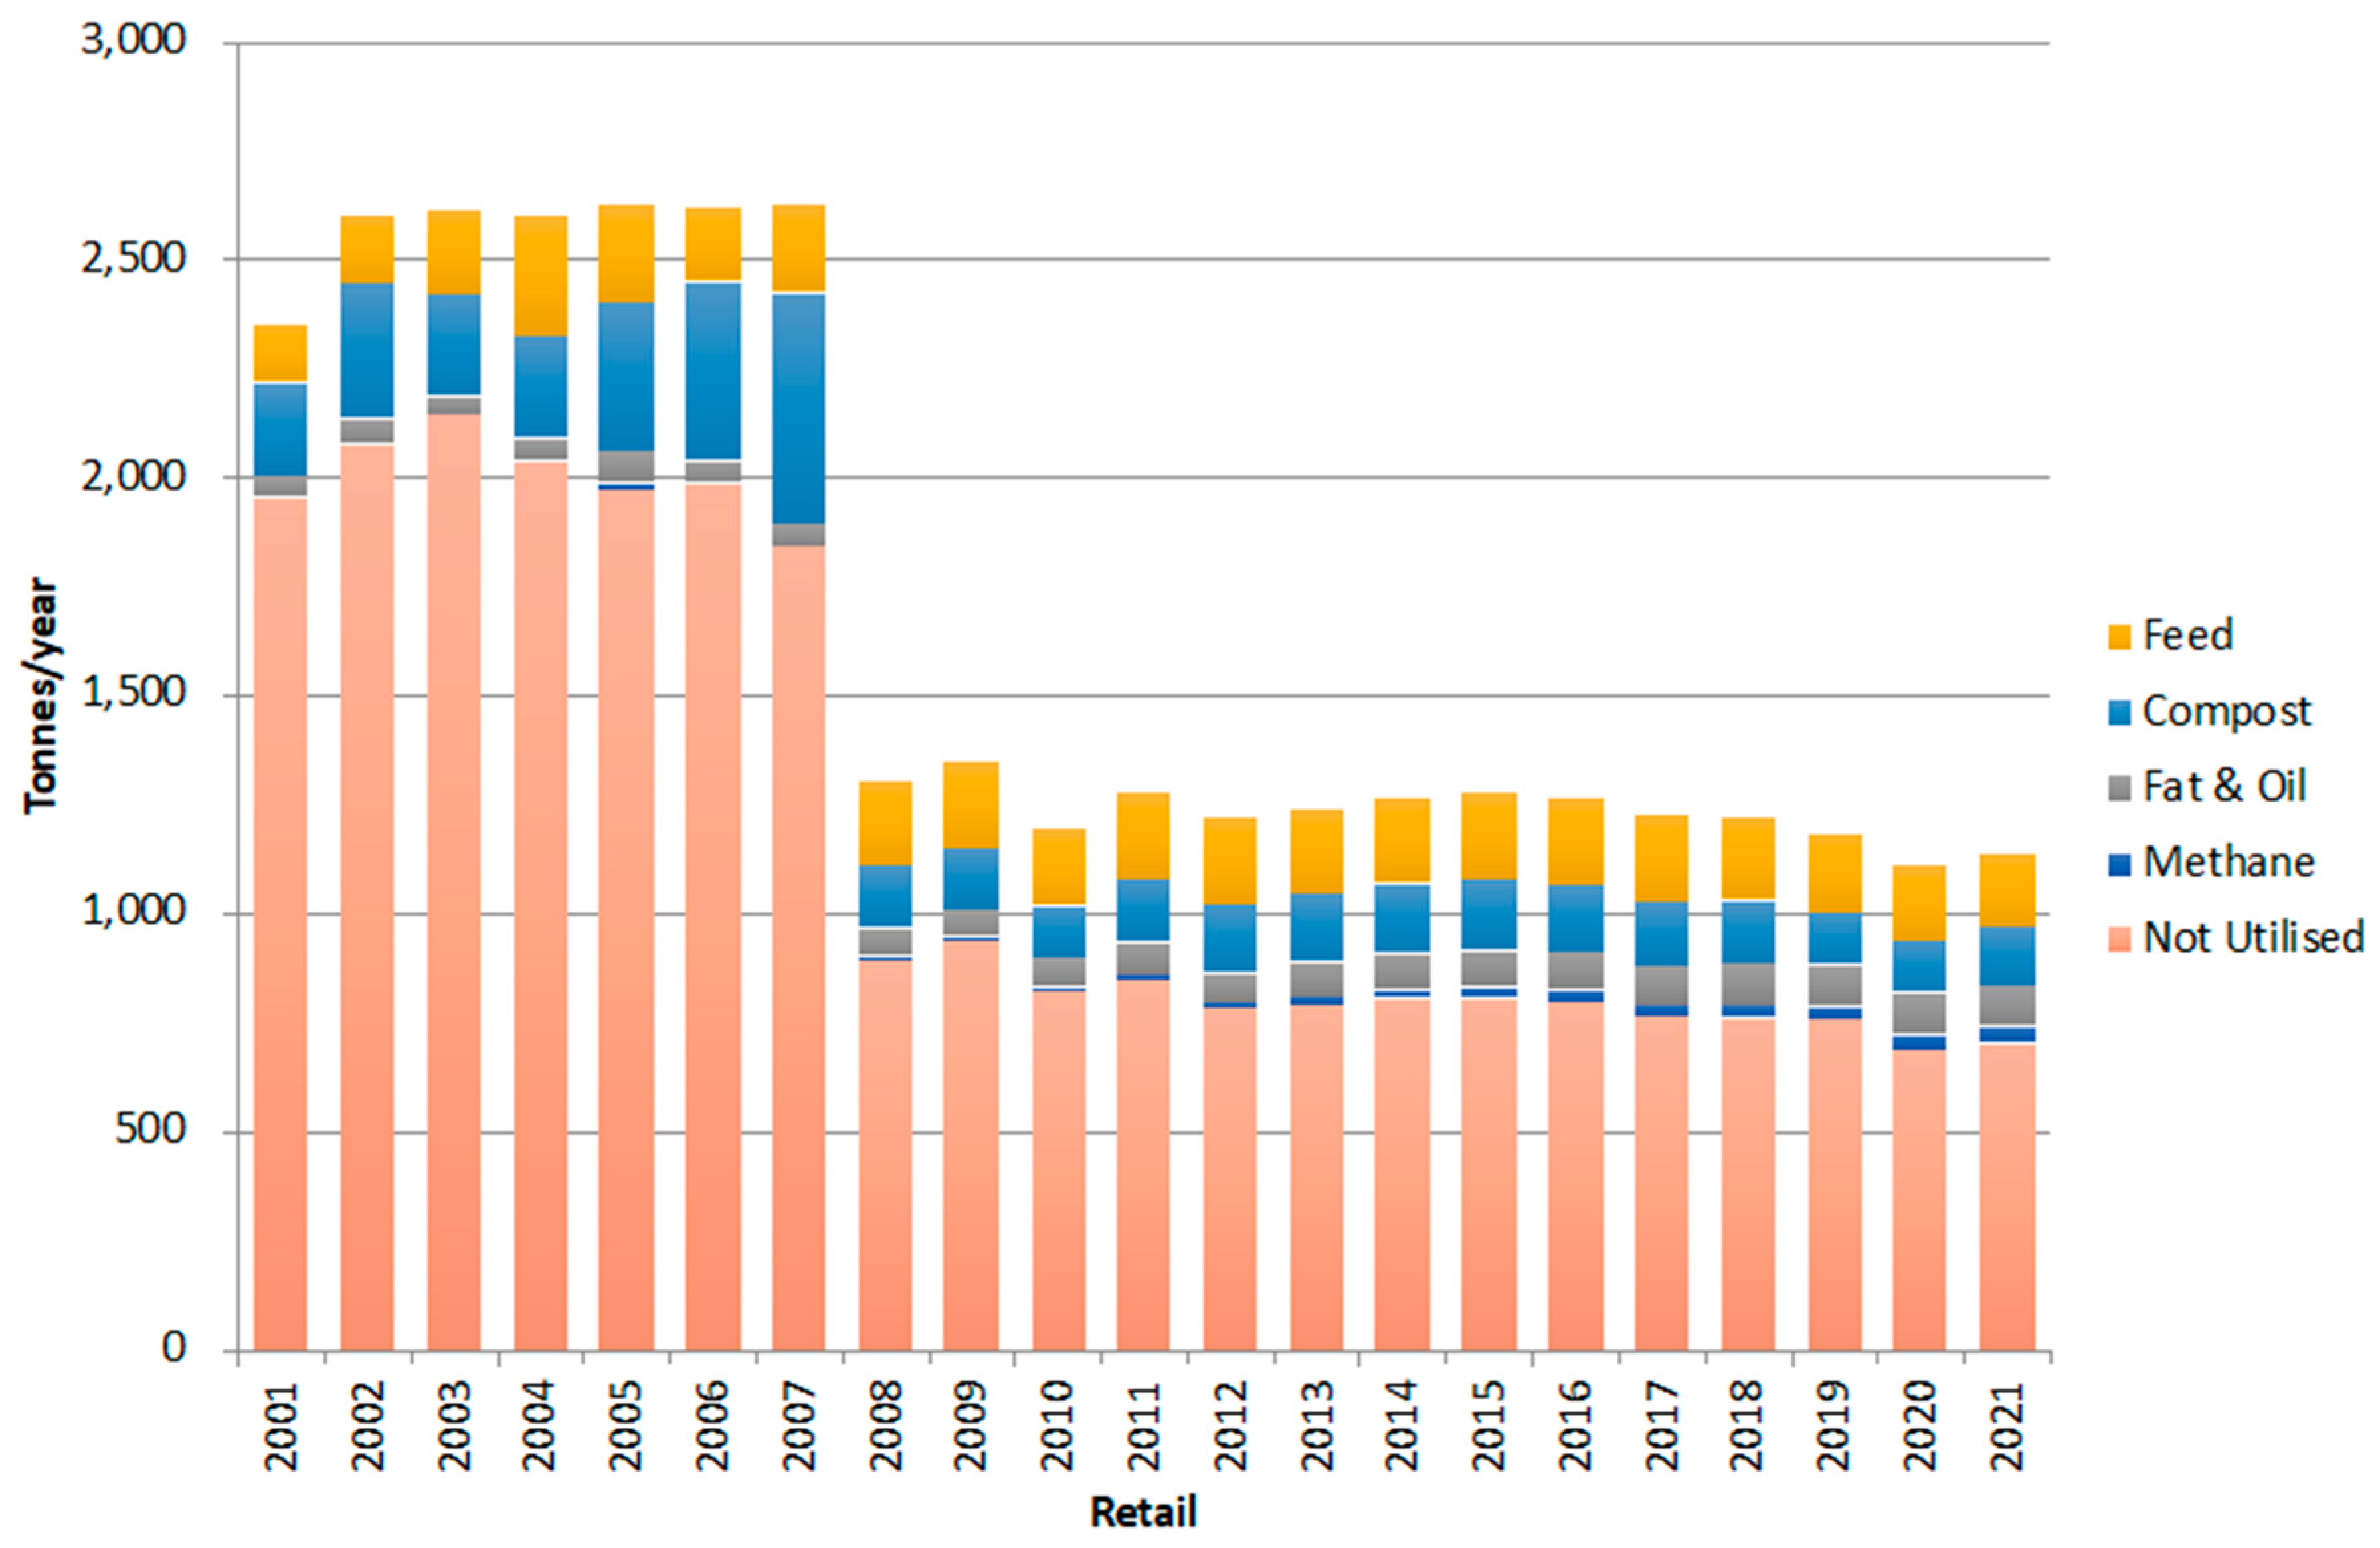
Figure 8 shows the performance of the food retail sector by recycling method. Looking at the period since 2008, the amount of food waste from retailer has remained almost flat, although there is a slight downward trend from about 1.3 million tons in 2008 to 1.1 million tons in 2021. In 2021, the recycling rate is 39.2%. The ministry estimates that the retail sector has directed 56% of food waste to reduction, recycling and energy recovery [
16]. Although the top priority is to reduce the amount of waste generated, further recycling efforts are needed as well to achieve the goal of 60% by 2024. Of the total volume of recycling, feed and compost account for 38.7% and 29.1%, respectively.
In addition, the 2020 amendment to the law set a target on reduction of avoidable food waste. Based on the 2000 estimate of food waste generation, they estimated the amount of avoidable food waste, which was to be reduced by half by 2030. As mentioned earlier, the figures for retail sector prior to 2007 are overestimated, and using those as a baseline figure is not appropriate. Because of this, on figures nominally the retail sector has by now already halved the amount of avoidable food waste. However, this cannot be regarded as the result of the efforts by the retail industry.
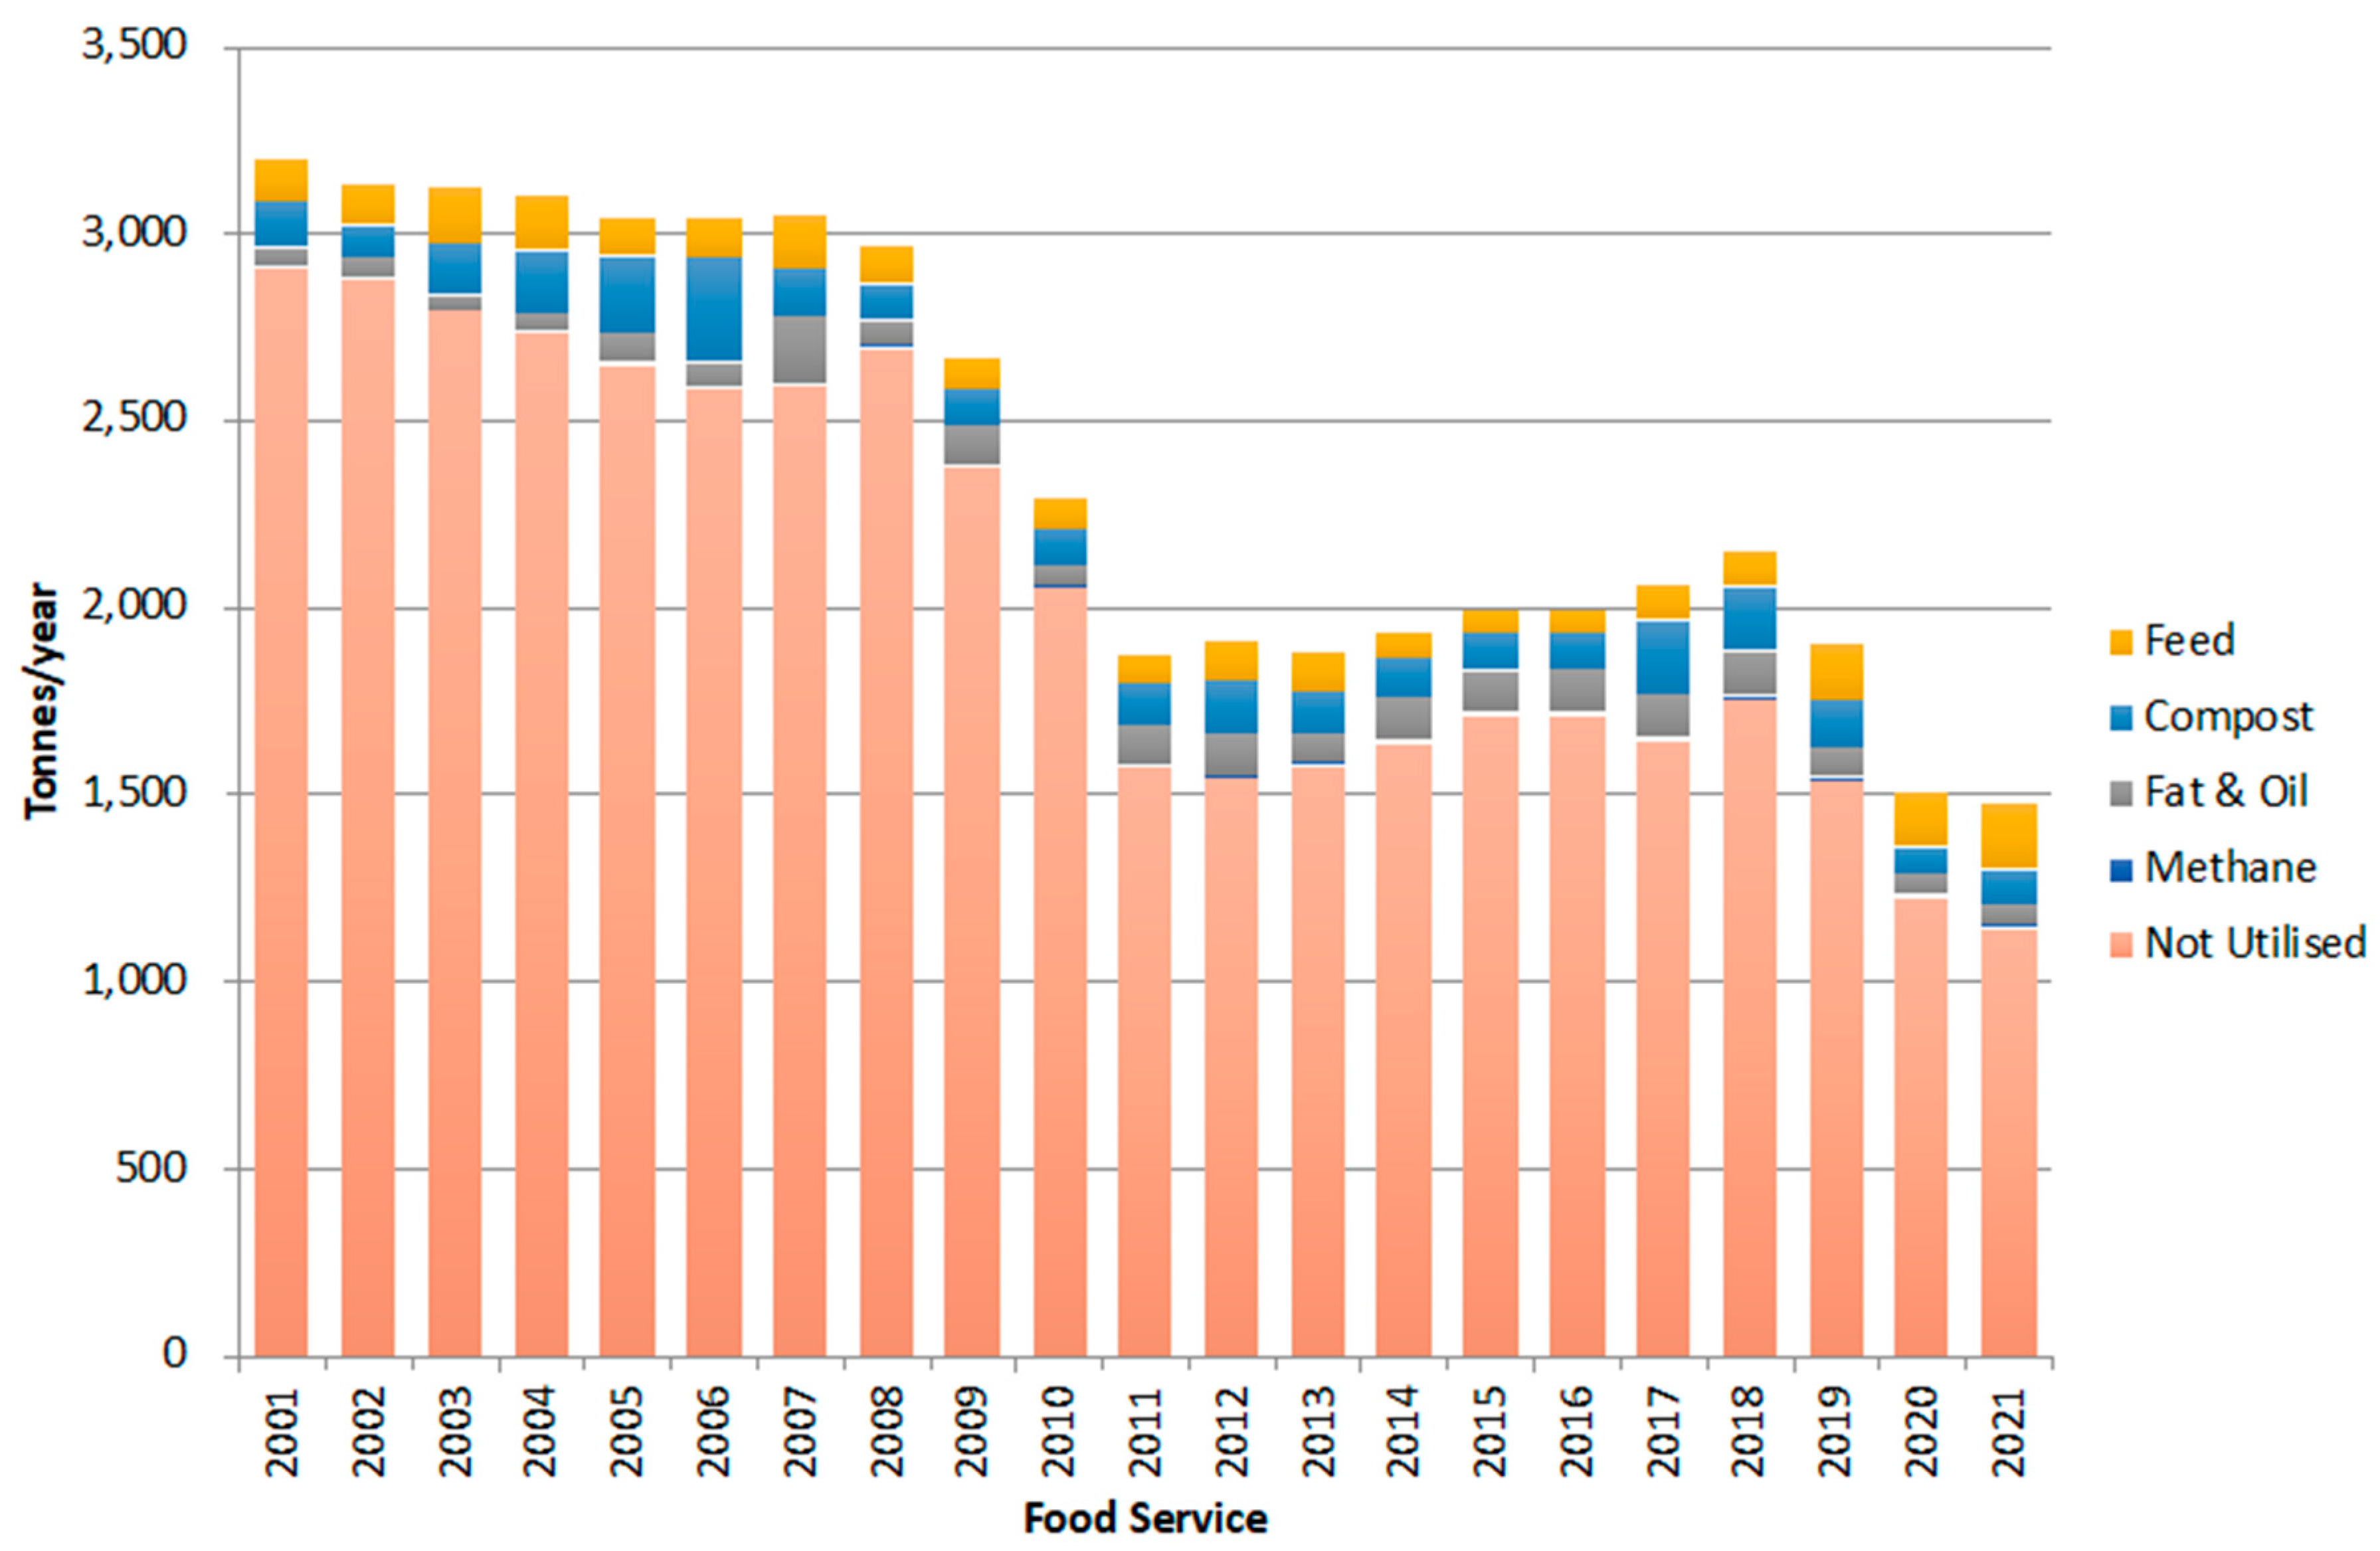
Figure 9 shows the situation in the food service (catering and restaurant) sector. In the catering and restaurant sector, the progress in recycling has been relatively slow: it has been decreasing since 2008 until the year of the big earthquake in 2011, turned into increase since then until the sector was hit by COVID 19. Note that the Tokyo Olympics were held in 2021, and the excessively ordered lunch boxes and other avoidable food waste generated in relation to the Olympics were recycled as feed. Although the overall recycling rate is low, 52.6% of the food waste recycled had been converted to feed in 2021.
From the above, it can be summarised that the food manufacturing industry is by far the largest recycler of feed recycling in Japan, but as feed recycling is designated the highest priority among the recycling methods, it is also the most widely implemented recycling method in both retail and food service sectors, although the amount is relatively small. Conversion of food waste to feed by the retail and food service sectors qualifies as a means to reduce avoidable food waste under SDG12.3. Japan does not recognise feed recycling as a means of reduction, but since the 2024 target of the Food Waste Recycling Law is to reduce, recycle, or energy recovery 50%, further recycling efforts, especially feed recycling, is desired.
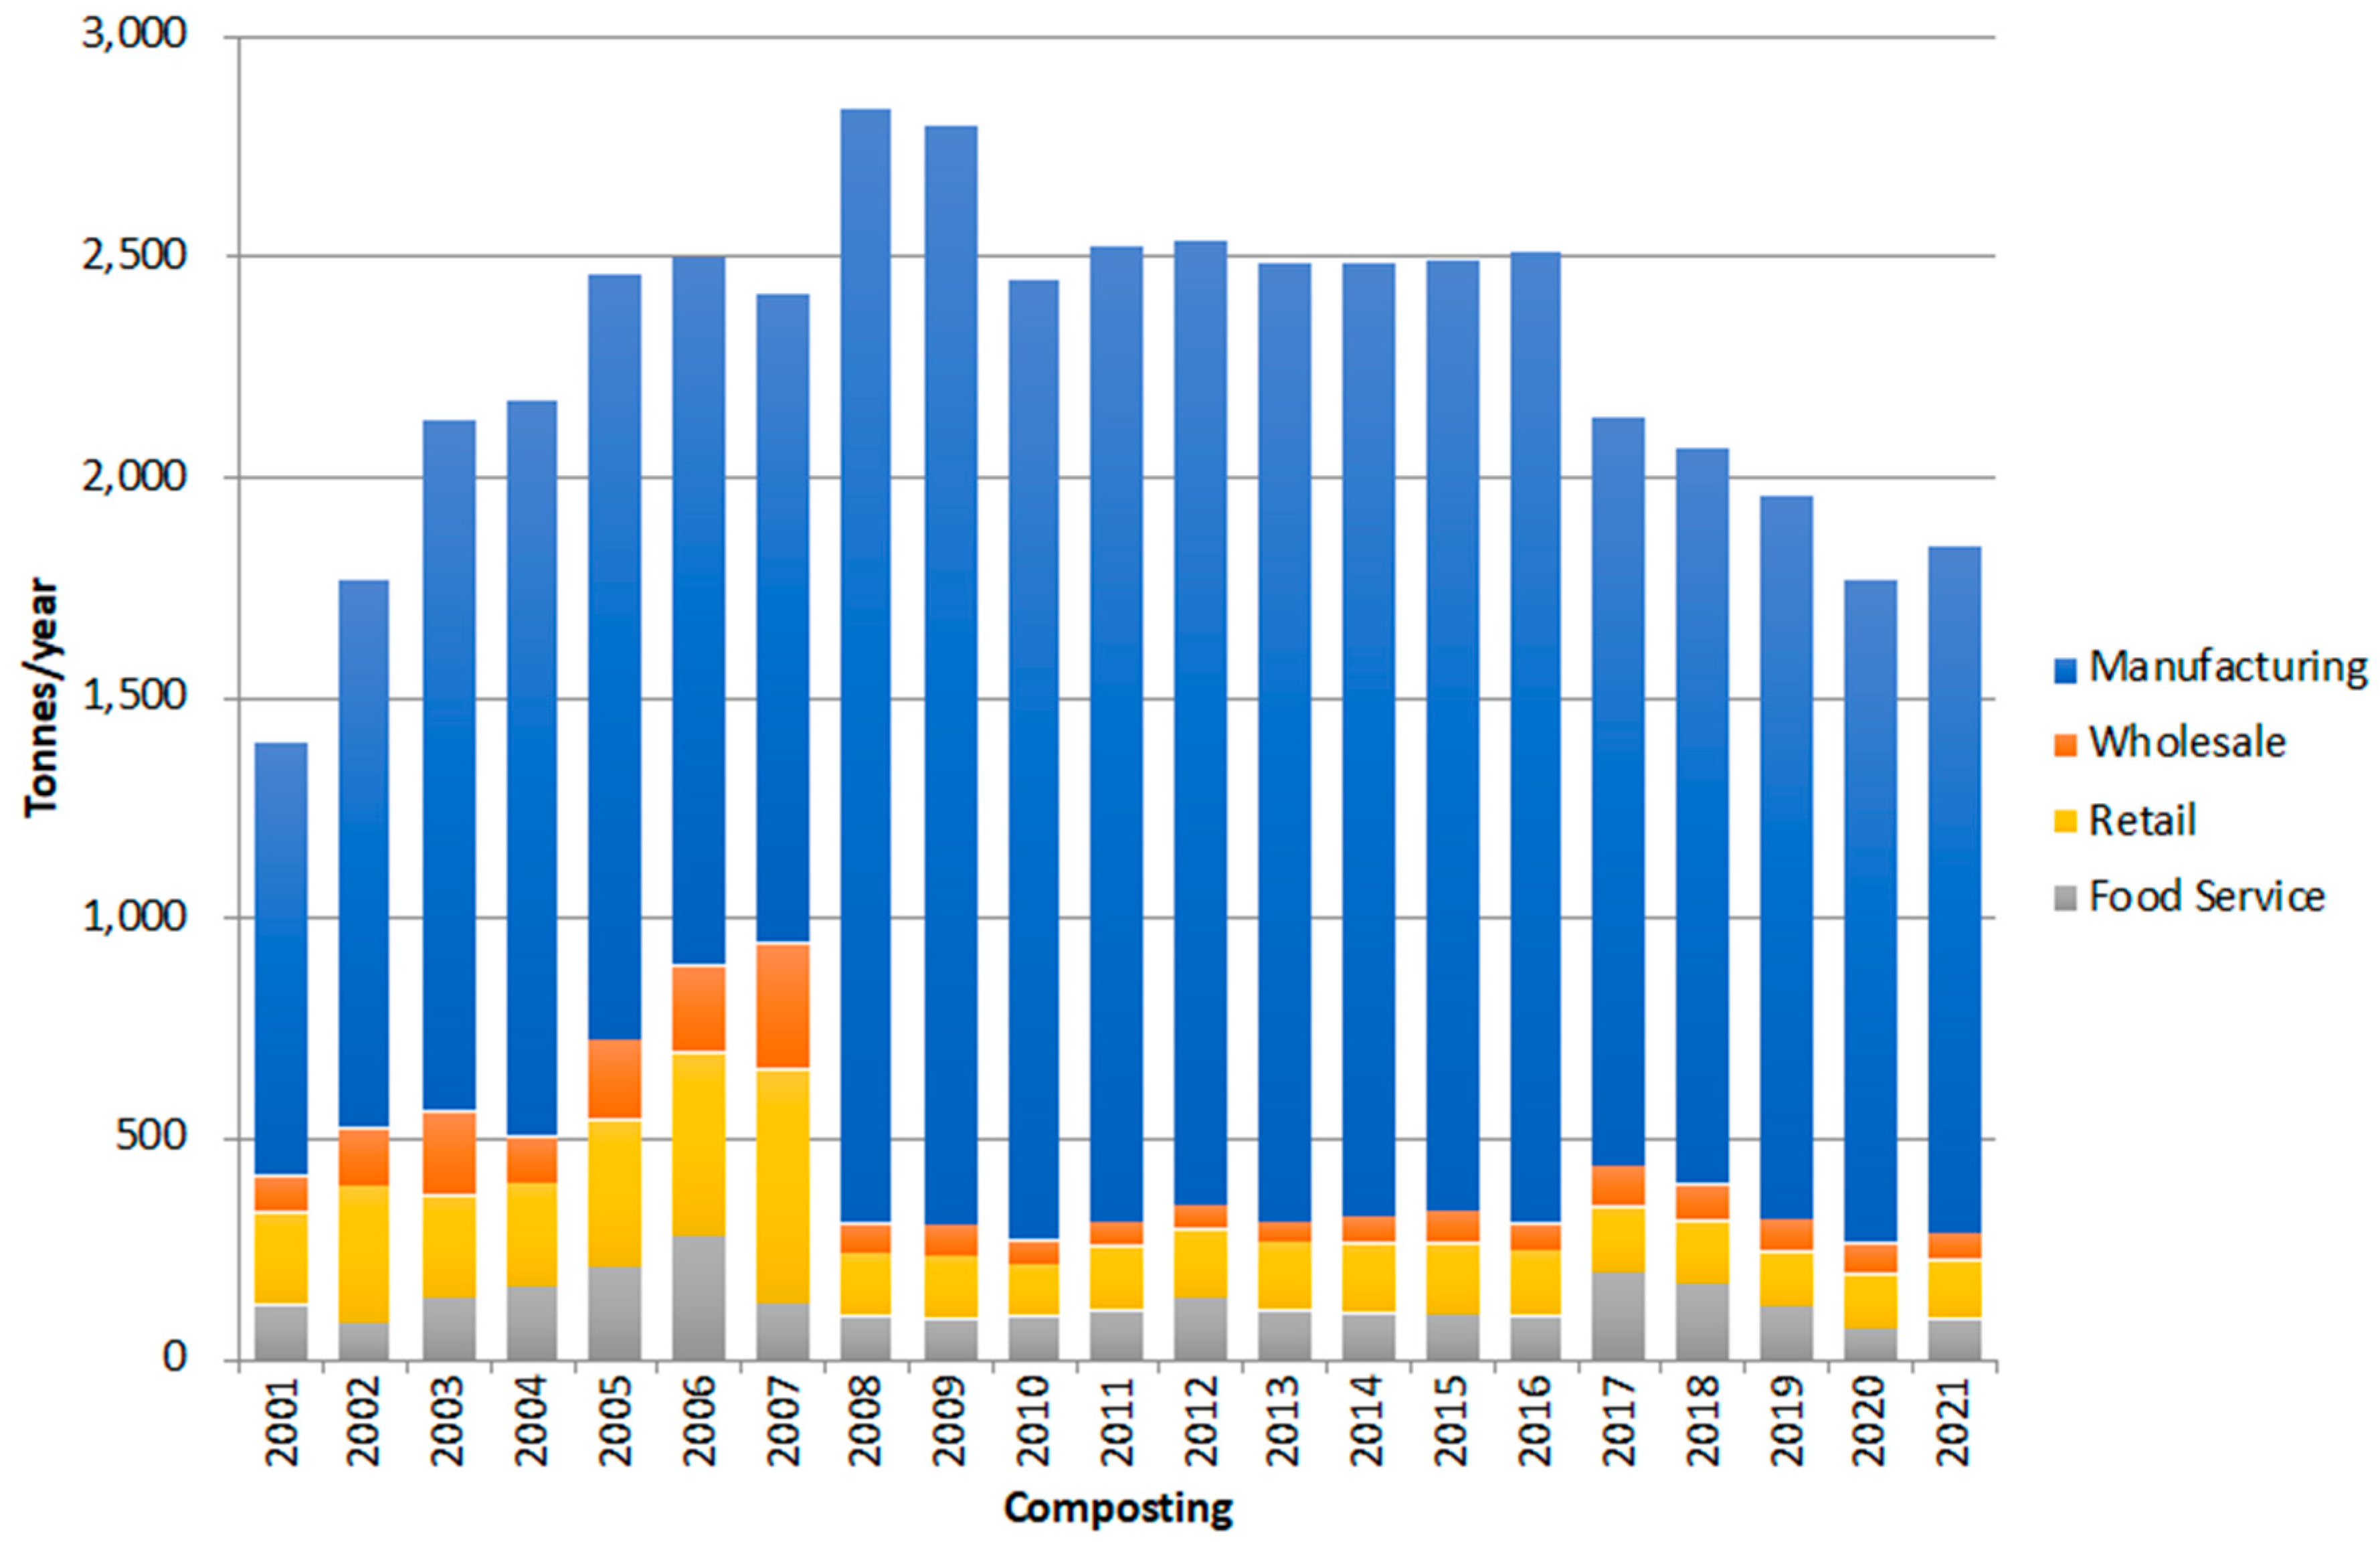
As for recycling other than feed recycling, the status of composting is shown in
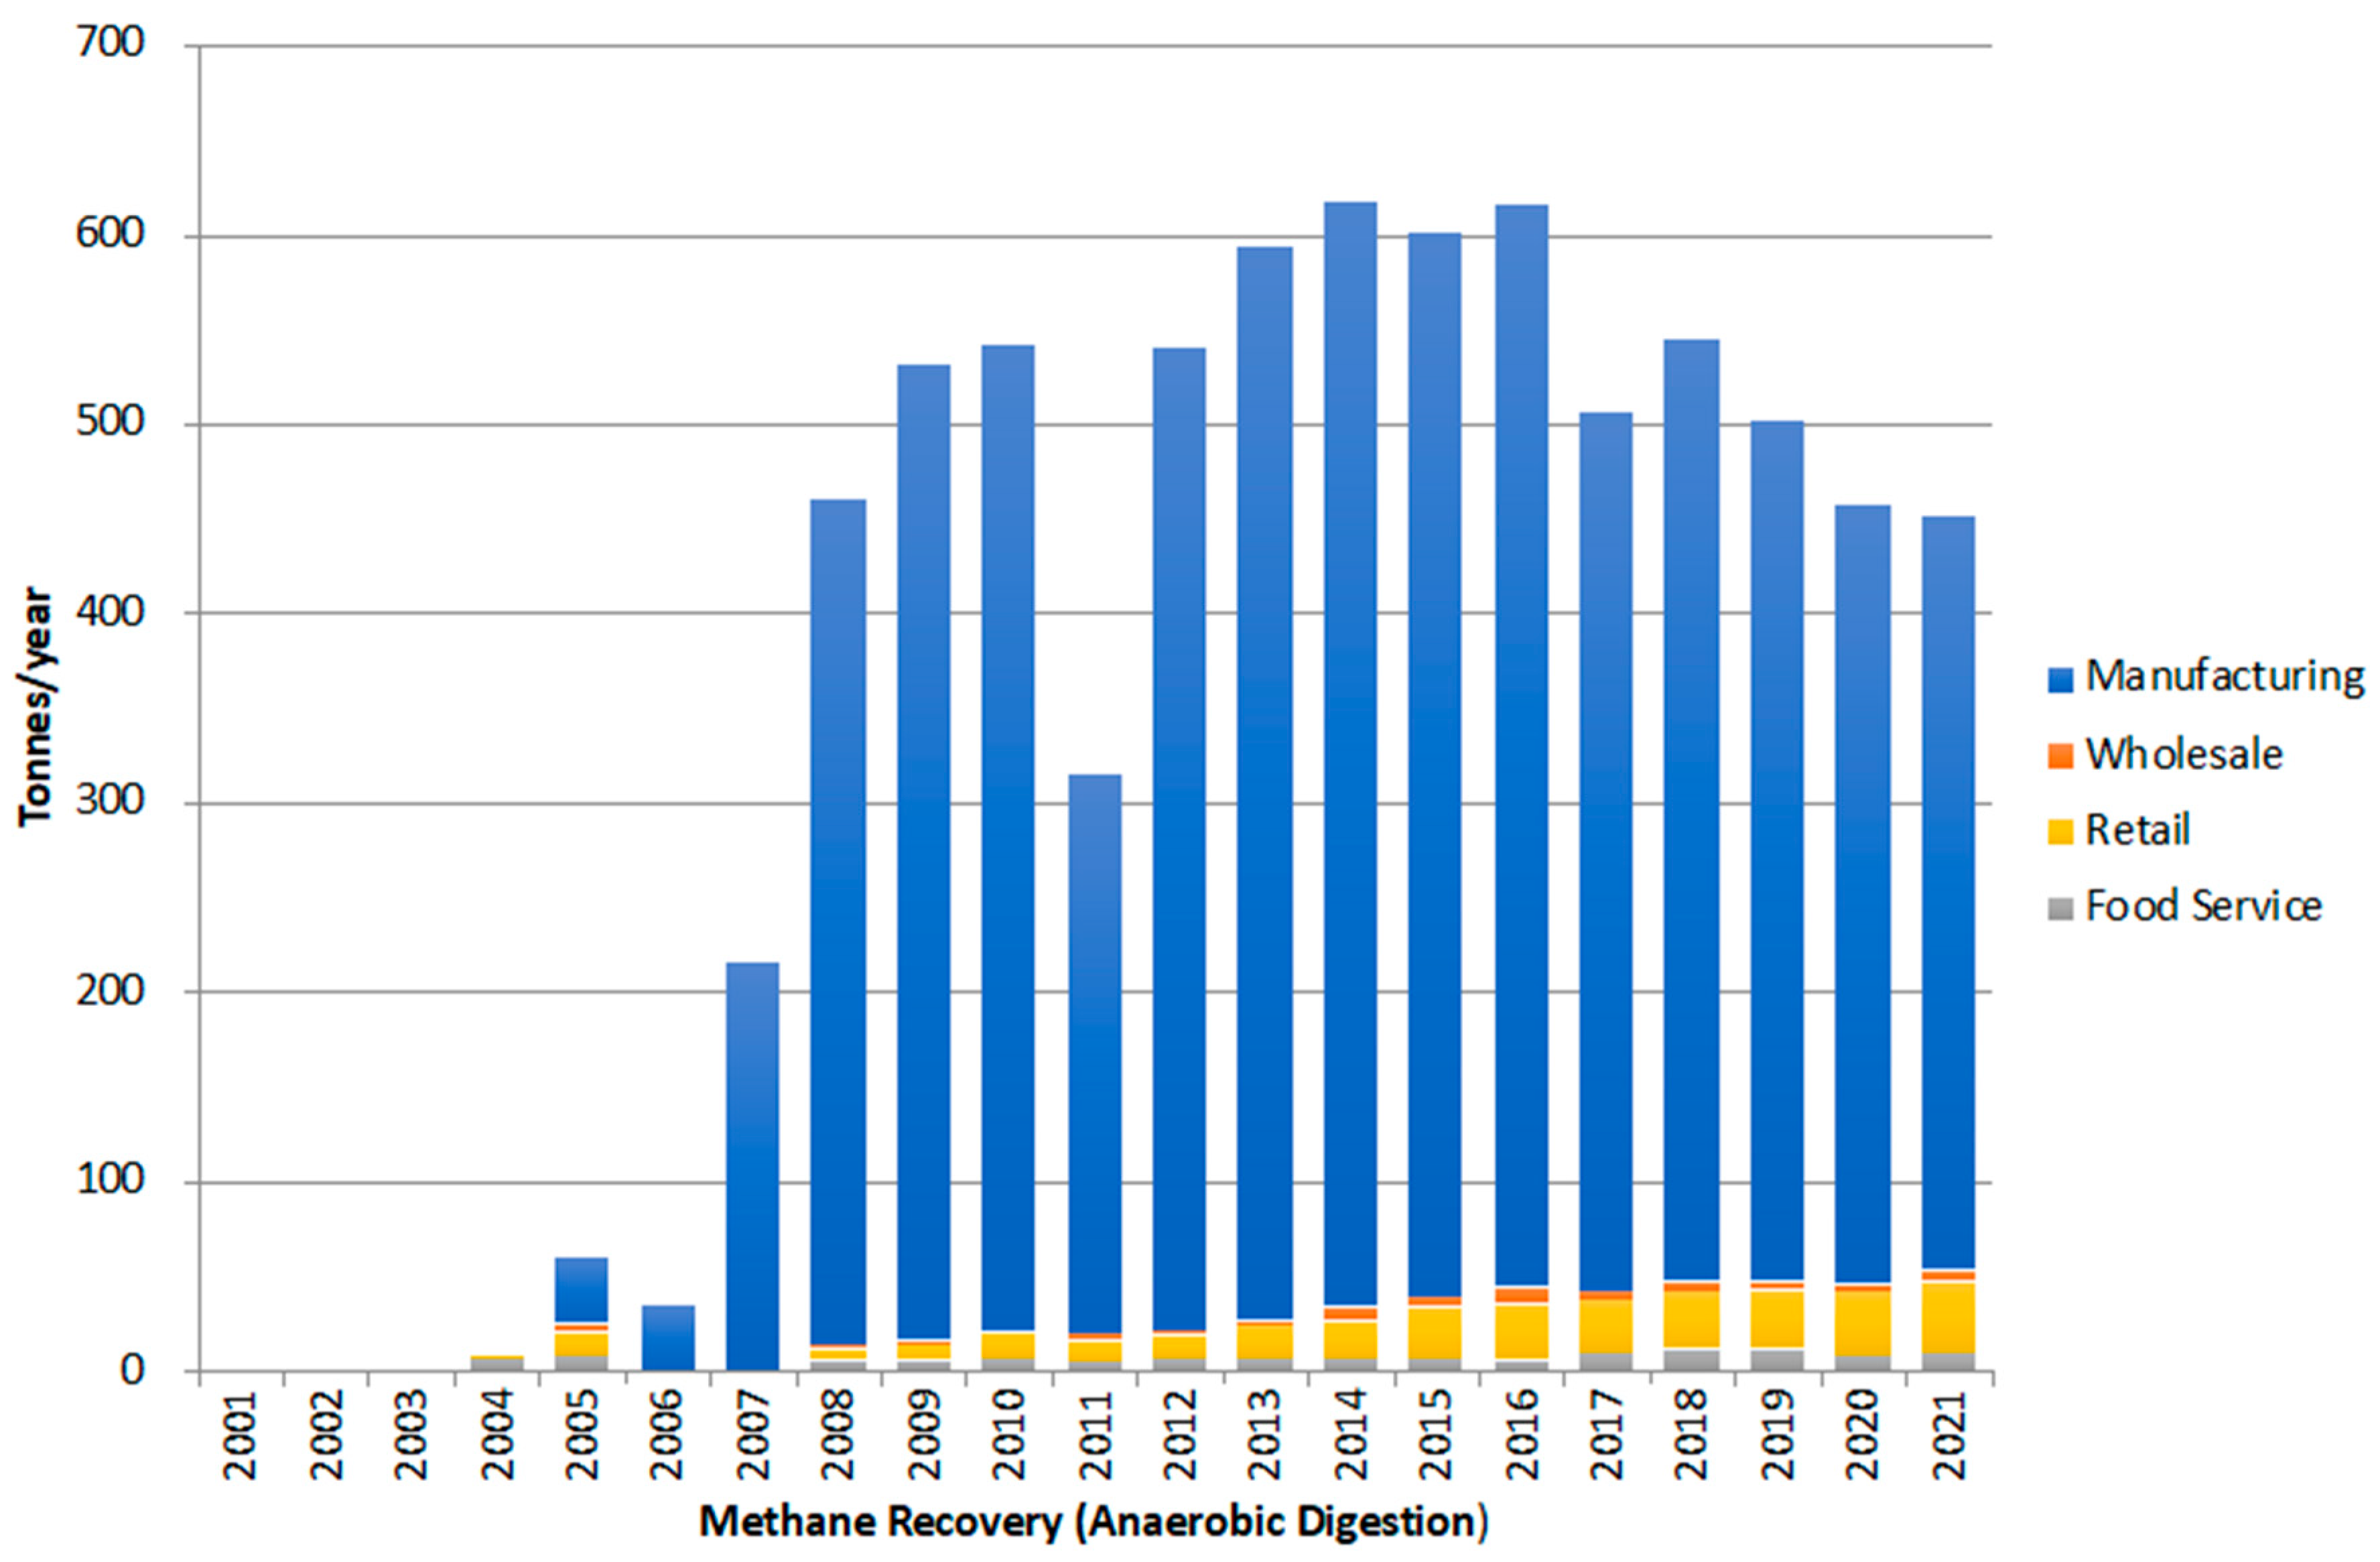
Figure 10, anaerobic digestion (AD) is shown in
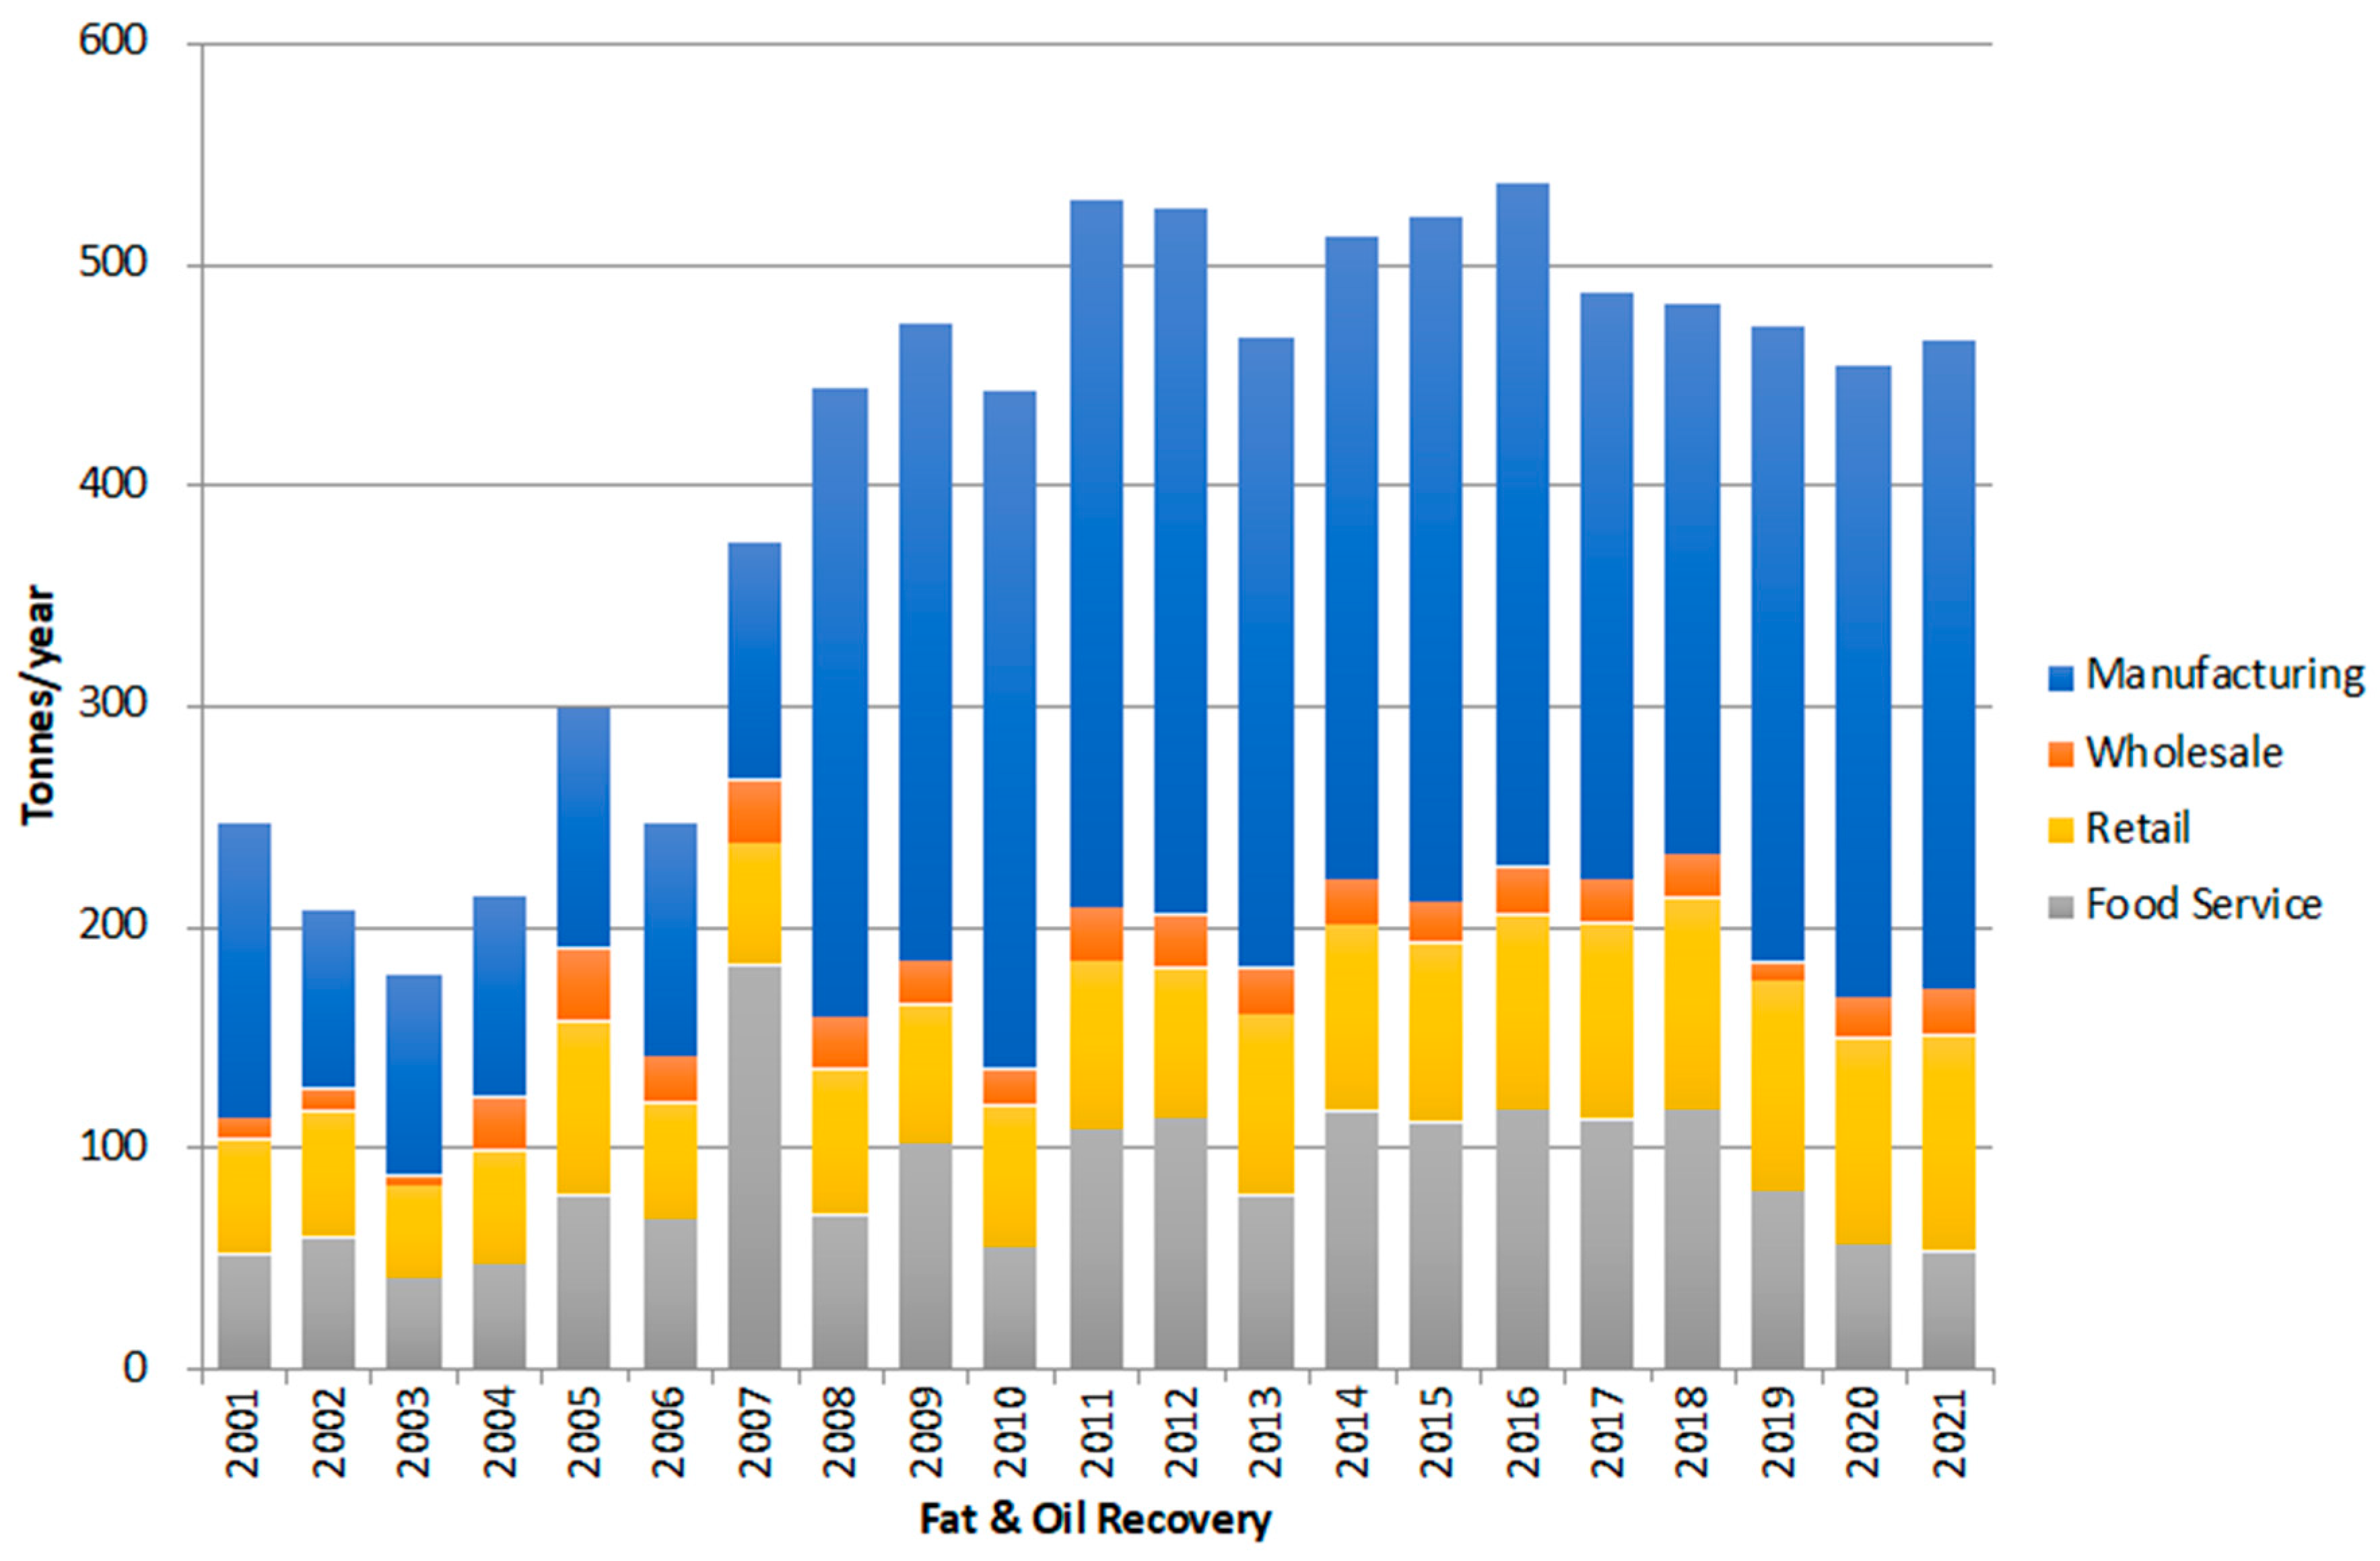
Figure 11, and oil and fat recovery is shown in
Figure 12.
Composting has been steadily implemented since 2008, as it is a relatively simple recycling method from a technical point of view. However it has shown a decreasing trend since 2017.
Biogas recovery by methane fermentation (anaerobic digestion) is often combined with power generation in Japan. This is because biogas from food waste is a renewable energy source, and the resulting electricity can be sold at a higher price under the feed-in tariff (FIT) system. Methane fermentation in the retail sector is on the rise.
Compared to other recycling methods, there is a higher share of oil and fat recovery by retailer and food service sectors. For example, butchers can sell residuals from meat production to reprocessors. Also, retailers and food service that provide deep fried dishes such as tempura can sell their waste cooking oil, and these oils and fats are recycled into raw materials for a variety of products, from cosmetics to soap to fuel [
18]. However, because they are traded as valuable resources (by-products), they may not be accounted for in food waste generation.
