Submitted:
02 December 2023
Posted:
05 December 2023
Read the latest preprint version here
Abstract
Keywords:
1. Introduction
- (i)
- (ii)
- the CoFe2O4 inverse spinel, the most promising OER catalyst [23], for which we consider an extensive set of surface configurations with various coverage of adsorbate intermediates relevant during the electrochemical OER (H, OH, H2O, O, O2).
2. Materials and Methods
3. Results & Discussion
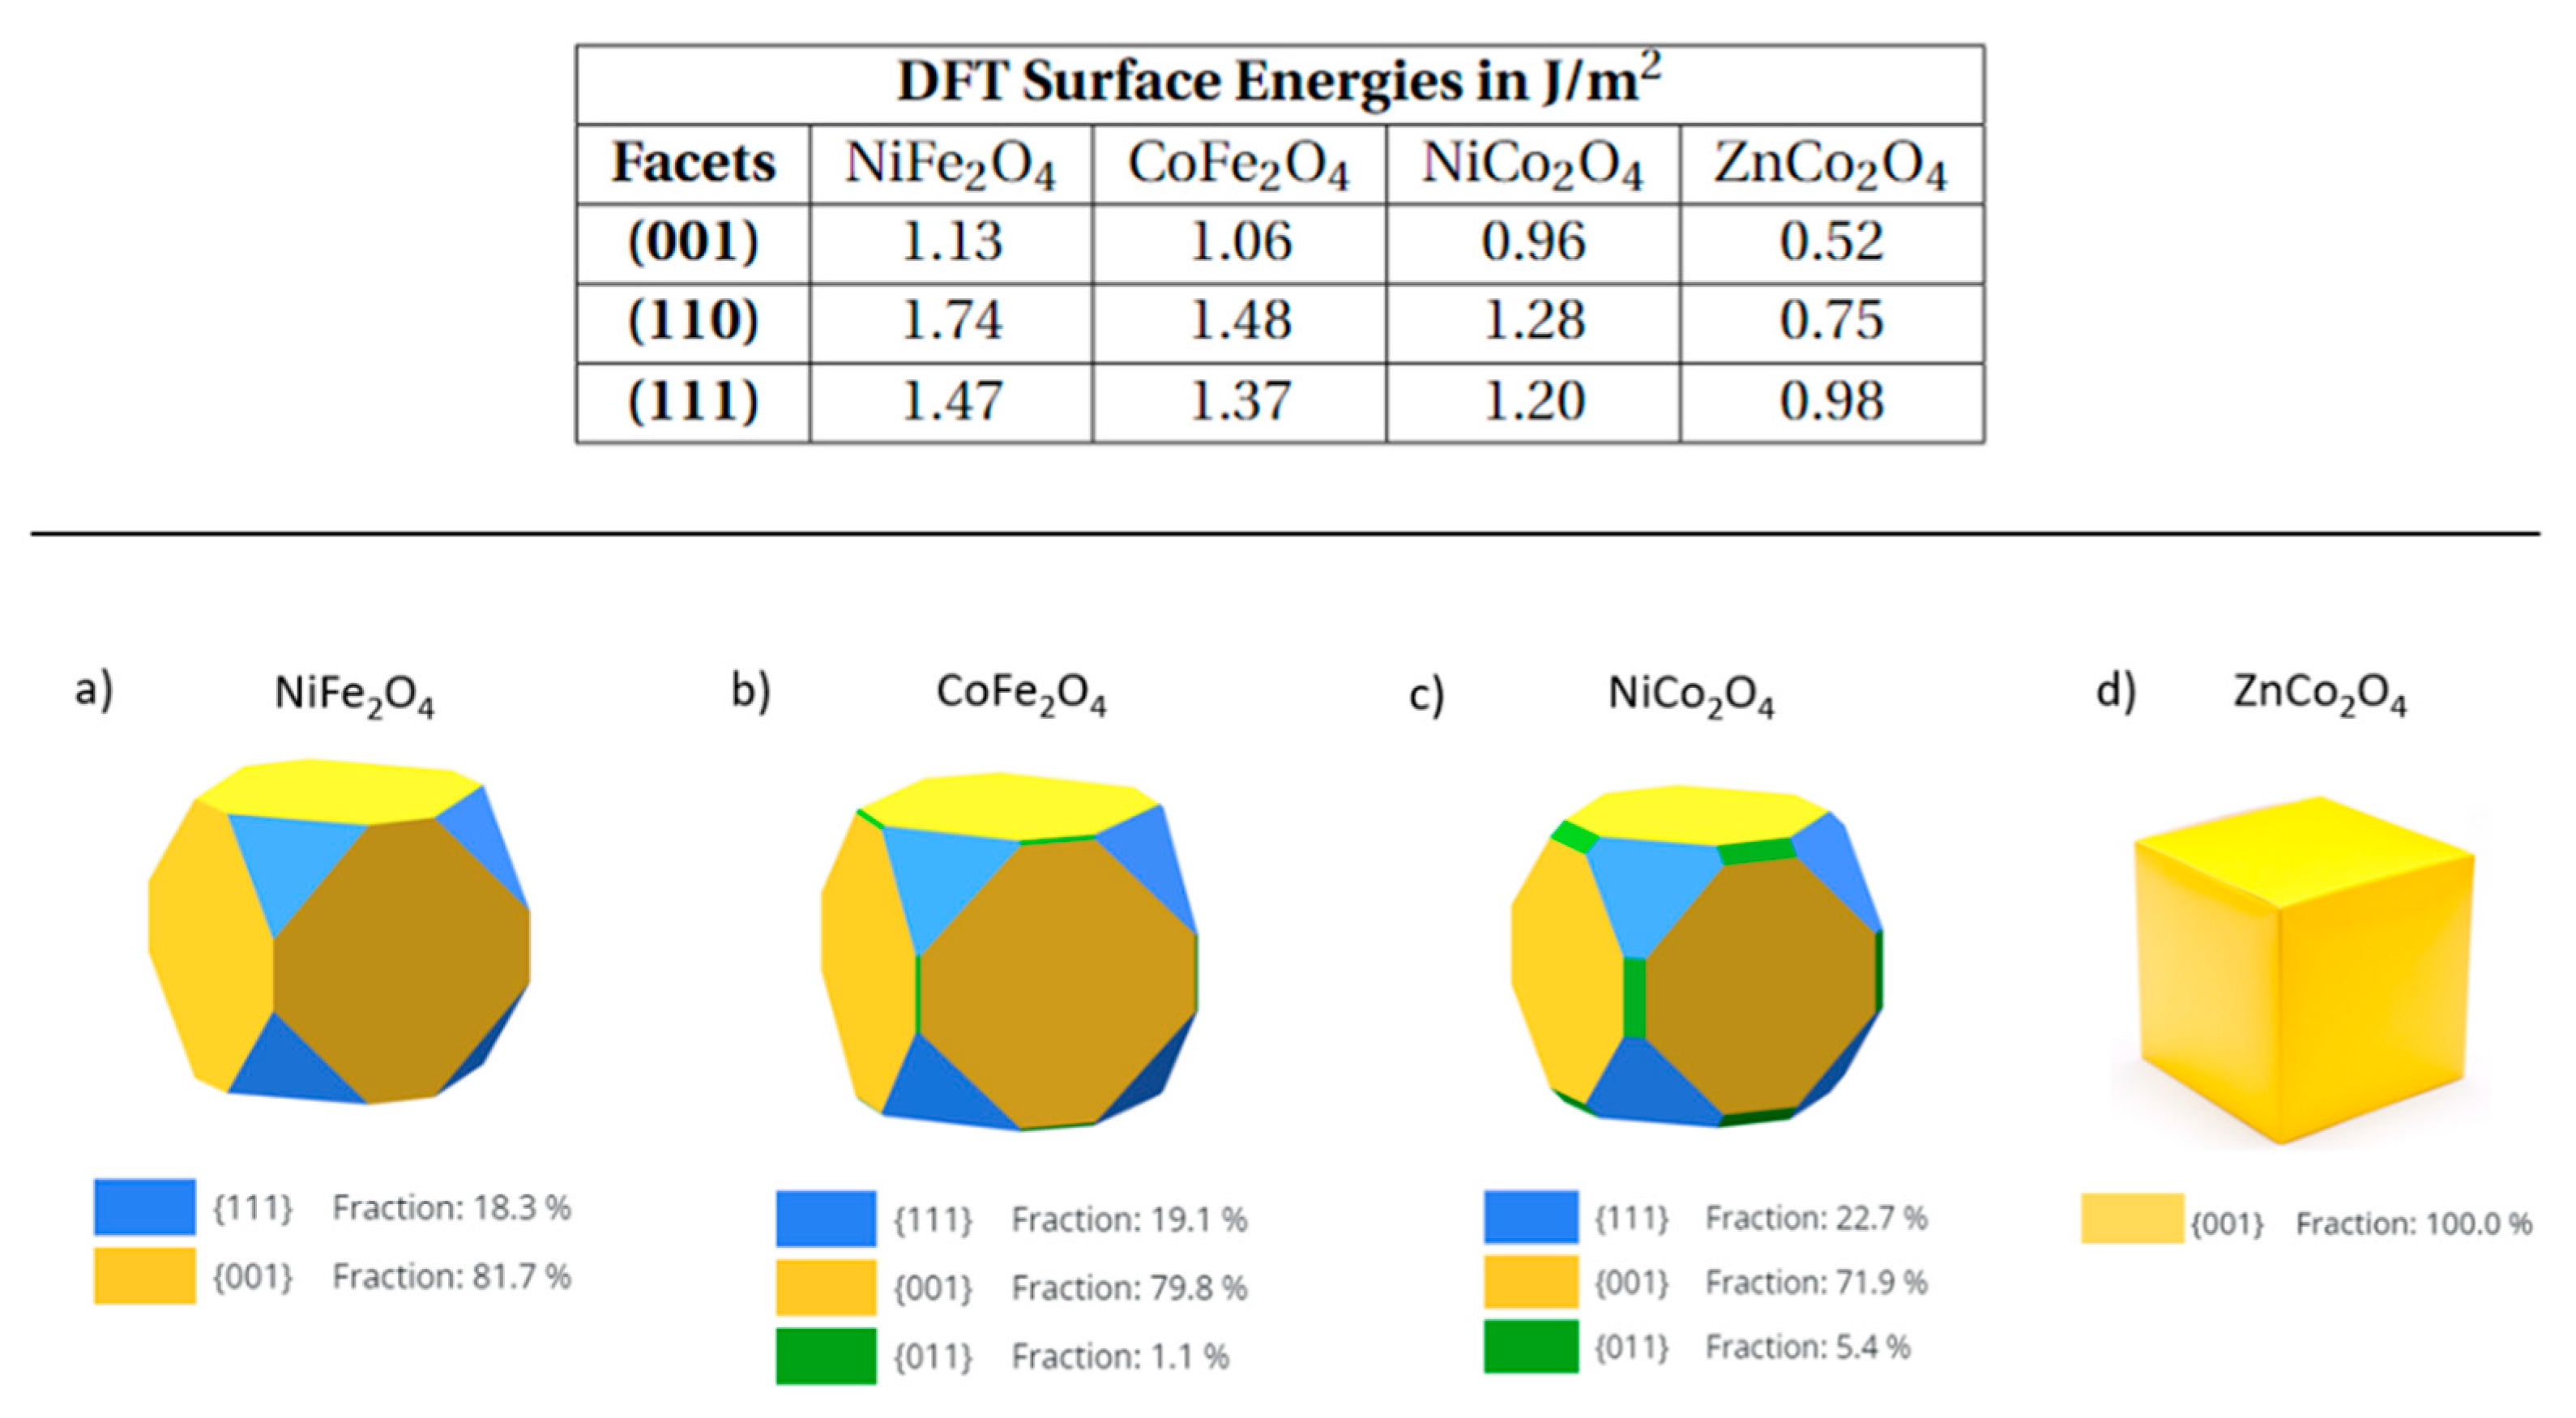
3.1. Wulff Shapes of Bare Spinel Surfaces as Heterogenous Catalysts
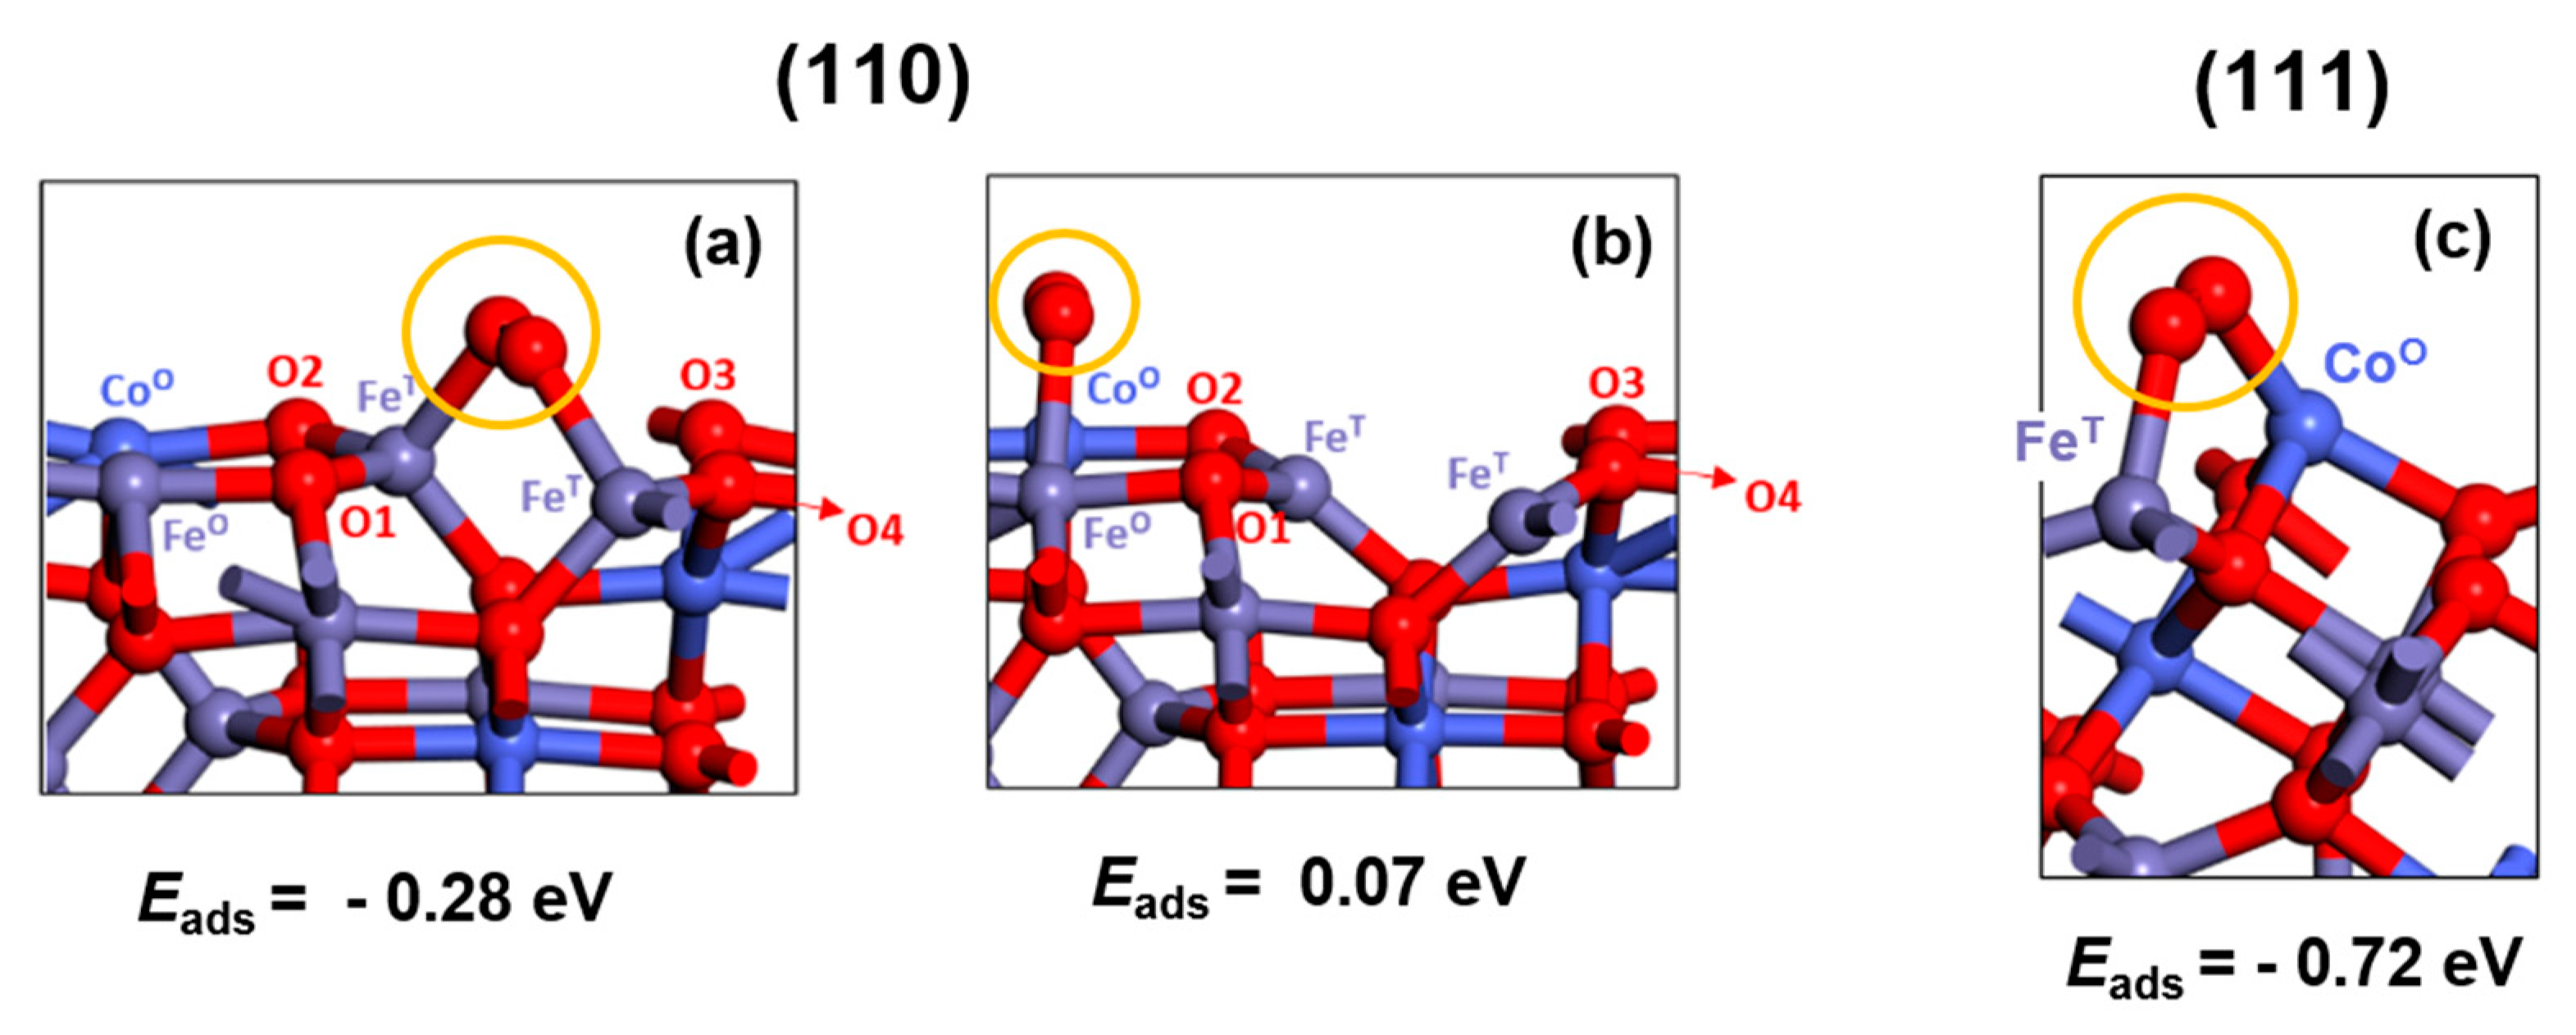
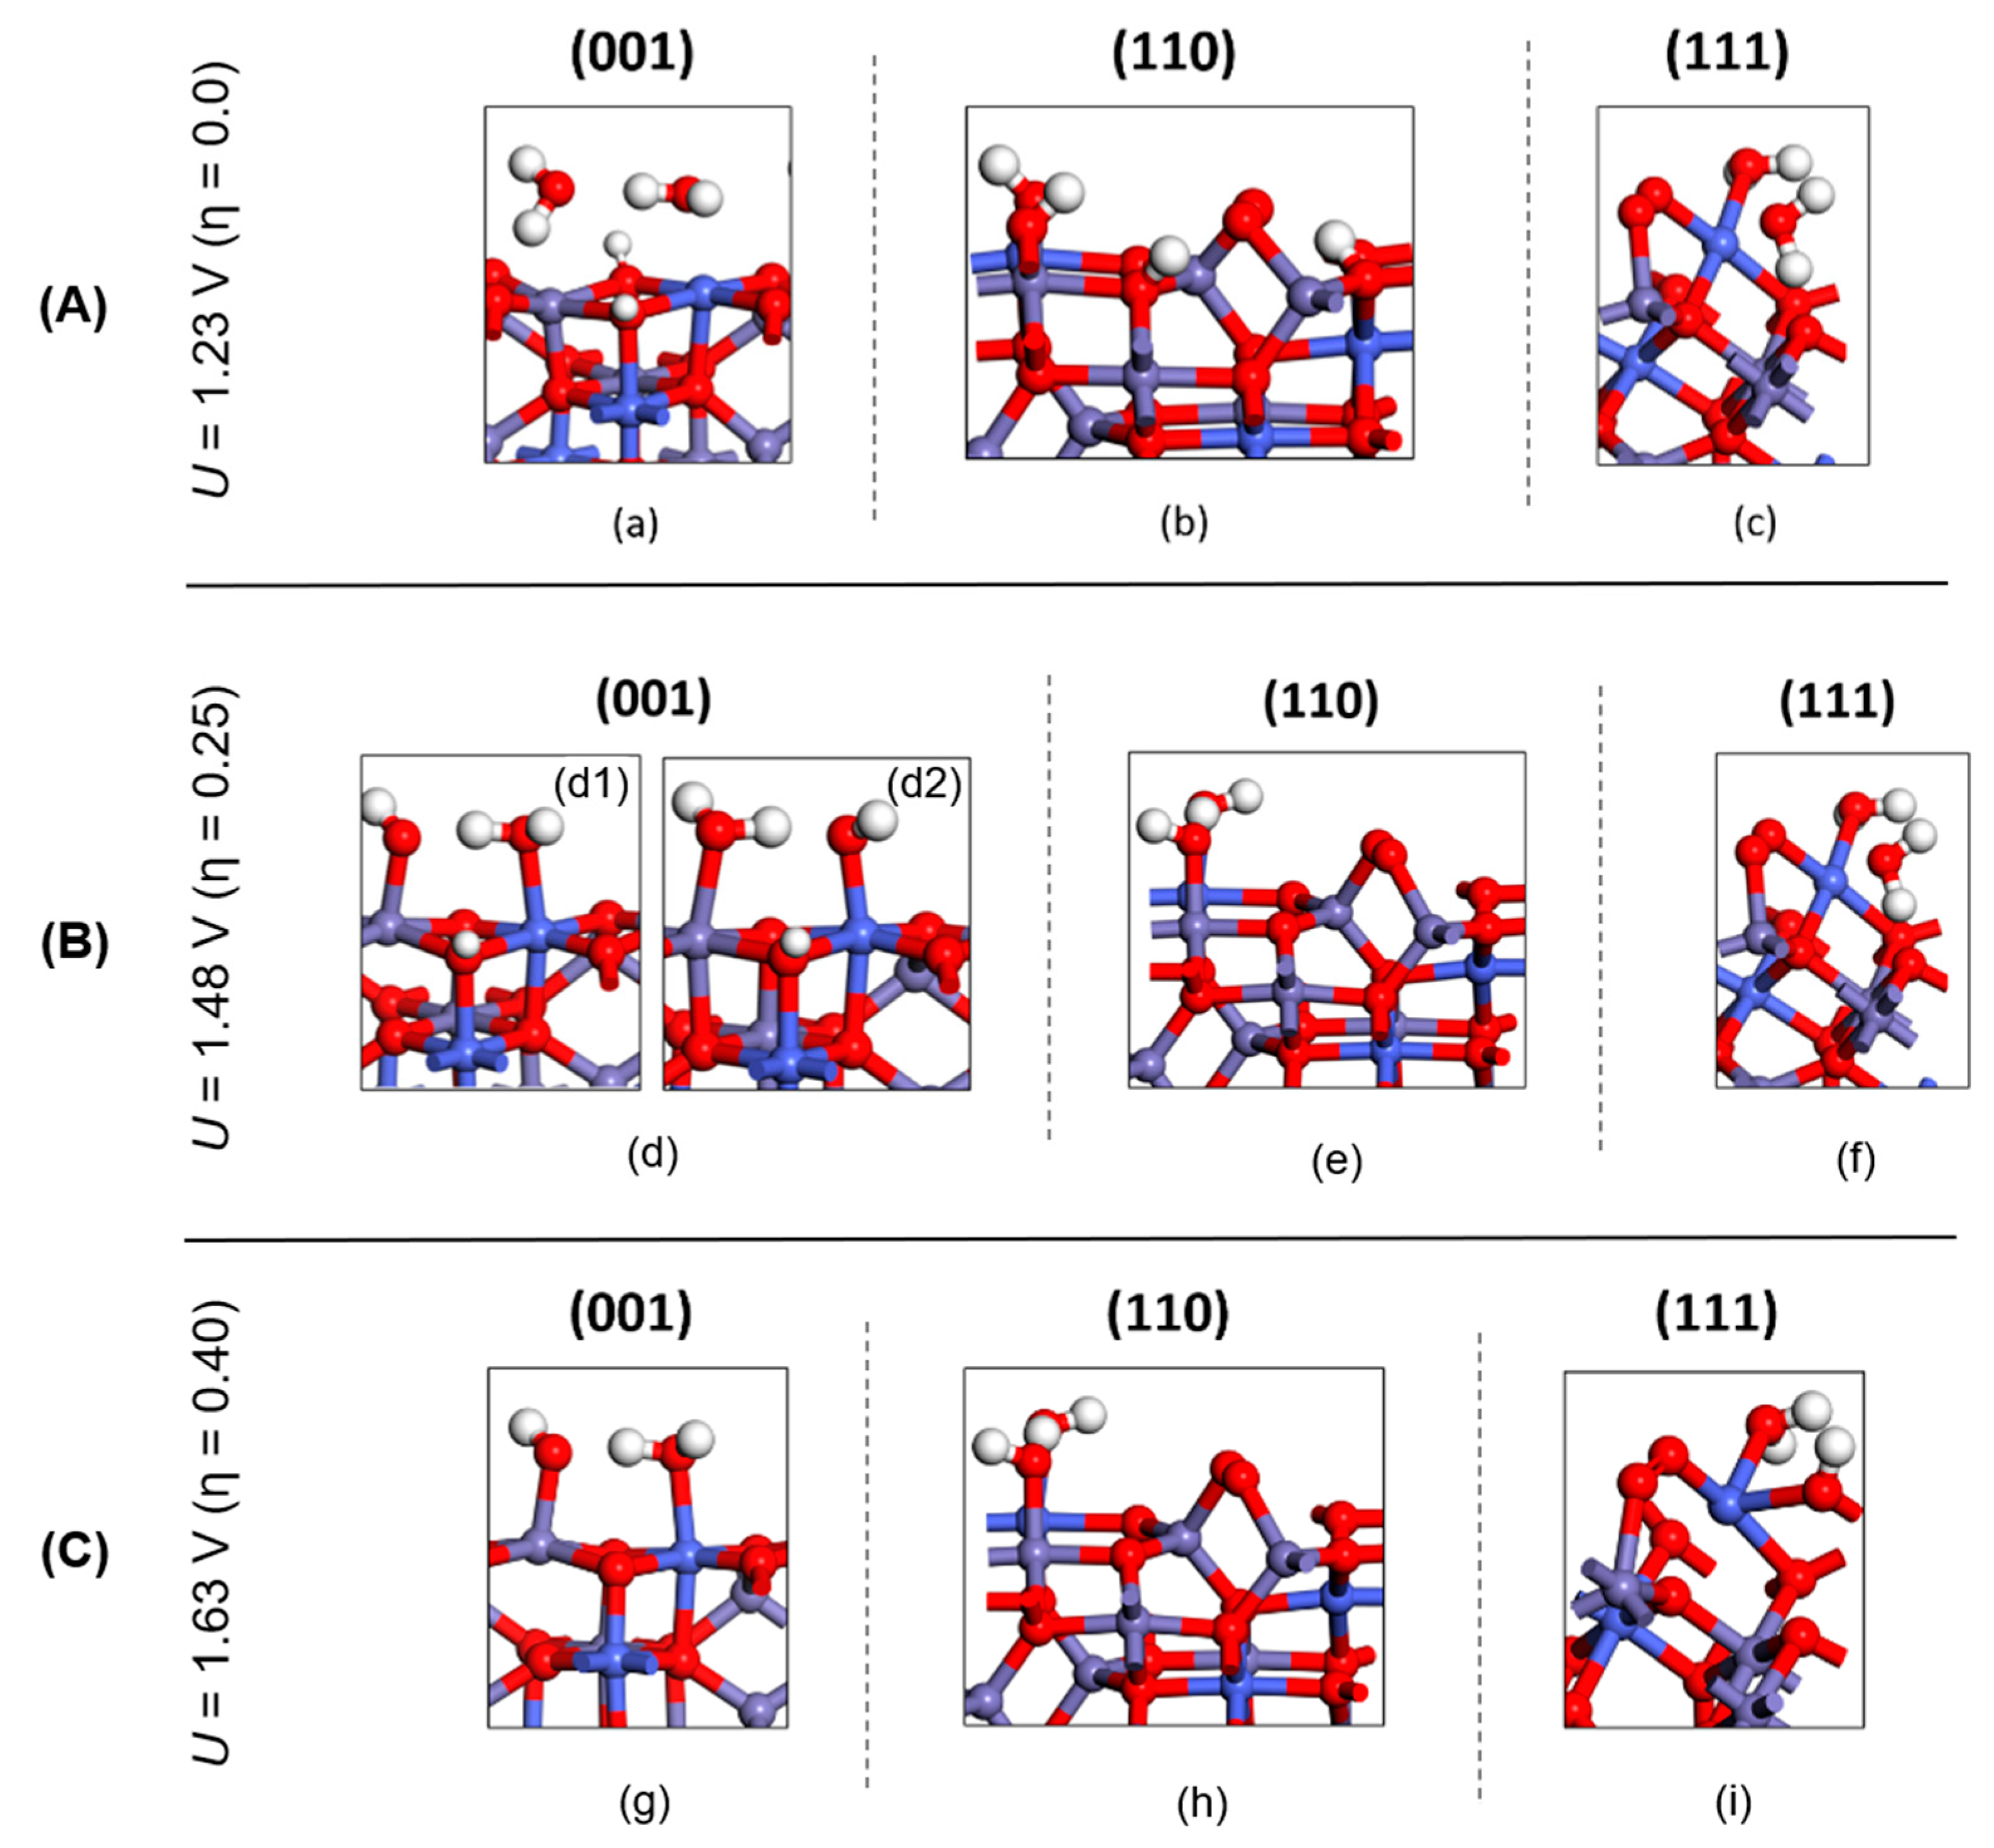
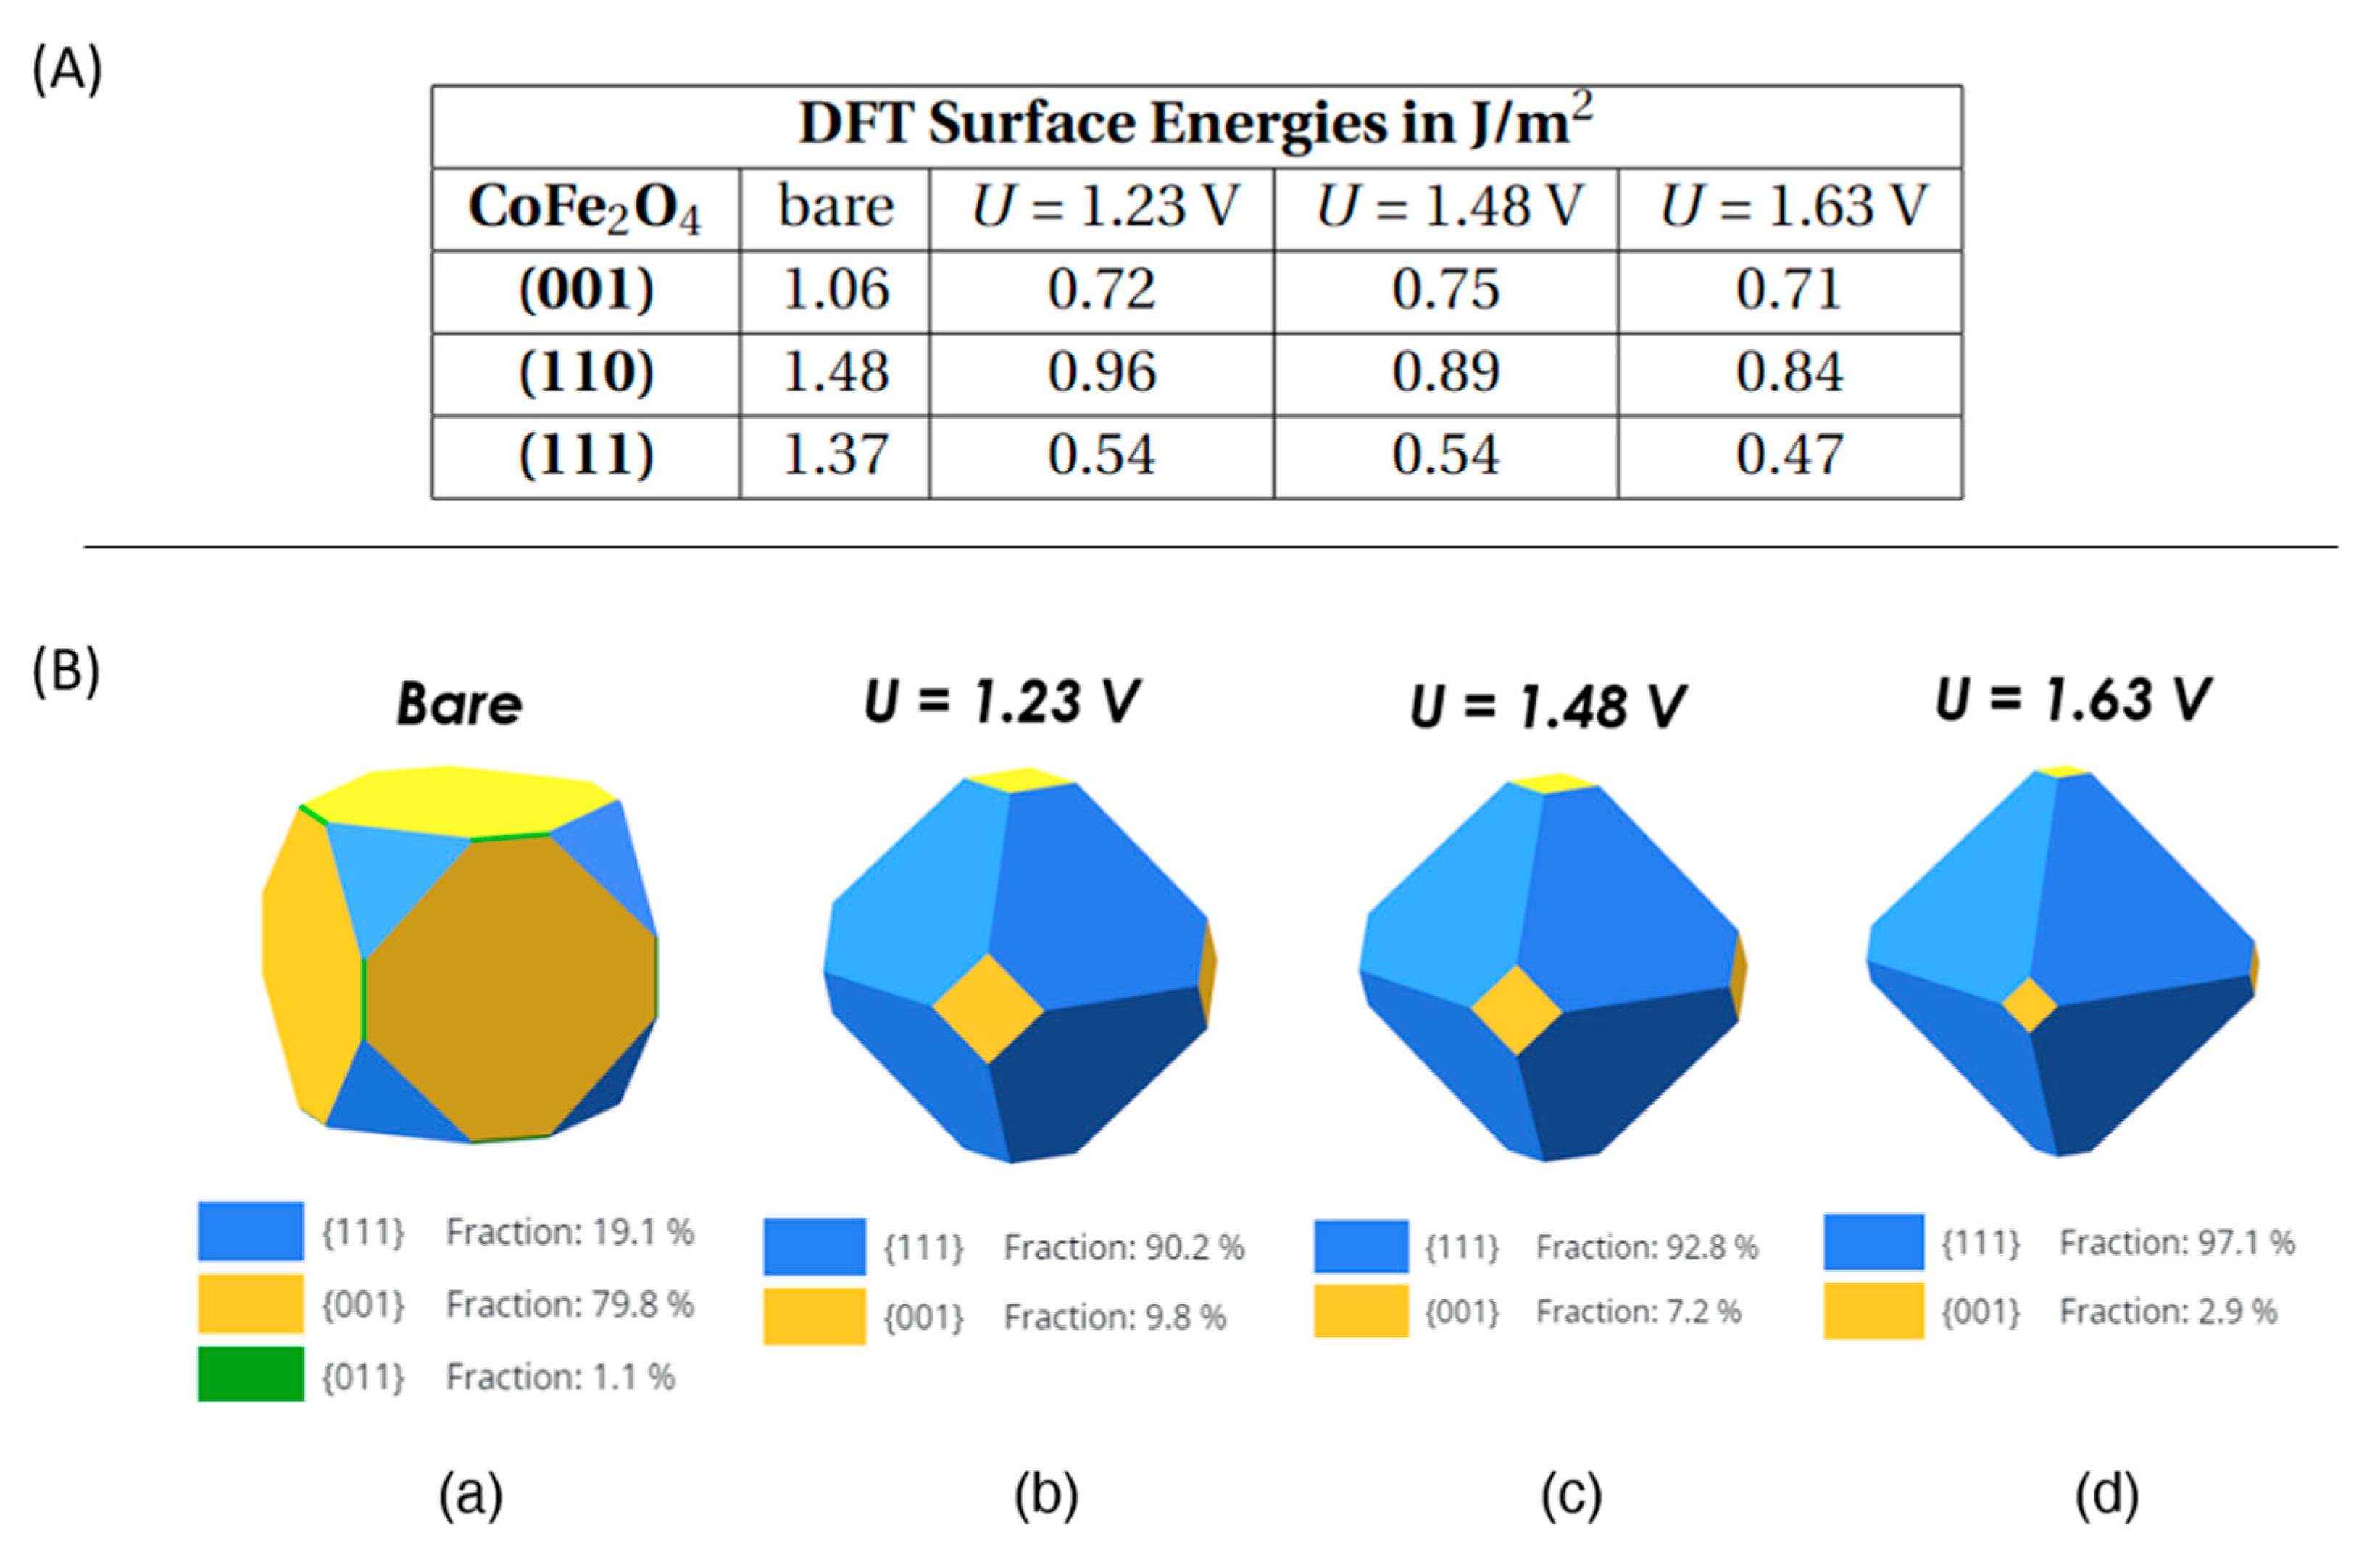
3.2. Wulff Shapes of Spinel Surfaces under Electrochemical Conditions
3.2.1. Comparison with experiment
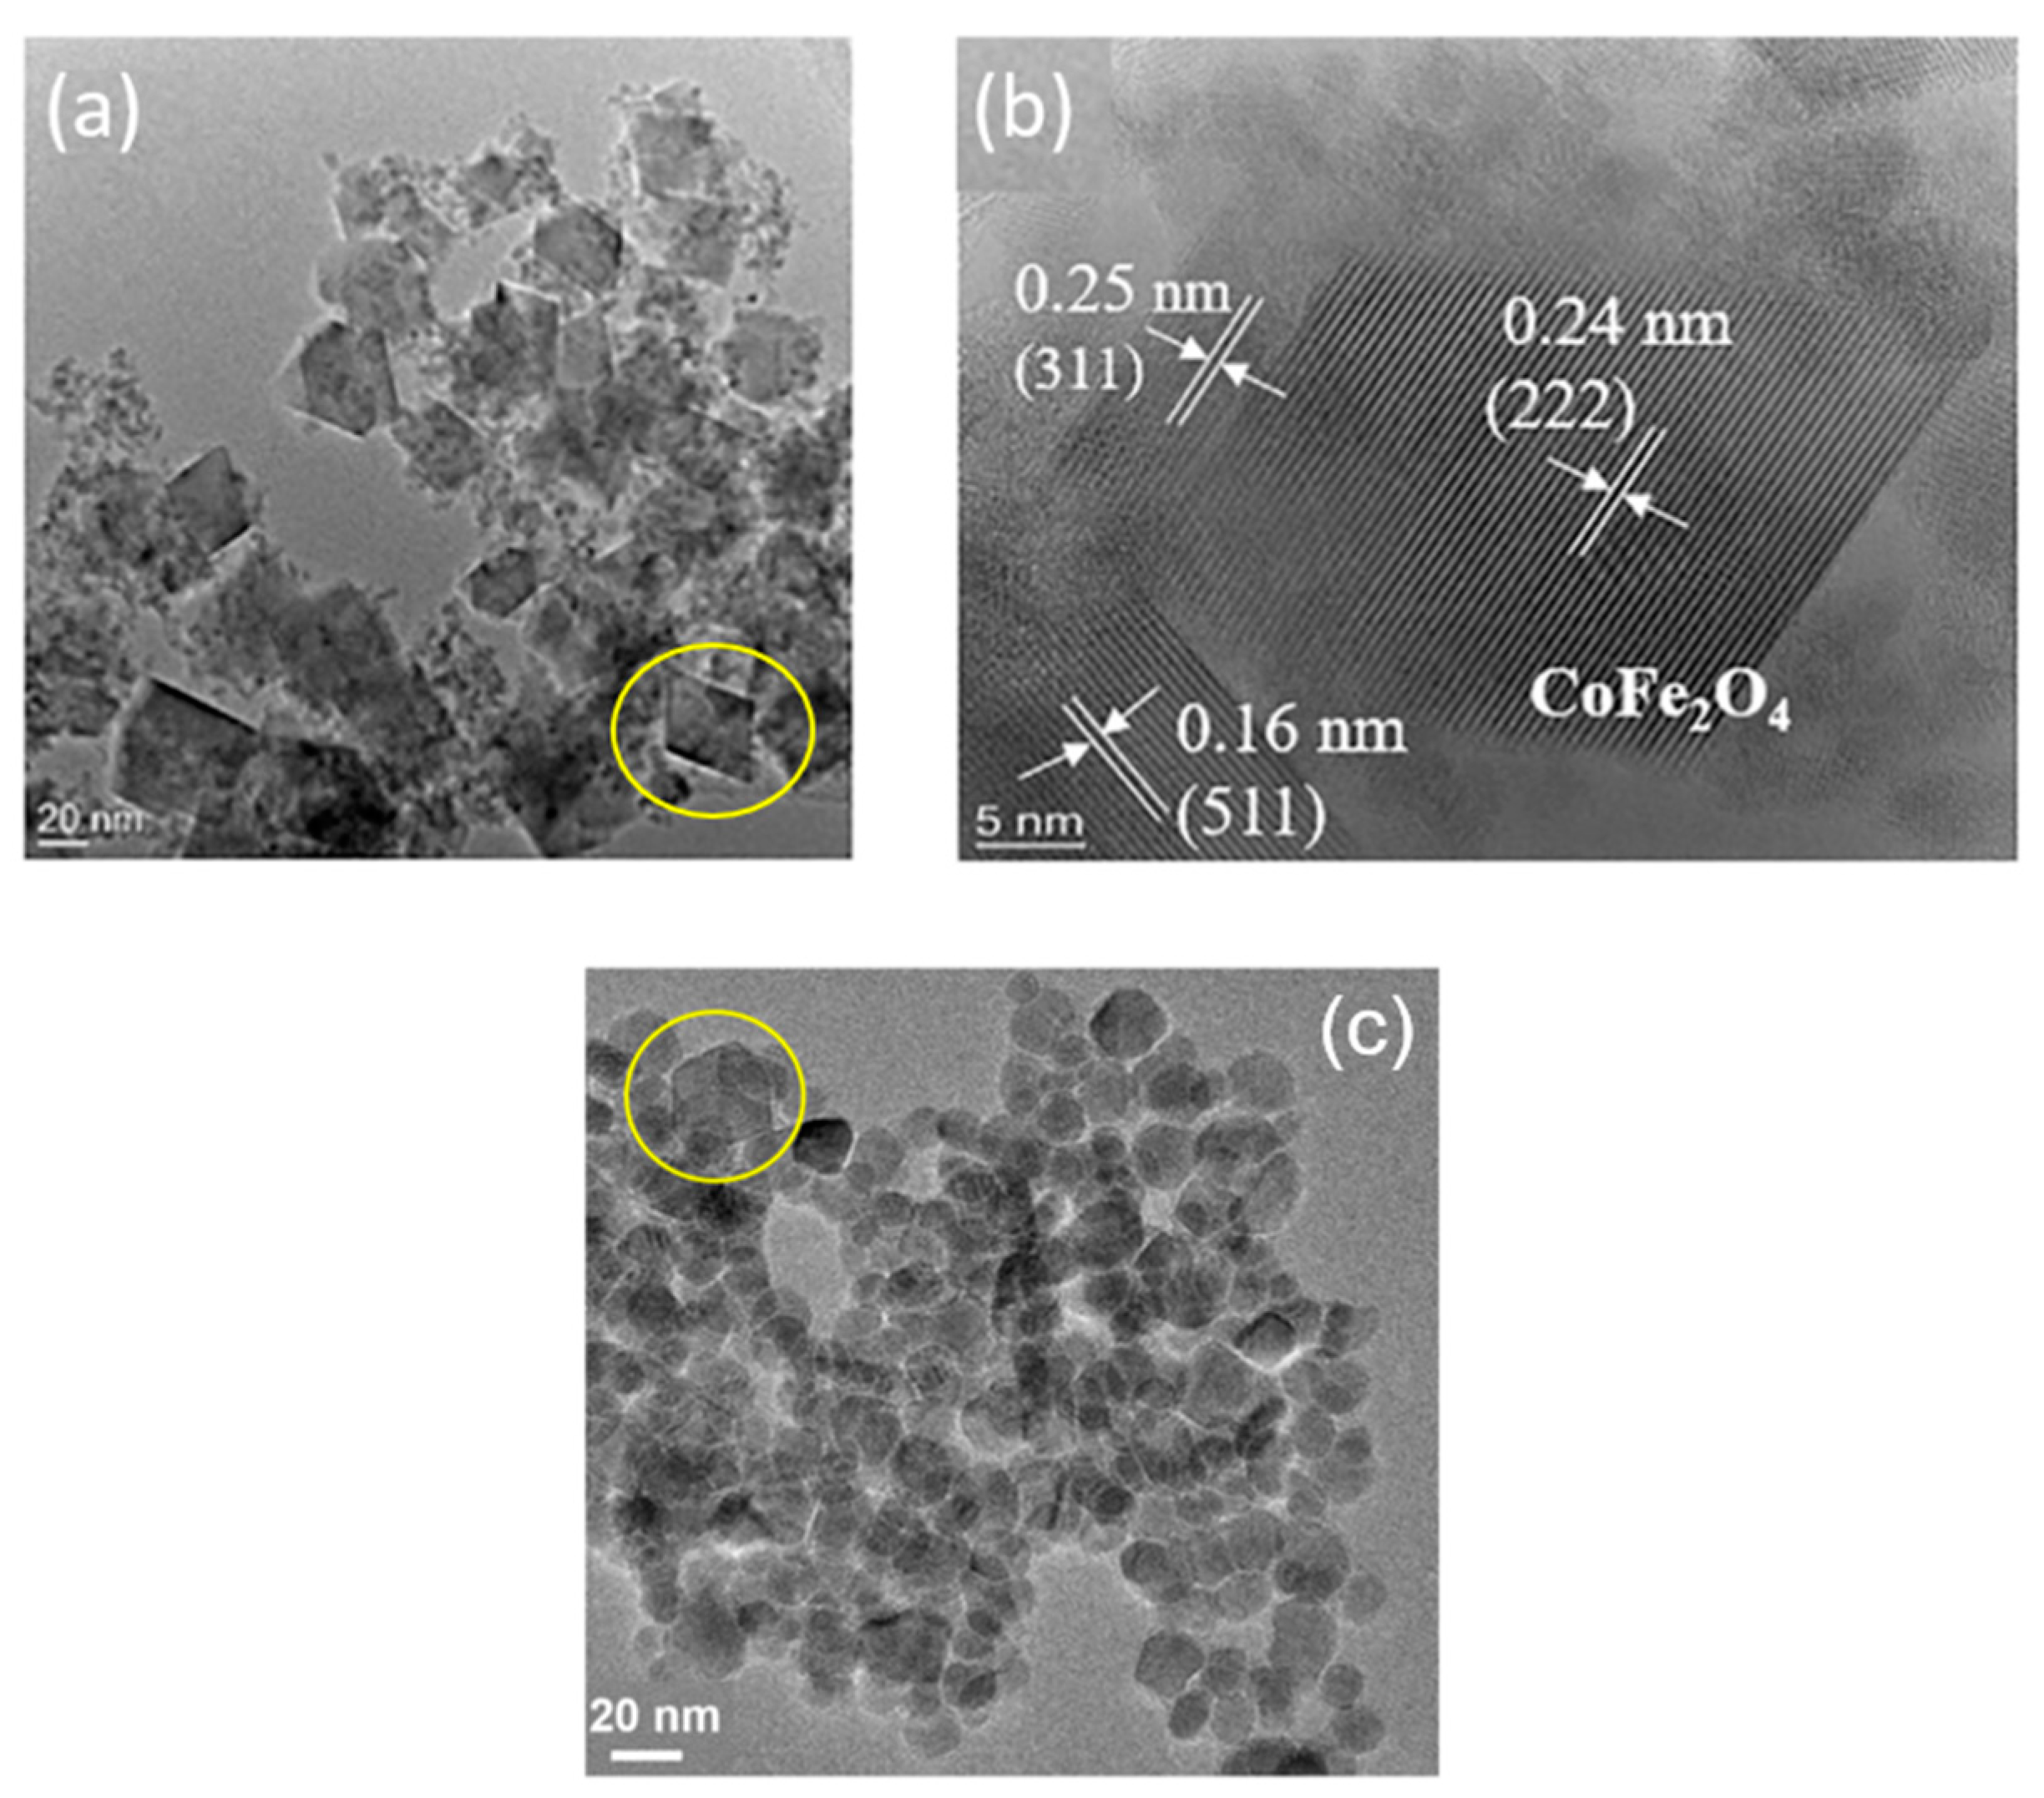
3.2.1. Effect of oxygen pressure on nanoparticle shape
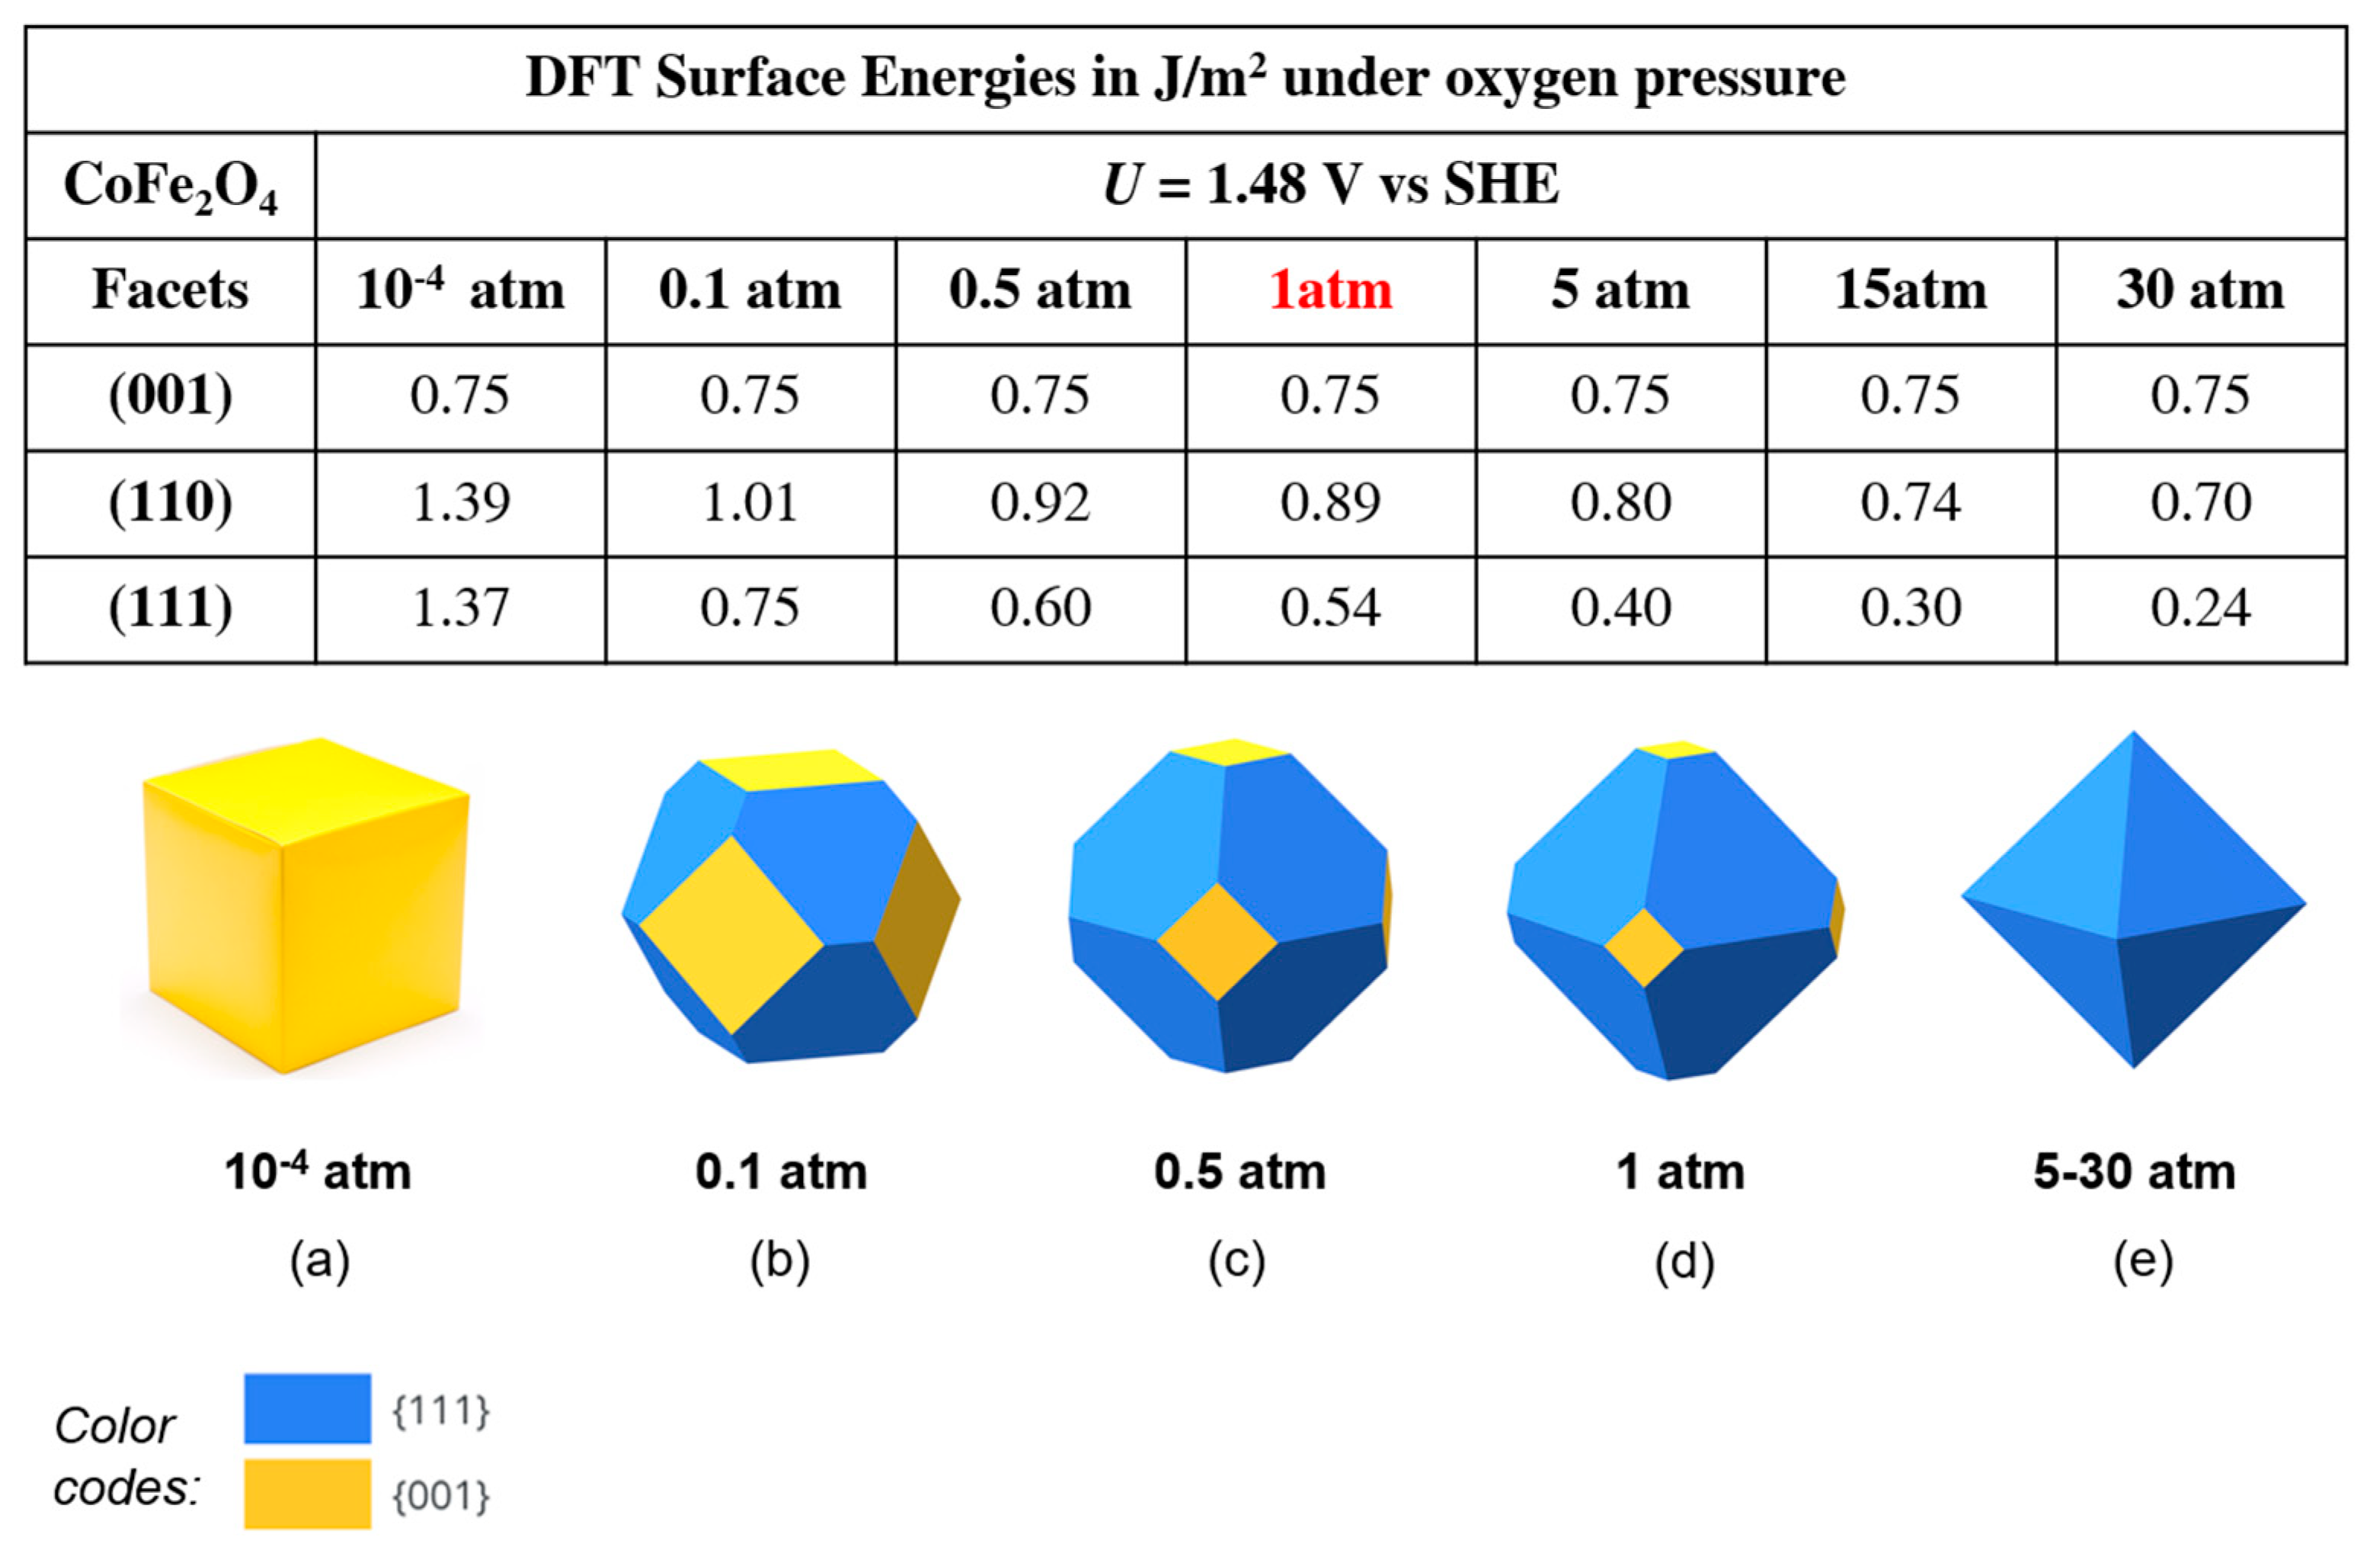
4. Conclusions
Supplementary Materials
Author Contributions
Funding
Data Availability Statement
Acknowledgments
Conflicts of Interest
References
- Barmparis, G.D.; Lodziana, Z.; Lopez, N.; Remediakis, I.N. Nanoparticle Shapes by Using Wulff Constructions and First-Principles Calculations. Beilstein J. Nanotech. 2015, 6, 361–368. [Google Scholar] [CrossRef] [PubMed]
- Sun, Y.; Xia, Y. Shape-controlled synthesis of gold and silver nanoparticles. Science. 2002, 298, 2176–2179. [Google Scholar] [CrossRef] [PubMed]
- Wulff, G. Zur Frage der Geschwindigkeit des Wachsthums und der Auflösung der Krystallflächen, Zeitschrift für Kristallographie. Crystalline Materials 1901, 34, 449–530. [Google Scholar]
- Gibbs, J.W. On the Equilibrium of Heterogeneous Substances. Am. J. Science 1878, s3-16, 441–458. [Google Scholar] [CrossRef]
- Honkala, K.; Hellman, A. , Remediakis, I.N., Logadottir, A., Carlsson, A.; Dahl, S.; Christensen, C.H.; Nørskov, J.K. Ammonia Synthesis from First-Principles Calculations. Science 2005, 307, 555–558. [Google Scholar] [CrossRef] [PubMed]
- Vilé, G.; Baudouin, D.; Remediakis, I.N.; Copéret, C.; López, N.; Pérez-Ramírez, J. Silver Nanoparticles for Olefin Production: New Insights into the Mechanistic Description of Propyne Hydrogenation. ChemCatChem. 2013, 5, 3750–3759. [Google Scholar] [CrossRef]
- Barmparis, G.D.; Remediakis, I.N. Dependence on CO Adsorption of the Shapes of Multifaceted Gold Nanoparticles: A Density Functional Theory. Phys. Rev. B. 2012, 86, 085457. [Google Scholar] [CrossRef]
- Zasada, F.; Gryboś, J.; Indyka, P.; Piskorz, W.; Kaczmarczyk, J.; Sojka, Z. Surface Structure and Morphology of M[CoM′]O4 (M = Mg, Zn, Fe, Co and M′ = Ni, Al, Mn, Co) Spinel Nanocrystals—DFT+U and TEM Screening Investigations. J. Phys. Chem. C 2014, 118, 19085–19097. [Google Scholar] [CrossRef]
- Zhu, M.; Wachs, I.E. Iron-Based Catalysts for the High-Temperature Water–Gas Shift (HT-WGS) Reaction: A Review. ACS Catalysis 2016, 6, 722–732. [Google Scholar] [CrossRef]
- Villa, R. Ni Based Mixed Oxide Materials for CH4 Oxidation under Redox Cycle Conditions. Journal of Molecular Catalysis A: Chemical 2003, 204-205, 637–646. [Google Scholar] [CrossRef]
- Anke, S.; Bendt, G.; Ilya Sinev; Hamidreza Hajiyani; Antoni, H; Ioannis Zegkinoglou; Hyo Sang Jeon; Rossitza Pentcheva; Beatriz Roldan Cuenya; Schulz, S.; Muhler, M. Selective 2-Propanol Oxidation over Unsupported Co3O4 Spinel Nanoparticles: Mechanistic Insights into Aerobic Oxidation of Alcohols. ACS Catalysis 2019, 9, 5974–5985. [CrossRef]
- Scheffe, J.R.; Allendorf, M.D.; Coker, E.N.; Jacobs, B.W.; McDaniel, A.H.; Weimer, A.W. Hydrogen Production via Chemical Looping Redox Cycles Using Atomic Layer Deposition-Synthesized Iron Oxide and Cobalt Ferrites. Chemistry of Materials 2011, 23, 2030–2038. [Google Scholar] [CrossRef]
- Chmielewski, A.; Meng, J.; Zhu, B.; Gao, Y.; Guesmi, H.; Prunier, H.; Alloyeau, D.; Wang, G.; Louis, C.; Delannoy, L.; Afanasiev, P.; Ricolleau, C.; Nelayah, J. Reshaping Dynamics of Gold Nanoparticles under H2 and O2 at Atmospheric Pressure. ACS Nano. 2019, 13, 2024–2033. [Google Scholar] [CrossRef] [PubMed]
- West, P.S.; Johnston, R.L.; Barcaro, G.; Fortunelli, A. The Effect of CO and H Chemisorption on the Chemical Ordering of Bimetallic Clusters. J. Phys. Chem. C 2010, 114, 19678–19686. [Google Scholar] [CrossRef]
- Geysermans, P.; Finocchi, F.; Goniakowski, J.; Hacquart, R.; Jupille, J. Combination of (100), (110) and (111) Facets in MgO Crystals Shapes from Dry to Wet Environment. Phys. Chem. Chem. Phys. 2009, 11, 2228–2233. [Google Scholar] [CrossRef] [PubMed]
- Molina, L.M.; Lee, S.; Sell, K.; Barcaro, G.; Fortunelli, A.; Lee, B.; Seifert, S.; Winans, R.E.; Elam, J.W.; Pellin, M.J. Size-Dependent Selectivity and Activity of Silver Nanoclusters in the Partial Oxidation of Propylene to Propylene Oxide and Acrolein: A Joint Experimental and Theoretical Study. Catal. Today 2011, 160, 116–130. [Google Scholar] [CrossRef]
- An, Q.; McDonald, M.; Fortunelli, A.; Goddard, W.A. Controlling the Shapes of Nanoparticles by Dopant-Induced Enhancement of Chemisorption and Catalytic Activity: Application to Fe-Based Ammonia Synthesis. ACS Nano 2020, 15, 1675–1684. [Google Scholar] [CrossRef] [PubMed]
- Akbashev, A.R. Electrocatalysis Goes Nuts. ACS Catal. 2022, 12, 4296–4301. [Google Scholar] [CrossRef]
- Suen, N.-T.; Hung, S.-F.; Quan, Q.; Zhang, N.; Xu, Y.-J.; Chen, H.M. Electrocatalysis for the Oxygen Evolution Reaction: Recent Development and Future Perspectives. Chem. Soc. Rev. 2017, 46, 337–365. [Google Scholar] [CrossRef] [PubMed]
- Zhao, Q.; Yan, Z.; Chen, C.; Chen, J. Spinels: Controlled Preparation, Oxygen Reduction/Evolution Reaction Application, and Beyond. Chemical Reviews 2017, 117, 10121–10211. [Google Scholar] [CrossRef]
- Pandiarajan, T.; John Berchmans, L.; Ravichandran, S. Fabrication of Spinel Ferrite Based Alkaline Anion Exchange Membrane Water Electrolysers for Hydrogen Production. RSC Adv. 2015, 5, 34100–34108. [Google Scholar] [CrossRef]
- Cheng, F.; Shen, J.; Peng, B.; Pan, Y.; Tao, Z.; Chen, J. Rapid Room-Temperature Synthesis of Nanocrystalline Spinels as Oxygen Reduction and Evolution Electrocatalysts. Nature Chem. 2010, 3, 79–84. [Google Scholar] [CrossRef] [PubMed]
- Avcı, Ö.N.; Sementa, L.; Fortunelli, A. Mechanisms of the Oxygen Evolution Reaction on NiFe2O4 and CoFe2O4 Inverse-Spinel Oxides. ACS Catal. 2022, 12, 9058–9073. [Google Scholar] [CrossRef] [PubMed]
- Tolba, S.A.; Gameel, K.M.; Ali, B.A.; Almossalami, H.A.; Allam, N.K. The DFT+U: Approaches, Accuracy, and Applications. Density Functional Calculations - Recent Progresses of Theory and Application, in Density Functional Calculations. Yang, G. ed. 2018, 2018. [Google Scholar] [CrossRef]
- Vanderbilt, D. Soft Self-Consistent Pseudopotentials in a Generalized Eigenvalue Formalism. Phys. Rev. B. 1990, 41, 7892–7895. [Google Scholar] [CrossRef] [PubMed]
- Giannozzi, P.; Baroni, S.; Bonini, N.; Calandra, M.; Car, R.; Cavazzoni, C.; Ceresoli, D.; Chiarotti, G.L.; Cococcioni, M.; Dabo, I.; Dal Corso, A.; de Gironcoli, S.; Fabris, S.; Fratesi, G.; Gebauer, R.; Gerstmann, U.; Gougoussis, C.; Kokalj, A.; Lazzeri, M.; Martin-Samos, L.; Marzari, N.; Mauri, F.; Mazzarello, R.; Paolini, S.; Pasquarello, A.; Paulatto, L.; Sbraccia, C.; Scandolo, S.; Sclauzero, G.; Seitsonen, A.P.; Smogunov, A.; Umari, P.; Wentzcovitch, R.M.J. Phys.: Condens. Matter. 2009, 21, 395502.
- Perdew, J.P.; Burke, K.; Ernzerhof, M. Generalized Gradient Approximation Made Simple. Phys. Rev. Lett. 1996, 77, 3865–3868. [Google Scholar] [CrossRef] [PubMed]
- Shi, X.; Bernasek, S.L.; Selloni, A. Formation, Electronic Structure, and Defects of Ni Substituted Spinel Cobalt Oxide: A DFT+U Study. J. Phys. Chem. C 2016, 120, 14892–14898. [Google Scholar] [CrossRef]
- Selcuk, S.; Selloni, A. DFT+U Study of the Surface Structure and Stability of Co3O4(110): Dependence on U. J. Phys. Chem. C 2015, 119, 9973–9979. [Google Scholar] [CrossRef]
- Wang, L.; Maxisch, T.; Ceder, G. Oxidation Energies of Transition Metal Oxides within TheGGA+Uframework. Phys. Rev. B 2006, 73, 195107. [Google Scholar] [CrossRef]
- Rahm, J.; Erhart, P. WulffPack: A Python Package for Wulff Constructions. J. Open Source Software. 2020, 5, 1944. [Google Scholar] [CrossRef]
- Wen, X.L.; Chen, Z.; Liu, E.H.; Lin, X. Structural and Magnetic Characterization of ZnCo2O4 Thin Film Prepared by Pulsed Laser Deposition. Appl. Surf. Sci. 2015, 357, 1212–1216. [Google Scholar] [CrossRef]
- Chen, Z.; Wen, X.L.; Niu, L.W.; Duan, M.; Zhang, Y.J.; Dong, X.L.; Zhang, R.L.; Chen, C.L. Transport and Magnetic Properties of ZnCo2O4/Si Heterostructures Grown by Radio Frequency Magnetron Sputtering. Thin Solid Films. 2014, 573, 90–94. [Google Scholar] [CrossRef]
- Montoya, A.; Haynes, B.S. Periodic Density Functional Study of Co3O4 Surfaces. Chem. Phys. Lett. 2011, 502, 63–68. [Google Scholar] [CrossRef]
- Zasada, F.; Piskorz, W.; Stelmachowski, P.; Kotarba, A.; Paul, J.-F.; Płociński, T.; Kurzydłowski, K.J.; Sojka, Z. Periodic DFT and HR-STEM Studies of Surface Structure and Morphology of Cobalt Spinel Nanocrystals. Retrieving 3D Shapes from 2D Images. J. Phys. Chem. C 2011, 115, 6423–6432. [Google Scholar] [CrossRef]
- Chmielewski, A.; Meng, J.; Zhu, B.; Gao, Y.; Guesmi, H.; Prunier, H.; Alloyeau, D.; Wang, G.; Louis, C.; Delannoy, L.; Afanasiev, P.; Ricolleau, C.; Nelayah, J. Reshaping Dynamics of Gold Nanoparticles under H2 and O2 at Atmospheric Pressure. ACS Nano. 2019, 13, 2024–2033. [Google Scholar] [CrossRef] [PubMed]
- Li, Y.-F.; Selloni, A. Mechanism and Activity of Water Oxidation on Selected Surfaces of Pure and Fe-Doped NiOx. ACS Catal. 2014, 4, 1148–1153. [Google Scholar] [CrossRef]
- Li, Y.-F.; Liu, Z.-P.; Liu, L.; Gao, W. Mechanism and Activity of Photocatalytic Oxygen Evolution on Titania Anatase in Aqueous Surroundings. J. Am. Chem. Soc. 2010, 132, 13008–13015, (b) Lide, D.R. CRC Handbook of Chemistry and Physics, 84th ed.; Ed.; CRC Press: Boca Raton, FL, 2003. [Google Scholar] [CrossRef]
- Nørskov, J.K.; Rossmeisl, J.; Logadottir, A.; Lindqvist, L.; Kitchin, J.R.; Bligaard, T.; Jónsson, H. Origin of the Overpotential for Oxygen Reduction at a Fuel-Cell Cathode. J. Phys. Chem. B 2004, 108, 17886–17892. [Google Scholar] [CrossRef]
- Gong, M.; Dai, H. A Mini Review of NiFe-Based Materials as Highly Active Oxygen Evolution Reaction Electrocatalysts. Nano Res. 2014, 8, 23–39. [Google Scholar] [CrossRef]
- Xiao, H.; Shin, H.; Goddard, W.A. Synergy between Fe and Ni in the Optimal Performance of (Ni,Fe)OOH Catalysts for the Oxygen Evolution Reaction. Proc. Nat. Ac. Sci. 2018, 115, 5872–5877. [Google Scholar] [CrossRef] [PubMed]
- Li, M.; Xiong, Y.; Liu, X.; Bo, X.; Zhang, Y.; Han, C.; Guo, L. Facile Synthesis of Electrospun MFe2O4(M = Co, Ni, Cu, Mn) Spinel Nanofibers with Excellent Electrocatalytic Properties for Oxygen Evolution and Hydrogen Peroxide Reduction. Nanoscale. 2015, 7, 8920–8930. [Google Scholar] [CrossRef] [PubMed]
- Müller, P.; Kern, R. Equilibrium Nano-Shape Changes Induced by Epitaxial Stress (Generalised Wulf–Kaishew Theorem). Surf. Sci. 2000, 457, 229–253. [Google Scholar] [CrossRef]
- Gebreslase, G.A.; Martínez-Huerta, M.V.; Sebastián, D.; Lázaro, M.J. Transformation of CoFe2O4 Spinel Structure into Active and Robust CoFe Alloy/N-Doped Carbon Electrocatalyst for Oxygen Evolution Reaction. J. Colloid Interface Sci. 2022, 625, 70–82. [Google Scholar] [CrossRef]
- Xiang, W.; Yang, N.; Li, X.; Linnemann, J.; Hagemann, U.; Ruediger, O.; Heidelmann, M.; Falk, T.; Aramini, M.; DeBeer, S.; Muhler, M.; Tschulik, K.; Li, T. 3D Atomic-Scale Imaging of Mixed Co-Fe Spinel Oxide Nanoparticles during Oxygen Evolution Reaction. Nature Commun. 2022, 13, 179. [Google Scholar] [CrossRef] [PubMed]
- Beverskog, B.; Puigdomenech, I. Revised Pourbaix Diagrams for Iron at 25–300 °C. Corrosion Sci. 1996, 38, 2121–2135. [Google Scholar] [CrossRef]
- El Arrassi, A.; Liu, Z.; Evers, M.V.; Blanc, N.; Bendt, G.; Saddeler, S.; Tetzlaff, D.; Pohl, D.; Damm, C.; Schulz, S.; Tschulik, K. Correction to “Intrinsic Activity of Oxygen Evolution Catalysts Probed at Single CoFe2O4 Nanoparticles. ” J. Am. Chem. Soc.. 2019, 141, 10565–10565. [Google Scholar] [CrossRef] [PubMed]
- Kargar, A.; Yavuz, S.; Kim, T.K.; Liu, C.-H.; Kuru, C.; Rustomji, C.S.; Jin, S.; Bandaru, P.R. Solution-Processed CoFe2O4 Nanoparticles on 3D Carbon Fiber Papers for Durable Oxygen Evolution Reaction. ACS Appl. Mater. Interfaces 2015, 7, 17851–17856. [Google Scholar] [CrossRef] [PubMed]
- Zhang, Y.; Zhang, G.; Li, W.; Li, X.; Uchiyama, K.; Chen, C. Enhancing Oxygen Reduction Activity by Exposing (111) Facets of CoFe2O4 Octahedron on Graphene. Chemistry Select 2017, 2, 9878–9881. [Google Scholar] [CrossRef]
- Chen, Z.; Cronawitter, C.X.; Koel, B. Facet-dependent activity and stability of Co3O4 nanocrystals towards the oxygen evolution reaction. Phys. Chem. Chem. Phys. 2015, 17, 29387–29393. [Google Scholar] [CrossRef] [PubMed]
- Li, A.; Kong, S.; Guo, C.; Ooka, H.; Adachi, K.; Hashizume, D.; Jiang, Q.; Han, H.; Xiao, J.; Nakamura, R. Enhancing the stability of cobalt spinel oxide towards sustainable oxygen evolution in acid. Nature Catal. 2022, 5, 109–118. [Google Scholar] [CrossRef]
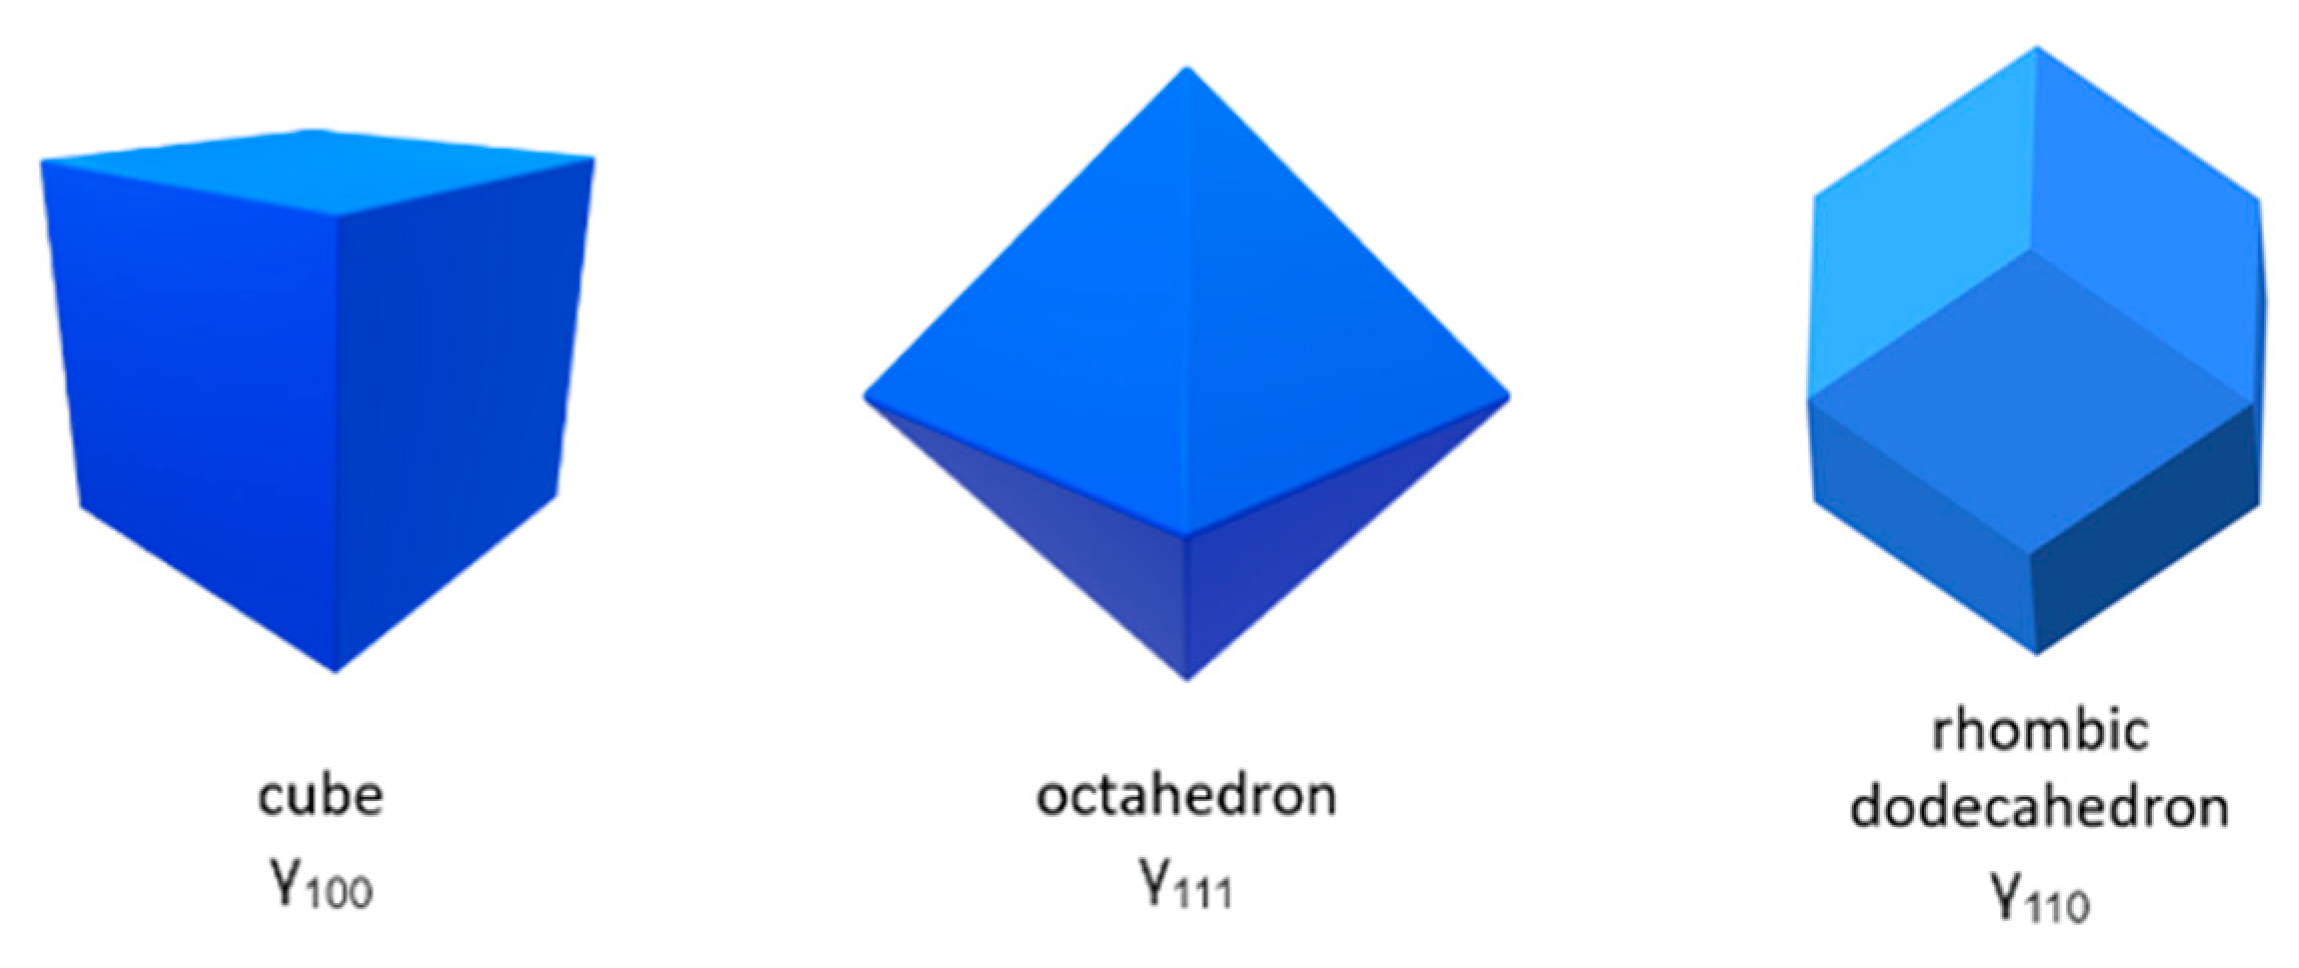
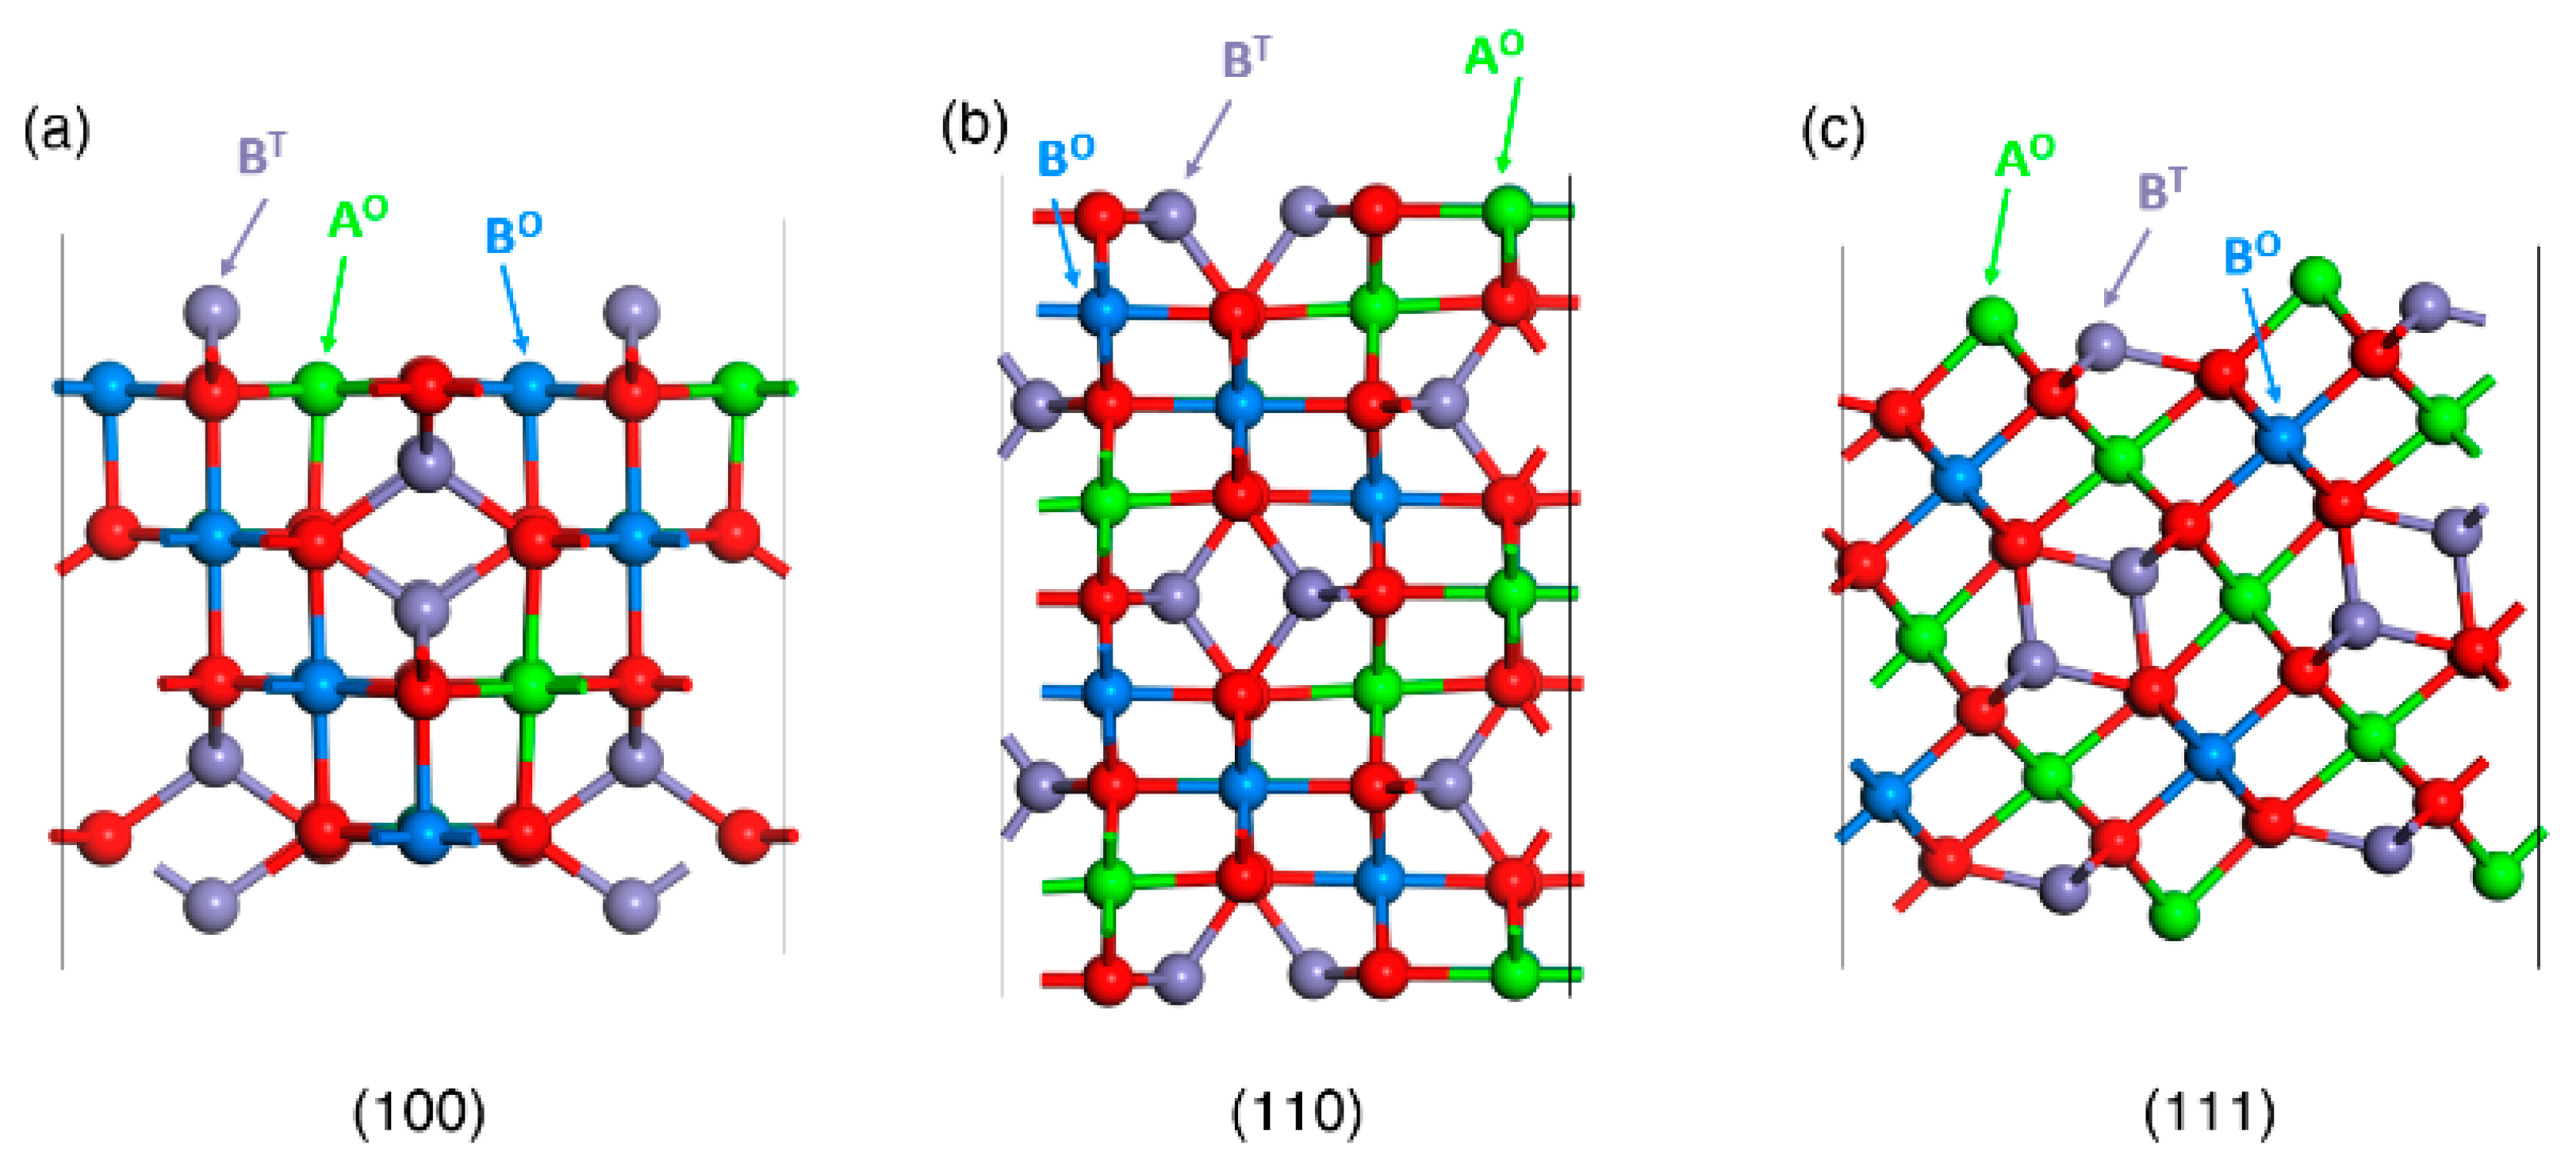
Disclaimer/Publisher’s Note: The statements, opinions and data contained in all publications are solely those of the individual author(s) and contributor(s) and not of MDPI and/or the editor(s). MDPI and/or the editor(s) disclaim responsibility for any injury to people or property resulting from any ideas, methods, instructions or products referred to in the content. |
© 2023 by the authors. Licensee MDPI, Basel, Switzerland. This article is an open access article distributed under the terms and conditions of the Creative Commons Attribution (CC BY) license (http://creativecommons.org/licenses/by/4.0/).


