1. Introduction
Apricot (
Prunus armeniaca L.) fruits are widely consumed in the world, and their growth is widespread throughout Central Asia, both in the wild and in cultivation.
Prunus armeniaca is the most commonly cultivated apricot species. The native range is somewhat uncertain due to its extensive prehistoric cultivation. Genetic studies indicate Central Asia is the center of origin [
1]. It is extensively cultivated in many countries and has escaped into the wild in many places [
2]. Apricots have been cultivated in Persia since antiquity, and dried ones were an important commodity on Persian trade routes. Its introduction to Europe is attributed to Alexander the Great [
3]. Apricots remain an important fruit in Tajikistan.
There are more than 60 varieties of apricot, and they are consumed immature, mature, and in dried forms. Common preparations include jams, jellies, canned fruits, bakery fillings, and compotes. In addition, traditional medicines have long used all parts of the plant for therapeutic purposes. The fruit contains high levels of dietary fibers, minerals, vitamins, and carotenoids and can be considered a very rich source of bioactive phenolic compounds, including catechins, phenylpropanoid (chlorogenic, gallic, ferulic, caffeic, 4-aminobenzoic, pyrocatechinic, salicylic, and p-coumaric) acids, procyanidins, and phenolic glycosides [
3,
4,
5,
6,
7,
8]. The major flavanols includes quercetin, glycoside rutin, resveratrol, and vanillin [
3], which contribute significantly to their taste, color and nutritive value [
5]. These fruits are also containing carotenoids such as carotene, β-carotene, lycopene, cryptoxanthin, phytoene, phytofluene, and lutein [
4,
5,
6,
7,
8].
The nutrient composition of fruits and vegetables is complex and challenging to assess. Apart from its phytochemicals, the pharmacological significance of this fruit is due to having high amounts of high molecular weight (polysaccharides) including pectin and low molecular weight carbohydrates (oligosaccharides) [
6,
7,
8,
9].
Pectin is one of the major plant cell wall components and the most complex macromolecule in nature, as it can be composed out of as many as 17 different monosaccharides containing more than 20 different linkages, the structural variation in pectin’s depending from different developmental stages or from different sources [
10,
11,
12]. The pectic polysaccharides have a complex structure but can generally be divided into homogalacturonan (HG), rhamnogalacturonan-I (RG-I), rhamnogalacturonan II (RG-II) and xylogalacturonan (XGA). These polysaccharides appear to be present in all cells but their relative abundance and structural details differ between cell types and species [
11,
12]. RG-I has a backbone of -4)-α-D-GalpA-(1 → 2)-α-LRhap-(1- and side branches composed mainly of neutral sugars (NS), arabinan and galactan motifs, and are of highly variable structure and composition.
The manner with which these polymers are attached or become entangled with each other and cellulosic polymers to form the pectin matrix has been a matter of debate. The classical theory is that the RG-I and HG polymers alternate with each other as block polymers and that the side chains interact with neighboring polysaccharide chains. Recently, this standard theory has been questioned and an argument whereby the HG polymers are actually side chains of a RG-I backbone polymer has been advanced [
10].
The pectin matrix is now believed to contain sub-domains of RG-I, HG and RG-II which may interact with different polysaccharide components of the cell wall such as cellulose or xyloglucan [
11] (
Figure 1). Several lines of evidence suggest that galactan-rich forms of RG-I contribute to the firmness of multicellular plant tissues, while arabinans have been associated with elasticity in guard cells [
13]. Additionally, arabinan- and galactan-rich side chains have high mobility and likely water-holding properties [
13,
14,
15].
RG-II is structurally unrelated to RG-I and is an HG backbone consisting of approximately nine 1,4-linked α-D-GalA residues that may be methylated at the C-6 position [
16].
Pectin shows multifunctional applications including in the food industry, the health and pharmaceutical sector, and in packaging regimes. Pectin is commonly utilized in the food industry as an additive in foods such as jams, jellies, low calorie foods, stabilizing acidified milk products, thickener and emulsifier. Pectin is widely used in the pharmaceutical industry for the preparation of medicines that reduce blood cholesterol level and cure gastrointestinal disorders, as well as in cancer treatment. Pectin also finds use in numerous other industries, such as in the preparation of edible films and coatings, paper substitutes and foams. The multifunctionality of pectin is related to the nature of its molecule that has diverse chemical structures, physicochemical properties and potential functionalities depending on the sources where it is extracted and on the extraction methods [
17].
Due to these varied uses of pectin in different applications, there is a great necessity to explore other non-conventional sources [
18]. The pectin content for non-conventional sources including fruits and vegetables such as apricot, cherries, orange and carrots are 1%, 0.4%, 0.5–3.5% and 1.4%, respectively, on a fresh weight basis [
19]. The biological active compounds of Apricots fruits have potent antioxidant activity and is proven to provide important health benefits such as reducing oxidative stress, boosting the immune system, decreasing the risk of heart disease, inflammation, arthritis, and some forms of cancer, and protecting against age-related macular degeneration [
3,
4,
5,
6,
7,
8,
9,
18,
19,
20,
21,
22]. Under rigorously controlled experimental conditions, fruit and vegetable consumption, especially apricot fruits are associated with a decrease in blood pressure, which is an important cardiovascular risk factor. However, the effects of fruit and vegetable consumption on plasma lipid levels, diabetes, and body weight have not yet been thoroughly explored [
20]. The anti-diabetic activities of apricot fruits, α-glucosidase inhibitory activity, and antioxidant activity of neutral polysaccharides from apricot have gained significant interest among recent publications [
20,
21,
22,
23].
We previously reported the effect of pectin from different fruit sources (apricot, peach and quince pectin) on the biosynthesis bile acids and cholesterol levels in rats [
20]. Concomitant examination of bile flow and the biliary secretion of the lipids were significantly different between animals receiving a crude pectin-supplemented diet, which contained pectin oligosaccharides and polyphenols. In rats fed pectin, biliary cholesterol and bilirubin levels were significantly lower, but the phospholipids and bile acid pool sizes were significantly greater than in the control group. Similar changes of greater magnitude were found in rats fed peach and apricot pectin, but lower magnitudes were found in rats fed quince pectin. With repeated administration of peach pectin, bile secretion, compared with the control, increased by 48%, and quince pectin - by 60%. A great effect was observed with apricot pectin, with its repeated administration [
20].
Identification and quantification of the poly- and oligosaccharides in fruits and vegetables is a challenging area as these foods contain a complex mixture of carbohydrates with a varying chain length from 2 to 2500 units. However, according to our knowledge, this is the ever first study carried out on the composition and structures of pectin polysaccharides from apricots fruits using NMR spectroscopy methods.
NMR is an important spectroscopic technique for analyzing biomolecules to characterize their physical characteristics and determine their structures [
24,
25]. Owing to their large sizes and complex, branched structures, often with repeating, or nearly-repeating sequences, carbohydrates in general, and specifically pectin, have unique challenges when analyzed by NMR. Yet, useful information can nonetheless be acquired. The fine structure of pectin polysaccharides will be discussed in this article from both literature and recent work we have performed on apricot pectin [
24,
25,
26,
27].
2. Results
2.1. Isolation and Purification of pectin Polysaccharides
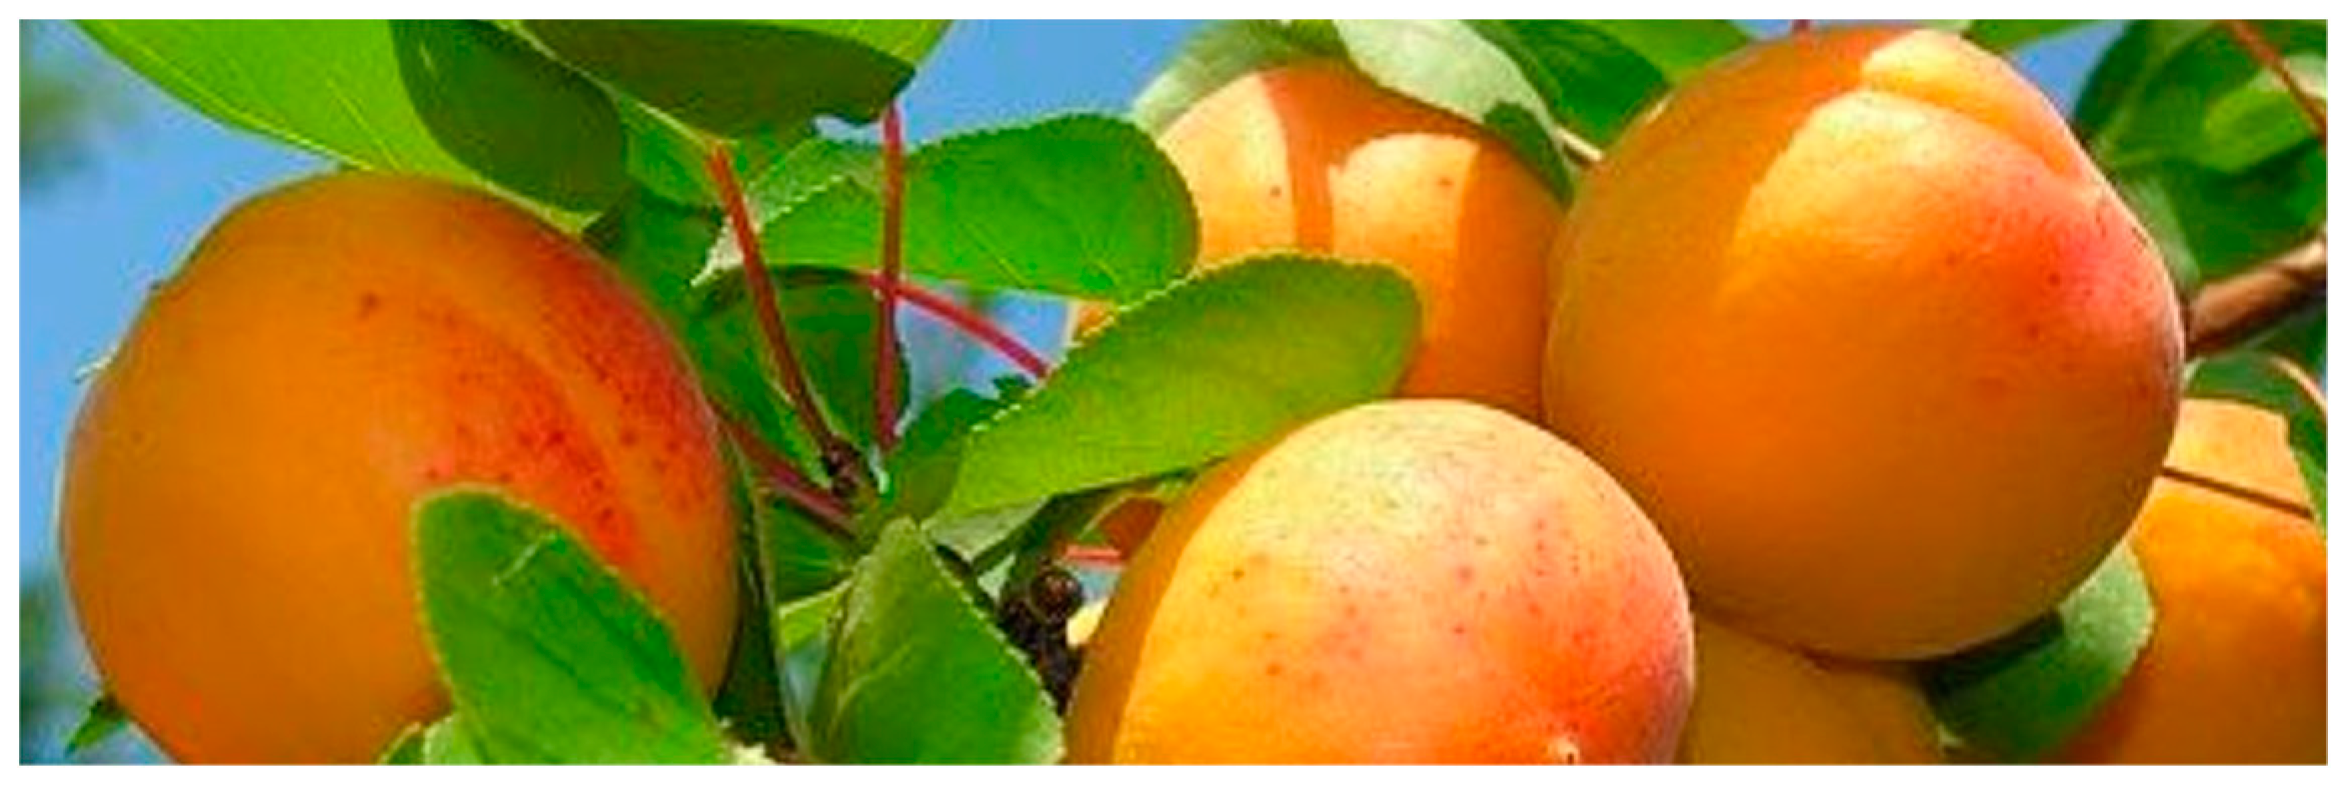
Apricot fruits “Mahtobi” (
Figure 2.) grown in Tajikistan were purchased in May month
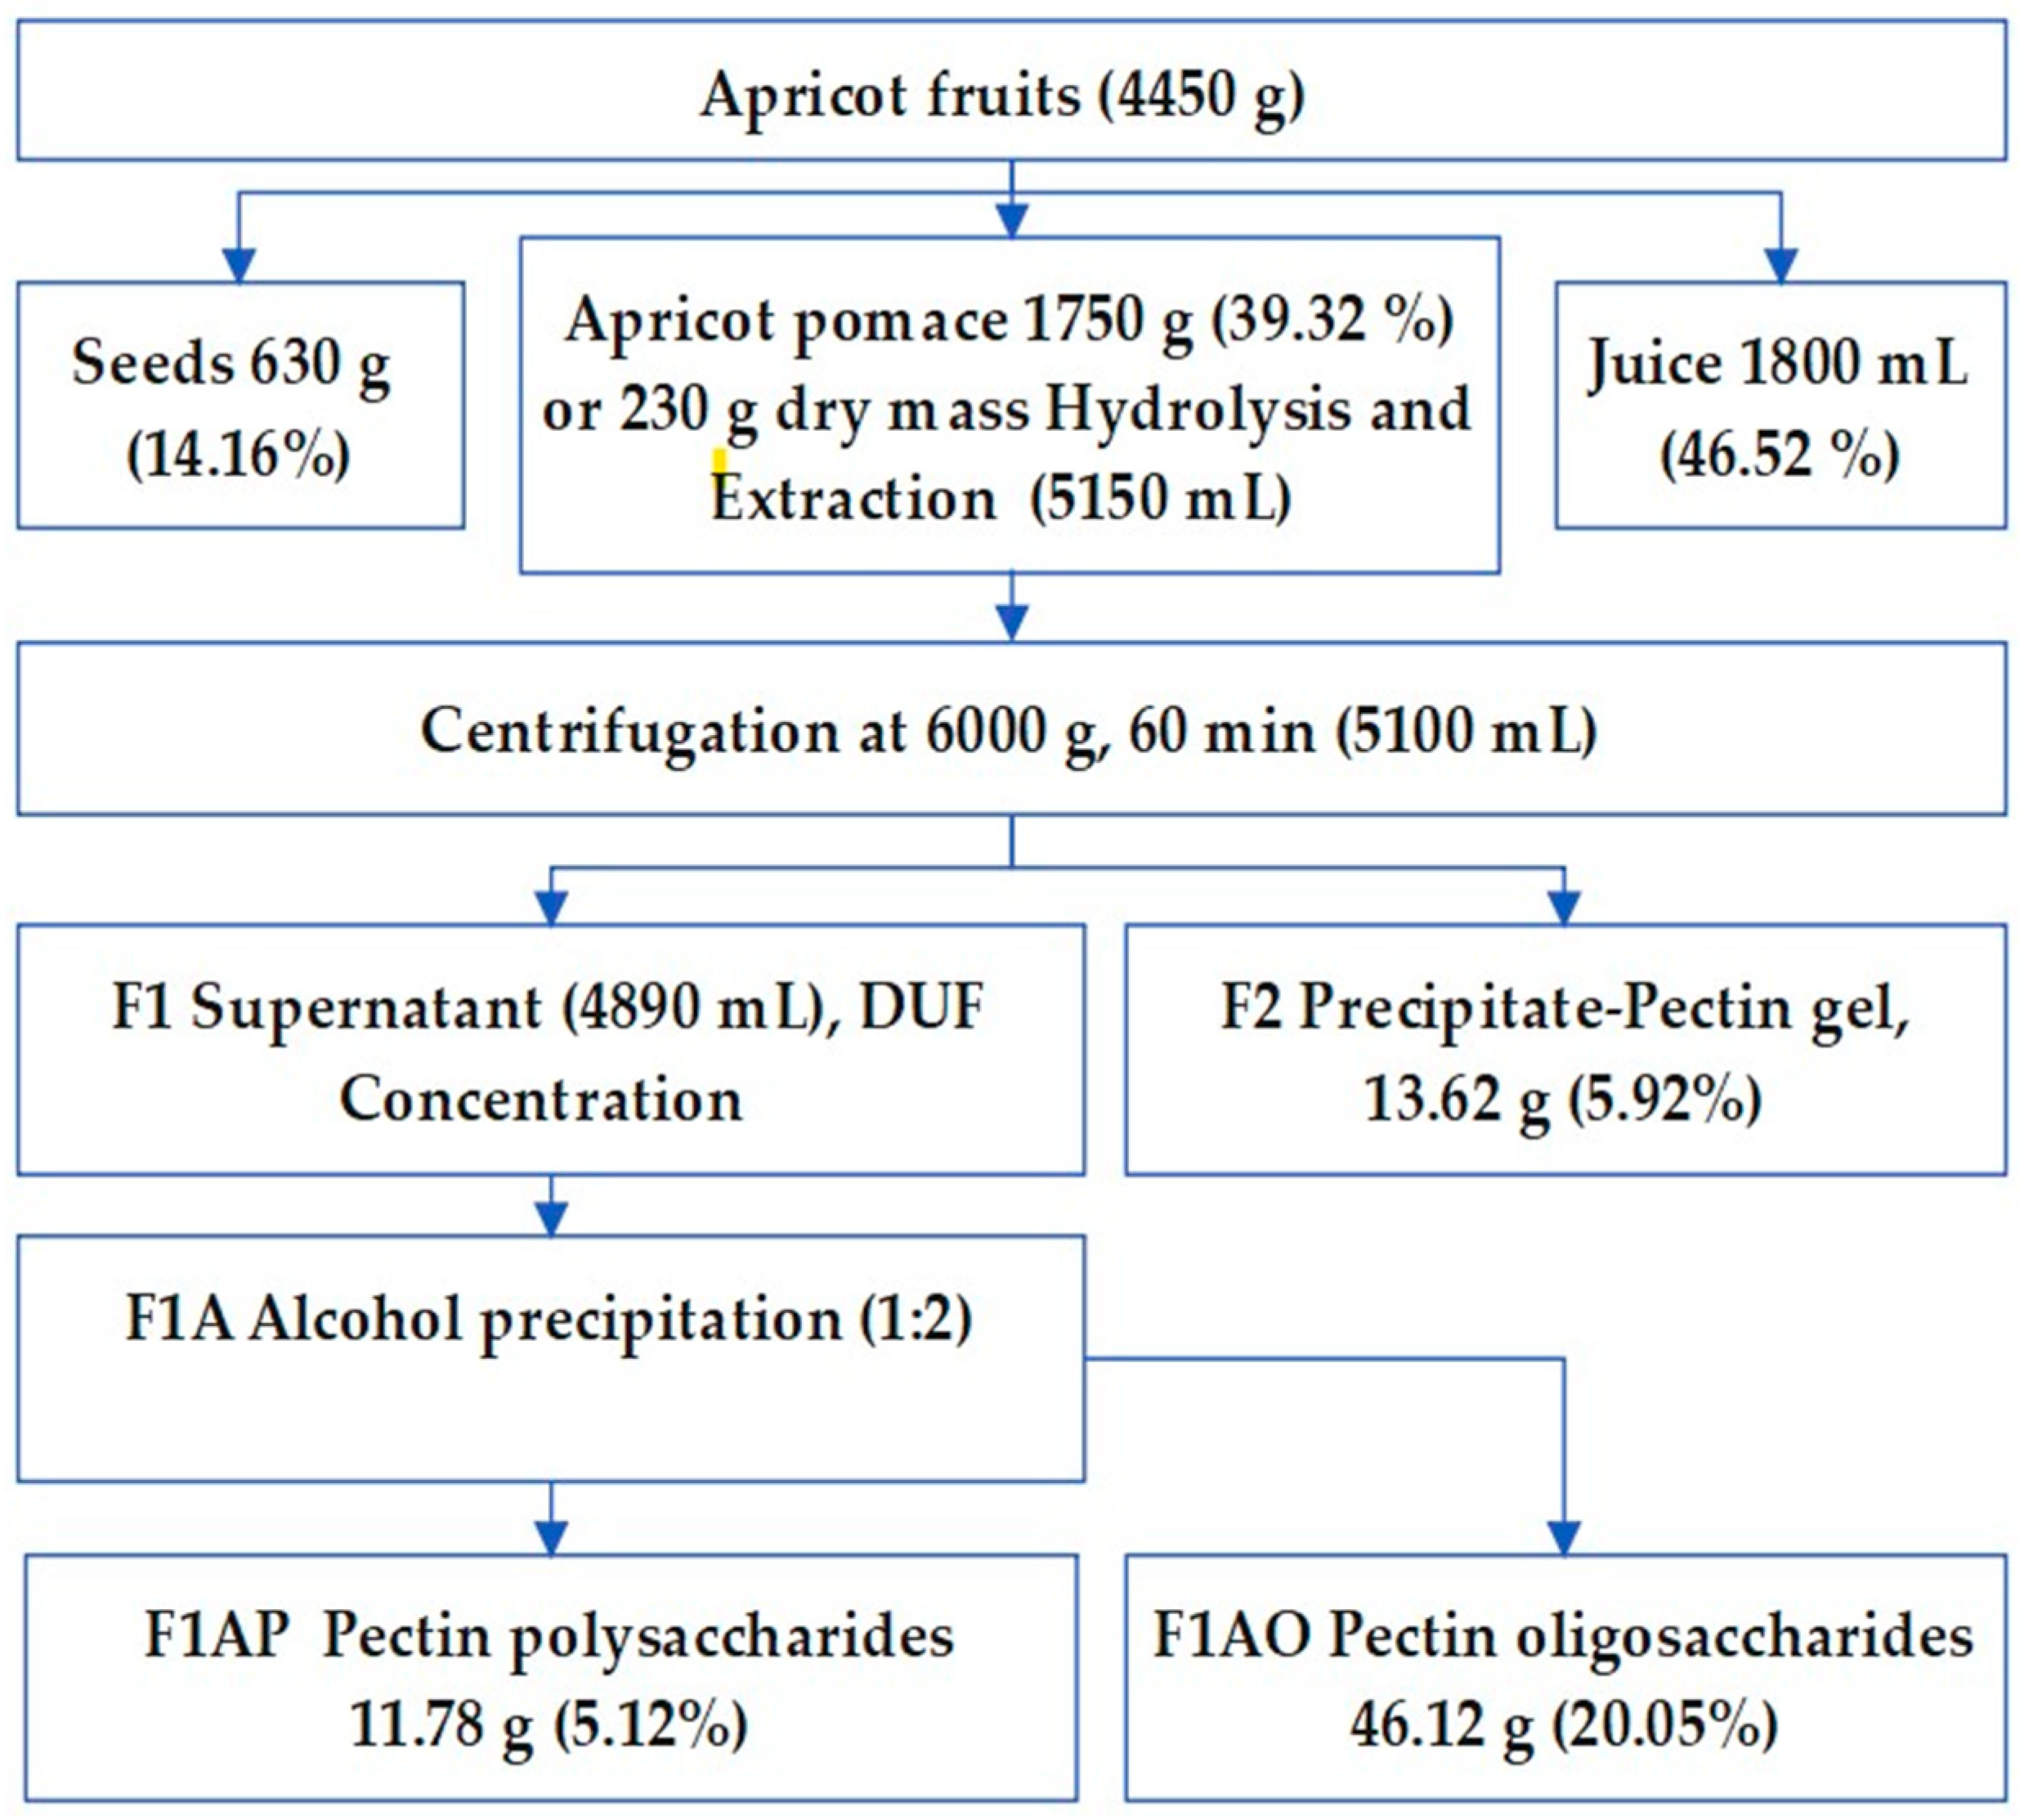
From fruits weighing 4450 were separated kernel (630 gr) and squeezed the juice (1800 mL). The residual mass of wet and dry mass of apricot fruit pomace accounted for 1750 and 250 grams respectively (
Figure 3). A hydrolysate solution from the rest of the cell was separated by filtration, then cooled with ice containers and neutralized to pH 3.4. The supernatant solution (fraction F1) and residual precipitate, microgel (F2) were separated by centrifuge.
Thus, a purified hydrolysate solution forced to the diaultrafiltration (DUF) via 100 KD PS membrane using the DUF systems (KrosFlo, USA) to separate and concentrate pectin polysaccharides, which further was extracted by alcohol precipitation (fraction F1AP), accounted for 5.12% of apricot dry mass. An alcoholic soluble fraction was concentrated on a rotary evaporator to obtain oligosaccharide and polyphenol (F1AO) (
Figure 3).
Permeate of PS 100KD (1500 ml) was undergo subsequent membrane filtration using two types of membrane: 5KD and 1Kd molar amass cut off (MCO) types respectively. The received concentrated solution of 5KD MCO further referred as F1B1 and it permeate as F1B2 consequently, the results not discussed in this work.
The deprotonated pectin polysaccharide has been further fractionated by anion-exchange chromatography as described early [
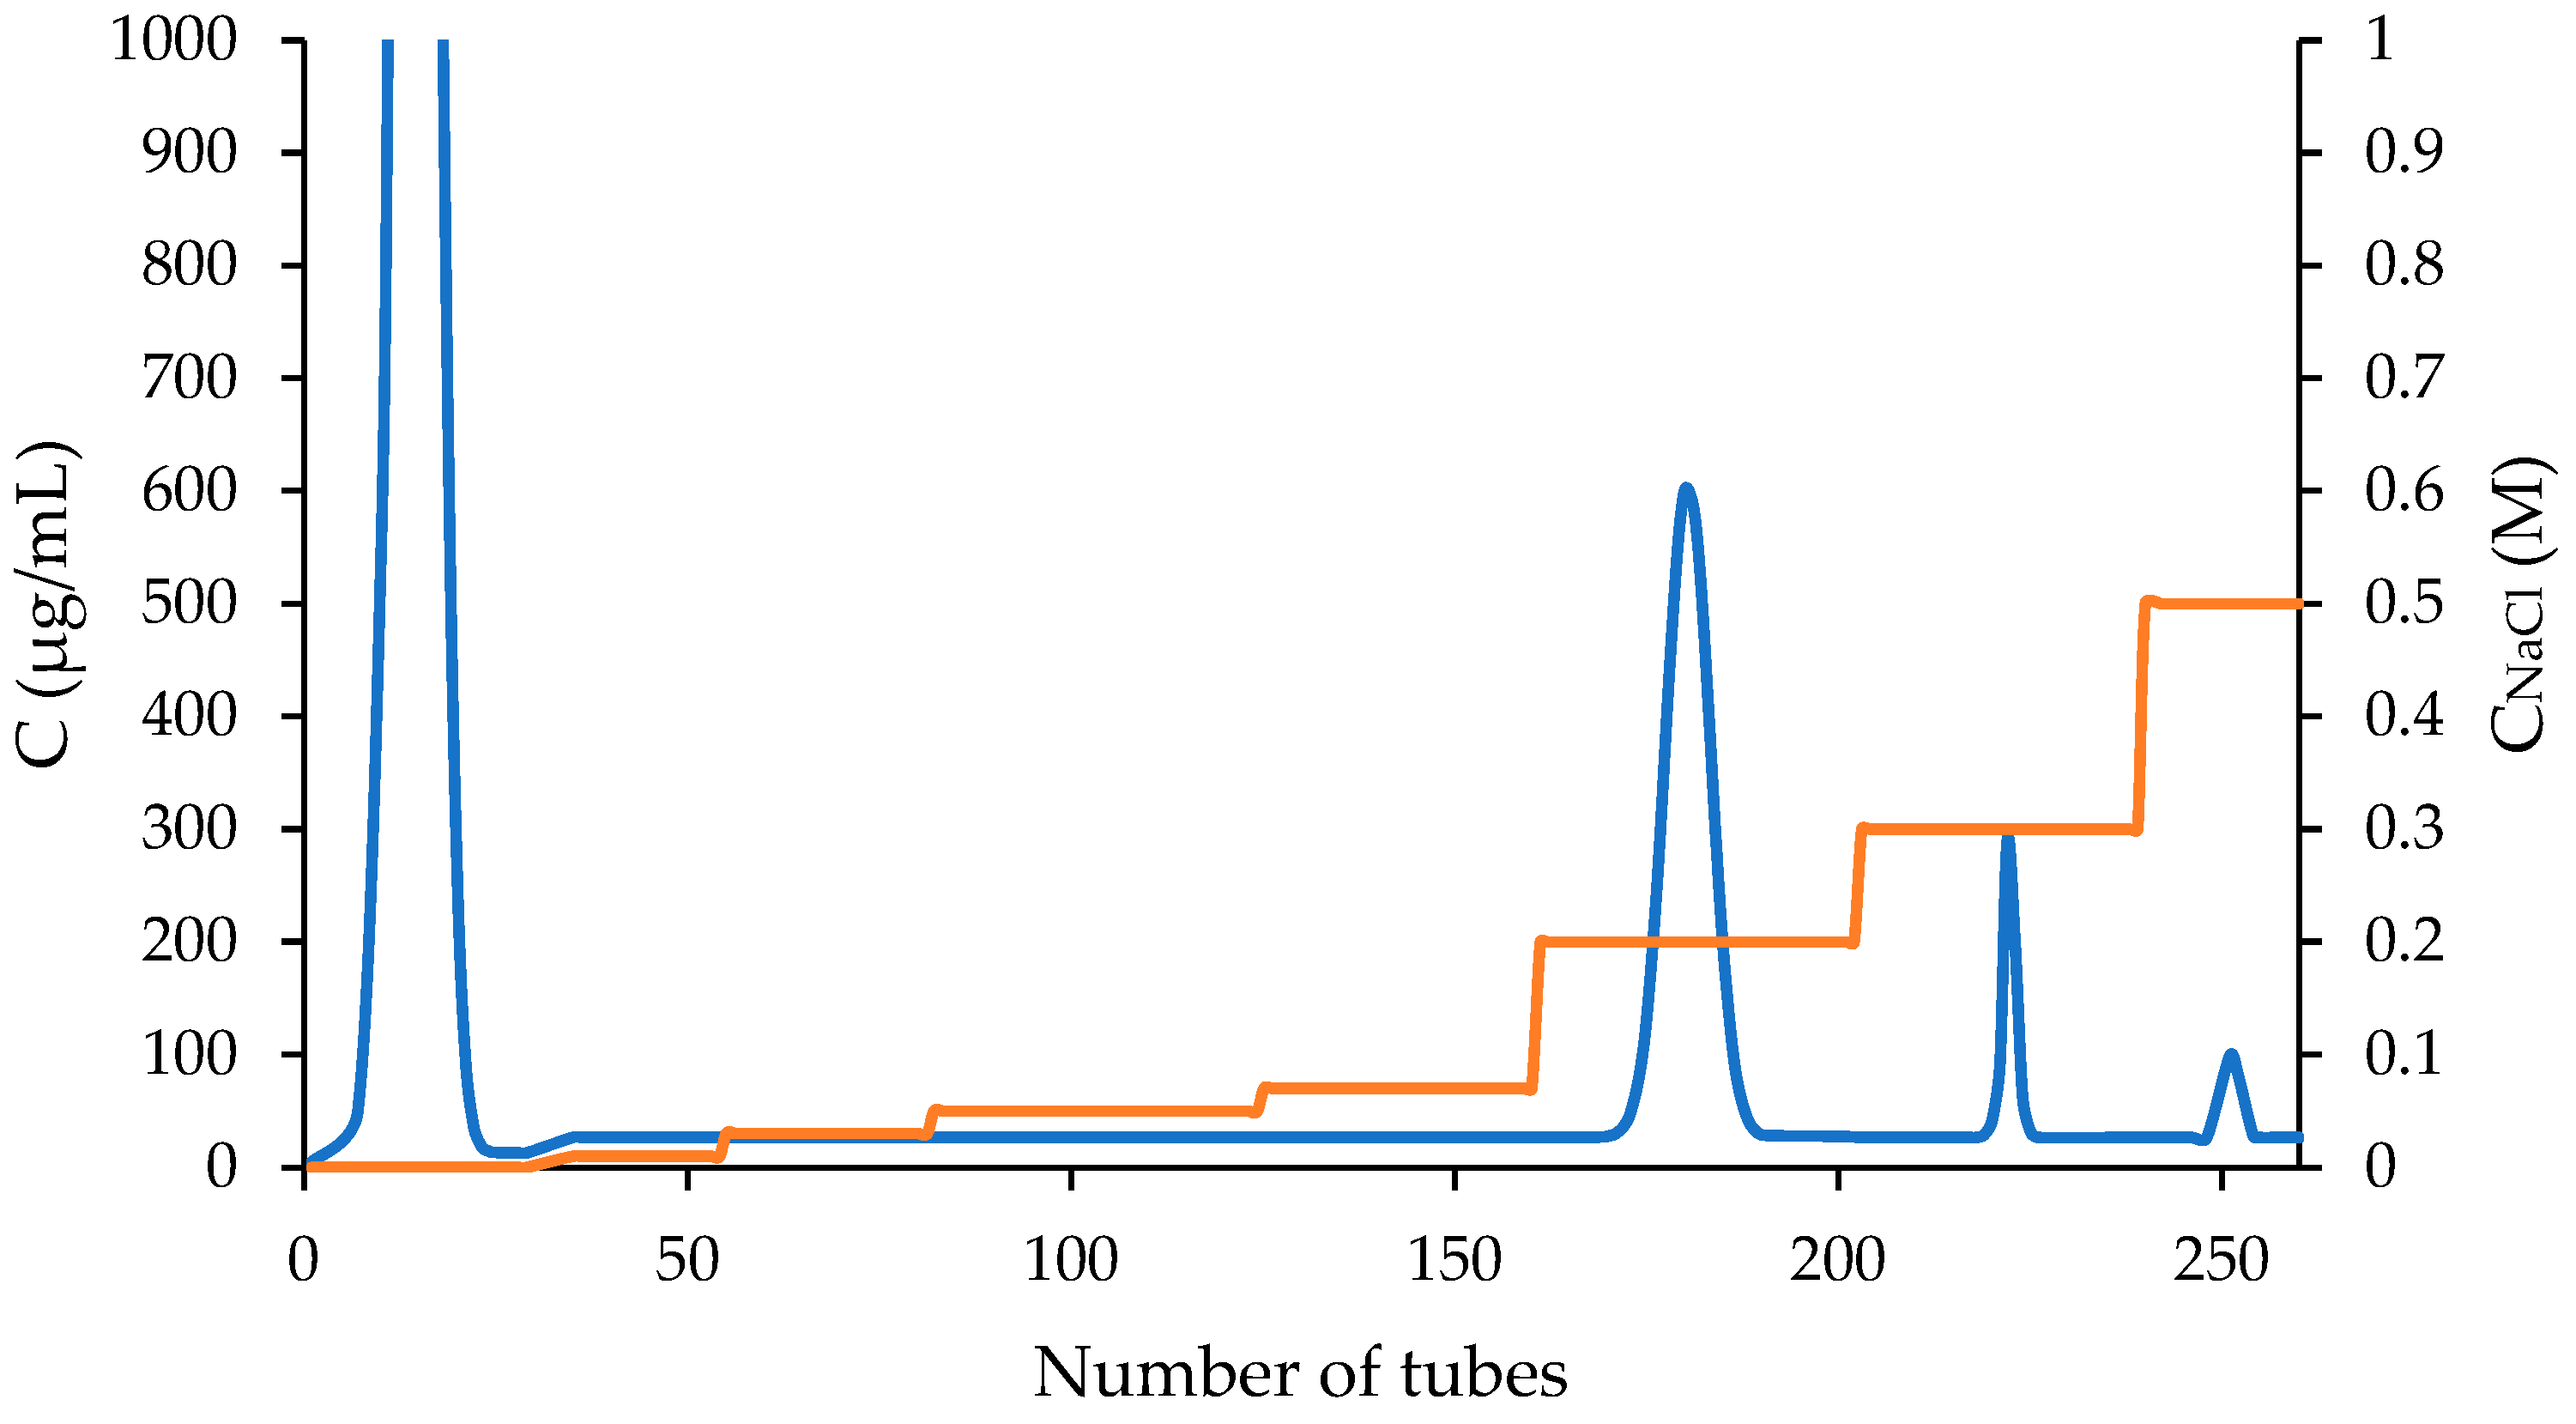
27]. Further refinement of the polysaccharides proceeded by loading on anion-exchange column of a DEAE Sepharose. The elution profile of the F1AP sample (tubes 1-34) with deionized water (
Figure 4) indicates that the main fraction of the apricot polysaccharide, having low negative charge, eluted from tubes 10 to 18 by water. The main polysaccharide components of apricot pectin eluted by water, which accounted for 67.14% of the F1AP, further named as F1AP1 fraction. It also shows the profile of the several fractions of polysaccharides, eluted from the DEAE Sepharose anion-exchange column by NaCl solutions of increasing ionic strength (0.01, 0.03, 0.05, 0.07, 0.2, 0.3, and 0.5) at a flow rate of 5 mL/min (
Figure 4). The next major polysaccharide components of apricot pectin polysaccharides eluted by 0.2 M NaCl, accounted for 22.85% and referred as F1AP6. This indicate that F1AP6 fraction has high negative charge that were retained on anion-exchange column.
Other five minor fractions with different charge density were eluted from the F1AP sample by the rising concentration of NaCl solutions of 0.01 M (tubes 35–54), 0.03 M (tubes 55–81), 0.05 M (tubes 82–124), 0.07 M (tubes 125–160), 0.2 M (tubes 161-202), 0.3 M (tubes 203-239), and 0.5 M (tubes 240-260). The remaining fractions were too small for extensive structural analysis.
2.2. Monosaccharide composition of Apricot pectin (F1AP), its main fractions F1AP1, F1AP6 and pectin oligosaccharides (F1AO)
The monosaccharide compositions of the original and two main fractions were analyzed by HPAEC-PAD. The original fraction (F1AP) composed of D-galacturonic acid, L-rhamnose, D-arabinose and D-galactose in a 1.0 : 0.1 : 0.36 : 0.12 molar ratio, respectively, which is consistent with a pectin RG-1 branched with arabinogalactan side chine poly-saccharides. The water-eluted fraction F1AP1 was found to have almost the same composition reviled to branched RG-1, while bounded on DEAE Sepharose anion-exchange polysaccharide might belong to the HG reigns of pectin polysaccharides. The alcohol soluble fraction comprises 93.26 % D-glucose with some impurities of related monosaccharides, mostly of arabinose and xylose trace.
Table 1.
Monosaccharide composition (%) of the apricot F1AP, F1AP1 and F1AP6.
Table 1.
Monosaccharide composition (%) of the apricot F1AP, F1AP1 and F1AP6.
| Apricot pectin |
Glc |
Man |
Ara |
Gal |
Xyl |
Rha |
Fuc |
GalA |
GlcA |
| F1AP |
2.93 |
0 |
21.3 |
6.83 |
2.32 |
5.4 |
0.4 |
59.7 |
1.1 |
| F1AP1 |
0.98 |
0 |
25.8 |
5.61 |
1.60 |
6.9 |
0.4 |
58.1 |
0.8 |
| F1AP6 |
0.13 |
0 |
8.47 |
3.66 |
0.50 |
2.1 |
0.2 |
83.9 |
1.0 |
| F1AO |
93.26 |
0.94 |
2.95 |
0.58 |
1.25 |
0.31 |
0.03 |
0.36 |
0.33 |
As seen from this table, Ara, Gal, and Rha were dominant sugars in the apricot pectin, while other monosaccharides like xylose, glucose, and fucose were present in minor amounts. The higher amount of arabinose is peculiar to the apricot pectin. However, this pectin, compared to other studied apricot species [
28], is distinguished on mannose quantity. This pectin has no or very minor quantity of Man. It is visible that after fractionation, moving from the original F1AP to the fraction eluted by water from DEAE anion exchange columns F1AP1, the content of Ara and Rha increased. The fraction linked to the DEAE, eluted by 0.2M NaCl, exhibited a higher content of GalA (83.9%) residue with a reduced quantity of neutral sugars. From monosaccharide composition analysis, the F1AP1 attributed to the RG-1 pectin, bearing arabinogalactan side chain. In other hand the fraction eluted by 0.2 M, NaCl dominated by the HG regions of pectin polysaccharides.
The study of the cell wall matrix polysaccharides contents using sequential solubilization and antibody-based approaches in association with anion-exchange chromatography analysis indicates that in all cases, solubilized polymers include spectra of HG molecules with unesterified regions that are separable from methyl esterified HG domains [
15]. In highly soluble fractions, RG-I domains exist in both HG-associated and non HG-associated forms.
We can preliminarily conclude that the studied pectin fraction F1AP1 is mainly composed of L-Ara and D-Gal, L-Rha, and D-GalA, as expected, forming a water-soluble complex of RG-I with an arabinogalactan side chain. Another fraction, F1AP6, contains highly charged HG residues, likely RG-II residues with AG side chains that represent the pectic polysaccharides in the cell wall of Apricot fruits.
2.3. Analysis of ATR-FTIR spectra of Apricot pectin polysaccharides
Apricot pectin polysaccharide samples, in the form of dry powder, were stored in P2O atmosphere before analysis. ATR-FTIR spectra data (4000 to 600 cm-1) were acquired at room temperature in a NicoletTM iSTM 50 FTIR (Thermo Fisher Scientific).
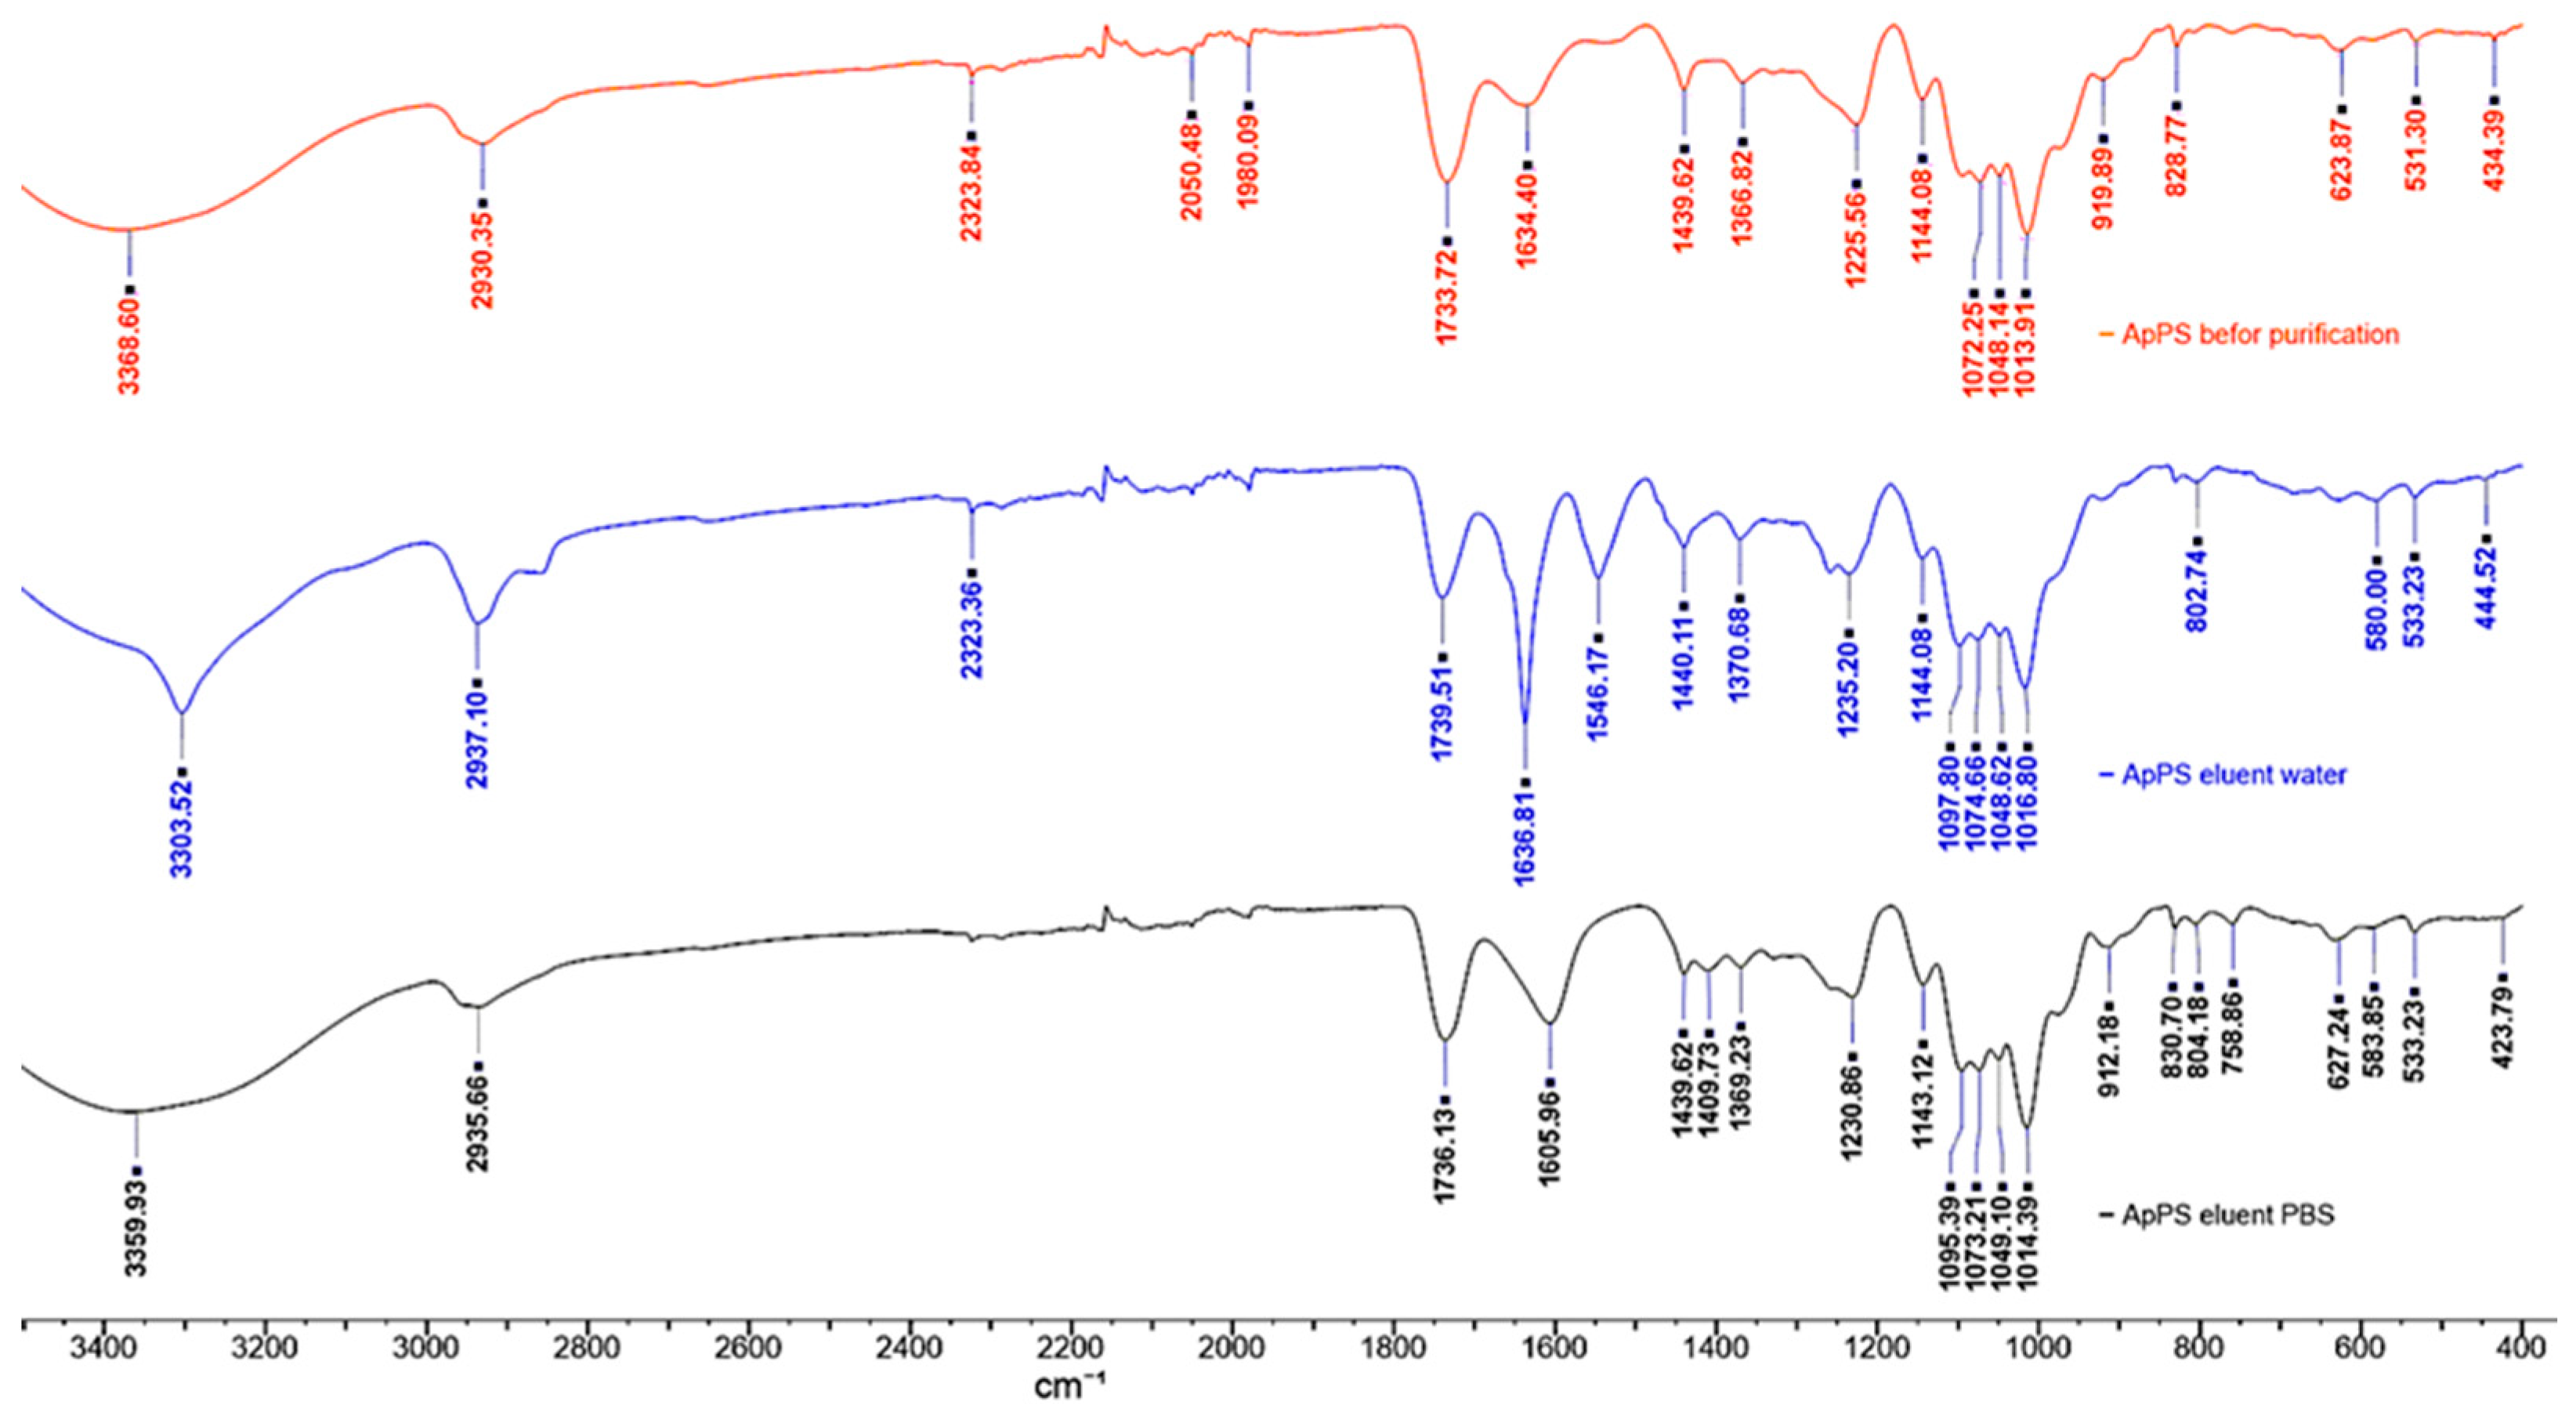
Figure 5.
Comparison of ATR-FTIR spectra of Apricot pectin polysaccharides in region of 4000-400 cm-1.
Figure 5.
Comparison of ATR-FTIR spectra of Apricot pectin polysaccharides in region of 4000-400 cm-1.
Relevant wavenumbers were highlighted for each pectin samples: The 4000 to 2100 cm
-1 spectral region is dominated by the broad and intense O-H stretching band of hydroxyl groups, overlapped with the C-H stretching bands. The broad shoulder near 2550 cm
-1, observed only in water eluted F1AP1 fraction may be assigned to the O-H stretching vibration in free carboxyl groups [
29]. The two strong bands in the 1750-1500 cm
−1 region are assigned to stretching vibration modes of carbonyl groups from esterified D-GalA units and free carboxylate groups, respectively [
30]. Herewith, absorbance at the 1733-1739 cm
-1 attributed to the ν(C=O) esterified and that at the 1605-1636 cm
-1 belong to free acid and ionized carboxyl group of pectin fractions according to the D-GalA unit environments and its degree of methylation.
The main CHx and C-O-H deformation modes appear partially overlapped, in the 1500-1200 cm
−1 region The characteristic bending asymmetric vibration of δas(CH
3) methyl group appears in the region of 1439 cm
−1 and symmetric vibration of δs(CH
3) acetyl grout in the region of 1366-1370 cm
−1 . The new weak peak at the 1409 cm
−1 of F1AP6 in combination of peeks at the 1231 and 1073 can be assigned to presence of RG-1 [
31].
The absorption bands in fingerprinted region, overlapped bands observed in the 1200-950 cm
−1 characteristics for stretching asymmetric vibration of pyranose C-O-C and are characteristic of the pectin backbone and side groups. The band at 1144 cm
−1 is assigned to the C-O-C stretching vibrations of the α-1,4-D-glycosidic bonds in the HG chains. The strong bands at 1014 cm
-1 in IR spectra of the of original F1AP and F1AP6 are due to skeletal stretching modes of the pyranose rings in D-GalA and L-Rha residues, present both in HG and RG regions. In case of F1AP1 fraction was moved to upper filed at 1018 cm
-1 due to predominance of HG region in this fraction. The other two parallel bands, at 1072 and 1048 cm
−1, in the original pectin occur at 1097 and 1074 cm
−1 in the IR spectra of F1AP1 and F1AP 6 fractions, result from neutral sugars in the side chains of RG-I and are assigned to the same stretching modes of L-arabinosyl and D-galactosyl units, respectively [
31,
32,
33,
34]. In aqueous solutions, Kacurakova et al. (2000) observed bands at 1070 and 1043 cm
-1 for rhamnogalacturonan, 1072 cm
-1 for galactan and 1039 cm
-1 arabinan, which were too close for reliable discrimination [
35]. These differences may be due to the different states (solid or solution) of the cell wall compounds and probably also to the specificity of the used spectrometers. For pectic homogalacturonans with more or less methylation, the main characteristic peaks (especially 1740, 1600, 1097 and 1014 cm
−1) were stable regardless of whether they are in a solid crystalline state or in an aqueous solution [
31].
Some band positions were affected by macromolecular arrangements. In fact, the key monosaccharides, galactose (Gal) and arabinose (Ara), were shown to have intense peaks at about 1074 and 1048 cm-1. The variable region was identified to be at about 1134-1094 cm-1 and 900-819 cm-1 and was probably due to compositional and structural differences between pectin polysaccharides fractions.
We ought to note that apricot pectin entails a complex group of heteropolysaccharides containing different covalently interlinked pectic polysaccharide types, of which HG, RG-I, and, to a lesser extent, type II rhamnogalacturonan (RG-II) and xylogalacturonan (XGA) are the most common. Therefore, the application of ATR-FTIR could sometimes remain limited for linkage structural elucidations due to the complexity of overlapping spectra bands and vibrational coupling from the enormous diversity of CWP chemical bonds.
From IR spectra it is possible to evaluate the degree of esterification of carboxyl group of pectin fractions. The degree of esterification of pectin (percent of methyl-esterified carboxyl groups) was determined by the using an approach provided by calculated simply by using the intensity of the asymmetric stretching of CH
3 at 1440 cm
-1 relative to a backbone vibration at 1010 cm
-1 [
36].
From these results it is clear that solubilization of F1AP1 fraction influenced by DE of pectin. However, additional information would be needed to determine the exact reason for this variation.
2.4. Analysis of molar mass and molar mass distributions (MMD) of Apricot pectin polysaccharides by size exclusion chromatography (SEC)
The pectin molar mass and molar mass distribution (MMD) were measured by high-performance size exclusion chromatography (HPSEC) using multi-detection systems. (Materials and Methods, section 3.2). The brief molar mass and MMD analyzes of main Apricot pectin and its fine fraction, as described previously with the aid of HPSEC by MALLS [
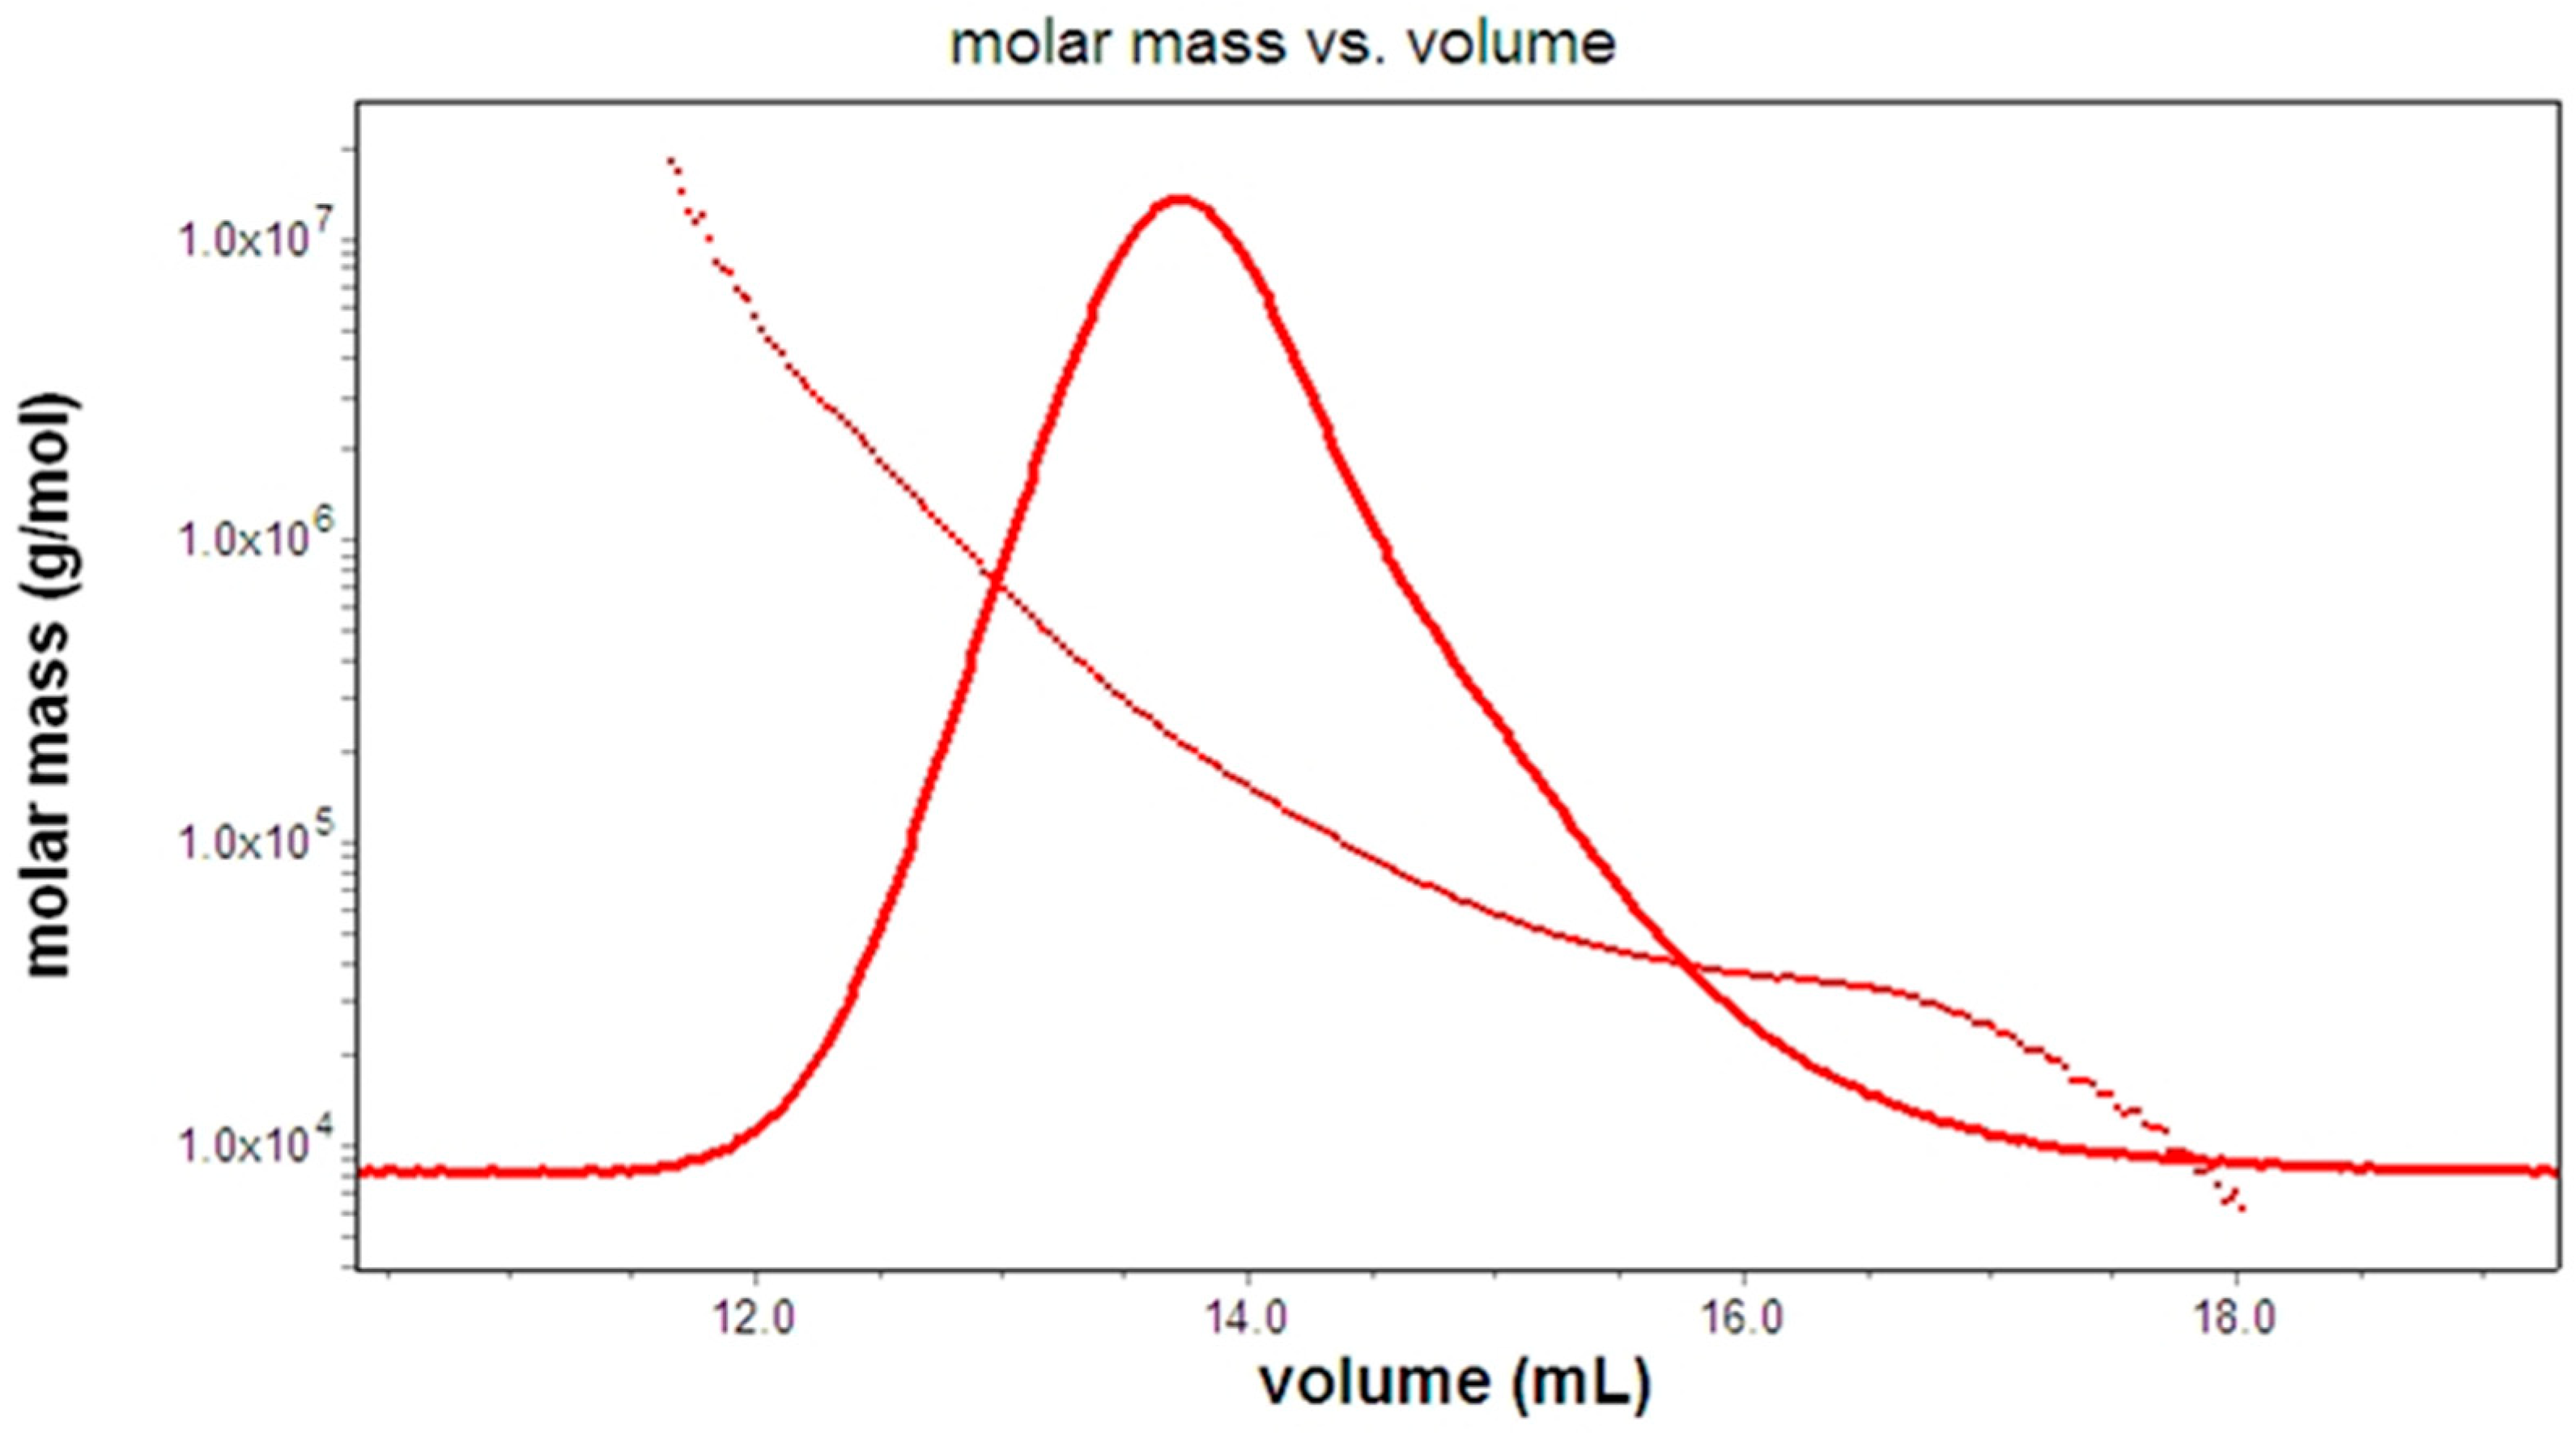
27], are provide in this work. The F1AP LS chromatogram main peak 1, eluted at 12.3-16.6 mL and represented 77.5% of the molar weight (
Figure 6). The LS of MALLS shows non symmetric peak, a bimodal distribution at least of two fractions in the Apricot pectin.
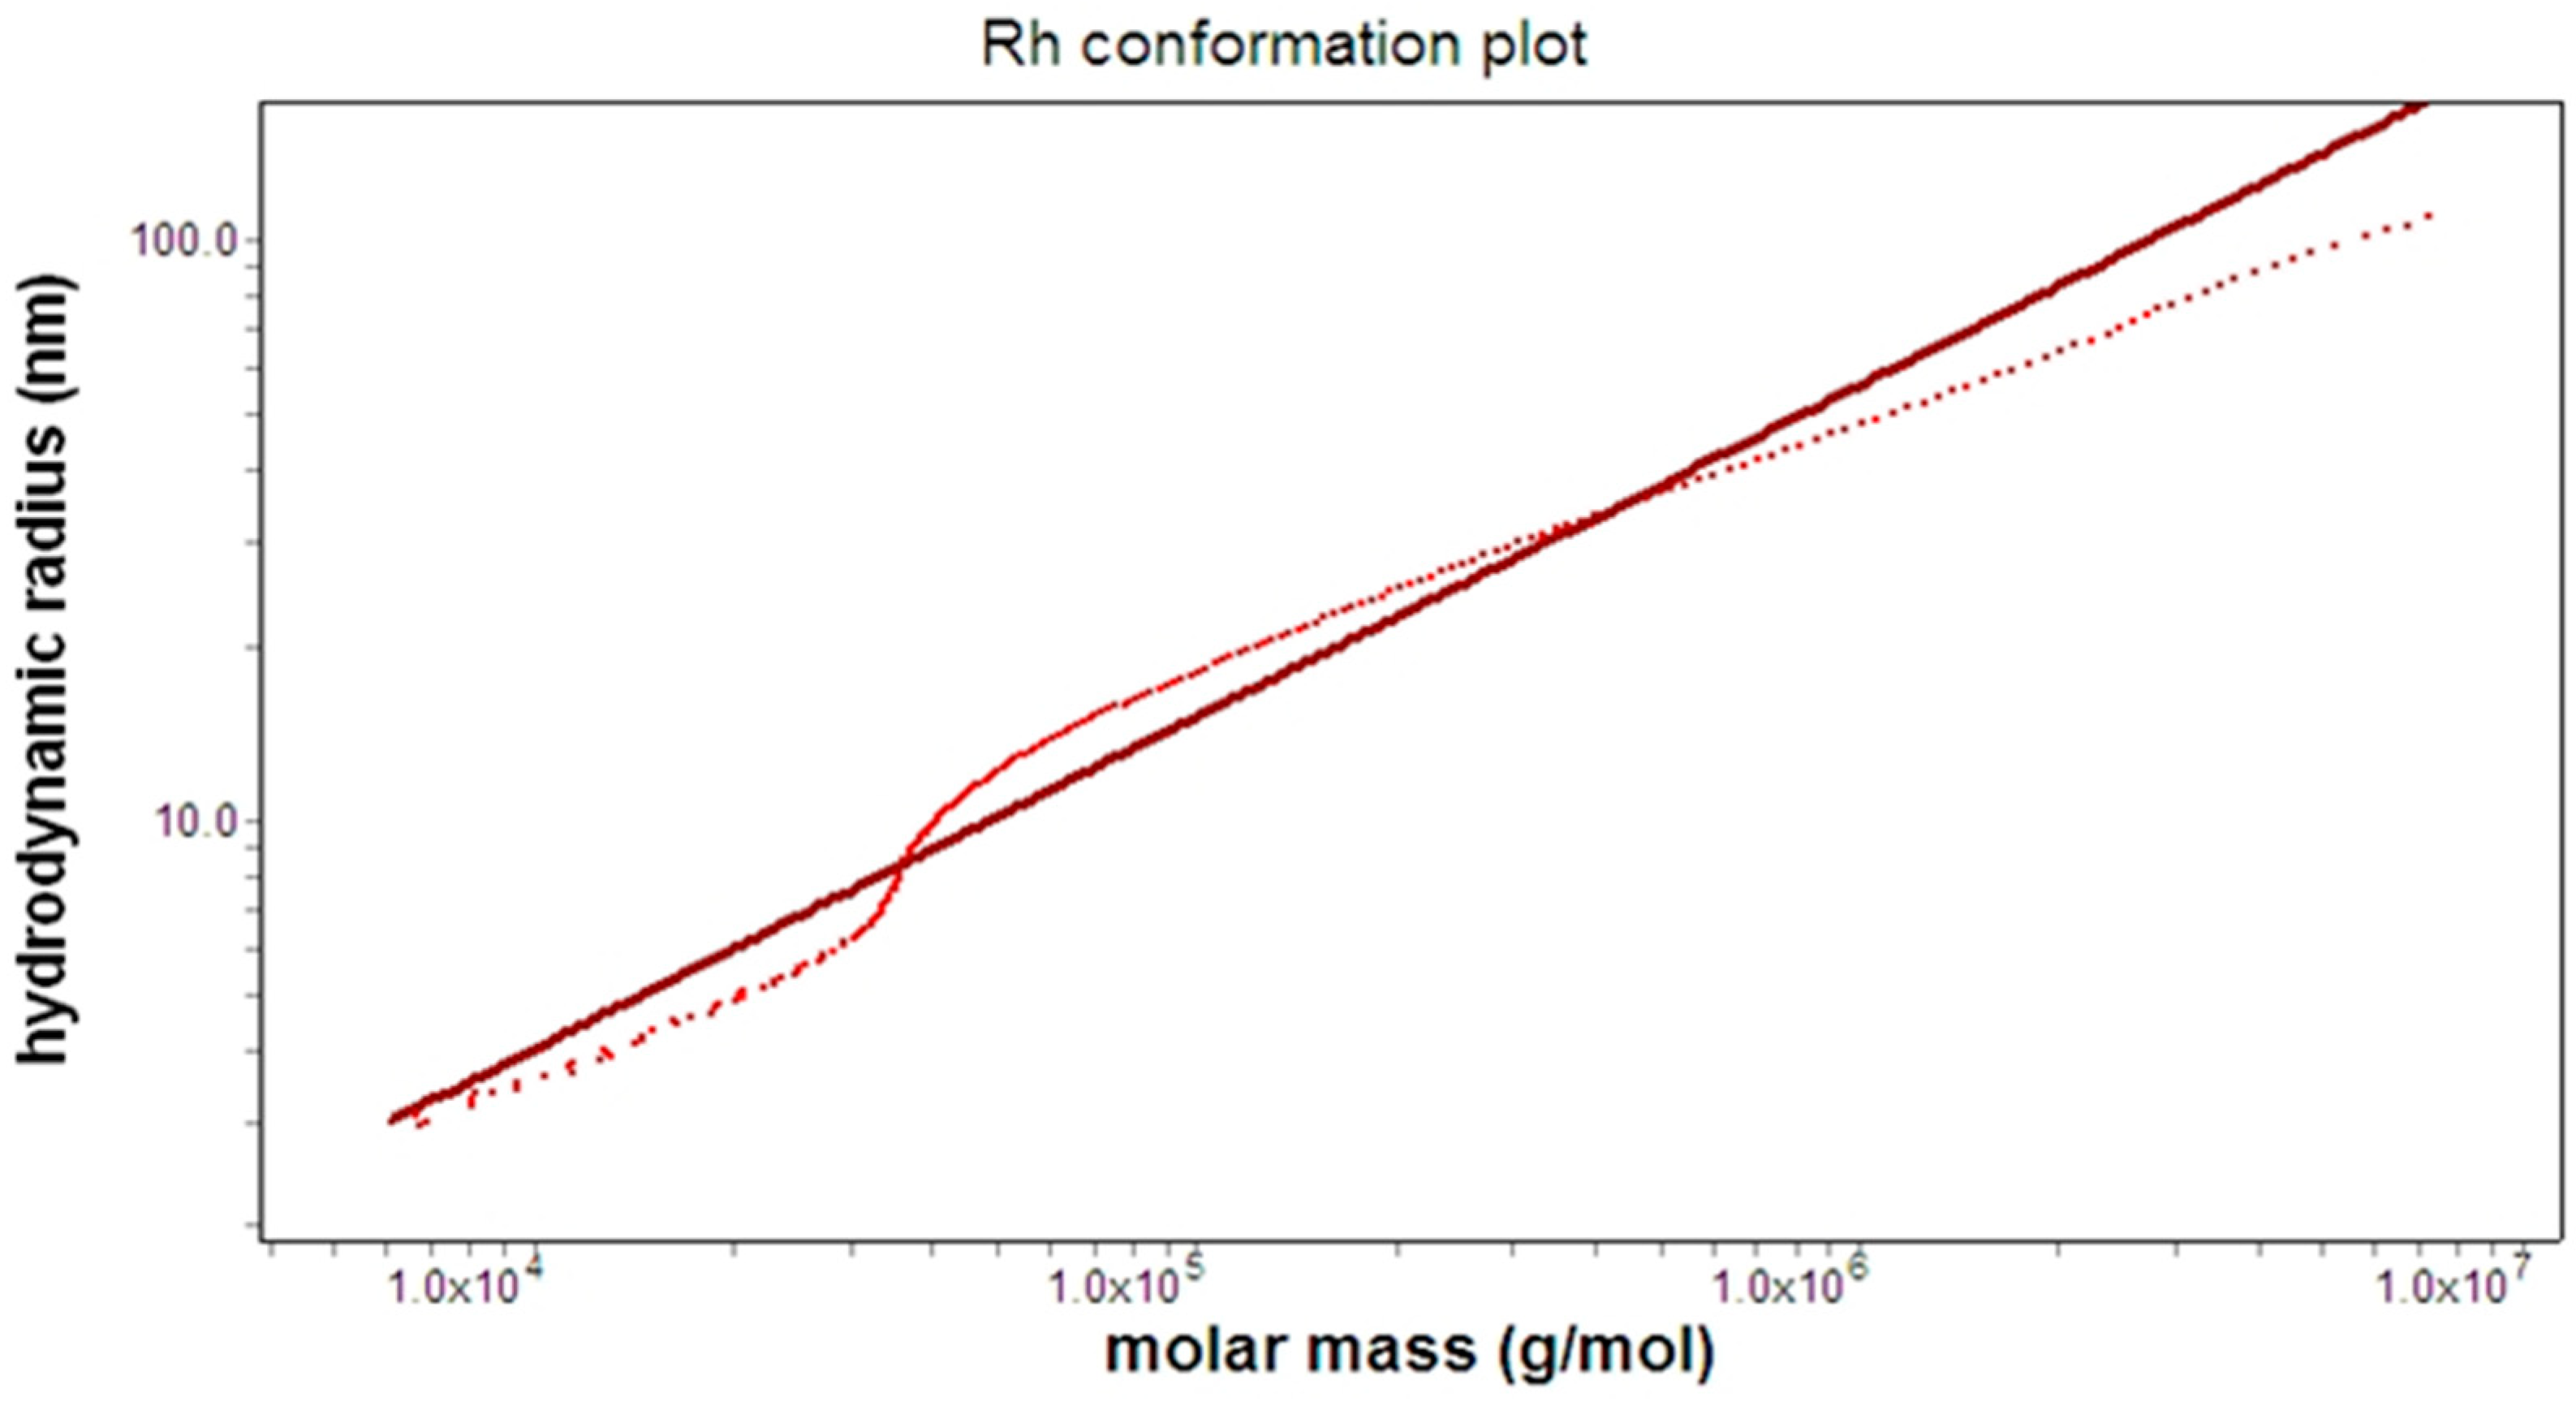
The shapes and forms of the macromolecules were assessed based on their measured molar masses and their hydrodynamic radii, as obtained from their intrinsic viscosity. The dependence of molar mass and hydrodynamic radius (R
h conformation plot) were analyzed by the ASTRA software (V.7.1.2.5, Wyatt Technology). The slope of this graph allows one to estimate the shape of a homogeneous polymer [
26,
27]. In the case of a heterogeneous polymer, the relationship between the slope and the molecular shape is somewhat more complicated as indicated in
Figure 7 for a F1AP sample.
Table 2 displays the results of the measurements of the polydispersity (M
w/M
n, M
z/M
n), number average molar mass (Mn), weight average molar mass (M
w), z-average molar mass (M
z), intrinsic viscosity [η
w], hydrodynamic radius [R
h], from each sample. A distinct bimodal peak is observed in the DV and IR chromatograms of original F1AP pectin, as compared to F1AP1 and F1AP6 fractions. The F1AP1 versus F1AP6 data analyzed as a single peak for the total chromatograms had following M
w, η
w, R
h values, 1945:117 kDa, 426:158 mL/mg and 64.3:30.0 nm, respectively.
Pectin oligosaccharides fraction had lower molar mass (3.55 kDa) low viscosity (1.6 mL/mg) and relatively low polydispersity (1.85).
The value of ηw, Rh of F1AP6 lower in two time than those of F1AP1 indicating different conformation of pectin fractions. This is consistent with pectin’s macromolecule monomer compositions.
Estimated low value of stiffness (flexibility) coefficient 0.57 and 0.48 shows compact flexible coil and random coil conformation for original Apricot pectin and its water-soluble fraction (F1AP1). This analysis indicates the presence of more extend conformations in polysaccharides fraction extracted from DEAE cellulose anion exchange resin by salt solution. The difference in the slope of F1AP1 vs F1AP6 indicates its structure diversity, as follows from its monosaccharide composition. At the same time, F1AP6 has more homogeneity in structure rod-like molecular shapes (b=0.78), which agrees with the high content of galacturonic acid residues (GalA) in this fraction (
Table 1). The chain stiffness of the original Apricot pectin and its F1AP1 fraction, except F1AP6 fraction, have similar conformations to those found previously for studied pectin poly-saccharides from different origin dominance with RG regions [
26,
37]. The conformation of F1AP6 fraction is close to that of sunflower pectin, which contains high HG regions.
A combination analysis of pectin conformations together with pectin GalA content (
Table 1) and its DE in RG-I backbone studied by other authors [
38,
39] indicate that, the elevated degree of GalA esterification in the high-molar mass fraction (F1AP1) would be expected to reduce calcium cross-linking, thus hindering the formation of an open, well-spaced pectin network in the solution. Alternatively, the lower negative charge of GalA region might increase intermolecular interactions between HG chains or between HG and RG-I or RG-II thus facilitating aggregation. The high degrees of methylesterification of the polysaccharide promote intermolecular hydrophobic interactions.
2.2. Carbohydrate Methylation Analysis of the Apricot pectin
The methylation analysis was demonstrated only for original purified apricot pectin, F1AP sample in according with methods detailed by Heiss et al., 2009 [
40]. Relative percentage of each detected linkage in F1AP sample, generated from Total Ion Chromatogram of the partially methylated alditol acetates (PMAA) derivatives (
Figure S1). The results of the major glycosyl linkage compositions are presented in
Table 3. From this Table, it is clear that the main polysaccharide backbone of apricot pectin was comprised of 4-, 3-, and terminal (t) linked Galactopyranosyl uronic acid residues (GalpA, 69.04 %); 2-, 2,3- 2,4- linked Rhamnopyranosyl residues (Rhap, 6.19%,); t-, 2-, 3-, 5- linked Arabinofuranosil (Araf, 5.32%); t-, and 3- linked Arabinopyranosyl residues (Arap, 4.72%); t-, 2-, 3-, 4-, 6-, 3,6-, 4,6- linked Galactopyranosyl residue (Galp, 9,17%). These sugar residues almost accounted for 94,44 % of PMAA from hydrolysate of pectin polysaccharides in Apricot pectin.
The rest monosaccharide residues reflected trace amounts the 4- and 4,6- linked Glucopyranosyl residue (Clcp, 4.23%), and t-, 2- and 4-linked xylopyranosyl (1,01%), which were indicative of Xylogalacturonan fragments resulted from hemicellulose by flash hydrolysis. The existence of t-Clcp residues (1.69%) because of starch or endosperm sugars.
A different linkage proportion of Arap, Araf and Galp residues was postulated as highly branched arabinan and galactan short side chains. This three-type side chain should be attached to the backbone of RG-I at C(O)3 and C(O)4 positions because of the presence of 2,3- and 2,4-linked Rhap residues resulted from methylation analysis.
The number of terminal Araf, Rhap and Clcp residues was approximately equal to the number of branched residues, suggesting that the methylation process used was effective. Besides, it indicated a correlation between terminal and branched residues. The backbone and branch of original F1AP pectin contained multiple linkage types and the most common derivatives were consistent with the monosaccharide composition identified via HPAE-PAD method.
3.1. NMR Spectroscopy
3.1.1. NMR analysis of original Apricot pectin (F1AP sample)
The 2D-HSQC spectrum was acquired both at 45 °C and 80 °C.
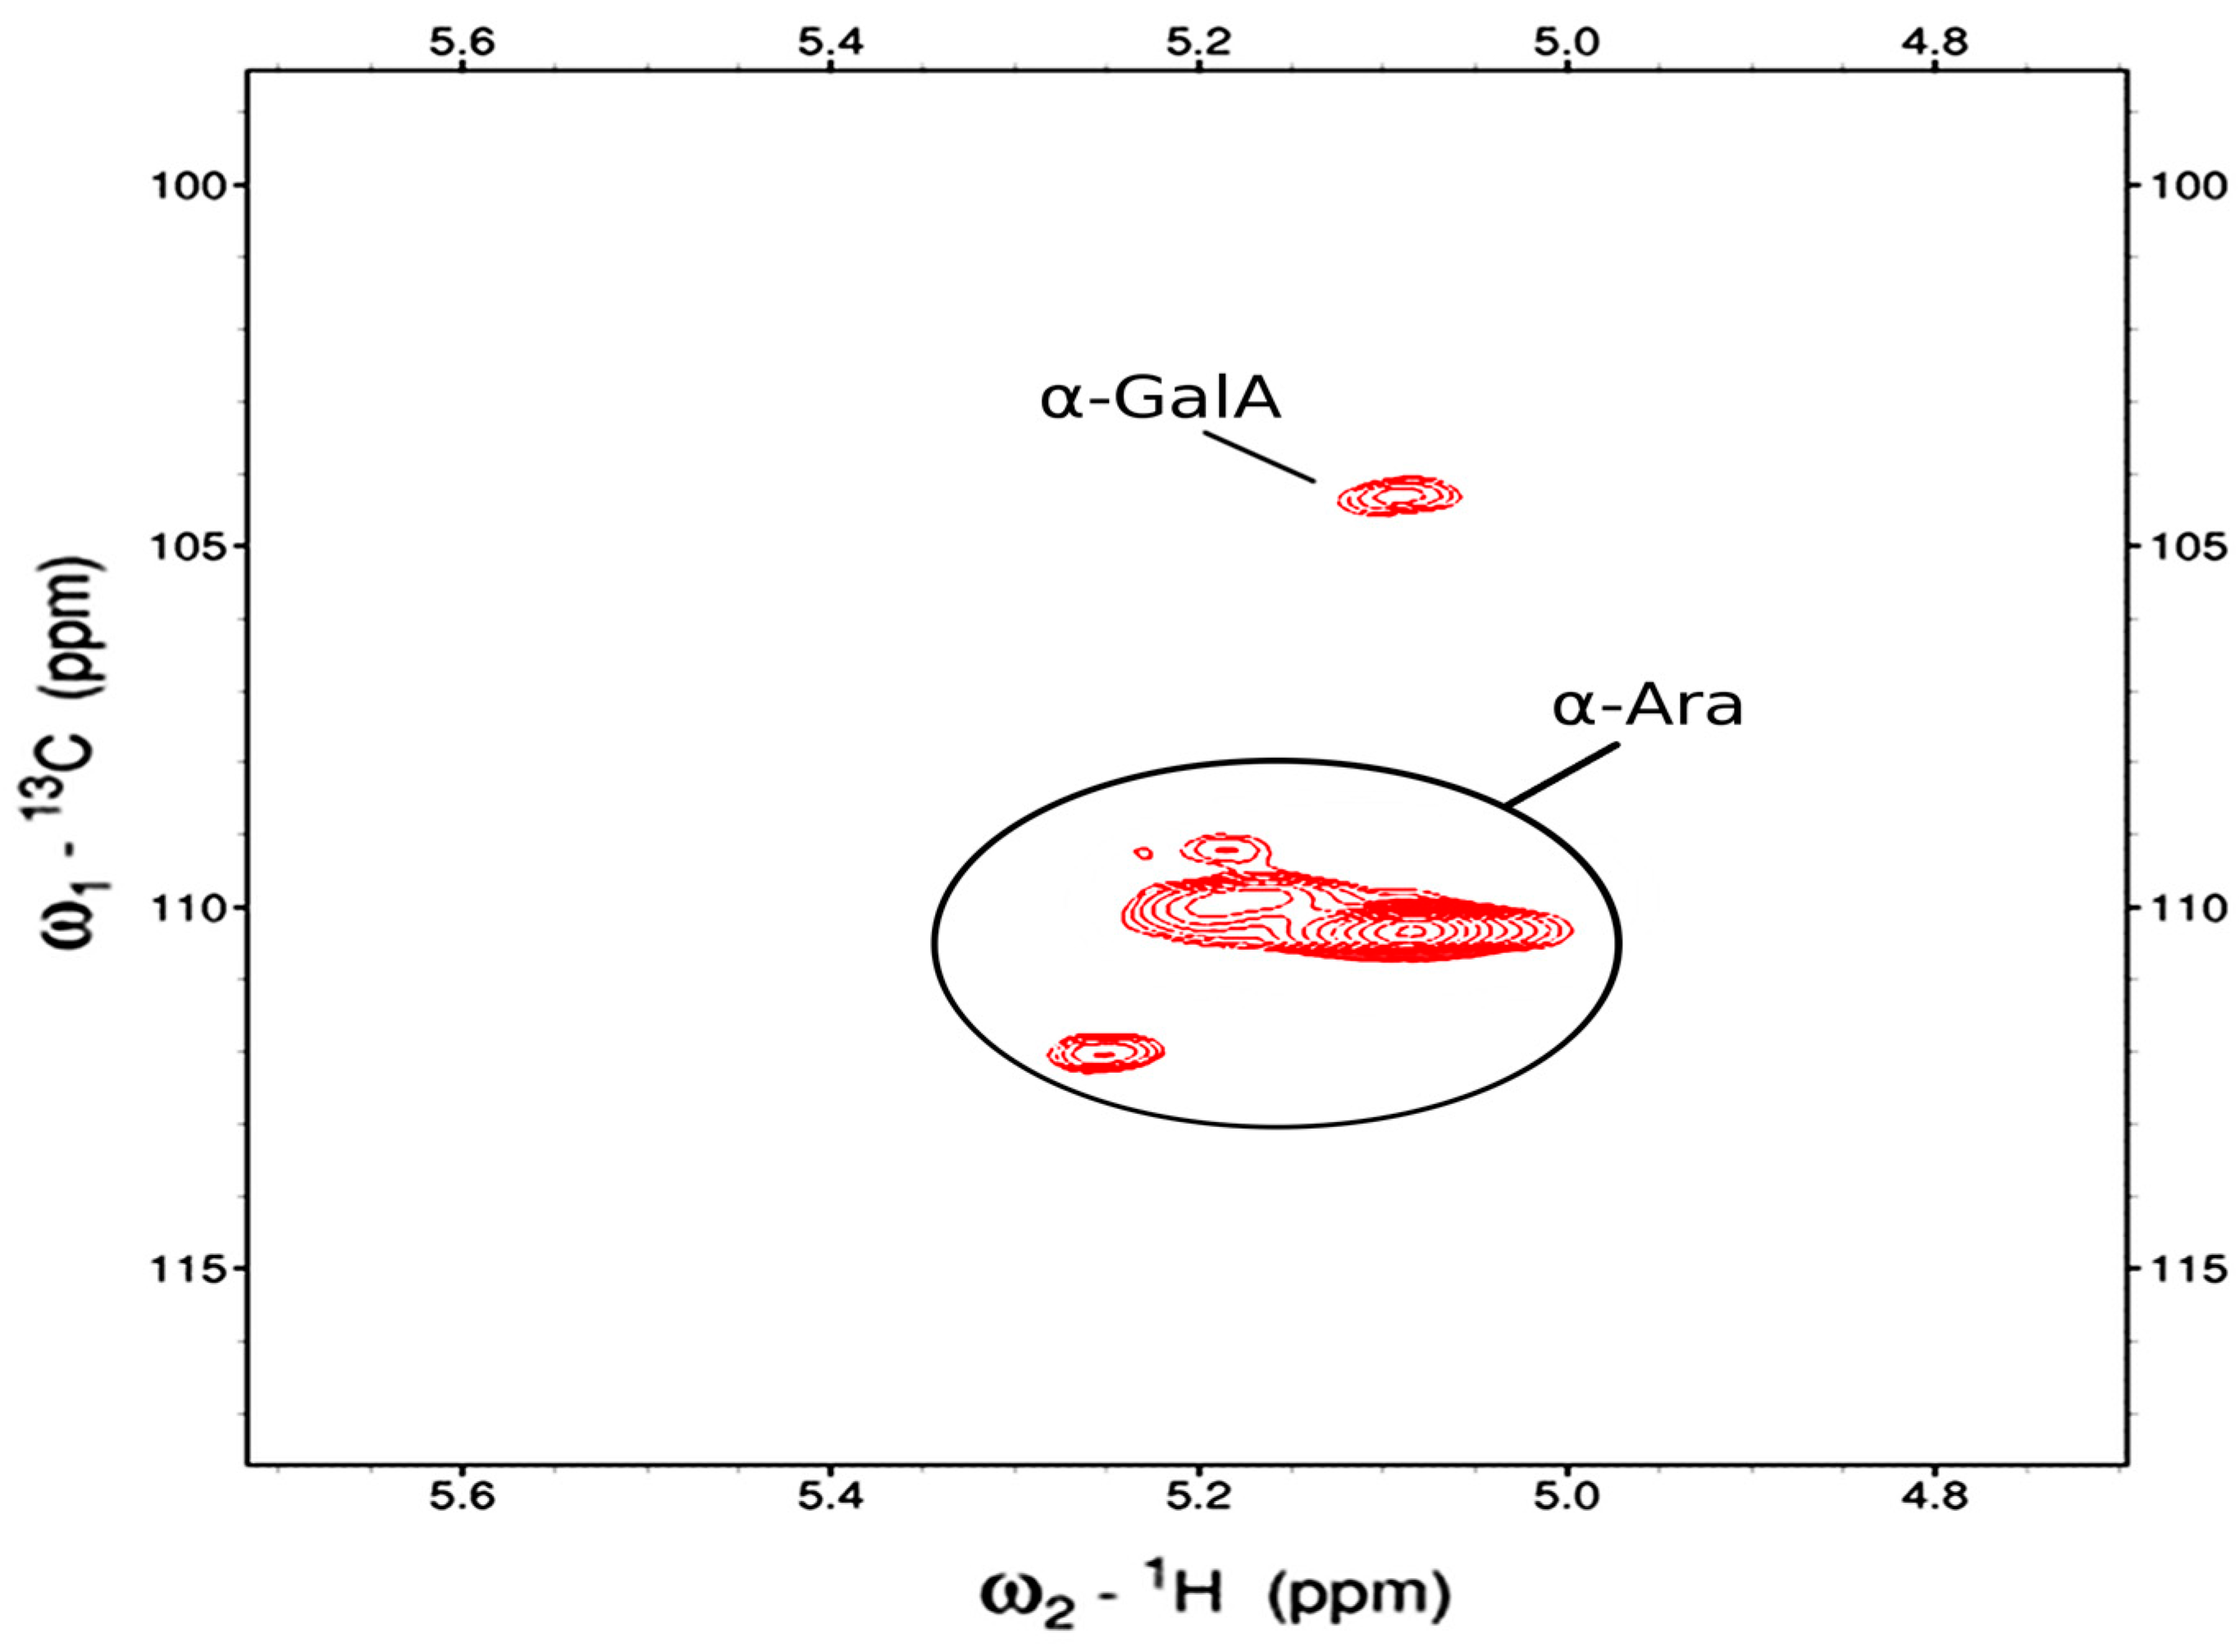
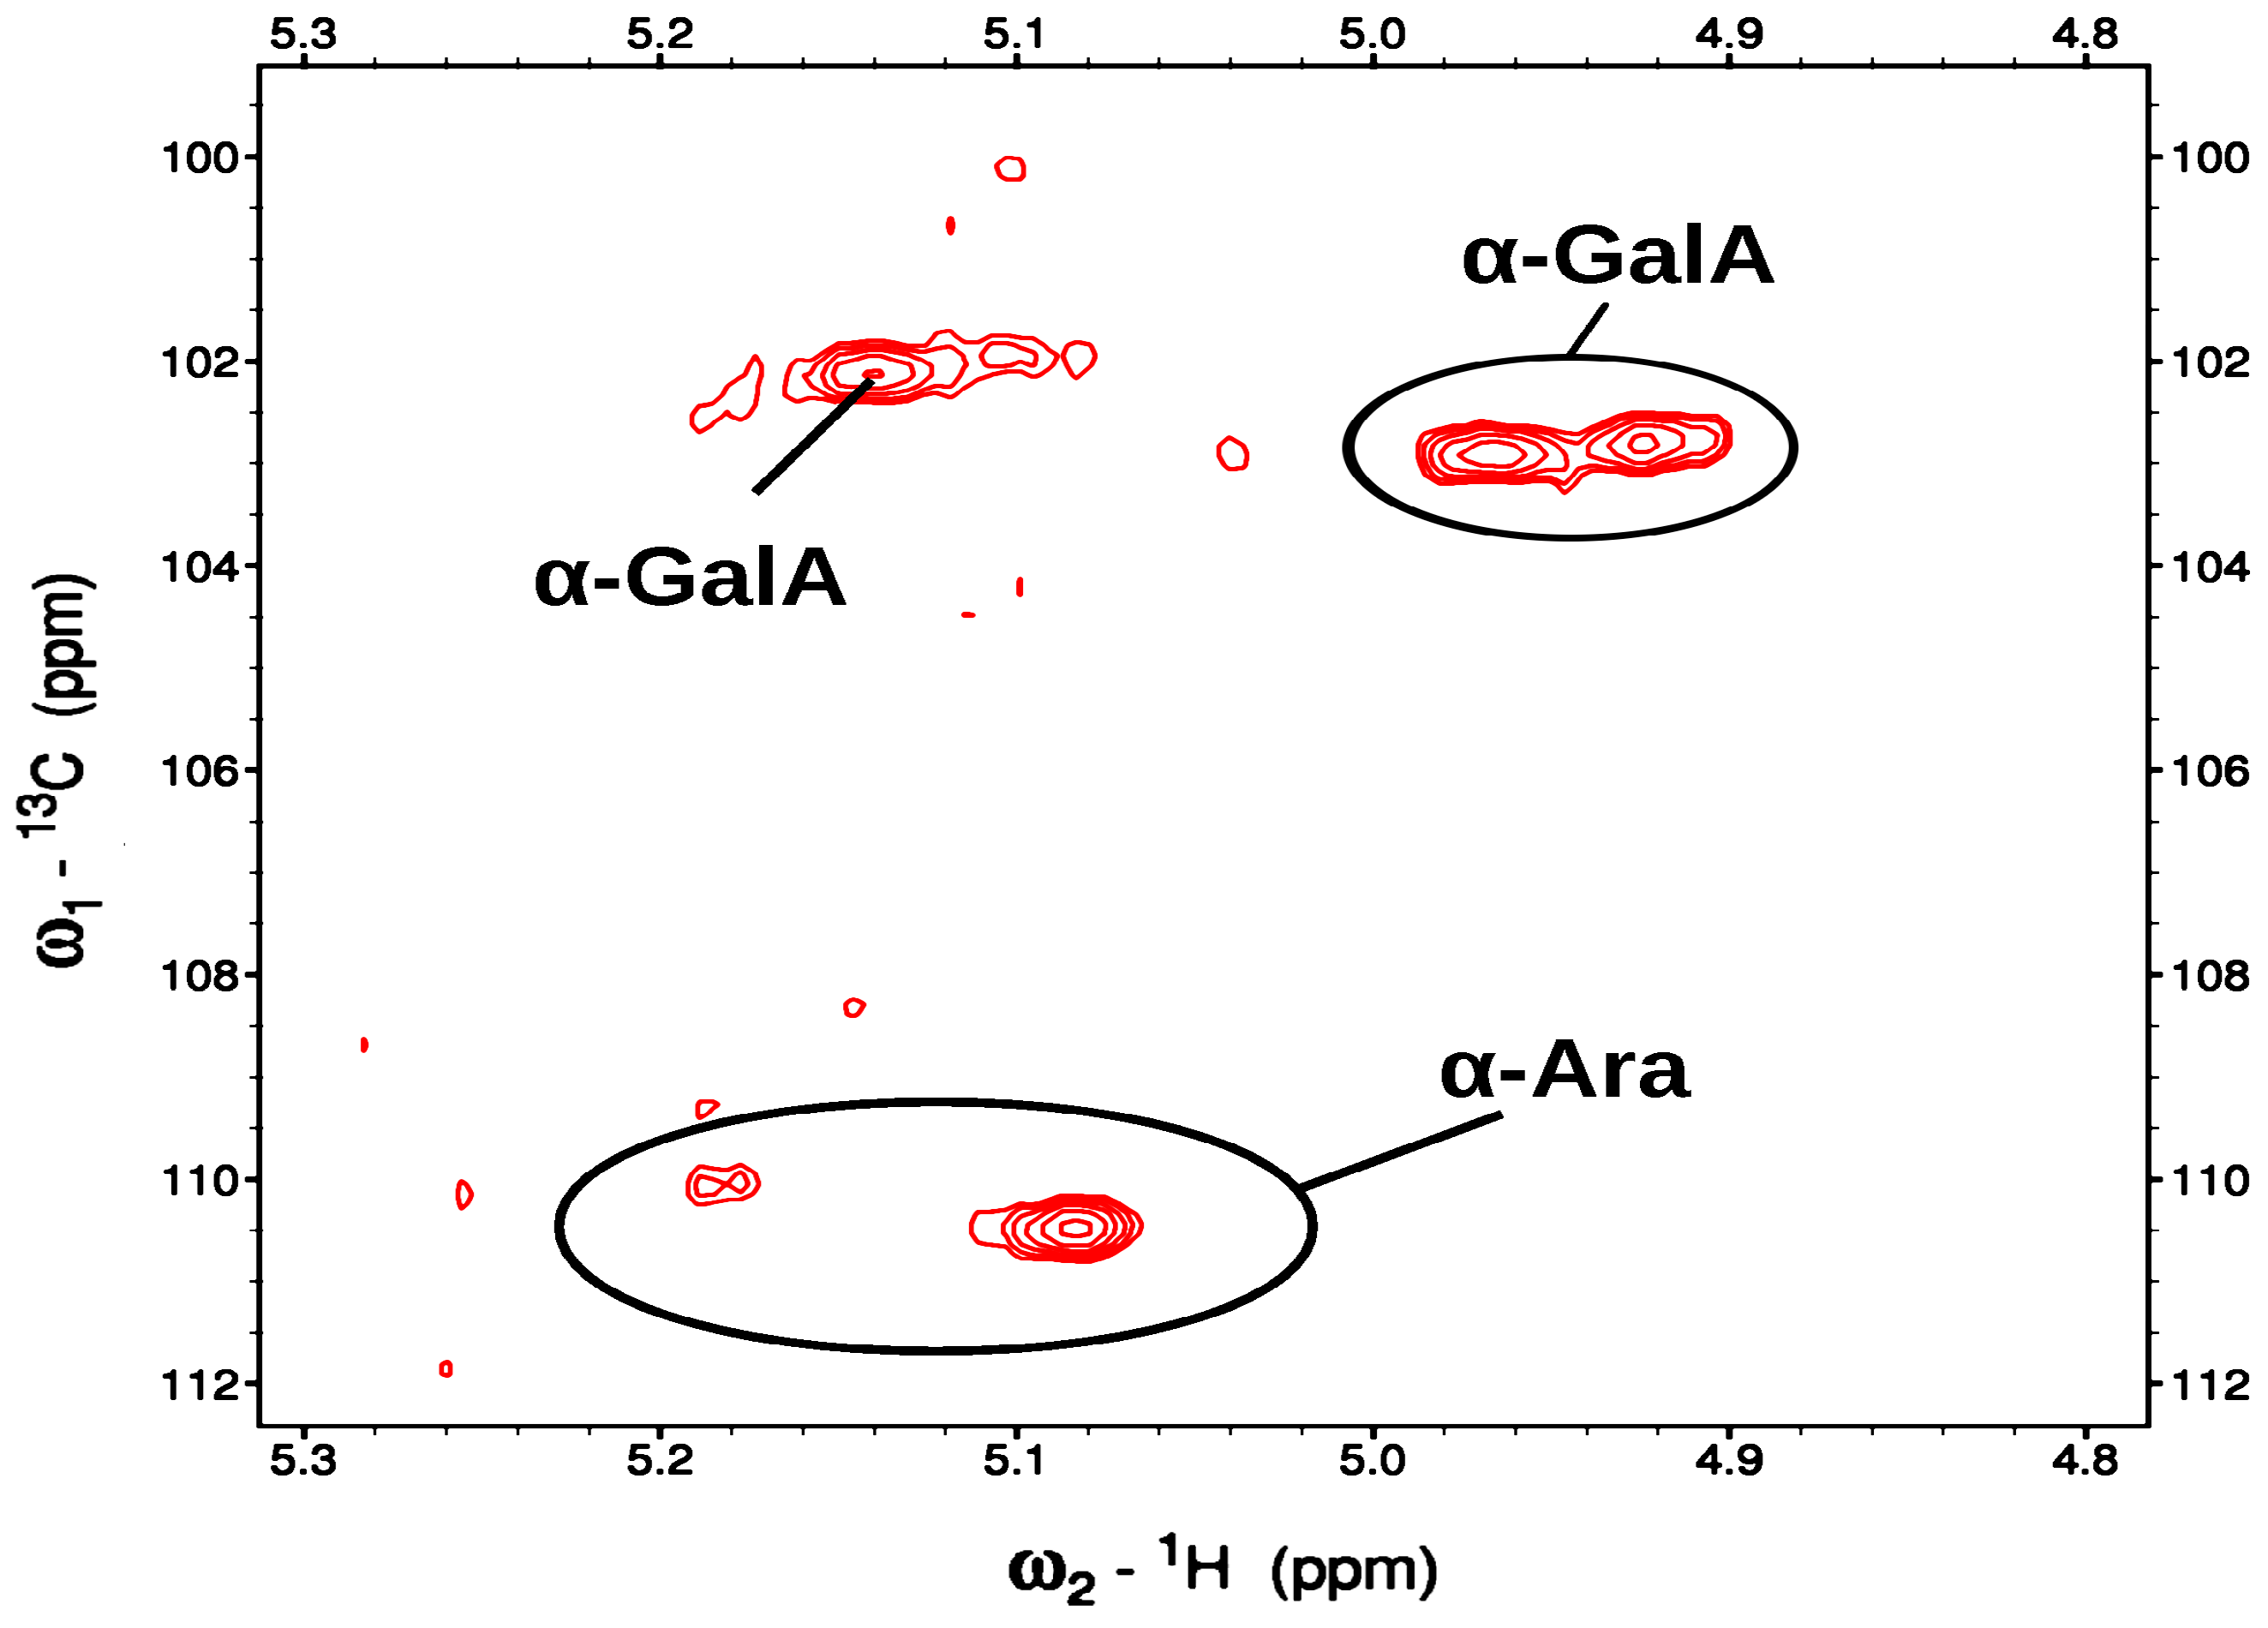
Figure 6 demonstrated 2D-HSQC spectrum at 80 °C, where four anomeric peaks are observed. These peaks have proton resonances that are typical for sugars with H1 and H2 in an axial−equatorial orientation, or α conformation. The three peaks observed at ~110 ppm in the
13C dimension were readily assigned as α-Ara based on their distinctive resonances. A weaker anomeric peak is at 5.01/104.3 ppm (
1H/
13C) is likely to be α-GalA, based on comparisons of literature chemical shift values and the monosaccharide analysis. These anomeric resonances are common to fractions F1AP1 and F1AP6 as well. In addition, a methyl resonance was found at 1.254/19.39 ppm which is consistent with H6/C6 of an α-Rha. In the other fractions of this sample, a COSY cross peak is observed connecting it to the H5. The spectra also indicate the presence of a methyl ester group (3.811/55.62 ppm), two methoxy groups (2.081/22.99 and 2.175/23.22 ppm) and one acetyl methyl (3.351/51.78 ppm), however it was not possible to determine their through-bond connectivity.
Figure 8.
The anomeric region of F1AP1 is shown in the HSQC spectrum at 80oC.
Figure 8.
The anomeric region of F1AP1 is shown in the HSQC spectrum at 80oC.
The assigned
1H and
13C chemical shifts from the 2D NMR experiments at 45 °C are given in
Table 4, and are based on through-bond correlations as well as comparisons to literature values for chemical shifts.
In addition, a methyl ester group (3.811/55.62 ppm for 1H/13C), two methoxy groups (2.081/22.99 and 2.175/23.22 ppm) and one acetyl methyl (3.351/51.78 ppm) were also observed.
3.1.2. NMR analysis of F1AP1 fraction of Apricot pectin
This fraction has very high molecular weight of approximately 1,945x10
6 g/mol (Da), unfavorable t
2 relaxation rates make it difficult to observe anything except the more flexible side-chains of this molecule. Consequently, the 1D-
1H spectra consist of a large number of broad and diffuse peaks at both 45 and 80 °C, with the anomeric region being largely uninterpretable. These relaxation properties also result in a 1D-
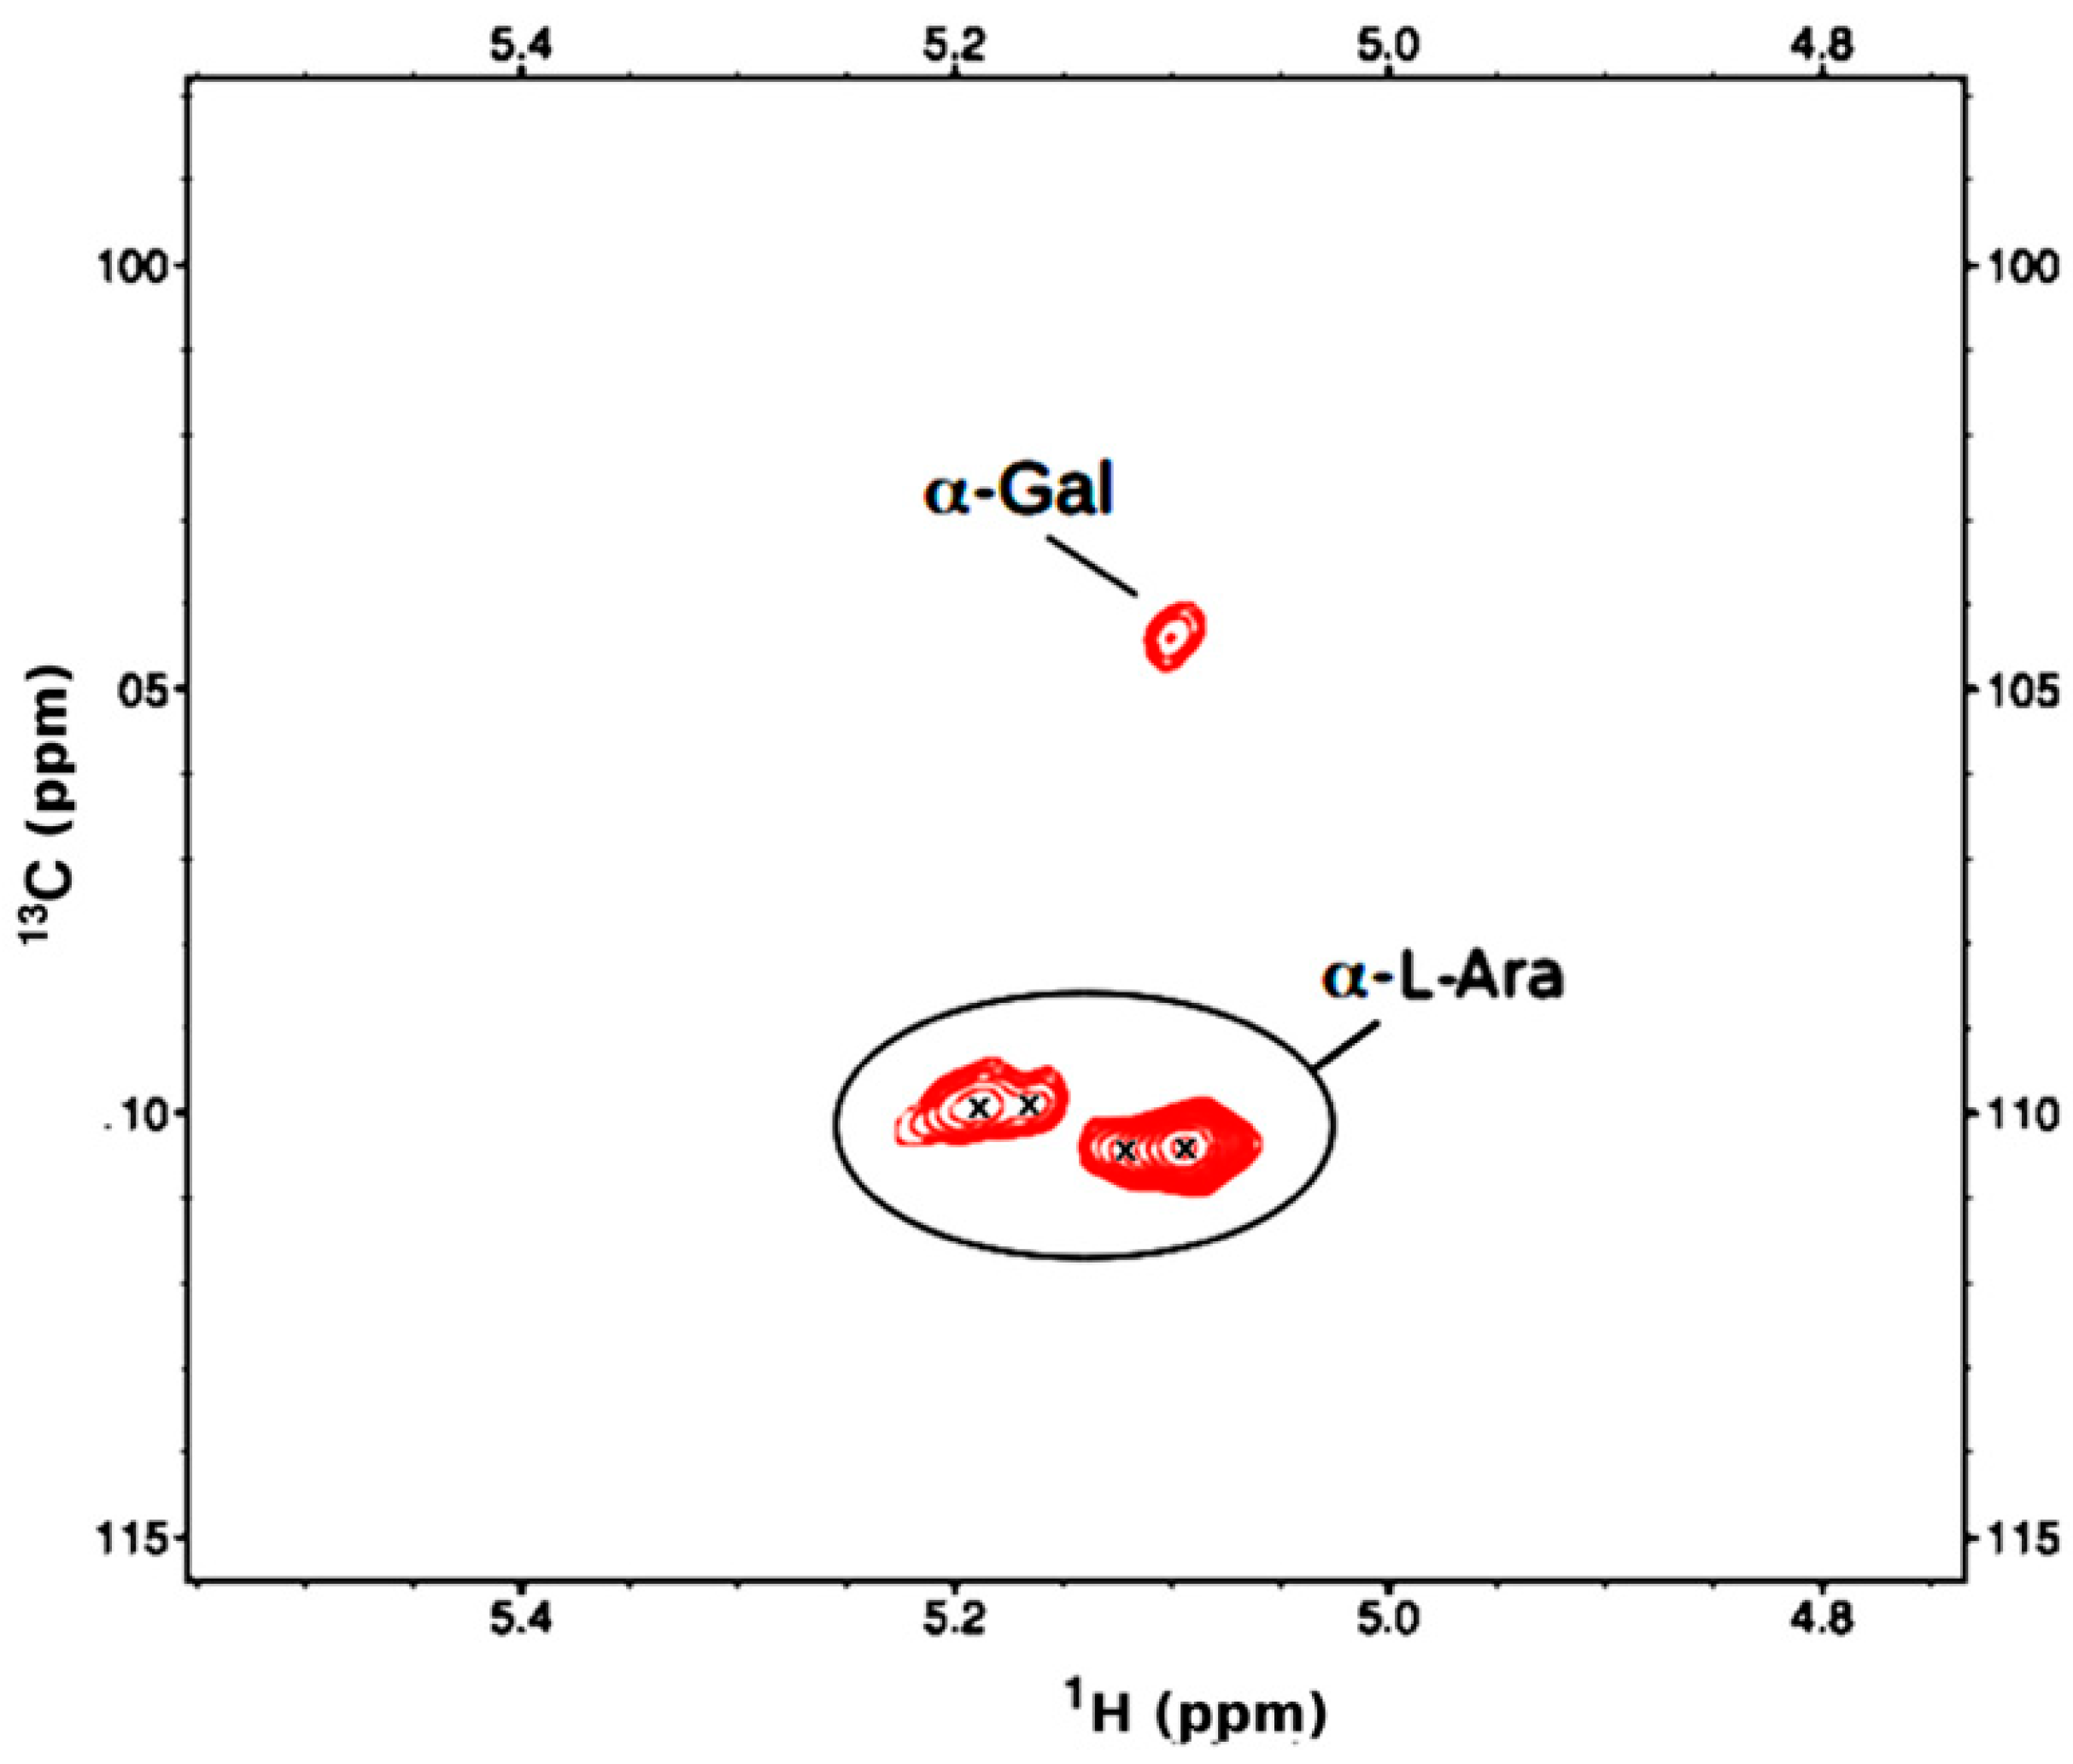
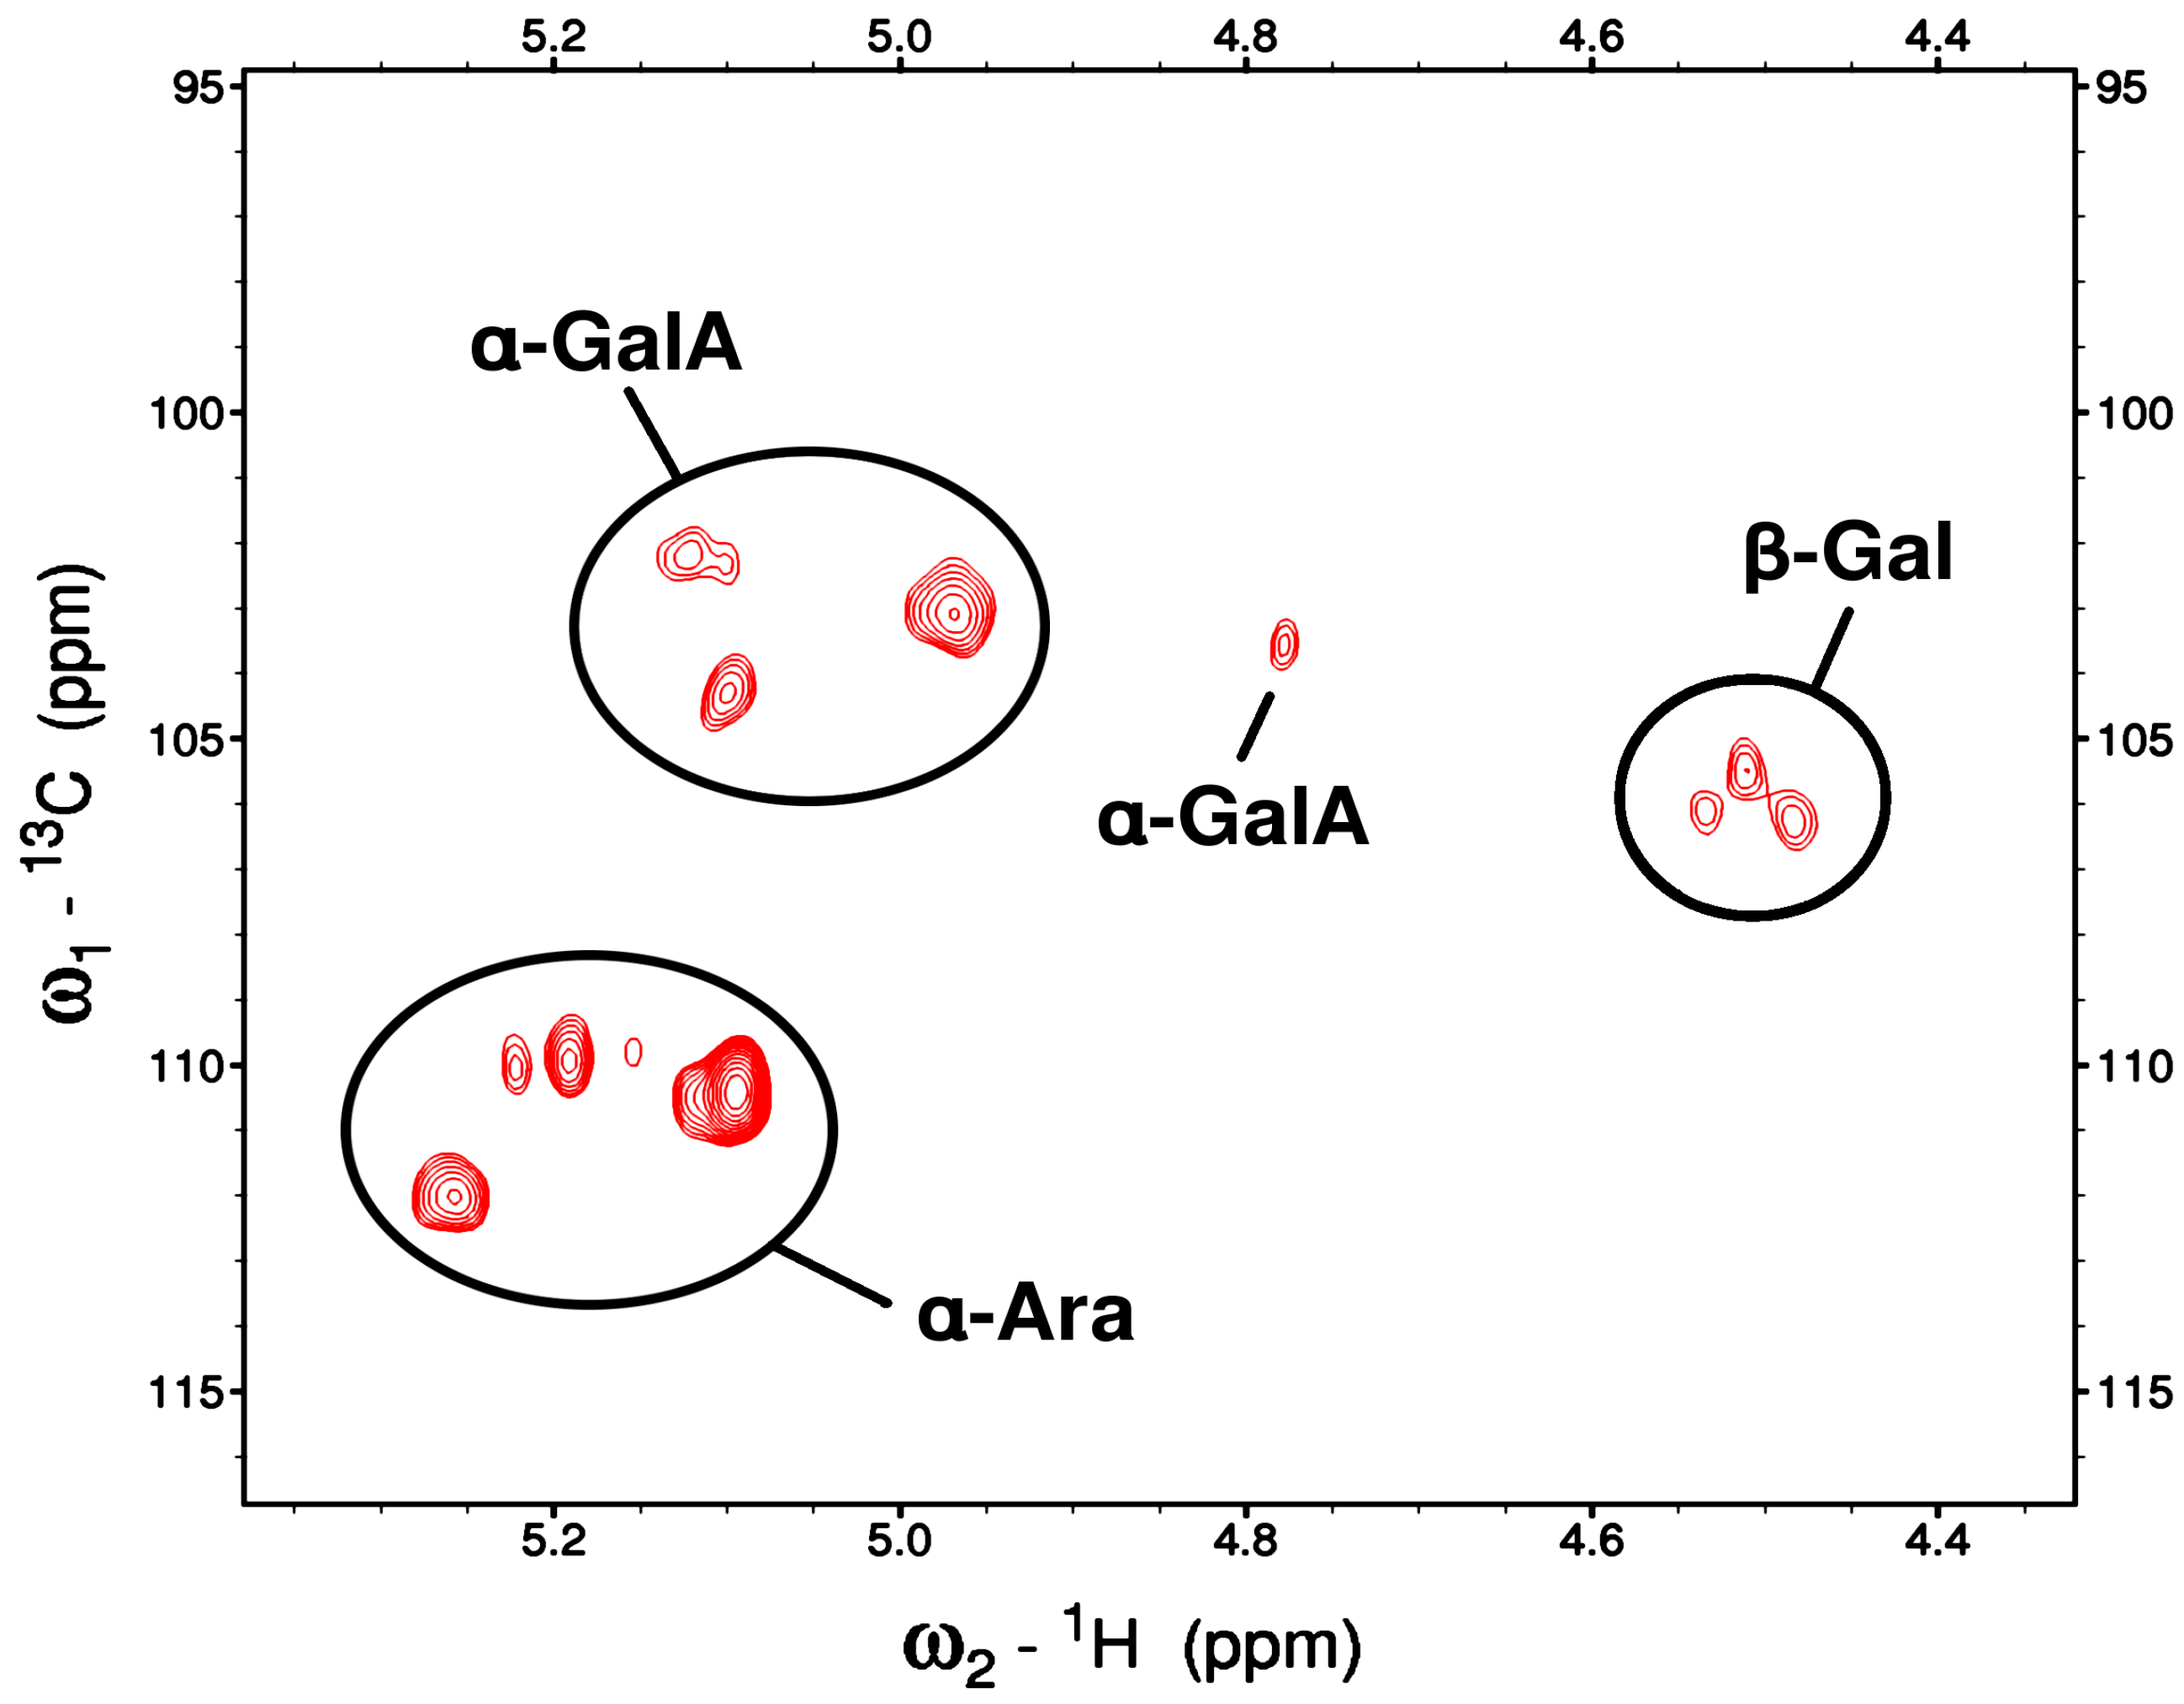
13C spectrum (at 45 °C) with low signal and diffuse peaks. Nevertheless, in the 2D-HSQC spectrum at 45 °C, five anomeric peaks are clearly observed (
Figure 9).
All of these peaks have proton resonances that are typical for sugars with H1 and H2 in an axial−equatorial orientation, or α conformation. The four peaks observed at ~110 ppm in the
13C dimension were readily assigned as α-Ara based on their distinctive resonances. A weaker anomeric peak found at 5.1/104.4 ppm (1H/13C) is likely to be α-GalA, based on its resonance frequencies and the concentrations determined by monosaccharide analysis. In addition, one rhamnose was identified by its C6 methyl resonances at 1.25/19.46 ppm (
1H/
13C); it also has a COSY correlation to the H5 at 3.792 ppm (
Figure S3).
The heteronuclear HSQC and HSQCTOXY experiments indicate the presence of one methyl ester at 3.82/55.77 ppm (1H/13C), which is presumably attached to a galacturonic acid, although this could not be identified. Also observed are one acetyl methyl (2.100/22.98) and one methoxy (3.36/51.49), each with undetermined attachments.
In order to improve the relaxation dynamics, the spectra were re-run at 80 °C, resulting in some sharpening of the spectra, the observation of a few more resonances, and some shifting of resonances. The 1D-
1H spectrum is still difficult to interpret, but a putative methoxy peak is now observed at ~3.3 ppm. In the anomeric region of the HSQC spectrum the α-Ara peaks are still observed at the same locations but appear to be weaker (
Figure 10).
It may be that some of the underlying resonances are shifted due to slight variations in the substructure (disaggregation). More notably, there are now at least three α-GalA peaks in the ranges of 4.92-5.14 ppm in 1H and 102.1-102.9 ppm in 13C. These α-GalA are presumably from the main chain, and the overall observations are consistent with previous reports that the rigid backbone of GalA and Rha produces broad and weak signals. In contrast, the more flexible arabinose side chains result in strong ones [
41]. One of these α-GalA was observed in the HMBC to have a methyl ester at 2.82/55.63 ppm (1H/13C). (
Table 5).
A second methyl ester was also observed at 3.84/55.62 ppm, with its carbonyl attachment at 166.0 ppm, but its connection to a sugar could not be determined. As seen at 45 °C, a rhamnose was identified by its C6 methyl resonances at 1.26/19.31 ppm and its COSY correlation to the H5 is at 3.785 ppm. Also, one methoxy group at 3.357/51.89 ppm (H/C), an additional methyl ester at 3.84/55.62 ppm, with its carbonyl attachment at 166.0 ppm, and three acetyl groups: 1.924/25.73 ppm, 2.107/23.15, 2.169.23.38, with carbonyl attachments at 183.2, 176.5 and 176.5 respectively were observed.
The results from HPAEC-PAD, HPSEC and NMR spectroscopy (1H, 13C, zTOCSY, HSQC, HSQCTOXY and HMBC) demonstrated that fraction F1AP1, eluted by water, (accounted for 65.6% of original F1AP pectin) has a backbone of (1→4)-linked -D-galacturonic acid and α-L-rhamnopyranosyl residues branched with arabinogalactan side chains, having methyl and acetylated groups, with high molecular weights (1945 kDa). One of these α-GalA was clearly observed in the HMBC to have a methyl ester at 2.82/55.63 ppm (1H/13C). A second methyl ester was also observed at 3.84/55.62 ppm, with its carbonyl attachment at 166.0 ppm. These α-GalA are presumably from the main chain.
Based on the aforementioned results, we assumed that the main pectin polysaccharides of the F1AP1 fraction in apricot fruits are RG-I polysaccharides (
Figure 1, [
11]) consisting of the repeating units -[2-α-L-Rha
p-(1→4)-α-D-Gal
pA-1]
n-. These are substituted with different arabinan sidechains, linked to C(O)4 position of Rha
p residues. However, galactan and glucan residues were not observed by NMR due to the unfavorable relaxation properties associated with this polysaccharide’s very high molar mass and aggregated. The presence of a carbonyl methyl ester in this fraction, identified by FTIR spectra (1740 cm
-1) and by
1H/
13C NMR (at 2.82/55.63 ppm) indicate that a D-GalA residue in this RG-I pectin is methylated, the DM is 74.5% was found by FTIR.
Carbohydrate analysis and NMR spectroscopy study [
11,
42] verified that most of the rhamnogalacturonan-I from cultured Arabidopsis cell walls is covalently linked to arabinogalactan-protein complex in cell wall. The study [
41] demonstrated that the attached RG-I glycans are decorated with α-1,5-arabinan, β-1,4-galactan, xylose, and 4-O-Me-xylose sidechains, the covalently linked RG-I-AGP is the major component of the traditionally prepared RG-I.
It could be deduced that the acetyl group present in this pectin probably attached to the C(O)2 or C(O)3 position of the GalpA residues. This result was further confirmed by the appearance of a cross-peak (multiplicity-sensitive gHSQCAD spectrum at 45 °C of the H-2 or H-3 proton (66.5 ppm and 65.97 ppm) of this fraction.
Given that the F1AP1 polysaccharide has a very high molar mass, it is expected to have increased aggregation, resulting in a main chain that adopts a compact coiled conformation.
3.1.3. NMR analysis of F1AP6 fraction of Apricot pectin
F1AP6 fraction was eluted by 0.2 M NaCl from DEAE Cellulose anion exchange column had a lower molecular weight that the previous samples, approximately 117.5 x 10
3 g/mol (Da), therefore has more favorable t
2 relaxation rates than the previous F1AP and F1AP1 samples. This results in the observation of more peaks and narrower line shapes1, but the peaks are still too broad to retrieve coupling information. In the 2D-HSQC spectrum (
Figure 11), 11 anomeric peaks are clearly observed.
The peaks at ~5.1-5.2 ppm in
1H and ~110-112 ppm in
13C were readily assigned as α-Ara based on their distinctive resonances. Similarly, the peaks at ~4.8-5.1 ppm in
1H and ~102-104 ppm in
13C were assigned as α-GalA. The weakest set of peaks, located at ~4.5/106 ppm (
1H/
13C), were assigned as β-Gal (t-, 4, and 6- linked) on the basis of both their chemical shifts and their weaker intensities, as expected from the monosaccharide analysis. A very weak anomeric peak is also observed at 4.78/103.5 ppm (
1H/
13C) but its identity could not be determined. In addition, two α-Rha sugars were identified on the basis of their C6 methyl resonances at ~1.26 / 19.5 ppm (
1H/
13C), each of which has COSY (
Figure S4) and HMBC correlations to its own H5 at ~3.8-4.0 ppm and C5 at ~71-75 ppm.
As with the initial F1AP and F1AP1 samples, the α-Ara resonances have the strongest intensities because these sugars are in the more flexible side-chains, whereas the resonances of α-GalA, which resides in the more rigid backbone, are weaker than one might predict from the monosaccharide analysis alone.
The assigned
1H and
13C chemical shifts from the 2D NMR experiments at 45 °C are given in
Table 6, and are based on through-bond correlations as well as comparisons to literature values for chemical shifts [
24,
25,
26,
41,
42,
43,
44,
45].
This is in agreement with previously published reports [
11,
12,
13,
14,
15,
25,
26,
38,
40,
41,
42,
43]. Using the HMBC and HSQCTOXY experiments, many of the other intra-residue resonances could be assigned for most of these sugars, but no inter-residue correlations could be reliably identified. The HMBC correlations reveal that one of the α -GalA is methyl esterified (3.82/55.67 ppm).
The HSQC and HSQCTOXY experiments also indicate the presence of one methoxy group (3.358/51.85) and three acetyl groups was also observed at 1.96/22.97 ppm, 2.08/23.06, 2.186/23.36 with its carbonyl attachment at 183.2 ppm, 176.3 ppm and 176.4 ppm, respectively. The methyl and acetyl group 1H/13C NMR signals very closely correspond those observed for the F1AP1 fraction.
Thus, from comprehensive analysis of the isolation profile, monosaccharide composition, carbohydrate linkage, HPSEC, and 2D NMR results and literatures sources, we can conclude that the main pectin polysaccharides of the F1AP6 fraction of apricot fruits belong to backbone of repeats units of [-(1→4)-α-D-GalpA-1]n – both HG and partly contents RG-II polysaccharides, bearing heterosugar sidechains, including α-Ara, α -Rha and β-Gal residues. The observation of a carbonyl methyl ester in this fraction, identified by FTIR spectra (1740 cm-1) and by
1H/
13C NMR (at 2.82/55.63 ppm) indicate that D-GalA residue in the HG regions of pectin are partly methylated. The DM was determined by FTIR to be 49.0%, which is lower than those of RG-I polysaccharide. Alternatively, RG-II residues might be attached to HG backbone with multiple complex side chains, as expected from the composition and carbohydrate linkage analysis, which can be cross-linked via borate diesters to the cell wall matrix [
43].
These results are consistence with finding observed for the arabinose polymers the cell wall of some fruits, most likely arabinan and arabinogalactan in nature, [
13,
41,
42]. The presence of RG-II connected to the HG chains in apricot pectin [
46,
47], shows the complexity and diversity in the structures of pectic polysaccharides greatly relate to the plant’s origin and the extraction and isolation methods used [
47]. Determining how they synthesis, interact with each other and how they are regulated Apricot fruits ripening is a tremendous challenge for the future.
5. Conclusions
The fine structure of pectin polysaccharides is discussed in this article from both literature and recent work we have performed on apricot pectin. The molar mass and hydrodynamic properties were determined by High Performance Size Exclusion Chromatography (HP-SEC) with DPV and RI detection. The monosaccharide compositions were determined by High-Performance Anion-Exchange Chromatography with Pulsed Amperometric Detection (HPAEC-PAD). Structural characterization utilized 1D and 2D homo- and hetero-nuclear NMR spectroscopy. The original fraction was found to be composed of D-galacturonic acid, L-rhamnose, D-arabinose and D-galactose in a 1.0 : 0.1 : 0.36 : 0.12 molar ratio, respectively, which is consistent with a pectin RG-1 branched with arabinogalactan side chain polysaccharides, and has a weight-average molecular weight of approximately 1588.2 kDa. The slope of the hydrodynamic radius versus the molar mass was 0.57, indicating the presence of coil conformations.
The results from HPAEC-PAD, HPSEC and NMR spectroscopy (1H, 13C, zTOCSY, HSQC, HSQCTOXY and HMBC) demonstrated that fine fraction of F1AP1 has a backbone of (1→4)-linked -D-galacturonic acid and -L-rhamnopyranosyl residues branched with arabinogalactan side chains, having methyl and acetylated groups, and has high molecular weights. In contrast the other, F1AP6, fraction of apricot fruits belong to backbone of repeats units of [-(1→4)-α-D-GalpA-1]n – both HG and partly contents RG-II polysaccharides, bearing heterosugar sidechains, including α-Ara, α -Rha and β-Gal residues..
From our studies, the structure of F1AP1 mainly comprised of RG-I hairy regions with multiply glycosidic linkages of T- α-Araf, 3-α-Araf, 5-α-Araf, T- α -Arap, 2- α-Arap that constitute the side chains as an oligomers with different portions connected at the C-4 of rhamnosyl units in RG-I regions. The main symmetric and unimodal peaks of HPSEC (RI, LS and DP) were observed for F1AP1 with weight-average molecular weight of 1945 kDa and polydispercity index 1.91, demonstrating its high purity and homogeneity. The polysaccharide was highly viscosity and value of hydrodynamic reduce was 64,3 nm. The exponent b of Rh-Mw (conformation plot) are accepted to be 0.48 related to the compact flexible coil conformation of macromolecule in solution.
The β-configuration of all Galp units was inferred from their common chemical shifts of anomeric carbon (δ 103.40–104.22) and proton (δ 4.46–4.67) as presented in the anomeric region of HSQC spectrum. Presence of a carbonyl methyl ester in this fraction, identified by FTIR spectra (1740 cm-1) and by 1H/13C NMR (at 2.82/55.63 ppm) indicate that D-GalA residue in the HG regions of pectin partly methylated, the DM fined 49.0% is less than those of RG-I polysaccharide (74.5%). The F1AP6 polysaccharide has low molar mass (117 kDa), less aggregated and adopt more stiffness rod like conformation.
Figure 1.
Structure of four pectic polysaccharides, homogalacturonan (HG), xylogalacturonan (XGA), rhamnogalacturonan I (RG-I), and rhamnogalacturonan II (RG-II), linked to each other that are found in Arabidopsis plants ( Scheller et al., 2007 [
11]).
Figure 1.
Structure of four pectic polysaccharides, homogalacturonan (HG), xylogalacturonan (XGA), rhamnogalacturonan I (RG-I), and rhamnogalacturonan II (RG-II), linked to each other that are found in Arabidopsis plants ( Scheller et al., 2007 [
11]).
Figure 2.
Apricot specie “Mahtobi” growing in Tajikistan.
Figure 2.
Apricot specie “Mahtobi” growing in Tajikistan.
Figure 3.
Extraction scheme of pectin poly- (F1AP) and oligosaccharides (F1AO) fraction from Apricot fruits.
Figure 3.
Extraction scheme of pectin poly- (F1AP) and oligosaccharides (F1AO) fraction from Apricot fruits.
Figure 4.
Elution profile of the Apricot pectin polysaccharides from DEAE Sepharose anion-exchange column (blue line). Gradient of NaCl ionic strength (0, 0.01, 0.03, 0.05, 0.07, 0.2, 0.3, and 0.5 M ) at a flow rate of 5 mL/min (red line).
Figure 4.
Elution profile of the Apricot pectin polysaccharides from DEAE Sepharose anion-exchange column (blue line). Gradient of NaCl ionic strength (0, 0.01, 0.03, 0.05, 0.07, 0.2, 0.3, and 0.5 M ) at a flow rate of 5 mL/min (red line).
Figure 6.
HPSEC chromatograms from LS detector of F1AP and molar mass distribution curve.
Figure 6.
HPSEC chromatograms from LS detector of F1AP and molar mass distribution curve.
Figure 7.
Hydrodynamic radius versus the molar mass (Rh conformation plot) of the F1AP. The slope value is 0.57.
Figure 7.
Hydrodynamic radius versus the molar mass (Rh conformation plot) of the F1AP. The slope value is 0.57.
Figure 9.
The HSQC anomeric region of the F1AP1 at 45 °C.
Figure 9.
The HSQC anomeric region of the F1AP1 at 45 °C.
Figure 10.
The HSQC anomeric region of F1AP1 sample at 80oC.
Figure 10.
The HSQC anomeric region of F1AP1 sample at 80oC.
Figure 11.
The HSQC anomeric region of F1AP6 at 45 °C.
Figure 11.
The HSQC anomeric region of F1AP6 at 45 °C.
Table 2.
Molecular mass and hydrodynamic properties of pectin polysaccharides from apricot fruits.
Table 2.
Molecular mass and hydrodynamic properties of pectin polysaccharides from apricot fruits.
| |
R
(%) |
Mw/Mn
|
Mw
(kD) |
w, (mL/mg) |
Rh (Å) |
b
(Rh conformation plot) |
| F1AP |
77.5 |
1.92 |
1588.2 |
355.1 |
60.1 |
0.57 |
| F1AP1 |
74.3 |
1.91 |
1945.0 |
426.4 |
64.3 |
0.48 |
| F1AP6 |
95.7 |
2.34 |
117.5 |
158.6 |
30.0 |
0.78 |
| F1AO |
97.1 |
1.85 |
3.55 |
22.0 |
1.6 |
- |
Table 3.
Relative percentage of each detected linkage in F1AP sample, generated from Total Ion Chromatogram feature in Data Analysis. The TIC peaks are given in order to increasing retention time.
Table 3.
Relative percentage of each detected linkage in F1AP sample, generated from Total Ion Chromatogram feature in Data Analysis. The TIC peaks are given in order to increasing retention time.
| Linkage patterns |
Relative area percentage (%) |
| Terminal Rhamnopyranosyl residue (t-Rha) |
0.52 |
| Terminal Arabinofuranosyl residue (t-Araf) |
3.80 |
| Terminal Arabinopyranosyl residue (t-Ara) |
4.60 |
| Terminal Xylopyranosyl residue (t-Xyl) |
0.58 |
| 2 linked Rhamnopyranosyl residue (2-Rha) |
4.67 |
| 2 linked Arabinofuranosyl residue (2-Araf) |
0.25 |
| Terminal Glucopyranosyl residue (t-Glc) |
1.69 |
| 3 linked Arabinofuranosyl residue (3-Araf) |
0.42 |
| Terminal Galactofuranosyl residue (t-Galf)* |
0.32 |
| Terminal Galactofuranosyl uronic acid residue (t-GalA)* |
0.33 |
| Terminal Galactopyranosyl residue (t-Gal) |
3.70 |
| Terminal Galactopyranosyl uronic acid residue (t-GalA) |
3.32 |
| 5 linked Arabinofuranosyl residue (5-Araf) |
0.85 |
| 3 linked Arabinopyranosyl residue (3-Ara) |
0.12 |
| 2 linked Xylopyranosyl residue (2-Xyl) |
0.17 |
| 4 linked Xylopyranosyl residue (4-Xyl) |
0.26 |
| 2,3 linked Rhamnopyranosyl residue (2,3-Rha) |
0.20 |
| 2,4 linked Rhamnopyranosyl residue (2,4-Rha) |
0.80 |
| 3 linked Galactopyranosyl residue (3-Gal) |
1.39 |
| 2 linked Galactopyranosyl residue (2-Gal) |
0.12 |
| 4 linked Galactopyranosyl residue (4-Gal) |
1.41 |
| 4 linked Galactopyranosyl uronic acid residue (4-GalA) |
62.2 |
| 4 linked Glucopyranosyl residue (4-Glc) |
2.12 |
| 4 linked Glucopyranosyl uronic acid residue (4-GlcA) |
0.37 |
| 6 linked Galactopyranosyl residue (6-Gal) |
1.81 |
| 3,4 linked Galactopyranosyl residue (3,4-Gal) |
0.10 |
| 3,4 linked Galactopyranosyl uronic acid residue (3,4-GalA) |
1.83 |
| 2,4 linked Galactopyranosyl residue (2,4-Gal) |
0.07 |
| 2,4 linked Galactopyranosyl uronic acid residue (2,4-GalA) |
0.67 |
| 4,6 linked Glucopyranosyl residue (4,6-Glc) |
0.73 |
| 4,6 linked Galactopyranosyl residue (4,6-Gal) |
0.04 |
| 3,6 linked Galactopyranosyl residue (3,6-Gal) |
0.63 |
| SUM |
|
Table 4.
Monosaccharide assignments from 2D experiments.
Table 4.
Monosaccharide assignments from 2D experiments.
| |
C1 |
C2 |
C3 |
C4 |
C5 |
C6 |
H1 |
H2 |
H3 |
H4 |
H5 |
H6 |
H
(Unassigned) |
| α -Rha |
- |
- |
- |
- |
- |
19.39 |
- |
- |
- |
- |
- |
1.254 |
|
| α -Ara |
112 |
86.78 |
- |
- |
- |
- |
5.252 |
- |
3.958 |
3.717 |
- |
- |
4.071,
3.83 |
| α -Ara |
110 |
- |
- |
- |
- |
- |
5.189 |
4.213 |
4.006 |
- |
- |
- |
|
| α -Ara |
109.8 |
- |
- |
- |
64.07 |
- |
5.164 |
4.139 |
3.973 |
- |
3.734,
3.832 |
- |
|
| α -Ara |
110.3 |
83.67 |
79.58 |
85.14 |
69.75 |
- |
5.088 |
4.133 |
4.018 |
4.213 |
3.805,
3.885 |
- |
|
| α -GalA |
104.3 |
65.87 |
66.03 |
65.9 |
|
|
5.091 |
3.817 |
3.723 |
- |
4.031 |
- |
- |
Table 5.
Monosaccharide Assignments of the F1AP1 fraction based on COSY, TOCSY, HSQC, HSQCTOXY and HMBC at 80 °C:.
Table 5.
Monosaccharide Assignments of the F1AP1 fraction based on COSY, TOCSY, HSQC, HSQCTOXY and HMBC at 80 °C:.
| |
C1 |
C2 |
C3 |
C4 |
C5 |
C6 |
H1 |
H2 |
H3 |
H4 |
H5 |
H6 |
Hw |
Methyl
Ester
(H/C) |
| -Rha |
- |
- |
- |
- |
- |
19.46 |
- |
- |
- |
- |
3.792 |
1.252 |
- |
- |
| -Ara |
110.1 |
- |
- |
- |
- |
- |
5.191 |
- |
- |
- |
- |
- |
3.788 |
- |
| -Ara |
110.5 |
83.9 |
79.7 |
85.26 |
69.84 |
- |
5.086 |
4.132 |
4 |
4.214 |
3.883,
3.805 |
- |
- |
- |
| -GalA |
104.3 |
66.5 |
65.97 |
81.2 |
74.33 |
177.7 |
5.106 |
3.797 |
3.727 |
4.425 |
4.662 |
- |
- |
- |
| -GalA |
102.1 |
- |
- |
- |
73.32 |
173.6* |
5.133 |
- |
- |
- |
5.093 |
- |
- |
3.821/
55.63 |
| -GalA |
102.9 |
- |
- |
- |
- |
- |
4.966 |
- |
- |
- |
- |
- |
- |
- |
| -GalA |
102.8 |
- |
- |
- |
- |
- |
4.924 |
- |
- |
- |
- |
- |
- |
- |
| -GalA |
99.05 |
|
|
|
|
|
4.589 |
|
|
|
|
|
|
|
Table 6.
Monosaccharide Assignments based on COSY, TOCSY, HSQC, HSQCTOXY and HMBC at 45 °C.
Table 6.
Monosaccharide Assignments based on COSY, TOCSY, HSQC, HSQCTOXY and HMBC at 45 °C.
| |
C1 |
C2 |
C3 |
C4 |
C5 |
C6 |
H1 |
H2 |
H3 |
H4 |
H5 |
H6 |
Methyl
Ester
(H/C) |
| -Rha |
- |
- |
- |
- |
71.75 |
19.41 |
- |
- |
- |
- |
3.787 |
1.266 |
- |
| -Rha |
- |
- |
- |
- |
74.85 |
19.53 |
- |
- |
- |
- |
4.019 |
1.263 |
- |
| -Ara |
112.0 |
86.8 |
- |
- |
- |
- |
5.257 |
4.146 |
3.955 |
4.225 |
3.771,
3.726 |
|
- |
| -Ara |
109.9 |
- |
79.5 |
- |
- |
- |
5.159 |
4.138 |
3.911 |
4.216 |
3.939 |
- |
- |
| -Ara |
110.5 |
- |
- |
- |
64.16 |
- |
5.112 |
4.143 |
3.971 |
4.235 |
3.838,
3.732 |
|
- |
| -Ara |
110.4 |
83.74 |
79.57 |
85.14 |
69.73 |
- |
5.095 |
4.139 |
4.013 |
4.216 |
3.891,
3.805 |
|
- |
| -Gal |
106.1 |
- |
- |
- |
- |
- |
4.534 |
- |
- |
- |
- |
- |
- |
| -Gal |
105.5 |
- |
- |
- |
- |
- |
4.511 |
- |
- |
- |
- |
- |
- |
-Gal
→6)-β-Galp-(1→ |
106.2 |
- |
- |
- |
- |
- |
4.484 |
- |
- |
- |
- |
- |
- |
| -GalA |
104.3 |
65.88, 77.14 |
74.22 |
- |
5.106 |
3.802 |
3.789 |
4.146 |
4.706 |
- |
- |
| -GalA |
102.1 |
- |
- |
- |
73.26 |
173.4* |
5.118 |
4.15 |
- |
- |
5.08 |
- |
3.817 / 55.67 |
| -GalA |
103.0 |
- |
- |
- |
- |
- |
4.968 |
3.737 |
|
"4.466 |
3.999" |
|
- |
| -GalA |
103.5 |
- |
- |
- |
- |
- |
4.779 |
- |
- |
- |
- |
- |
- |
