1. Introduction
Eco-driving is well known as one of the energy-saving methods for vehicles [
1]. With the popularization of BEVs, research on BEV eco-driving becomes more and more important. Many researchers study eco-driving as an optimization problem, for example, a study done by Mensing et al. shows that using optimization techniques at a fixed distance and time to adjust the driver’s operations significantly improves the energy efficiency of the ICV [
2]. This fixed distance and time method is convenient to clarify the energy consumption improvement effect of eco-driving under the same driving conditions, so we also adopted it in our research. However, the power system characteristics of BEV and ICV are different, and the applicability of BEV needs further verification. And a study done by Sundström et al. introduces a generic dynamic programming function for Matlab [
3], which can be used in vehicle power consumption optimization problems. Referring to this research, we built a speed change pattern optimization simulator by combining our developed accuracy-proven vehicle simulator with an optimization algorithm, and used it to derive the BEV eco-driving. In addition, eco-driving optimization study often focuses on algorithms and lacks the verification of actual vehicle experiments [
4,
5]. In this regard, after deriving the optimal BEV eco-driving, we verified its characteristics using the driving test data of a small electric bus developed by our research team.
In this paper, first, we introduce an electric bus running energy calculation simulator using target vehicle parameters with an optimization algorithm and derive an eco-driving speed change pattern for BEV. Next, we investigate derived BEV eco-driving characteristics and compare them with ICV eco-driving. Finally, we verify the BEV eco-driving through test data of the target vehicle driving on public roads.
2. Target Vehicle and Simulator
2.1. Target Vehicle and Simulation Conditions
In this study, target vehicle is a small electric bus, the Waseda Electric Bus-3Advanced (WEB-3A). This vehicle was created by converting a small diesel bus using Hino Motors into a remodeled small electric bus with standard specifications.
Table 1 summarizes the basic specifications.
Since we focused on the aforementioned street bus in this study, we optimized the speed change pattern in which “driving distance” and “average speed” are fixed from start to stop while considering the distance between bus stops and the schedule [
6,
7].Our purpose was to cover a total distance of 400 m in three intervals (acceleration, coasting, and deceleration) at an average speed of 30 km/h. In addition, we also focused on a double travel distance when stops were skipped (800 m total with an average speed of 30 km/h). In this study, we assumed that there would be no impact from traffic lights or congestion.
2.2. Vehicle Driving Energy Calculation Simulator and the Speed Change Pattern Optimization Method
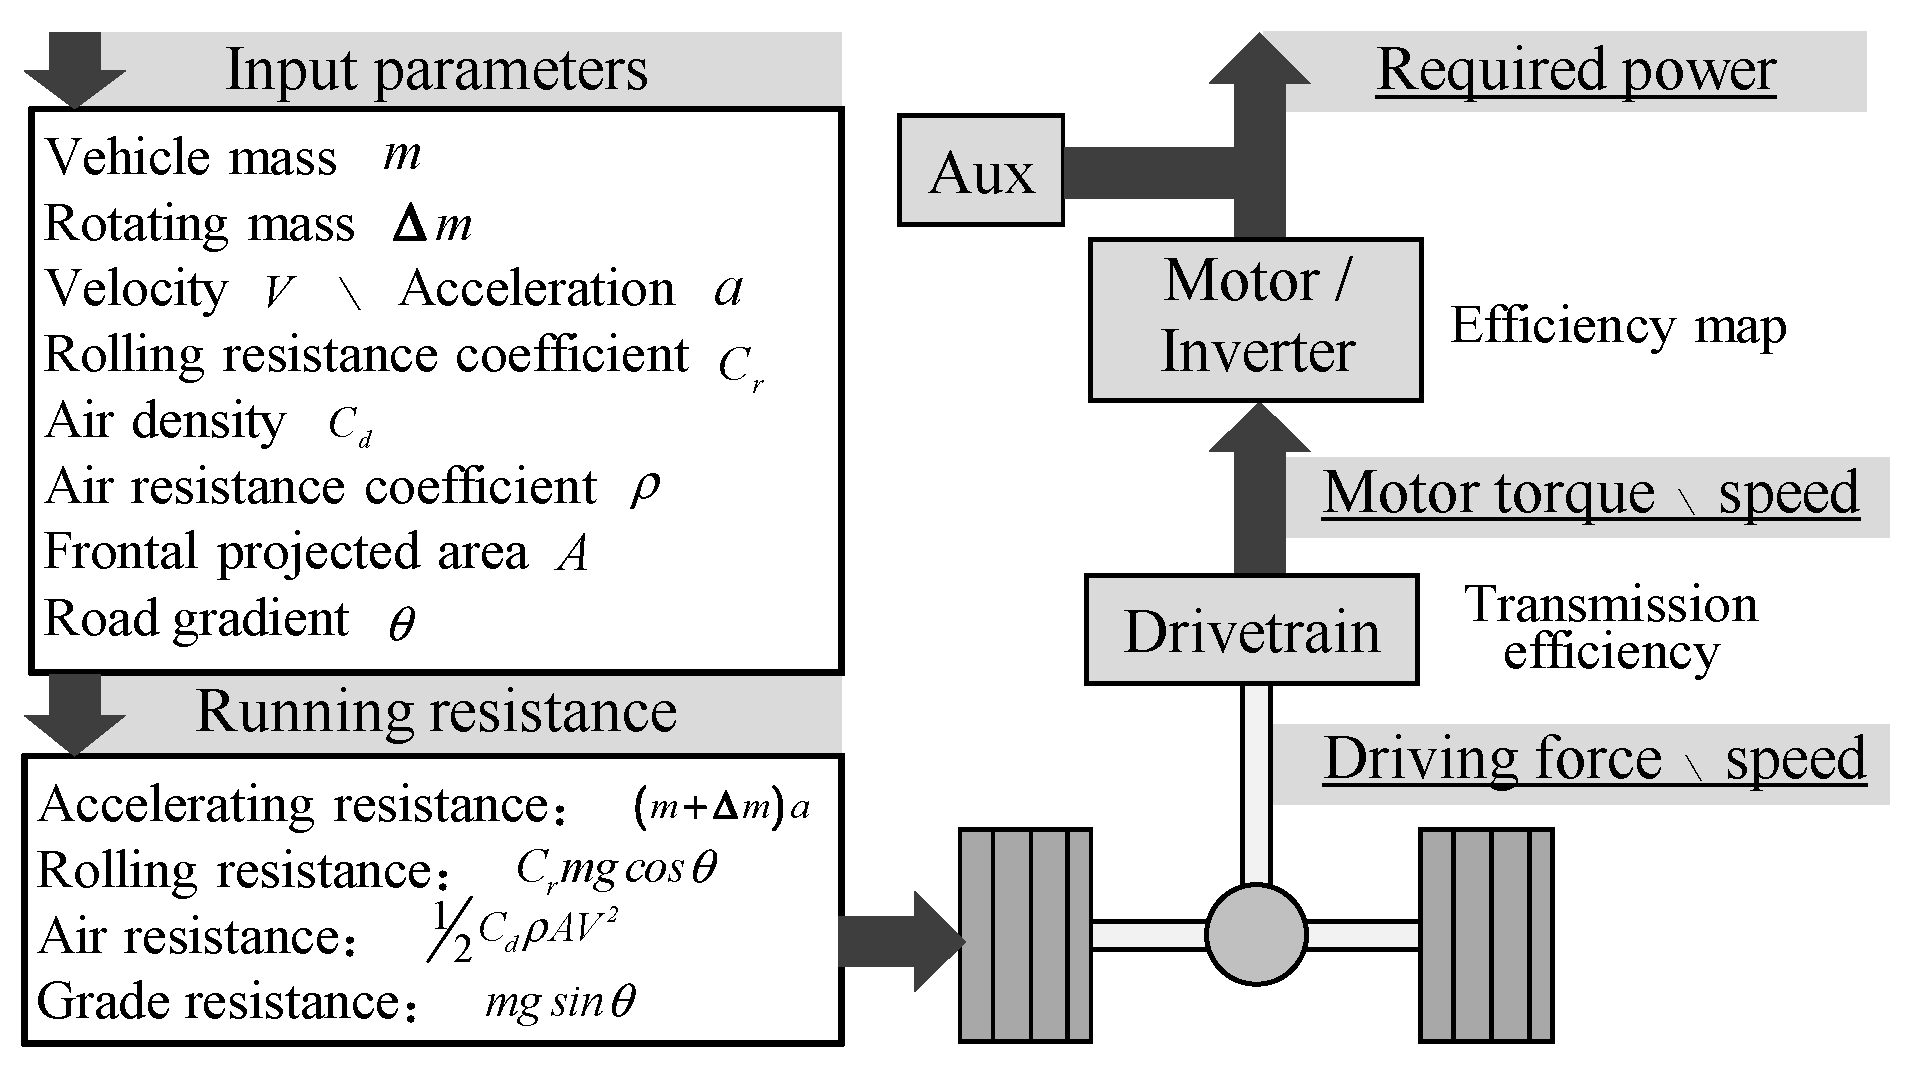
Figure 1 shows the schematic of the backward simulator used to calculate driving energy of WEB-3A. The power consumed by the battery is obtained by inputting the vehicle’s speed.
We optimized the drive of 400 m (or 800 m) with an average speed of 30 km/h as mentioned above. First we define a cost function to search for the speed change pattern that consumes least energy, as shown in Equation (1).
Here, C [kWh] is the consumed energy, t [s] is time, P [kW] is consumed power, and j [m/s3] is the jerk (control variable).
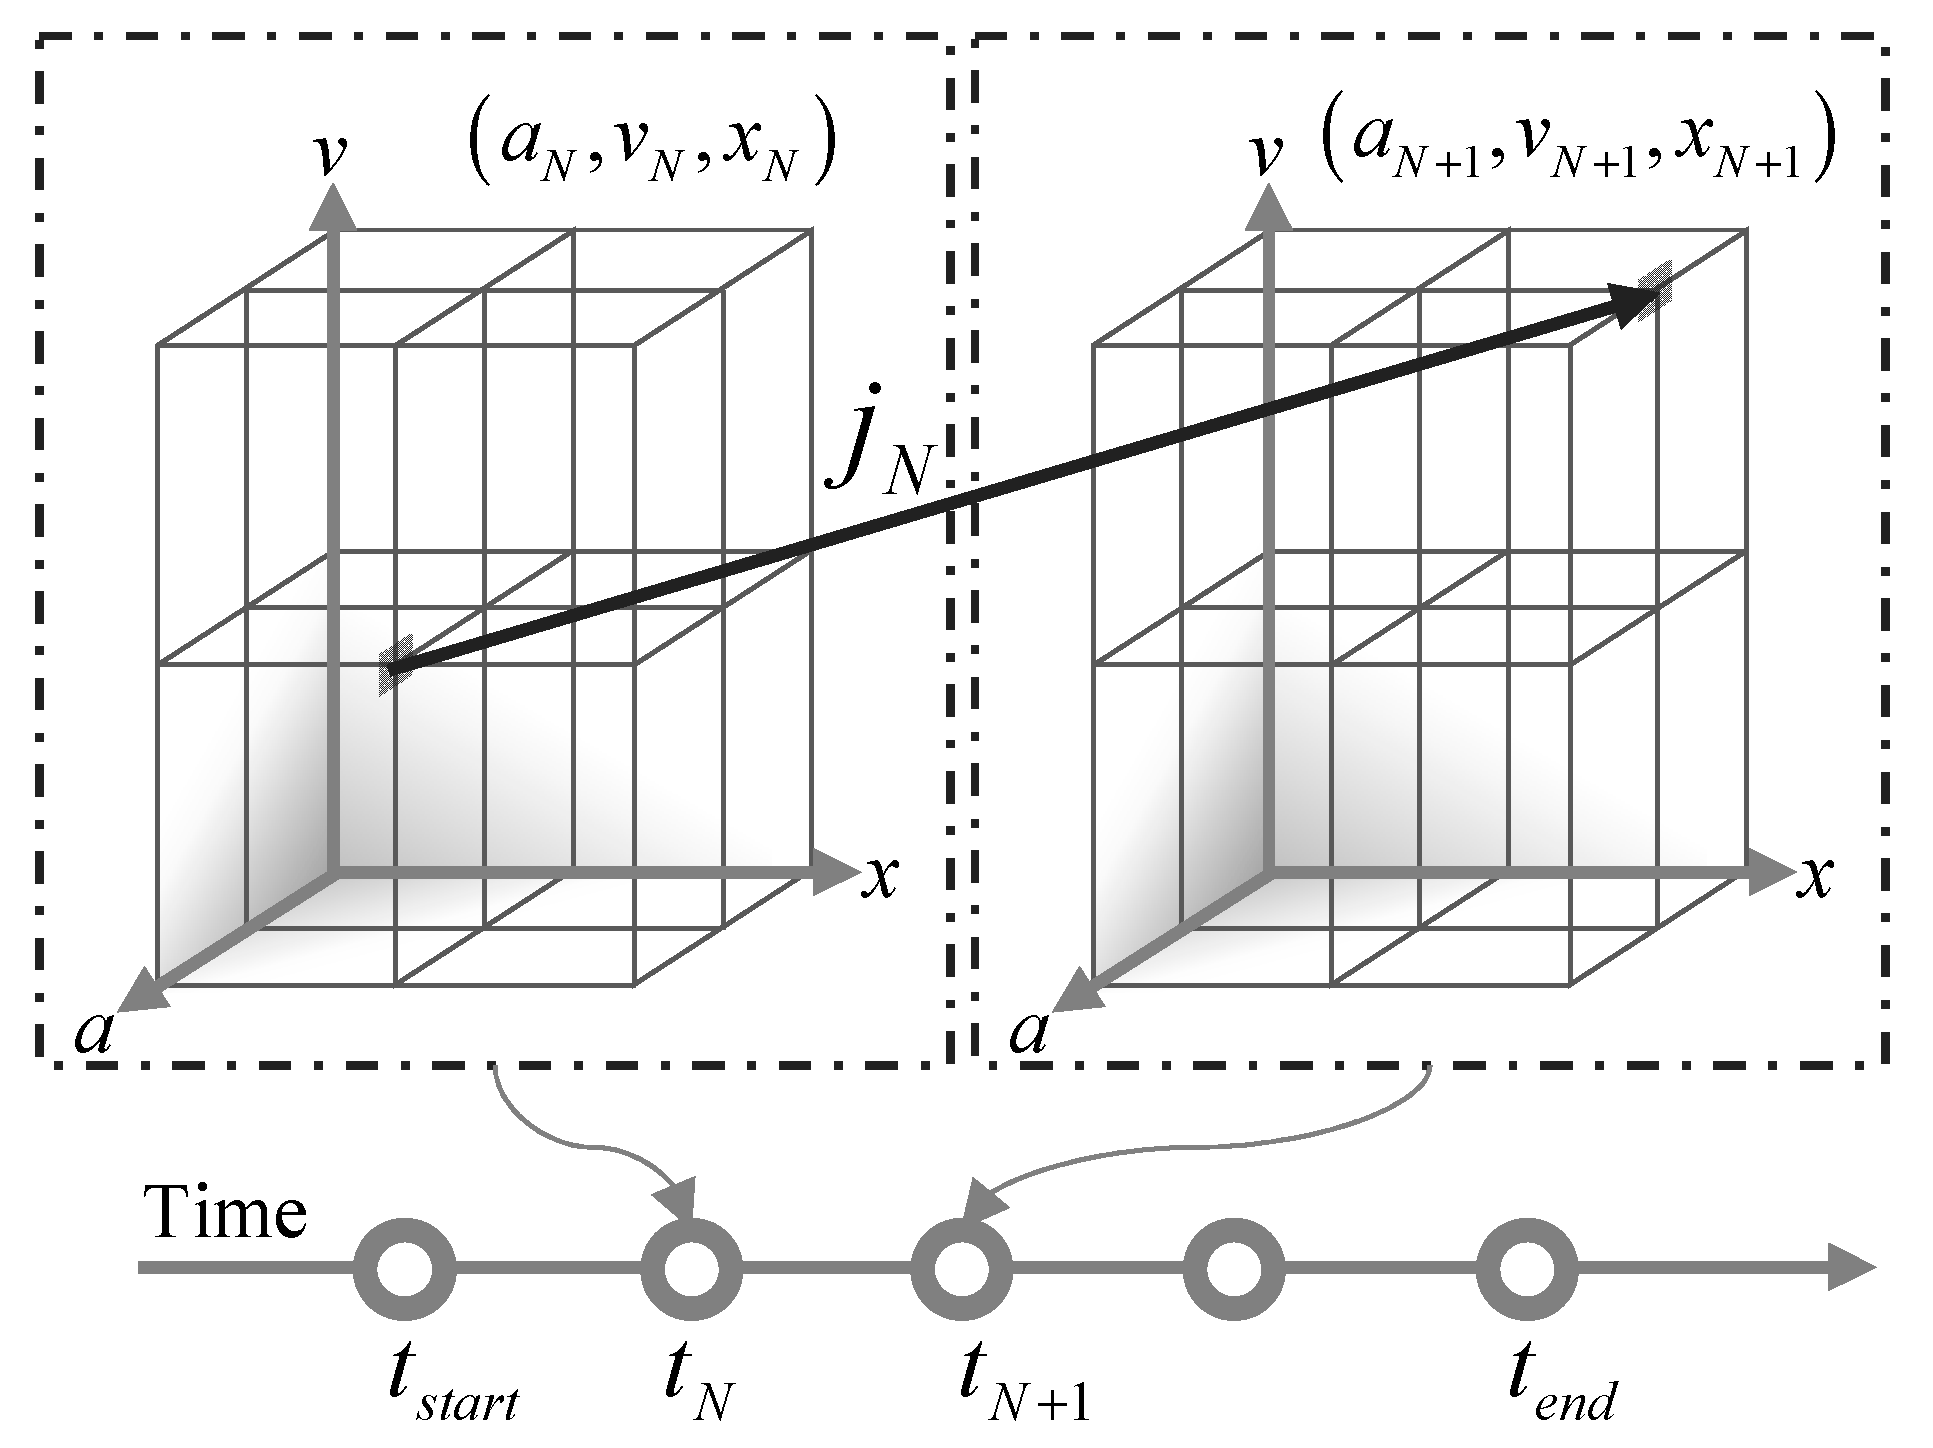
Figure 2 shows a schematic of the optimization method used in this study (dynamic programming) (
x [m] represents position,
v [m/s] represents speed, and
a [m/s
2] represents acceleration). The following are the constraints and convergence conditions: (a) maximum jerk of ±1 m/s
3, (b) maximum acceleration (deceleration) of ±0.2 G, (c) starting (stopping) speed of 0 km/h, and (d) maximum speed of 60 km/h.
The speed change pattern is optimized by incorporating the proposed optimization method into the vehicle’s driving energy calculation simulator. Calculations are performed in the following order: (a) relationship among acceleration, speed, position, and time as state variables and jerk as the control variable, (b) input the state variables of each tiny time period into the vehicle simulator to calculate the battery electricity consumption, and (c) search for the combination that minimizes the cost function.
3. Investigation and Trial Calculation of the Electricity Consumption Optimization Speed Change Pattern
3.1. Derivation of the Electricity Consumption Optimization Speed Change Pattern
In this section, we summarize the optimization of the speed change pattern for various conditions.
Vehicle loss conditions are listed in
Table 2. In addition, we investigate the use of “coasting,” which has gained attention recently for improving the electricity consumption of electric vehicles. In most cases, coasting is not advantageous in terms of fuel efficiency or safety in internal combustion vehicles; thus, it is not employed in regular driving. However, it is widely employed in trains as an eco-driving method. In such cases, coasting has been implemented in electric vehicles. For example, some EVs using one-pedal accelerator, in the neutral range of pedal opening, for the driver’s unintentional fine operation, set a dead zone to keep the output of the motor at 0 Nm, so that the vehicle maintains coasting [
8], while others keep coasting by releasing the accelerator pedal [
9]. Coasting is possible by reducing motor torque to 0 Nm while the inverter is operating [
10] or disconnecting the inverter from the motor [
11]. In the current study, we employed the latter “inverter off coasting control (with coasting control).” Finally, as the second analytical condition, we employed “without coasting control”.
Figure 3 illustrates the simulator’s speed change pattern optimization result. The following section summarizes the details of “with coasting control (Co)” and “without coasting control (W/O Co).”
3.2. Discussion on the Details of the Derived Electricity Consumption Optimization Speed Change Pattern
This section examines the results of “with coasting control (inverter OFF coasting control)” and “without coasting control”, which are derived in the previous section. For detailed discussions, driving is divided into three parts: acceleration, cruising, and deceleration. Due to space constraints, we only present the discussion on the 800 m drive.
First, we consider the acceleration interval.
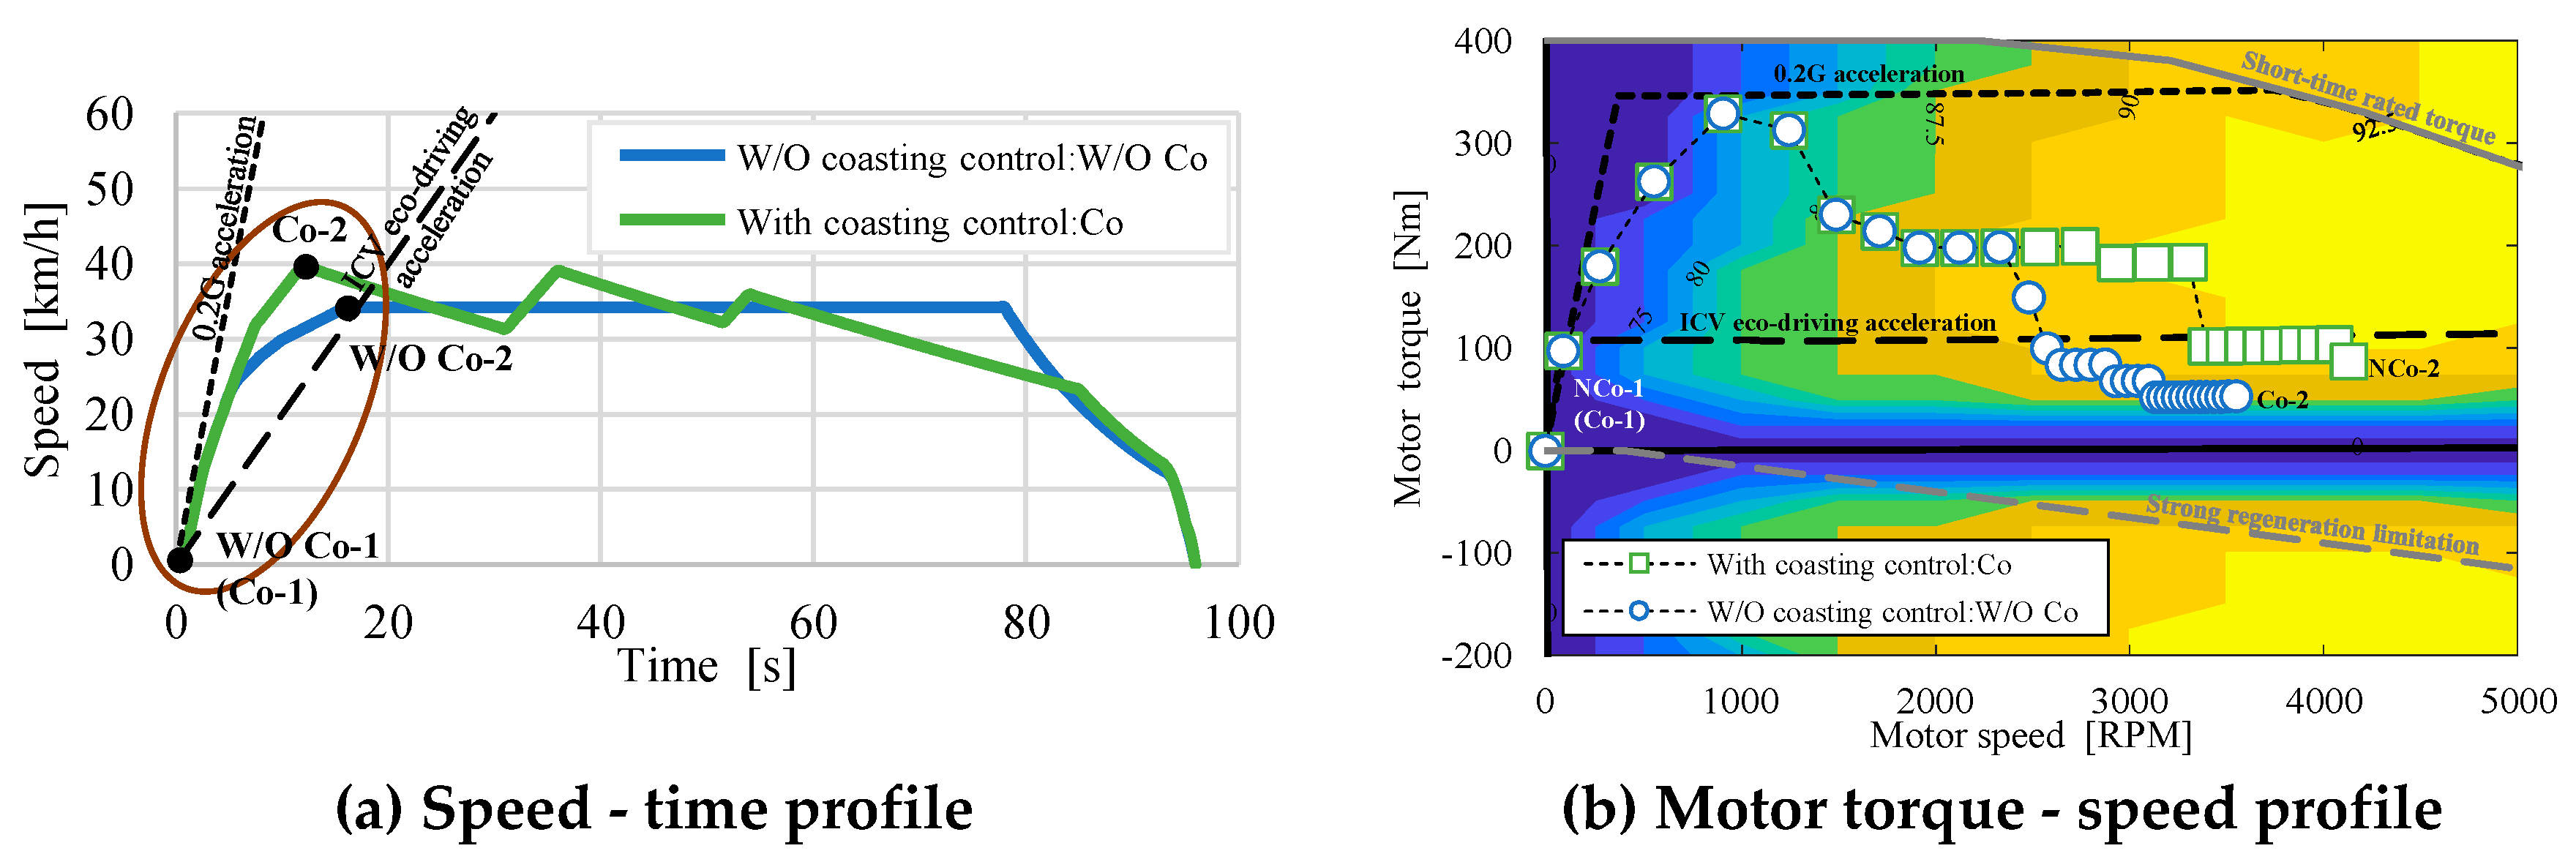
Figure 4 illustrates the details of acceleration interval in optimized speed change patterns. Both type of controls “should accelerate strongly” compared to the typical internal combustion engine eco-driving acceleration pattern [
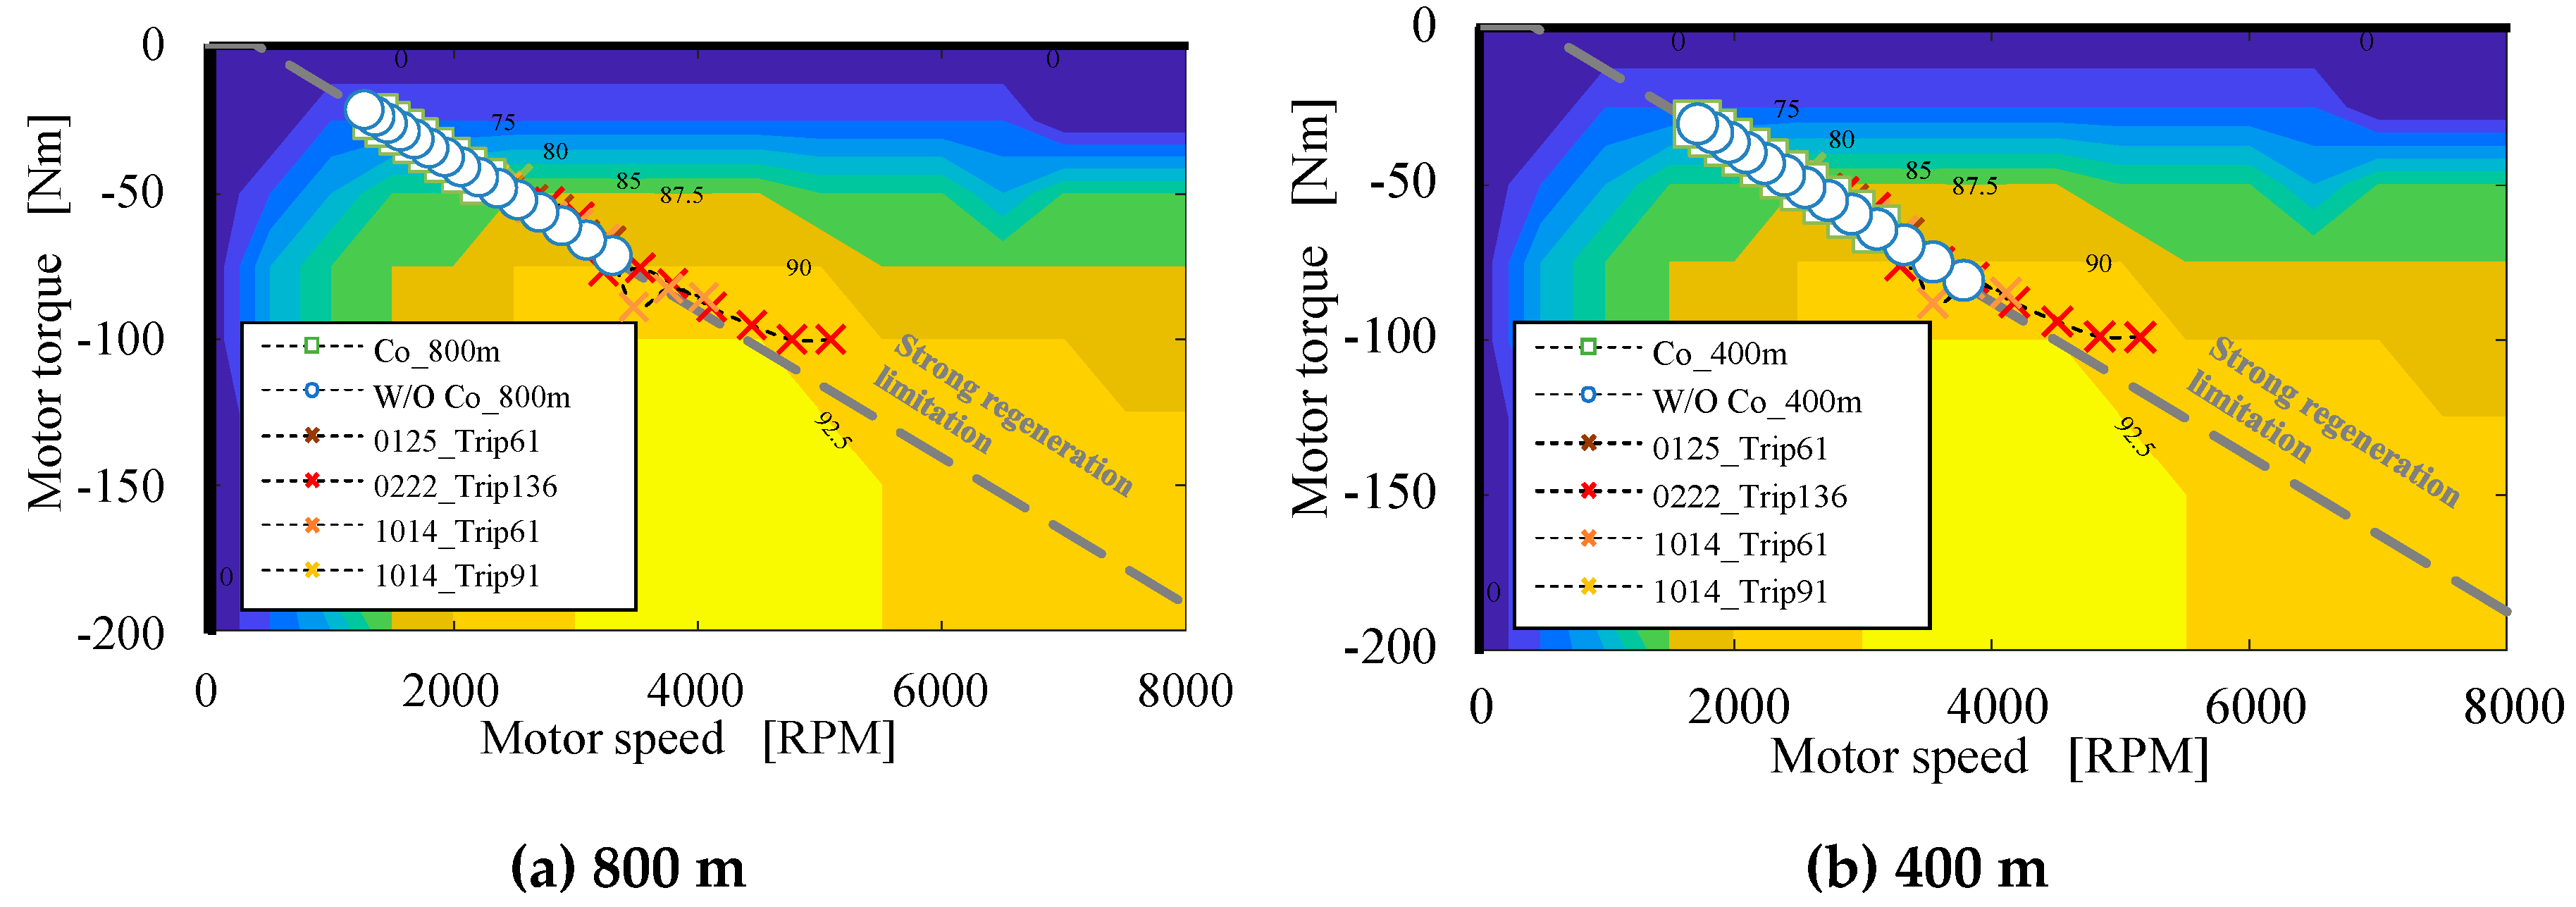
12]. In particular the vehicle starts near the maximum allowable acceleration (0.2 G) based on the optimization calculation, then eases slightly, but remains close to full acceleration. This strong acceleration can reduce the cruising speed under the situation of fixed driving distance and time, thereby reducing the air resistance loss of entire driving trip. When performing similar acceleration for an internal combustion engine heavy vehicle, the engine must be revved high while the gear remains low, leading to poor fuel efficiency. However, the motor is resistant to load changes while maintaining good efficiency across a wide range of operating points. Therefore, strong acceleration is not a major issue in terms of electricity consumption. From the motor operating points of
Figure 4, which demonstrate that good efficiency is maintained. For a diesel bus, if a bus “accelerates slowly” while leaving a bus stop, it may disrupt traffic flow and potentially cause accidents. Thus there is a safety concern. However, with an electric bus, while passenger comfort is important, relatively strong acceleration to merge safely into the traffic does not cause a major issue in electricity consumption.
Next, we consider the cruising interval.
Figure 5 shows the details of cruising interval in optimized speed change patterns. “With coasting control” is “repetition of acceleration and coasting” while “without coasting control” is “constant speed driving,” which is also recommended for internal combustion engine heavy vehicles as well. From the motor operating points of
Figure 5, in some cases, repetition of acceleration and coasting may be preferable to constant speed driving in cruising interval (depending on the loss when the motor operating point is at 0 Nm). This conclusion is similar to “coasting-powering operation” being recommended for trains.
Finally, considering the deceleration interval,
Figure 6 shows the details of deceleration interval in optimized speed change patterns. Both type of coasting controls was described as “deceleration while maintaining the maximum regeneration.” To maximize regenerative energy recovery, this is a speed change along the vehicle-set regenerative braking line (break line in motor operating points of
Figure 6). Energy dissipation due to mechanical braking in the same interval can be prevented, thereby contributing substantially to the improved efficiency. Note that when using “with coasting control”, coasting deceleration has advantages over regenerative deceleration in energy-saving and is therefore preferred. Afterwards, it switched to regenerative deceleration for the stronger deceleration. After reaching near the minimum regenerative speed, it decelerates or stops using mechanical braking. This operation is comparable to that of a diesel bus.
3.3. Calculation of the Improvements to Electricity Consumption with the Derived Electricity Consumption Optimization Speed Change Pattern
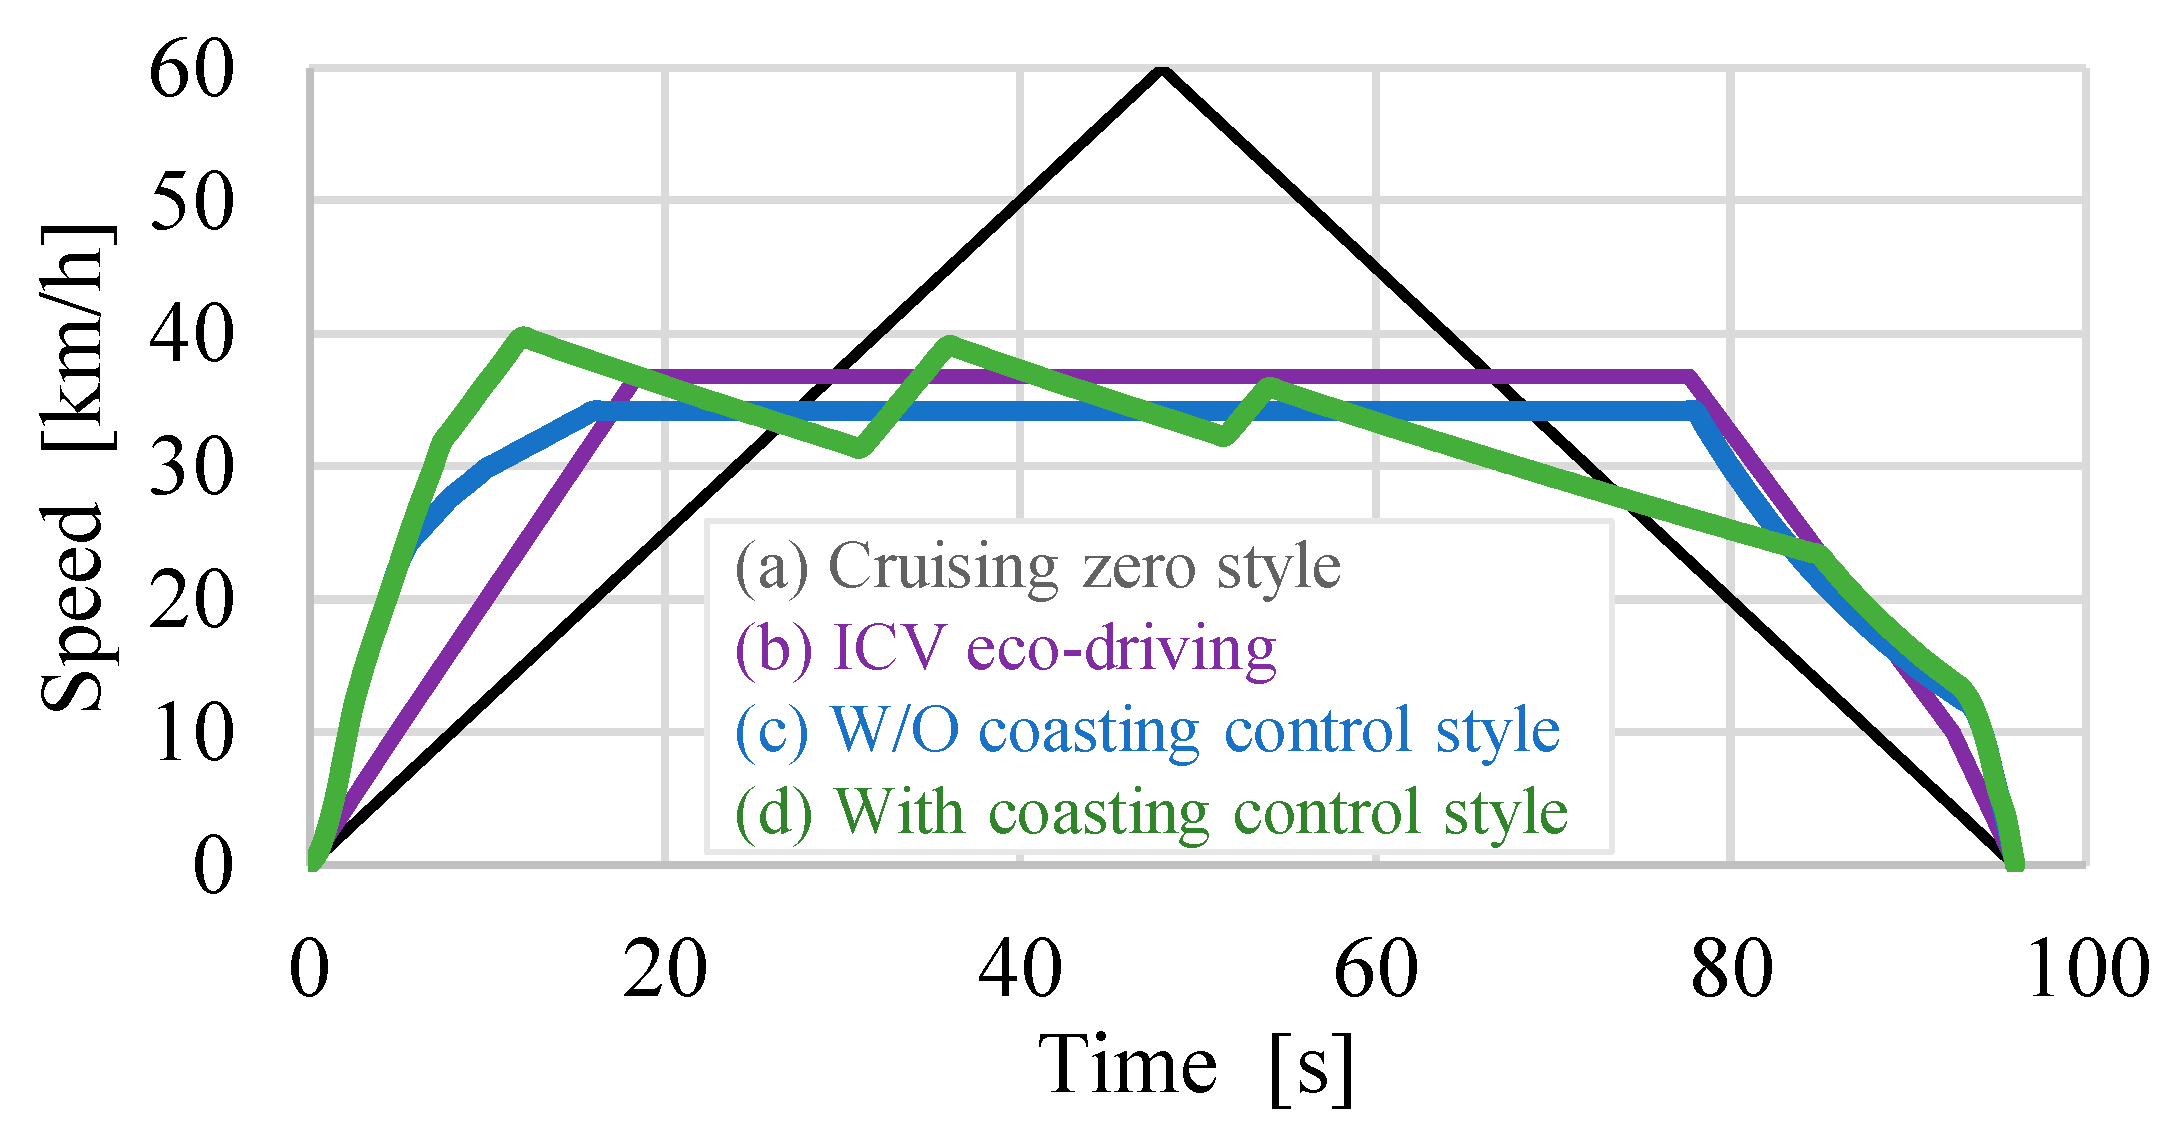
In this section we compare the electricity consumption when the target vehicle, WEB-3A, is driven with the various electricity consumption optimization speed change patterns. We specifically used the electricity consumption during (a) cruising zero style (constant acceleration interval and constant deceleration interval without cruising) as the reference and compared this value to the (b) ICV eco-driving speed change pattern for diesel buses, and the optimization speed change pattern when the two types of coasting control mentioned above were used ((c) without coasting control and (d)with coasting control). Based on relevant reference [
12], as for (b), we considered the slow acceleration based on gentle acceleration and quick shift up, constant speed cruising, and deceleration with engine brake.
Figure 7 summarizes the speed change patterns.
Table 3 compares electricity consumption derived from the vehicle drive energy calculation simulator. We can quantitatively see that driving with the electricity consumption optimization speed change pattern derived in this study improves electricity consumption.
4. Verification of Derived Speed Change Pattern Optimization Based on the Public Road Driving Test Data
In this chapter, we verify the validity of the speed change pattern optimization derived in previous chapter based on the public road driving test data. The optimization resulted in the following order (without coasting control): “acceleration interval with allowed strong acceleration,” “cruising interval with constant speed,” and “deceleration interval with maintaining the maximum regeneration & mechanical braking”. We compared the optimization result to the measured value for each interval.
4.1. Public Road Driving Test
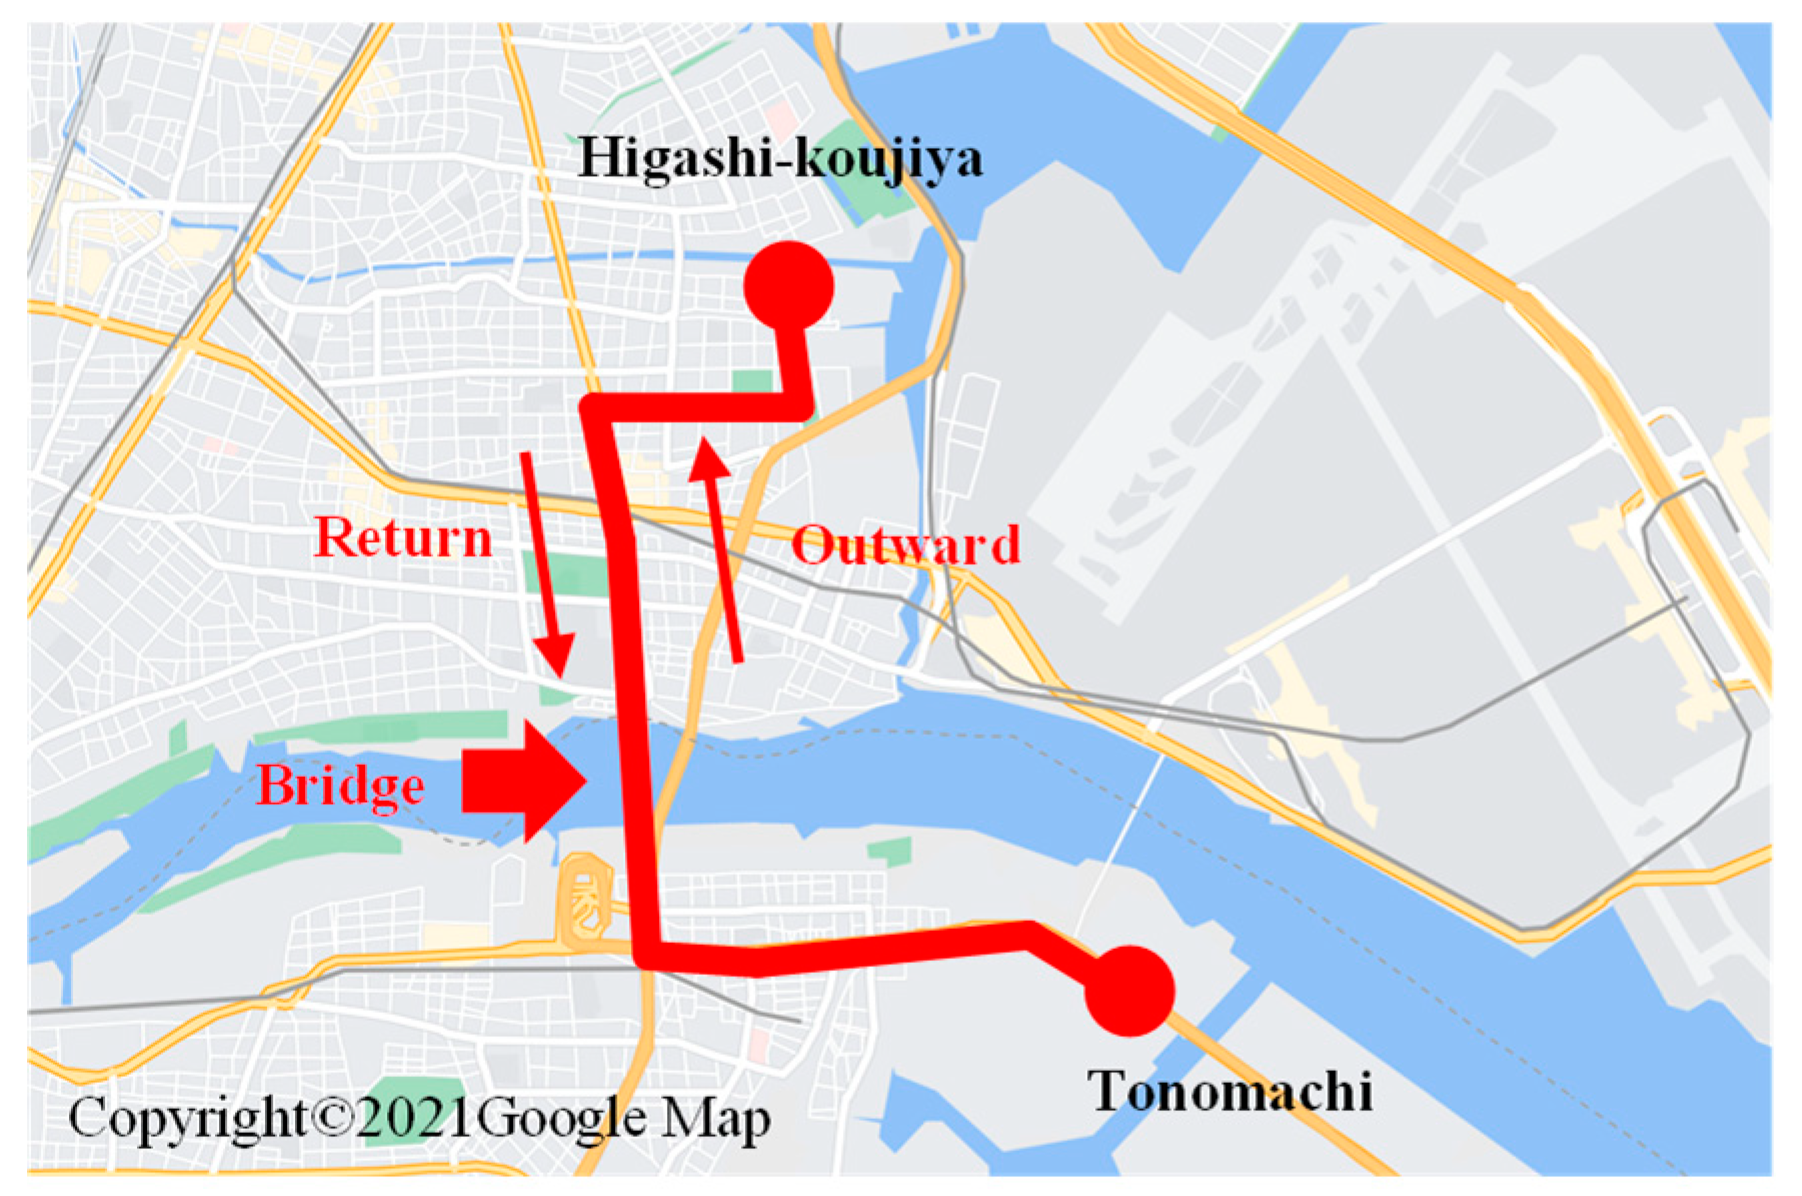
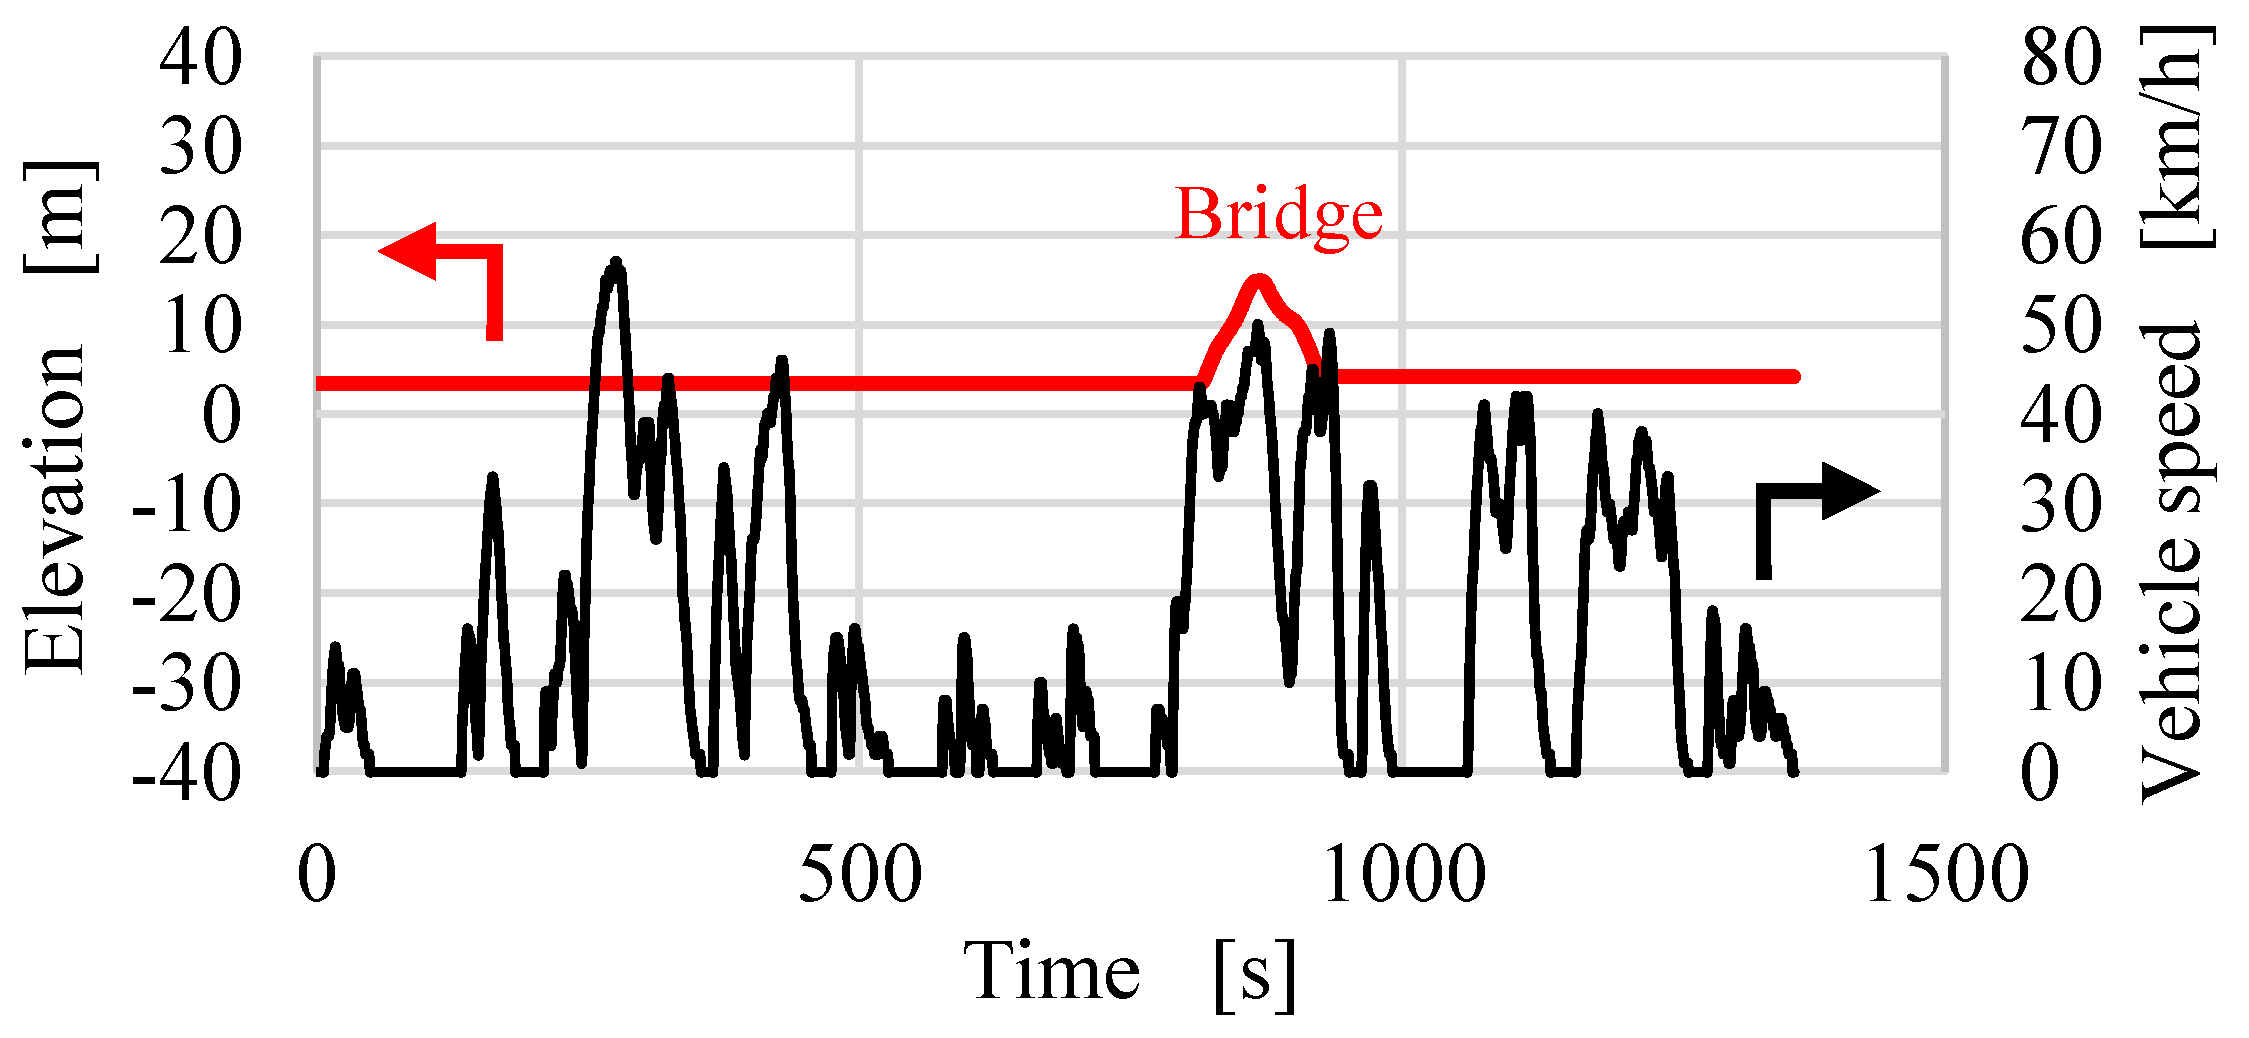
Our research group conducted a 12-month driving test in Tonomachi, Kawasaki City, Japan, using the electric bus WEB-3A (December 2015 to November 2016). This test was conducted four times daily covering a distance of ~5.5 km one way. The vehicle route is shown in
Figure 8, and an illustration of the changes in vehicle speed and elevation along the route is shown in
Figure 9. The route includes a bridge, and the slope changes around it; however, the remainder of the route is flat. In the following test, we extracted various data from the verification test for analysis. We excluded areas with a change in slope. There was no change in the number of passengers because it was a trial operation.
4.2. Verification of Derived Speed Change Pattern Optimization
4.2.1. Comparison of the Optimization Result and Measured Value in the Acceleration Interval
The optimization result was “acceleration interval during which strong acceleration is allowed”.
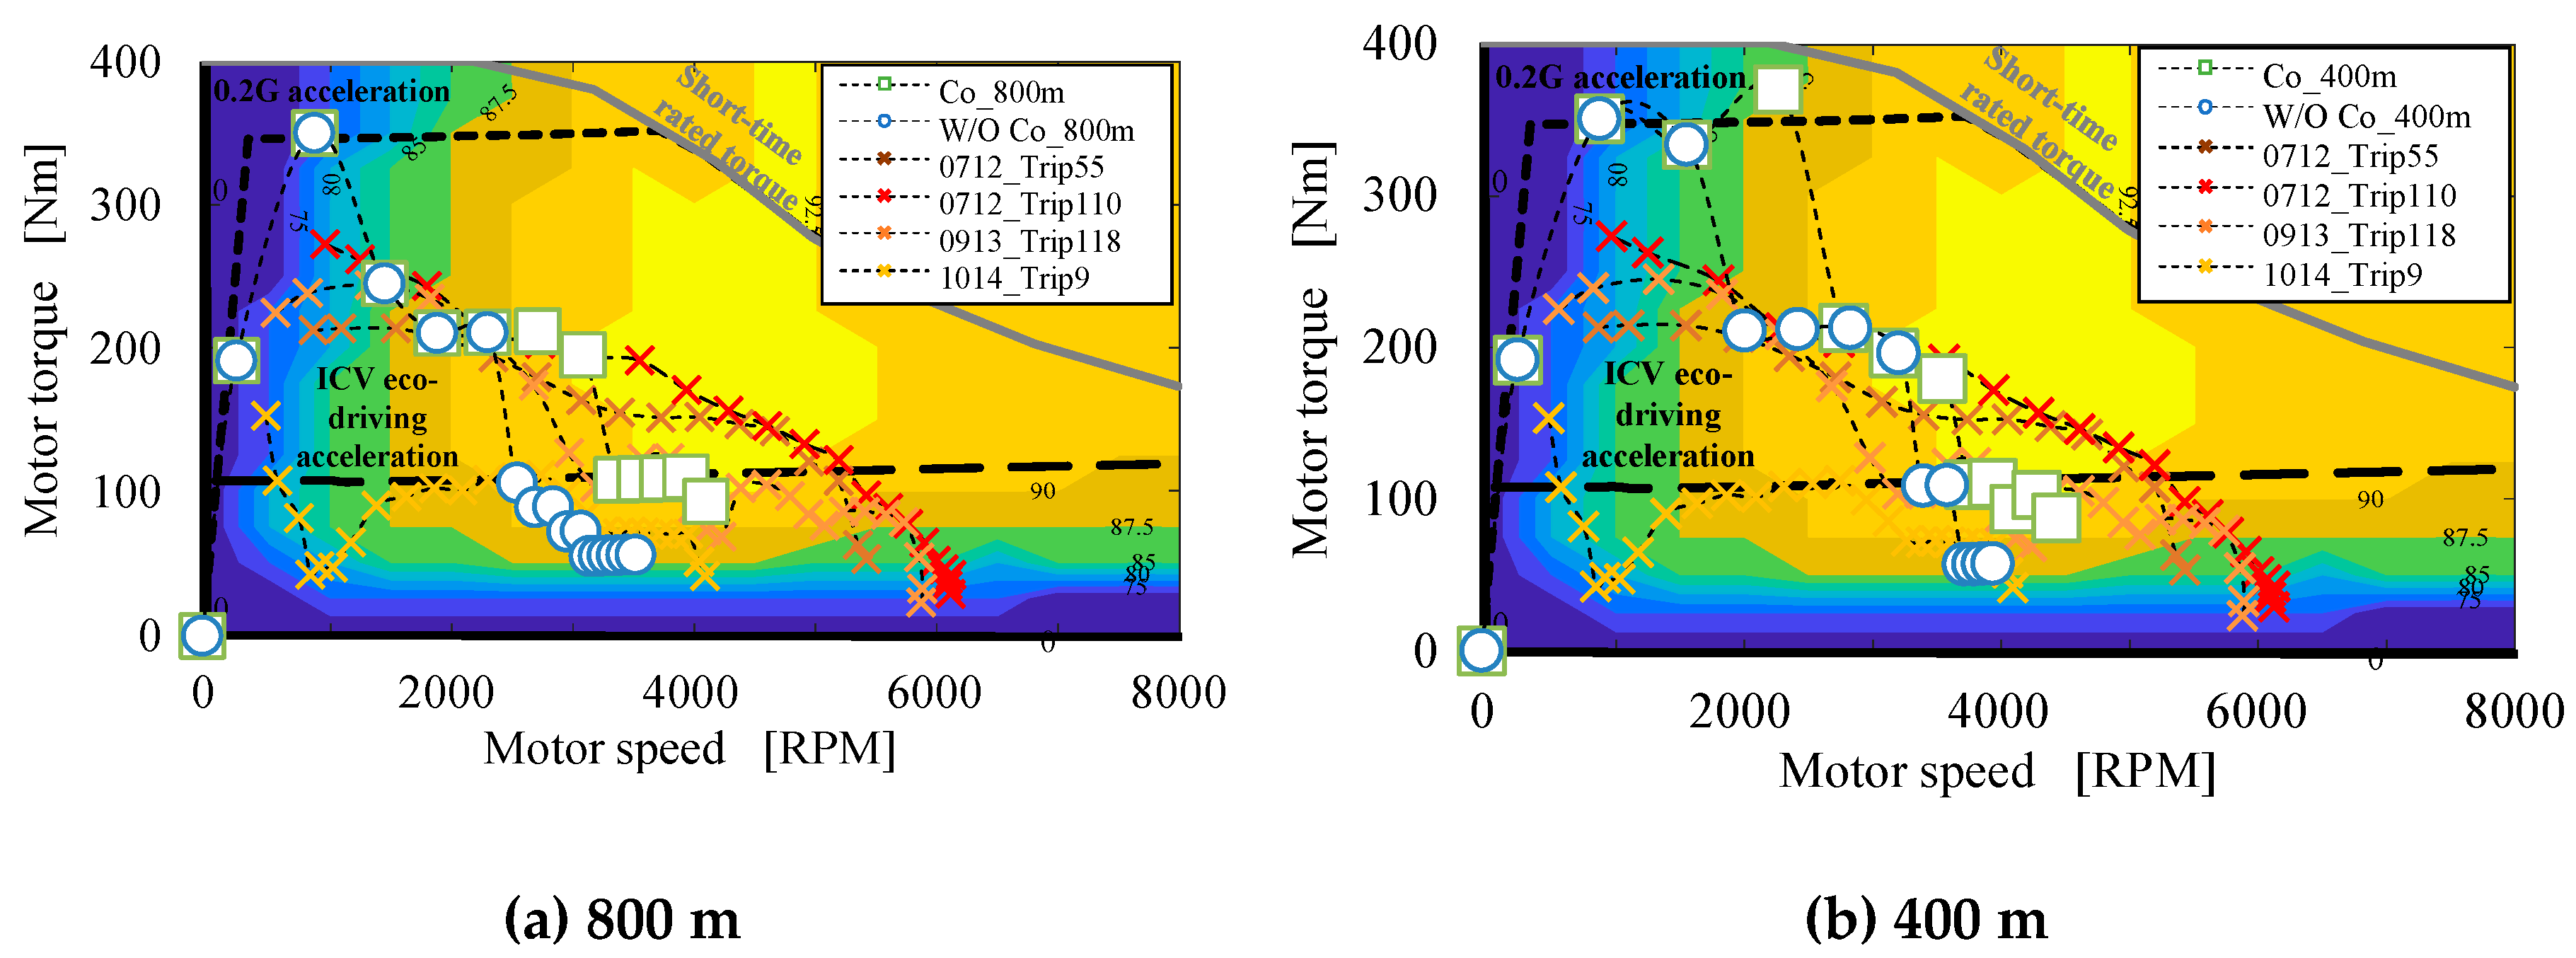
Figure 10 and
Figure 11 show the comparison with the measured value for the speed change pattern and motor operating point, respectively. The four types of values shown with a dotted line are the measured results (e.g., 0712_Trip55 is the 55th trip data from July 12), the two types of optimization results shown with a solid line (e.g., W/O Co means the optimization without coasting control), and the diesel bus’s eco-driving acceleration pattern shown with break line. The most similar to the optimization results and diesel bus’s eco-driving acceleration pattern were extracted from the test data.
Figure 12 and
Figure 13 compare the average motor efficiency (motor output/motor input) and the average vehicle efficiency (motor output/battery output). The figure shows 16 types of acceleration data obtained on the same test day (July 12) as well as four different types of measured values to increase generality. The average efficiency was calculated from start to 30 km/h.
The optimization result and the measured result were consistent. Specifically, efficiency remained rather constant regardless of acceleration, indicating that it is quite different from the property of internal combustion vehicles. These results verify the previous optimization result: even if the electric vehicle performs strong acceleration, there will be no deterioration in efficiency.
4.2.2. Comparison of The Optimization Result and Measured Values in the Cruising Interval
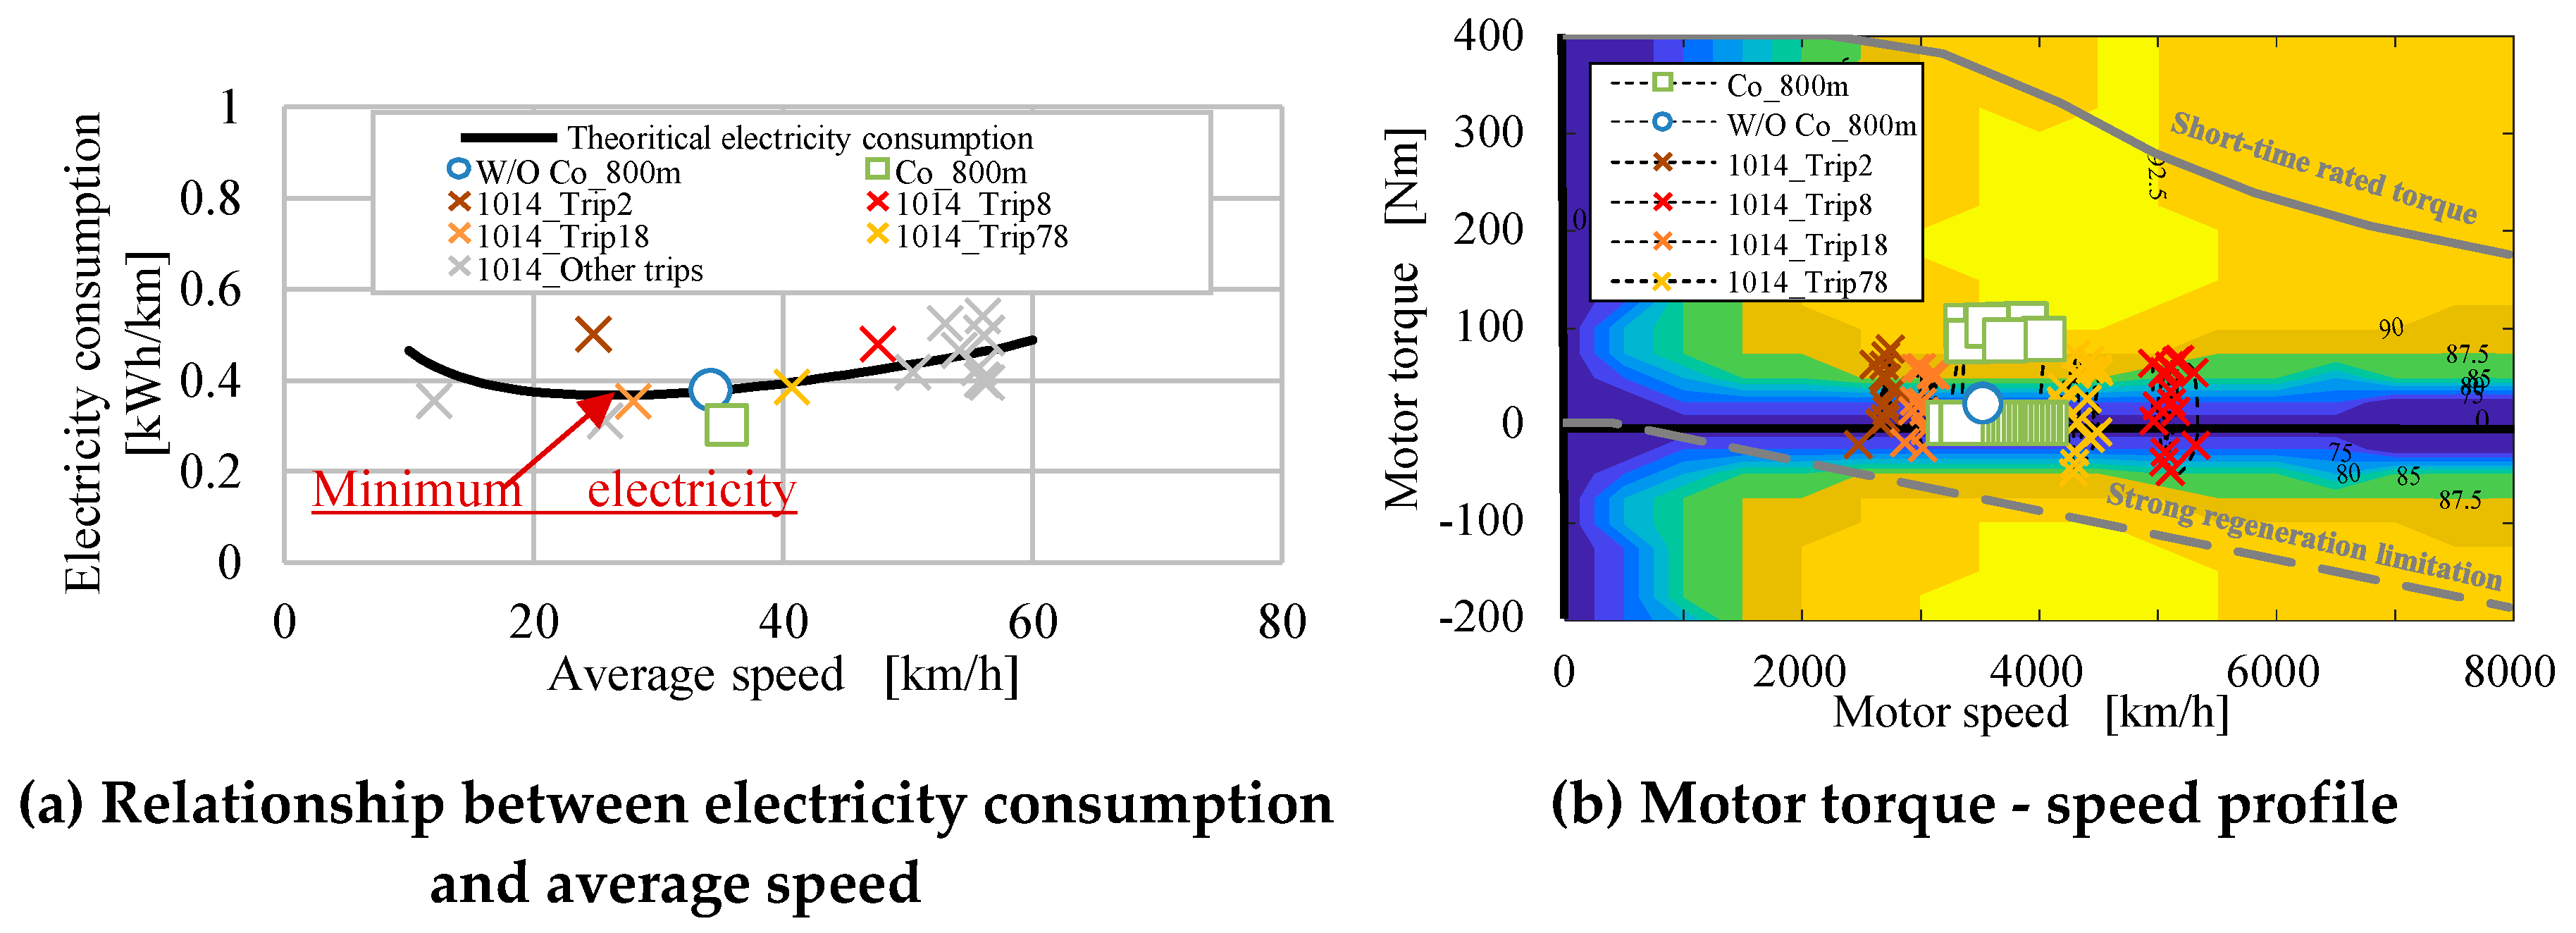
The WEB-3A adopts “without coasting control”, so the optimization result for this type of control was “cruising interval with constant speed”.
Figure 14 shows the comparison of electricity consumption and motor operating point with the measured and optimized values. The figures illustrate 14 types of data obtained on the same test day (October 14), when the speed change was within ±2 km/h, and the acceleration was within ±1 km/h/s. In (a), the solid line represents the theoretical electricity consumption of a vehicle driven at a constant speed. The optimization result without coasting control is consistent with both the theoretical consumption and measured consumption. Furthermore, the conclusion of the previous section, “acceleration interval with allowed strong acceleration,” has the effect of bringing the vehicle speed in the subsequent cruising interval closer to the theoretical minimum electricity consumption (about 30 km/h); thus, it was a valid optimization result.
4.2.3. Comparison of the Optimization Result and Measured Value in the Deceleration Interval
The optimization result was “deceleration with maximum regenerative drive + mechanical braking”. Here we continue the comparison of “deceleration with maximum regenerative drive.”
Figure 15 and
Figure 16 show the comparison of the speed change pattern and motor operating point with the measured value, respectively.
Figure 17 and
Figure 18 are comparisons of energy regenerative efficiency, with the former representing average deceleration dependency and the latter representing deceleration speed band notation. These are equivalent to regenerative system efficiency (to the motor power generation unit)[
13], which is derived by dividing regenerative energy that was actually generated by theoretically generatable regenerative energy. In order to broaden the scope, we collected 39 different types of deceleration data (other trips) in addition to the four measured values. Furthermore, for comparison, we included six different types of measured regenerative system efficiency when a regenerative/mechanical brake was applied. Overall, the optimization result and measured value were consistent, demonstrating the efficacy of “deceleration with maximal regenerative drive” in electric buses. Additionally, measured data showed that regenerative efficiency (74-96% with a mean of 85%) improved significantly when compared to when the regenerative/mechanical brake was used (33-49% with a mean of 41%).
5. Conclusion
We report a vehicle driving energy calculation simulator with a speed change optimization function proposed in this study. We were able to derive a speed change pattern that optimizes electricity consumption while performing various type of coasting controls using the designed simulator.
Based on the optimization calculation with the simulator, the optimal speed change pattern (BEV eco-driving) was derived for electric buses “without coasting control” and “with coasting control” (assume “inverter off coasting control”). When the target vehicle is driven in the BEV eco-driving speed change pattern, according to our trial calculation, this method can improve the electricity consumption by about 10% - 20% under the same average speed.
To confirm the validity of the optimization result of the speed change pattern derived in mentioned above, we used a small electric bus road driving test data. The optimization result is in the following order (without coasting control): “acceleration interval with allowed strong acceleration”, “cruising interval with constant speed”, and “deceleration interval with maintaining the maximum regeneration & mechanical braking”. We verified these results by comparing them to actual measured data, which is the speed change in each interval, and found that they were consistent.
Specifically, we examined the details of the “acceleration interval with allowed strong acceleration,” which was significantly different from that of a diesel bus, and confirmed with measured data that the previous optimization result—even if an electric bus performs strong acceleration, there will be no deterioration in efficiency. Internal combustion engines have large variations in fuel consumption during acceleration, but the properties of an electric bus, whose efficiency does not depend on the pattern of acceleration change, contributes to eliminating variations in electricity consumption during acceleration.
Author Contributions
Conceptualization, all authors; methodology, Y.F., W.Y., and Y.K.; software, Y.F., and W.Y.; validation, Y.F., and Y.K.; formal analysis, Y.F., W.Y., and Y.K.; investigation, Y.F., W.Y., and Y.K.; resources, Y.K.; data curation, Y.F., and Y.K.; writing—original draft preparation, Y.F.; writing—review and editing, Y.K., T.I., S.U., and M.K.; visualization, Y.F., and W.Y.; supervision, Y.K.; project administration, Y.K.; funding acquisition, Y.K., T.I., S.U., and M.K. All authors have read and agreed to the published version of the manuscript.
Funding
This research received no external funding.
Data Availability Statement
Data are available on request due to restrictions.
Conflicts of Interest
The authors declare no conflict of interest.
References
- Y. Huang, E. C. Y. Ng, J. L. Zhou, N. C. Surawski, E. F. C. Chan, G. Hong, Eco-driving technology for sustainable road transport: A review, Renew. Sustain. Energy Rev. 2018, vol. 93, no. June, pp. 596–609. [CrossRef]
- F. Mensing, R. Trigui, E. Bideaux, Vehicle trajectory optimization for application in ECO-driving, 2011 IEEE Veh. Power Propuls. Conf. VPPC 2011, pp. 9–14. [CrossRef]
- Sundström, L. Guzzella, A generic dynamic programming Matlab function, Proc. IEEE Int. Conf. Control Appl. 2009, no. 7, pp. 1625–1630. [CrossRef]
- Koch, T. Bürchner, T. Herrmann, M. Lienkamp, Eco-driving for different electric powertrain topologies considering motor efficiency, World Electr. Veh. J. 2021, vol. 12, no. 1, pp. 1–19. [CrossRef]
- D. Maamria, K. Gillet, G. Colin, Y. Chamaillard, C. Nouillant, On the use of Dynamic Programming in eco-driving cycle computation for electric vehicles, 2016, pp. 1288–1293. [CrossRef]
- Tokyo Metropolitan Bureau of Transportation, 2019 transport statistics annual report: https://www.kotsu.metro.tokyo.jp/about/information. (accessed on 16 April 2022).
- S. Koyano, H. Okamura, M. Miyagi, K. Kokuryo, Reduction Effect of CO2 by Idling Stop in the Case of Route Buses, Tokyo Metropolitan Institute of Environmental Science Annual Report 2009, pp. 76-85.
- M. Naoki, S. Ikuma, S. Tatsuya, A. Keigo, N. Yohei, e-Pedal system which provides simple driving by capacious throttle pedal controllability with electric brake control, JSAE Congress (Autumn) 2017, pp. 217-222.
- Volkswagen: Brake or Coast? The ID.4’s Intelligent Energy Recuperation Concept. https://motor-fan.jp/article/photo/100003361 (accessed on 21 January 2021).
- H. Kawai, T. Sunohara, Y. Tasaka, S. Fukasawa, Permanent-Magnet Synchronous Motor Propulsion System for Tokyo Metro Ginza Line Trains, Toshiba Review 2008, Vol.63 No.6, pp. 45-49.
- Y. Hisanori, K. Sho, Y. Yoshinori, T. Kota, Development and Future Prospects of PMSM Drive Control Technologies for Railway Rolling Stock, Mitubishi denki giho 2016, vol.90, No.9, pp. 513-516.
- Organization for the Promotion of Low Emission Vehicles, Eco-driving class materials, 2016, unpublished. (Printed in Japanese).
- Tianqi Xu, Yiyuan Fang, Daiki Nishiwaki, Wei-hsiang Yang, Yushi Kamiya, Takehito Imai, Shigeru Ueki, Masayuki Kobayashi, Optimization of Speed Pattern for Improving Electricity Consumption of Electric Bus and Its Verification by Actual Vehicle (1st Report), ~Construction of Theoretical Formulas for Energy Consumption Considering Regenerative/mechanical Brake Settings~, 2021-2022 JSAE KANTO International Conference of Automotive Technology for Young Engineers (ICATYE) 2022, pp. 1-4.
Figure 1.
Image of vehicle running energy calculation simulator.
Figure 1.
Image of vehicle running energy calculation simulator.
Figure 2.
Image of dynamic programming.
Figure 2.
Image of dynamic programming.
Figure 3.
Optimized speed change patterns in different settings.
Figure 3.
Optimized speed change patterns in different settings.
Figure 4.
Details of acceleration interval in optimized speed patterns (distance: 800 m).
Figure 4.
Details of acceleration interval in optimized speed patterns (distance: 800 m).
Figure 5.
Details of cruising interval in optimized speed patterns (distance: 800 m).
Figure 5.
Details of cruising interval in optimized speed patterns (distance: 800 m).
Figure 6.
Details of deceleration interval in optimized speed patterns (distance: 800 m).
Figure 6.
Details of deceleration interval in optimized speed patterns (distance: 800 m).
Figure 7.
Various speed change patterns in different settings.
Figure 7.
Various speed change patterns in different settings.
Figure 8.
Route profile of Tonomachi/ Higashi-koujiya shuttle route.
Figure 8.
Route profile of Tonomachi/ Higashi-koujiya shuttle route.
Figure 9.
Running profile (from Tonomachi to Higashi-koujiya, 2016/9/13-2nd).
Figure 9.
Running profile (from Tonomachi to Higashi-koujiya, 2016/9/13-2nd).
Figure 10.
Speed - time profile at acceleration interval.
Figure 10.
Speed - time profile at acceleration interval.
Figure 11.
Motor torque - speed profile at acceleration interval.
Figure 11.
Motor torque - speed profile at acceleration interval.
Figure 12.
Relationship between motor efficiency and average acceleration.
Figure 12.
Relationship between motor efficiency and average acceleration.
Figure 13.
Relationship between vehicle efficiency and average acceleration.
Figure 13.
Relationship between vehicle efficiency and average acceleration.
Figure 14.
Various comparison at cruising interval.
Figure 14.
Various comparison at cruising interval.
Figure 15.
Speed - time profile at deceleration interval.
Figure 15.
Speed - time profile at deceleration interval.
Figure 16.
Motor torque - speed profile at deceleration interval.
Figure 16.
Motor torque - speed profile at deceleration interval.
Figure 17.
Relationship between energy regeneration efficiency (up to the motor generator) and average deceleration.
Figure 17.
Relationship between energy regeneration efficiency (up to the motor generator) and average deceleration.
Figure 18.
Relationship between energy regeneration efficiency (up to the motor generator) and speed zone.
Figure 18.
Relationship between energy regeneration efficiency (up to the motor generator) and speed zone.
Table 1.
Basic Specifications of WEB-3A.
Table 1.
Basic Specifications of WEB-3A.
| |
Base diesel bus |
WEB-3A |
| Manufacturer / Type |
Hino / Poncho(BDG-HX6JLAE) |
| Capacity |
31 persons |
| Curb / Gross weight [kg] |
5710 / 7415 |
5990 / 7695 |
| Engine or Motor |
132 kW Engine |
145 kW/ 400Nm (PMSM) |
| Transmission |
5 speed AT |
Fixed |
| Battery [kWh] / [V] |
None |
40 / 331(TOSHIBA “SCiB™”) |
| Exterior photograph |
None |
 |
Table 2.
List of various data used for vehicle loss calculation.
Table 2.
List of various data used for vehicle loss calculation.
| Transmission efficiency |
Auxiliary equipment consumption power |
Motor / inverter efficiency
(Using efficiency map data) |
| 98 % |
1.5 kW |
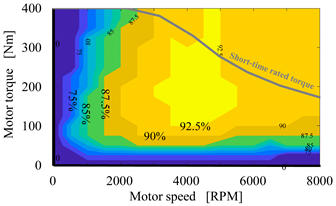 |
Table 3.
Electricity consumption comparison of various speed change patterns in different settings.
Table 3.
Electricity consumption comparison of various speed change patterns in different settings.
| |
Electricity consumption |
| |
[kWh/km] |
[%] |
| (a) Cruising zero style |
0.408 |
(Benchmark) |
| (b) ICV eco-driving |
0.382 |
-6.2% |
| (c) W/O coasting control style |
0.370 |
-10.0% |
| (d) With coasting control style |
0.318 |
-24.2% |
|
Disclaimer/Publisher’s Note: The statements, opinions and data contained in all publications are solely those of the individual author(s) and contributor(s) and not of MDPI and/or the editor(s). MDPI and/or the editor(s) disclaim responsibility for any injury to people or property resulting from any ideas, methods, instructions or products referred to in the content. |
© 2023 by the authors. Licensee MDPI, Basel, Switzerland. This article is an open access article distributed under the terms and conditions of the Creative Commons Attribution (CC BY) license (http://creativecommons.org/licenses/by/4.0/).
