Preprint
Article

Transport and Accumulation of Microplastics Released from Siberian Rivers to the Arctic Ocean

Altmetrics

Downloads

141

Views

84

Comments

0

This version is not peer-reviewed

Submitted:

01 December 2023

Posted:

04 December 2023

You are already at the latest version

Alerts
Abstract
Plastic pollution of the ocean is currently one of the most serious environmental threat. Analysis of observations in the Arctic ocean shows that microplastic particles have been found in Arctic snow cover, sea ice, water and sediments. Possible pathways and deposition locations of microplastics in the Arctic Ocean can be assessed based on 3D numerical modeling of thermohaline structure and water circulation, sea ice conditions and drift. The problem is that in addition to transport by currents, a number of other processes affect the state of microplastics. These include mechanical fragmentation, freezing into sea ice and release back into the water, biofouling, adsorption of contaminants and other factors. In this study, based on scenario calculations for a 5-year period, we analyzed the possible spread of microplastics brought by Siberian rivers to the Kara Sea shelf. The Lagrangian particle model used daily 3D numerical simulation data to simulate microplastic transport by ocean currents and by sea ice drift. The results of a series of scenario calculations show how the distribution of particles and their subsequent deposition depend on their type (density), size, processes of freezing into the ice and biofouling.
Keywords: 
Subject: Environmental and Earth Sciences  -   Pollution

1. Introduction

Plastic pollution of the ocean is one of the most serious environmental threat nowadays. The global load of plastic on the open ocean surface was estimated to be in the order of tens of thousands of tons [1]. In the environment, due to exposure to sunlight and waves, freezing in the polar regions, mechanical abrasion plastic debris gradually crumble [2]. Breaking down it forms the huge amount of tiny particles, size < 5 mm, called microplastic [3] that pose the greatest danger to the environment. Floating microplastic (MP) particles with low density are perceived by living organisms as a food source, which poses a serious risk to them and can lead to their death. Hundreds of publications have documented the impact of plastic debris on the marine ecosystem (e.g. [4,5,6,7,8,9]). In addition, physical and chemical properties of microplastics contribute to the adsorption of contaminants on the surface of particles. Moving up the food chain, microplastics and associated contaminants can enter the human body from seafood [7,8] and affect human health. Measurement data indicate that microplastics are found in different regions of the world’s oceans, from the surface to sediment layer [10].
Although assessing pollution transport in Arctic waters is challenging due to the inaccessibility of the region and the lack of a permanent observations, plastic pollution has been detected in sea ice [11,12,13,14] , water masses [15,16,17,18], deep-sea sediments [19,20] and in ecosystems [19,21]. In addition to local sources (fishery, marine industrial activities, and wastewater), significant sources of plastic are remote regions at lower latitudes from which pollution is transferred to the Arctic by ocean currents, atmospheric flows and rivers. Observations show that a significant portion of plastic enters the Arctic from the North Atlantic [15,17] and the North Pacific [11,20,22]. As a result of the analysis of water samples in the Eurasian basin, river flows were determined to be the second largest source of microplastic pollution in the region [15]. With huge catchment areas, Arctic rivers cross the territory of large cities, industrial and agricultural areas and receive wastewater of unknown purity [23]. The amount of debris in the Siberian shelf seas indicates a low contribution of rivers in autumn [24], but massive river discharges in late spring or summer make potentially significant impacts.
The analysis of observational data describing the concentration of plastic in the marine environment is accompanied by consideration of a wide range of physical and chemical-biological processes affecting its distribution in the ocean (see [25] for review). There are a number of physical processes that could determine the pathways and fate of microplastics in the marine environment. Here we highlight some of them that we are investigating.
Processes associated with ocean dynamics facilitate the transport of particles over long distances from the original source of pollution.The oceanic pathways followed by the floating debris could be explored using a surface transport model based on data from the Global Drifter Program [17]. Constantly improving numerical models of ocean circulation make it possible to calculate the velocity of currents on regional and global scales.
The difference in the densities of particles and sea water determines the intensity of vertical displacement of particles, their ability to remain buoyant or to sink into the deeper layers, settling on the seafloor [19]. The presence of particles in the marine environment is accompanied by a concentration of organisms on their surface (biofouling), affecting their buoyancy. Many field studies have shown that the accumulation of biomass, often visually observed on samples, is one of the main mechanisms for changing the chemical and physical properties that can influence the vertical transport of the plastic particles in the water column (e.g. [26,27,28,29]).
While in polar regions, microplastic particles become embedded in sea ice and move with its drift, which might be different from the current system of the surface layer. Observations revealed that the amount of MP in Arctic sea ice is extremely high and therefore sea ice can be considered as a temporary sink for MP [11,12,13,14]. Currently, little is known about the behavior of microplastics at the interface of seawater and ice, in particular about the mechanisms of particle entrapment into the ice and release with saline brine back into the ocean and others. A variety of physical processes underlie the interaction of ice and plastic particles [25,30]. To understand this process, a number of laboratory studies have attempted to determine the percentage of plastic particles freezing into the ice [31,32,33].
An increasing number of publications on microplastic in the marine environment include not only observational analysis but also works based on numerical modeling. Despite the shortcomings of the numerical approach noted in the review [25], the method of numerical modeling enables to simulate the transport of microplastics in different areas of the World Ocean, makes it possible to trace the trajectory of particles, determine areas of their accumulation, and to study the sensitivity of the results to parameterization of physical and biological processes. Currently, similar research for the Arctic Ocean is limited [34,35,36].
One of the few studies devoted to the numerical modeling of the fate of MPs in the Arctic Ocean is the work [36]. The authors used Lagrangian particle advection to simulate the long-term transport of buoyant microplastic from northern European rivers into Arctic waters using results from 3-dimensional modeling. As can be understood from the text of the work, the processes of particle freezing into ice and biofouling were not considered. To model vertical movement of buoyant particles the authors used a random 10 cm vertical displacement of the particles every hour within the upper 20 m of the water column. As a result of the study, microplastic dispersal was shown along the Eurasian continental shelf, over the North Pole, the Nordic Seas, and accumulation zones over the Nansen Basin, the Laptev Sea, and the ocean gyres of the Nordic Seas.
The study [34,35] used an Eulerian approach to simulate three-dimensional plastic distribution in the World Ocean, including polar regions. A range of both positively and negatively buoyant plastics were considered. The rising and sinking velocities of MPs were calculated based on a balance between friction and buoyancy determined by the difference between the density of sea water and particles. Process of biofoling was not considered. In contrast to [34,36], the study [35] took into account MPs incorporation into sea ice.
To clarify the most critical physical processes influencing the distribution of microplastics, in this work, we performed a series of numerical sensitivity experiments. The source of the microplastics was considered to be the waters of the two major Siberian rivers, the Ob and the Yenisey, which flow into the shelf of the Kara Sea (Figure 1). Unlike previous researchers, we carried out calculations for only 5 years. The results of 3D numerical simulations series show the influence of particle size, particle type (density), physical and biological processes (freezing into ice and biofouling) on the propagation path of particles and their subsequent deposition.

2. Data and Methods

2.1. Method of numerical simulation of the Arctic Ocean and sea ice state

Large-scale ocean circulation is the most powerful way to transport MP particles from estuaries to deep-sea regions. Numerical simulations of the Arctic Ocean circulation, sea ice and water mass variability were carried out using of three-dimensional numerical ocean and sea ice model SibCIOM (Siberian coupled ice-ocean model) [37,38]. The ocean model is based on Reynolds-averaged primitive equations using Boussinesq and hydrostatic approximations. The conservation laws for heat, salt and momentum which are written in the orthogonal curvilinear coordinates and physical z-vertical coordinate system. The tracer advection is based on the multidimensional extension of QUICKEST scheme [39,40]. Some physical processes, which can not be adequately resolved by the numerical model, are described by parameterizations, such as parameterization of vertical convective and turbulent mixing, formation of slope flows or cascading [41].
The ocean model is coupled with the sea ice model CICE v3 [42]. The ice model simulates the rheology and multi-category sea ice thermodynamics [43] and advection on the basis of a semi-lagrangian scheme [44].
Numerical simulations were performed for the modeling domain covering the Arctic Ocean bounded by the Bering Strait, and the Atlantic Ocean north from 20S. The three-polar numerical grid has a resolution of 0.5 in the Atlantic Ocean and from 10 to 25 km in the Arctic, about 15 km in the Arctic shelf seas. The vertical grid consists of 38 levels. The minimum shelf depth is 12.5 m.
NCEP/NCAR atmospheric reanalysis data [45] were used to set forcing at the ocean and sea ice surfaces. The initial fields of temperature, salinity, current velocity, and sea ice distribution for 2016 were taken from the results of our previous calculations using the SibCIOM model [46], carried out since 1948.
Water inflow at open boundaries has a prescribed transport, temperature, and salinity. The incoming Bering Strait water has characteristics recommended by climatology data from [47]. The river discharge corresponds to the [48] database. Monthly mean discharge data for the largest Arctic rivers (Lena, Yenisey, Ob, Pur, Kolyma, Yana, Indigirka, Olenek, Northern Dvina, Pechora, Mackenzie) were taken from the ArcticGRO (Arctic Great Rivers Observatory) Discharge Dataset [49] for the period 2016 to 2020. Monthly average temperatures of Eurasian rivers were obtained from Arctic River Discharge and Temperature (ARDAT) dataset [50].
The SibCIOM model was tested in coordinated experiments of the international project FAMOS (Forum for Arctic Modeling ans Observational Synthesis [51]) and in comparisons with observational data [52,53,54]. The model results [38,55,56] showed that SibCIOM is able to simulate the interannual and seasonal variability of the water and sea ice in the Arctic Ocean and the Arctic Shelves.

2.2. Method of simulation of microplastic transport

The distribution of microplastics in the marine environment was modeled using the Lagrangian particle tracking model. The basic displacement of the passive tracer in the model was determined as d r = U d t , where d r ( d x , d y , d z , t ) is the displacement, U = ( u o c n , v o c n , w ) defines the particle velocity when the tracer was in the water, and U = ( u i c e , v i c e , 0 ) if movement of particles freezing into ice was considered. The values of the horizontal velocity components u o c n , v o c n were provided by the large-scale ocean model. The vertical velocity was calculated as w = w o c n + w s , where w = w o c n is ocean velocity in the vertical direction and w s is sinking or rising velocity of the MP particles determined based on their properties. Marine microplastics show wide range of densities, sizes and shapes that determine their buoyancy. In this study, the vertical velocity of the particles was calculated according to [57]
w s ( x , y , z , t ) = ν 2 R d 3 38.1 + 0.93 d 12 / 7 7 / 8 ,
where
d = 2 R g ν 2 ρ p ρ o c n ρ o c n 1 / 3 .
Here ρ o c n is the three-dimensional seawater density from SibCIOM model results, g is the gravity, ρ p is the plastic density, R is the particle radius, ν is kinematic viscosity.

2.2.1. Ice freezing and melting

Freezing and melting of sea ice are among the most fundamental processes that determine the state of the water masses in the Arctic Ocean. Plastic particles located in the ocean surface layer can be frozen into the ice and move by the ice drift. With the summer onset and ice melting, MPs release to the water. To determine the freezing rate of microplastic particles, we relied on the work [32,33], where the authors showed that microplastics actively freeze into the ice in a relatively short time.
We assumed that daily probability of plastic inclusion into ice is estimated to be 10%, provided that the ice freezes and the local ice area exceeds 50% concentration. The possibility of MP release into water during ice melt for every grid point was estimated as P = Δ V i V i , where V i ( x , y , t ) is ice volume and Δ V i ( x , y , t ) is the local ice volume change over time Δ t . To exclude changes in ice volume due to transport alone, we additionally used an information about the ice melting rate at this point.

2.2.2. Biofouling

Data on the dynamics and timescales of biofouling of plastic are limited. Biofouling sufficient to sink buoyant microplastics has been described theoretically in [58], where some approximate estimates of the basic spatial and temporal scales describing the particles behavior of different densities and shapes in the Baltic Sea were obtained.
Considering biofouling, which leads to an increase in average particle density and sinking rate, the authors found that for spherical particles and a constant fouling rate proportional to surface area, the time to fouling to water density is directly proportional to the radius of the sphere. Based on the findings of [58], the change in particle density with biofouling was calculated using the formula
ρ p = ρ 0 R 0 3 R 0 3 + B T 3 + ρ b 1 R 0 3 R 0 3 + B T 3 ,
where R 0 is the initial radius of the particle, ρ 0 is the density of the polymer, ρ b equals to 1.38 g/cm3 in the experiments (as proposed in [59]), B T = B T 0 + B R · Δ t is the thickness of biofouling, the change of which over time is determined by the biofouling rate B R and the initial biofilm thickness B T 0 .
It was also assumed that the biofouling rate depends on the time of year, being maximum in the spring and tending to zero with the onset of winter. The schematic drawings in the work [60] depict a temporal development of ice algae and phytoplankton blooms. By analysing these drawings we created a functional relationship to determine the time dependence of the biofouling rate for microplastic particles as
B R = B R m a x · f ,
where B R m a x is maximum value of biofouling rate, f equals f i c e or f o c n , depending on particle location, and describes seasonal variability of biofouling as follow
f i c e = 1 3 · e t t i c e / 10 , t t i c e e t t i c e / 10 2 , t > t i c e , ,
f o c n = e t t o c n / 20 2 , t t o c n e t t o c n / 20 , t > t o c n .
Here t denotes time in days. Our study used t i c e = 140 and t o c n = 165 days.

2.3. Experimental design

The transport of MP particles was simulated during the period 2016-2021 using simulated data on the state of the Arctic Ocean obtained from 3D numerical modeling, namely: the daily averaged ocean arrays of velocity, temperature, salinity, and sea ice arrays of thickness, concentration, drift velocity, and ice melting rate.
We simulated the transfer of microplastics entering the Kara Sea shelf area with the waters of the Yenisey and Ob rivers. To model the Lagrangian transferof MPs we assumed that each particle is associated with a volume of microplastics equal to 5 tons. The output of each particle into the seawater was calculated based on the average annual volume of pollution discharge (795.55 t/year for the Ob and 117.85 t/year for the Yenisey [61] and average monthly river discharge [48]. Since according to [61] the Lena River microplastic influx was estimated to be 0.17 t/year, its contribution is very small and will not reach the value transported by one particle in our experiments in five years.
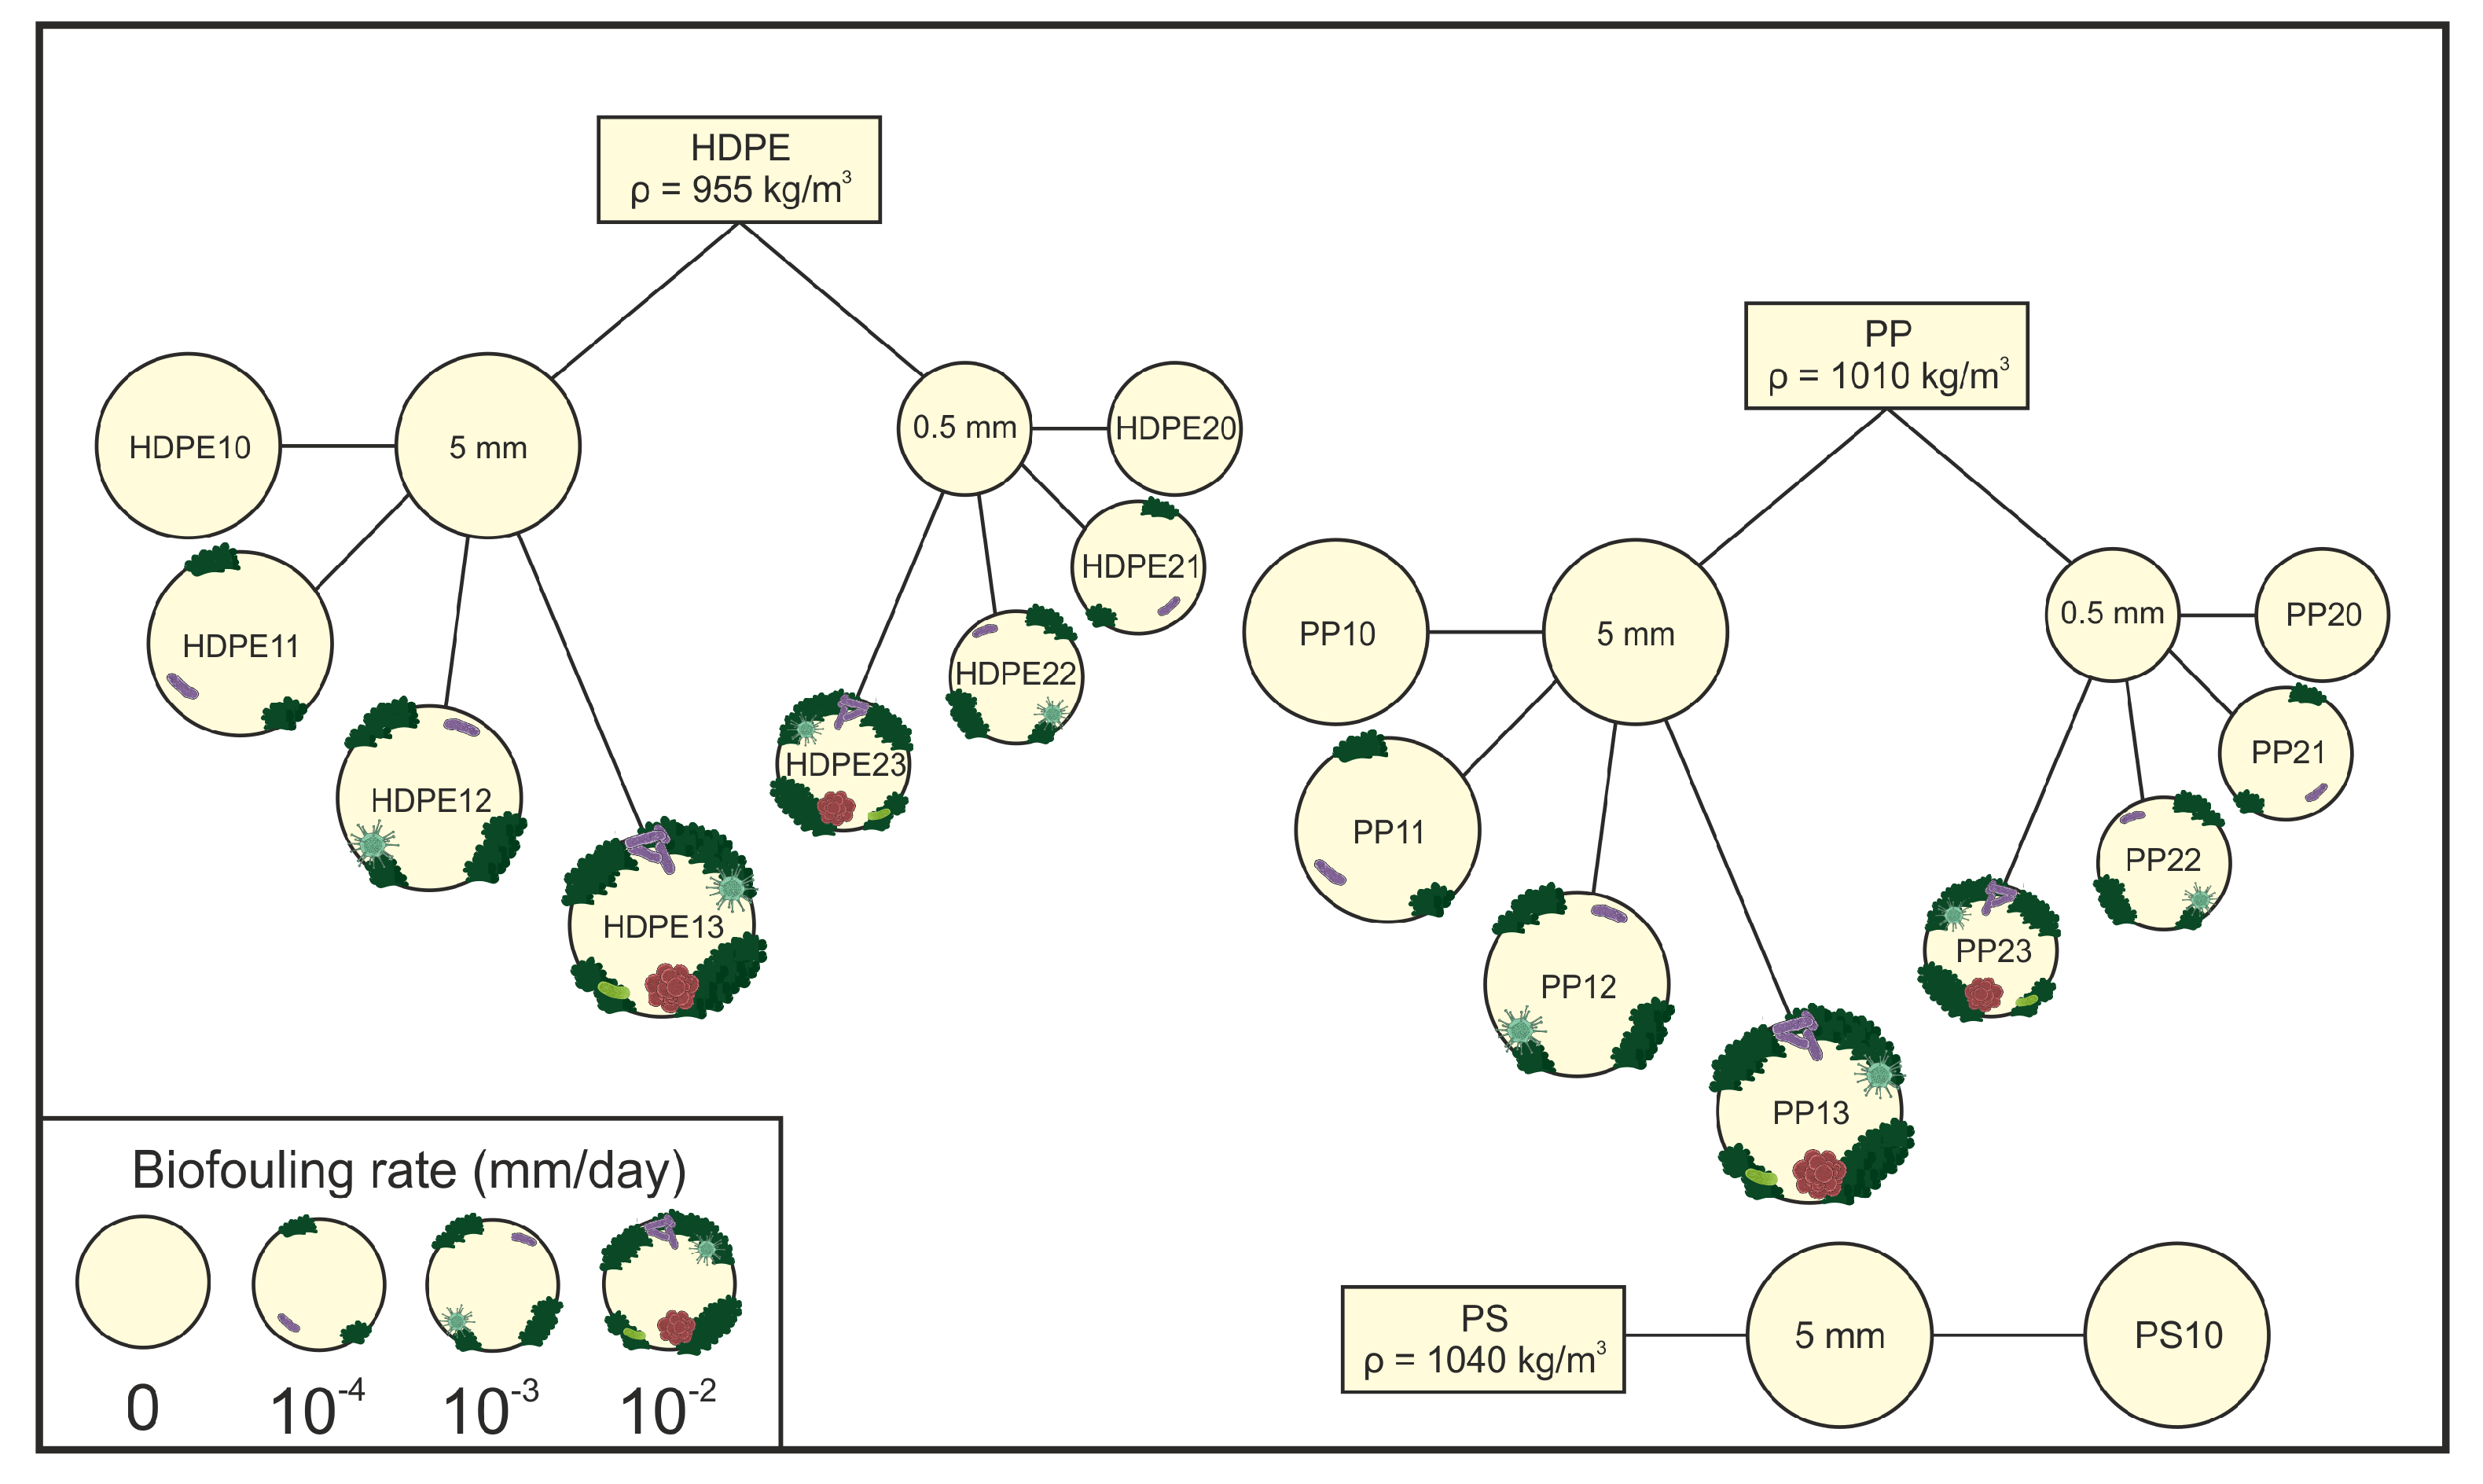
A series of sensitivity experiments based on the same hydrological characteristics were conducted. The following parameters were varied: plastic type, particle size, probability of freezing in sea ice, and biofouling rate. Of the seven most common types of microplastics [34], 3 types were considered, namely: high-density polyethylene (HDPE, density 955 kg/m3), polypropylene (PP, density 1010 kg/m3), and polystyrene (PS, density 1040 kg/m3). The first two types of microplastics (HDPE and PP) have a density lower than that of seawater and are classified as buoyant plastics. Polystyrene (PS) has a density greater than that of water, so it is considered negatively buoyant. Microplastic particles were assumed to be of two sizes, 5 and 0.5 mm.
First, the control experiment included all types of MPs (HDPE, PP and PS). In the experiment, riverine microplastics were carried by the ocean currents, the particles could be incomporated into sea ice during ice freezing and transported by ice drift, and released back into the water during ice melt. Biofouling was not considered in the control experiment.
The second series of experiments was carried out to study whether biofouling influences the transport of buoyant microplastics (HDPE, PP) and results in their removal from surface waters.To investigate the effect of biofouling on MPs, we used three values of maximum biofouling rate to calculate its seasonal distributions, namely 10 4 , 10 3 , and 10 2 mm/day. These values were chosen to reproduce the time period when biofilm on plastic becomes visible [62]. The third sensitivity simulation focused on MP size. At the same time, all plastic choices and all biofouling rate options were considered for each particle size. Figure 2 shows an illustration of the sensitivity experiments.
At the end of our study, several experiments investigated the effect of the microplastic incorporation into sea ice. A few values for specifying the probability of particle freezing were tested, namely P = 0 , 0.01, 0.1 and 0.9. The sensitivity study was conducted for the lightest HDPE microplastic with a particle size of 5 mm. Biofouling rate of 10 3 mm/day was used that allowed a number of particles to hold in the surface layer.

3. Results

3.1. Control experiment. Biofouling excluded

The control experiment included microplastic input to the Kara Shelf from the Ob and Yenisey Rivers. The key processes under consideration included microplastic transfer by ocean currents, plastic particle freezing into ice and transfer by ice drift, and MP release back into the water during ice melt. The experiment was carried out for three types of MP (HDPE, PP and PS). Biofouling was not considered in the control experiment.
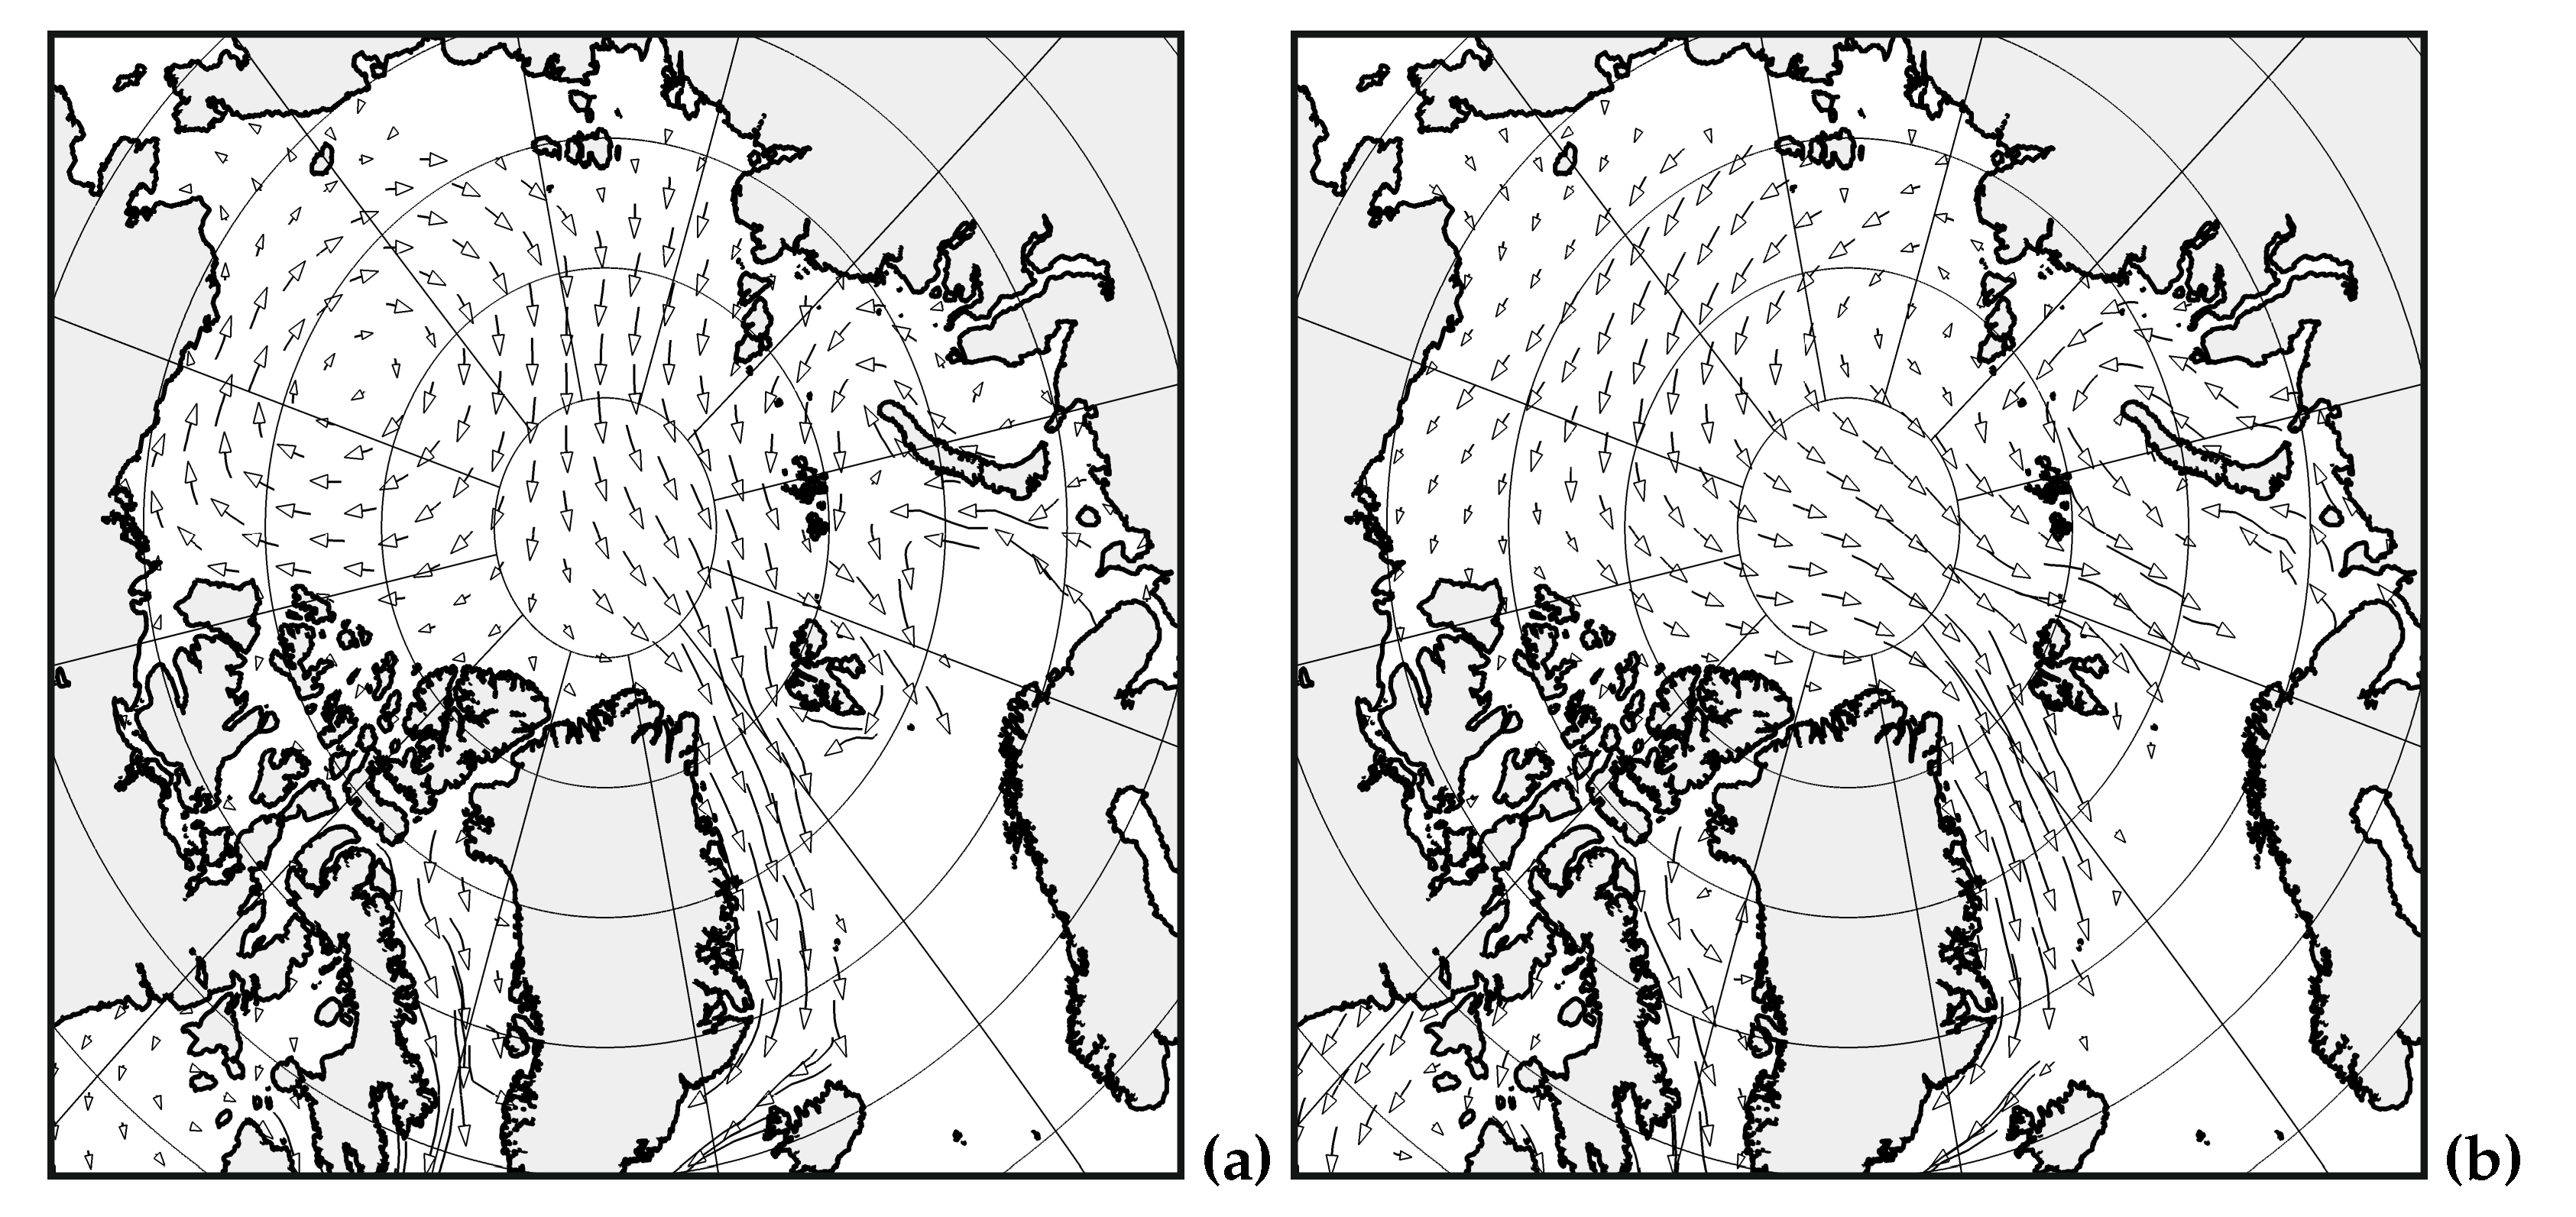
The main drivers of microplastics transport in the ocean are water circulation and ice drift. Sea ice is the most dynamic part of the ocean-ice system of the Arctic Ocean. Under the action of wind, its drift can change quite rapidly, up to the opposite direction. Figure 3 presents two most characteristic types among the numerous variants, simulated by the numerical model: anticyclonic and cyclonic. In both cases, despite the opposite direction of circulation, there is a flow carrying sea ice from the Arctic Ocean to the Greenland Sea through Fram Strait.
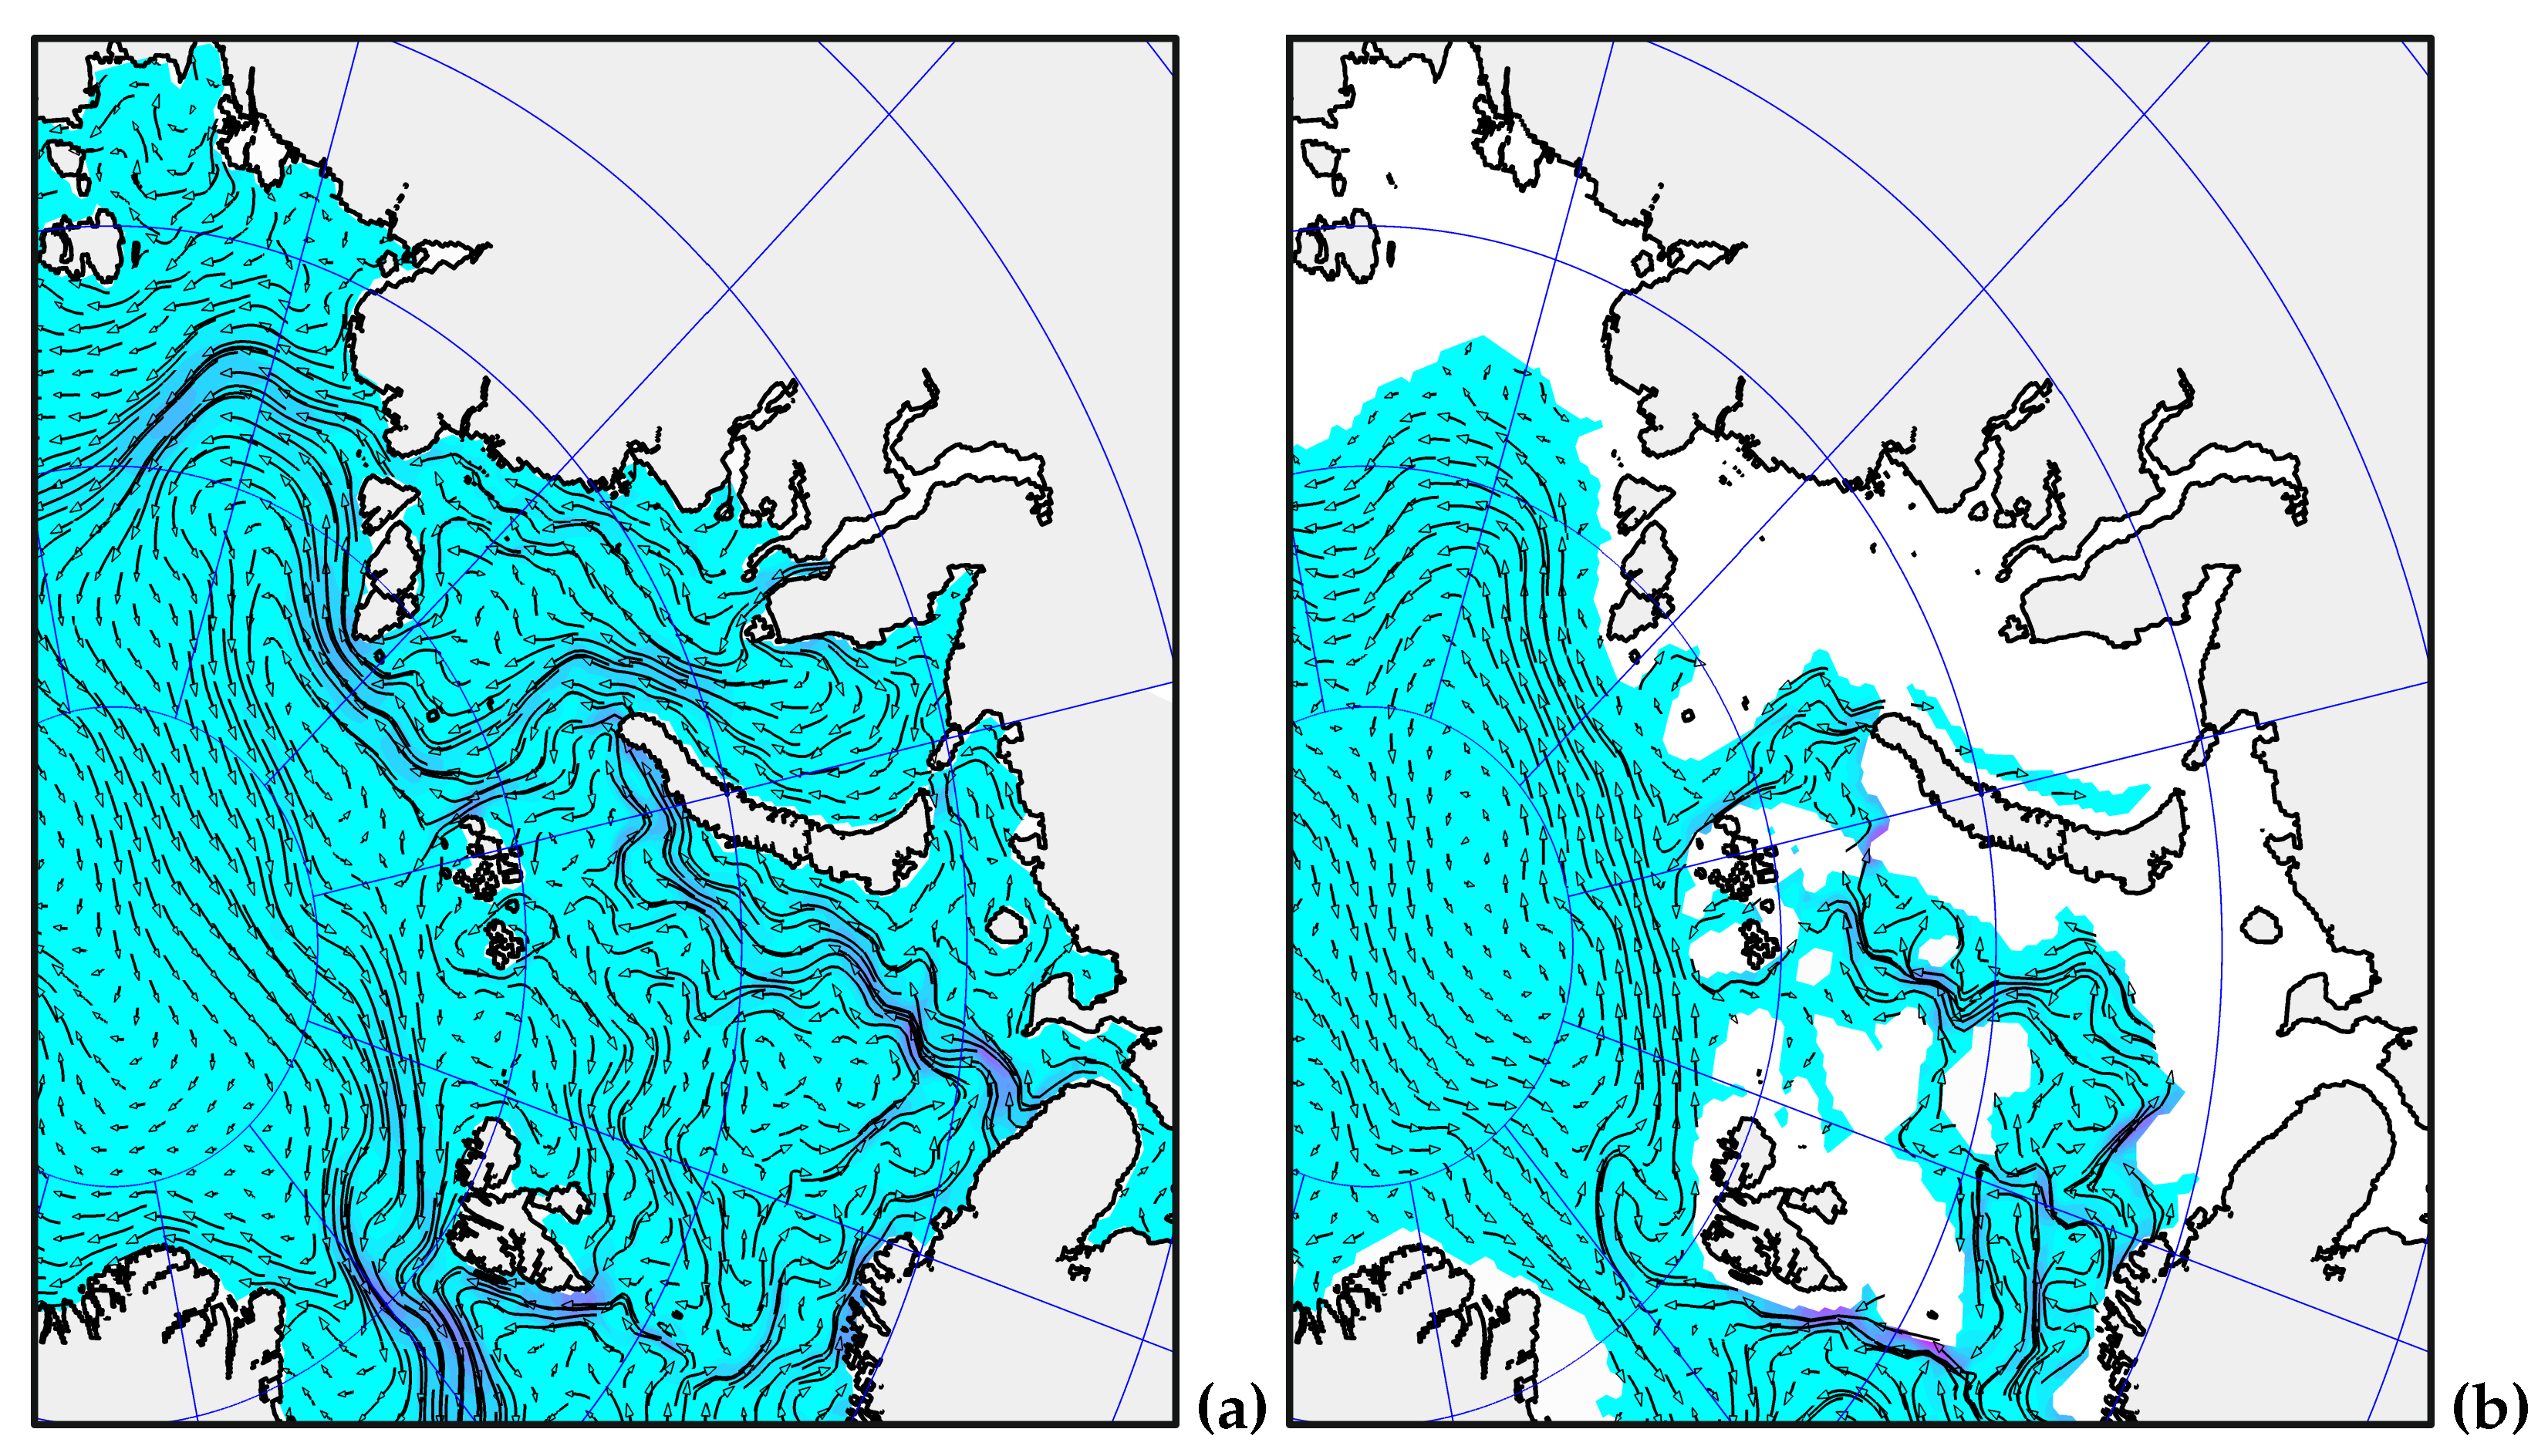
The circulation of the surface water layer of the Arctic Ocean and its shelf seas is not a repetition of the ice drift pattern, as it is formed on the basis of a complex system of interactions with ice, atmosphere, incoming fresh water flows and waters of the adjacent sea areas. In the numerical model, the propagation of the Ob and Yenisey tracers in the shelf water occurs mainly along two trajectories: the eastern one characterizes the jet along the coast of Eurasia with an exit through the Vilkitsky Strait into the deepwater part of Laptev Sea, the second trajectory passes along the central and western part of the sea in the direction of the strait between the islands of Franz Josef Land and Severnaya Zemlya. The intensity of the two branches is different in different years and may change during the year. The surface circulation in Figure 4a demonstrates the velocity field averaged over the simulated period 2016-2020, therefore both branches are visible simultaneously in the figure. As a rule, in the conditions of the established ice cover, from November to July, the main distribution of tracers occurs along the coast of Eurasia in the direction of the Vilkitsky Strait. When the sea is free from ice, the dynamic state of the atmosphere is the determining factor in establishing the surface circulation. A common feature of the surface circulation and ice drift is the export of surface water from the deep Arctic basin to the Greenland Sea.
Figure 4b represents the water circulation in the Eurasian basin in the 200-600 m layer, which is characterized by the propagation of Atlantic waters along the continental slope in a cyclonic direction. The same figure shows the second branch of Atlantic waters in the bottom layer of the Barents Sea.
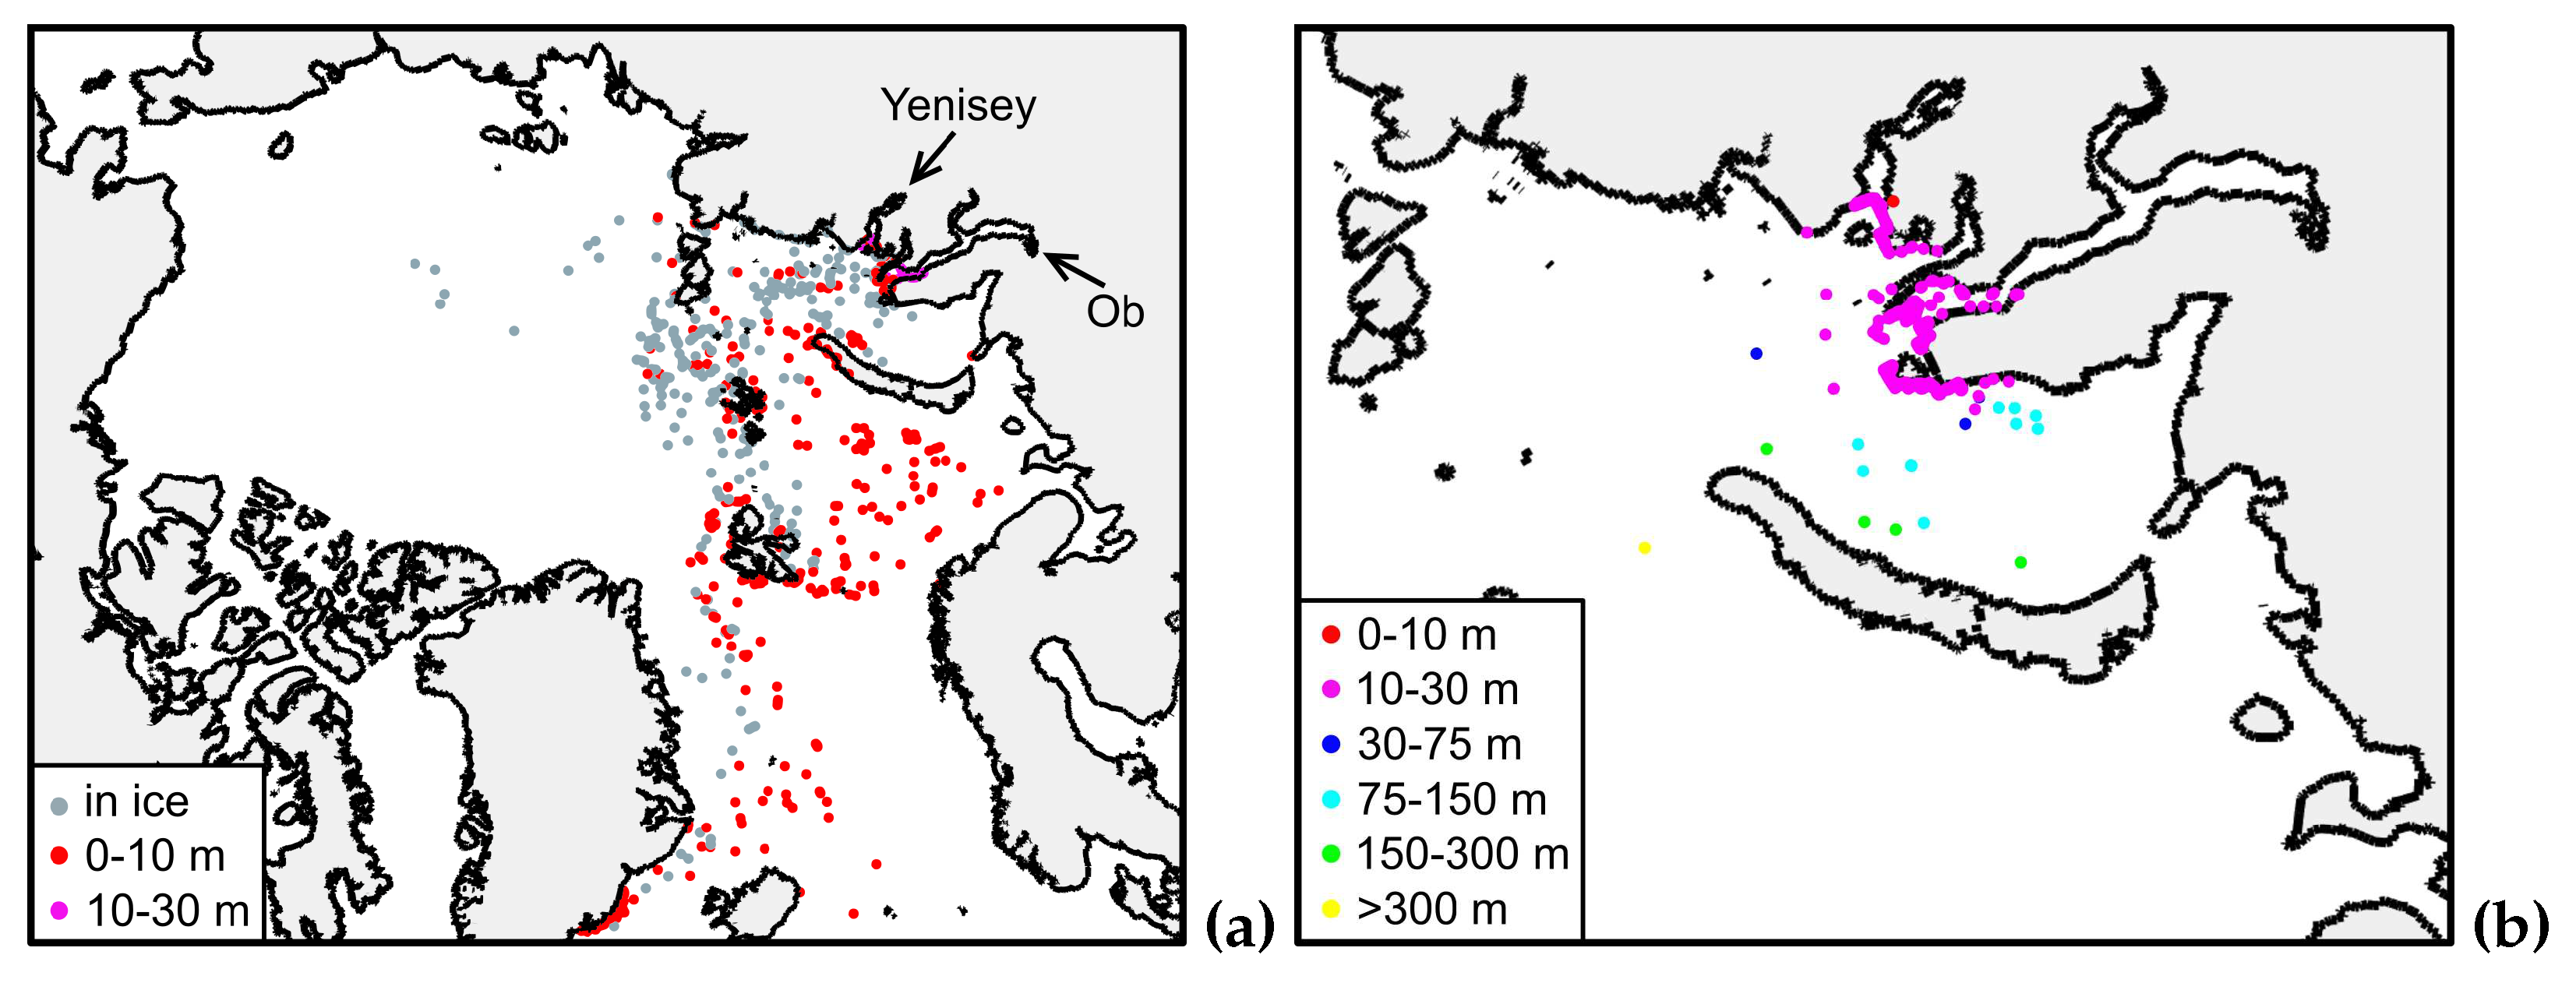
The analysis of modeling results of 5-year continued microplastic riverine inflow showed, that light plastic particles, regardless of their sizes (experiments HDPE10, HDPE20, PP10, PP20), spread throughout the Arctic Ocean in a similar way, predominantly staying in the surface layer (Figure 5a, Figure S1,a-d). Repeatedly moving from the upper layer of water to ice and back, they move both in the Kara Sea and beyond. Depending on the direction of surface water circulation, in certain periods flows are formed through different straits, which connect the Kara Sea with the surrounding waters. Once off the shelf, the particles are included in the large-scale circulation system of the Arctic Ocean. The general direction of ice drift and surface circulation force them through the Fram Strait and further through the Denmark Strait into the Atlantic, including in a frozen-to-ice state. The appearance of particles in the Barents Sea is caused by ice drift, as will be shown in the subsequent section analyzing the role of sea ice.
However, there are differences near the estuaries, where waters are characterized by low salinity and correspondingly low density compared to waters in more distant regions. In contrast to HDPE, which are floating, a small portion of PP particles settles near the river mouth because they have density greater than the surrounding waters (Figure 5a).
Heavy plastic, PS particles, being carried out with river waters, settle in the immediate vicinity of the river mouth and are transported by a system of bottom currents over a short distance across the Kara Sea. Moreover, not a single PS particle was captured by ice over the 5 years of calculation. Figure 5b shows the distribution for PS particle size of 5 mm. From the formula (1) that determines the rate of particle immersion, it follows that smaller particles are deposited faster. In further experiments, PS is excluded from consideration due to its high density, which leads to rapid immersion of particles even without biofouling.

3.2. Sensitivity tests to biofouling rate and particle size

The sensitivity to biofouling was tested in experiments for two types of microplastics (PP and HDPE) considering particle sizes of 5 and 0.5 mm. The maximum value of biofouling rate varied 10 4 , 10 3 and 10 2 mm/day. Due to biofouling, the rate of particle immersion changes along with the corresponding pattern of particle distribution in the sea. For demonstration purposes, the most representative distributions of microplastic particles at the end of the five-year modeling period were selected.
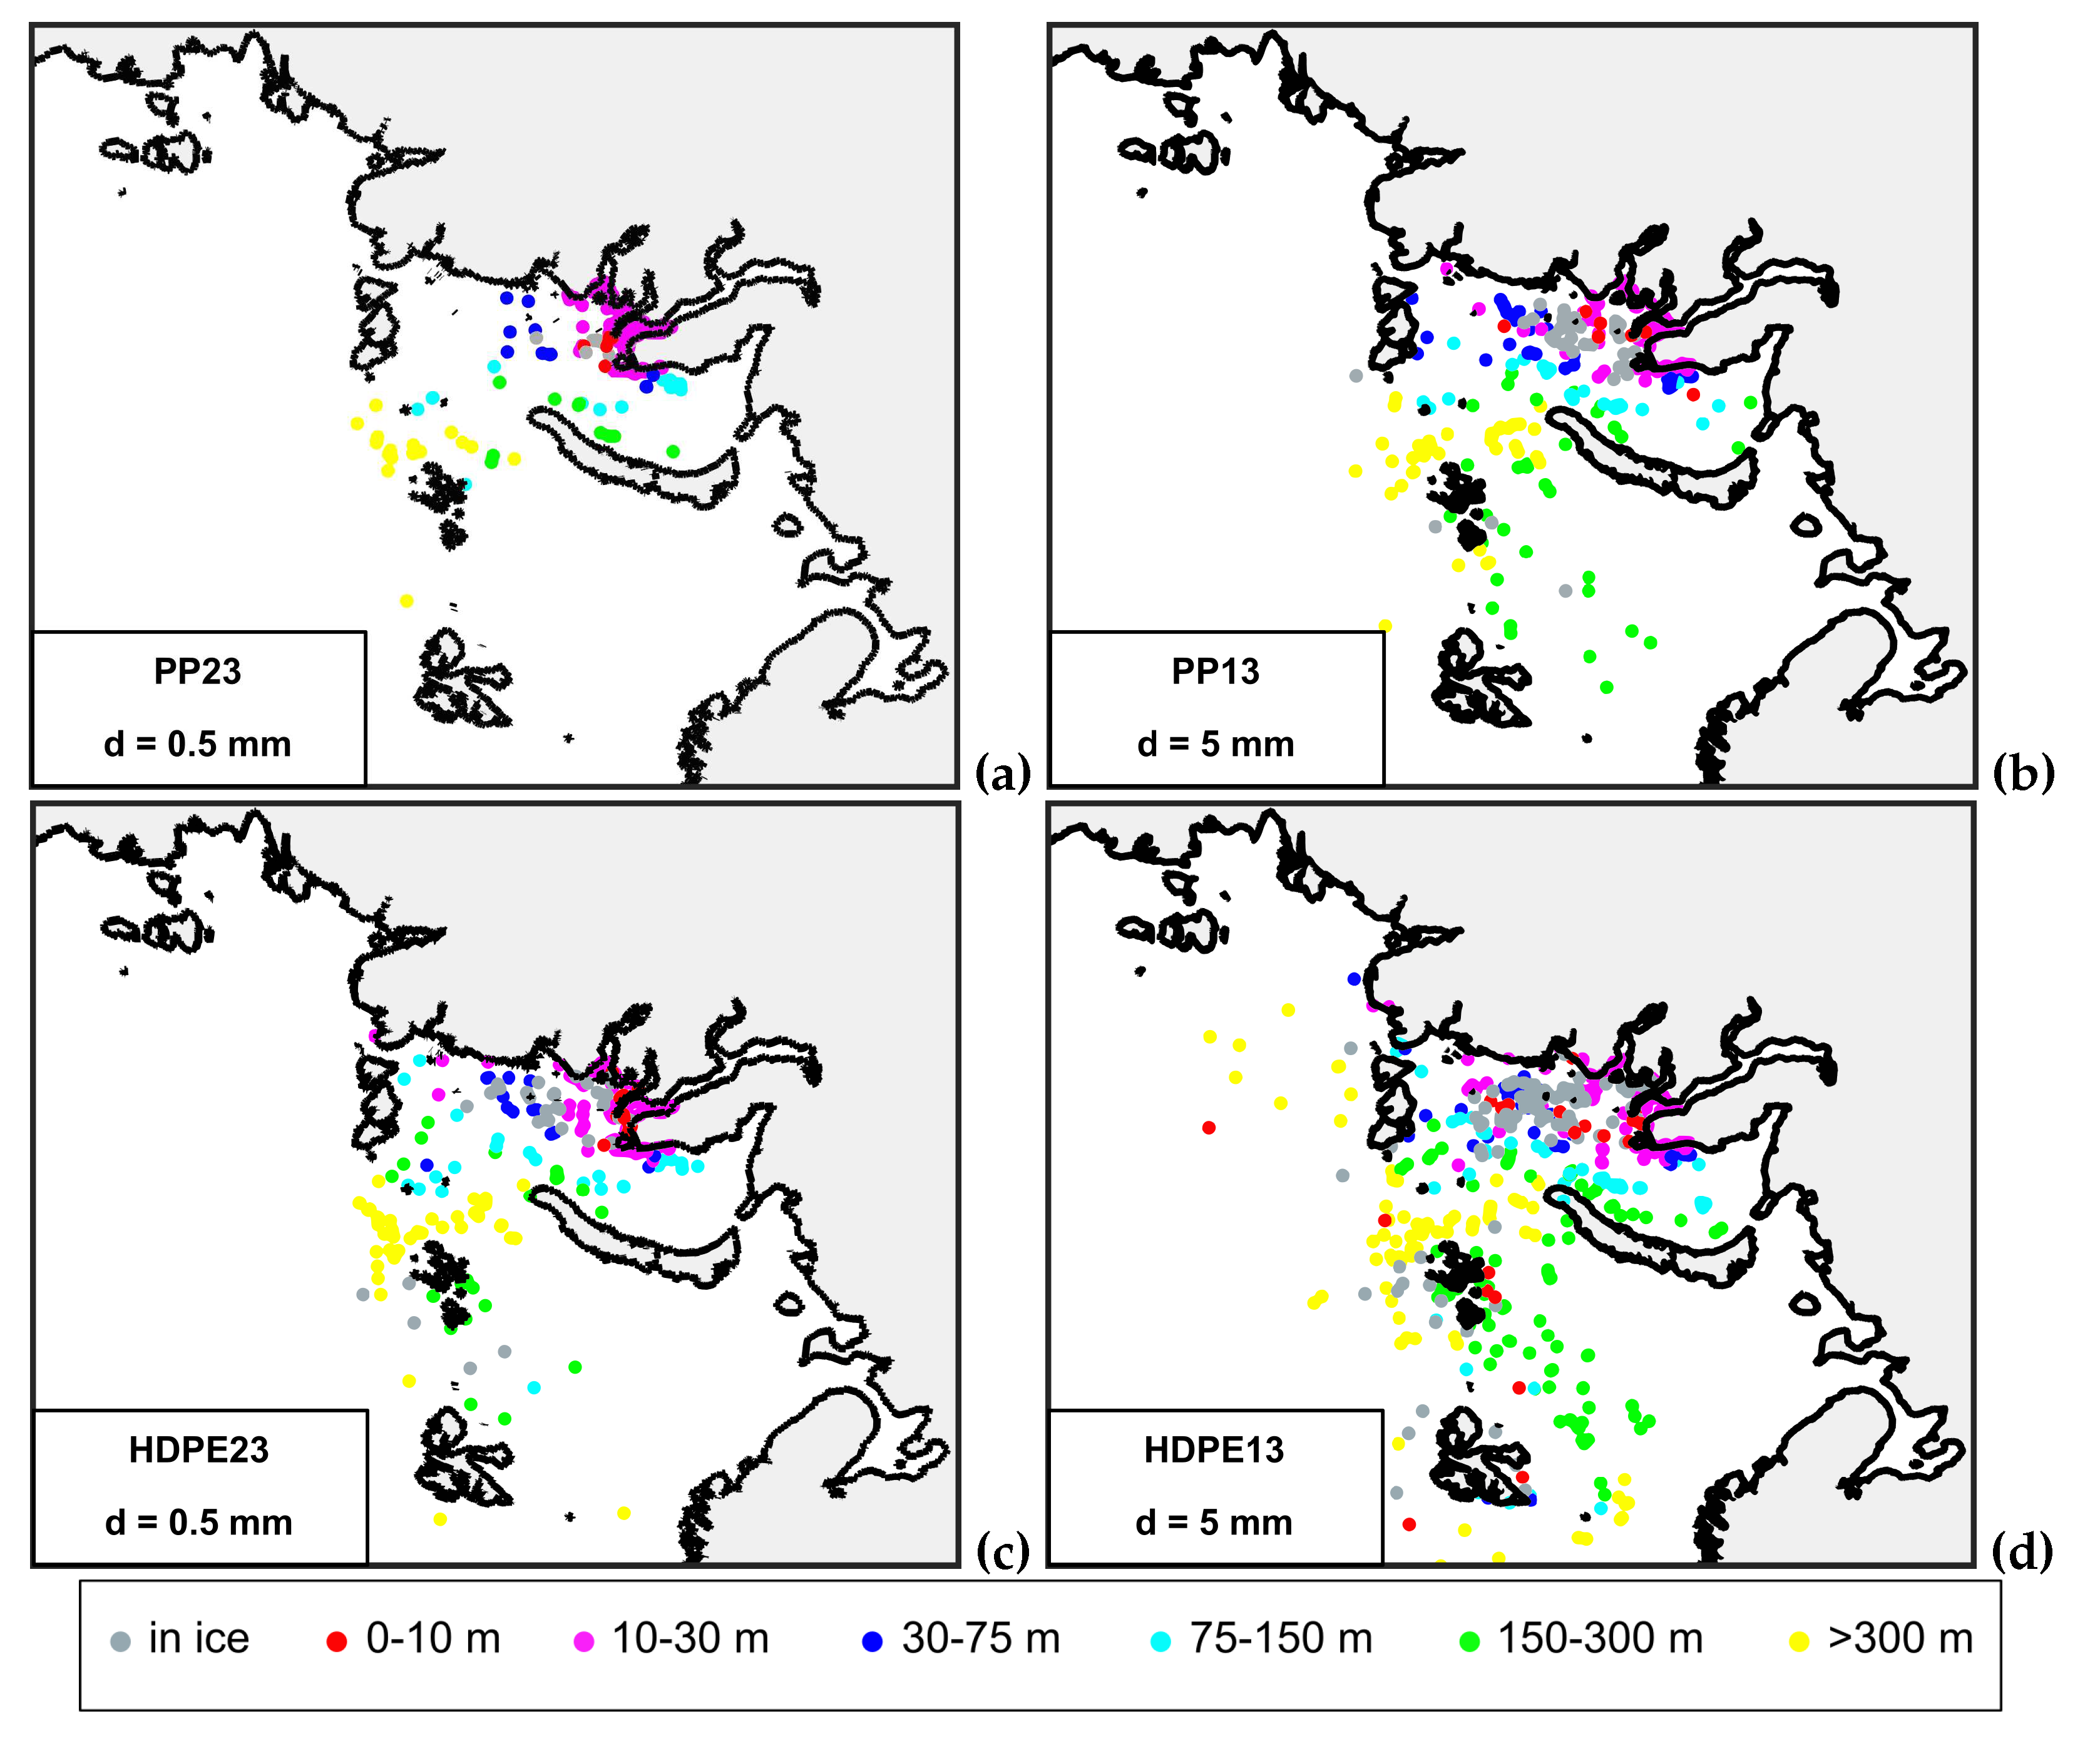
Considering the highest biofouling rate for our experiments, 10 2 mm/day, the simulation shows that the main pollution is concentrated on the seafloor of the Kara Sea. The MP particles of all sizes and all types are deposited (Figure 6).
Particles PP, size of 0.5 mm (Figure 6a) are concentrated mainly in the area of river mouths. As the particle size increases or lighter HDPE is considered, the pollution is more widely distributed over the Kara Sea, with a small number of particles deposited on the shelf of the Barents Sea (Figure 6b, c). The distribution for 5 mm HDPE shows not only shelf pollution but also includes some particles that have reached the deep-water part of the basin (Figure 6d).
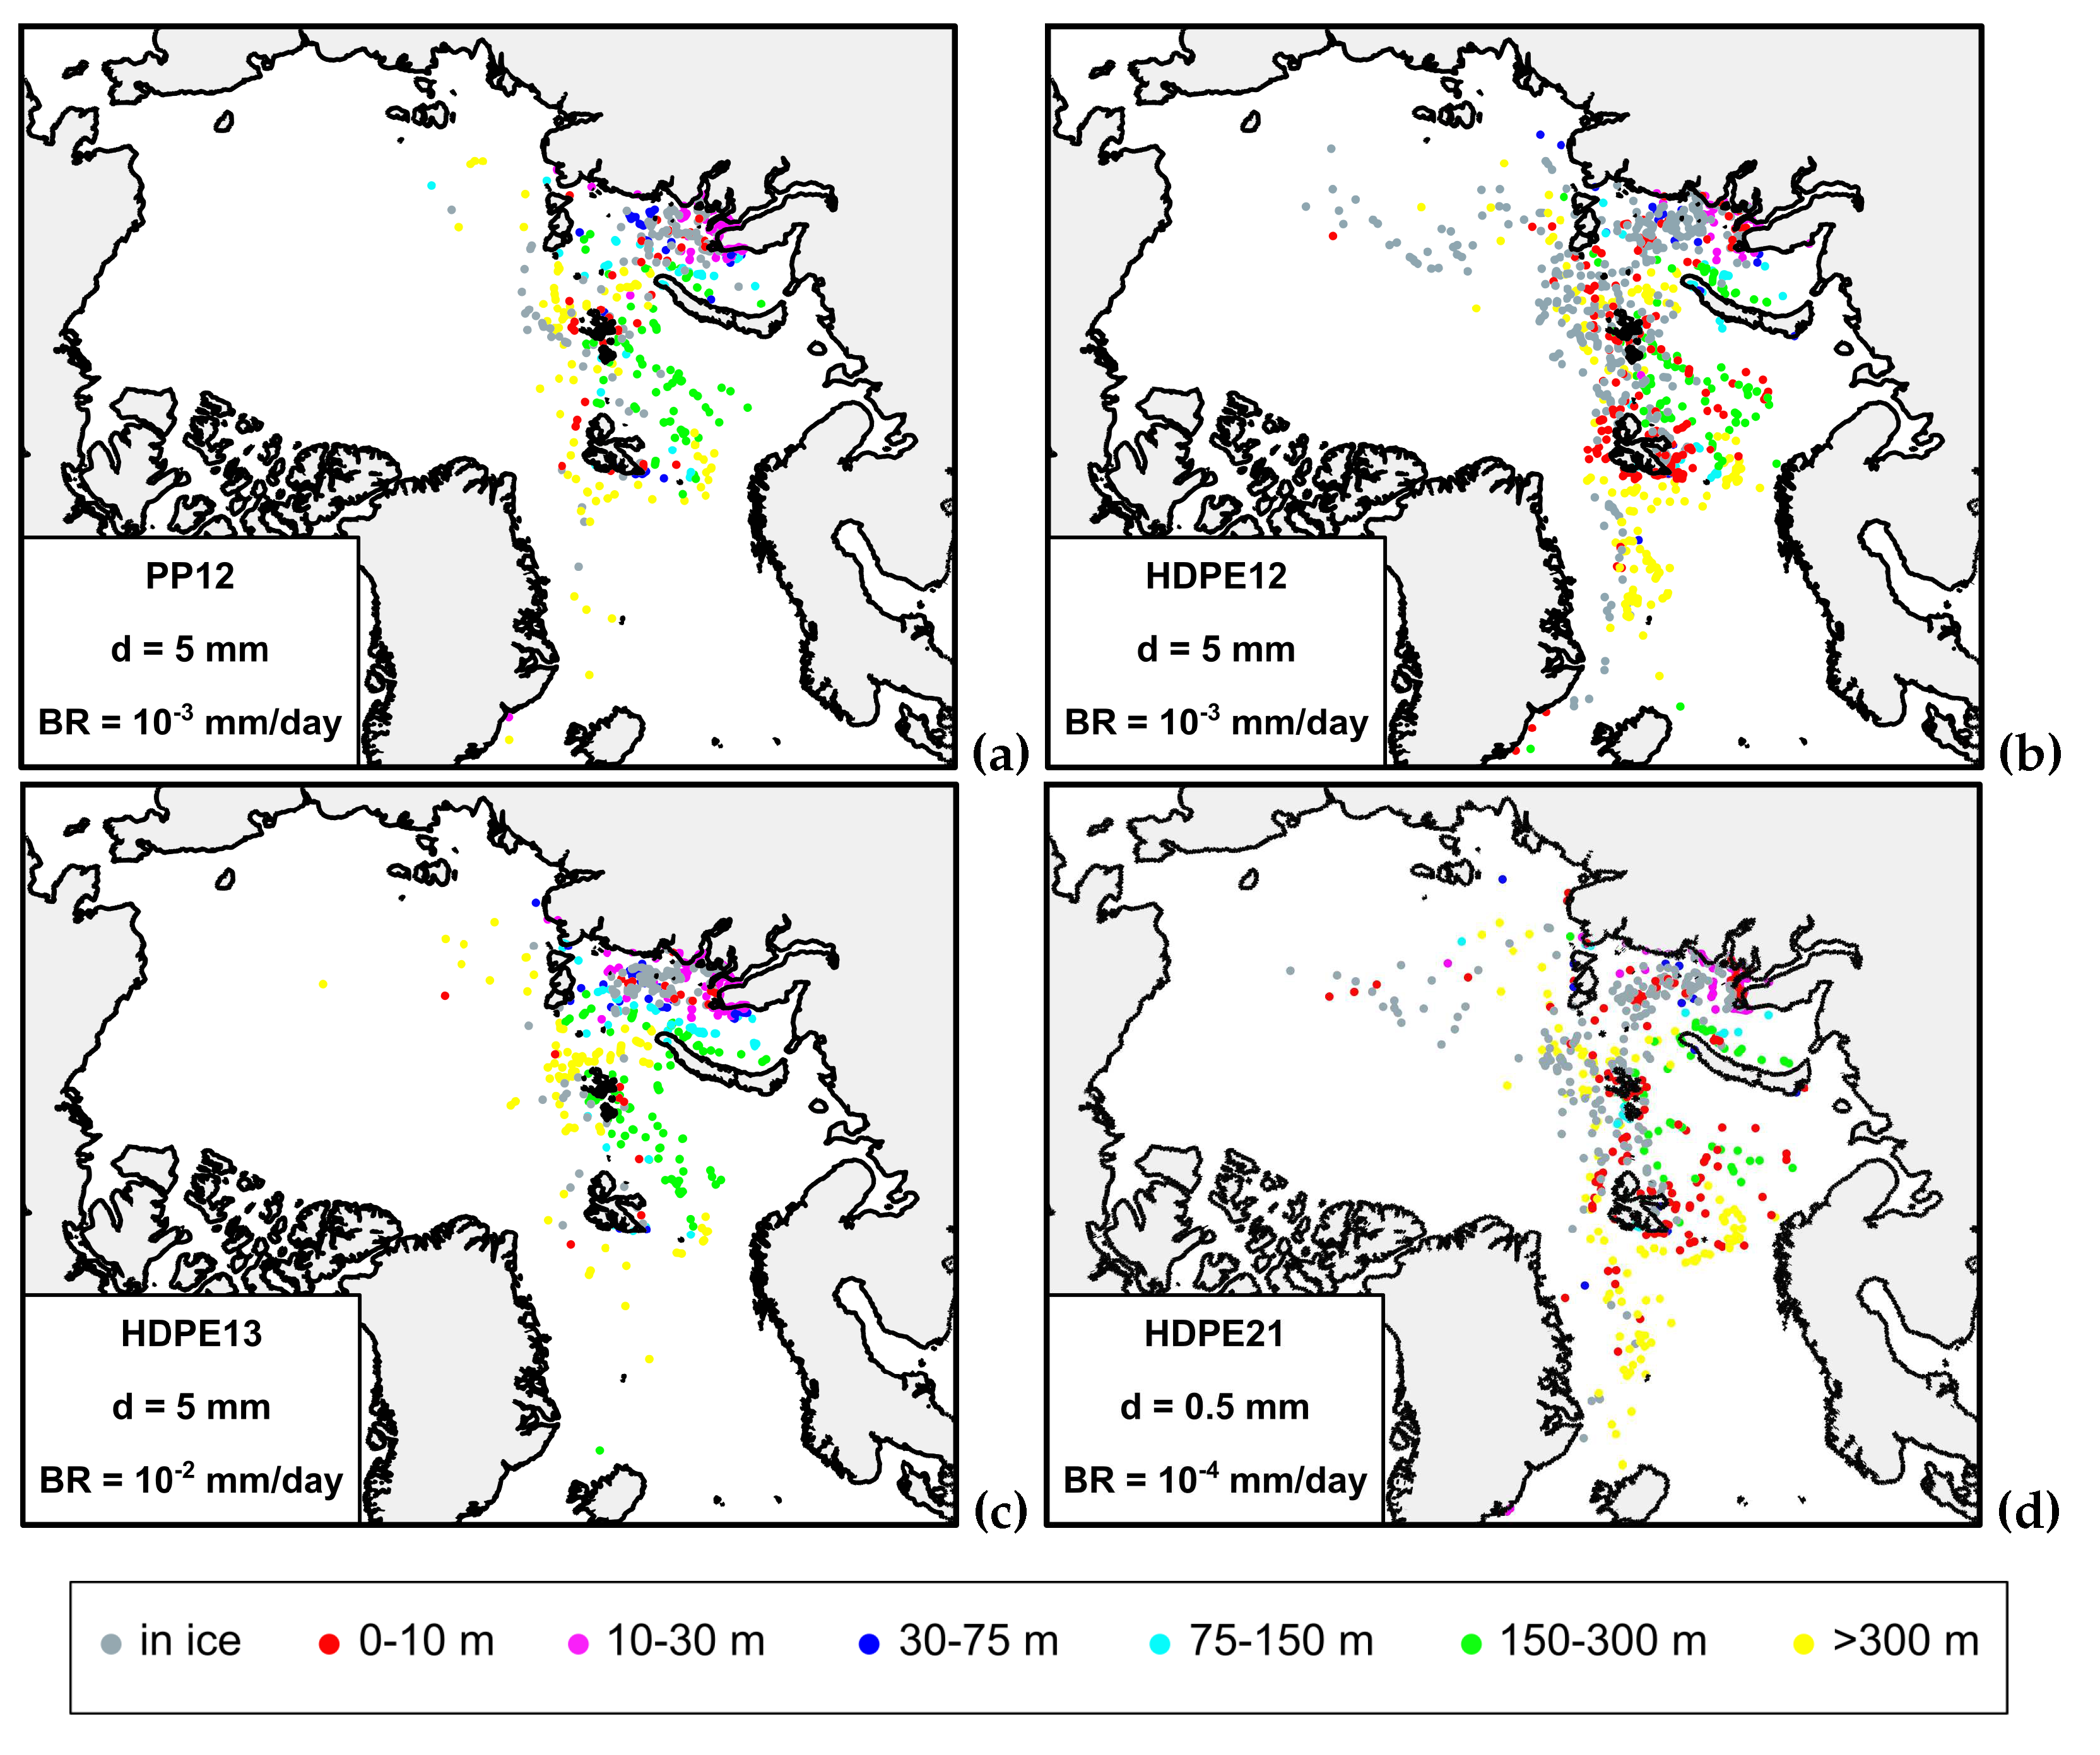
Comparison of the PP and HDPE particle distributions at the same size and maximum biofouling rate (e.g. 5 mm and 10 3 mm/day, respectively) show that a significant portion of the particles settle on the shelf, but some microplastics remain frozen in sea ice (Figure 7a, b). Lighter HDPE particles not only fill shelf area, but also extend into the deep-sea part of the Arctic Basin and beyond. Moving to the south they pass through Fram Strait with deepening into the Greenland Sea. In contrast to HDPE, the inclusion of PP particles in the ice cover is mainly observed in the central part of the Kara Sea. Intensive model transport into the Barents Sea during the calculation period leads to pollution of the region, which, unlike to the situation presented in (Figure 5a), is concentrated in the bottom layer of the sea.
For particles of the same type and fixed size (HDPE, d = 5 mm), an increasing biofouling rate from 10 3 (Figure 7b) to 10 2 mm/day (Figure 7c)contributes to an increase in the sinking rate. As a consequence, the area of MP spreading by surface currents, which are more intense in summer, decreases, and the area of MP deposition is mainly limited to the shelf. The resulting distribution in Figure 7c for HDPE under biofouling rate of 10 2 mm/day is more similar to the distribution of PP particles of the same size, but with a lower biofouling rate of 10 3 mm/day (10 times less, Figure 7a). At the same time, in the experiments for PP, 5 mm, B R = 10 4 , (PP11, Figure S3a) and for HDPE, 5 mm, B R = 10 3 mm/day (Figure 7b) the calculation results did not show the same relation.
It should be noted that for lighter particles, using a biofouling rate of 10 4 mm/day (HDPE11, Figure S2a) did not produce considerable differences in the resulting particle distribution compared to the HDPE10 calculation without biofouling (Figure S1a) .
At the same time, the reduction in particle size leads to an increase in sedimentation under low biofouling rate (HDPE21). Figure 7d shows that a significant portion of the 0.5 mm HDPE particles ended up in the bottom layer after a five-year period. The low settling velocity ( 10 4 mm/day) allowed particles to remain in the surface layer and sea ice for a long time before the density of biofilm particles reached the ambient density. In the HDPE21 experiment, the spatial distribution of particles, including depth of their immersion, was found to be close to the distribution of particles in the HDPE12 experiment (Figure 7b), which used an order of magnitude larger particle size and an order of magnitude lower biofouling rate.
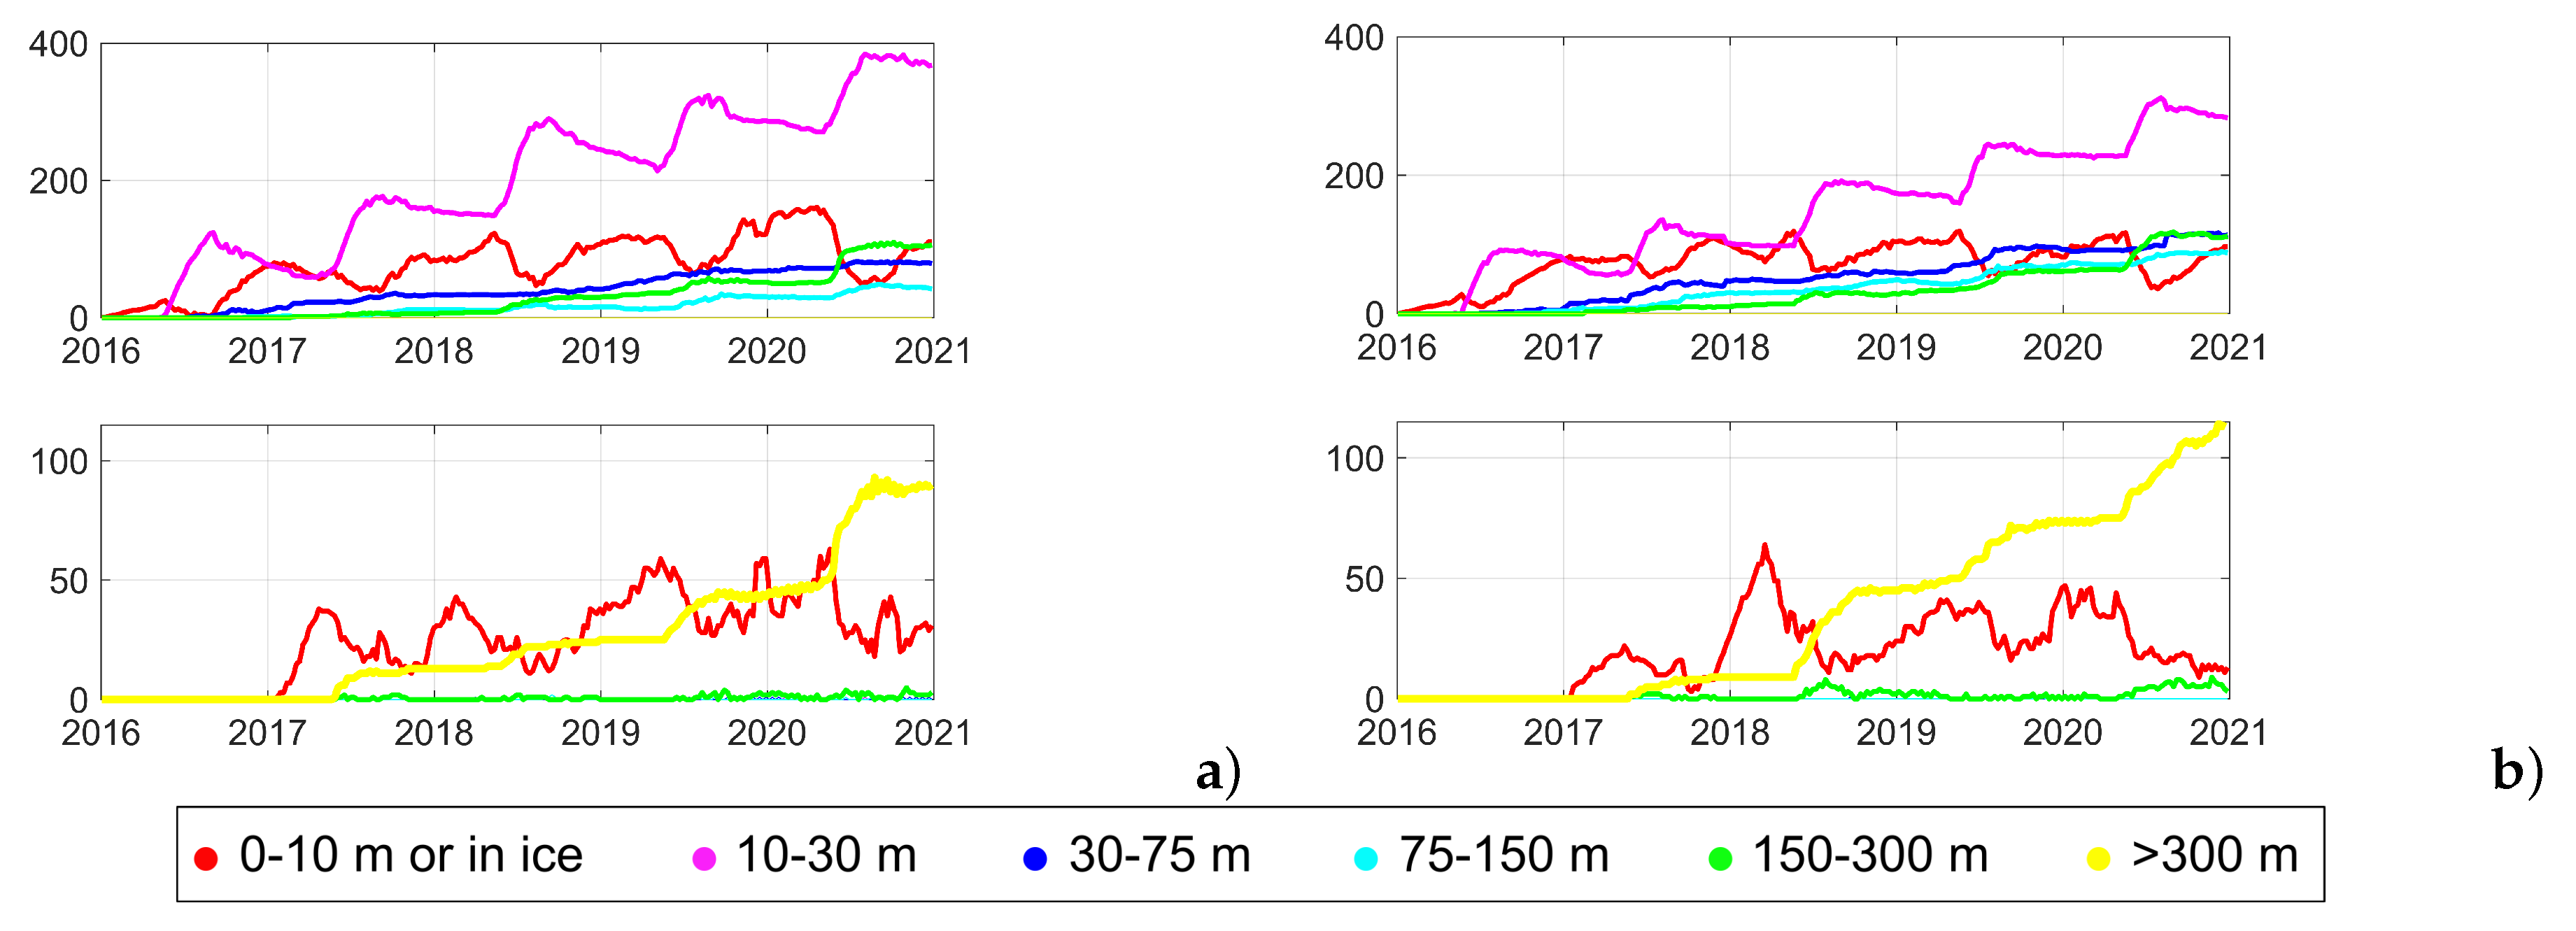
Despite the apparently similar distribution of particles after 5 years of simulations noted above, the time of particle immersion is different. For example, the time series, illustrating the change in the number of particles in the layers are presented in Figure 8. It can be seen from the plots presented that the overall behavior of the curves is similar, but the lower degree of biofouling contributes to a longer residence time of particles in the surface layer, even for particles of higher density.
The results of the remaining experiments on the sensitivity to the biofouling rate for a size of 0.5 mm show that the value of B R = 10 3 mm/day is sufficient for most of the particles to settle near river mouths, and the rest to settle on the Arctic shelf (experiments HDPE22, PP22, Figure S2d, S3d). This is also true for PP at a velocity value of B R = 10 4 mm/day, with the exception of a small number of individual particles that went beyond the shelf area (PP21, Figure S3b). A further increase of the biofouling rate to 10 2 mm/day does not lead to significant changes in the model results (HDPE23, PP23,Figure S2f, S3f).

3.3. Sensitivity MP tranfer to freezing into sea ice

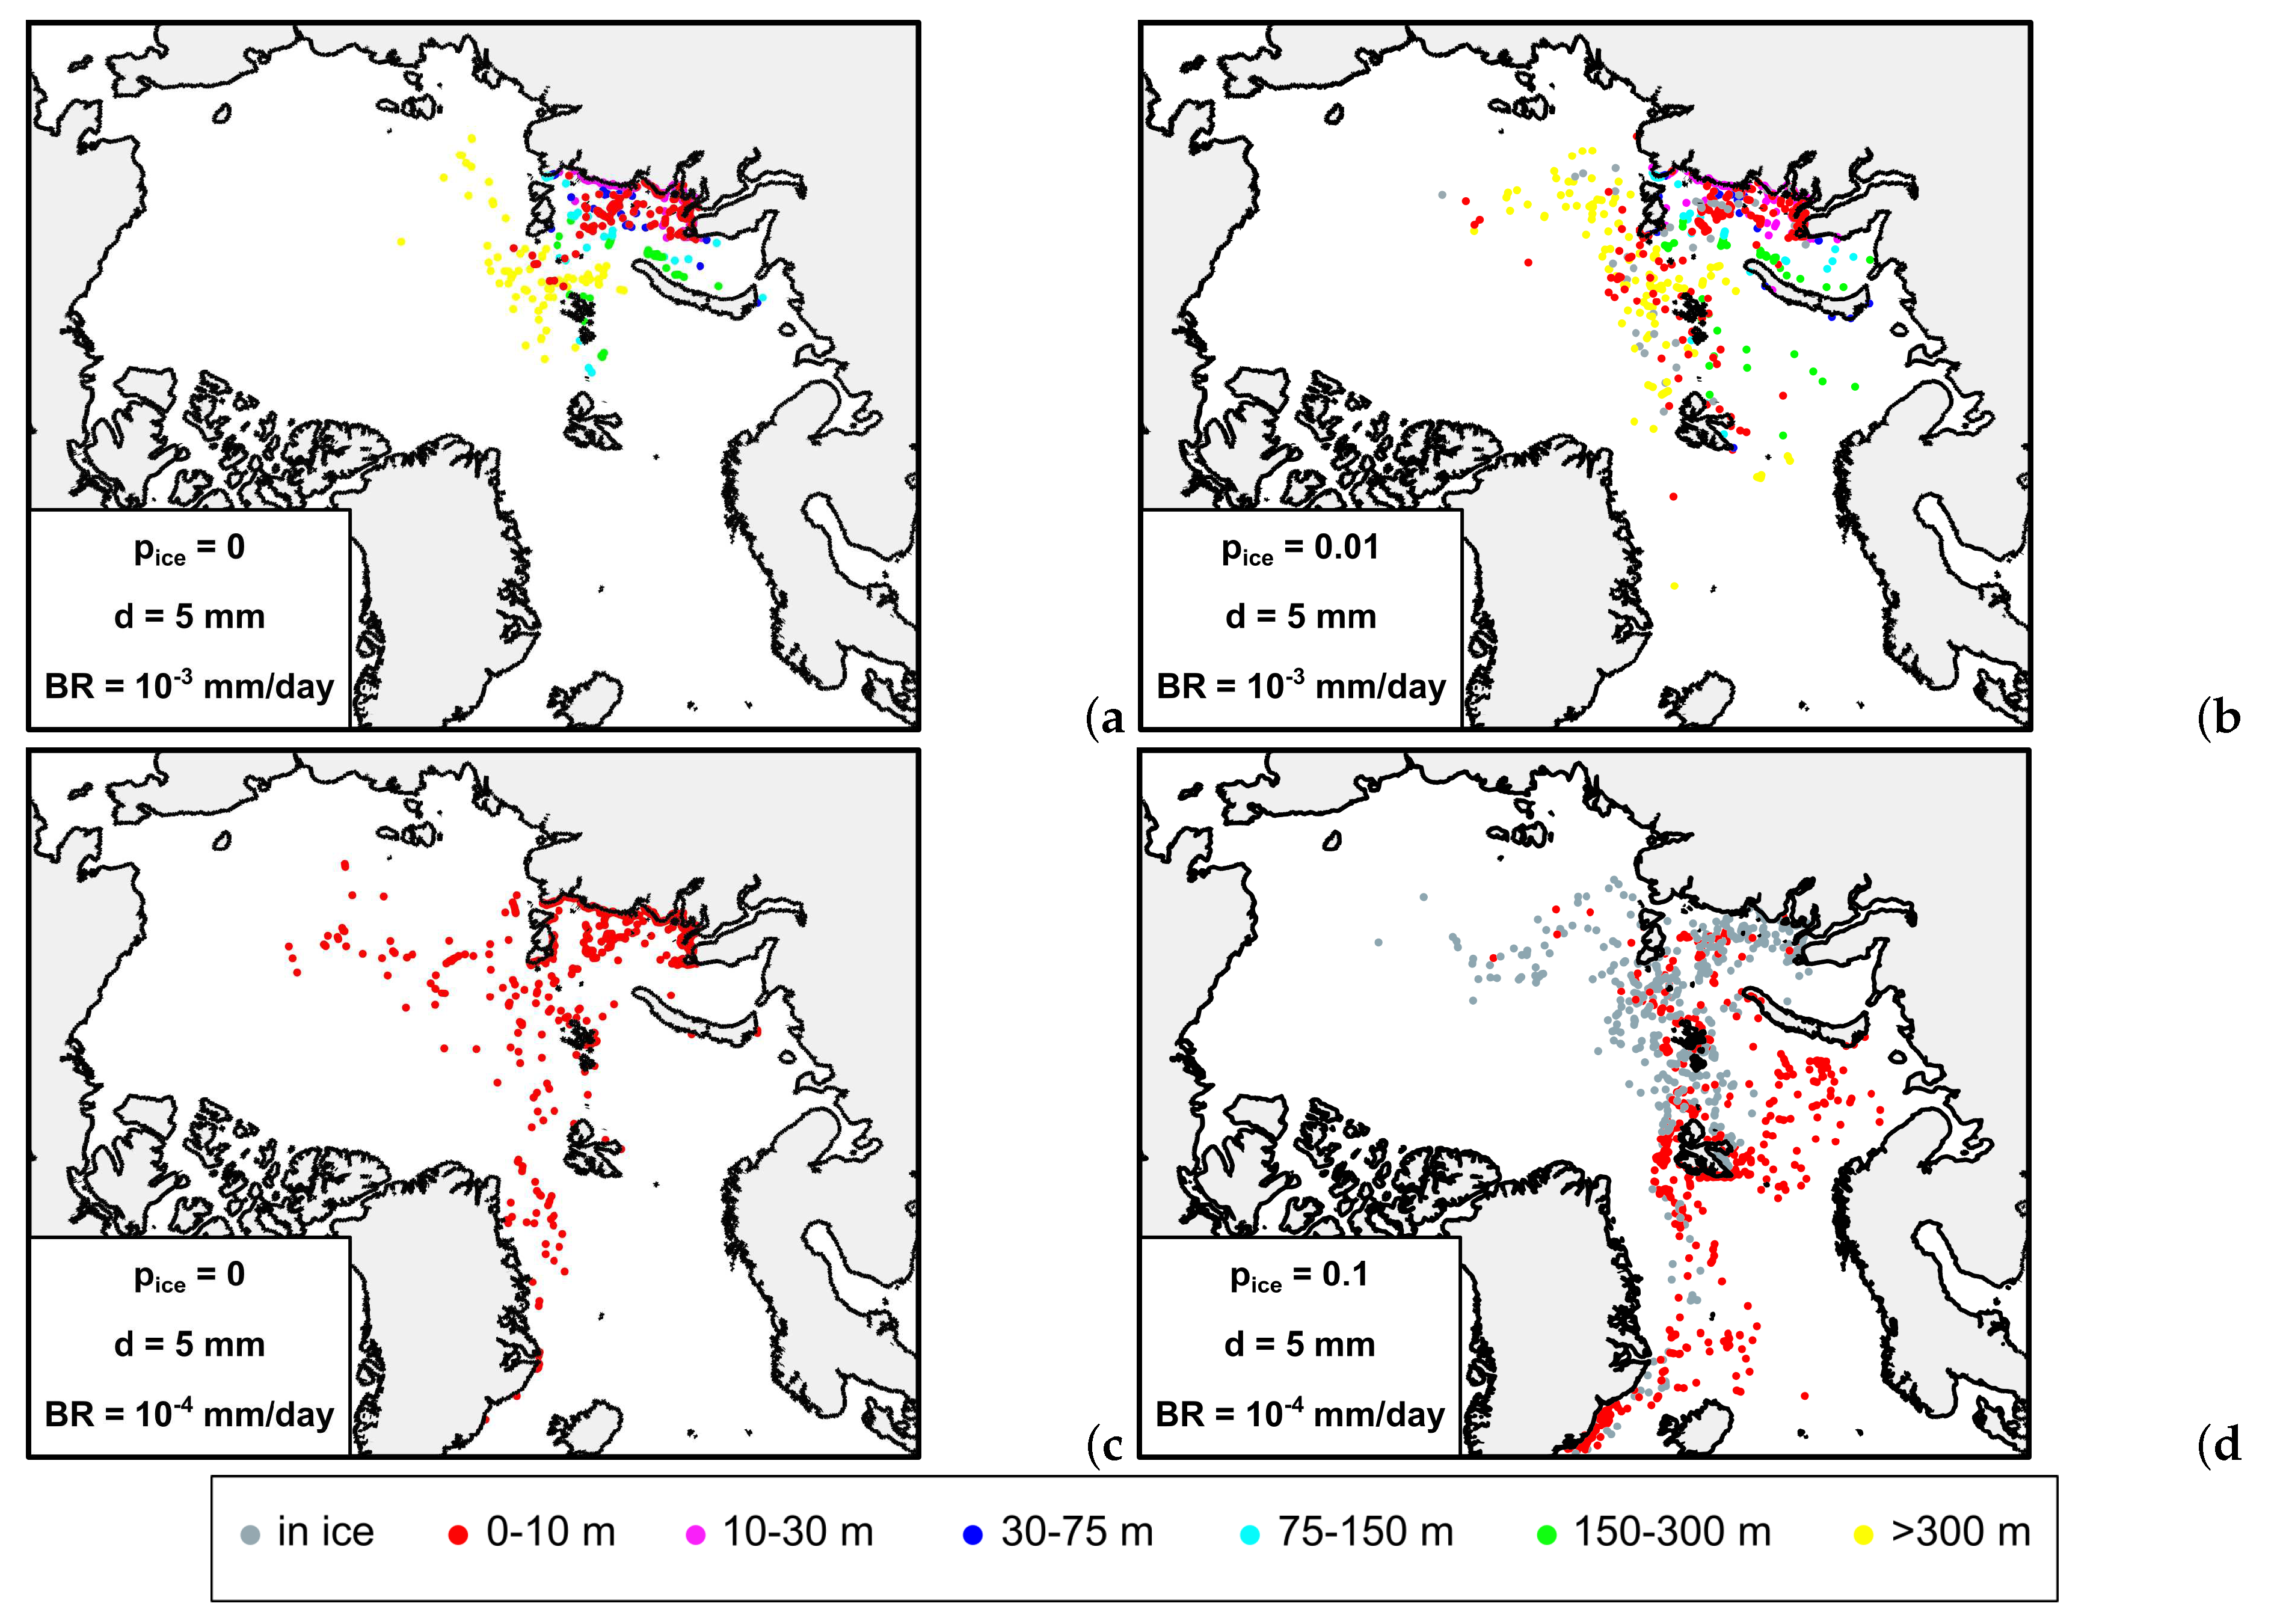
A series of numerical experiments were conducted to investigate the sensitivity of the microplastic incorporation into sea ice. Since the parameterization of this process is currently undefined, several values for specifying the probability of particle freezing were tested, namely P = 0 , 0.01, 0.1 and 0.9. Sensitivity experiments were conducted for the lightest HDPE microplastic with a particle size of 5 mm and a biofouling rate of 10 3 mm/day, allowing the particles to hold in the surface layer. The simulation results show that by varying the probability value from 0.1 to 0.9, the spatial distribution after a five-year result has a basically similar pattern (Figure 7b for P = 0.1 and Figure S4d for P = 0.9 ). Significant differences in the particle distribution appear when the probability approaches zero. The distributions obtained for P = 0 and P = 0.01 (Figure 9a, b) are similar to each other and significantly different from the same pattern for P = 0.1 (Figure 7b). In the absence of particle involvement in the ice, their transport is only due to water circulation and additional submergence caused by biofouling. Most of the particles settle on the Kara Shelf. The particles that leave the sea, under the influence of biofouling, reach the layer of Atlantic waters spreading in the cyclonic direction (Figure 4b). Transported in the Atlantic layer they settle on the continental slope of the Eurasian basin (yellow dots in Figure 9a, b). These two experiments ( P = 0 and P = 0.01 ) show that even minimal incorporation of particles into the ice favors their wider spreading across the Kara Sea.
The importance of considering microplastic particles freezing into ice is most apparent when comparing the results of two simulations for the minimum biofouling rate, 10 3 mm/day, which does not lead to the particle sinking into the deep layers during the 5-year period. In the absence of freezing (Figure 9c), particles in the surface layer are concentrated along the Kara Sea coastline and carried to the central ocean and to the Greenland Sea through Fram Strait. At P = 0.1 , the model results show a more intensive export of particles outside the Kara Sea. The export through the Fram Strait and the Denmark Strait is clearly expressed (Figure 9d). In addition, the model shows that the transport of particles with ice drift leads to the export of pollution to the Barents Sea through the strait east of Spitsbergen. These particles are then transported across the Barents Sea by the current system. The differences noted in the pollution of the Barents Sea due to the transfer of microplastics by sea ice also apply to the experiments considered above with a biofouling rate of 10 3 mm/day (Figure 9b).

4. Discussion

In this study, we tried to determine how sensitive the distribution of microplastics in Arctic waters is to some physical and biological processes. As an example, riverine microplastic input from two major Siberian rivers, Ob and Yenisey, to the Kara Sea was considered. Previously, we simulated the Lagrangian transport of freshwater passive tracers from Siberian rivers across the Arctic Ocean using calculations of velocity fields from a 3-dimensional ocean and sea ice model [63]. In the present study, we included the calculation of the sinking velocity of microplastic particles as a function of their density, particle size, biofouling and the density of the surrounding water in order to give the tracers the relevance of microplastic particles (similar to [62]).
To account for the presence of plastic in polar waters, we considered the probability of particles freezing in ice and being released when the ice melts. To determine the freezing rate of microplastic particles, we relied on the work of [32,33]. These papers describe laboratory experiments to study the freezing of microplastic beads into ice. The paper [32] considered the process of entrainment of microplastic beads into sea ice based on laboratory experiments with the freezing of Antarctic water. Results from analysis of the ice and remaining water after 15 days of the experiment showed that the percentage of microplastic entrainment into the ice varied from 10 to 50% and correlated with the salinity of the water and sea ice. A similar study carried out in [33] showed a greater degree of microplastic freezing, namely the proportion of microplastics in the ice was about 77% after 24 hours.The results obtained in these studies did not provide us with the certainty to allow parameterization of this process in the ocean and sea ice model. However, it was clear from both studies that microplastics are actively frozen into ice in a relatively short period of time.
Among 7 most common types of MP [34], three types were used in the experiments. The choice was based on the fact that their density is closest to that of seawater. Two of them has density less then sea water (HDPE, density 955 kg/m33 and PP, density 1010 kg/m3) and one is heavy MP (PS, density 1040 kg/m3). Considering a denser type of MP compared to PS is inappropriate for our purposes, as it is obvious that its distribution will be limited to the estuary area. Particles sizes of 5 an 0.5 mm were considered.
The problem of determining the sources of plastic and its release onto the Arctic shelf has not yet been solved. We have used model estimates of the amount of plastic entering the ocean with river water [61]. These are based on analyses of population density and the quality of plastic waste disposal systems in the catchment area. Due to the sparse population and limited data on the Lena River, the estimate of riverine plastic input to the Laptev Sea is more than 5000 times lower than in the Kara Sea. According to these estimates, not a single particle will be discharged by the Lena River onto the Laptev Sea shelf over a period of five years. Estimates of riverine microplastic influx given in the paper [61] are approximate, so we do not estimate in tons the amount of pollution of this or that region of the Arctic Ocean.
In the contrast to the studies [36], where the authors modeled the long-term transfer of floating microplastics from the rivers of Northern Europe to the waters of the Arctic Ocean, we ran experiments over a period of 5 years. However, our study included the processes of particles freezing in ice and biofouling. We also used information on the properties of particles (their density and size). Nevertheless, we see common features, such as the spread of microplastics along the continental slope of Eurasia. This process would be more pronounced in our results when modeled over a longer period.
Our research shows that the process of introducing microplastics into the ice has a significant impact on particle trajectories. Upper ocean circulation may different from ice drift. Ice drift is the most dynamic part of the ice-ocean system, strongly influenced by wind, but ocean circulation is defined as the result of a complex system of interactions with sea ice, the atmosphere, incoming river tributaries and water masses from adjacent ocean areas. Therefore, the transport of microplastics from the freeze-up to the melt season depends significantly on whether the plastic is in the water or frozen in the ice. Our studies have shown that considering particle freezing of particles in ice is essential, but the rate of freezing from 10 to 90% per day does not have a significant effect on the final result of microplastic distribution. The greatest difference of the results was obtained when the probability of particle freezing approached zero (1%).
Including the process of microplastics freezing into ice, we obtained an interesting effect of light microplastics spreading into the Barents Sea. Earlier studies indicated that the influx of Atlantic waters is a source of pollution in the Barents Sea [15]. Our research shows that there is also an additional influx of microplastics caused by ice transport from other areas. According to the results of the experiments, the ice entering the Barents Sea east of Spitsbergen melts, and the microplastics it contains enter the water and are transported by the current system or settle on the seafloor due to biofouling. The modeling study [34] also showed that the buoyant microplastics trapped in the sea ice are transported across the Barents Sea and north of Spitsbergen, as well as by the Transpolar drift through Fram Strait. The risk of contaminants in the Kara Sea entering the food webs of the Greenland and Barents Seas was reported in the study [64], in which the authors estimated ice drift in the Arctic using satellite imagery and a reconstruction of air pressure for the period 1899-1998. They showed that a significant proportion of the sea ice in the Arctic Ocean originates in the Kara Sea and melts in the Greenland and Barents Seas. More recently, analysis of large volumes of subsurface water samples from the Barents Sea has revealed high levels of microplastics in the northern part of the sea, close to the ice edge [65].
Some processes that can affect the transport of particles were not considered in this work. We did not consider the windage of light particles, which, as noted in the work [58], move along the surface of the water, and their drift speed can be up to four times higher in amplitude and can differ in direction than the water current speed. Intuitively, this makes it possible for light microplastic particles to move faster under the influence of wind even beyond the shelf. It is quite simple to include this process in calculations as an additional particle velocity and it will be accounted in further studies.
The work [31], based on laboratory experiments, shows that, similar to the biofouling of light MPs in surface waters, the aggregation and/or formation of gas bubbles on heavy (usually hydrophobic) plastic particles in the water column or sediments can serve as a mechanism for the vertical movement of MPs. The authors suggest that this mechanism is the most important process facilitating the rise of MPs to the surface and plays a key role in the capture of heavy plastic particles by both fresh water and growing sea ice, since a significant amount (from 17 to 57%) of plastic particles in both fresh and saltwater bodies were frozen into the ice during its formation. To include this process in a large-scale model, a parameterization of the gas bubble formation during biofouling is required. Currently this issue awaits our further study.
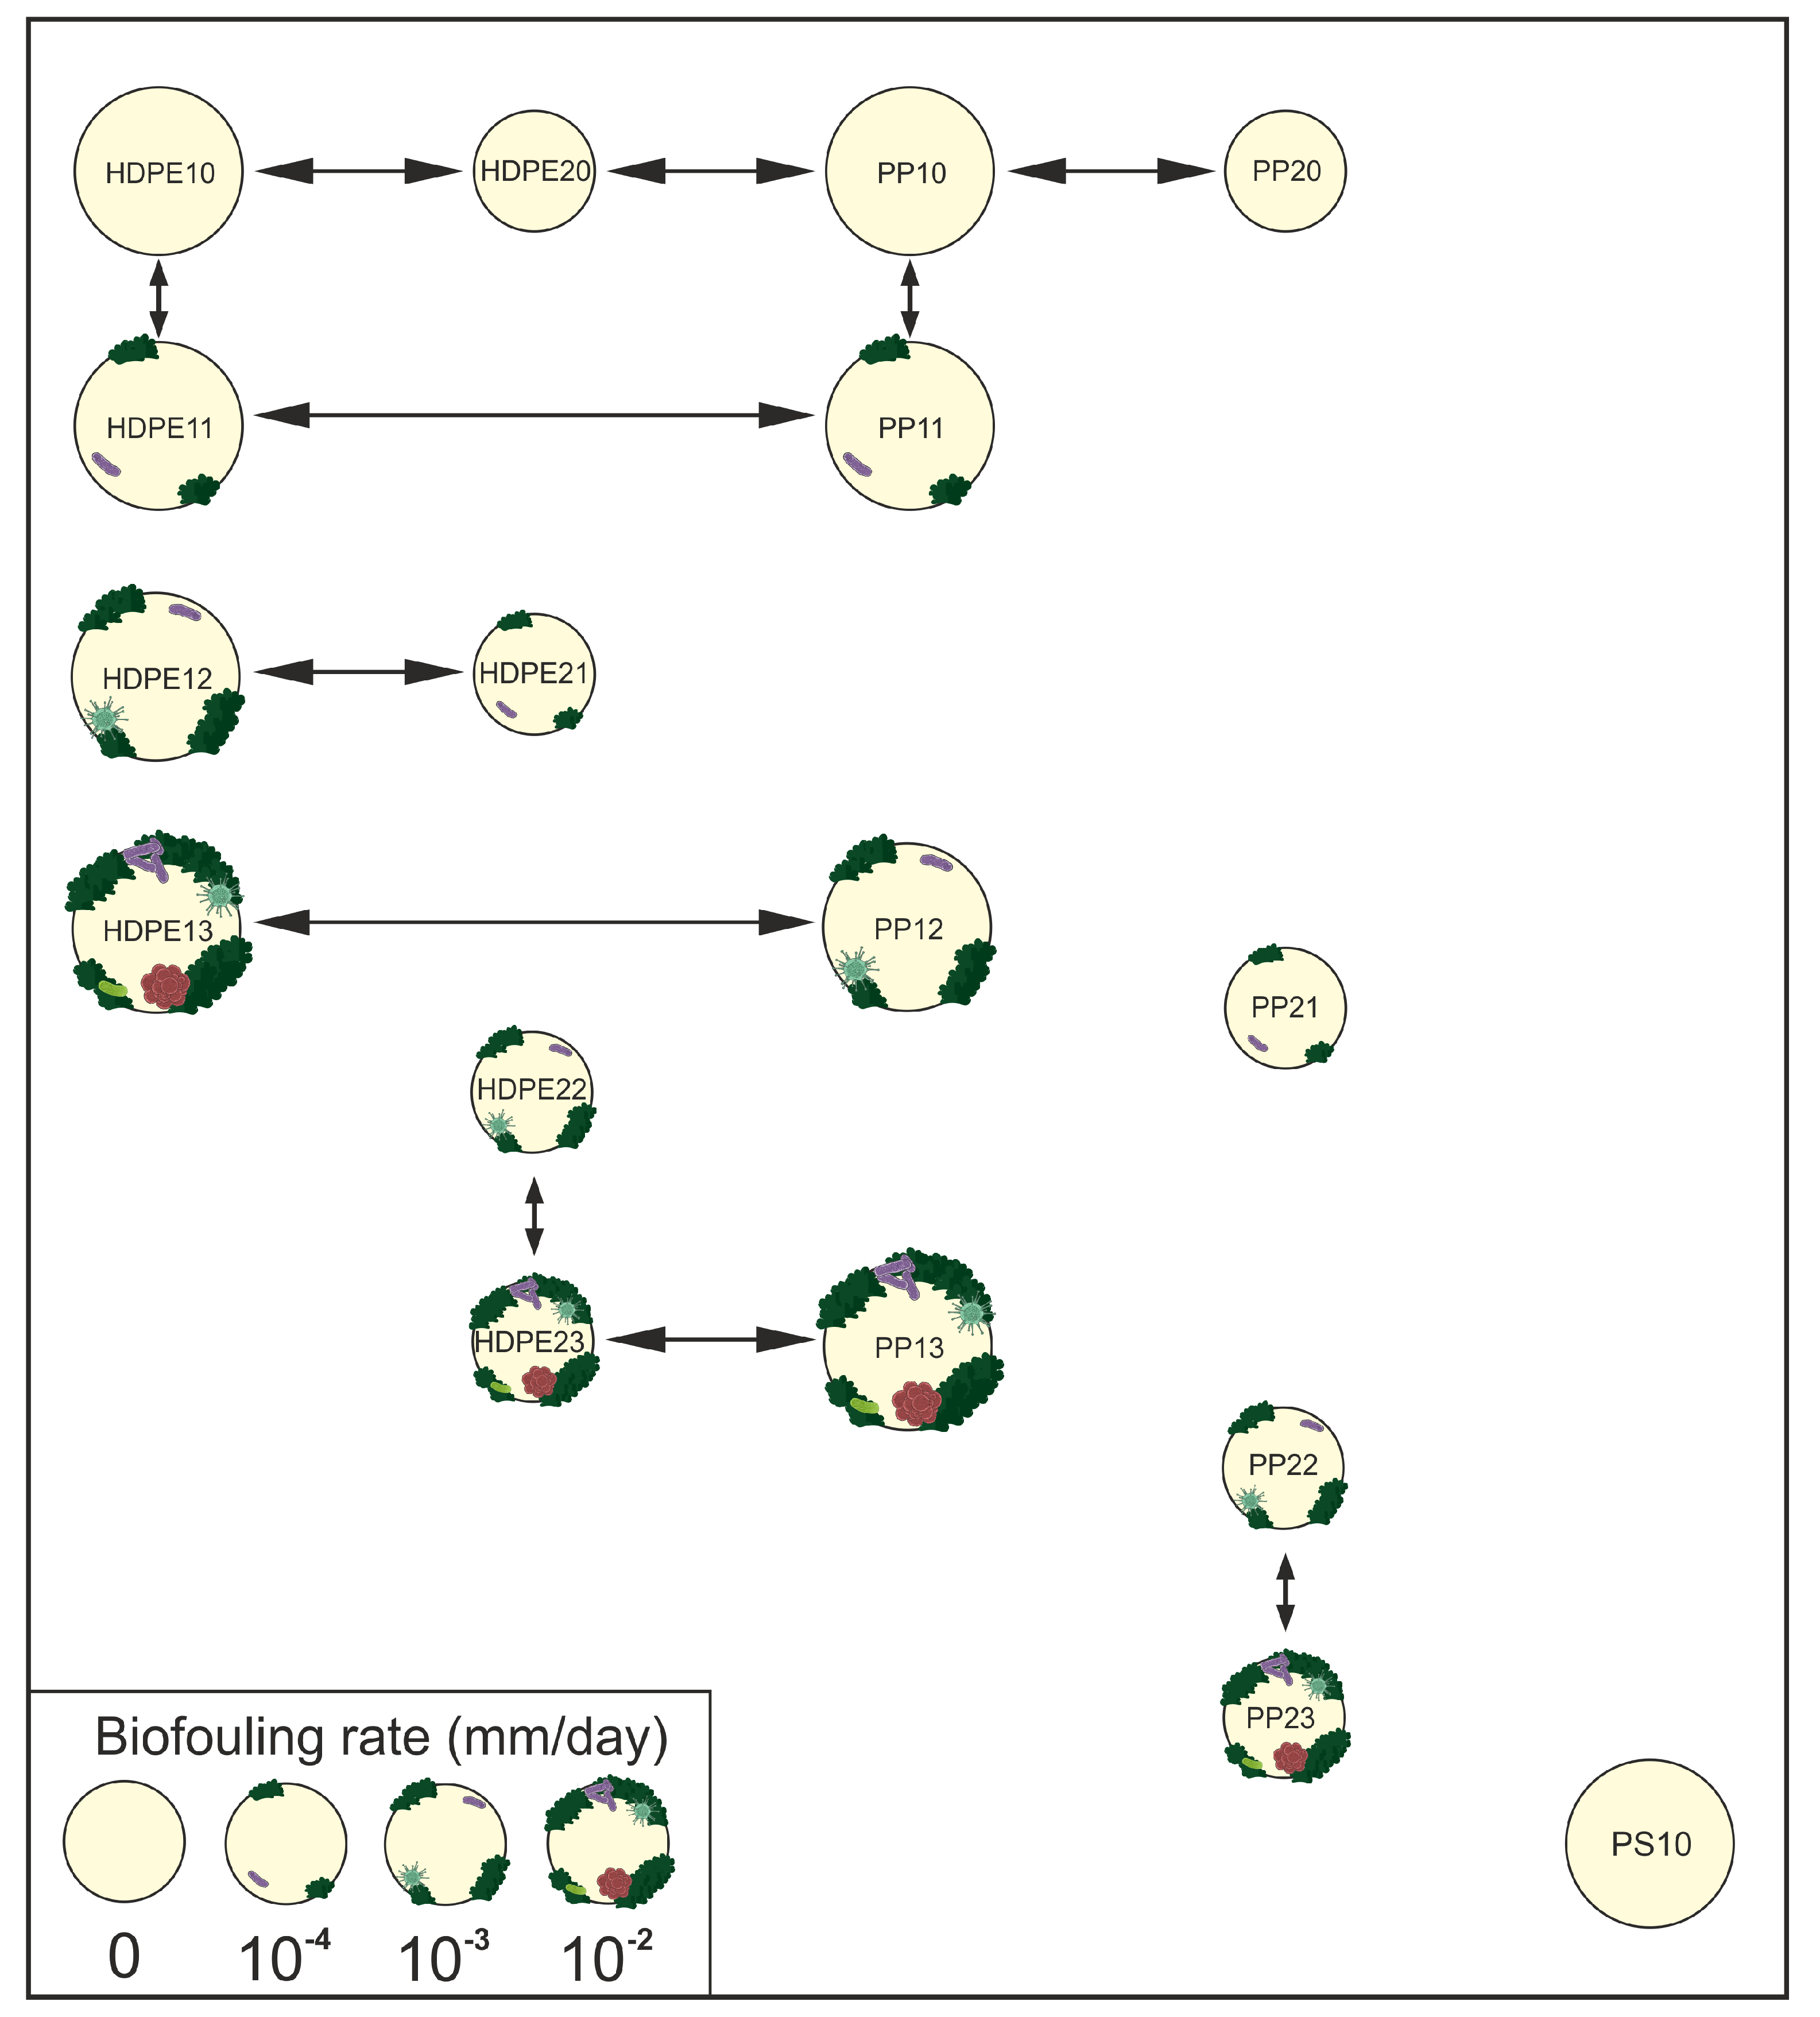
To summarize the results of the study, we have finalized the illustrative scheme of the experiments performed (Figure 2). The new scheme (Figure 10) provides information on the sensitivity of microplastic distributions across experiments. Experiments that have similar results are connected by arrows. The vertical level of the experiment is important, i.e. the more particles remain in the Kara Sea, the lower the experiment marker is located.
The main driving force for the simulated vertical displacement of the MP is the difference in density between particles and seawater. Floating plastics can remain in the surface layer for a long time. Negatively buoyant microplastics (PS) have a higher density than water. Unlike buoyant particles (HDPE and PP), they begin to sink immediately after entering the sea and accumulate on the sea floor. When immersed in water or frozen in sea ice, microplastic particles collect microorganisms on their surface. This process, called biofouling, affects the buoyancy of the particle. The graph shows that light plastic particles of different sizes behave the same unless biofouling is taken into account. This includes an option with a biofouling rate of 10 4 mm/day, but only for particles 5 mm in size. The graph shows that 0.5 mm particles sink faster, so their distribution may be similar to that of 5 mm microplastic particles with a higher biofouling rate or particles or higher density.
We recognize that our approach is an oversimplification of the complex interactions between seawater movement, ice drift, and particle buoyancy as modified by mechanical fragmentation, biofouling, and other factors described in the review [25,30]. We believe that our study focuses attention on fundamental physical processes that need to be studied in order to better identify regions of potential marine microplastic pollution in the future.
Figure 10. Modified scheme of the sensitivity experiments. Small and large circles denote particle sizes of 0.5 and 5 mm, respectively. Arrows indicate experimental results showing similar microplastic distribution after 5-year calculation. Vertical location of the circles reflecs the level of particles sinking.
Preprints 92062 g010

5. Conclusion

This study aims to define the most critical physical processes influencing the transport and deposition of riverine microplastics in the Arctic Ocean shelf and deep-water basin. The coupled ice-ocean 3-dimensional numerical model SibCIOM and NCEP/NCAR atmospheric reanalysis data were used to obtain daily fields of water and sea ice state and circulation for the period 2016-2020. A three-dimensional Lagrangian particle tracking model used these daily ocean and ice fields to simulate large-scale MP transport. The model included parameterisations of the vertical displacement of floating microplastic particles as a function of the density difference between the particles and the surrounding water and biofouling (accumulation of microorganisms).
We considered the entire Arctic Ocean domain with riverine microplastic flux from Yenisey and Ob into the Kara Sea. Estimates of the amount of plastic entering the ocean with river waters were used from a model based on population density and the quality of plastic waste management systems in the catchment [61]. A series of numerical experiments included three types of microplastics, high-density polyethylene (HDPE, density 955 kg/m3), polypropylene (PP, density 1010 kg/m3) and polystyrene (PS, density 1040 kg/m3) with particle sizes of 5 and 0.5 mm in diameter.
The model simulates the transport of microplastic particles over time and shows that, depending on particle size and density, the particles either float in the water or drift with the ice and sink to the seafloor. The main driver of the modelled long-range transport is the water and ice circulation, but the vertical displacement of the MP is determined by the difference between the particle and seawater densities. Buoyant plastics can remain in the surface layer for a long time. Negatively buoyant microplastics have a higher density than water. Unlike buoyant particles, they begin to sink immediately after entering the sea and accumulate near the river mouth.
The study emphasizes that the effects of microplastic embedment in sea ice and particle biofouling are fundamental issues that affect the trajectories of floating particles and their settling on the seafloor. Biofouling changes the buoyancy of particles. When the density of a particle with a biofilm exceeds seawater density, it begins to sink. The time a particle remains in the surface layer and the depth to which it sinks depends on the particle size, the rate of biofouling, and the thermohaline structure of the water. Larger particles, 5 mm, appear to be more buoyant than the same particles size of 0.5 mm. Therefore, the same biofouling rate for 5 and 0.5 mm particles results in different MP distributions.
The modeling results show that low density microplastics repeatedly moving from the upper water layer to the ice and back again, are transported both within and out of the shelf. Included in the Transpolar Drift system, they exit through the Fram and Denmark straits and settle in the deep Greenland Sea depending on the intensity of particle biofouling. The results demonstrate that the transport of light microplastic particles in the ice can lead to pollution of the Barents Sea from sources located within the Actic Ocean. Trapped into the ice, microplastics travel faster than in the upper layers of the ocean. Without freezing, less low-density plastic is transported across the Fram Strait. If we additionally take into account biofouling, which leads to gradual submergence of floating particles, microplastics remain on the shelf bottom or are transported along the continental slope in cyclonic direction following the trajectory of the Atlantic waters.

Supplementary Materials

The following supporting information can be downloaded at the website of this paper posted on Preprints.org.

Author Contributions

Conceptualization and methodology, E.G.; software, E.G., M.G.; validation, E.G., M.G.; investigation, E.G., M.G.; writing - original draft preparation, E.G., M.G.; visualization, M.G. All authors have read and agreed to the published version of the manuscript.

Funding

This research is supported by Russian Science Foundation, Grant 20-11-20112.

Institutional Review Board Statement

Not applicable.

Informed Consent Statement

Not applicable.

Data Availability Statement

NCEP/NCAR Reanalysis Data are provided by National Centers for Environmental Prediction/National Weather Service/NOAA/U.S. Department of Commerce. NCEP/NCAR Global Reanalysis Products, 1948-continuing. Research Data Archive https://psl.noaa.gov/data/gridded/data.ncep.reanalysis.html.
The used version of the ArcticGRO Discharge Dataset and monthly average river discharge temperatures are available online at http://research.cfos.uaf.edu/arctic-river/ and https://arcticgreatrivers.org/discharge/.

Acknowledgments

The Siberian Branch of the Russian Academy of Sciences (SB RAS) Siberian Supercomputer Center is gratefully acknowledged for providing supercomputer facilities.

Conflicts of Interest

The authors declare no conflict of interest.

References

  1. Cózar, A.; et al. Plastic debris in the open ocean. Proc. Nat. Acad. Sci. 2014, 111, 10239–10244. [Google Scholar] [CrossRef] [PubMed]
  2. Andrady, A.L. Persistence of Plastic Litter in the Oceans. In Marine Anthropogenic Litter. Eds. Bergmann M., Gutow L., Klages M. Springer, Cham. 2015. [CrossRef]
  3. Andrady, A.L.; Neal, M.A. Applications and societal benefits of plastics. Philos Trans R Soc Lond B Biol Sci. 2009, 364, 1977–1984. [Google Scholar] [CrossRef] [PubMed]
  4. Bergmann, M.; Tekman, M.; Gutow, L. Sea change for plastic pollution. Nature 2017, 544, 297. [Google Scholar] [CrossRef] [PubMed]
  5. Bergmann, M.; Allen, S.; Krumpen, T.; Allen, D. High Levels of Microplastics in the Arctic Sea Ice Alga Melosira arctica, a Vector to Ice-Associated and Benthic Food Webs. Sci. Technol. 2023, 57, 6799–6807. [Google Scholar] [CrossRef] [PubMed]
  6. Thushari, G.G.N.; Senevirathna, J.D.M. Plastic pollution in the marine environment. Heliyon 2020, 27, e04709. [Google Scholar] [CrossRef] [PubMed]
  7. Law, K.L. Plastics in the Marine Environment. Annu. Rev. Mar. Sci. 2017, 9, 205–29. [Google Scholar] [CrossRef] [PubMed]
  8. Carbery, M.; O’Connor, W.; Palanisami, T. Trophic transfer of microplastics and mixed contaminants in the marine food web and implications for human health. Environment International 2018, 115, 400–409. [Google Scholar] [CrossRef] [PubMed]
  9. Kühn, S.; Schaafsma, F.L.; van Werven, B.; et al. Plastic ingestion by juvenile polar cod (Boreogadus saida) in the Arctic Ocean. Polar Biol 2018, 41, 1269–1278. [Google Scholar] [CrossRef] [PubMed]
  10. Woodall, L.C.; Sanchez-Vidal, A.; Canals, M.; Paterson, G.L.; Coppock, R.; Sleight, V.; Calafat, A.; Rogers, A.D.; Narayanaswamy, B.E.; Thompson, R.C. The deep sea is a major sink for microplastic debris. R. Soc. Open Sci. 2014, 1, 140317. [Google Scholar] [CrossRef] [PubMed]
  11. Kim, S.K.; Lee, H.J.; Kim, J.S.; Kang, S.H.; Yang, E.J.; Cho, K.H.; Tian, Z.; Andrady, A. Importance of seasonal sea ice in the western Arctic ocean to the Arctic and global microplastic budgets. J. Hazard. Mater. 2021, 418, 125971. [Google Scholar] [CrossRef] [PubMed]
  12. Peeken, I.; Primpke, S. Beyer, B; Gütermann, J; Katlein, C.; Krumpen, T.; Bergmann, M.; Hehemann, L.; Gerdts, G. Arctic sea ice is an important temporal sink and means of transport for microplastic. Nat. Commun. 2018, 9, 1505. [Google Scholar] [CrossRef] [PubMed]
  13. Obbard, R.W.; et al. Global warming releases microplastic legacy frozen in Arctic Sea ice. Earth’s Future 2014, 2, 315–320. [Google Scholar] [CrossRef]
  14. Zhang, Y.; Gao, T.; Kang, S.; Allen, D.; Wang, Z.; Luo, X.; Yang, L.; Chen, J.; Hu, Z.; Chen, P.; Du, W.; Allen, S. Cryosphere as a temporal sink and source of microplastics in the Arctic region, Geoscience Frontiers 2023, 14, 101566. 14. [CrossRef]
  15. Yakushev, E.; et al. Microplastics distribution in the Eurasian Arctic is affected by Atlantic waters and Siberian rivers. Earth Environ. 2021, 2, 23. [Google Scholar] [CrossRef]
  16. Lusher, A.L.; et al. Microplastics in Arctic polar waters: the first reported values of particles in surface and sub-surface samples. Sci. Rep. 2015, 5, 14947. [Google Scholar] [CrossRef] [PubMed]
  17. Cózar, A.; et al. The Arctic Ocean as a dead end for floating plastics in the North Atlantic branch of the Thermohaline Circulation. Sci.Adv. 2017, 3, e1600582. [Google Scholar] [CrossRef] [PubMed]
  18. Kanhai, D.K.; Gårdfeldt, K.; Lyashevska, O.; Hassellöv, M.; Thompson, R.C.; O’Connor, I. Microplastics in sub-surface waters of the Arctic Central Basin. Mar Pollut Bull. 2018, 130, 8–18. [Google Scholar] [CrossRef] [PubMed]
  19. Kanhai, D.K.; Johansson, C.; Frias, J.P.G.L.; Gardfeldt, K.; Thompson, R.C.; O’Connor, I. Deep sea sediments of the Arctic Central Basin: A potential sink for microplastic. Deep-Sea Research, 2019; 145 Part I, 137–142. [Google Scholar] [CrossRef]
  20. Mu, J.; Qu, L.; Jin, F.; Zhang, S.; Fang, C.; Ma, X.; Zhang, W.; Huo, C.; Cong, Y.; Wang, J. Abundance and distribution of microplastics in the surface sediments from the northern Bering and Chukchi Seas. Environmental Pollution 2019, 245, 122–130. [Google Scholar] [CrossRef] [PubMed]
  21. Bergmann, M.; Collard, F.; Fabres, J.; et al. Plastic pollution in the Arctic. Nat Rev Earth Environ 2022, 3, 323–337. [Google Scholar] [CrossRef]
  22. Mu, J.; et al. Microplastics abundance and characteristics in surface waters from the Northwest Pacific, the Bering Sea, and the Chukchi Sea. Mar. Pollut. Bull. 2019, 143, 58–65. [Google Scholar] [CrossRef] [PubMed]
  23. Frank, Y.A.; Vorobiev, D.S. Kayler,O.A.; Vorobiev, E.D.; Kulinicheva, K.S.; Trifonov, A.A.; Hunter, T.S. Evidence for microplastics contamination of the remote tributary of the Yenisey River Siberia-the pilot study results. Water 2021, 13, 3248. [Google Scholar] [CrossRef]
  24. Pogojeva, M.; et al. Distribution of floating marine macro-litter in relation to oceanographic characteristics in the Russian Arctic Seas. Mar. Pollut. Bull. 2021, 166, 112201. [Google Scholar] [CrossRef] [PubMed]
  25. Van Sebille, E.; et al. The physical oceanography of the transport of floating marine debris. Environ. Res. Lett. 2020, 15, 023003. [Google Scholar] [CrossRef]
  26. Kaiser, D.; Kowalski, N.; Waniek, J.J. Effects of biofouling on the sinking behavior of microplastics. Environ. Res. Lett. 2017, 12, 124003. [Google Scholar] [CrossRef]
  27. Morét-Ferguson, S.; Law, K.L.; Proskurowski, G.; Murphy, E.K.; Peacock, E.E.; Reddy, C.M. The size, mass, and composition of plastic debris in the western North Atlantic Ocean. Mar Pollut Bull. 2010, 60, 1873–1878. [Google Scholar] [CrossRef] [PubMed]
  28. Chen, X.; Xiong, X.; Jiang, X.; Shi, H.; Wu, C. Sinking of floating plastic debris caused by biofilm development in a freshwater lake. Chemosphere 2019, 222, 856–864. [Google Scholar] [CrossRef] [PubMed]
  29. Fazey, F.M.; Ryan, P.G. Biofouling on buoyant marine plastics: An experimental study into the effect of size on surface longevity. Environ Pollut. 2016, 210, 354–360. [Google Scholar] [CrossRef] [PubMed]
  30. Chubarenko, I. Physical processes behind interactions of microplastic particles with natural ice. Environ. Res. Commun. 2022, 4, 012001. [Google Scholar] [CrossRef]
  31. Chubarenko, I.; Bocherikova, I.; Esiukova, E.; Isachenko, I.; Kupriyanova, A.; Lobchuk, O.; Fetisov, S. Microplastics in sea ice: A fingerprint of bubble flotation. Science of The Total Environment 2023, 164611. [Google Scholar] [CrossRef] [PubMed]
  32. Hoffmann, L.; et al. Interactions between the ice algae Fragillariopsis cylindrus and microplastics in sea ice. Environment International 2020, 139, 105697. [Google Scholar] [CrossRef]
  33. Pradel, A.; Gautier, M.; Bavay, D.; Gigault, J. Micro- and nanoplastics’ transfer in freezing saltwater: Implications for their fate in polar waters. Environ. Sci.: Processes Impacts 2021, 23, 1759–1770. [Google Scholar] [CrossRef] [PubMed]
  34. Mountford, A.S.; Morales Maqueda, M.A. Eulerian Modeling of the Three-Dimensional Distribution of Seven Popular Microplastic Types in the Global Ocean. JGR Oceans 2019, 124, 8558–8573. [Google Scholar] [CrossRef]
  35. Mountford, A. S.; Morales Maqueda, M.A. Modeling the accumulation and transport of microplastics by sea ice. JGR Oceans 2020, 126, e2020JC016826. [Google Scholar] [CrossRef]
  36. Huserbråten, M.B.O.; Hattermann, T.; Broms, C.; et al. Trans-polar drift-pathways of riverine European microplastic. Sci. Rep. 2022, 12, 3016. [Google Scholar] [CrossRef] [PubMed]
  37. Golubeva, E. N.; Platov, G. A. On improving the simulation of Atlantic Water circulation in the Arctic Ocean. J. Geophys. Res. 2007, 112, C04S05. [Google Scholar] [CrossRef]
  38. Golubeva, E.N.; Platov, G.A. Numerical modeling of the Arctic Ocean ice system response to variations in the atmospheric circulation from 1948 to 2007. Izv. Atmospheric and Oceanic Physics 2009, 45, 137–151. [Google Scholar] [CrossRef]
  39. Leonard, B.P. A stable and accurate convective modeling procedure based on quadratic upstream interpolation. Computer Methods Applied Mechanics and Engineering 1979, 19, 59–98. [Google Scholar] [CrossRef]
  40. Leonard, B.P.; Lock, A.P.; MacVean, M.K. Conservative explicit unrestricted-timestep multidimensional constancy-preserving advection schemes. Mon. Weather Rev. 1996, 124, 2588–2606. [Google Scholar] [CrossRef]
  41. Platov, G.A. Numerical modeling of the Arctic Ocean deepwater formation: Part II. Results of regional and global experiments. Izv. Atmospheric and Oceanic Physics 2011, 47, 377–392. [Google Scholar] [CrossRef]
  42. Hunke, E. C.; Dukowicz, J. K. An elastic-viscous-plastic model for ice dynamics. J. Phys. Oceanography 1997, 27, 1849–1867. [Google Scholar] [CrossRef]
  43. Bitz, C.M.; Lipscomb, W.H. An energy-conserving thermodynamic model of sea ice. J. Geophys. Res. 1999, 104, 15669–15677. [Google Scholar] [CrossRef]
  44. Lipscomb, W.H.; Hunke, E.C. Modeling Sea Ice Transport Using Incremental Remapping. Mon. Weather Rev. 2004, 132, 1341–1354. [Google Scholar] [CrossRef]
  45. Kalnay, E.; Kanamitsu, M.; Kistler, R.; Collins, W.; Deaven, D.; Gandin, L.; Iredell, M.; Saha, S.; White, G.; Woollen, J.; Zhu, Y.; Chelliah, M.; Ebisuzaki, W.; Higgins, W.; Janowiak, J.; Mo, K. C.; Ropelewski, C.; Wang, J.; Leetmaa, A.; Reynolds, R.; Jenne, R.; Joseph, D. The NCEP/NCAR 40-Year Reanalysis Project. Bull. Amer. Meteor. Soc. 1996, 77, 437–471. [Google Scholar] [CrossRef]
  46. Platov, G.A.; Golubeva, E.N.; Kraineva, M.V.; Malakhova, V.V. Modeling of climate tendencies in Arctic seas based on atmospheric forcing EOF decomposition. Ocean Dynamics 2019, 69, 747–767. [Google Scholar] [CrossRef]
  47. Woodgate, R.A. Increases in the Pacific inflow to the Arctic from 1990 to 2015, and insights into seasonal trends and driving mechanisms from year-round Bering Strait mooring data. Prog. Oceanogr. 2018, 160, 124–154. [Google Scholar] [CrossRef]
  48. Vorosmarty, C.J.; Fekete, B.M.; Tucker, B.A. 1998. Global River Discharge, 1807-1991, V[ersion]. 1.1 (RivDIS). ORNL DAAC, Oak Ridge, Tennessee, USA. [CrossRef]
  49. McClelland, J.W.; Tank, S.E.; Spencer, R.G.M.; Shiklomanov, A.I.; Zolkos, S.; Holmes, R.M.; Arctic Great Rivers Observatory. Discharge Dataset, Version 20230810. Available online: https://arcticgreatrivers.org/discharge/ (accessed on 01 December 2023).
  50. Whitefield, J., Winsor, P., McClelland, J., Menemenlis, D. A new river discharge and river temperature climatology data set for the pan-Arctic region. Ocean Modelling 2015, 88, 1–15, ISSN 1463-5003. [CrossRef]
  51. Forum for Arctic Modeling and Observational Synthesis. Available online: https://web.whoi.edu/famos (accessed on 01 December 2023).
  52. Proshutinsky, A.; Aksenov, Y.; Clement Kinney, J.; Gerdes, R.; Golubeva, E.; Holland, D.; Holloway, G.; Jahn, A.; Johnson, M.; Popova, E.; Steele, M.; Watanabe, E. Recent advances in Arctic ocean studies employing models from the Arctic Ocean Model Intercomparison Project. Oceanography 2011, 24, 102–113. [Google Scholar] [CrossRef]
  53. Proshutinsky, A.; Krishfield, R.; Toole, J.M.; Timmermans, M.-L.; Williams, W.; Zimmermann, S.; et al. Analysis of the Beaufort Gyre freshwater content in 2003–2018. JGR Oceans 2019, 124. [Google Scholar] [CrossRef] [PubMed]
  54. Aksenov, Y.; Karcher, M.; Proshutinsky, A.; Gerdes, R.; de Cuevas, B.; Golubeva, E.; Kauker, F.; Nguyen, A.T.; Platov, G.A.; Wadley, M.; Watanabe, E.; Coward, A.C.; Nurser, A.J.G. Arctic pathways of Pacific Water: Arctic Ocean Model Intercomparison experiments. JGR Oceans 2016, 121, 27–59. [Google Scholar] [CrossRef] [PubMed]
  55. Platov, G.A.; Golubeva, E.N.; Krupchatnikov, V.N.; et al. Numerical Study of Interaction between the Climate System Components and Their Role in Arctic Amplification of Climate Change. Water Resour 50 2023, 664–674. [Google Scholar] [CrossRef]
  56. Golubeva, E.; Kraineva, M.; Platov, G.; Iakshina, D.; Tarkhanova, M. Marine heatwave in Siberian Arctic Seas and adjacent region. Remote Sens. 2021, 13, 4436. [Google Scholar] [CrossRef]
  57. Zhiyao, S.; Tingting, W.; Fumin, X.; Ruijie, L. A simple formula for predicting settling velocity of sediment particles. Water Science and Engineering 2008, 1, 37–43. [Google Scholar] [CrossRef]
  58. Chubarenko, I.; Bagaev, A.; Zobkov, M.; Esiukova, E. On some physical and dynamical properties of microplastic particles in marine environment. Mar. Pollut. Bull. 2016, 108, 105–12. [Google Scholar] [CrossRef] [PubMed]
  59. Fisher, N.S.; Bjerregaard, P.; Fowler, S.W. Interactions of marine plankton with transuranic elements. 1. Biokinetics of neptunium, plutonium, americium, and californium in phytoplankton. Limnol. Oceanogr. 1983, 28, 432–447. [Google Scholar] [CrossRef]
  60. Wassmann, P.; Reigstad, M. Future Arctic Ocean seasonal ice zones and implications for pelagic-benthic coupling. Oceanography 2011, 24, 220–231. [Google Scholar] [CrossRef]
  61. Schmidt, C.; Krauth, T.; Wagner, S. Export of Plastic Debris by Rivers into the Sea. Environ Sci Technol. 2017, 51, 12246–12253. [Google Scholar] [CrossRef] [PubMed]
  62. Jalón-Rojas, I.; Wang, X.H.; Fredj, E. A 3D numerical model to Track Marine Plastic Debris (TrackMPD): Sensitivity of microplastic trajectories and fates to particle dynamical properties and physical processes. Mar Pollut Bull. 2019, 141, 256–272. [Google Scholar] [CrossRef] [PubMed]
  63. Gradova, M.A.; Golubeva, E.N. Evaluation of the Riverine Heat Influx Impact on the Arctic Ice Cover Based on Numerical Modeling. Russ. Meteorol. Hydrol. 2023, 48, 639–644. [Google Scholar] [CrossRef]
  64. Korsnes, R.; Pavlova, O.; Godtliebsen, F. Assessment of potential transport of pollutants into the Barents Sea via sea ice – an observational approach. Mar Pollut Bull. 2002, 44, 861–869. [Google Scholar] [CrossRef] [PubMed]
  65. Emberson-Marl, H.R.L.; Coppock, M.; Cole, B.J.; Godley, N.; Mimpriss, S.E.; Nelms, P.K.; Lindeque, P.K. Microplastics in the Arctic: a transect through the Barents Sea. Front. Mar. Sci. Sec. Marine Pollution 2023, 10. [CrossRef]
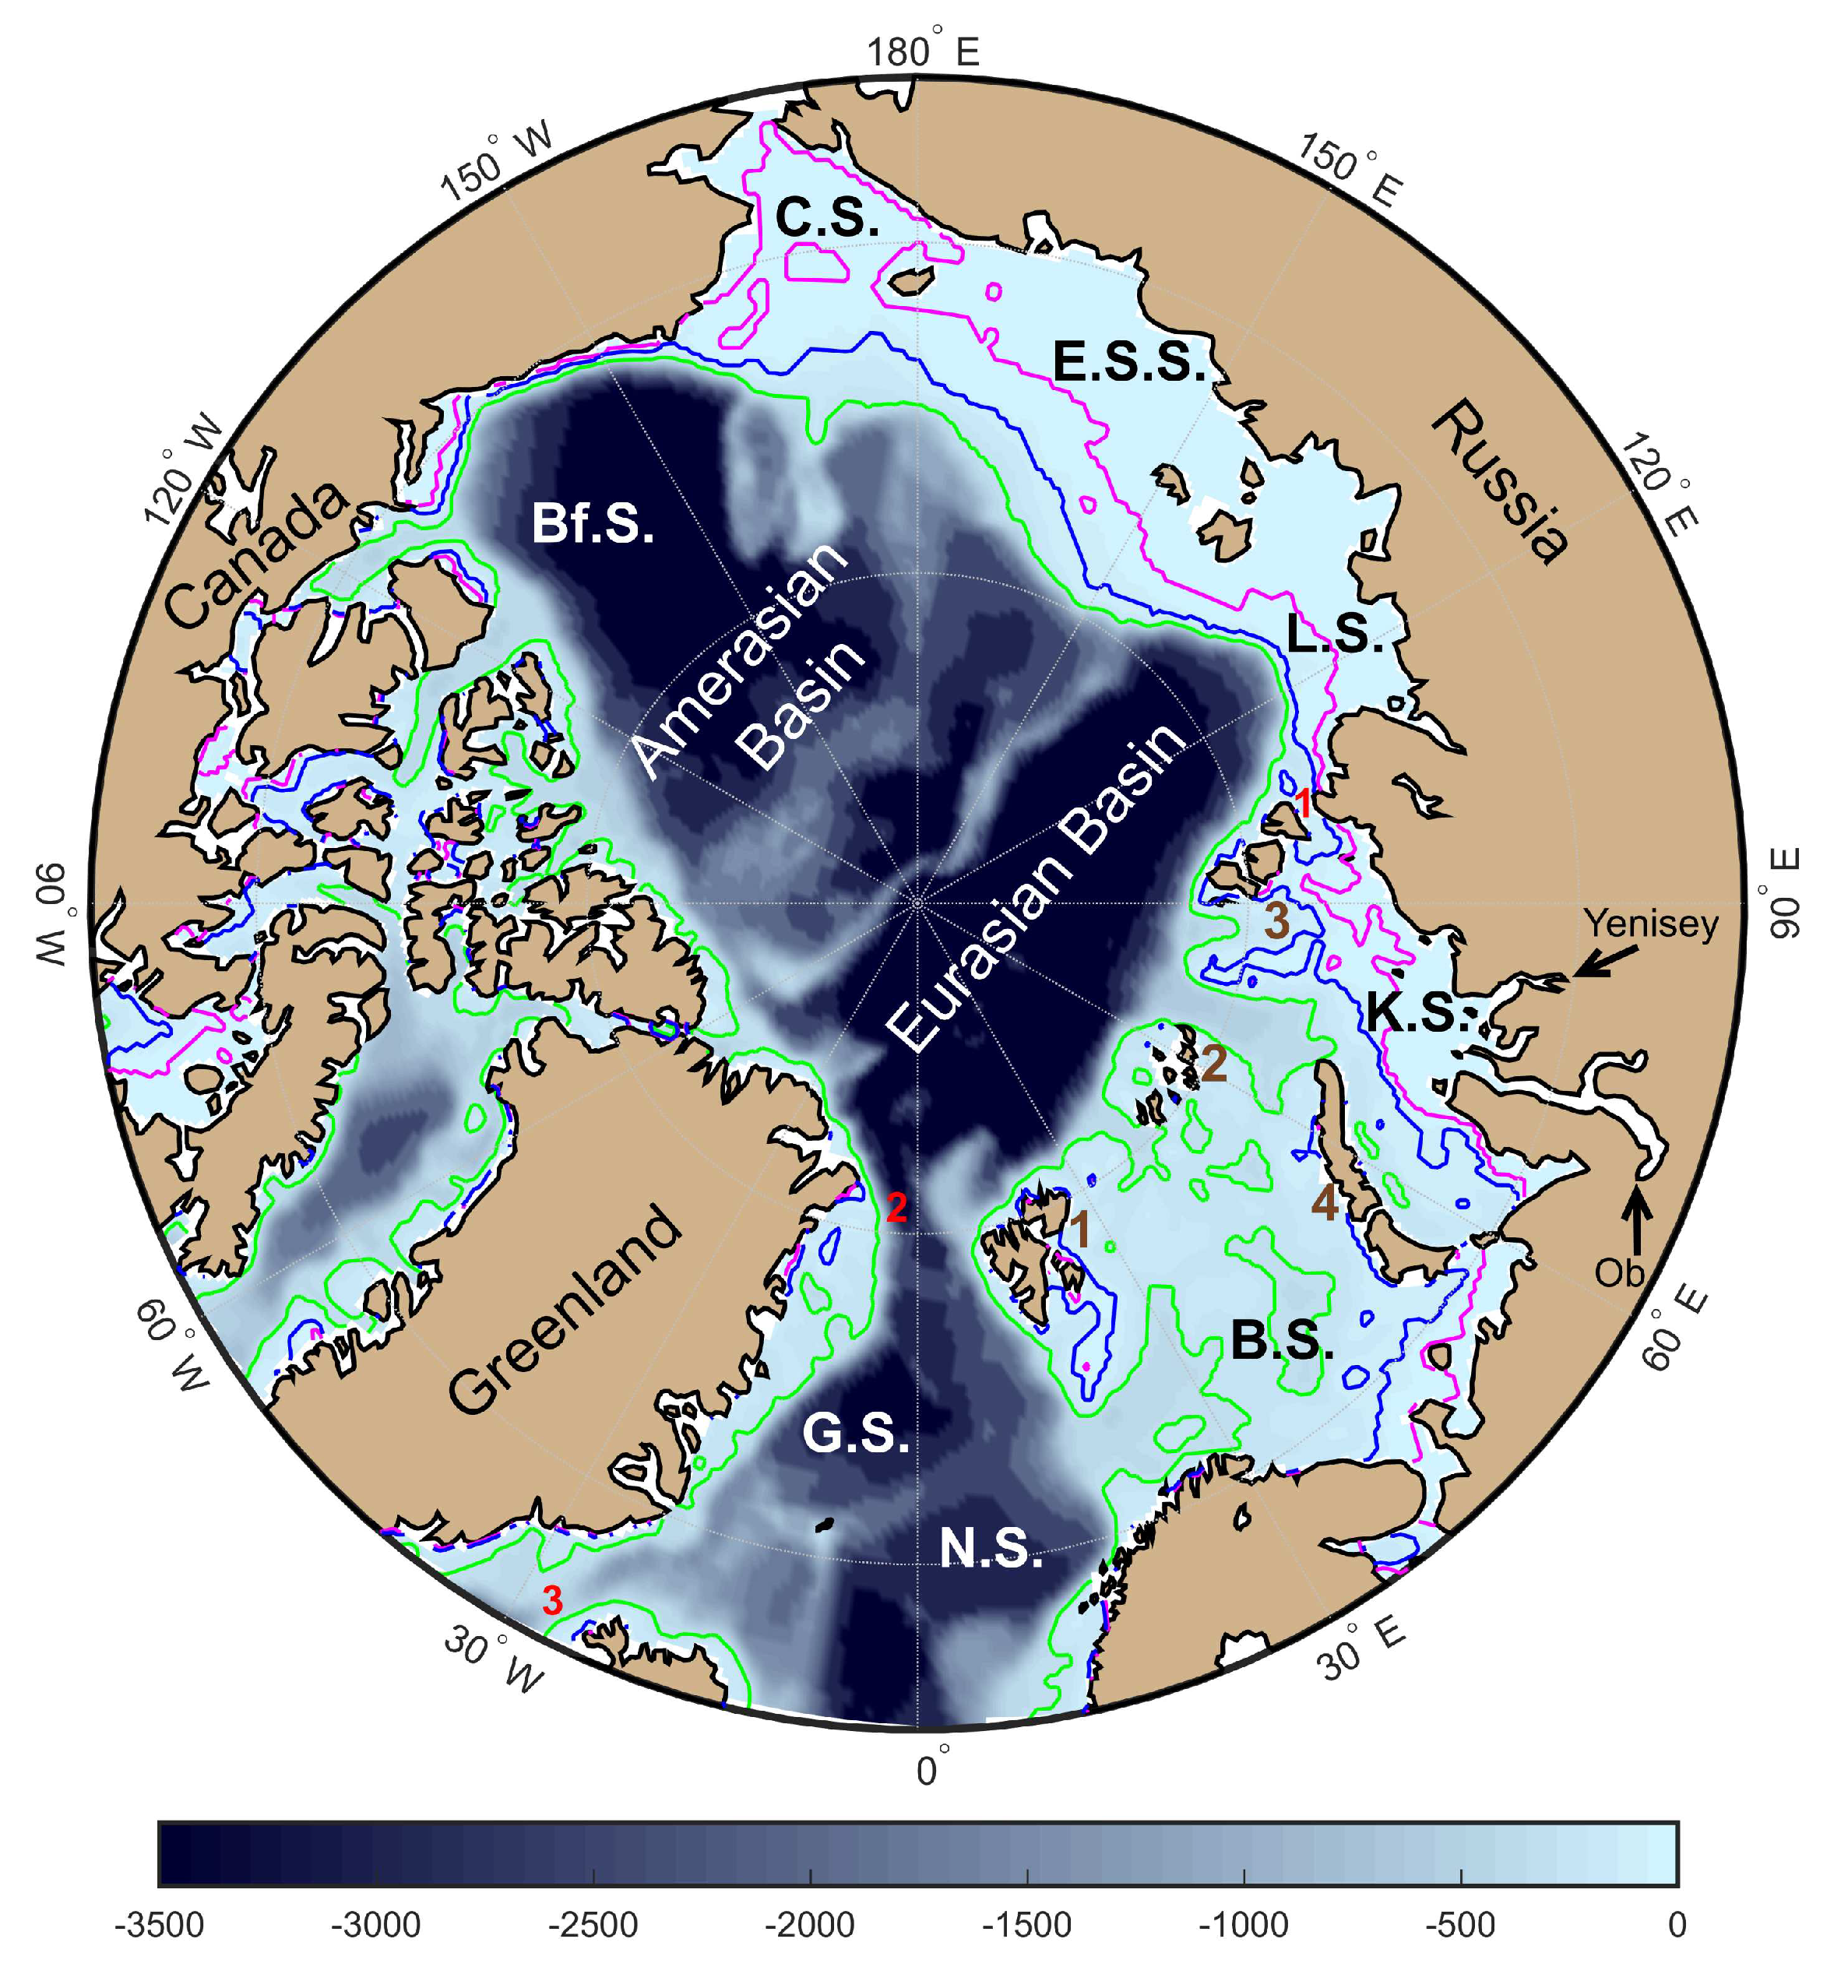
Figure 1. The map of Arctic Ocean bathimetry, magenta, blue and green lines show the depths of 30, 75 and 300 m. Here G.S. - Greenland Sea, B.S. - Barents Sea, K.S. - Kara Sea, L.S. - Laptev Sea, E.S.S. - East Siberian Sea, C.S. - Chukchi Sea; brown numbers denote archipelagos: 1 - Spitsbergen, 2 - Franz Josef Land, 3 - Northern Land; red numbers denote straits: 1- Vilkitsky Strait, 2 - Fram Strait, 3 - Denmark Strait.
Preprints 92062 g001
Figure 2. Illustration scheme of experiments on sensitivity to MP type (plastic density), particle size, biofouling rate. The experiment name is given by the type of plastic (HDPE, PP or PS) followed by two digits, the first defining the particle size: "1" for 5 mm and "2" for 0.5 mm; the second digit defines the biofouling rate (BR), namely: "0" - no biofouling, "1" for 10 4 mm/day, "2" for 10 3 mm/day and "3" for 10 2 mm/day.
Preprints 92062 g002
Figure 3. Simulated in SibCIOM two modes of ice drift, (a) anticyclonic; (b) cyclonic.
Preprints 92062 g003
Figure 4. Large-scale velocity fields averaged over the period 2016-2020 (SibCIOM results): (a) mean in the surface layer 0-10m; (b) mean in the layer 200-600 m
Preprints 92062 g004
Figure 5. Simulated particle distribution after 5 years of continuous riverine MP influx. Biofouling is excluded from consideration. (a) results for PP, particle size 0.5 mm; (b) PS, particle size 5 mm.
Preprints 92062 g005
Figure 6. Simulated microplastic particle distribution after 5 years of continuous riverine influx. Biofouling rate B R = 10 2 mm/day. Particle size 5 and 0.5 mm. Particle color is determined by its immersion depth, shown in the panel below.
Preprints 92062 g006
Figure 7. Simulated microplastic particle distribution after 5 years of continuous riverine influx. Different particle sizes and biofouling rates. Results of the experiments (a) - PP12; (b) - HDPE12; (c) - HDPE13; (d) - HDPE21. Particle color is determined by its immersion depth, shown in the panel below. Type MP differs in the pictures (a) and (b); (b) and (c) differ in biofouling rates; (b) and (d) differ in particle sizes and biofouling rates; (a) and (c) differ in particle types and biofouling rates.
Preprints 92062 g007
Figure 8. Time series of particle number in different water layers. The color of the plots corresponds to the point colors in previous pictures. (a) - PP12; (b) - HDPE13; upper panels show the number of particles in region where the sea depth is shallower 300 m, lower panels - the same for shelf-water regions.
Preprints 92062 g008
Figure 9. Sensitivity HDPE MP distribution to the probabily of freezing into sea ice: (a)  P = 0 , biofouling rate of 10 3 mm/day; (b) P = 0.01 , biofouling rate of 10 3 mm/day; (c) P = 0 , biofouling rate of 10 4 mm/day; (d) P = 0.1 , biofouling rate of 10 4 mm/day.
Preprints 92062 g009
Disclaimer/Publisher’s Note: The statements, opinions and data contained in all publications are solely those of the individual author(s) and contributor(s) and not of MDPI and/or the editor(s). MDPI and/or the editor(s) disclaim responsibility for any injury to people or property resulting from any ideas, methods, instructions or products referred to in the content.
Copyright: This open access article is published under a Creative Commons CC BY 4.0 license, which permit the free download, distribution, and reuse, provided that the author and preprint are cited in any reuse.
Prerpints.org logo

Preprints.org is a free preprint server supported by MDPI in Basel, Switzerland.

Subscribe

© 2024 MDPI (Basel, Switzerland) unless otherwise stated