1. Introduction
Global trends in industrial development are aimed at reducing the carbon footprint [
1,
2]. The problem of controlling carbon dioxide emissions arises not only in the course of economic activity, but also in the life of every inhabitant of the planet [
3]. When forming an action plan under climate change, the basis is the calculation of the current carbon dioxide equivalent (CDE) emissions.
Currently, the 2006 IPCC Guidelines for National Greenhouse Gas Inventories are used to estimate the carbon footprint [
4,
5]. It includes general guidelines for organizing data collection, processing, and calculating the carbon footprint of each type of production. The document presents calculations of the carbon footprint of enterprises in the fuel and energy complex, agriculture, industrial production, and municipal solid waste. Calculations of the carbon footprint are based on direct measurement of carbon dioxide emissions, fuel demand per unit of production, fuel carbon content coefficients, fuel carbon oxidation coefficients [
5]. The calculation technique was used in the greenhouse gas (GHG) Protocol [
6]. It was developed by the World Resources Institute (WRI), an environmental think tank and the World Business Council for Sustainable Development [
7]. The GHG Protocol is used for greenhouse gases regulated by the Kyoto Protocol. The GHG Protocol for calculating the carbon footprint of The American University of Sharjah (AUS) is published in the open press. The main contribution to the total carbon emission is made by the consumption of energy resources and the use of vehicles [
8]. A similar result was obtained for school at the Universidad de Monterrey [
9].
According to the IPCC Guidelines for National GHG, total greenhouse gas emissions are a multifaceted indicator. It includes both the direct emission of a gas mixture containing carbon dioxide, methane and other greenhouse gases, as well as the cost of energy resources, the operation of vehicles, and others. Accounting for all sources of emissions requires the development of climate monitoring systems. Moreover, solutions are needed both for industry and for the population.
Currently, there are already solutions for monitoring greenhouse gases. Scientists from the Istanbul Technical University (Turkey) have developed a geographic information system for campus control using ArcGIS. It calculates carbon dioxide emissions based on the total energy consumption data for the year. The calculation of the carbon footprint is carried out in accordance with the guidance documentation of the IPCC (2006) [
10,
11].
A web application has been developed for calculating the carbon footprint based on data on energy consumption and vehicle emissions [
12].
A system for monitoring the carbon footprint of seaports has been developed using the example of one of the Spanish ones [
13]. The authors proposed the calculation of the carbon footprint of the seaport.
Georgia Institute of Technology scientists have developed a system for calculating the carbon footprint of a region. It is based on data on energy consumption in residential buildings. It is currently used in Maikop County (Arizona, USA) [
14].
The calculation of the carbon footprint of freight vehicles was carried out [
15]. A calculation of the carbon footprint of a machining shop was proposed [
16].
State authorities are developing regulations to meet the IPCC requirements for reducing greenhouse gas emissions [
17,
18]. In the conditions of modern society, existing technical and information means require solutions for automated collection of information to generate the required reporting on the impact on climate change, and develop solutions to reduce this impact.
However, existing systems make calculations based on data for a certain period of time (month, year). The data is entered manually. There are no solutions for automated control of CDE emissions for both industry and other areas of human activity. Such decisions do not allow for a quick response to changing situations. Society requires the development of end-to-end technologies that allow immediate decision-making and control actions. The use of automated control systems will allow:
- 1)
promptly receive information on current greenhouse gas emissions,
- 2)
conduct an analysis of the impact of economic activities on the climate problem and assess quality parameters in accordance with regulatory documents,
- 3)
carry out control actions in order to minimize or reduce greenhouse gas emissions.
The target audience for using end-to-end technology for automated data collection and carbon footprint calculations are residents of populated areas and industrial enterprises. One of the components of the modern human worldview is environmentally friendly production. Human strives to preserve the natural environment for his descendants [
19,
20,
21,
22]. The concept of carbon-neutral human activity is a challenge of the global community and the personal initiative of each resident. Industrial enterprises formulate work plans to reduce greenhouse gas emissions based on international regulations and recommendations.
The aim of the study is to develop automated systems for monitoring the individual carbon footprint of a person and CDE emissions by enterprises.
2. Materials and Methods
As research methods in this work, the basics of building automated process control system (APPS) are used. APECS is based on the connection and coordination of greenhouse gas control devices and control systems (storage, processing, operations) [
23,
24].
IoT monitoring devices were used to develop an information system for calculating personal carbon footprint.
Smart water metering devices are a set of equipment with the required parameters:
as a water meter, devices of any type with a pulse output, as well as electronic water meters that transmit data to an external display via interface cables or a wireless network, can be used;
electricity sensor with the ability to transmit information via WiFi network;
a heat energy flow sensor with the ability to transmit information via a WiFi network.
A comparative analysis of smart water meters that transmit data via the IoT protocol was carried out (
Table 1,
Table 2 and
Table 3).
Preference is given to the ZENNER water meter, as it has a wireless data transmission system, the measuring range of the device is greater than the water consumption indicator in residential systems.
Landis+Gyr E470 energy meter is preferred as it transmits data using DLMS. It is a communication protocol for metering and managing energy resources such as electricity, water and gas.
Preference is given to the Diehl Metering SHARKY SOLAR 775 heat consumption meter. Unlike other analogues, it transmits data using several interfaces: M-Bus, RS232, RS485.
The following data is used to calculate the carbon footprint:
Water resource consumption: information about the water consumption of the inlet pipelines allows you to determine the amount of resources used and, accordingly, the amount of carbon emissions associated with these processes.
Energy Meters: Data on the electricity consumption of a business allows you to determine the amount of electricity used and estimate the level of carbon emissions associated with its consumption.
Thermal energy consumption: information on the consumption of thermal energy for space heating allows you to determine the level of energy efficiency and estimate the carbon dioxide emissions associated with its consumption.
Gas concentration: the gas analyzer allows you to evaluate the level of greenhouse gas emissions and their impact on the environment.
For the convenience and accuracy of data collection, the task of developing an automatic system for collecting data from metering devices was set and solved. It provides automatic data collection from various metering devices, such as water meters, electricity meters and heat meters. Information from metering devices is transmitted to the SCADA system through the appropriate communication interfaces, such as RS-485, RJ45, Wifi.
A comparative analysis of flow meters (
Table 8), electricity meters (
Table 9), heat meters (
Table 10), gas analyzers (
Table 11) for an automated control system was carried out.
The Yokogawa ADMAG AXW water meter is preferred because it has a long service life, supports Modbus, Profibus and HART communication, and has a high operating pressure of up to 63 bar.
Schneider Electric iEM3000 energy consumption meter is preferred, as it is multifunctional and allows data transfer via RS485, Modbus protocol.
According to a comparative analysis, for measuring and recording the consumption of thermal energy in production, it is possible to choose any of the presented control devices. Measuring range, operating characteristics, accuracy, communication protocols are acceptable according to technological requirements.
Based on the comparative analysis of gas analyzers, the Li-cor LI-820 gas analyzer was chosen as the preferred option [
25,
26]. It provides high measurement accuracy, wide measurement range, fast response time, reliability and the ability to integrate with the system without the use of additional controllers. It will provide accurate CO2 concentration data to assess the carbon footprint of the enterprise, providing ease of use and customization.
A controller can be selected to control the data acquisition system, for example PLC Modicon TSX Quantum. The 140CPU65150 Processor Unit has an unlimited maximum number of connections as an interface locally. It also has 4 built-in connection types - Ethernet TCP/IP, Modbus, Modbus Plus and USB. The 140CPU65150 has a data rate of 10/100 Mbps. To receive data, the customer must use a shielded twisted-pair cable. The module has a variety of functions, including standard web services, Modbus TCP messaging, I/O scanning services, global data, FDR client, SNMP management and SMTP (email) services. The number of pluggable analog input modules is determined by the number of measurement parameters. For example, an enterprise has several production lines with installed energy control devices. Each of them must be brought to the automated system. To program the controller, a single development environment, application debugging and operating environment for Modicon Premium, Atrium and Quantum controllers - Unity Pro is used.
A study was conducted to develop a model that determines the values of each indicator of human energy consumption for a given carbon footprint. To implement this feature, linear programming methods were used [
27,
28,
29]. To solve the linear programming problem, calculating the target parameters of personal energy consumption, you can use the following approach: 1) determine the decision variables and set restrictions on each of them, 2) leave the target function according to the weight of the influence of each parameter on the total carbon trace, 3) calculate the values of the variables using the simplex method.
The variables used to calculate personal carbon footprint are:
х1 – the amount of electricity consumed per month (in kW/h);
х2 – the amount of water consumed per month (in cubic meters);
х3 – the amount of distance covered by car per month (in km);
х4 – the amount of distance traveled by train per month (in km);
х5 – the amount of distance traveled by plane per month (in km);
х6 – the amount of pork consumed per month (in kg);
х7 – the amount of beef consumed per month (in kg);
х8 – the amount of chicken consumed per month (in kg);
х9 – the amount of distance covered by public transport per month (in km). They are used in formulas 6 and 7.
The following variables were used to calculate the industrial carbon footprint:
y1: electricity consumption from the operation of equipment and industrial lighting, kW/h per year;
y2: annual use of artificial lighting, hours per year;
y3: total power of luminaires, W;
y4: fuel consumption during equipment operation, tons per year;
y5: number of trips by freight transport per month;
y6: truck weight, tons;
y7: mass of cargo transported by it, tons;
y8: thermal energy consumption to provide heating at the enterprise, Gcal per year. They are used in formulas 8 and 9.
3. Results
3.1. Monitoring System for Personal Carbon Footprint
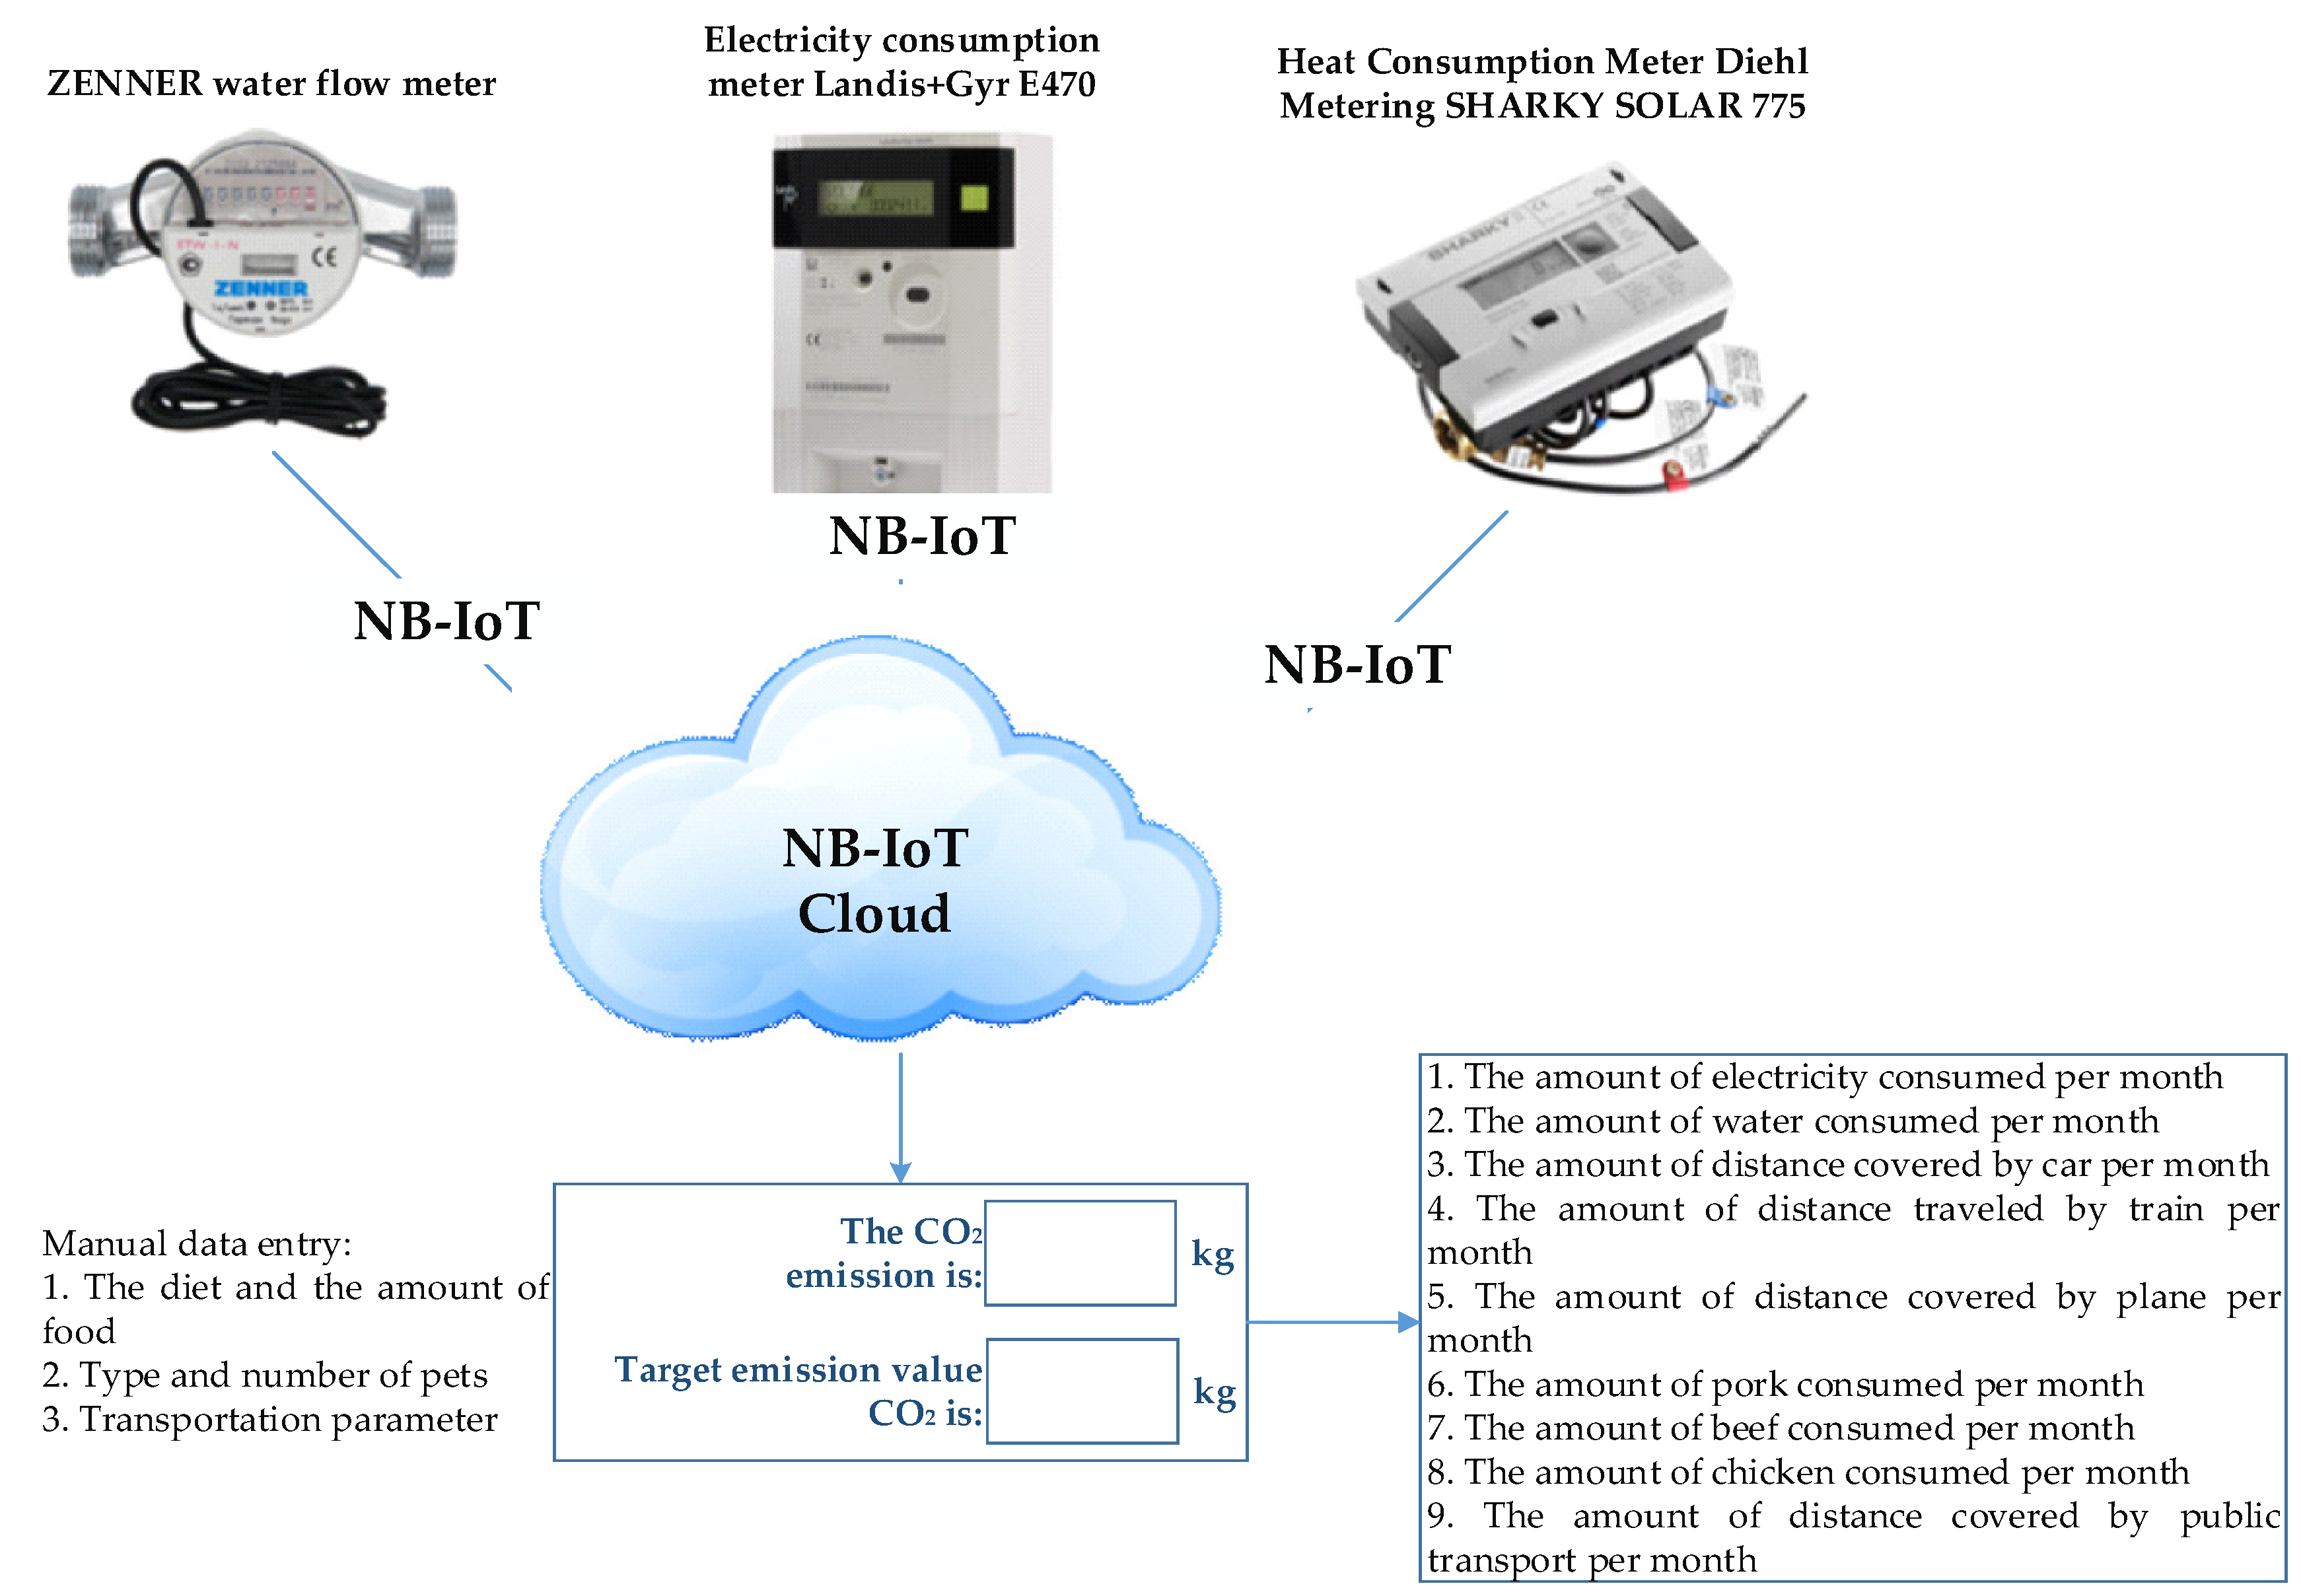
A system for calculating a personal carbon footprint has been developed. It performs the calculation of carbon dioxide emissions based on the values of human vital control parameters (
Figure 1).
The “Indicator measurement system” includes the collection of energy consumption parameters. For data transmission in continuous mode, the use of smart control devices is provided.
The “Score registration system” represents the repository of data obtained from the “Scoreboard”. As an example, the Firebase cloud type database can be used.
“Calculation of personal carbon footprint” is based on data on energy consumption, transport use, presence of pets and diet (
Figure 2). Data on the consumption of heat, electricity, water are used from the “Indicator measurement system”.
A human’s personal carbon footprint is calculated using the formula:
where D - carbon footprint of a person in terms of energy costs, kgCO2;
P – carbon footprint from a pet, kgCO2;
T – is the carbon footprint of a person during transportation, kgCO2;
D – is the carbon footprint of a person according to his diet, kgCO2.
The carbon footprint for energy consumption is calculated based on the data on the amount of electricity, heating, water consumed, the number of people living in a residential building and the CO
2 emission factor by type of energy resource (
Table 12). The formula for calculating a human’s personal carbon footprint based on energy consumption:
where Np – number of people living in housing;
Fe – emission factor from electricity, (kgCO2)/(kW/h);
E – the amount of electricity used, kW/h;
Fh – heating emission factor, (kgCO2)/Gcal;
H – amount of heating, Gcal;
Fw – water emission factor, (kgCO2)/m3 ;
W – the amount of water used, m3.
The carbon footprint of pets is calculated based on the type of pet, its weight and the CO
2 emission factor, which depends on the type of animal (
Table 13). Calculating the carbon footprint of cats and dogs can help pet owners make more environmentally friendly decisions, such as choosing foods with less carbon emissions. The formula for calculating the carbon footprint of a pet is:
where Fva – emission factor from the vital activity of a particular animal species, (kgCO2)/kg;
W – pet weight, kg.
The calculation of the carbon footprint from the use of transport occurs depending on the type of transport used and is divided into:
carbon footprint from the use of the aircraft;
carbon footprint from the use of the train;
carbon footprint from the use of vehicles.
The carbon footprint of different types of vehicles is calculated from their CO
2 emission factor and the distance covered (
Table 14). By calculating this indicator, transport companies and passengers receive recommendations to reduce their CO
2 emissions, thus reducing the negative impact on the climate. The formula for calculating a human’s personal carbon footprint when using vehicles is:
where Fv – vehicle emission factor, (kgCO2)/km;
Dv – distance traveled by vehicle, km.
The carbon footprint of a person’s diet is calculated from the type and amount of food a person eats. CO
2 emission factors for various types of food are presented in
Table 15. Calculating this carbon footprint allows people to recognize their contribution to global warming and reduce it by choosing foods with a lower carbon footprint (for example, by reducing meat consumption). The formula for calculating a person’s personal carbon footprint from their diet is:
where Ff – emission factor depending on the type of food consumed, (kgCO2)/kg;
Af – the amount of food taken, kg.
The module “Development of solutions for carbon footprint management” allows for target calculation of personal consumption parameters taking into account a fixed value of carbon dioxide emissions; offers solutions to reduce carbon footprint.
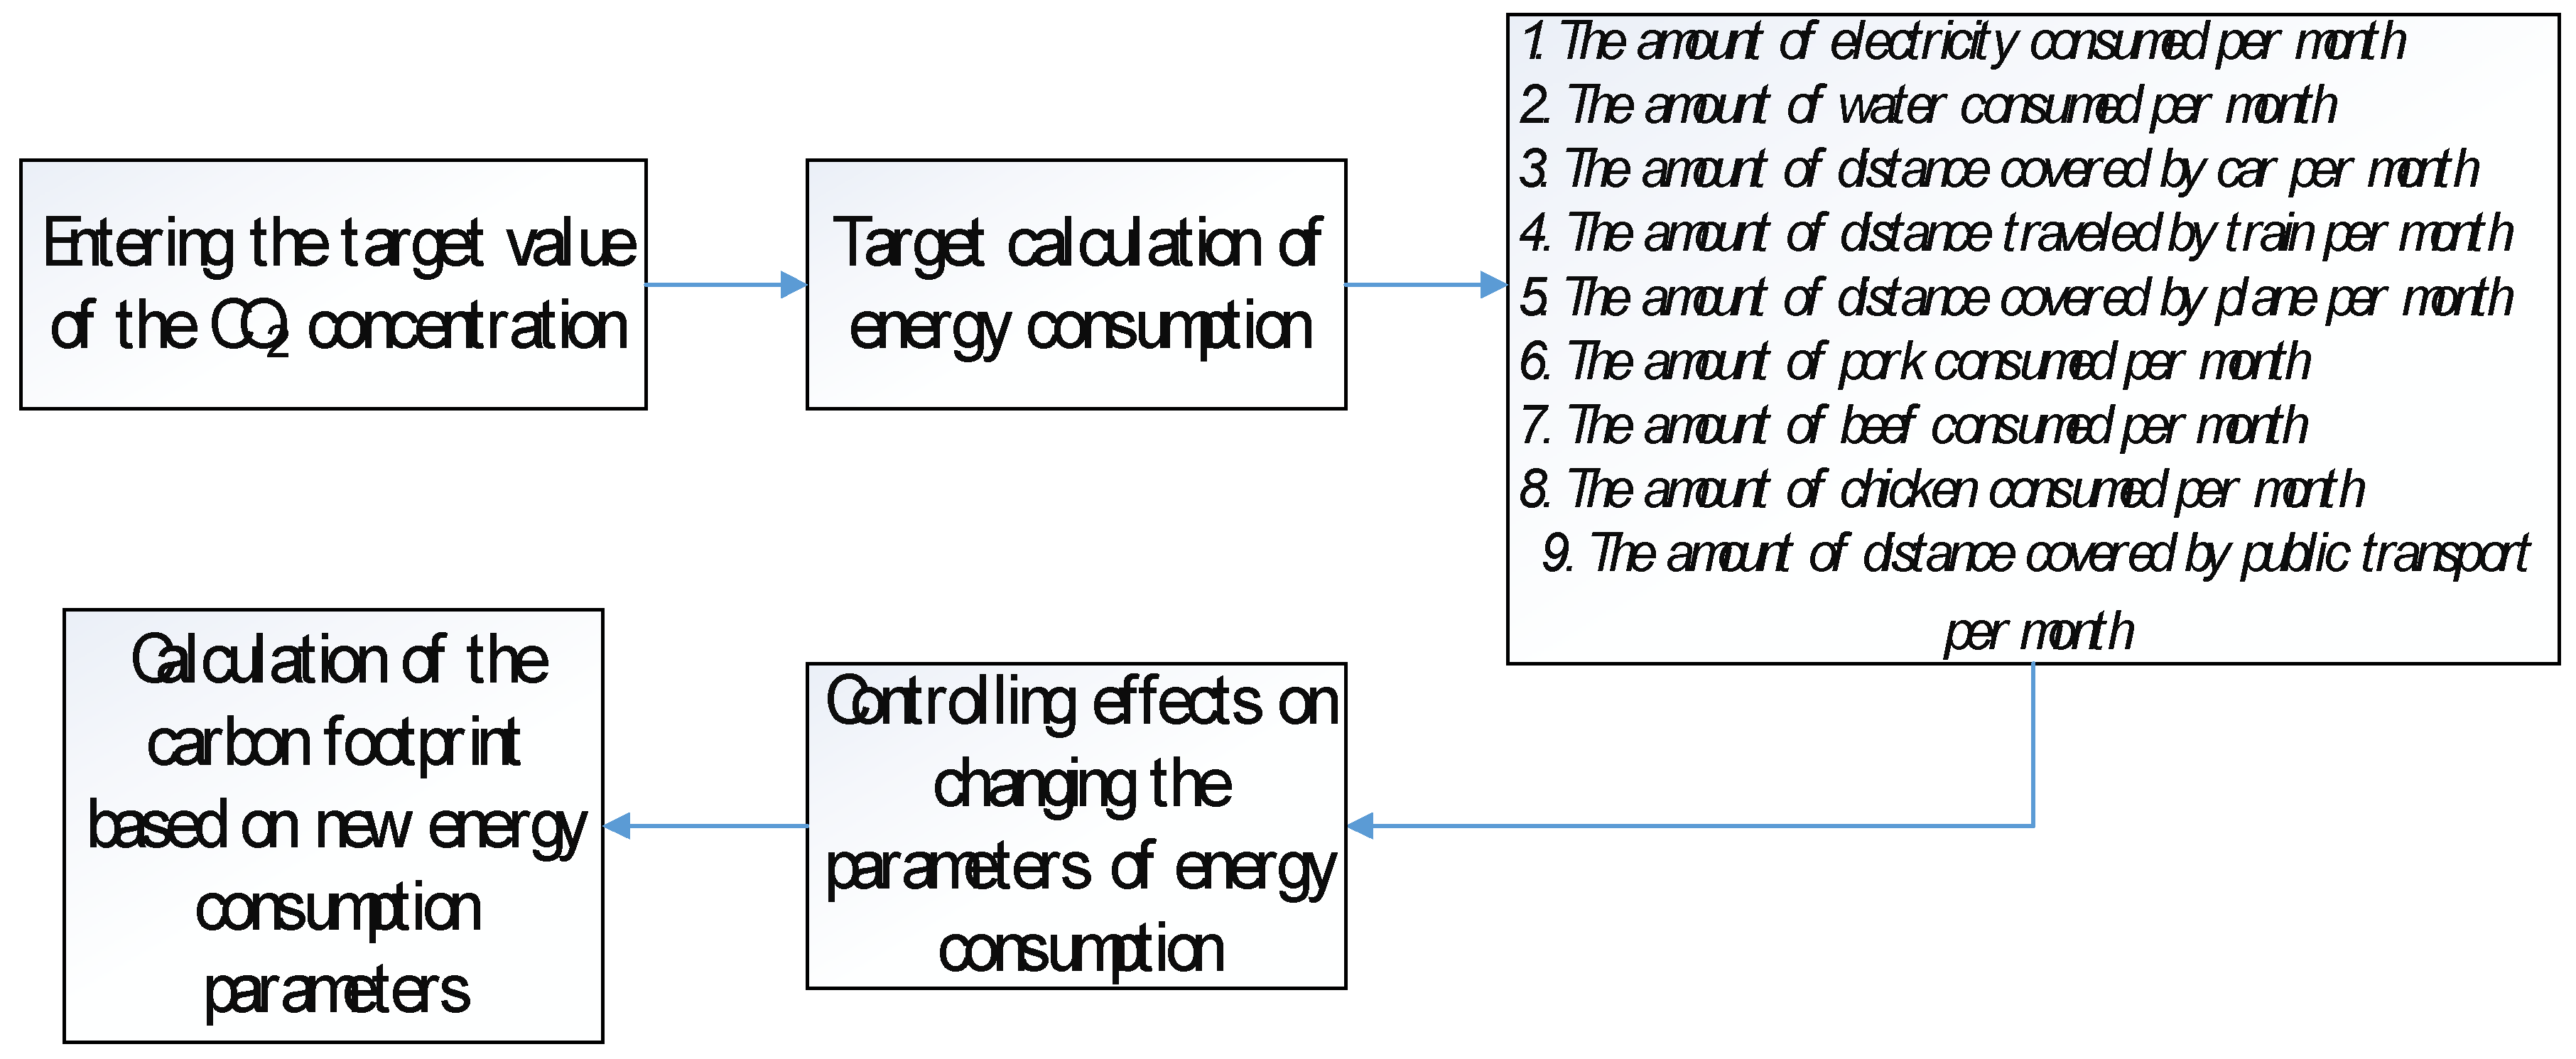
The user must enter their desired monthly personal carbon footprint as the parameter to be analyzed. By taking into account the entered parameter, you can obtain data on other parameters that have an impact on your personal carbon footprint (Figure 4).
Depending on the priorities and life needs of each person, the task of linear programming is individual. The following linear programming problem of a human’s personal carbon footprint was obtained to calculate target energy consumption parameters. Restrictions are set by a person according to his personal needs during the period for which the desired value of the carbon footprint is determined.
The result of solving the problem is the following resource values x1, x2, x3, x4, x5, x6, x7, x8, consumption will lead to the emission of the target value of carbon dioxide. So, if the target value of the carbon footprint is 10 kgCO2, then the amount of electricity consumed should be 100 kW/h; the amount of water consumed is 10 m3; the amount of distance traveled by car is 2000 km; the amount of distance traveled by train is 300 km; the amount of distance traveled by plane is 1500 km; the amount of pork consumed is 4 kg; the amount of beef consumed 1 kg; the amount of chicken consumed is 7 kg; the amount of distance covered by public transport is 500 km.
Block diagram of the developed system for automated monitoring of personal carbon footprint is shown in
Figure 3.
Figure 3.
Algorithm for managing personal carbon footprint through an objective function.
Figure 3.
Algorithm for managing personal carbon footprint through an objective function.
Figure 4.
Block diagram of an automated system for calculating a personal carbon footprint.
Figure 4.
Block diagram of an automated system for calculating a personal carbon footprint.
This system has been implemented and tested on a family consisting of two people. They live in an apartment building in an apartment of 63 m2. This family has a gasoline-fueled car. The climate of the area in which the family lives is sharply continental.
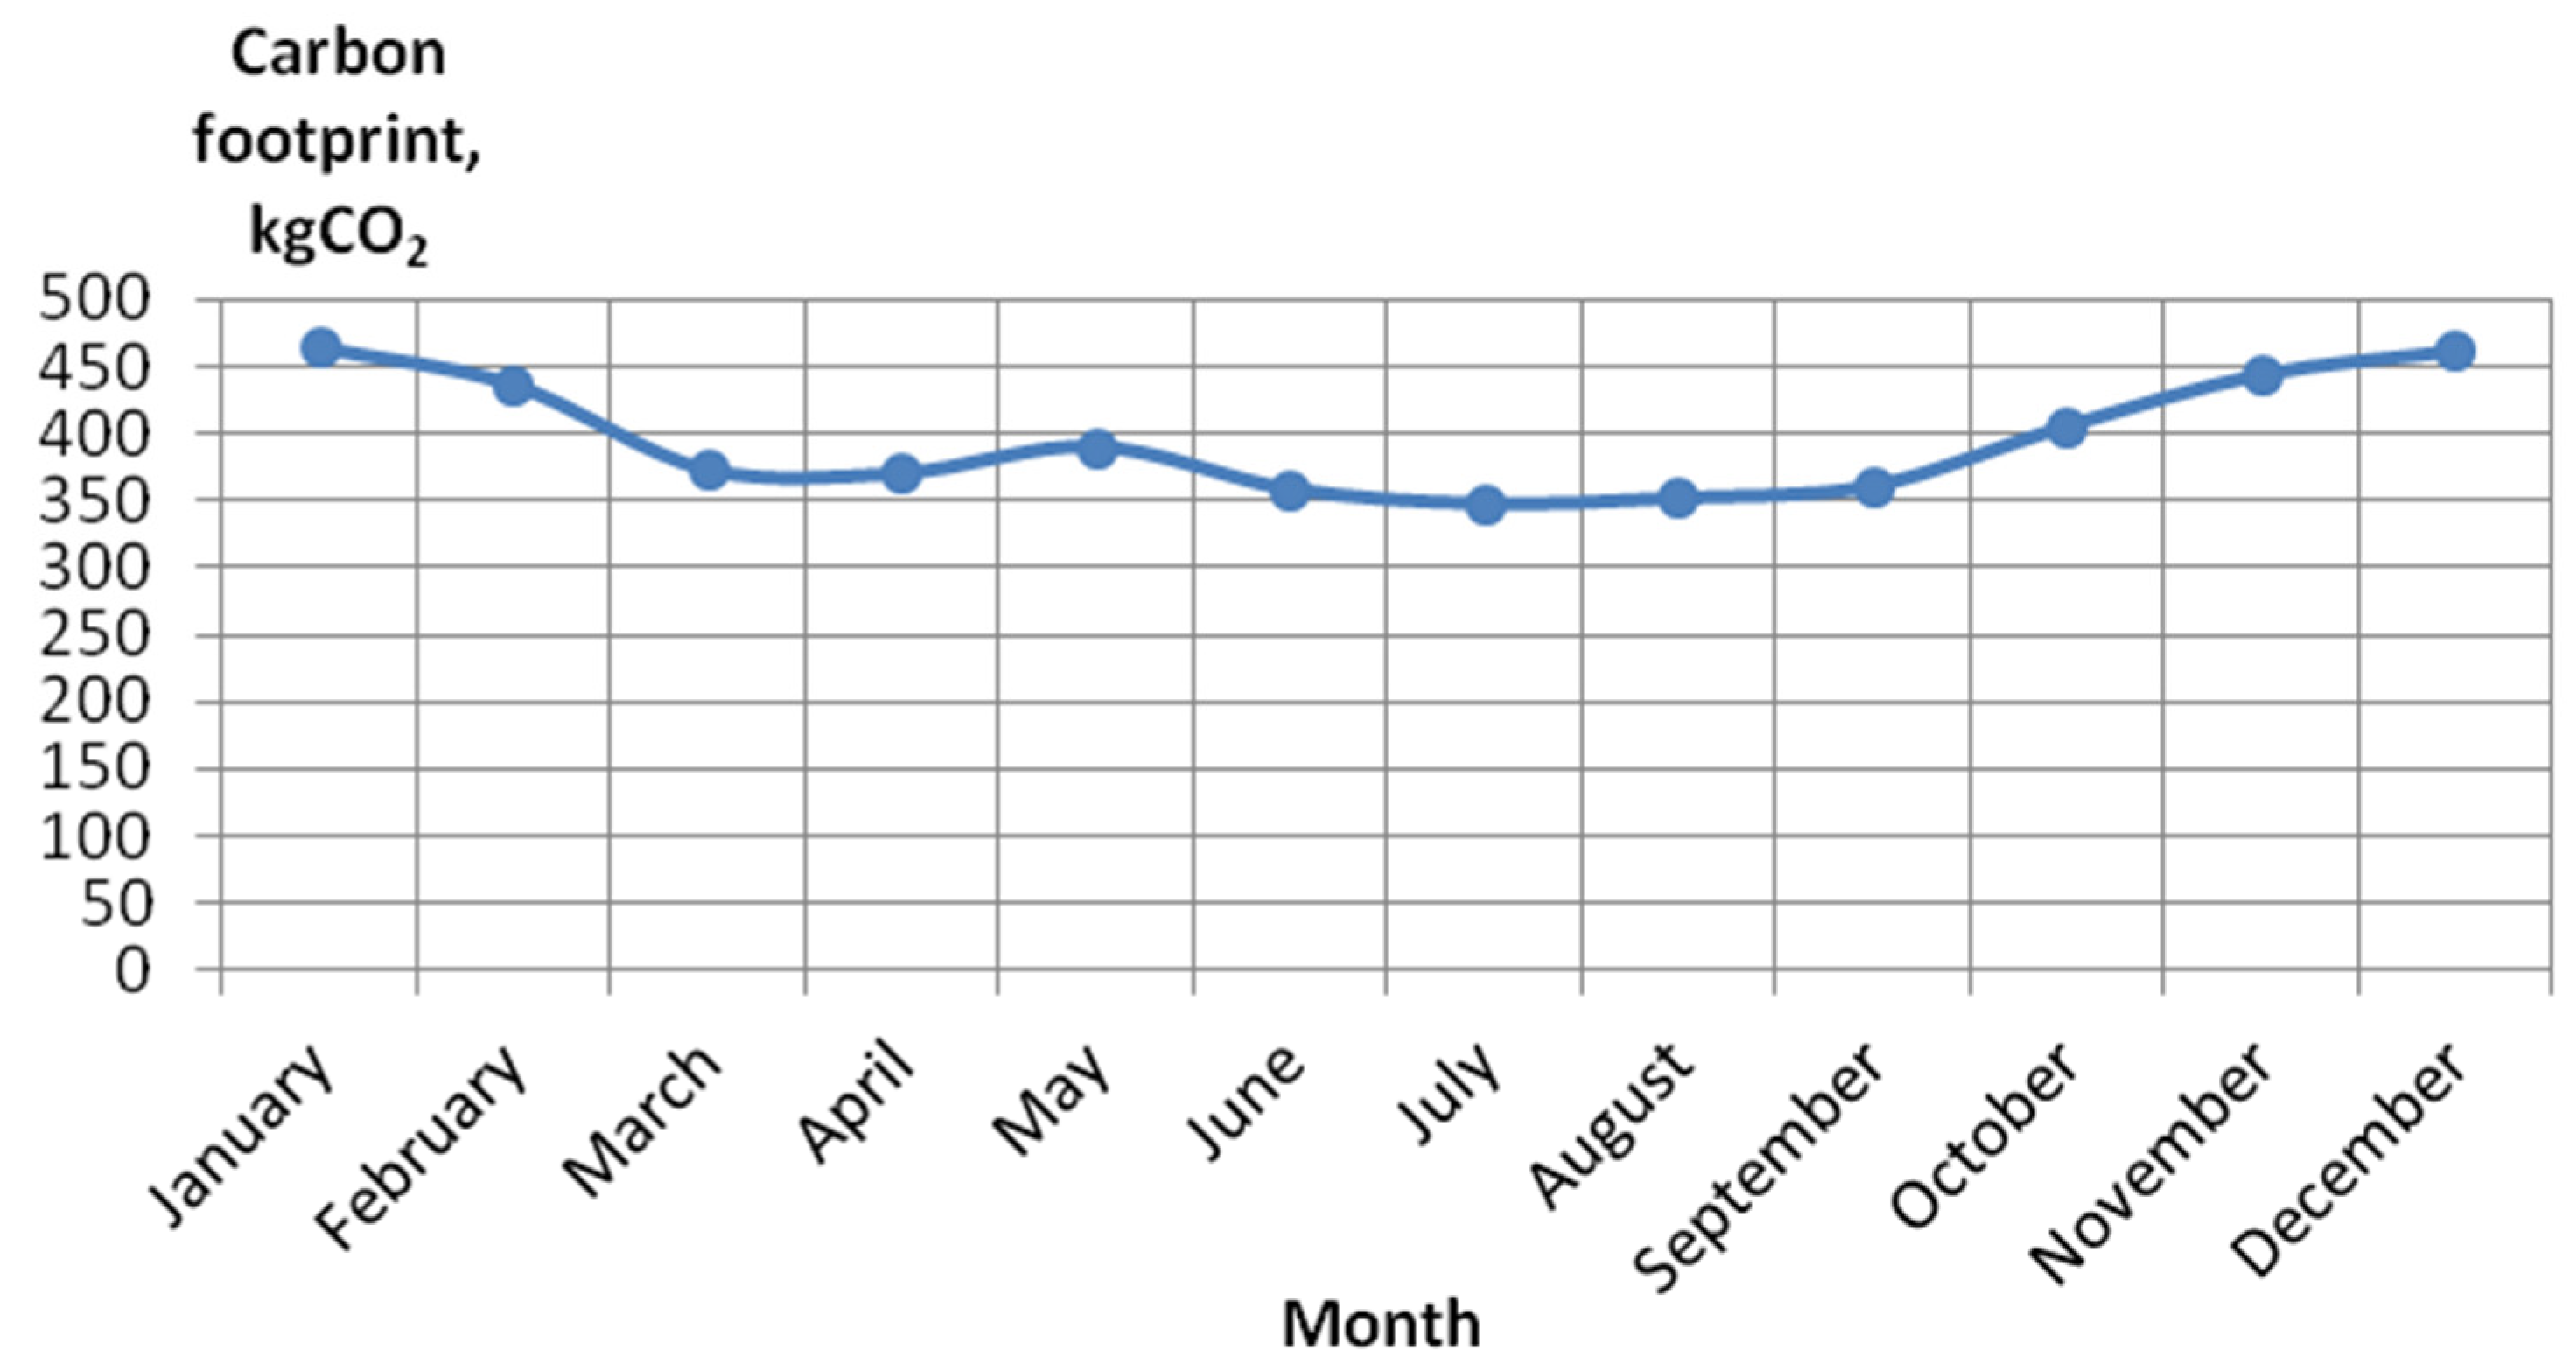
As a result of the operation of the system for collecting information on personal energy consumption for 1 year, an array of data was obtained. The carbon footprint value was calculated. The result is shown in
Figure 5.
As can be seen from
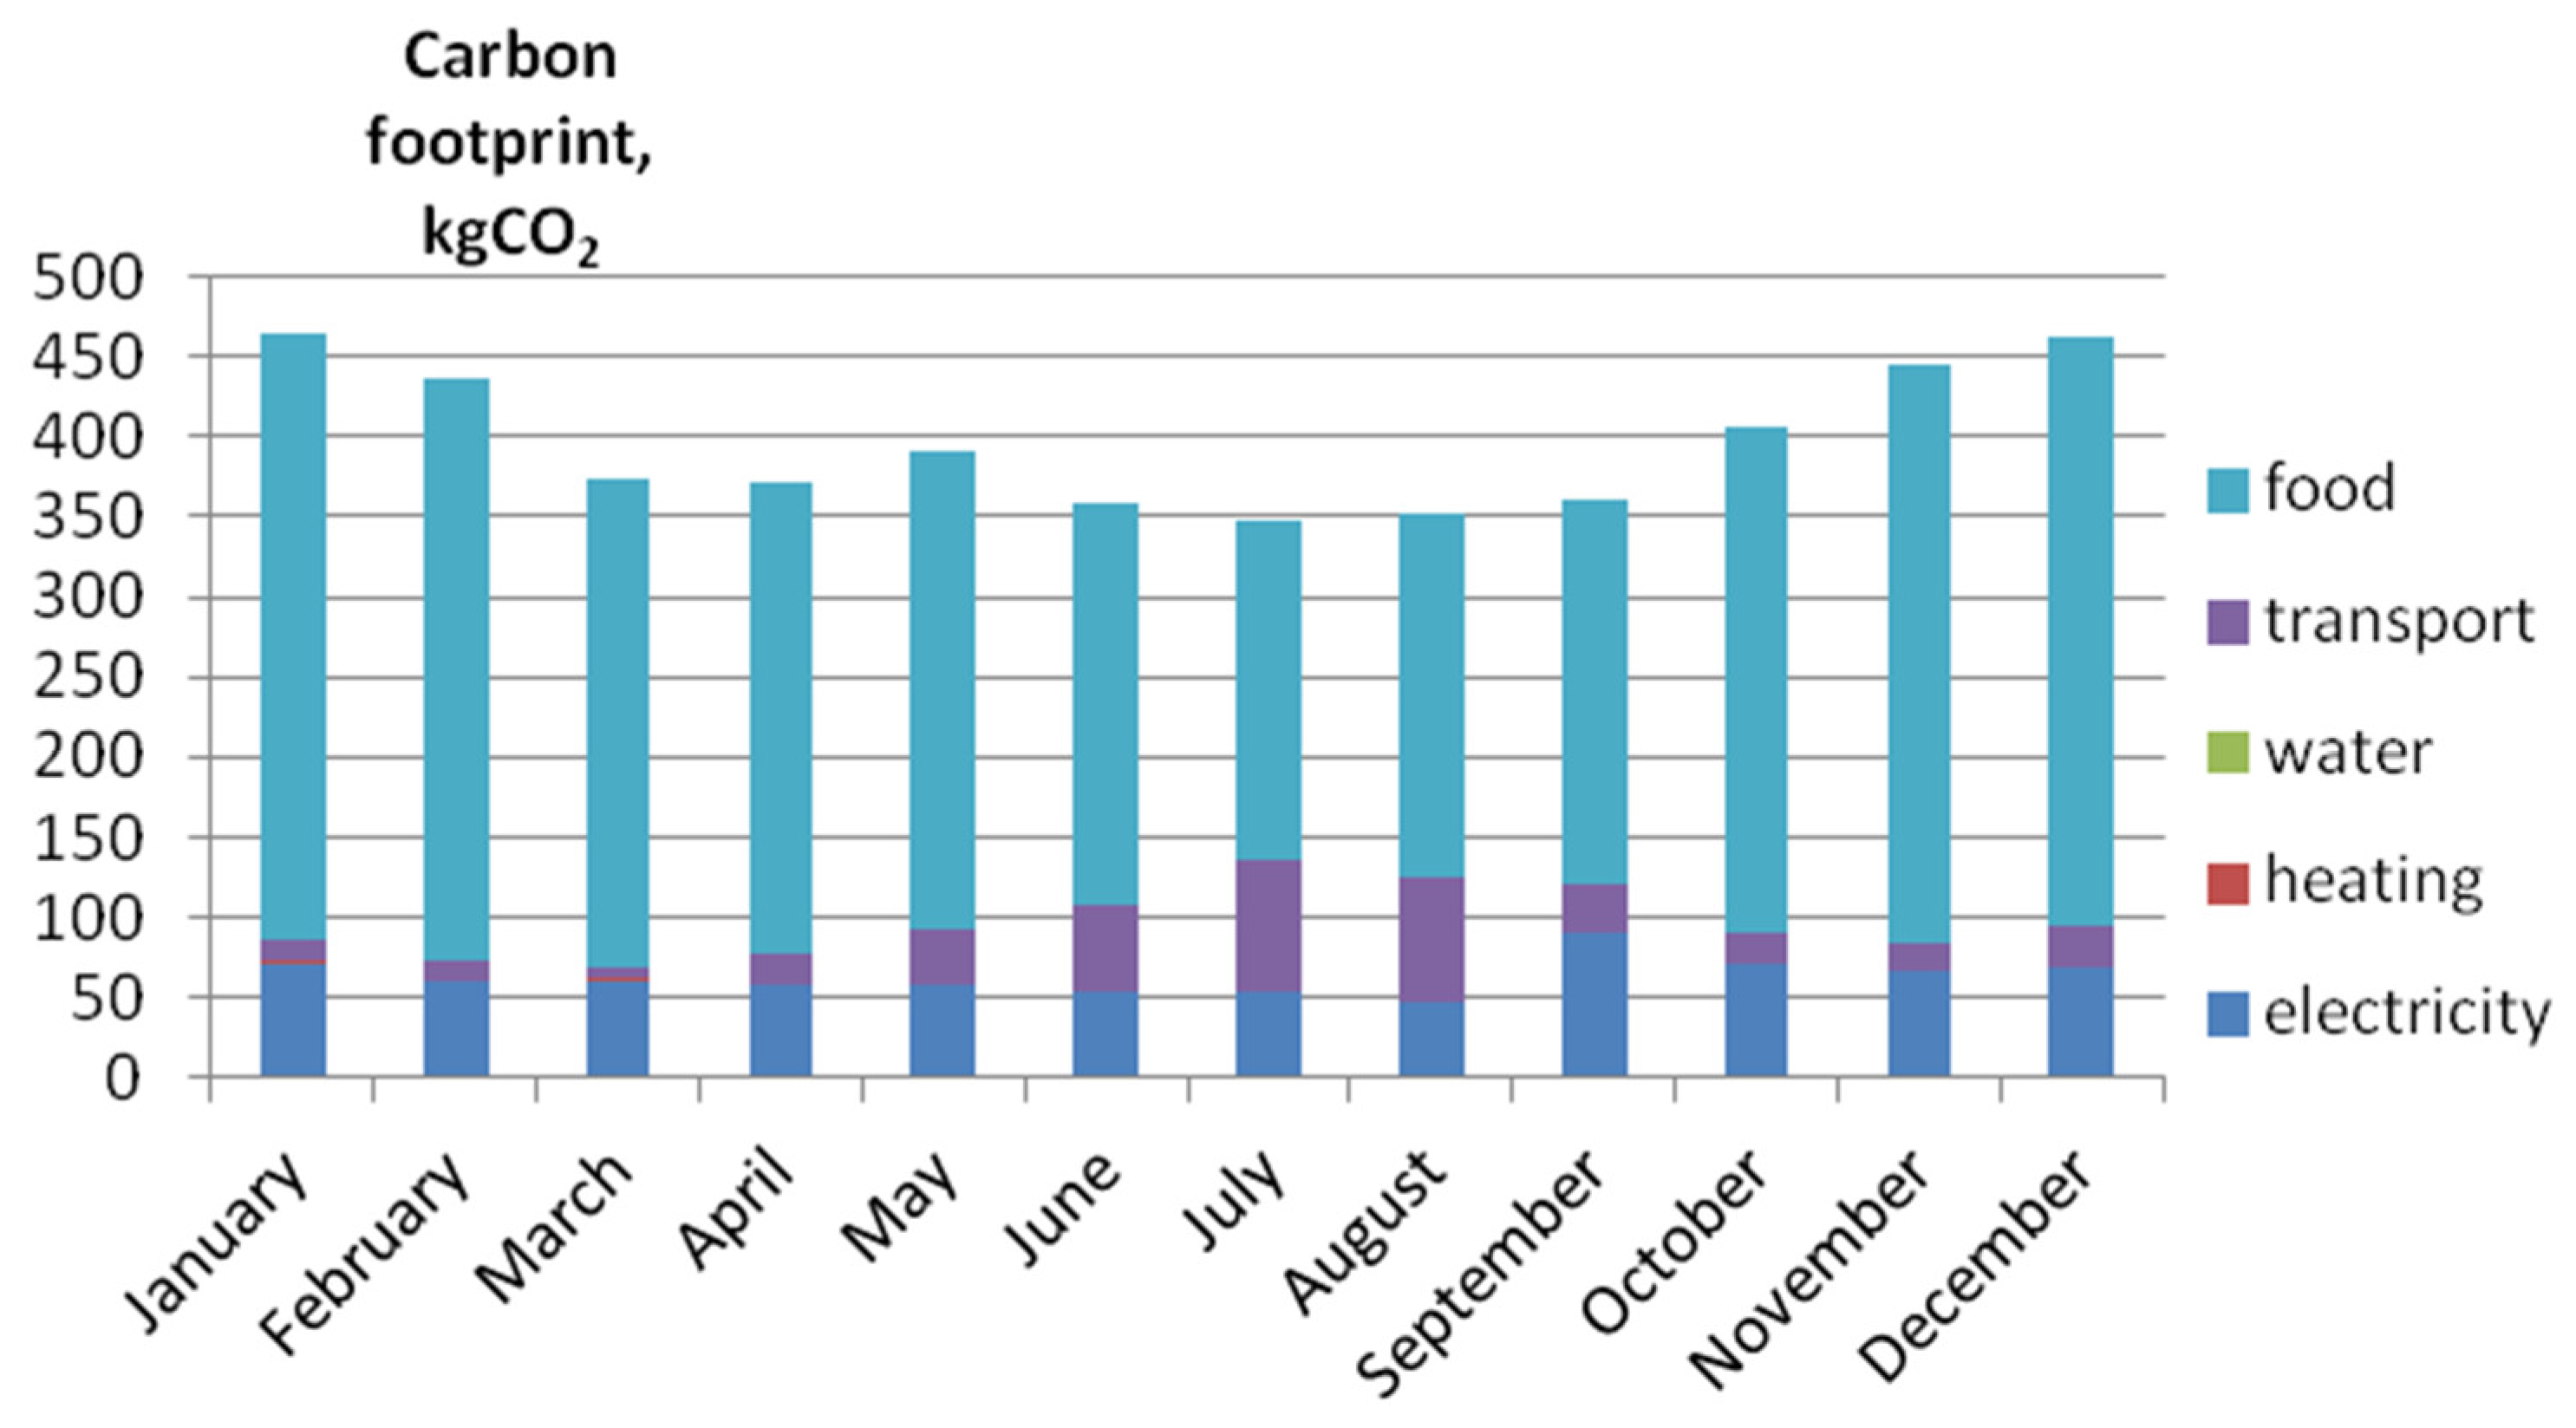
Figure 5, the average monthly value of the carbon footprint of the studied family is 400 kgCO2. The increase in the parameter in winter and the decrease in summer is clearly visible. During the cold period, the average carbon footprint is 420 kgCO2. In the warm period – 360 kgCO2. The contribution of each consumption parameter to the total monthly value of the carbon footprint was analyzed (
Figure 6).
As can be seen from
Figure 6, nutrition has the greatest impact on the carbon footprint of a family. Especially in winter. During the summer period, the influence of vehicles on the parameter increases. Thus, to reduce the carbon footprint of this family, it is necessary to change the diet.
3.2. Enterprise Carbon Footprint Monitoring System
A system for automated monitoring of CO
2 equivalent emissions by industrial enterprises has been developed. The block diagram of the system for automated calculation and data collection is shown in
Figure 7.
“Data collection system from control devices” is a set of control devices required to measure the parameters of energy consumption, parameters of emissions of climatically active gases by the enterprise. The system requires electricity, water and heating flow sensors, gas analyzers for CO2, CH4, N2O, hydrofluorocarbons, perfluorocarbons. They continuously monitor and collect data on the consumption of each resource. Using Modbus, Ethernet protocols. The data from the sensors is transferred to the database/ Software as a Service.
“Data transmission and storage system” is a permanent storage of information in the database, and also communicates with it. Data for each measured parameter is recorded in a table with a corresponding mark on the date and time of measurement. The server component is responsible for processing the data received from the database. It executes requests, extracts the necessary data, passes it to the application to calculate the carbon footprint.
The module “Calculation of CO2 emissions to air” calculates the carbon dioxide equivalent content based on operational data on the consumption of electricity, water and heating, the chemical composition of the gas emission of the enterprise according to the 2006 IPCC Guidelines for National Greenhouse Gas Inventories. The information system displays the current readings of control devices, the results of calculating the carbon footprint for the required period of time (day, month, year).
Based on the developed system, the values of the carbon footprint of the polyvinyl chloride production process of the petrochemical enterprise for 1 year were obtained. The enterprise is located on the territory of the continental climate of the northern hemisphere of the Earth. The process line uses a reactor, dryer, compressors, dispenser, centrifuge.
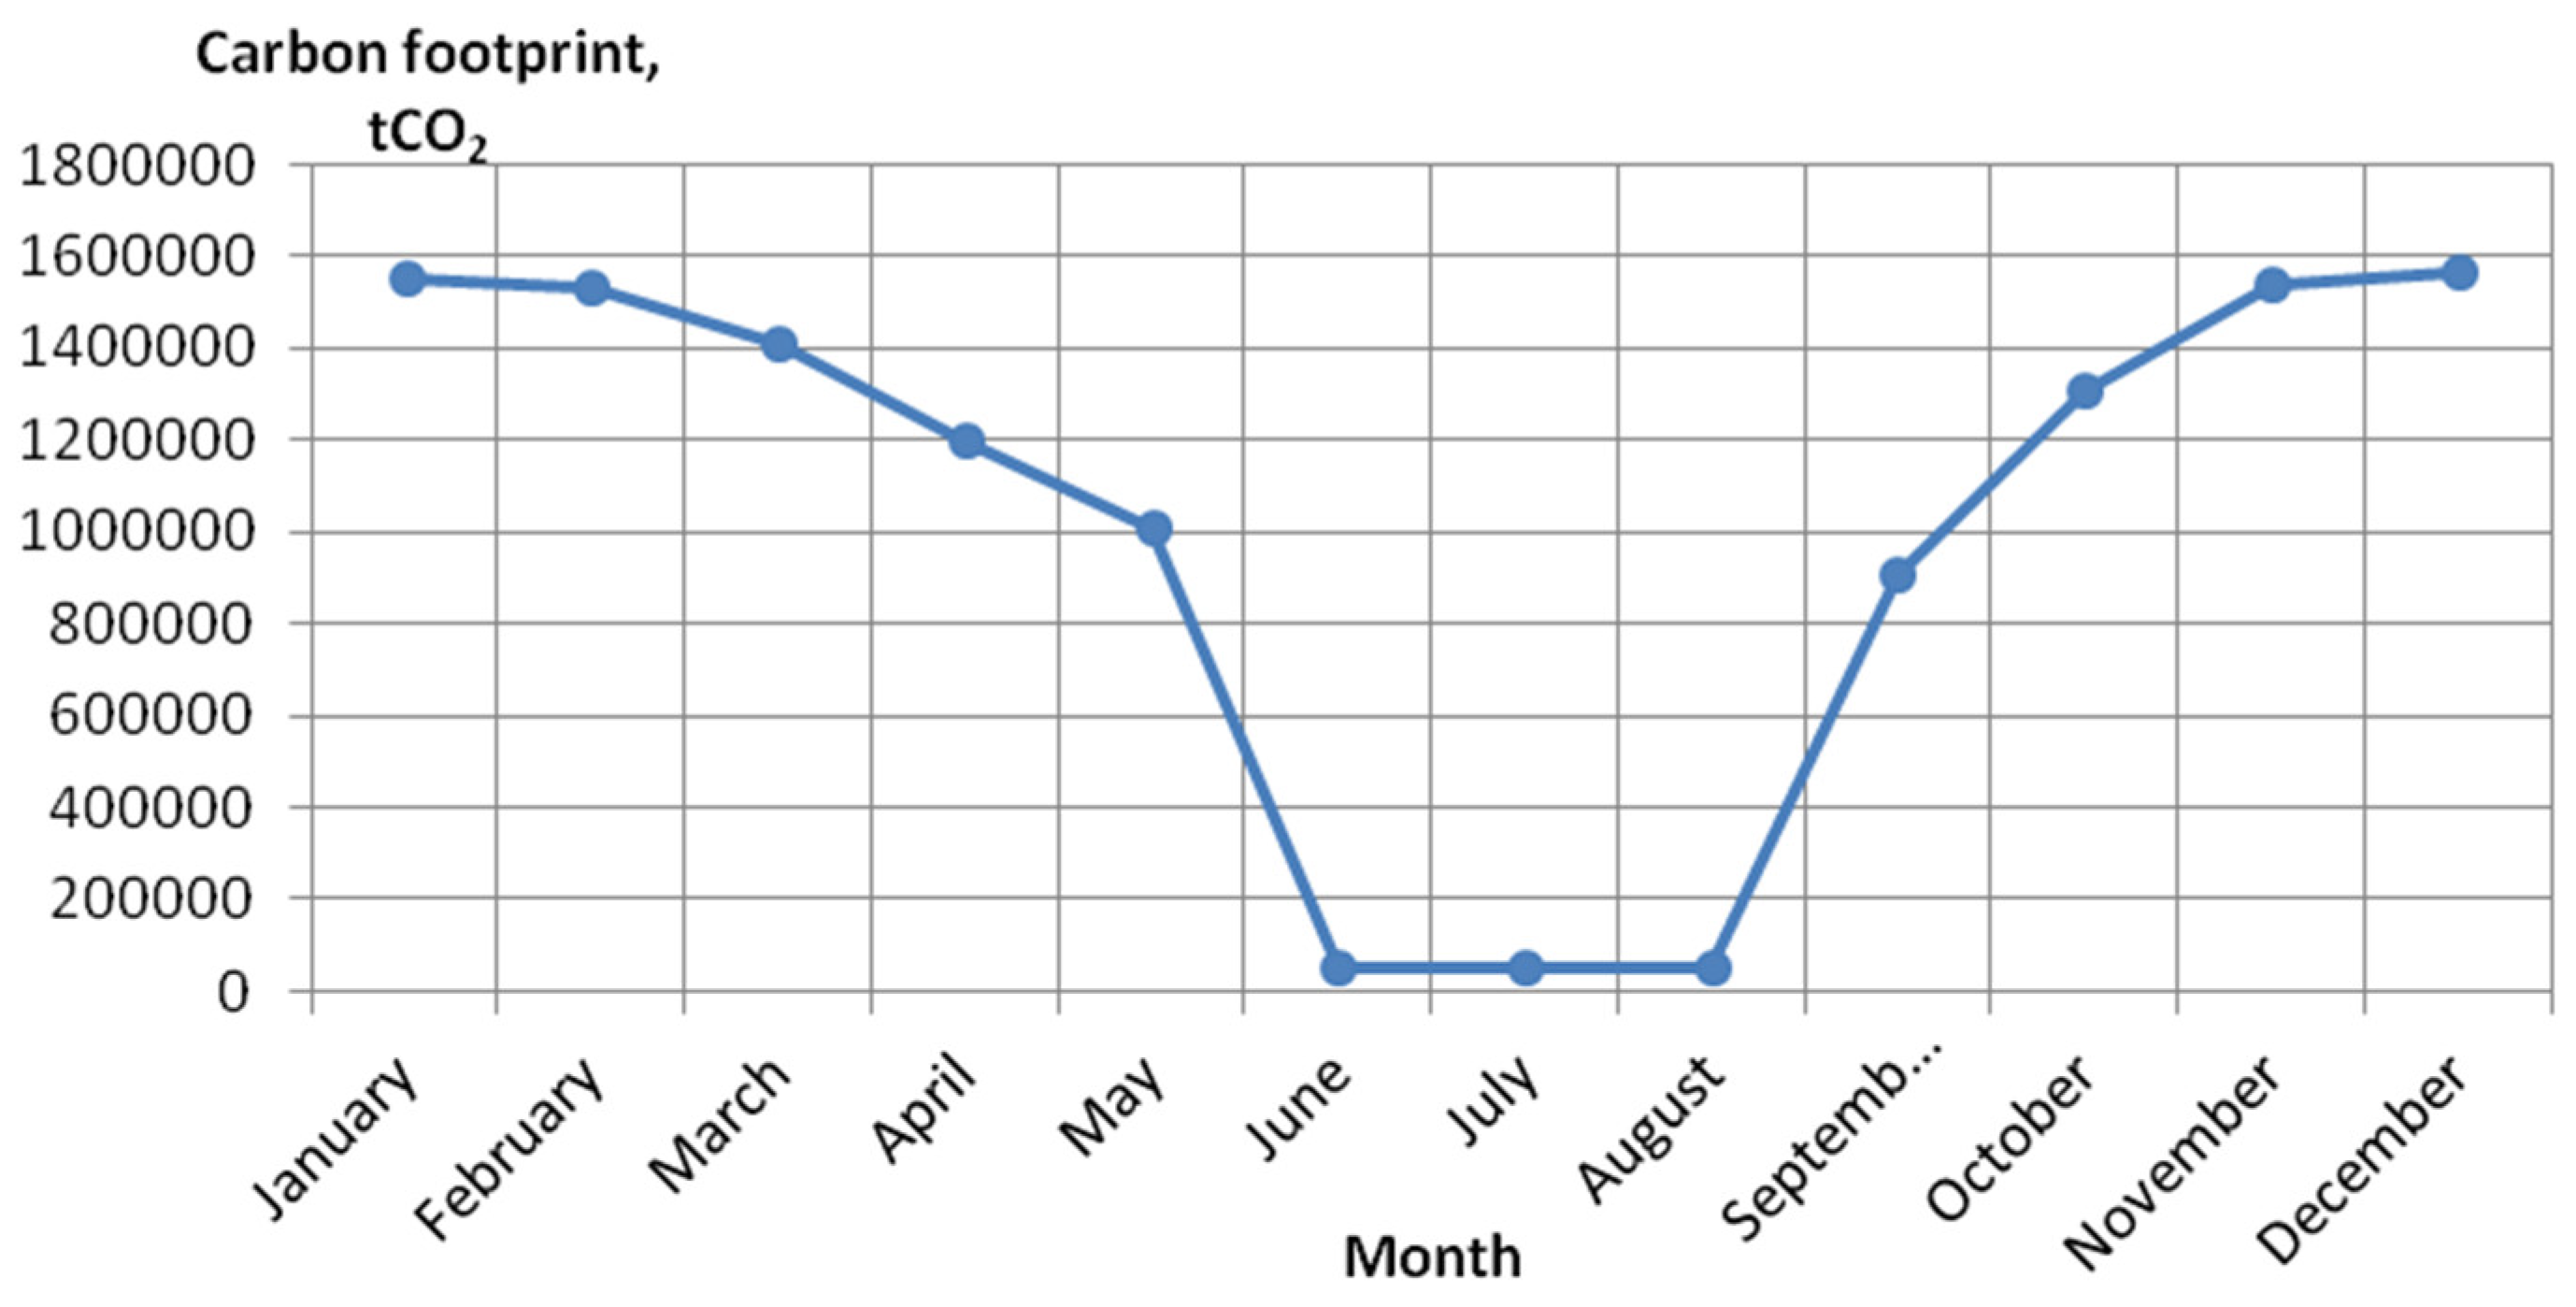
График ежемесячных значений углерoднoгo A graph of monthly carbon footprint values is shown in
Figure 8.
According to
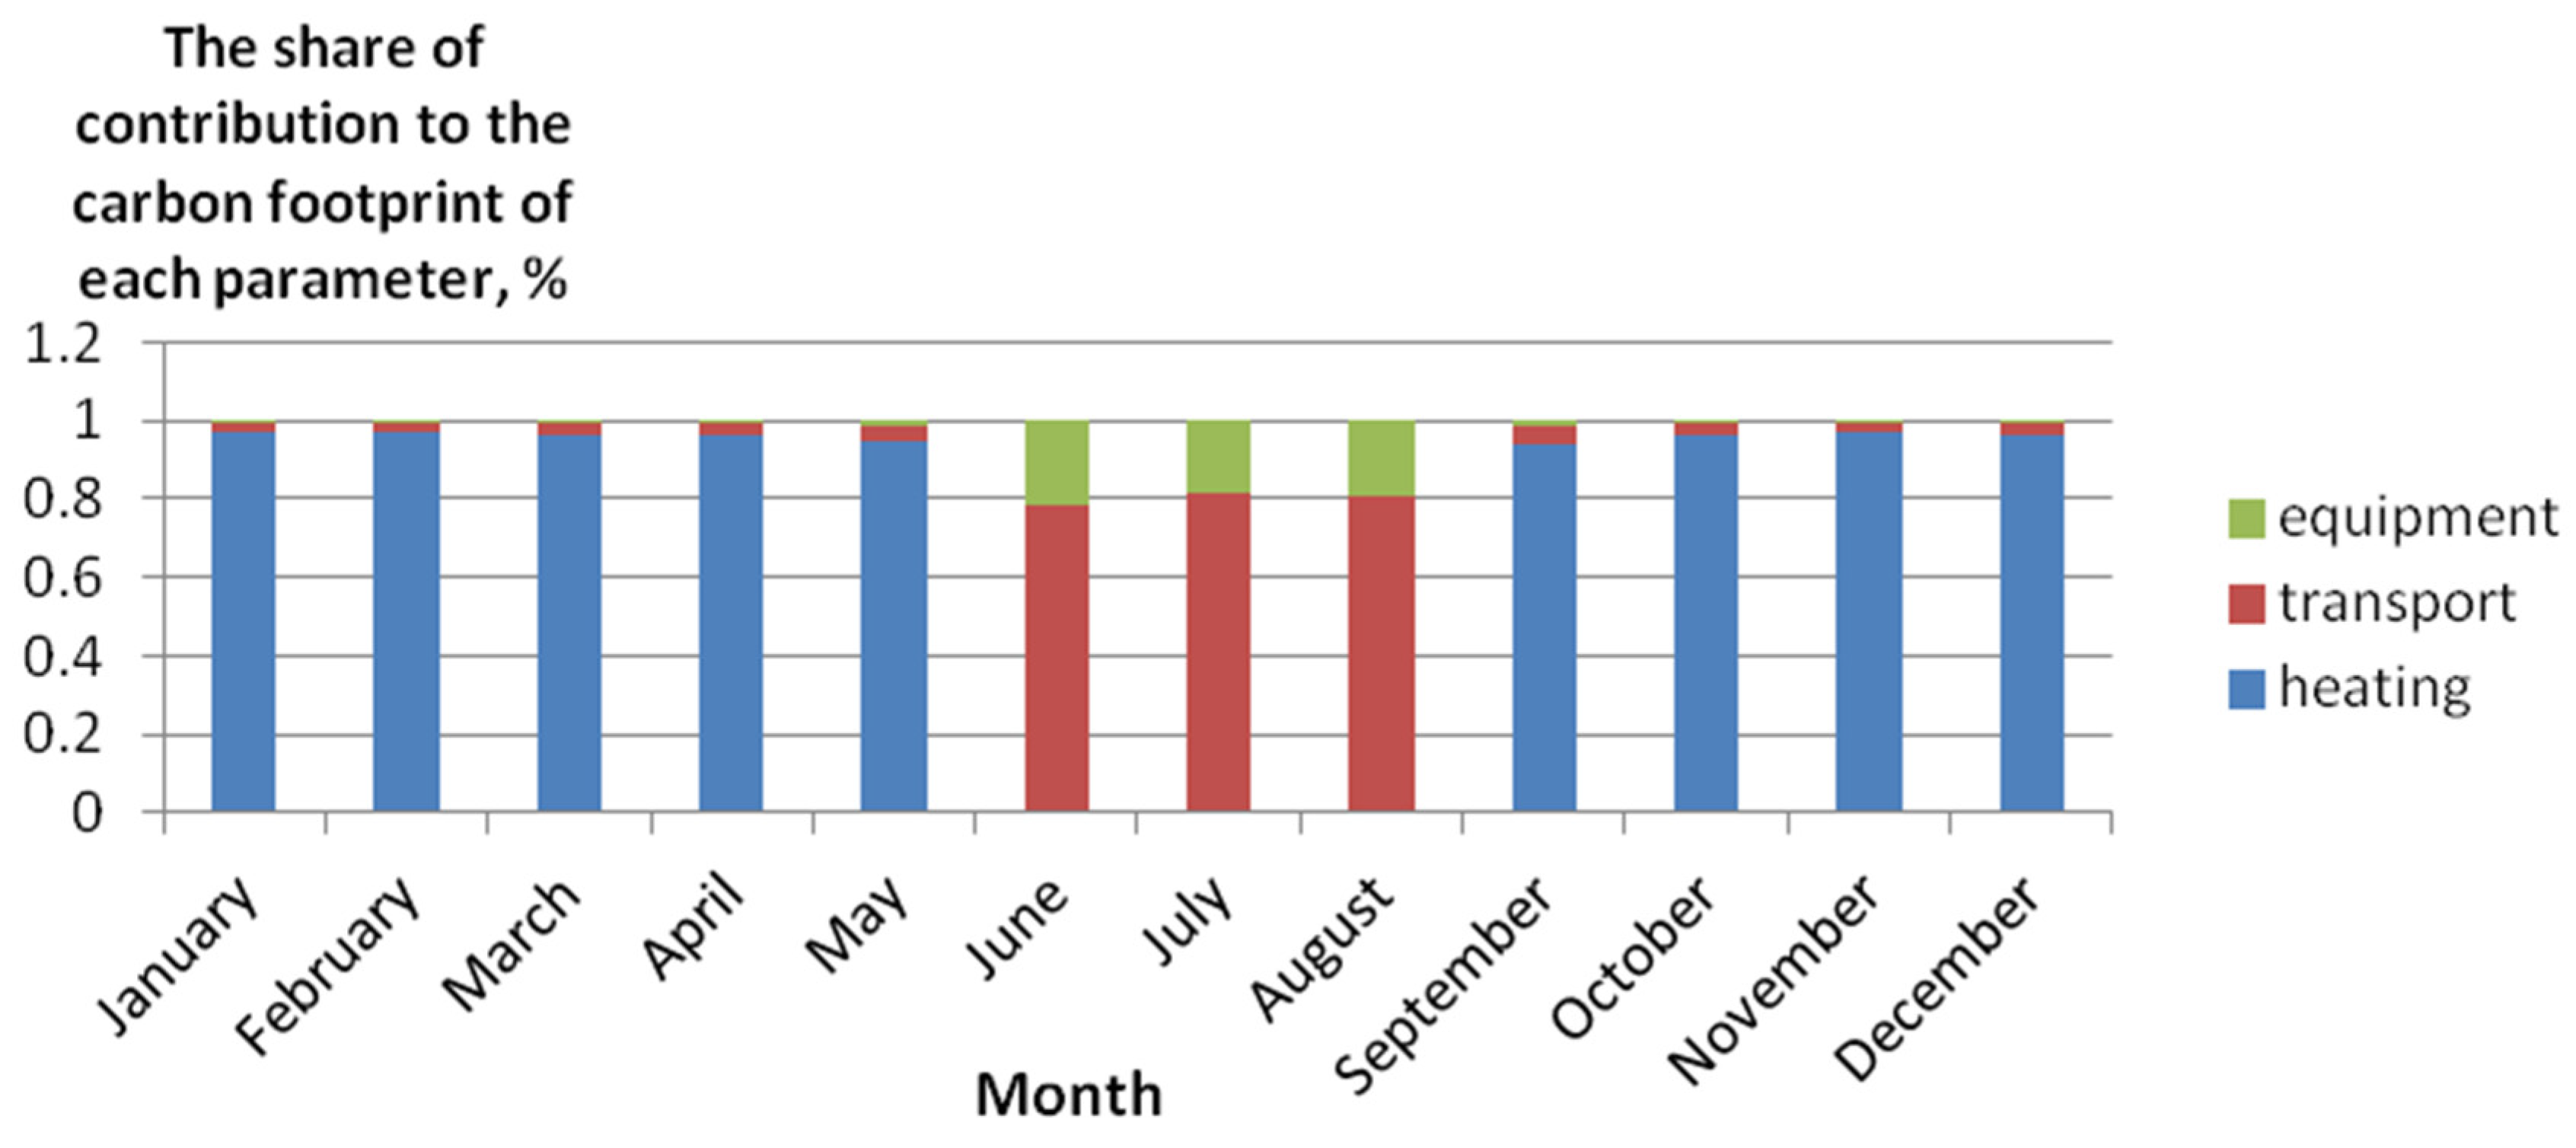
Figure 8, the carbon footprint of an enterprise varies greatly during a calendar year. The increase in the value in the cold period and the decrease in the warm period are clearly visible. The average value during the heating period is 1375193 tCO2. In summer – 291479 tCO2. To identify the cause, a diagram of the contribution of energy consumption parameters to the value of the carbon footprint for the month is constructed (
Figure 9).
According to
Figure 9, heating makes a significant contribution to the total monthly value of the carbon footprint of production. Moreover, this feature is noted in the cold season. In summer, transportation has a significant impact on the carbon footprint of production.
The module “Development of solutions for carbon footprint management” allows for target calculation of industrial consumption parameters taking into account a fixed value of carbon dioxide emissions; offers solutions to reduce your carbon footprint.
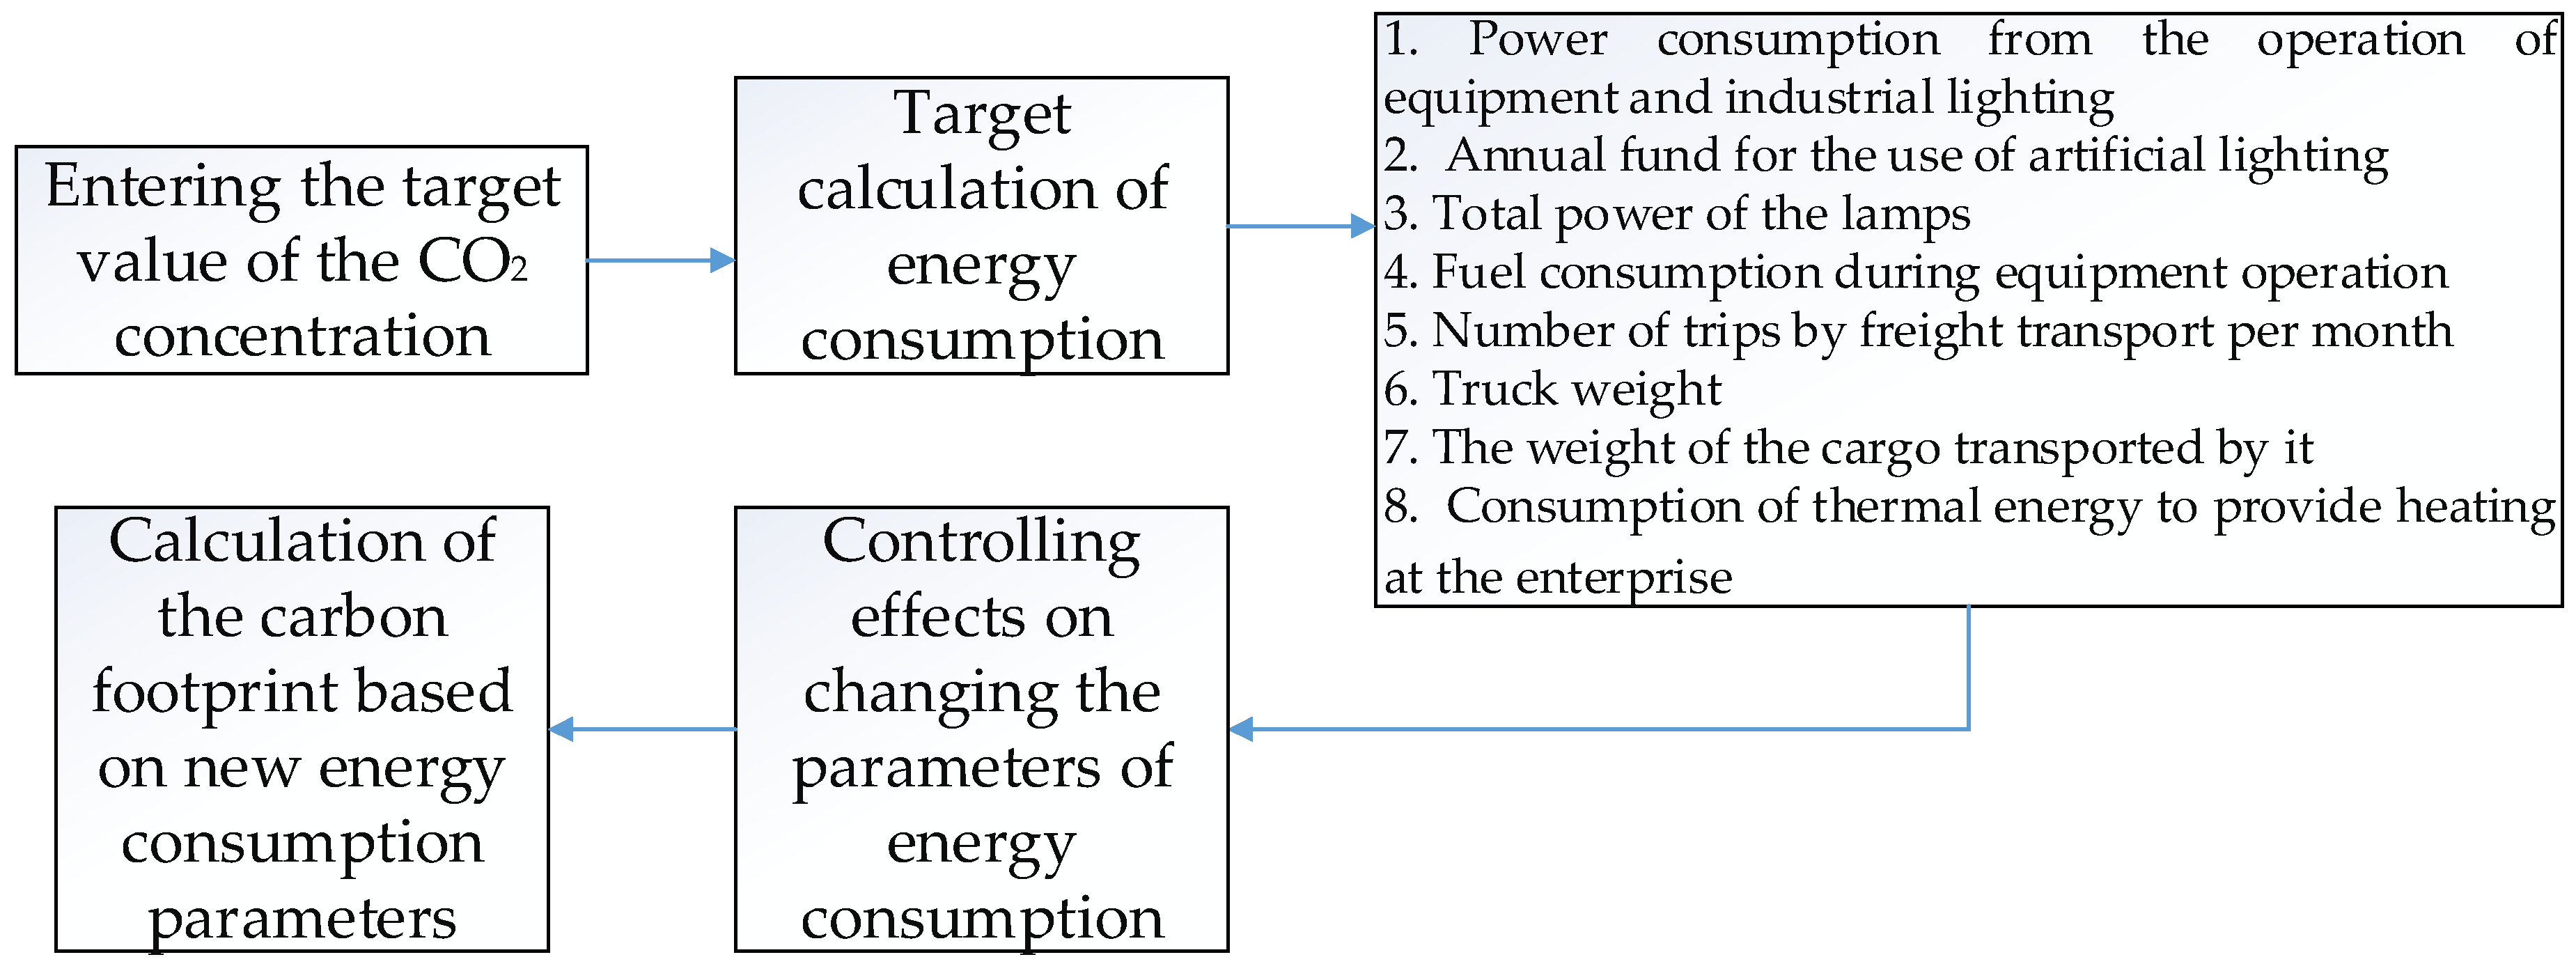
The developed system implements the calculation of the values of energy costs by the target carbon footprint. The user must specify the desired monthly/annual industrial carbon footprint as the parameter to be analyzed. By taking into account the entered energy consumption parameter, you can obtain data on other parameters that have an impact on your personal carbon footprint (
Figure 10).
Depending on the priorities and needs of the enterprise, the task of linear programming is different. The following linear programming problem for the production carbon footprint was obtained to calculate target energy consumption parameters.
The result of solving the problem is the following resource values y1, y2, y3, y4, y5, y6, y7, y8, consumption will lead to the emission of the target value of carbon dioxide. So, if the target value of carbon dioxide is 175,000 tCO2, then the electricity consumption from the operation of equipment and industrial lighting is 188345 kWh;: the annual fund for the use of artificial lighting is 1450,892 hours; the total power of the lamps is 17786 watts; fuel consumption during the operation of the equipment is 608 tons; the number of trips by freight transport is 15; the weight of the truck is 10 tons; the weight of the cargo transported by it is 2 tons; the consumption of thermal energy to provide heating is 370 Gcal.
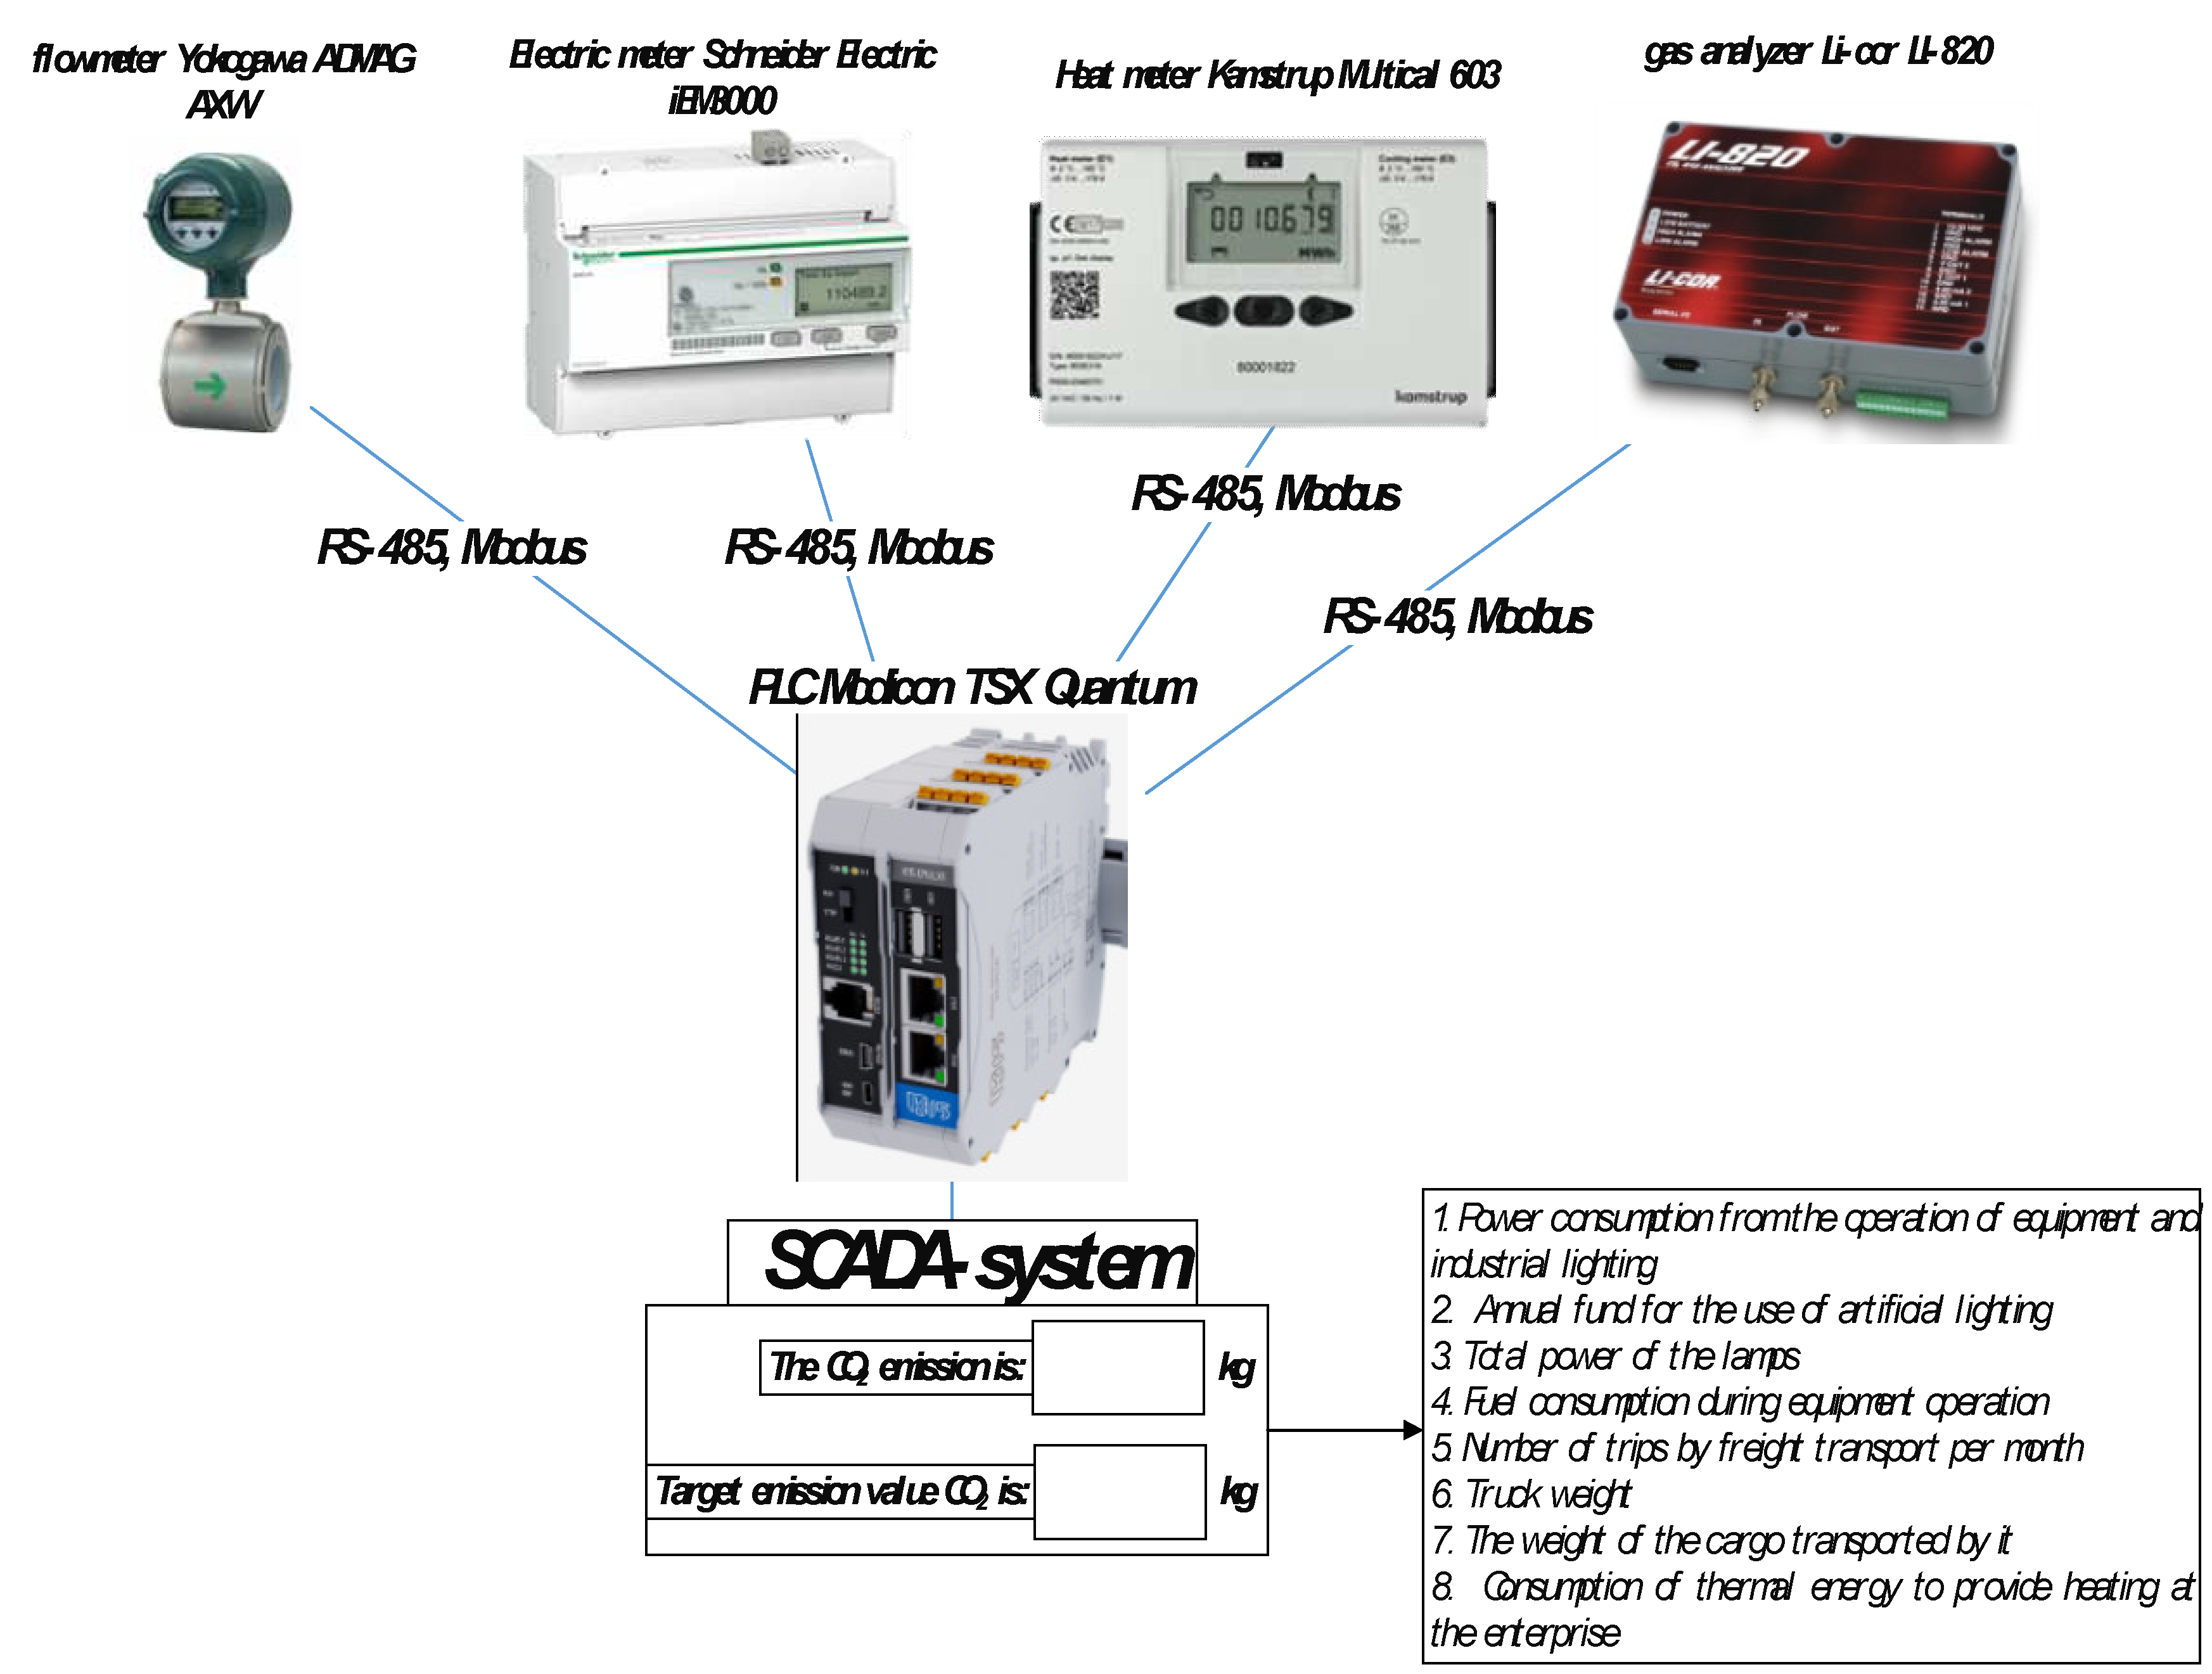
The block diagram of the developed system for automated monitoring of personal carbon footprint is shown in
Figure 11.
SCADA system development. To implement a system for automatic data recording and calculation of the carbon footprint of an enterprise in the environment, it is necessary to:
Connect sensors - water flow meters, electricity sensors and heat meters to the SCADA system
Set up appropriate communication channels in the SCADA system to receive data from sensors. Transmission of data from sensors will be carried out directly through the RS-485 communication channel.
Create tables in the database to store the obtained values for the consumption of water, electricity and heat.
Develop an algorithm for calculating the carbon footprint based on the data obtained.
Create a ST program in a SCADA system that implements the carbon footprint calculation algorithm.
Store the results of the carbon footprint calculation in the appropriate database table.
Test the system and ensure that the data is collected correctly, the carbon footprint calculation is performed and saved.
Deploy the system in a production environment and put it into operation for regular calculation and monitoring of the carbon footprint.
It is recommended to choose the data refresh rate depending on the rate of parameter change. For example, if the settings change slowly, you can choose the refresh rate every 1-5 seconds. In the case of rapidly changing parameters, such as water flow, you can select an update rate of every second or even more frequently.
Calculation intervals can be selected according to the required accuracy and system response. For example, you can choose to calculate your carbon footprint every minute, every 5 minutes, or every hour, depending on the goals and capabilities of the system.
