Submitted:
04 December 2023
Posted:
05 December 2023
You are already at the latest version
Abstract
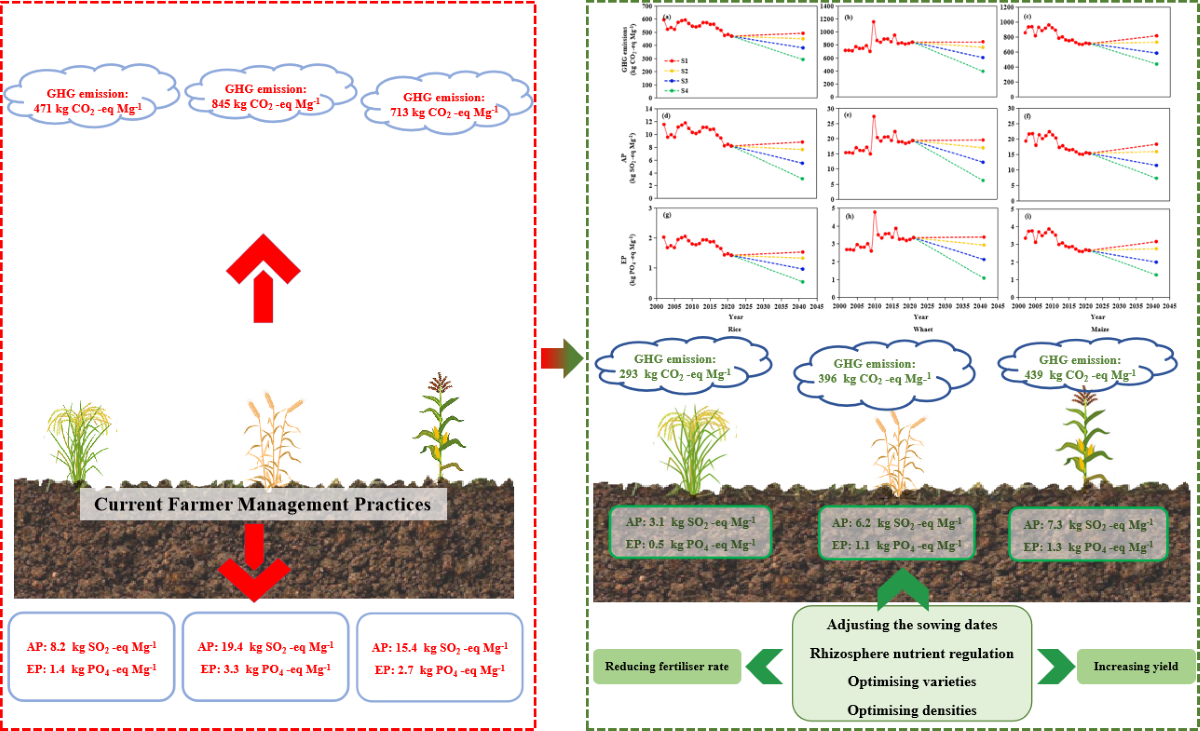
Keywords:
1. Introduction
2. Materials and Methods
2.1. Study Area
2.2. Data Collection
2.3. Statistical Analysis
2.4. Functional Units and System Boundary
2.5. Impact Assessment
2.6. Estimation of Greenhouse Gas Emissions, Acidification Potential and Eutrophication Potential
- (1)
- GHG emissions
- (2)
- Acidification Potential (AP)
- (3)
- Eutrophication Potential (EP)
2.7. Emission-Mitigation Scenarios for Greenhouse Gas Emissions, Acidification Potential and eutrophication Potential
3. Results
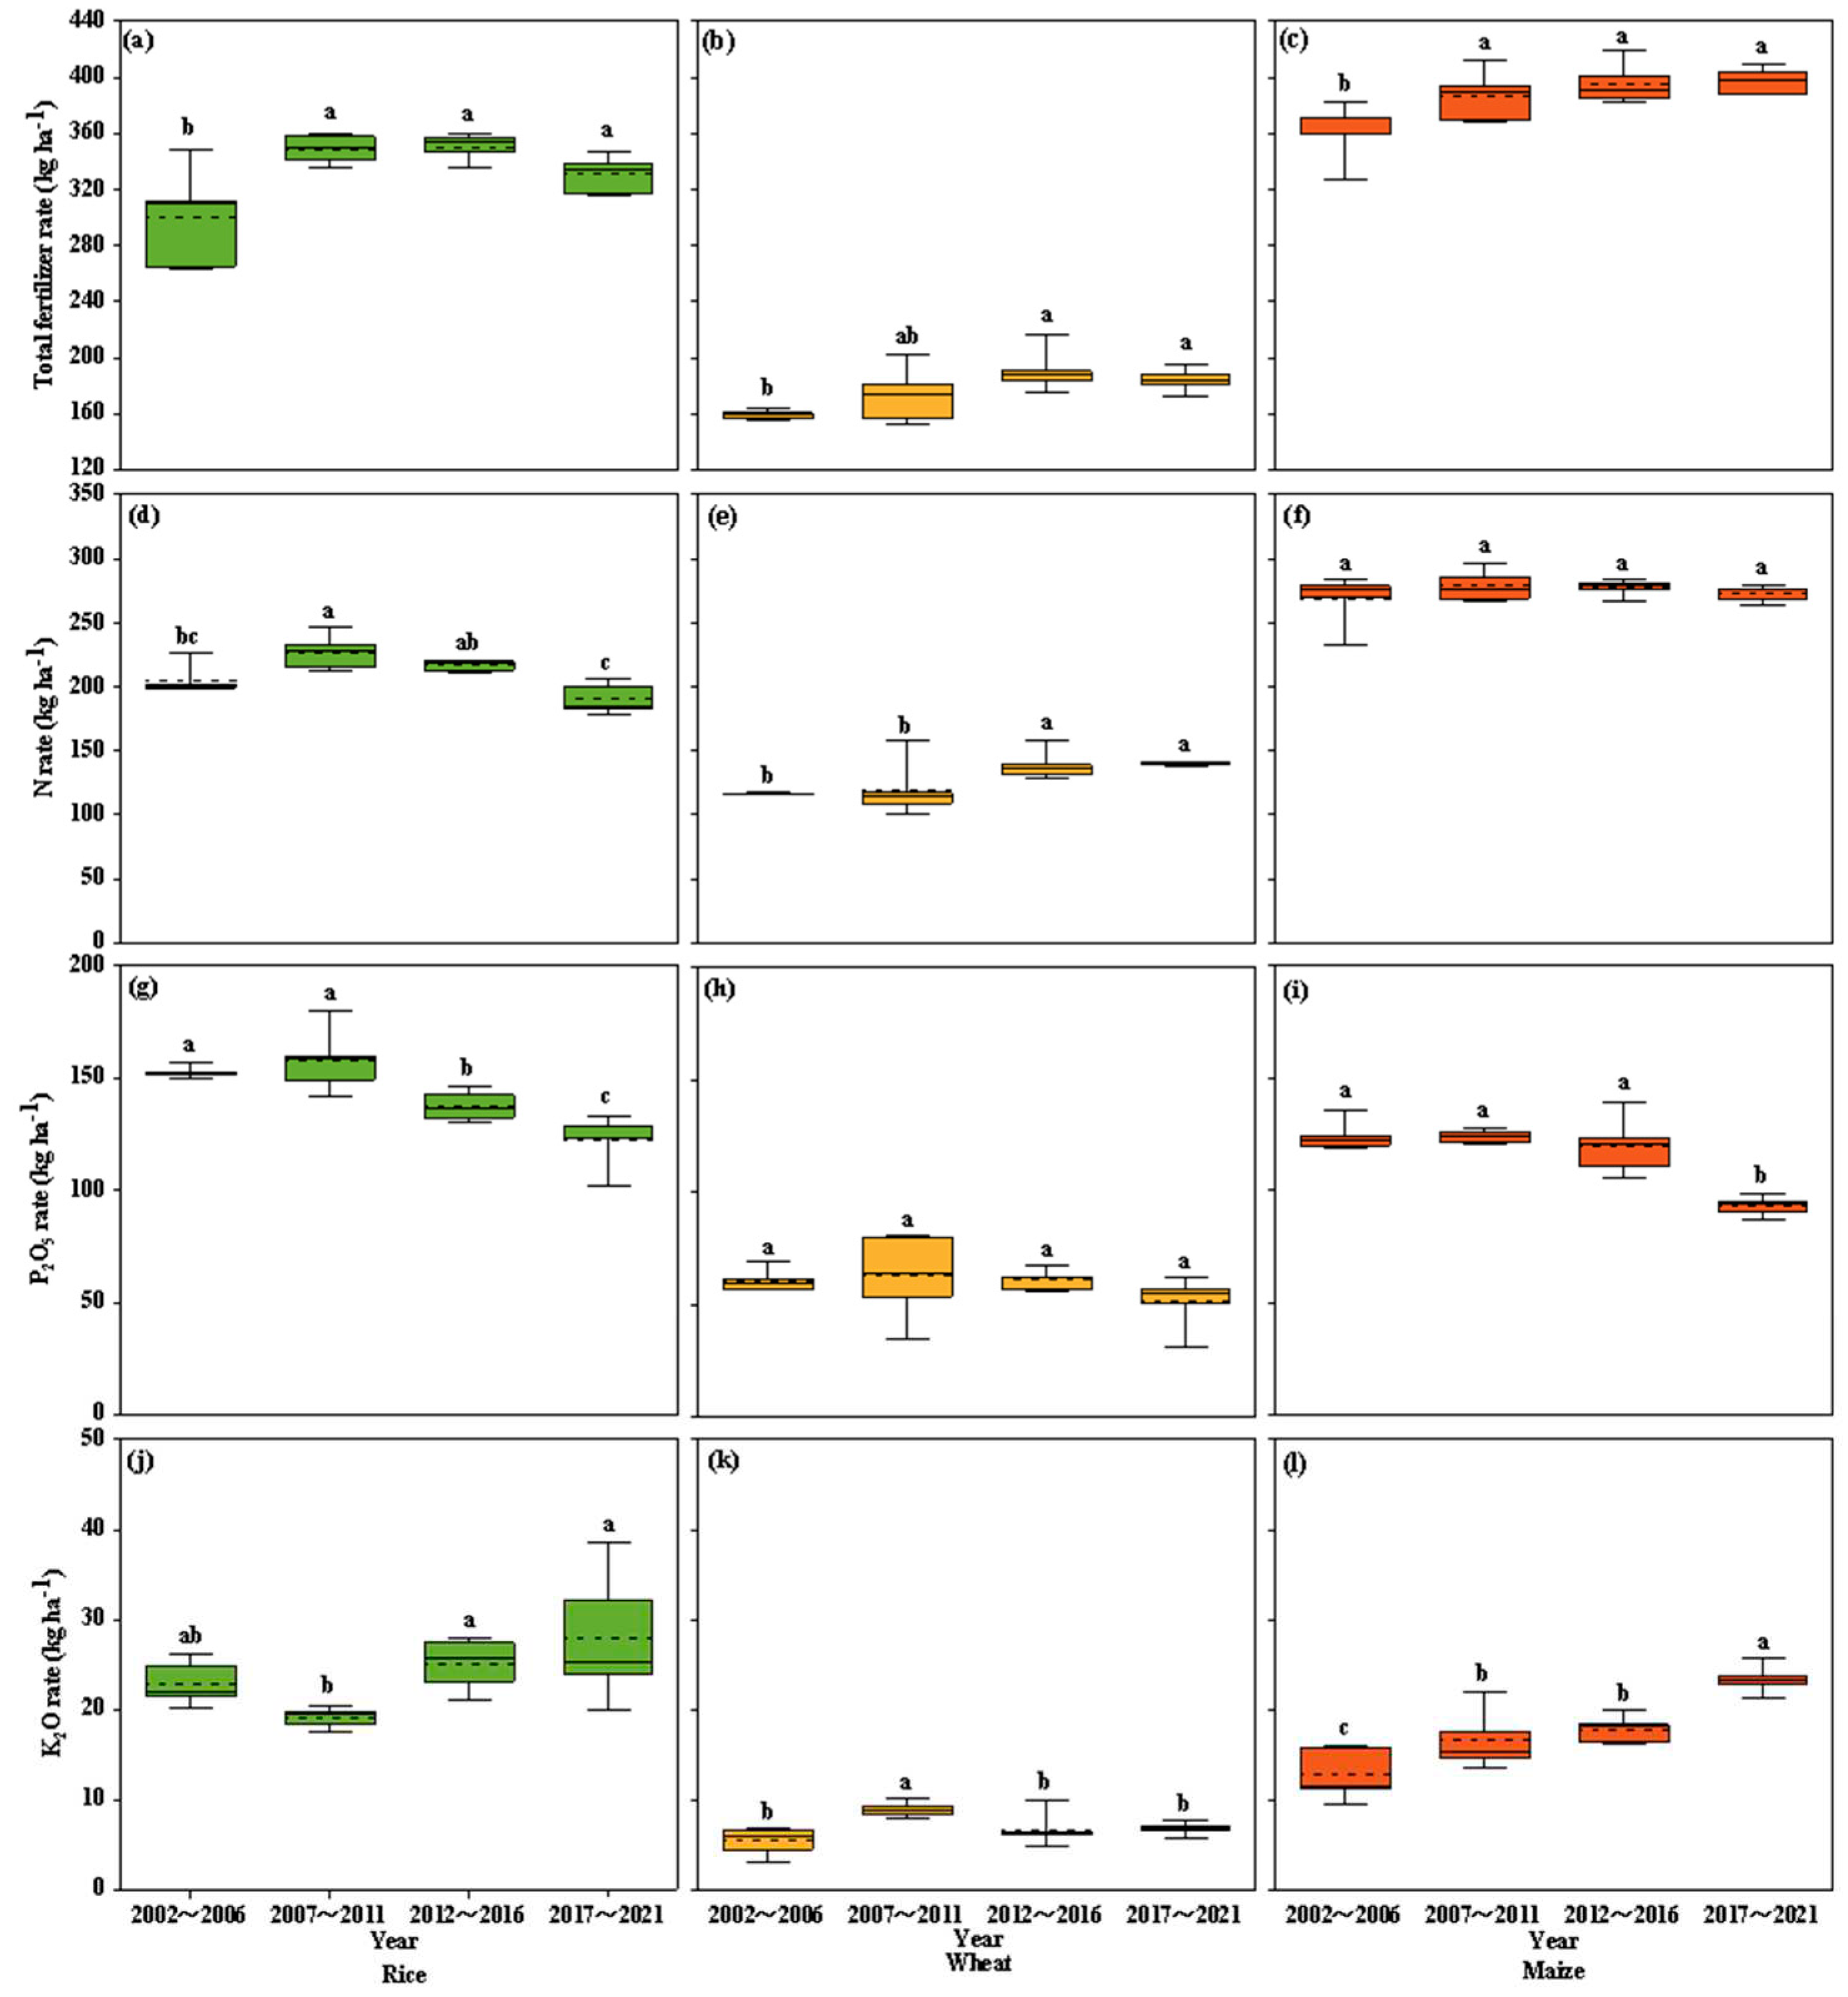
3.1. Crop Yield, Nutrient Input, and PFP–N
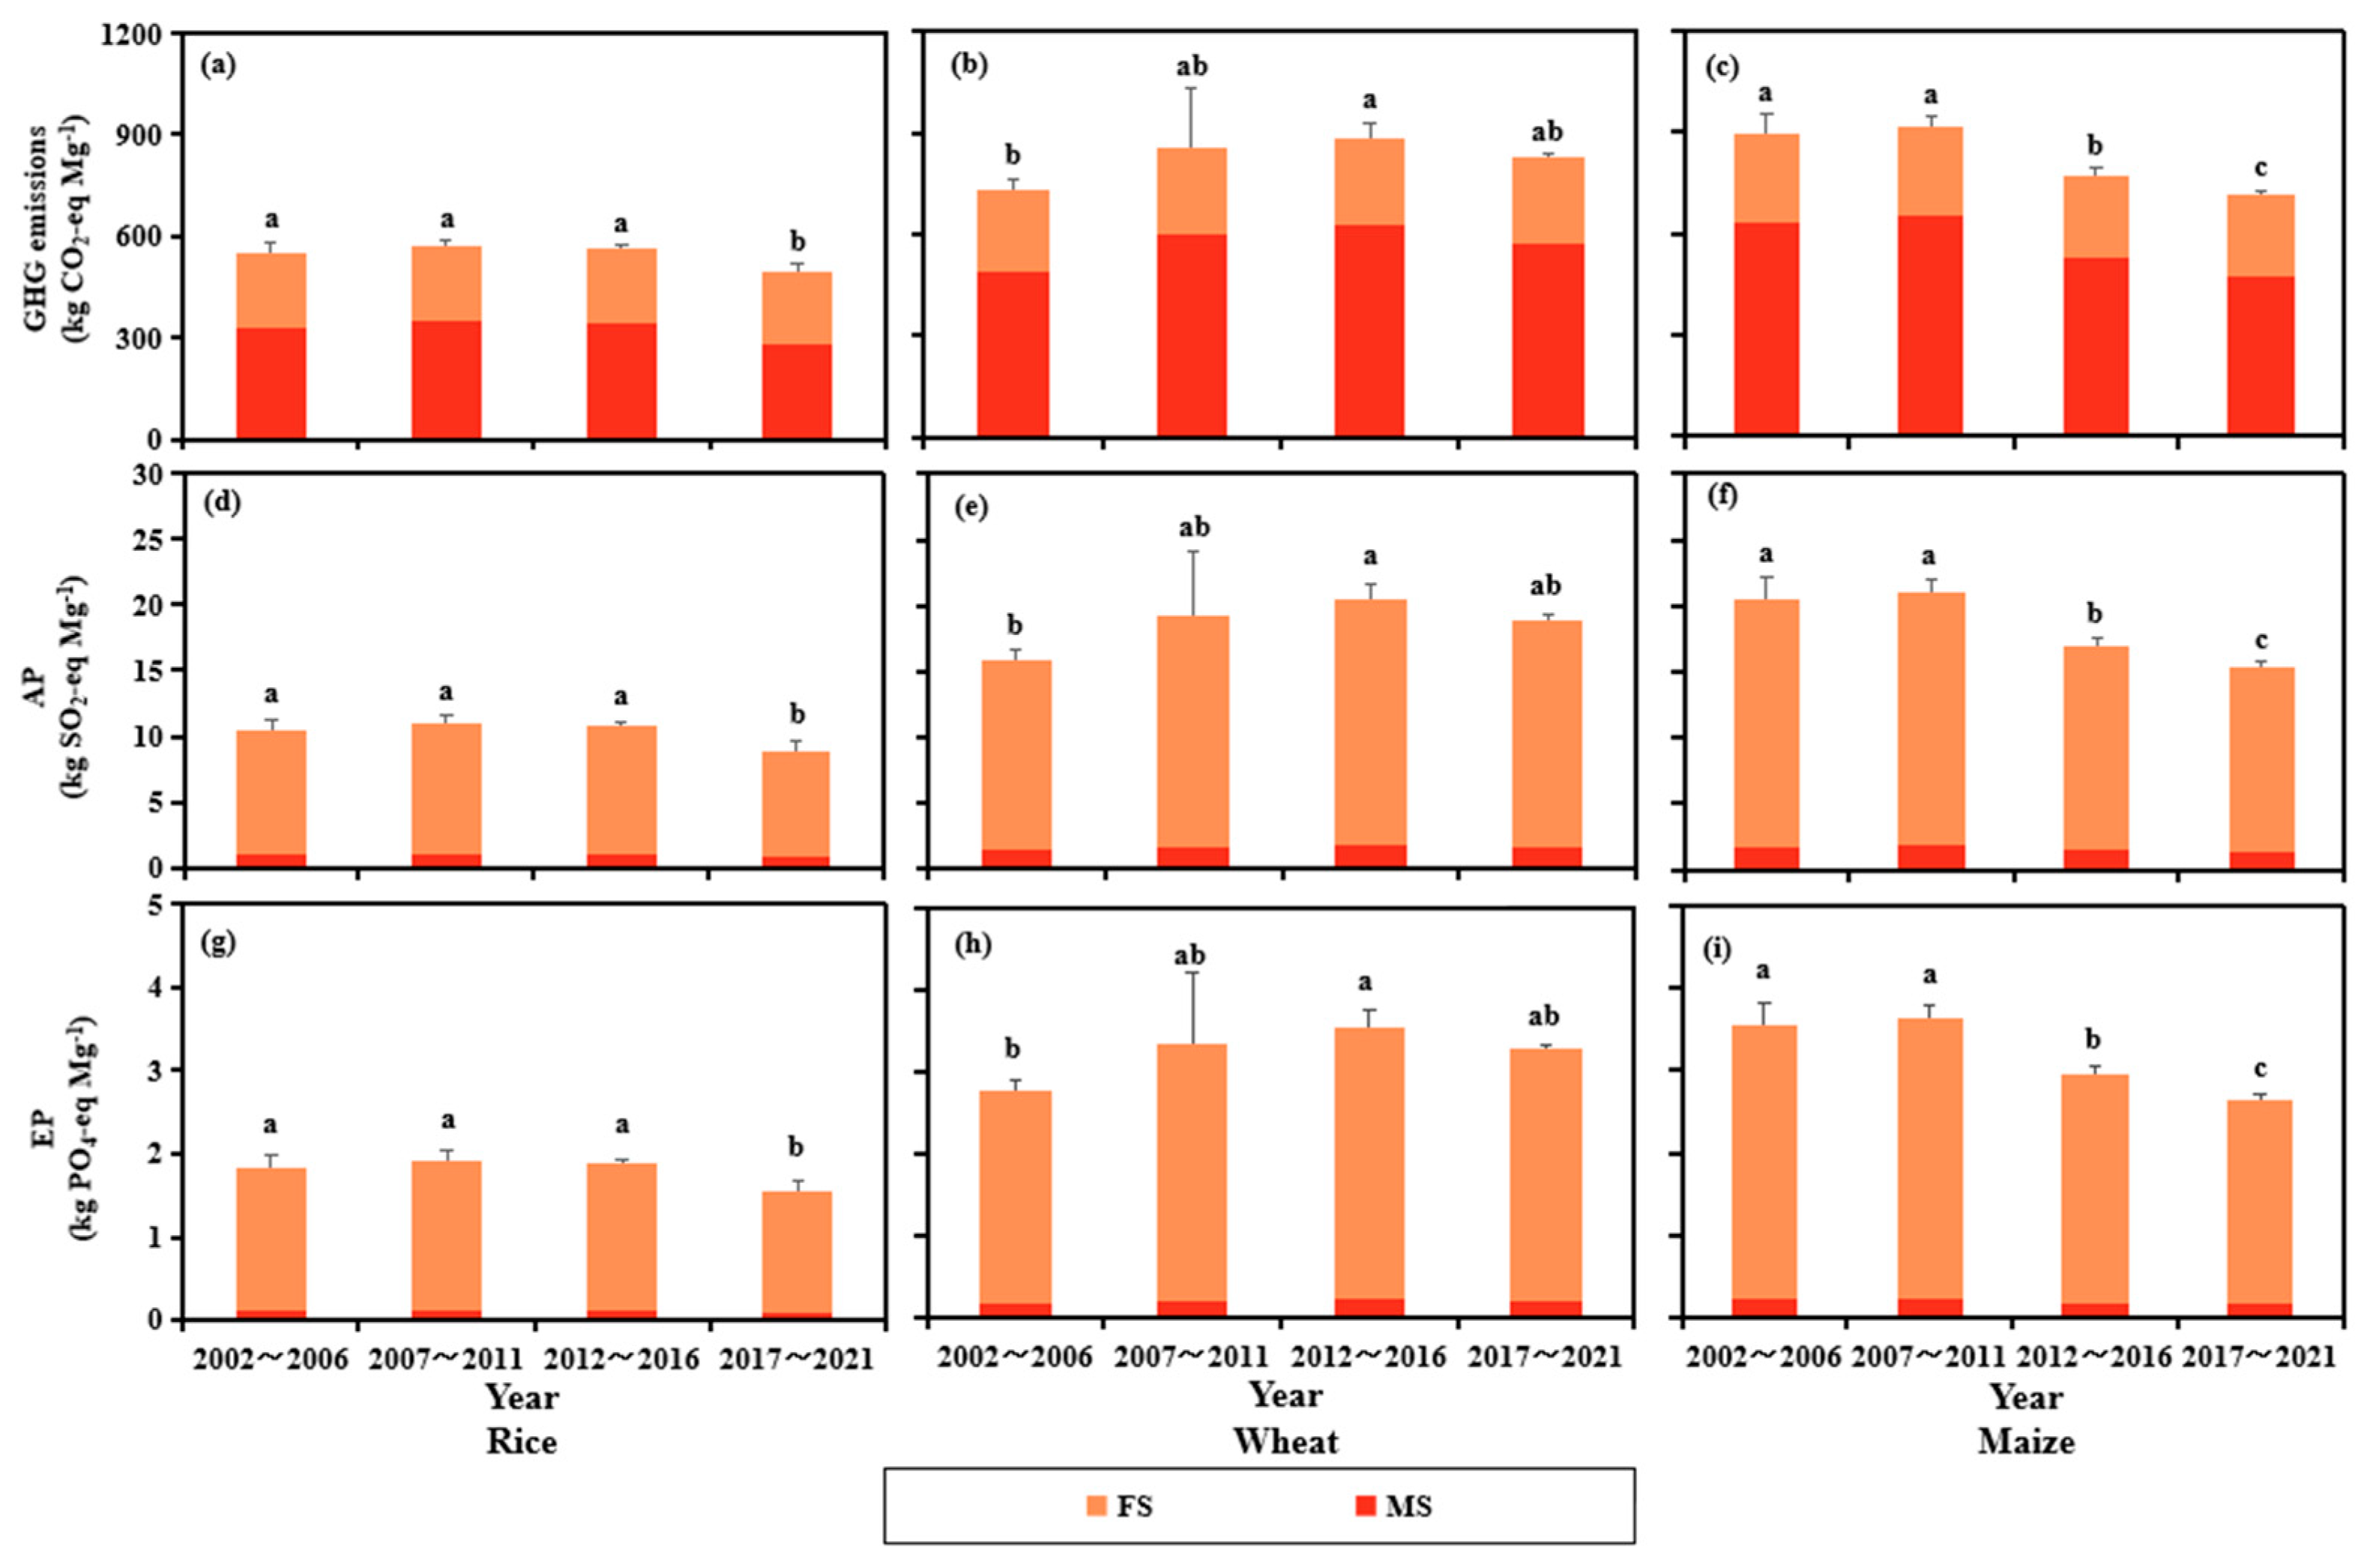
3.2. Greenhouse Gas Emissions, Acidification potential and Eutrophication Potential
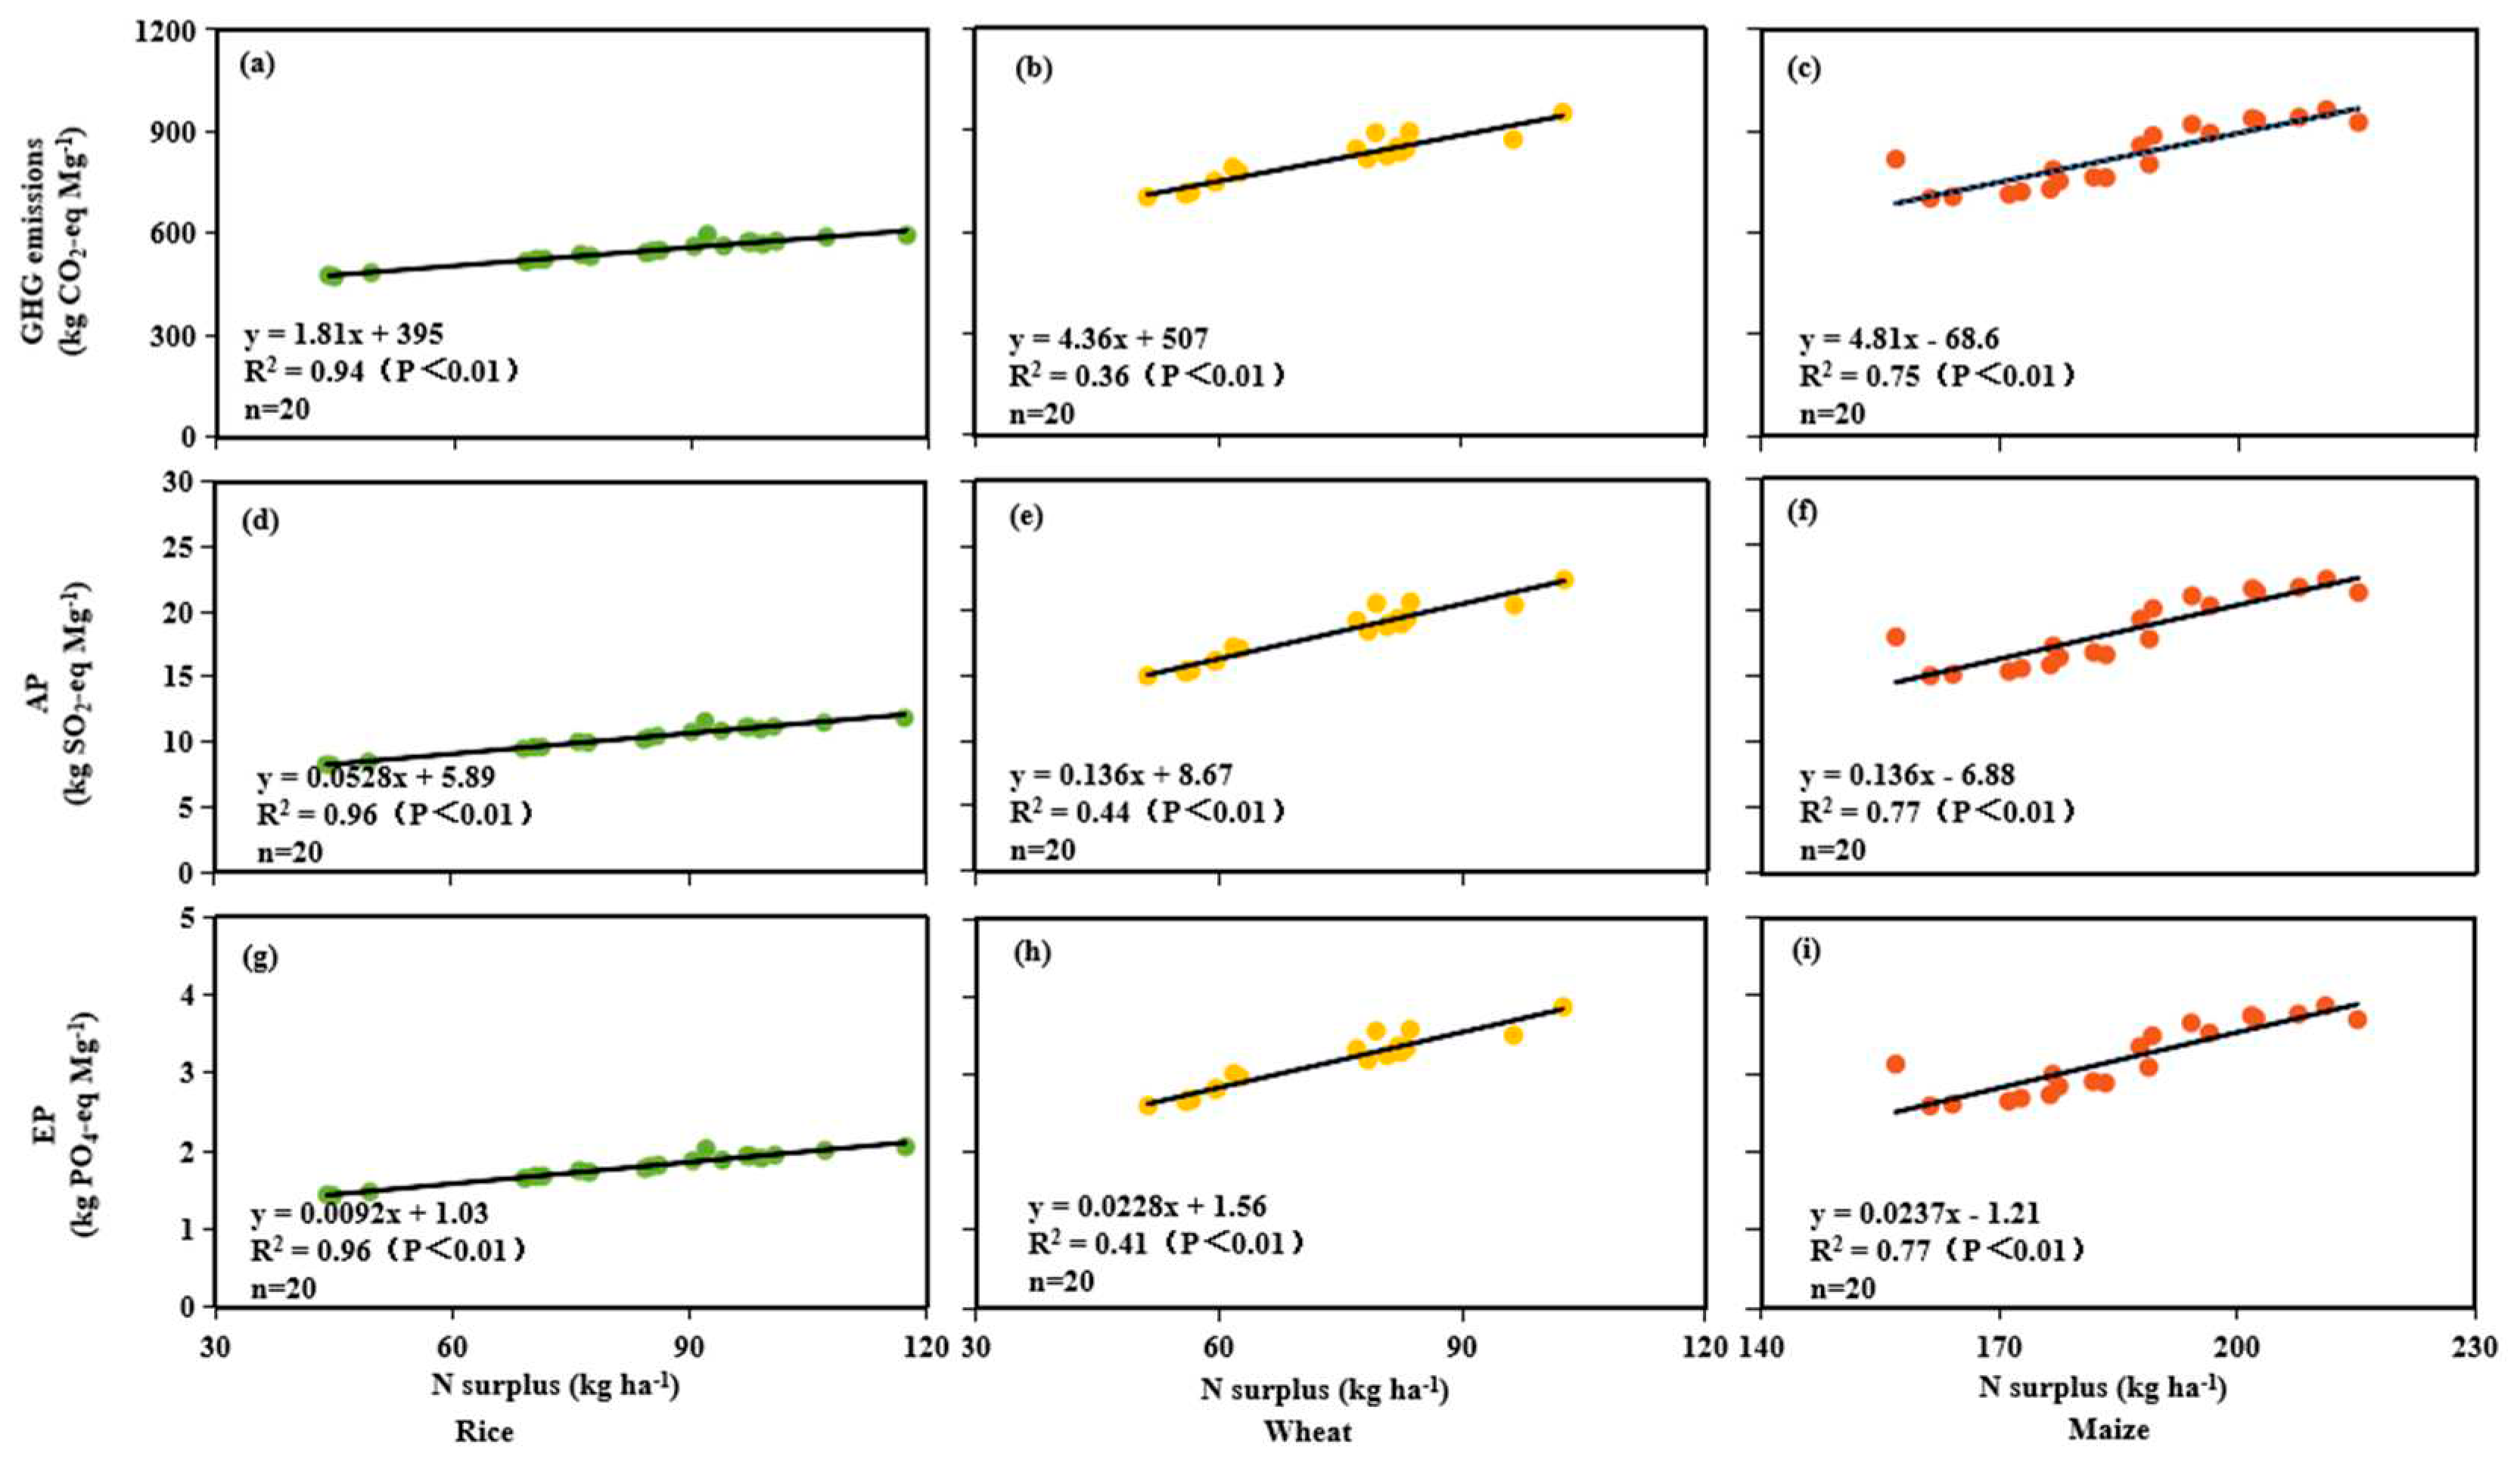
3.3. Correlations between Environmental Impacts and Influencing Factors
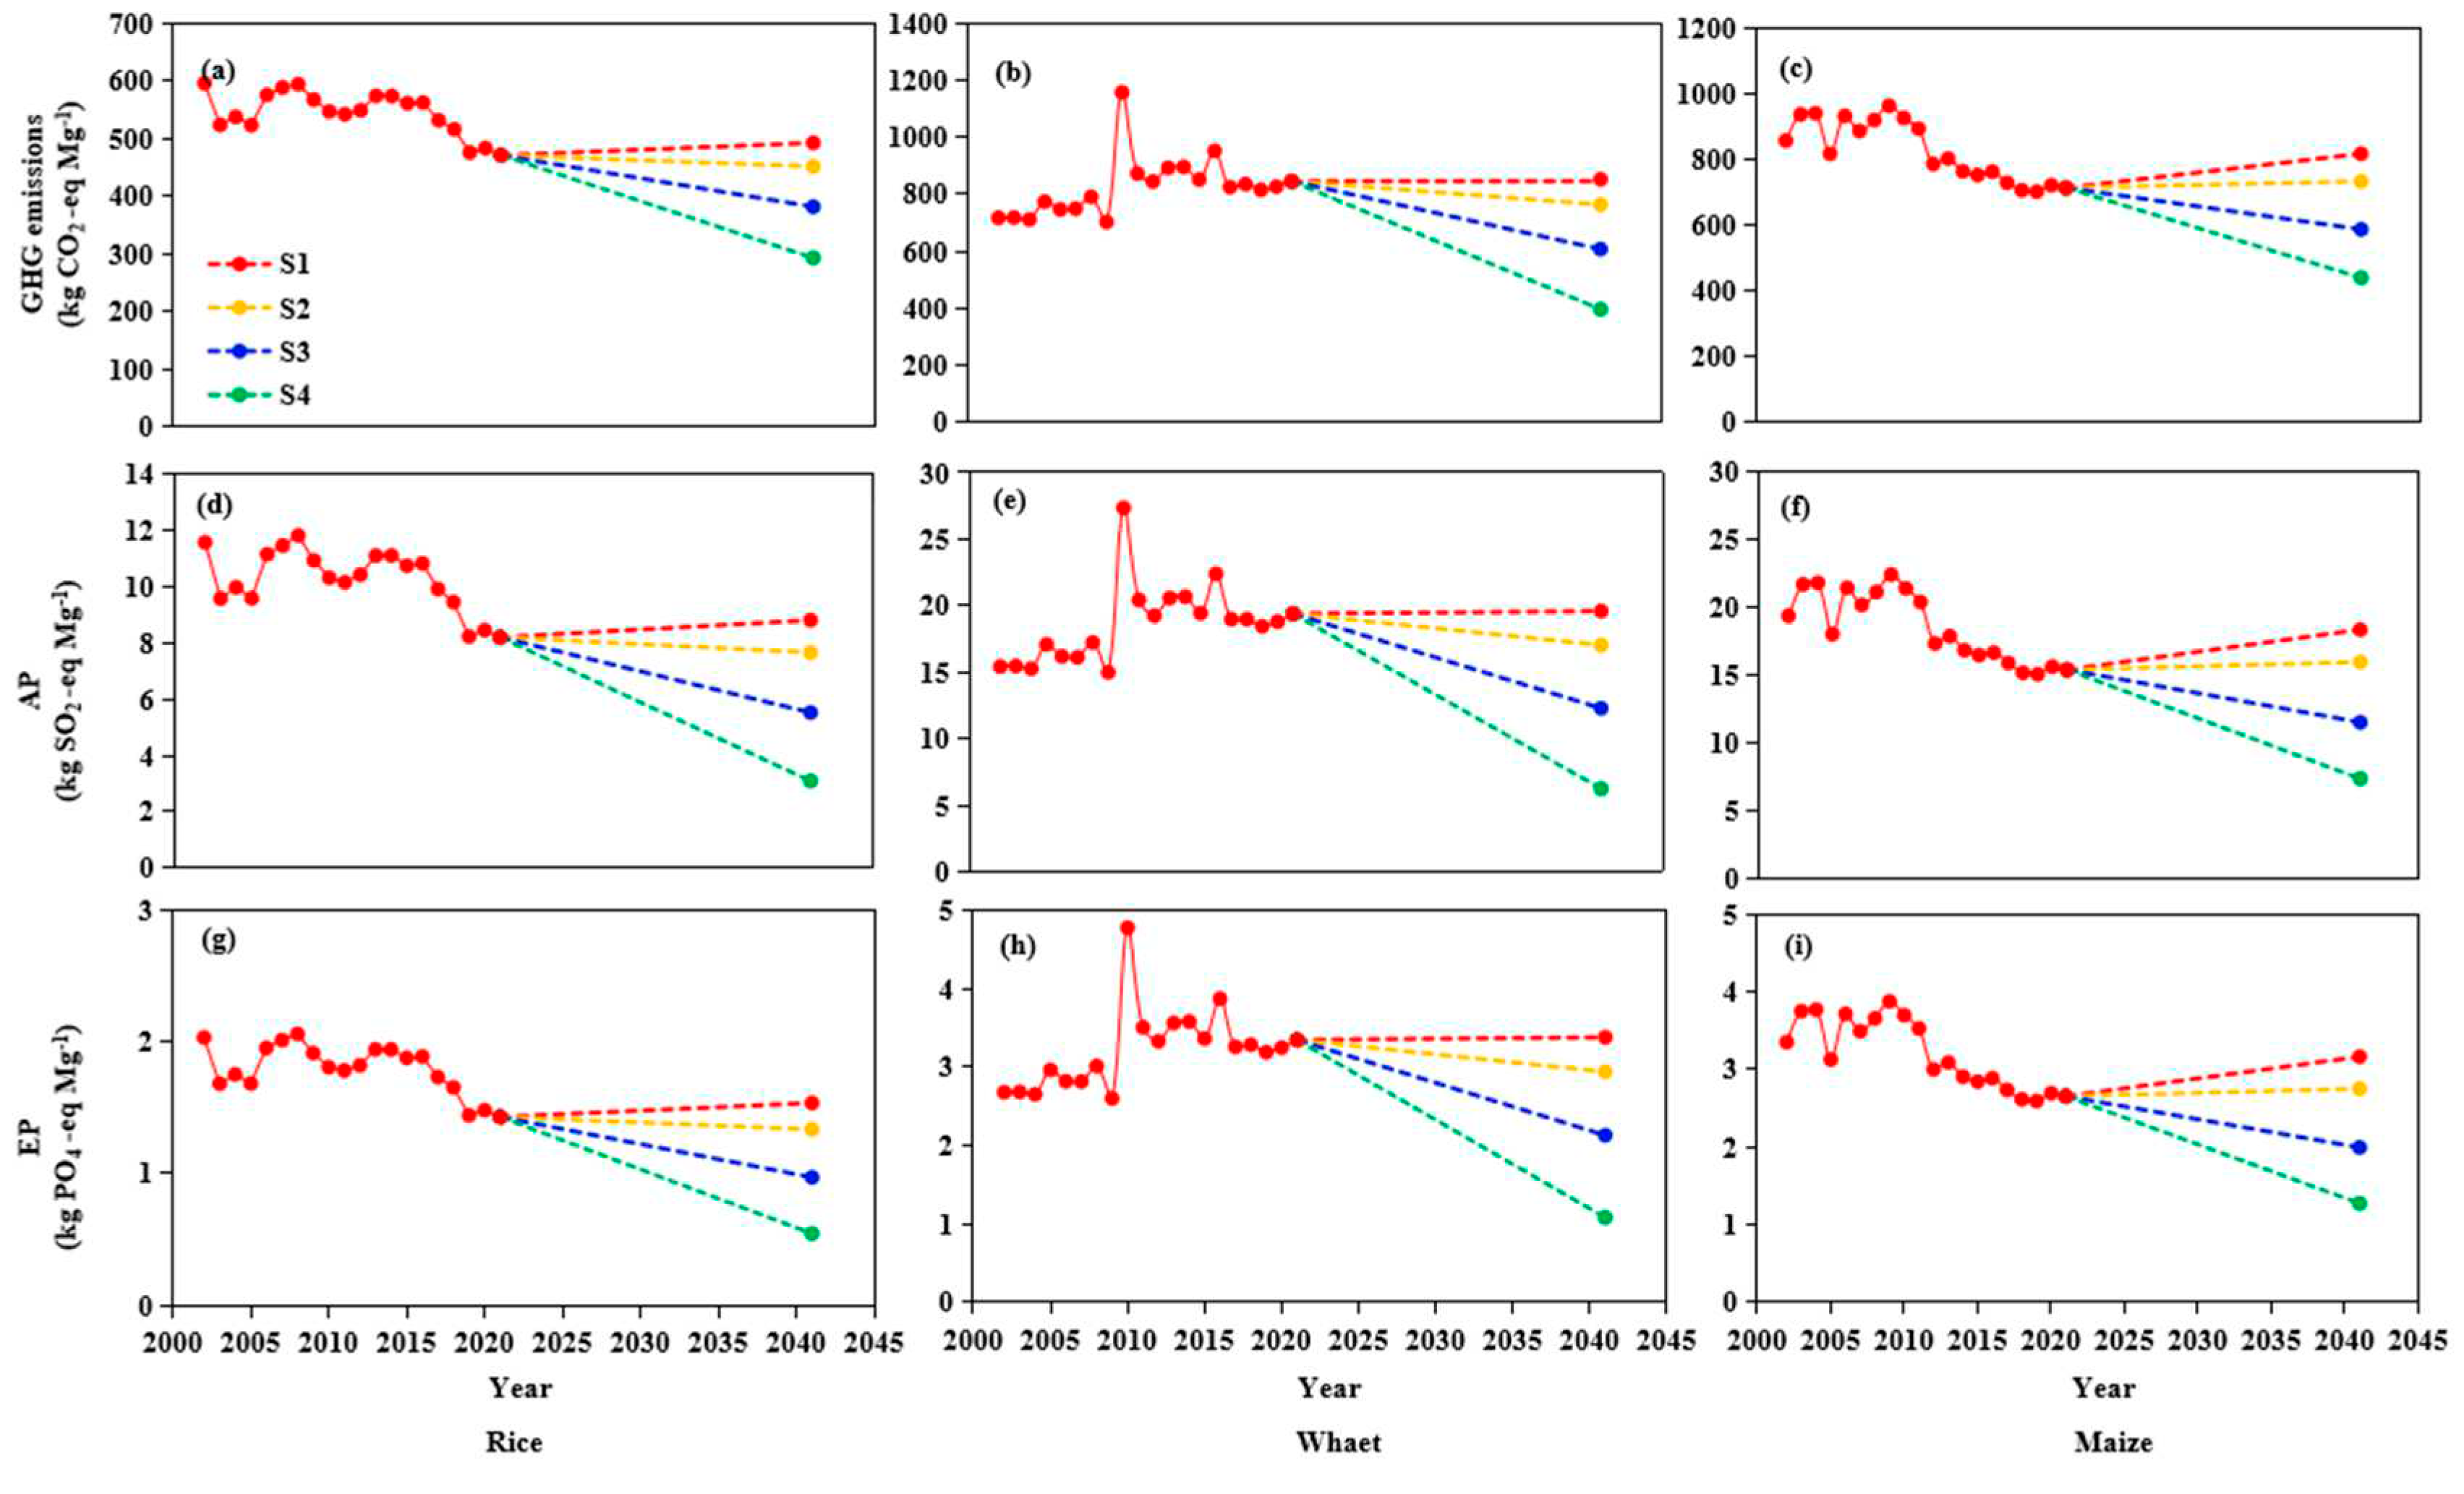
3.4. Environmental Impacts and Mitigation Potential of Crop Production
4. Discussion
4.1. Differences in Yield, Nutrient Input, and PFP–N
4.2. Characteristics of Environmental Impacts from Crop Production
4.3. Mitigating the Environmental Impacts of Crop Production in Subtropical Plateau Regions.
4.4. Uncertainty
5. Conclusions
Author Contributions
Funding
Informed Consent Statement
Abbreviations
| N, nitrogen; | MS, agricultural materials stage; |
| NUE, N use efficiency; | FS, farming stage; |
| LCA, life cycle assessment; | Nr, reactive nitrogen; |
| GWP, global warming potential; | GHG, greenhouse gas; |
| AP, soil acidification potential; | EP, water eutrophication potential; |
| NCP, China's North China Plain; | PFP–N, partial factor productivity of nitrogen |
References
- Ray, D.K.; Ramankutty, N.; Mueller, N.D.; West, P.C.; Foley, J.A. Recent patterns of crop yield growth and stagnation. Nat. Commun. 2012, 3, 1293. [Google Scholar] [CrossRef]
- Guo, S.F.; Pan, J.; Zhai, L.; Khoshnevisan, B.; Wu, S.X.; Wang, H.Y.; Yang, B.; Liu, H.B.; Lei, B.K. The reactive nitrogen loss and GHG emissions from a maize system after a long-term livestock manure incorporation in the North China Plain. Sci. Total Environ. 2020, 720, 137558.1–137558.9. [Google Scholar] [CrossRef] [PubMed]
- Chen, X.P.; Cui, Z.L.; Fan, M.S.; Vitousek, P.; Zhao, M.; Ma, W.Q.; Wang, Z.L.; Zhang, W.J.; Yan, X.Y.; Yang, J.C.; Deng, X.P.; Gao, Q.; Zhang, Q.; Guo, S.W.; Ren, J.; Li, S.Q.; Ye, Y.Y.; Wang, Z.H.; Huang, J.L.; Tang, Q.Y.; Sun, Y.X.; Peng, X.L.; Zhang, J.W.; He, M.R.; Zhu, Y.J.; Xue, J.Q.; Wang, G.L.; Wu, L.; An, N.; Wu, L.Q.; Ma, L.; Zhang, W.F.; Zhang, F.S. Producing more grain with lower environmental costs. Nature 2014, 514, 486–489. [Google Scholar] [CrossRef] [PubMed]
- Zhang, F.S.; Cui, Z.L.; Fan, M.S.; Zhang, W.F.; Chen, X.P.; Jiang, R.F. Integrated Soil–Crop System Management: Reducing Environmental Risk while Increasing Crop Productivity and Improving Nutrient Use Efficiency in China. J. Environ. Qual. 2011, 40, 1051–1057. [Google Scholar] [CrossRef] [PubMed]
- Nie, J.W.; Zhou, J.; Zhao, J.; Wang, X.Q.; Liu, K.; Wang, P.X.; Wang, S.; Yang, L.; Zang, H.D.; Harrison, M.T.; Yang, Y.D.; Zeng, Z.H. Soybean Crops Penalize Subsequent Wheat Yield During Drought in the North China Plain. Front Plant Sci. 2022, 13, 947132. [Google Scholar] [CrossRef]
- Amir, S.; Ketterings, Q.M.; Godwin, G.S.; Czymmek, K.J. Under- or Over-Application of Nitrogen Impact Corn Yield, Quality, Soil, and Environment. Agron. J. 2016, 109, 343–353. [Google Scholar] [CrossRef]
- Savci, S. An Agricultural Pollutant: Chemical Fertilizer. Int. J. Environ. Sci. Dev. 2012, 3, 73–80. [Google Scholar] [CrossRef]
- Zhou, Y.J.; Li, X.X.; Cao, J.; Li, Y.; Huang, J.L.; Peng, S.B. High nitrogen input reduces yield loss from low temperature during the seedling stage in early-season rice. Field Crop. Res. 2018, 228, 68–75. [Google Scholar] [CrossRef]
- Ten Berge, H.F.M.; Hijbeek, R.; Van Loon, M.P.; Rurinda, J.; Tesfaye, K.; Zingore, S.; Craufurd, P.; Van Heerwaarden, J.; Brentrup, F.; Schröder, J.J. Maize crop nutrient input requirements for food security in sub-Saharan Africa. Global Food Secur. 2019, 23, 9–21. [Google Scholar] [CrossRef]
- Cui, Z.l.; Zhang, H.Y.; Chen, X.P.; Zhang, C.C.; Ma, W.; Huang, C.D.; Zhang, W.F.; Mi, G.H.; Miao, Y.X.; Li, X.L.; Gao, Q.; Yang, J.C.; Wang, Z.H.; Ye, Y.L.; Guo, S.W.; Lu, J.W.; Huang, J.L.; Lv, S.H.; Sun, Y.X.; Liu, Y.Y.; Peng, X.L.; Ren, J.; Li, S.Q.; Deng, X.P.; Shi, X.J.; Zhang, Q.; Yang, Z.P.; Tang, L.; Wei, C.Z.; Jia, L.L.; Zhang, J.W.; He, M.R.; Tong, Y.N.; Tang, Q.Y.; Zhong, X.H.; Liu, Z.H.; Cao, N.; Kou, C.L.; Ying, H.; Yin, Y.L.; Jiao, X.Q.; Zhang, Q.S.; Fan, M.S.; Jiang, R.F.; Zhang, F.S.; Dou, Z.X. Pursuing sustainable productivity with millions of smallholder farmers. Nature 2018, 555, 363–366. [Google Scholar] [CrossRef]
- Tilman, D.; Balzer, C.; Hill, J.; Befort, B.L. Global food demand and the sustainable intensification of agriculture [Sustainability Science]. Proc. Natl. Acad. Sci. U. S. A. 2011, 108, 20260–20264. [Google Scholar] [CrossRef]
- Afi, M.; Parsons, J. Integrated vs. Specialized Farming Systems for Sustainable Food Production: Comparative Analysis of Systems’ Technical Efficiency in Nebraska. Sustainability 2023, 15, 5413. [Google Scholar] [CrossRef]
- GGonzález-García, S.; Almeida, F.; Brandão, M. Do Carbon Footprint Estimates Depend on the LCA Modelling Approach Adopted? A Case Study of Bread Wheat Grown in a Crop-Rotation System. Sustainability 2023, 15, 4941. [Google Scholar] [CrossRef]
- Samuel, K.; Van, D.H.M.G.A. A global meta-analysis of yield stability in organic and conservation agriculture. Nat. Commun. 2018, 9, 3632. [Google Scholar] [CrossRef]
- Feng, X.M.; Sun, T.; Guo, J.R.; Cai, H.G.; Qian, C.R.; Hao, Y.B.; Yu, Y.; Deng, A.X.; Song, Z.W.; Zhang, W.J. Climate-smart agriculture practice promotes sustainable maize production in northeastern China: Higher grain yield while less carbon footprint. Field Crop. Res. 2023, 302, 109108. [Google Scholar] [CrossRef]
- Pankievicz, V.C.S.; Delaux, P.M.; Infante, V.; Hirsch, H.H.; Rajasekar, S.; Zamora, P.; Jayaraman, D.; Calderon, C.I.; Bennett, A.; Ané, J.M. Nitrogen fixation and mucilage production on maize aerial roots is controlled by aerial root development and border cell functions. Front. in Plant Sci. 2022, 13, 977056. [Google Scholar] [CrossRef]
- Wang, L.; Li, L.Q.; Cheng, K.; Pan, G.X. Comprehensive evaluation of environmental footprints of regional crop production: A case study of Chizhou City, China. Ecol. Econ. 2019, 164, 106360.1–106360.12. [Google Scholar] [CrossRef]
- Zheng, J.; Han, J.; Liu, Z.; Xia, W.; Zhang, X.; Li, L.; Liu, X.; Bian, R.; Cheng, K.; Zheng, J. Biochar compound fertilizer increases nitrogen productivity and economic benefits but decreases carbon emission of maize production. Agric. Ecosyst. Environ. 2017, 241, 70–78. [Google Scholar] [CrossRef]
- Krol-Badziak, A.; Pishgar-Komleh, S.H.; Rozakis, S.; Ksiezak, J. Environmental and socio-economic performance of different tillage systems in maize grain production: Application of Life Cycle Assessment and Multi-Criteria Decision Making. J. Cleaner Prod. 2021, 278, 123792.1–123792.13. [Google Scholar] [CrossRef]
- Todorović, M.; Mehmeti, A.; Cantore, V. Impact of different water and nitrogen inputs on the eco-efficiency of durum wheat cultivation in Mediterranean environments. J. Cleaner Prod. 2018, 183, 1276–1288. [Google Scholar] [CrossRef]
- Yang, X.L.; Sui, P.; Zhang, X.P.; Dai, H.C.; Yan, P.; Li, C.; Wang, X.L.; Chen, Y.Q. Environmental and economic consequences analysis of cropping systems from fragmented to concentrated farmland in the North China Plain based on a joint use of life cycle assessment, emergy and economic analysis. J. Environ. Manage. 2019, 251, 109588.1–109588.12. [Google Scholar] [CrossRef]
- Pini, M.; Scarpellini, S.; Rosa, R.; Neri, P.; Ferrari, A.M. Management of Asbestos Containing Materials: A Detailed LCA Comparison of Different Scenarios Comprising First Time Asbestos Characterization Factor Proposal. Environ. Sci. Technol. 2021, 55, 12672–12682. [Google Scholar] [CrossRef] [PubMed]
- Xie, B.; Jones, P.; Dwivedi, R.; Bao, L.L.; Liang, R.B. Evaluation, comparison, and unique features of ecological security in southwest China: A case study of Yunnan Province. Ecol. Indic. 2023, 153, 110453. [Google Scholar] [CrossRef]
- CMDC, The China Meteorological Data Service Center.
- NBSC, National Bureau of Statistics. China Agricultural Statistical Yearbook, China Statistics Press: Beijing, 2021.
- ECCAY. Editing Committee of China Agriculture Yearbook. China Agriculture Press: Beijing, 2022.
- PDNDRCC. The Price Department of the National Development and Reform Commission of China. China Statistics Press: Beijing, 2022.
- Lynch, J. Availability of disaggregated greenhouse gas emissions from beef cattle production: A systematic review. Environ. Impact Asses. 2019, 76, 69–78. [Google Scholar] [CrossRef] [PubMed]
- He, X.Q.; Qiao, Y.H.; Liu, Y.X.; Dendler, L.; Yin, C.; Martin, F. Environmental impact assessment of organic and conventional tomato production in urban greenhouses of Beijing city, China. J. Cleaner Prod. 2016, 134, 251–258. [Google Scholar] [CrossRef]
- Fageria, N.K.; Baligar, V.C. Enhancing Nitrogen Use Efficiency in Crop Plants. Adv. Agron. 2005, 88, 97–185. [Google Scholar] [CrossRef]
- Argento, F.; Liebisch, F.; Anken, T.; Walter, A.; El Benni, N. Investigating two solutions to balance revenues and N surplus in Swiss winter wheat. Agr. Syst. 2022, 201, 103451. [Google Scholar] [CrossRef]
- Meng, Q.F.; Yue, S.C.; Hou, P.; Cui, Z.L.; Chen, X.P. Improving Yield and Nitrogen Use Efficiency Simultaneously for Maize and Wheat in China: A Review. Pedosphere 2016, 26, 137–147. [Google Scholar] [CrossRef]
- Yin, Y.L.; Ying, H.; Zheng, H.F.; Zhang, Q.S.; Cui, Z.L. Estimation of NPK requirements for rice production in diverse Chinese environments under optimal fertilization rates. Agric. For. Meteorol. 2019, 279, 107756. [Google Scholar] [CrossRef]
- IPCC, Climate Change 2014: Impacts, Adaptation, and Vulnerability. Part A: Global and Sectoral Aspects. Contribution of Working Group II to the Fifth Assessment Report of the Intergovernmental Panel on Climate Change. In Press, C. U., Ed. Cambridge, 2014.
- Hauschild, M.Z.; Wenzel, H. Environmental assessment of products. Int. J. Life Cycle 1999, 4, 7–15. [Google Scholar] [CrossRef]
- Zhang, F.; Liu, F.B.; Ma, X.; Guo, G.Z.; Liu, B.; Cheng, T.H.; Liang, T.; Tao, W.L.; Chen, X.P.; Wang, X.Z. Greenhouse gas emissions from vegetables production in China. J. Cleaner Prod. 2021, 317, 128449.1–128449.10. [Google Scholar] [CrossRef]
- Perrin, A.; Basset-Mens, C.; Gabrielle, B. Life cycle assessment of vegetable products: a review focusing on cropping systems diversity and the estimation of field emissions. Int. J. Cycle Ass. 2014, 19, 1247–1263. [Google Scholar] [CrossRef]
- Huijbregts, M.A.J.; Thissen, U.; Guinée, J.B.; Jager, T.; Kalf, D.; Meent, D.V.D.; Ragas, A.M.J.; Sleeswijk, A.W.; Reijnders, L. Priority assessment of toxic substances in life cycle assessment. Part I: Calculation of toxicity potentials for 181 substances with the nested multi-media fate, exposure and effects model USES-LCA. Chemosphere 2000, 41, 541–573. [Google Scholar] [CrossRef]
- Wu, L.; Chen, X.P.; Cui, Z.L.; Zhang, W.F.; Zhang, F.S.; Hu, S.J. Establishing a Regional Nitrogen Management Approach to Mitigate Greenhouse Gas Emission Intensity from Intensive Smallholder Maize Production. Plos One 2014, 9, e98481. [Google Scholar] [CrossRef] [PubMed]
- Zhang, X.X.; Sun, H.F.; Wang, J.L.; Zhang, J.N.; Zhou, S. Effect of moisture gradient on rice yields and greenhouse gas emissions from rice paddies. Environ. Sci. Pollut. Res. 2019, 26, 33416–33426. [Google Scholar] [CrossRef] [PubMed]
- Chen, X.P.; Cui, Z.L.; Vitousek, P.M.; Cassman, K.G.; Matson, P.A.; Bai, J.S.; Meng, Q.F.; Hou, P.; Yue, S.C.; Romheld, V. Integrated soil–crop system management for food security. Proc. Natl. Acad. Sci. U. S. A. 2011, 108, 6399–6404. [Google Scholar] [CrossRef] [PubMed]
- Chen, W.; Wang, G.; Cai, W.; Che, X.; Zhou, W.; Zhang, C.; Zeng, J. Spatiotemporal mismatch of global grain production and farmland and its influencing factors. Resour. Conserv. Recycl. 2023, 194, 107008. [Google Scholar] [CrossRef]
- Tushar, S.R.; Alam, M.F.B.; Zaman, S.M.; Garza-Reyes, J.A.; Bari Mainul, A.B.M.; Karmaker, C.L. Analysis of the factors influencing the stability of stored grains: Implications for agricultural sustainability and food security. Sustain. Opera. Computer. 2023, 4, 40–52. [Google Scholar] [CrossRef]
- Xu, X.P.; He, P.; Zhao, S.C.; Qiu, S.J.; Johnston, A.M.; Zhou, W. Quantification of yield gap and nutrient use efficiency of irrigated rice in China. Field Crop. Res. 2016, 186, 58–65. [Google Scholar] [CrossRef]
- Xu, X.P. Estimating nutrient uptake requirements for rice in China. Field Crops Research 2015, 180, 37–45. [Google Scholar] [CrossRef]
- Lu, C.H.; Fan, L. Winter wheat yield potentials and yield gaps in the North China Plain. Field Crop. Res. 2013, 143, 98–105. [Google Scholar] [CrossRef]
- Meng, Q.F.; Hou, P.; Wu, L.; Chen, X.P.; Cui, Z.L.; Zhang, F.S. Understanding production potentials and yield gaps in intensive maize production in China. Field Crop. Res. 2013, 143, 91–97. [Google Scholar] [CrossRef]
- Van Wart, J.; Kersebaum, K.C.; Peng, S.; Milner, M.; Cassman, K.G. Estimating crop yield potential at regional to national scales. Field Crop. Res. 2013, 143, 34–43. [Google Scholar] [CrossRef]
- Wu, L.; Chen, X.P.; Cui, Z.L.; Wang, G.L.; Zhang, W.F. Improving nitrogen management via a regional management plan for Chinese rice production. Environ. Res. Lett. 2015, 10, 095011. [Google Scholar] [CrossRef]
- Good, A.G.; Shrawat, A.K.; Muench, D.G. Can less yield more? Is reducing nutrient input into the environment compatible with maintaining crop production? Trends Plant Sci. 2004, 9, 597–605. [Google Scholar] [CrossRef] [PubMed]
- Dobermann, A.; Cassman, K.G. Cereal area and nitrogen use efficiency are drivers of future nitrogen fertilizer consumption. Sci. China, Ser. C: Life Sci. 2005, 48, 745–758. [Google Scholar] [CrossRef] [PubMed]
- Bai, H.Z.; Tao, F.L. Sustainable intensification options to improve yield potential and eco-efficiency for rice-wheat rotation system in China. Field Crop. Res. 2017, 211, 89–105. [Google Scholar] [CrossRef]
- Cui, Z.L.; Wang, G.L.; Yue, S.C.; Wu, L.; Zhang, W.F.; Zhang, F.S.; Chen, X.P. Closing the N-Use Efficiency Gap to Achieve Food and Environmental Security. Environ. Sci. Technol. 2014, 48, 5780. [Google Scholar] [CrossRef]
- Liu, Z.J.; Yang, X.G.; Lin, X.M.; Hubbard, K.G.; Lv, S.; Wang, J. Maize yield gaps caused by non-controllable, agronomic, and socioeconomic factors in a changing climate of Northeast China. Sci. Total Environ. 2016, 541, 756–764. [Google Scholar] [CrossRef]
- Zhou, B.Y.; Sun, X.F.; Ding, Z.S.; Ma, W.; Zhao, M. Multisplit Nitrogen Application via Drip Irrigation Improves Maize Grain Yield and Nitrogen Use Efficiency. Crop Sci. 2017, 57, 168–1703. [Google Scholar] [CrossRef]
- Zhang, L.; Zhang, W.S.; Cui, Z.L.; Hu, Y.C.; Schmidhalter, U.; Chen, X.P. Environmental, human health, and ecosystem economic performance of long-term optimizing nitrogen management for wheat production. J. Cleaner Prod. 2021, 311, 127620.1–127620.11. [Google Scholar] [CrossRef]
- Achten, W.M.J.; Acker, K.; Lifset, R. EU-Average Impacts of Wheat Production: A Meta-Analysis of Life Cycle Assessments. J. Ind. Ecol. 2016, 132–144. [Google Scholar] [CrossRef]
- Kim, S.; Dale, B.E.; Jenkins, R. Life cycle assessment of corn grain and corn stover in the United States. Int. J. Cycle Ass. 2009, 14, 160–174. [Google Scholar] [CrossRef]
- Wang, J.; Dai, C. Identifying the Spatial-Temporal Pattern of Cropland's Non-Grain Production and Its Effects on Food Security in China. Foods 2022, 11, 3494. [Google Scholar] [CrossRef] [PubMed]
- Chen, Z.D.; Xu, C.C.; Ji, L.; Feng, J.F.; Fang, F.P. Effects of multi-cropping system on temporal and spatial distribution of carbon and nitrogen footprint of major crops in China. Glob. Ecol. Conserv. 2019, 22, e00895. [Google Scholar] [CrossRef]
- Cardenas, L.M.; Bhogal, A.; Chadwick, D.R.; Mcgeough, K.; Misselbrook, T.; Rees, R.M.; Thorman, R.E.; Watson, C.J.; Williams, J.R.; Smith, K.A. Nitrogen use efficiency and nitrous oxide emissions from five UK fertilised grasslands. Sci. Total Environ. 2019, 661, 696–710. [Google Scholar] [CrossRef] [PubMed]
- Ju, X.T.; Kou, C.L.; Zhang, F.S.; Christie, P. Nitrogen balance and groundwater nitrate contamination: Comparison among three intensive cropping systems on the North China Plain. Environ. Pollut. 2006, 143, 117–125. [Google Scholar] [CrossRef]
- Zhang, F.S.; Yue, S.C.; Schulz, R.; Chen, X.P.; Muller, T. Nitrogen dynamics, apparent mineralization and balance calculations in a maize-wheat double cropping system of the North China plain. Field Crop. Res. 2014, 160, 22–30. [Google Scholar] [CrossRef]
- Huang, S.H.; He, P.; Jia, L.L.; Ding, W.C.; Ullah, S.; Zhao, R.R.; Zhang, J.J.; Xu, X.P.; Liu, M.C.; Zhou, W. Improving nitrogen use efficiency and reducing environmental cost with long-term nutrient expert management in a summer maize-winter wheat rotation system. Soil Tillage Res. 2021, 213, 105–117. [Google Scholar] [CrossRef]
- Huang, T.; Ju, X.T.; Yang, H. Nitrate leaching in a winter wheat-summer maize rotation on a calcareous soil as affected by nitrogen and straw management. Sci. Rep. 2017, 7, 42247. [Google Scholar] [CrossRef]
- Galloway, J.N.; Townsend, A.R.; Erisman, J.W.; Bekunda, M.; Cai, Z.; Freney, J.R.; Martinelli, L.A.; Seitzinger, S.P.; Sutton, M.A. Transformation of the Nitrogen Cycle: Recent Trends, Questions, and Potential Solutions. Science 2008, 320, 889–892. [Google Scholar] [CrossRef]
- Xue, J.F.; Pu, C.; Liu, S.L.; Zhao, X.; Zhang, R. Carbon and nitrogen footprint of double rice production in Southern China. Ecol. Indic. 2016, 64, 249–257. [Google Scholar] [CrossRef]
- Rodrigues, V.L.; Dessureault, P.; Marty, C.; Boucher, J.; Paré, M.C. Life Cycle Assessment of Oat Flake Production with Two End-of-Life Options for Agro-Industrial Residue Management. Sustainability 2023, 15, 5124. [Google Scholar] [CrossRef]
- Wang, X.L.; Chen, Y.Q.; Sui, P.; Yan, P.; Yang, X.L.; Gao, W.S. Preliminary analysis on economic and environmental consequences of grain production on different farm sizes in North China Plain. Agr. Syst. 2017, 153, 181–189. [Google Scholar] [CrossRef]
- Brentrup, F.; Küsters, J.; Lammel, J.; Barraclough, P.; Kuhlmann, H. Environmental impact assessment of agricultural production systems using the life cycle assessment (LCA) methodology II. The application to N fertilizer use in winter wheat production systems. Eur. J. Agron. 2004, 20, 265–279. [Google Scholar] [CrossRef]
- Hu, S.Y.; Qiao, B.W.; Yang, Y.H.; Rees, R.M.; Huang, W.H.; Zou, J.; Zhang, L.; Zheng, H.Y.; Liu, S.Y.; Shen, S.J.; Chen, F.; Yin, X.G. Optimizing nitrogen rates for synergistically achieving high yield and high nitrogen use efficiency with low environmental risks in wheat production – Evidences from a long-term experiment in the North China Plain. Eur. J. Agron. 2023, 142, 126681. [Google Scholar] [CrossRef]
- Kurbah, I. Integrated nutrient management for food security and environmental quality. Int. J. Adv. Res. 2016, 4, 120–126. [Google Scholar] [CrossRef] [PubMed]
- Yang, S.H.; Peng, S.Z.; Xu, J.Z.; He, Y.P.; Wang, Y.J. Effects of water saving irrigation and controlled release nitrogen fertilizer managements on nitrogen losses from paddy fields. Paddy Water Environ. 2015, 13, 71–80. [Google Scholar] [CrossRef]
- He, T.H.; Liu, D.Y.; Yuan, J.J.; Ni, K.; Zaman, M.; Luo, J.F.; Lindsey, S.; Ding, W.X. A two years study on the combined effects of biochar and inhibitors on ammonia volatilization in an intensively managed rice field. Agric. Ecosyst. Environ. 2018, 264, 44–53. [Google Scholar] [CrossRef]
- Wu, Y.Y.; Xi, X.C.; Tang, X.; Luo, D.M.; Gu, B.J.; Lam, S.K.; Vitousek, P.M.; Chen, D.L. Policy distortions, farm size, and the overuse of agricultural chemicals in China. Proc. Natl. Acad. Sci. U S A 2018, 115, 7010–7015. [Google Scholar] [CrossRef]
- Cheng, K.; Pan, G.X.; Smith, P.; Luo, T.; Yan, M. Carbon footprint of China's crop production—An estimation using agro-statistics data over 1993–2007. Agric. Ecosyst. Environ. 2011, 142, 231–237. [Google Scholar] [CrossRef]
- Xu, X.M.; Lan, Y. Spatial and temporal patterns of carbon footprints of grain crops in China. J. Cleaner Prod. 2017, 146, 218–227. [Google Scholar] [CrossRef]
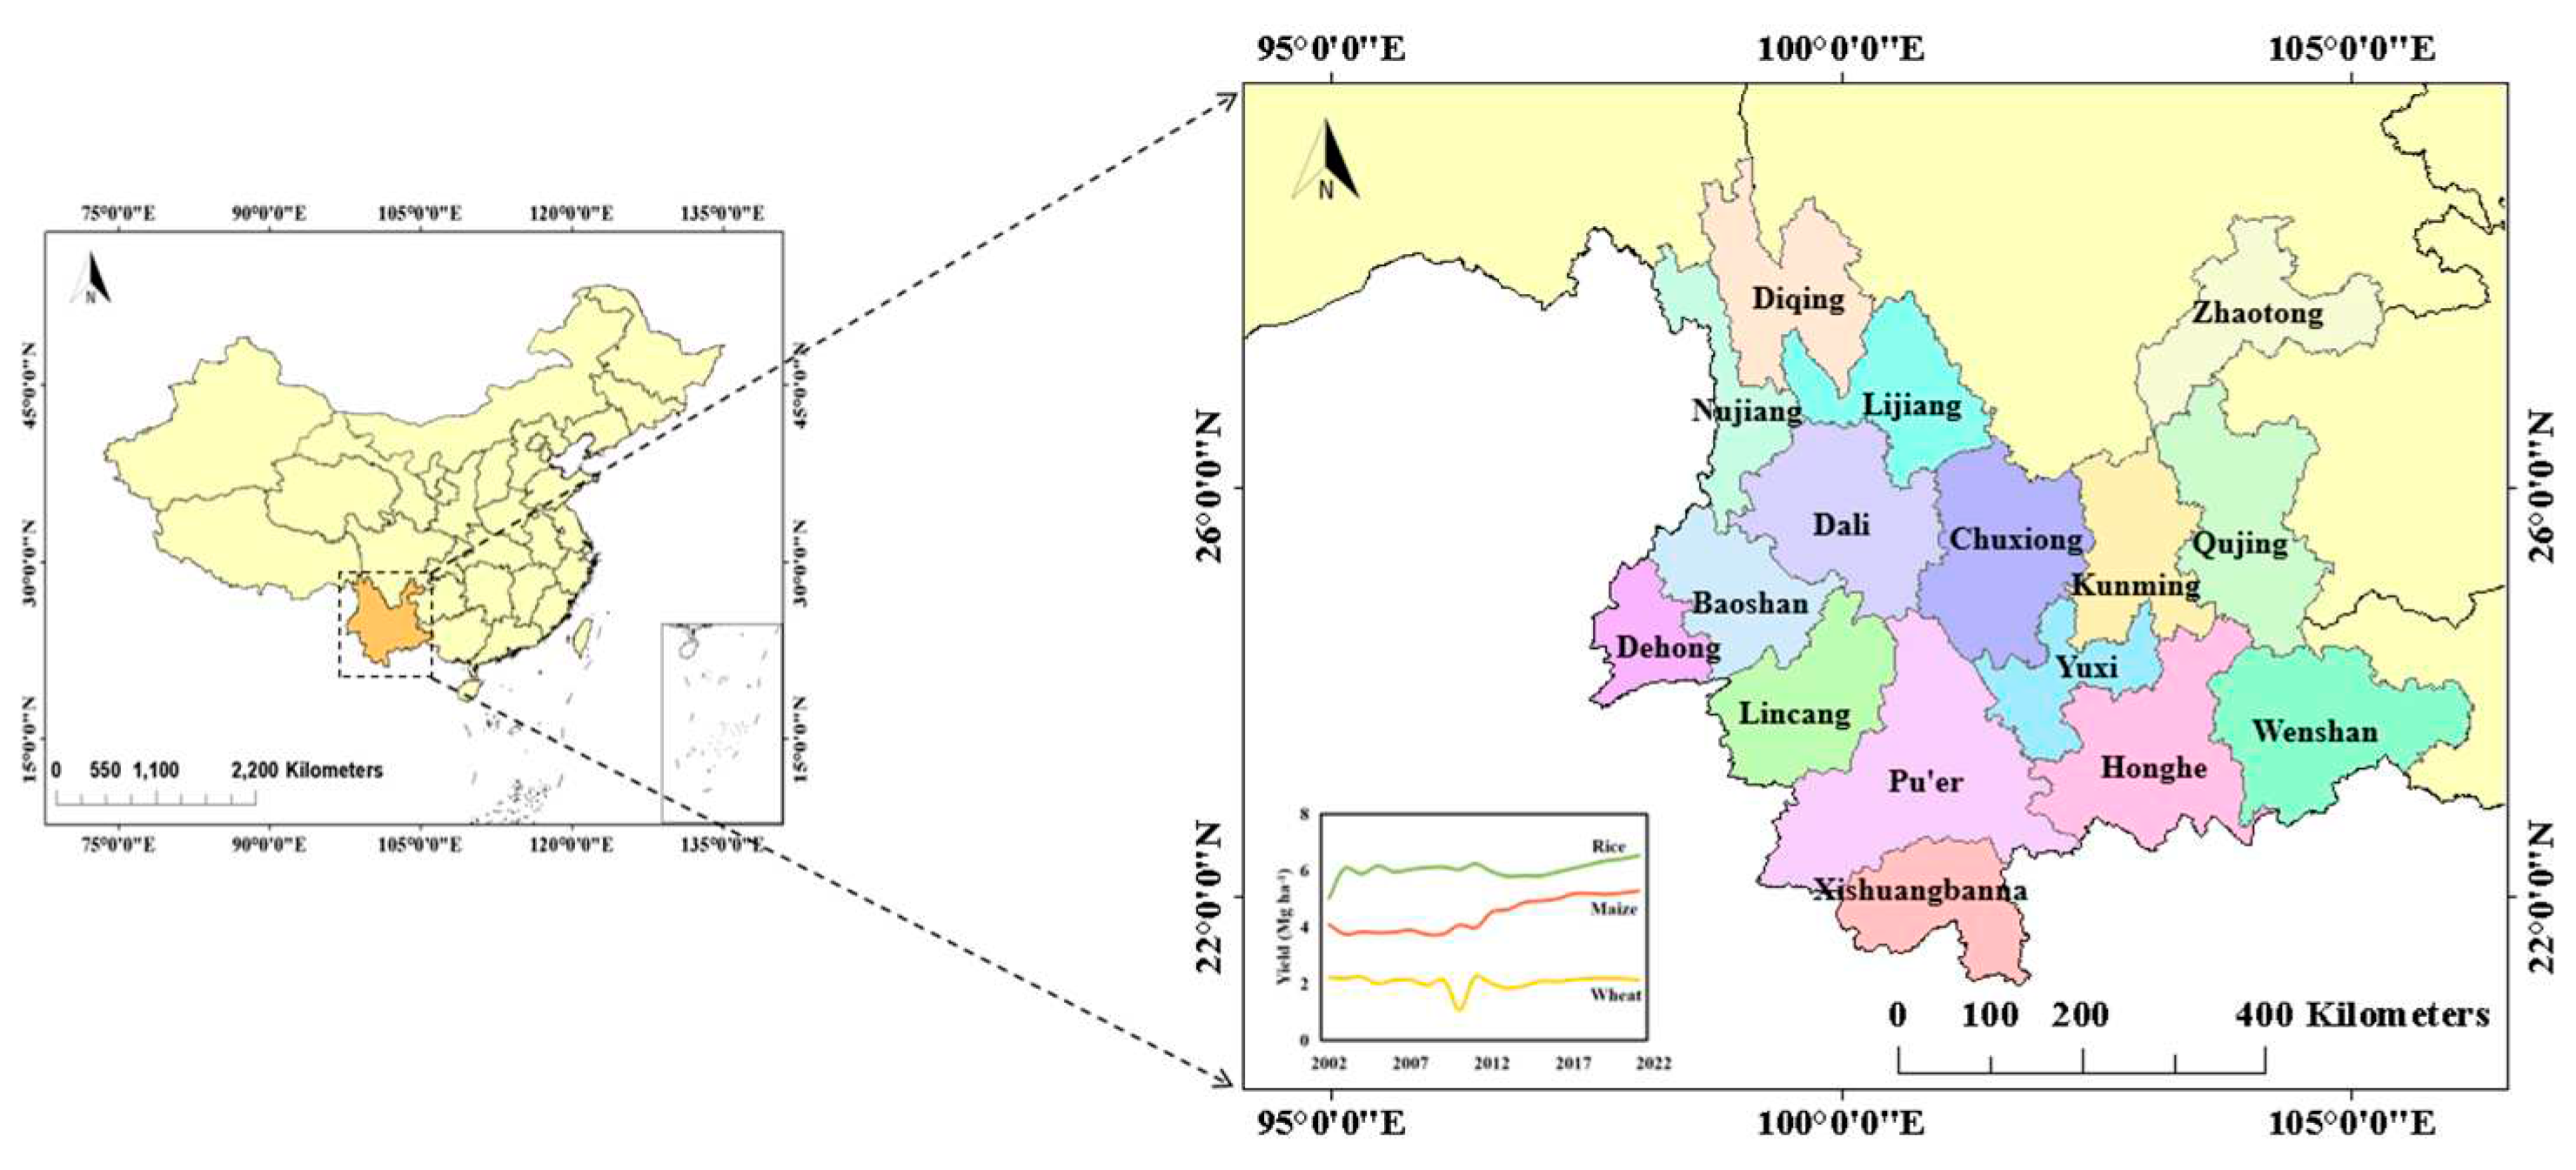
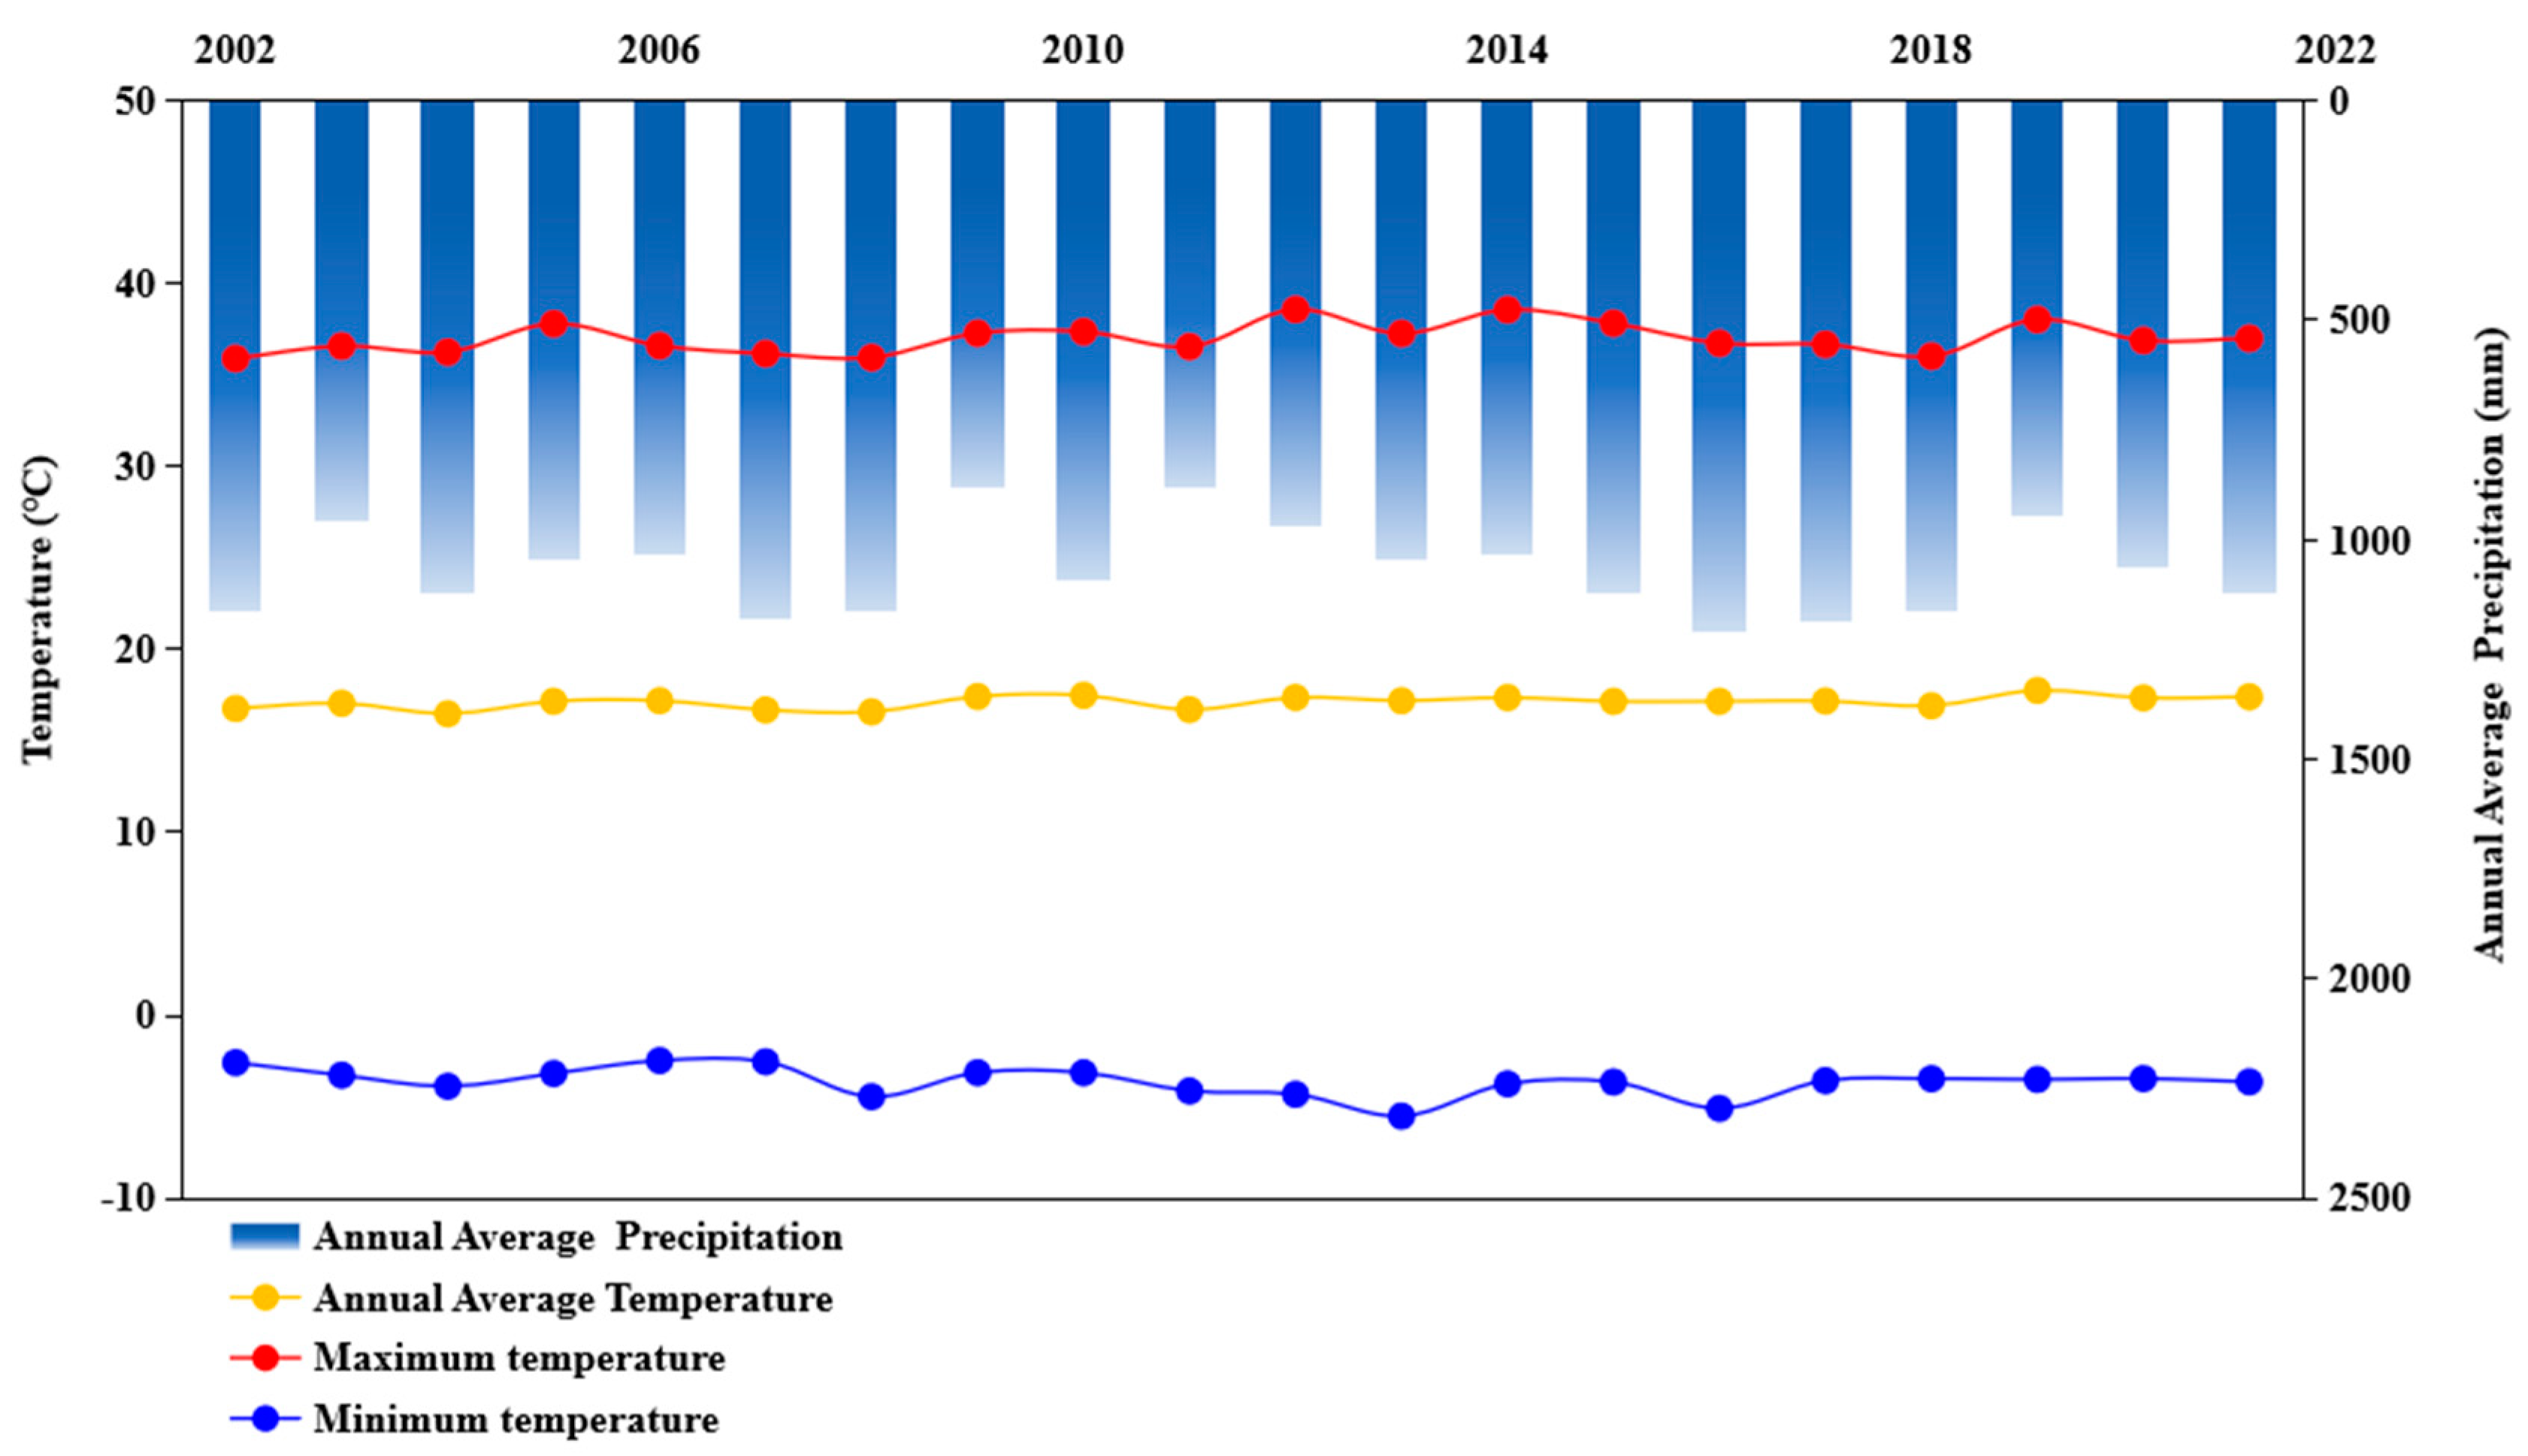
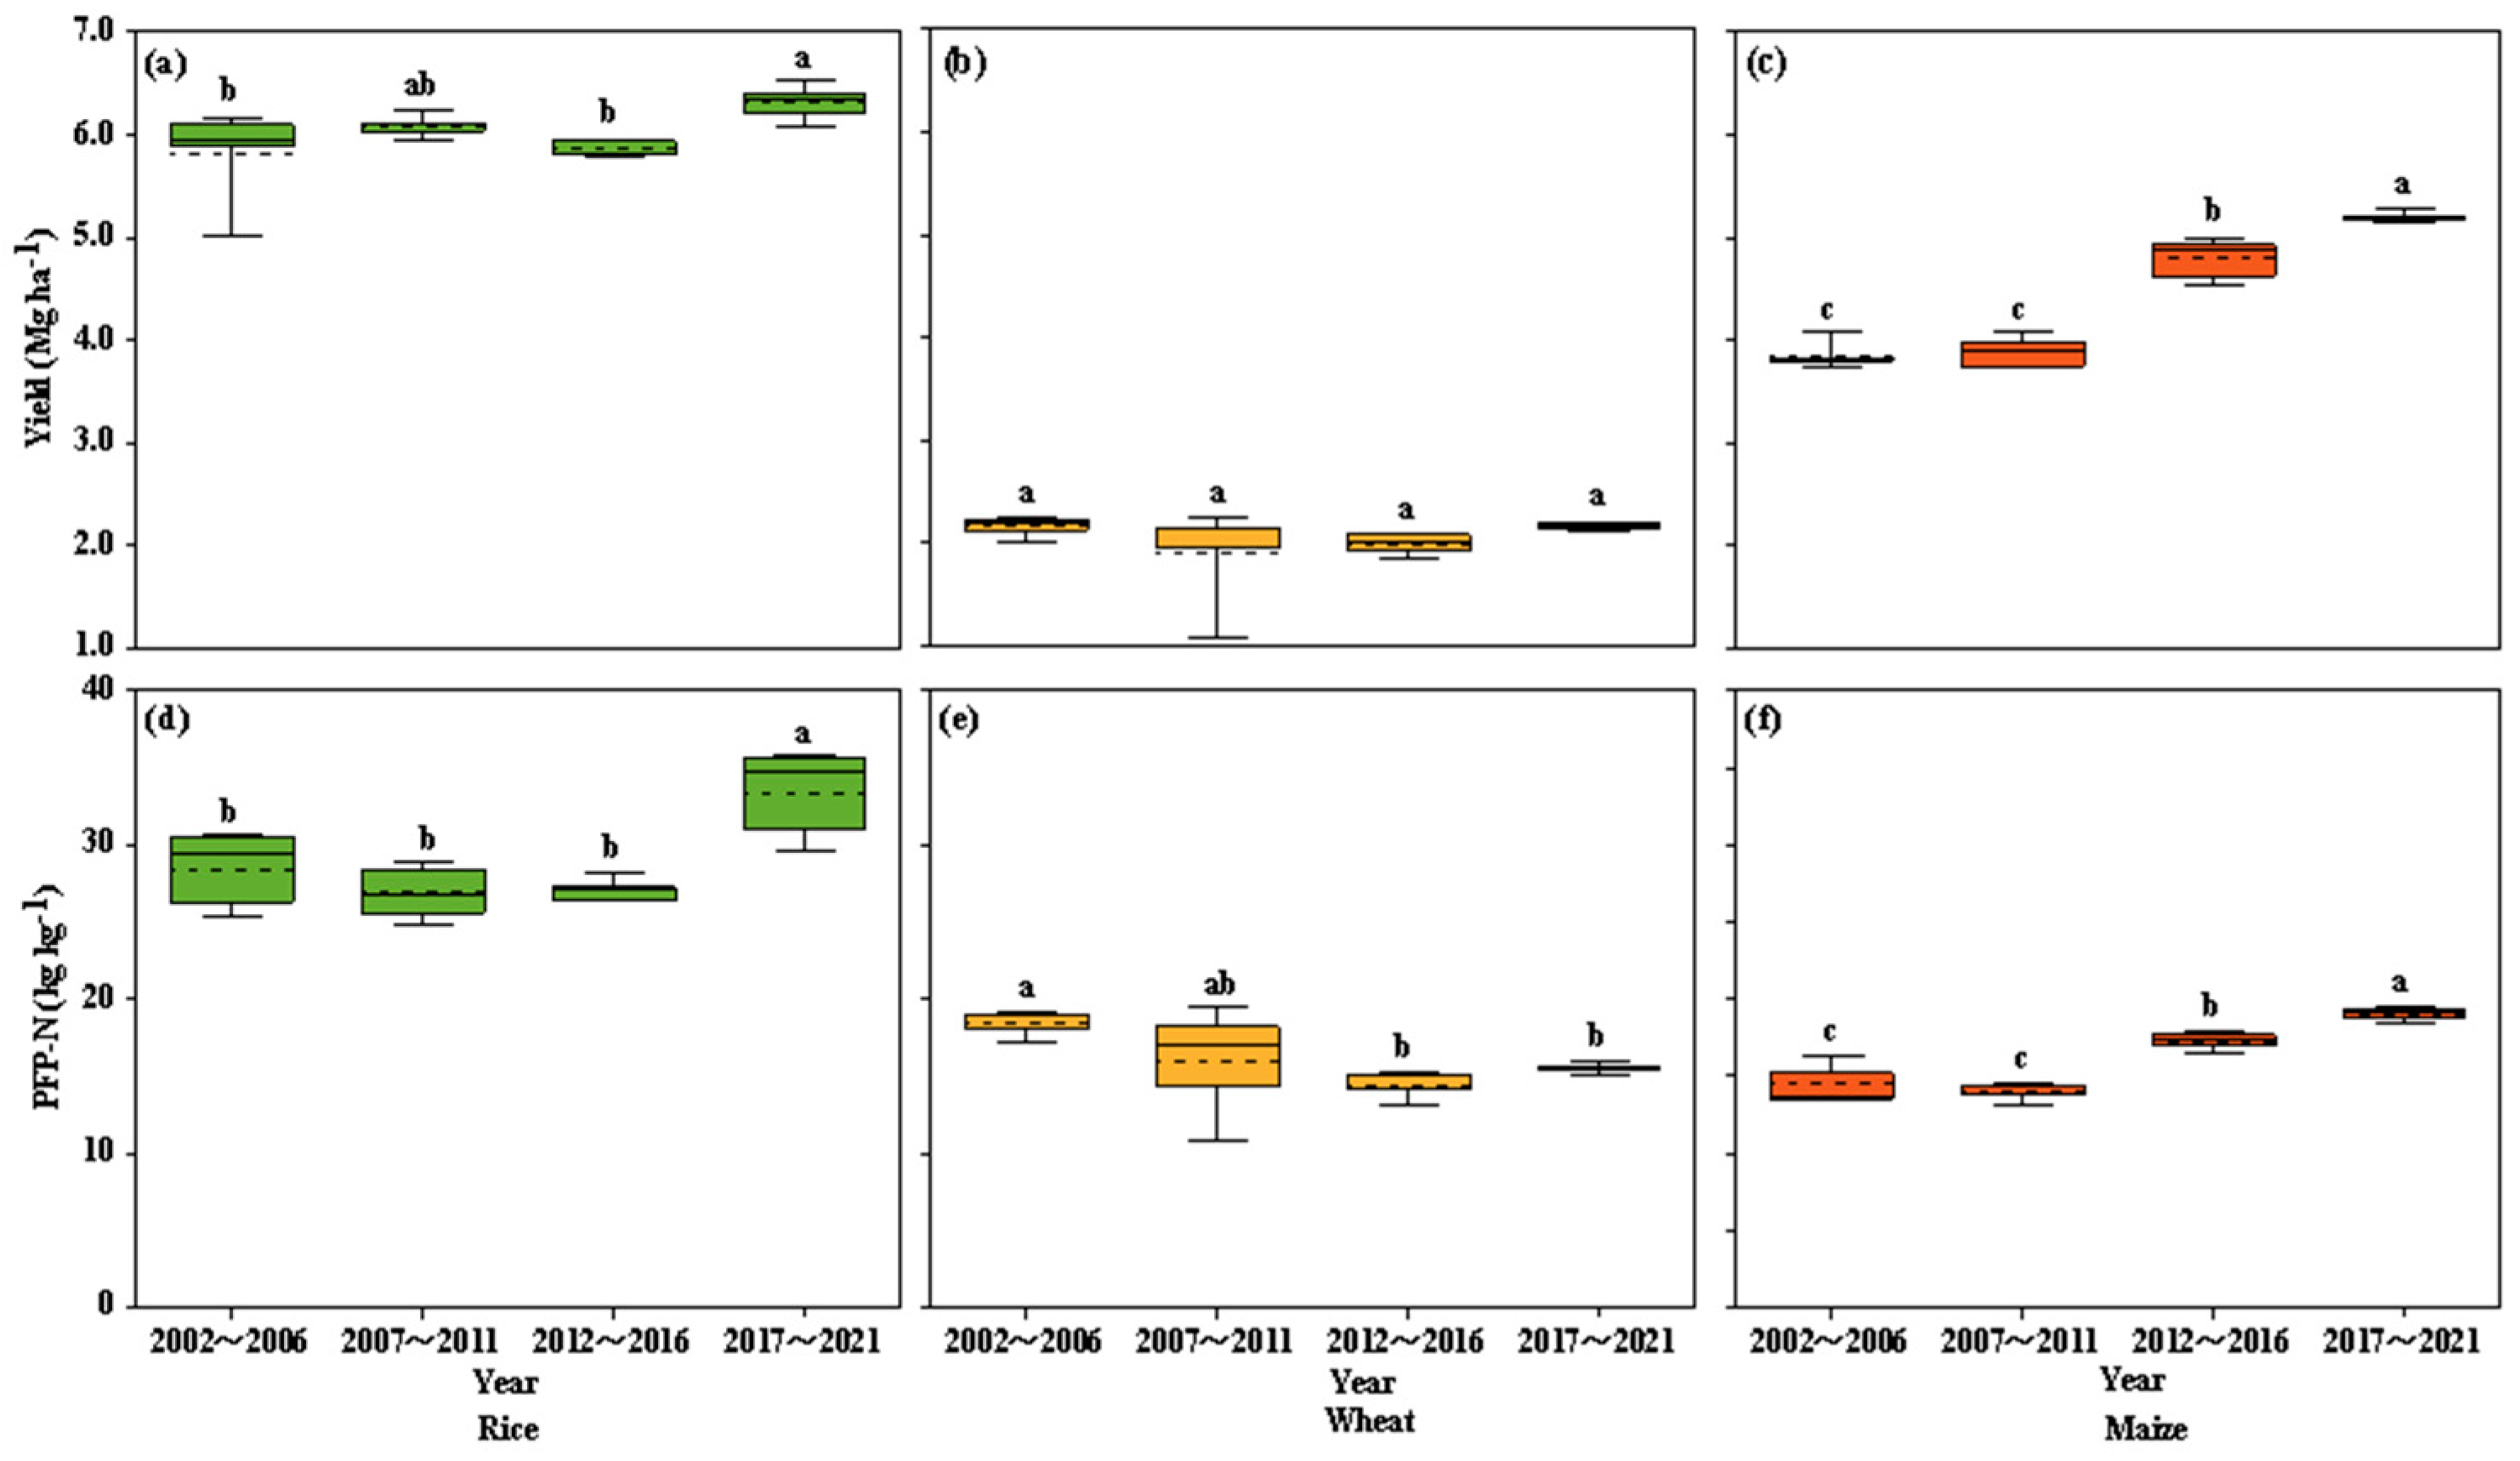

| Annual precipitation(mm) | Annual air temperature(°C) | Annual illumination hours (h) | Major soil textures | Soil pH | |
| Kunming | 917±131 | 16.7±1.6 | 2181±212 | Loam to clay loam | 5.8–6.7 |
| Qujing | 1012±147 | 15.6±1.9 | 1908±107 | Loam to clay loam | 5.7–7.0 |
| Yuxi | 893±131 | 20.5±0.8 | 2159±177 | Loam to clay loam | 5.6–6.6 |
| Zhaotong | 885±128 | 14.6±2.0 | 1456±96 | Loam to clay loam | 5.5–6.5 |
| Chuxiong | 949±123 | 18.9±1.2 | 2343±153 | Loam to clay loam | 5.5–7.5 |
| Honghe | 1106±122 | 19.9±0.1 | 1997±129 | Sandy loam to clay loam | 5.5–6.8 |
| Wenshan | 1082±158 | 18.8±1.2 | 1733±131 | Loam to clay loam | 5.3–6.3 |
| Pu'er | 1351±154 | 20.3±0.8 | 2197±144 | Sandy loam to sandy clay | 5.3–6.4 |
| Xishuangbanna | 1492±208 | 22.1±0.5 | 2175±153 | Loam to clay loam | 4.9–6.2 |
| Dali | 983±126 | 16.8±1.6 | 2248±134 | Loam to clay loam | 5.4–7.4 |
| Baoshan | 1123±157 | 17.5±1.4 | 2325±134 | Loam to clay loam | 5.3–6.5 |
| Dehong | 1247±171 | 18.7±1.2 | 2317±135 | Loam to clay loam | 5.0–6.4 |
| Lijiang | 916±98 | 15.0±2.0 | 2400±121 | Sandy loam to sandy clay | 5.5–6.8 |
| Nujiang | 1097±170 | 13.6±2.3 | 1817±134 | Sandy loam to clay loam | 5.4–6.9 |
| Lincang | 1157±163 | 19.3±1.0 | 2316±149 | Sandy loam to clay loam | 5.3–6.3 |
| Diqing | 820±123 | 10.7±2.9 | 1990±143 | Loam to sandy loam | 5.5–6.9 |
| Unit | Rice | Wheat | Maize | ||||
| Yunnan Province | Northeast China |
Yunnan Province | Europe | Yunnan Province | America | ||
| Greenhouse gas emissions |
kg CO2-eq Mg-1 | 471–596 | 987–1486 | 702–951 | 610–650 | 700–962 | 254–824 |
| Acidification potential | kg SO2-eq Mg -1 | 8.2–11.8 | – | 15.3–22.4 | 4.9–6.5 | 15.0–22.4 | 2.7–7.8 |
| Eutrophication potential | kg PO4-eq Mg -1 | 1.4–2.1 | – | 2.6–3.9 | 5.0–7.6 | 2.6–3.9 | 0.7–2.3 |
Disclaimer/Publisher’s Note: The statements, opinions and data contained in all publications are solely those of the individual author(s) and contributor(s) and not of MDPI and/or the editor(s). MDPI and/or the editor(s) disclaim responsibility for any injury to people or property resulting from any ideas, methods, instructions or products referred to in the content. |
© 2023 by the authors. Licensee MDPI, Basel, Switzerland. This article is an open access article distributed under the terms and conditions of the Creative Commons Attribution (CC BY) license (http://creativecommons.org/licenses/by/4.0/).


