
You are currently viewing a beta version of our website. If you spot anything unusual, kindly let us know.
Preprint
Article
Investigation on the Influence Area of Excavation of Double-Line Highway Tunnel Underpass Existing Railway Tunnel
Altmetrics
Downloads
89
Views
30
Comments
0
A peer-reviewed article of this preprint also exists.

This version is not peer-reviewed
Abstract
The research on the impact of excavation of underpass tunnels has already had certain results, but there is a lack of research cases of double-line highway tunnels with oblique angles underpass the existing railway tunnels, especially the method of determining the area of the impact of the dynamic and static loads of the new tunnels and existing trains to be enriched by considering them at the same time. In this paper, based on the tunnel project of the new double-line Shiqian Highway Tunnel with oblique angles underpass the Hurong Railway in Wanshoushan. By constructing a three-dimensional finite element model and simulating the application of static tunnel excavation load, dynamic blasting load and dynamic train operation load of the existing tunnel, the overall displacement of the existing tunnel and the settlement value of the bottom plate of the track surface by the static tunnel excavation load were analyzed. Then, the stresses, vibration speeds and displacements of the tunnel due to the dynamic blasting loads and the dynamic train operation loads were obtained. The results show that: the area of influence of the static loads of the new tunnel excavation on the existing tunnel is divided into three types of perturbations presenting strong, weak and slight; the area affected by the blasting dynamic load of new tunnel excavation is a circular domain with the datum point in the tunnel section as the center; the area affected by the dynamic load of train operation in the existing tunnel is an ellipse with the center of the track surface of the existing tunnel as the datum; there is an anomalous shape in the area affected by the blasting dynamic load of new tunnel excavation and the area affected by the dynamic load of train operation in the existing tunnel.
Keywords:
Subject: Environmental and Earth Sciences - Other
1. Introduction
With China's growing population and increasing traffic congestion, the development of underground space has become a mainstream trend, and the emergence of underground highway and railway tunnels has greatly eased traffic congestion [1,2,3]. However, due to the increase in the number of tunnels, it is inevitable that there will be spatial overlapping of tunnels, in which the lower part of new tunnels passes through the existing tunnels is a commonly used method in the project [4,5,6,7]. Excavation of new tunnels not only induces stress redistribution in the surrounding rock strata, but also generates additional stresses, settlement deformations and additional vibrations on the existing tunnels, resulting in the deterioration of the mechanical properties of the existing tunnel structures within a certain range of the underpass area [8,9,10]. When the clear distance between the cross section tunnels is small, there is an overlapping influence area between the excavation of the new tunnel and the train operation in the existing tunnel, which can lead to further deterioration of the mechanical properties of the surrounding rock [11,12,13]. Currently, there are fewer studies on the overlapping impact areas of tunnel crossing sections, especially lacking research cases of double-line highway tunnels passing under existing railway tunnels at oblique angles. Therefore, it is of great significance to study the area affected by excavation of road tunnels underpass existing railway tunnels.
At present, scholars have certain research results on the effects of static loads on excavation under existing tunnels for new tunnels [14,15,16]. Chakeri et al. [17] investigated the effect of tunnel depth, overburden pressure, tunnel dimensions and palisade pressure on tunnel displacements in a single-lane tunnel. Gue et al. [18] investigated the bending moments and deformation patterns of a newly constructed two-lane tunnel vertically crossing an existing tunnel at different clear distances by using centrifuge modeling tests. Avgerinos et al. [19] constructed a model of a newly constructed tunnel vertically underpass an existing tunnel by means of three-dimensional finite element (FE) software and analyzed the circumferential forces, bending moments, and lining deformations due to excavation. Chen et al. [20] systematically monitored the deformation characteristics and stress changes of new tunnels using a proximity earth pressure balance shield (EPBS) on existing tunnels based on a double tunnel project in sandy soil formation in Changsha City. It is proposed that the settlement development of the existing tunnel undergoes four stages: settlement, bulge, secondary settlement and reaching steady state, and it is found that the settlement caused by the second shield tunnel penetration is significantly larger than the settlement caused by the first tunnel penetration.
Vertical tunnel crossing is typical in the theoretical model, but in practical engineering, the angled crossing with more complex disturbances is often adopted. Shi et al. [21] investigated the response of underground pipes to tunnel boring by centrifuge tests. The results showed that the pipe-tunnel settlement and strain were related to the tunnel intersection angle, and the change was 20% higher at an intersection angle of 60° compared to 90° intersection angle. Lin et al. [22]studied the lateral deformation, transverse internal force and torsional deformation of new two-lane tunnels diagonally angled down through the existing tunnels based on the Changsha Metro Line 2 and Line 4 projects in China. The results show that the lateral deformation and lateral internal force of the existing tunnel show obvious asymmetric characteristics, and there are irrecoverable local torsional deformations on both sides of the new tunnel; the angle of intersection has almost no effect on the maximum settlement at the top of the existing tunnel, but it has a significant effect on the maximum settlement at the bottom, and it can be divided into three phases, i.e., a slow decrease (0-30°), a sharp decrease (30-60°) and slow decrease (60-90°).Further, Charles et al. [23] analytically summarized the stress redistribution patterns of new tunnels passing under existing tunnels at different angles of intersection by 3D centrifuge modeling.
At the same time, in addition to the static loads of excavation, more results have been obtained for the role of the dynamic loads of blasting excavation in new tunnels and the dynamic loads of train operation in existing tunnels.
In terms of dynamic loading of blasting and excavation of new tunnels, Shin et al. [24] used numerical methods to simulate the dynamics of soft rock tunnels, and investigated the particle velocity of the blast vibration and the displacement and lining stress change of the tunnels, and proposed the concept of blast protection zone. Zhao et al. [25] investigated the effects of blasting vibration velocity and vibration frequency of neighboring tunnels on the existing tunnels through the finite element method (FEM) and on-site monitoring experiments. Tian et al. [26] carried out on-site tunnel blasting vibration tests and processed the signals such as power spectrum, wavelet energy, and wavelet packet energy analysis with the help of MATLAB software. According to the severity of the affected degree, the tunnel blasting area is divided into hazardous area, warning area, blasting control area, and safety area. Duan et al. [27] investigated the peak particle velocity (PPV) change, stress distribution and crown settlement of cross tunnels under blasting vibration conditions by on-site monitoring and numerical simulation methods based on the Gaojiu Road-Jiahua Tunnel Project in Chongqing. Cao et al. [28] studied the effect of excavation blasting on the supporting structure of the front tunnel in the transition section of the rear tunnel under different levels of surrounding rock, excavation process, distance from the explosive source and clear span. Ruan et al. [29] modeled the vibration velocity of deep rock blasting, proposed the safe allowable distances under different soil thicknesses, and verified them according to the field blasting parameters.
In terms of dynamic loading from train operation in existing tunnels, Gharehdash et al. [30] and Ma et al. [31] investigated the effect of subway operation on shield tunnel lining and ground vibration by establishing a three-dimensional dynamic finite element model of train-track-tunnel-soil, respectively. Lai et al. [32] analyzed the vibration response of vehicle loads in the new tunnel and train loads in the existing tunnel on the structure of the new tunnel with the help of Midas-GTS 3D finite element simulation software based on the intersection project of Metro Line 2 and Yongningmen Tunnel. Huang et al. [33] studied train-induced settlement of subway tunnels in saturated clay. Yan et al. [34] investigated the dynamic response of cross-shield tunnels under train vibration using nonlinear finite element software. Dong et al. [35] investigated the dynamic response characteristics of new tunnels underpass existing heavy railroad tunnels. Xue et al. [36] studied the effects of construction disturbance, train dynamics and vibration loads on the existing tunnels of super-large diameter shield tunnels based on the Shanghai North Cross-Strait Project.
In summary, the current research on the role of new tunnel excavation static loads, new tunnel blasting excavation dynamic loads and the existing tunnel operational loads has been more comprehensive, but at the same time consider the new tunnel excavation and the existing train dynamic and static loads affecting the region of the determination of the method needs to be enriched.
Therefore, based on the tunnel project of the new double-line Shiqian Highway Tunnel diagonally crossing the Hurong Railway at Wanshoushan, a three-dimensional model of the influence area of the crossing section was constructed by using Midas-GTS numerical simulation software. By applying the new tunnel excavation static load, blasting dynamic load and the existing tunnel train running dynamic load for simulation calculation, the influence area of the three different load effects is studied.
2. Project Summary
2.1. Engineering Background
The research project described in this paper focuses on the cross tunnel between the Hurong Railway and the Shiqian Expressway at the Wanshoushan section. As Figure 1 shows, the Hurong Wanshoushan Railway is a two-lane tunnel with one uphill side and a gradient of 15.5%. The maximum width of the tunnel clear section is 12.26m, the height is 10.03m, and the clear area is 99.49m2.Shiqian Wanshoushan Highway Tunnel is a detached double-bore tunnel, with a length of 2,718m on the left and 2,729m on the right. the maximum width of the tunnel's clear section is 10.66m, the height is 8.60m, and the clear area is 76.85m2.
As shown in Figure 2, the spacing of the two-lane Shiqian highway tunnel is 25m, and it passes through the railroad tunnel in the form of 61° oblique angle. The pile number of left line intersection Shiqian highway tunnel is K3+674.943, and the pile number of Hurong railroad tunnel is K1468+119 (operation pile number), and the static spacing of structure is 30.856m; the pile number of right line intersection Shiqian highway tunnel is YK3+694.291, and the pile number of Hurong railroad tunnel is K1468+148 (operation pile number), and the static spacing of structure is 29.332m.
2.2. Engineering Geological Conditions
Shiqian Expressway Tunnel is approaching from Shizhu to Qianjiang direction, and the lower part of the tunnel crosses the surrounding rock of Wanshoushan Tunnel section of Hurong Railway. As shown in Figure 3, the lithology of the project area is mainly mudstone and malmstone, and the inlet section and outlet section are class V surrounding rock, and the cave section is mainly class III and IV surrounding rock (necessary for the classification of surrounding rock).
The malmstone belongs to the Upper Shaximiao Formation of the Middle Jurassic, which is a hard rock. The direction of the rock strata intersects with the axis of the cave at an angle of 32°, the inclination of the rock strata is about 10~12°, and two groups of joints are mainly developed. The rock body is more complete, with thick layer structure, and the combination between layers is generally better.
The mudstone belongs to Upper Shaximiao Formation of the Middle Jurassic System, which is a soft rock, and the thickness of mudstone is thin. The direction of the rock layer is intersected with the axis of the cave at an angle of 25~26°, the inclination of the rock layer is about 11°, and two groups of joints are mainly developed. The rock body is more complete, for thin ~ medium-thick layer structure, the combination between layers is general ~ good.
Tunnels through the area of lithology for the mudstone malmstone, is a weak water-bearing strata, part of the fissure is more developed section of the existence of drop-shaped or linear outflow of water. The tunnel body is an elliptical mound, with good conditions for surface water and groundwater drainage. Tunnel environmental action category for chemical erosion environment and chlorine salt environment, take the nearby ditch water and groundwater for water quality analysis, no erosion of concrete structure, so ignore the impact of groundwater. The impact of groundwater is therefore ignored.
According to China Earthquake Parameter Zoning Map (GB18306-2015) and Code for Seismic Design of Buildings (GB50011-2022), the peak acceleration of ground vibration in the survey area is 0.05g, and the intensity of seismic defense of buildings is 6 degrees.
3. Three-Dimensional Numerical Model
3.1. Finite Element Calculation Model
In this paper, a 3D geologic model was created by Midas GTS software. In order to minimize the negative influence of the boundary constraints on the calculation results in the finite element model, the left and right outer boundaries are taken to be 3-5 times of the width of the excavation area, and the upper and lower boundaries are taken to be 3-5 times of the height of the excavation area: the length (X-direction) × width (Y-direction) × height (Z-direction) of the finite element model is 600 m × 316 m × 749.6 m, and it can be considered to be unaffected by the construction factors, such as excavation, etc., outside the taken range. construction factors such as excavation.
The boundary constraints imposed during the calculation are: the ground surface is free constraint; the front and rear boundaries of the model are constrained by displacement in the Y-axis direction and the left and right boundaries are constrained by displacement in the X-axis direction due to the presence of extrusion in the subsurface geotechnical body; the lower boundaries of the model are fixed constraints, which limit the vertical and horizontal displacements and rotations.
The 3D solid model building process is shown in Figure 4. Firstly, according to the contour data of the actual geological topographic map, the TGM (terrain generator) in GTS NX is used to generate the actual free ground surface, then the solid model is generated according to the dimensions, and finally the solid model is generated by combining the stratigraphic section, the tunnel dimensions and the spatial relationship.
The surrounding rocks around the tunnel structure are symmetrically seeded with linear gradients to divide the fine cells to improve the calculation accuracy, with a grid size of 2~10m, and the 3D grid model is generated with 689,200 cells after giving the rock parameters and the intrinsic model.
3.2. Finite Element Calculation Parameters
3.2.1. Static Loads for New Tunnel Excavation
1). Basic parameters
The paper uses three-dimensional four-sided structural units to simulate mudstones and malmstones using the Drucker-Prager model.Mudstone and malmstone samples were taken from the typical Class IV rock section of Shiqian Wanshoushan Highway Tunnel, and density test, uniaxial compression and deformation test, and triaxial compression test were carried out with reference to the national standards of "Rock Testing Procedures for Water Conservancy and Hydropower Engineering" (SL264-2020) and "Standard of Testing Methods for Engineering Rocks" (GB/T50266-2013). Table 1 shows the parameters of peripheral rock support of Shiqian Wanshoushan Highway Tunnel.
As shown in Figure 5, the peripheral rock support of Shiqian Wanshoushan highway tunnel is shown. Anchor support is discounted to the modulus of elasticity of the rock body in the reinforced area by stiffness, and steel frame and grid support is discounted to the initial lining of sprayed concrete by stiffness, and the reinforced area of rock anchors is estimated according to Duraksha's formula [28]: steel frame or grid discounting formula:
where: Ec - modulus of elasticity of spray concrete after conversion (MPa);Ec0 - modulus of elasticity of original spray concrete (MPa);Sg --Steel frame or grille frame cross-sectional area (m2);Eg - modulus of elasticity of steel frame or grill (MPa);Sc - cross-sectional area of concrete (m2).
E = Ec0 + Sg ✕ Eg / Sc
Anchor support discount formula:
where: Er - modulus of elasticity of the rock mass after conversion (MPa);Er0 - modulus of elasticity of original spray concrete (MPa);Vb - volume of anchor rods in the support area (m3);Eb - modulus of elasticity of anchor rod (MPa);Vr - volume of rock body in the support area (m3).
Er = Er0 + Vb ✕ Eb / Vr
The parameters of the mudstone and malmstone rock mass and the discounted anchor support and steel-frame grating support are shown in Table 2.
2) Numerical simulation process
- (1)
- The corresponding rock properties are assigned to the strata and the initial ground stress field is balanced. There is no influence of tectonic joints in the cross-section tunnel project, and the ground stress is considered according to the initial self-gravitational stress field.
- (2)
- Simulate the excavation of the whole section of the existing railroad tunnel, apply initial support and secondary lining, and zero the displacement field.
- (3)
- Excavation of new highway tunnel. Tunnel each excavation footage of 2m, after excavation for the initial support and secondary lining, in order to facilitate data analysis for multiple excavation steps as a whole encapsulated into different data results extracted when the step Si. set the left side of the tunnel for the first excavation of the tunnel, from the inlet (left) to the exit (right) excavation, the right side of the tunnel for the excavation after the front and back of the tunnel difference of 3 Si, Si No. for the S1, S2, S3. S20, ......S20. The left hole S1 and S17, the right hole S4 and S20 are the time step of going to the boundary effect, which is 90m respectively. left hole S2=S3=S15=S16=50m,S4=S5=S6=S7=S8=S9=S10=S11=S12=S13=S14=20m.right hole S5=S6=S18=S19=S14=20m. S6=S18=S19=50m, S7=S8=S9=S10=S11=S12=S13=S14=S15=S16=S17=20m as shown in Figure 6.
- (4)
- Layout of monitoring points in existing tunnels. Along the Hurong Tunnel floor layout measurement points, tunnel left and right intersection of the center of the line is set as 0 measurement points, to the left hole extension line layout 0 ~ 61 measurement points, to the right hole extension line layout 0 ~ -61 measurement points measurement point interval distance of 3m, the 7th measurement point for the left line of the intersection, the -7th measurement point for the right line of the intersection.
3.2.2. Dynamic Blasting Loads for New Tunnels
1) Eigenvalue analysis (general formula, refer to established running literature [A])
Eigenvalue is used to analyze the inherent dynamic characteristics of the structure, which is an important parameter for the design of the structure subjected to dynamic loads. Through the eigenvalue analysis [37], the dynamic characteristics of the structure such as vibration shape, self-oscillation period, and vibration parameter coefficients can be obtained.
The characteristic equations for the calculation of vibration shape and intrinsic period are as follows:
where K is the stiffness matrix of the structure; M is the mass matrix of the structure; "ω" _"n" ^ "2" is the eigenvalue of the nth vibration mode; "Ф" ̅_"n" is the eigenvector of the nth vibration mode, and the spatial iterative method is used to calculate the eigenvectors to converge [41].
- (1)
- Boundary conditions
According to the literature [31,38], the elastic boundary is defined by the curved surface spring and the spring coefficient is calculated according to the foundation reaction coefficient of the road design code.
Vertical rock formation reaction force coefficient:
kv = kv0·(Bv/30)-3/4
Horizontal rock formation reaction factor:
where kv0 = kh0 = E0/30, Bv = Av1/2, Bh = Ah1/2, Av is the vertical cross-section area of the rock layer, Ah is the horizontal cross-section area of the rock layer, and E0 is the elastic modulus of the rock layer.
kh = kh0·(Bh/30)-3/4
After extracting the cross-sectional area in each direction based on the 3D solid model (Figure 4), the vertical and horizontal foundation reaction coefficients are calculated by Eqs. 4 and 5, as shown in Table 3.
- (2)
- Analysis of results
As shown in Figure 7, the calculation is carried out through Equation 1, and the comprehensive comparison of the eigenvalue results of the mass participation coefficients and periods of different vibration modes, and the final determination of the period values of vibration modes 6 and 7, 1.085584 and 1.031460, are used as the basis data for the calculation of damping of vibration modes of the time-range analysis.
- (3)
- Time course analysis
Time-course analysis is the process of calculating the dynamic characteristics of the structure and the structural response (displacement, internal force, velocity, etc.) at any moment in time.According to the literature [39,40,41], the power balance equations used are as follows:
where M is the total mass matrix of the finite element system; C is the total damping matrix of the finite element system; K is the total stiffness matrix of the finite element system; ("u") ̈"(t)", ("u") ̇"(t)", and "u(t)" are the acceleration, velocity, and displacement vectors of each node of the system; and "p(t)" is the dynamic load.
- (1)
- Boundary conditions
Define the viscous boundary through the surface spring [31,38], the P-wave and S-wave damping calculations in the X, Y and Z directions of the rock layer required to establish the viscous boundary are shown in Equations (7) and (8).
P-wave damping calculation formula:
CP = ρ·A·[(λ+2G)/ρ]1/2 = γ·A·[(λ+2G)/(λg)]1/2 = cp·A
S-wave damping formula:
where ρ is the density, kg/m3; γ is the bulk weight, t/m3; λ = vE/[(1+v)(1-2v)], the bulk modulus, t/m2; G = E/2(1+v), the shear modulus, t/m2; E is the modulus of elasticity, t/m2; v is the Poisson's ratio; g is the acceleration of gravity; A is the cross-sectional area of the boundary rock layer, m3; cp is the P-wave damping constant; cs is the S-wave damping constant.
CS = ρ·A·(G/ρ)1/2 = γ·A·[(G/(λg)]1/2 = cs·A
When inputting damping in GTS NX, only cp and cs can be input because the program automatically calculates the cross-sectional area of each unit. According to Eqs. (7) and (8) combined with the mechanical parameters of the rock formation, the results of cp and cs are shown in Table 4.
- (2)
- Dynamic load
Blasting load parameters include loading waveform, peak stress, location and direction of action, loading and unloading time, total vibration time and loading boundary.
The blast load waveform adopts the triangular load waveform, the peak load is reached quickly in 10 ms, and the unloading time is 100 ms. The peak load is determined by the empirical formula according to the literature [42], and the empirical formula is as follows:
where Z is the proportional distance; R is the distance from the gun hole to the loading surface, m; Q is the gun hole charge.
Pmax = 139.97/Z + 844.81/Z2 + 2154/Z3 -0.8034
Z = R/Q1/3
Under the tunnel blasting excavation of existing railroad tunnels mass vibration velocity requirements do not exceed 2cm / s, according to the literature [43], a one-time detonation of the maximum allowable amount of drug formula:
where V is the existing tunnel media mass vibration velocity; Q is a one-time permitted under the tunnel detonation of the total charge, kg; R is the center of the source of self-explosion to the distance of the protected building, m; K is the medium factor; a for the blasting vibration coefficient.
Q=R3(V/K)3/a
According to new tunnels and existing tunnels engineering geological conditions, K take 250, a take 1.5, through the formula (11) calculations, the existing tunnel floor from the center line of different distances from the maximum amount of detonation charge and mass vibration velocity, see Table 5
The maximum charge of 8.0 kg was selected as the base data for calculating the peak blasting load in conjunction with the spatial relationship of the cross tunnels. According to the maximum charge requirements for the upper and lower steps of the excavation section blasting design, the design of the shell hole section shown in Figure 8, blasting parameters are shown in Table 6.
Combined with the excavation section blasting design, the distance from the gun hole to the load surface is 1.0 m, based on the formula (7) and (8) to obtain the peak blasting load of 20.89 MPa. Blasting load in the form of pressure applied to the tunnel excavation boundary rock layer, the direction of action for the perimeter of the tunnel vertical direction.
3.2.3. Existing Tunnel Operational Loads
- (1)
- Train dynamic load
The dynamic load of each wheel during train operation is simplified into a series of vertical concentrated forces whose size changes dynamically with time, and the artificial excitation function method is utilized to determine the train vibration load. The excitation function consists of a static load and a series of sinusoidal functions superimposed on the dynamic load [44,45], whose expression is:
where is the static wheel load; 、、 are the peak loads corresponding to smoothness of travel, line power additional load, and waveform wear; is the mass of the train under the springs; is the uneven vibration wavelengths of the smoothness of travel, line power additional load, and waveform wear control conditions; is the lost height corresponding to the uneven vibration wavelength of the three control conditions; v is the train speed.
According to the existing tunnel train operation information, comprehensively considering the relevant parameters of CRH series trainsets, the train parameters are selected as eight cars, length 200m, speed 200km/h (55.5m/s), axle weight 19t, unsprung mass 2t, and static wheel weight 95kN on one side. According to the track unevenness laying accuracy standard (Figure 9) mentioned in the literature [32], the uneven wavelength and vector height are determined under three control conditions: L1=10 m, a1=3.5 mm; L2=2 m, a2=0.4 mm; L3=0.5 m, a3=0.1 mm. According to the formulae (12)~(13) to get the train dynamic loading time curve, as shown in Figure 10.
4. Results
4.1. New Tunnel Excavation
Figure 11 shows the cloud diagram of the overall displacement of the existing tunnel at different timing steps, and Figure 12 shows the overall peak deformation of the existing railroad tunnel and the overall deformation curve of the centerline of the bottom plate of the track surface at different timing steps.
Combining Figure 11 and Figure 12, it can be seen that the sensitive area of the existing tunnel impact after S1 excavation is in the 26m area on the excavation side of the A end of the new tunnel, and the maximum settlement is 0.11mm at the location of the arch of the existing tunnel, and the minimum settlement is 0.05mm at the location of the tunnel floor at the B end; the maximum settlement of the track floor is 0.09mm, and the minimum settlement is 0.05mm, which occurs at the tunnel end; the settlement value does not change much in the sensitive area, and gradually decreases as it moves away from the sensitive area.
The settlement pattern of the existing tunnel after excavation of S2 and S3 is the same as that of S1, with the maximum and minimum values occurring at the same location, and the influence area expanding to the B-end; the maximum value of the tunnel settlement after excavation of S2 is 0.18mm, and the minimum value is 0.08mm; the maximum settlement of the track base plate is 0.16mm, and the minimum settlement is 0.08mm, and the influence sensitive area expanding to 40m; the maximum value of the tunnel settlement after excavation of S3 is 0.25mm, and the minimum value The maximum value of tunnel settlement after S3 excavation is 0.25mm, the minimum value is 0.12mm; the maximum settlement of track floor is 0.23mm, the minimum settlement is 0.12mm, and the influence sensitive area extends to 90m.
After S4 excavation, the location of the maximum value of the existing tunnel settlement has changed, which occurs in the arch waist position on the excavation side of the new tunnel, 80m from end A, with a settlement value of 0.39mm, affecting the sensitive area in the 100m area on the excavation side of the new tunnel at end A. There is no change in the location of the minimum value of the tunnel settlement and the maximum and minimum value of the track floor, with the maximum settlement of the track floor being 0.35mm, and the minimum settlement of 0.19mm. 0.19mm.
S5 after excavation, the maximum settlement occurs in the new tunnel excavation side arch waist position, 85m from end A, the settlement value is 0.55mm; the maximum settlement of the track base plate occurs 90m from end A, the settlement value is 0.45mm; the tunnel settlement sensitive area moves from end A to the middle of the tunnel.
After S6 excavation, the existing tunnel settlement pattern is the same as that of S5, the maximum settlement value of tunnel and track surface moves to the middle of the tunnel, and the sensitive area of tunnel settlement moves to the middle of the tunnel from the A end, and the settlement changes in the middle of the tunnel are obvious; the maximum settlement value of the tunnel is 0.80mm, and the maximum settlement of the track base plate is 0.63mm.
S7 and S8 excavation tunnel and track surface settlement maximum value occurs in the same location as S6, but the maximum settlement value point from the tunnel arch waist position to the bottom of the arch position to move; S7 excavation tunnel maximum settlement value of 1.23mm, the maximum settlement of the track base plate for 1.04mm; S8 excavation tunnel maximum settlement value of 1.85mm, the maximum settlement of the base plate for 1.66mm; the maximum value of the tunnel to the two ends of the tunnel The maximum settlement value is 1.66mm at both ends of the tunnel, and the settlement becomes smaller in a symmetrical trend.
S9~S12 after excavation, the maximum settlement of tunnel and track surface tends to coincide with the location of the maximum value, which occurs in the location of the tunnel floor, 120m away from the A-end; the tunnel sensitive area occurs in the 120m area on both sides of the maximum settlement value, and the A-end area is larger than the B-end area; the maximum settlement value of the tunnel after excavation of S9 is 2.52mm, and the maximum settlement of the track floor is 2.49mm; the maximum settlement value of the tunnel after excavation of S10 is 2.92mm and that of the track floor is 1.66mm; the maximum value becomes smaller towards both ends of the tunnel. S10 after excavation, the maximum settlement of the tunnel is 2.92mm, and the maximum settlement of the track base plate is 2.92mm; S11 after excavation, the maximum settlement of the tunnel is 3.26mm, and the maximum settlement of the track base plate is 3.24mm; S12 after excavation, the maximum settlement of the tunnel is 3.59mm, and the maximum settlement of the track base plate is 3.51mm; the maximum value of the tunnel is the same as that of the tunnel at the two ends of the settlement law.
The maximum settlement of tunnel and track surface after excavation of S13~S20 is 130m away from the A end of the tunnel floor, and the increase of settlement value is small.
Figure 13 shows the combined settlement curves of the track surface of the existing tunnel under different timing steps. In Figure 13, it can be seen that the maximum settlement of the track surface from S7 to S11 occurs to the right of the left line crossing point. This is because the excavation of the new tunnel is at an angle of 61° with the existing tunnel (as shown in Figure 6), and the left line is the first to be excavated and is three timing steps ahead of the right line, so the left line of the existing tunnel is the first to be affected by the excavation of the new tunnel. As the tunnel excavation progresses, the maximum settlement value gradually approaches the measurement point. At the end of the excavation, it can be observed that the settlement curve is symmetrically distributed based on the measurement points.
From Figure 13, it can be clearly seen that the track surface settlement curve is characterized by significant features: the excavation area of S7~S14 is the sensitive area affected by the excavation of the new tunnel on the existing tunnel, and the settlement changes are large; the settlement of the new tunnel on the existing tunnel is concentrated in the strong disturbance area of 120m at the measurement point, and the weak disturbance area is 60m around the strong disturbance area.
4.2. New Tunnel Blasting
The overall displacement cloud, overall vibration velocity cloud, and Von Mises stress cloud of the rock layer under blasting action were extracted and analyzed in order to determine the area affected by blasting dynamic loads in the new tunnel excavation.
Figure 14 shows the overall displacement of the rock layer under blasting load. As can be seen from Figure 14, with the centerline of the tunnel section as the reference point, the overall displacement of the rock layer under the dynamic blasting load is divided into three zones: the first zone is centered on the reference point, the diameter of the circle of 19.72m, the overall displacement in the range of 0.88~2.11mm; the second zone is the first segment of the circle to the diameter of the circle of the extension to the 27.09m circle, the overall displacement in the range of 0.35~0.88mm; the third zone is the second segment of the circle to the extension to the diameter of 35.24m circle, the overall displacement in the range of 0.35~2.11mm. 0.88mm; the third section is the circular domain of the second section extended outward to the circular domain of 35.24m in diameter, and the overall displacement is 0.35~0.18mm.
As shown in Figure 15, the overall vibration velocity of the rock layer under blasting load is shown in the cloud diagram. As can be seen from Figure 15, with the centerline of the tunnel section as the reference point, the overall vibration velocity of the rock layer under the dynamic blasting load is divided into three zones: the first zone is a circle with a diameter of 19.72m centered on the reference point, and the overall vibration velocity is in the range of 2.53-6.07cm/s; the second zone is a circular domain extending outward from the circular domain of the first zone to a circular domain with a diameter of 25.63m, and the overall displacement is in the range of 1.01-2.53cm/s; the third zone is a circular domain extending outward from the circular domain of the second zone to a circular domain with a diameter of 35.24m. 2.53cm/s; the third section is the circular domain of the second section extended outward to the circular domain of 35.24m in diameter, and the overall displacement is in the range of 0.51~1.01cm/s.
The Von Mises stress cloud of the rock formation under blasting load is shown in Figure 16. As can be seen from Figure 16, with the centerline of the tunnel section as the reference point, the Von Mises stress in the rock layer under dynamic blasting load is divided into three zones: the first zone is a circle with a diameter of 19.72m centered on the reference point, and the Von Mises stress is in the range of 1.25-3.01MPa; the second zone is a circle extending outward from the circle in the first zone to a circle with a diameter of 25.63m, and the Von Mises stress is in the range of 0.50-1.25MPa; and the third zone is a circle in the second zone, and the Von Mises stress is in the range of 0.50-1.25MPa. The second section is the circular domain of the first section extending outward to 25.63m in diameter, and the Von Mises stress is in the range of 0.50~1.25MPa; the third section is the circular domain of the second section extending outward to 30.03m in diameter, and the Von Mises stress is in the range of 0.25~0.50MPa.
Considering the overall displacement map, overall vibration velocity map, Von Mises stress impact area of the rock layer under the action of blasting dynamic load, combined with the impact characteristics of blasting load in tunnel excavation, it is determined to take the center of the datum point in the tunnel section and the circular domain with a diameter of 25.63m as the impact area of blasting dynamic load in the excavation of the new tunnel.
4.3. Existing Tunnel Operation
Overall displacement cloud, overall vibration velocity cloud, and Von Mises stress cloud of the rock layer under train dynamic loading were extracted and analyzed for the purpose of determining the area affected by the dynamic loading of train operation in existing tunnels.
Figure 17 shows a cloud diagram of the overall displacement of the rock formation under the dynamic load of the train. The overall displacement of the rock layer under the dynamic train load is along the axis of the existing tunnel, and the influence range is largest in the center of the dynamic train load application area, and the symmetry decreases to both sides, and the overall course is ellipsoidal. Taking the section at the center of the dynamic load application area of the existing tunnel as the benchmark, three impact zones are quantitatively described: the first zone is distributed within 5m below the track surface, with an irregular semicircular shape, and an overall displacement of 0.10-0.14mm; the second zone is distributed within 40-50m around the tunnel section, with an irregular ellipsoidal shape, and an overall displacement of 0.07-0.10mm; the third zone is distributed within 40-50m around the tunnel section, with an irregular ellipsoidal shape, and an overall displacement of 0.10mm; and the third zone is distributed in the tunnel section, with an overall displacement of 0.10mm. The third zone is distributed in the range of 70~100m around the tunnel section, with an irregular oval shape and an overall displacement of 0.69~0.07mm.
As shown in Figure 18, the overall vibration velocity of the rock layer under the dynamic load of the train is shown in the cloud diagram. From Figure 18, it can be seen that the overall vibration velocity of the rock layer under dynamic train loads varies irregularly along the axis of the existing tunnel, but the overall influence area does not change much. Taking the cross-section at the center of the dynamic load application area of the existing tunnel as the reference, three impact zones are quantitatively described: the first zone is distributed in the track surface area, and the overall vibration velocity is in the range of 1.29~1.94m/s; the second zone is in the range of 6m below the track surface, with the shape of an irregular semicircle, and the overall vibration velocity is in the range of 0.34~1.29m/s; and the third zone is in the range of 10m below the track surface, with the irregular semicircle and the left side wall in the range of 3m. The third zone is in the area of irregular semicircle in the range of 10m below the track surface and the area in the range of 3m on the left side wall, and the overall vibration speed is 0.18~0.34m/s.
The Von Mises stress cloud of the rock formation under the dynamic train load is shown in Figure 19. From Figure 19, it can be seen that the Von Mises stresses under dynamic train loads change irregularly along the axis of the existing tunnel, but the overall influence area does not change much. Taking the section at the center of the dynamic load application area of the existing tunnel as the reference, three impact zones are quantitatively described: the first zone is distributed in the track area, and the Von Mises stresses are in the range of 0.18-0.30MPa; the second zone is in the irregular semicircular area within 3m below the track surface and in the area within 2m of the left side wall, and the Von Mises stresses are in the range of 0.05-0.18MPa; The second section is in the irregular semicircular area within 5m below the track surface and the area within 3m on the left side wall, and the Von Mises stress is 0.03~0.05MPa.
Considering the overall displacement map, overall vibration velocity map and Von Mises stress influence area of the rock layer under the dynamic load of train, and combining with the repetitive characteristics of the dynamic load of train, it is determined that the influence area of the existing tunnel is the range of the second section of the overall displacement. Taking the overall displacement maps as the basic data, the quantification is carried out by AutoCAD software to get the quantified data of the second section of the influence area (Figure 20(a)), and the influence area of the rock layer under the dynamic load of the train is finally determined through the symmetry of the data (Figure 20 (b)): taking the center of the track surface of the existing tunnel as the reference, the influence area is elliptical, with the long axis of 54.75m, and the short axis of 44.96m. The long axis is 54.75m and the short axis is 44.96m.
4.4. Impact Area Determination
Comprehensive analysis of the new tunnel excavation static load on the existing tunnel impact area, the new tunnel excavation blasting dynamic load impact area, the existing tunnel train running dynamic load impact area data, through the entity model to quantify, and finally determine the two-lane highway tunnel under the existing railroad tunnel excavation impact area.
As shown in Figure 21, the new tunnel excavation static load influence area: 40mI area on both sides of the center of the crossing point is the strong disturbance area of the new tunnel excavation, 40mII area on both sides of the strong disturbance area is the weak disturbance area, and III area is the micro-disturbance area. As shown in Figure 22, there is a heterogeneous overlapping area with a length of 25.30m, a width of 18.30m and a volume of 499.73m3 in the dynamic loaded area of the new tunnel excavation and the dynamic loaded area of the existing tunnel train operation.
5. Conclusions and Discussion
In this paper, the excavation impact area of a two-lane new highway tunnel passing through an existing railroad tunnel is investigated. A finite element three-dimensional analysis model is constructed, and the impact area of the tunnel under three kinds of loads is investigated by applying the static load of the new tunnel excavation, the dynamic load of the new tunnel blasting excavation, and the dynamic load of the train running in the existing tunnel for simulation calculation.
The results of the study show that there are strong and weak disturbance zones in the influence area of new tunnel excavation static loads on existing tunnels; and there are heterogeneous superimposed influence areas in the influence area of new tunnel excavation blasting dynamic loads and dynamic train operation loads in existing tunnels. In this paper, a method of determining the influence area of dynamic and static loads on new tunnel excavation and existing tunnels is identified, which can provide reference for similar projects in the future.
Numerical simulation software is used to further analyze and come up with the following conclusions:
- (1)
- The region of influence of the static load of new tunnel excavation on the existing tunnel. Existing tunnels from the center of the intersection to both sides of 120m for the strong disturbance area, strong disturbance area on both sides of 60m for the weak disturbance area, and other micro-disturbance area; intersection of the center of both sides of 40m for the new tunnel excavation of the strong disturbance area, strong disturbance area on both sides of 40m for the weak disturbance area, and other micro-disturbance area.
- (2)
- New tunnel excavation blasting dynamic load impact area. Tunnel section in the center of the reference point, 25.63m diameter circle for the new tunnel excavation blasting dynamic load impact area.
- (3)
- the existing tunnel train running dynamic load impact area. The center of the existing tunnel track surface as a reference, the impact area is oval, the long axis of 54.75m, the short axis of 44.96m.
- (4)
- Overlapping influence area. The dynamic load impact area of the new tunnel blasting excavation and the dynamic load impact area of the existing tunnel train operation have a heteromorphic superimposed impact area of 25.30m in length, 18.30m in width and 499.73m3 in volume.
Comprehensive comparison found that the new tunnel excavation static load influence area is the largest, followed by excavation and blasting dynamic load, the existing tunnel train operation dynamic load area is the smallest, and there is a heterogeneous overlap influence area between the new tunnel excavation and blasting dynamic load influence area and the existing tunnel train operation dynamic load. The method of determining the overlap region in the current study also needs to be enriched, and less attention is paid to the mechanical effect of the overlap region of influence.
This paper only considered the overall displacement and deformation cases when studying the static loads of new tunnel excavation, ignoring the lateral deformation, transverse internal force and torsional deformation effects. At the same time, the study of the tunnel impact area is based on finite element simulation software, the accuracy of which is affected by the mesh density and calculation parameters, and it is only an approximate numerical solution, which lacks on-site monitoring data to verify the accuracy of the anisotropic overlap area proposed in the numerical simulation.
Therefore, perfecting the effect of excavation static load on the tunnel and verifying the accuracy of the simulation results by combining with on-site monitoring data are the topics that need to be further studied.
Author Contributions
Methodology, Y.L.; Formal analysis, Y.L., C.H. and H.L.; Resources, C.H.; Data.curation, C.H., H.L. and C.M.; Writing—original draft, C.H., H.L. and C.M.; Writing—review & editing,H.L. and C.M.; Visualization, C.H., H.L. and C.M.; Funding acquisition, Y.L. All authors have read and agreed to the published version of the manuscript.
Funding
This work is supported by the Hongjian Lu: Natural Science Foundation of Hebei Province (No. E2021209006).
Institutional Review Board Statement
Not applicable.
Informed Consent Statement
Not applicable.
Data Availability Statement
Data sharing is not applicale.
Conflicts of Interest
The authours declare no conflict of interest.
References
- CHEN Z L, CHEN J Y, LIU H, et al. Present status and development trends of underground space in Chinese cities: Evaluation and analysis [J]. Tunnelling and Underground Space Technology, 2018, 71: 253-70. [CrossRef]
- DEBROCK S, VAN ACKER M, ADMIRAAL H. Design recommendations for sustainable urban underground spaces [J]. Tunnelling and Underground Space Technology, 2023, 140. [CrossRef]
- VON DER TANN L, STERLING R, ZHOU Y X, et al. Systems approaches to urban underground space planning and management - A review [J]. Underground Space, 2020, 5(2): 144-66. [CrossRef]
- CHENG H Z, CHEN J, CHEN G L. Analysis of ground surface settlement induced by a large EPB shield tunnelling: a case study in Beijing, China [J]. Environmental Earth Sciences, 2019, 78(20). [CrossRef]
- ISLAM M S, ISKANDER M. Twin tunnelling induced ground settlements: A review [J]. Tunnelling and Underground Space Technology, 2021, 110. [CrossRef]
- SHI J W, NG C W W, CHEN Y H. A simplified method to estimate three-dimensional tunnel responses to basement excavation [J]. Tunnelling and Underground Space Technology, 2017, 62: 53-63. [CrossRef]
- XIE X Y, YANG Y B, JI M. Analysis of ground surface settlement induced by the construction of a large-diameter shield-driven tunnel in Shanghai, China [J]. Tunnelling and Underground Space Technology, 2016, 51: 120-32. [CrossRef]
- WENG X L, SUN Y F, YAN B H, et al. Centrifuge testing and numerical modeling of tunnel face stability considering longitudinal slope angle and steady state seepage in soft clay [J]. Tunnelling and Underground Space Technology, 2020, 101. [CrossRef]
- YIN X S, CHEN R P, MENG F Y. Influence of seepage and tunnel face opening on face support pressure of EPB shield [J]. Computers and Geotechnics, 2021, 135. [CrossRef]
- ZOU J F, QIAN Z H. Face-Stability Analysis of Tunnels Excavated below Groundwater Considering Coupled Flow Deformation [J]. International Journal of Geomechanics, 2018, 18(8). [CrossRef]
- LI Y Q, ZHANG W G. Investigation on passive pile responses subject to adjacent tunnelling in anisotropic clay [J]. Computers and Geotechnics, 2020, 127. [CrossRef]
- NEMATOLLAHI M, DIAS D. Three-dimensional numerical simulation of pile-twin tunnels interaction - Case of the Shiraz subway line [J]. Tunnelling and Underground Space Technology, 2019, 86: 75-88. [CrossRef]
- PHUTTHANANON C, LERTKULTANON S, JONGPRADIST P, et al. Numerical investigation on the responses of existing single piles due to adjacent twin tunneling considering the lagging distance [J]. Underground Space, 2023, 11: 171-88. [CrossRef]
- FANG Q, ZHANG D L, LI Q Q, et al. Effects of twin tunnels construction beneath existing shield-driven twin tunnels [J]. Tunnelling and Underground Space Technology, 2015, 45: 128-37. [CrossRef]
- NG C W W, FONG K Y, LIU H L. The effects of existing horseshoe-shaped tunnel sizes on circular crossing tunnel interactions: Three-dimensional numerical analyses [J]. Tunnelling and Underground Space Technology, 2018, 77: 68-79. [CrossRef]
- YIN M L, JIANG H, JIANG Y S, et al. Effect of the excavation clearance of an under-crossing shield tunnel on existing shield tunnels [J]. Tunnelling and Underground Space Technology, 2018, 78: 245-58. [CrossRef]
- CHAKERI H, OZCELIK Y, UNVER B. Effects of important factors on surface settlement prediction for metro tunnel excavated by EPB [J]. Tunnelling and Underground Space Technology, 2013, 36: 14-23. [CrossRef]
- GUE C Y, WILCOCK M J, ALHADDAD M M, et al. Tunnelling close beneath an existing tunnel in clay - perpendicular undercrossing [J]. Geotechnique, 2017, 67(9): 795-807. [CrossRef]
- AVGERINOS V, POTTS D M, STANDING J R. Numerical investigation of the effects of tunnelling on existing tunnels [J]. Geotechnique, 2017, 67(9): 808-22. [CrossRef]
- CHEN R P, LIN X T, KANG X, et al. Deformation and stress characteristics of existing twin tunnels induced by close-distance EPBS under-crossing [J]. Tunnelling and Underground Space Technology, 2018, 82: 468-81. [CrossRef]
- SHI J W, WANG Y, NG C W W. Three-Dimensional Centrifuge Modeling of Ground and Pipeline Response to Tunnel Excavation [J]. Journal of Geotechnical and Geoenvironmental Engineering, 2016, 142(11). [CrossRef]
- LIN X T, CHEN R P, WU H N, et al. Deformation behaviors of existing tunnels caused by shield tunneling undercrossing with oblique angle [J]. Tunnelling and Underground Space Technology, 2019, 89: 78-90. [CrossRef]
- NG C W W, WONG Y Y A, SHAKEEL M. Effects of the skew angle of new tunneling on an existing tunnel: three-dimensional centrifuge and numerical modeling [J]. Canadian Geotechnical Journal, 2022. [CrossRef]
- SHIN J H, MOON H G, CHAE S E. Effect of blast-induced vibration on existing tunnels in soft rocks [J]. Tunnelling and Underground Space Technology, 2011, 26(1): 51-61. [CrossRef]
- ZHAO H B, LONG Y, LI X H, et al. Experimental and numerical investigation of the effect of blast-induced vibration from adjacent tunnel on existing tunnel [J]. Ksce Journal of Civil Engineering, 2016, 20(1): 431-9. [CrossRef]
- TIAN X X, SONG Z P, WANG J B. Study on the propagation law of tunnel blasting vibration in stratum and blasting vibration reduction technology [J]. Soil Dynamics and Earthquake Engineering, 2019, 126. [CrossRef]
- DUAN B F, GONG W Z, TA G S, et al. Influence of Small, Clear Distance Cross-Tunnel Blasting Excavation on Existing Tunnel below [J]. Advances in Civil Engineering, 2019, 2019. [CrossRef]
- CAO F, ZHANG S, LING T H. Blasting-Induced Vibration Response of the Transition Section in a Branching-Out Tunnel and Vibration Control Measures [J]. Advances in Civil Engineering, 2020, 2020. [CrossRef]
- RUAN J B, WANG T H, ZHAO Z K, et al. Discussion on Blasting Vibration Velocity of Deep Rock Mass Considering Thickness of Overlying Soil Layer [J]. Periodica Polytechnica-Civil Engineering, 2023. [CrossRef]
- GHAREHDASH S, BARZEGAR M. Numerical modeling of the dynamic behaviour of tunnel lining in shield tunneling [J]. Ksce Journal of Civil Engineering, 2015, 19(6): 1626-36. [CrossRef]
- MA M, LIU W N, QIAN C Y, et al. Study of the train-induced vibration impact on a historic Bell Tower above two spatially overlapping metro lines [J]. Soil Dynamics and Earthquake Engineering, 2016, 81: 58-74. [CrossRef]
- LAI J X, WANG K Y, QIU J L, et al. Vibration Response Characteristics of the Cross Tunnel Structure [J]. Shock and Vibration, 2016, 2016. [CrossRef]
- HUANG Q, HUANG H W, YE B, et al. Dynamic response and long-term settlement of a metro tunnel in saturated clay due to moving train load [J]. Soils and Foundations, 2017, 57(6): 1059-75. [CrossRef]
- YAN Q X, SONG L Y, CHEN H, et al. Dynamic Response of Segment Lining of Overlapped Shield Tunnels Under Train-Induced Vibration Loads [J]. Arabian Journal for Science and Engineering, 2018, 43(10): 5439-55. [CrossRef]
- DONG J, ZHONG S, WANG H L, et al. Dynamic response characteristics of crossing tunnels under heavy-haul train loads [J]. Geomechanics and Engineering, 2020, 20(2): 103-12. [CrossRef]
- ZHANG X, ZHANG M X, JAVADI A A. Influence of a Super-Large Diameter Shield Tunnel Excavation on the Lining Structure of the Metro Lines in Operation [J]. Iranian Journal of Science and Technology-Transactions of Civil Engineering, 2023. [CrossRef]
- GALLI G, GRIMALDI A, LEONARDI A. Three-dimensional modelling of tunnel excavation and lining [J]. Computers and Geotechnics, 2004, 31(3): 171-83. [CrossRef]
- WANG W H, WANG L L, DU Y Z, et al. Numerical and experimental analysis on motion performance of new sandglass-type floating body in waves [J]. Marine Structures, 2016, 46: 56-77. [CrossRef]
- YANG C S, MO H H, CHEN J S, et al. Influence of Seismic Loading on Segment Opening of a Shield Tunnel [J]. Scientific World Journal, 2014. [CrossRef]
- LAI J X, GUO C X, QIU J L, et al. Static Analytical Approach of Moderately Thick Cylindrical Ribbed Shells Based on First-Order Shear Deformation Theory [J]. Mathematical Problems in Engineering, 2015, 2015. [CrossRef]
- NEJATI H R, AHMADI M, HASHEMOLHOSSEINI H. Numerical analysis of ground surface vibration induced by underground train movement [J]. Tunnelling and Underground Space Technology, 2012, 29: 1-9. [CrossRef]
- SHI C H, ZHAO Y W, ZHAO C Y, et al. Water-Sealed Blasting Control Measures of the Metro Station Undercrossing Existing Structures in Ultra-Close Distances: A Case Study [J]. Frontiers in Earth Science, 2022, 10. [CrossRef]
- WU X D, GONG M, WU H J, et al. Vibration reduction technology and the mechanisms of surrounding rock damage from blasting in neighborhood tunnels with small clearance [J]. International Journal of Mining Science and Technology, 2023, 33(5): 625-37. [CrossRef]
- YE F, HE C, WANG S M, et al. Landscape design of mountain highway tunnel portals in China [J]. Tunnelling and Underground Space Technology, 2012, 29: 52-68. [CrossRef]
- LAI J X, MAO S, QIU J L, et al. Investigation Progresses and Applications of Fractional Derivative Model in Geotechnical Engineering [J]. Mathematical Problems in Engineering, 2016, 2016. [CrossRef]
Figure 1.
Spatial relationship diagram of the underpass tunnel project.
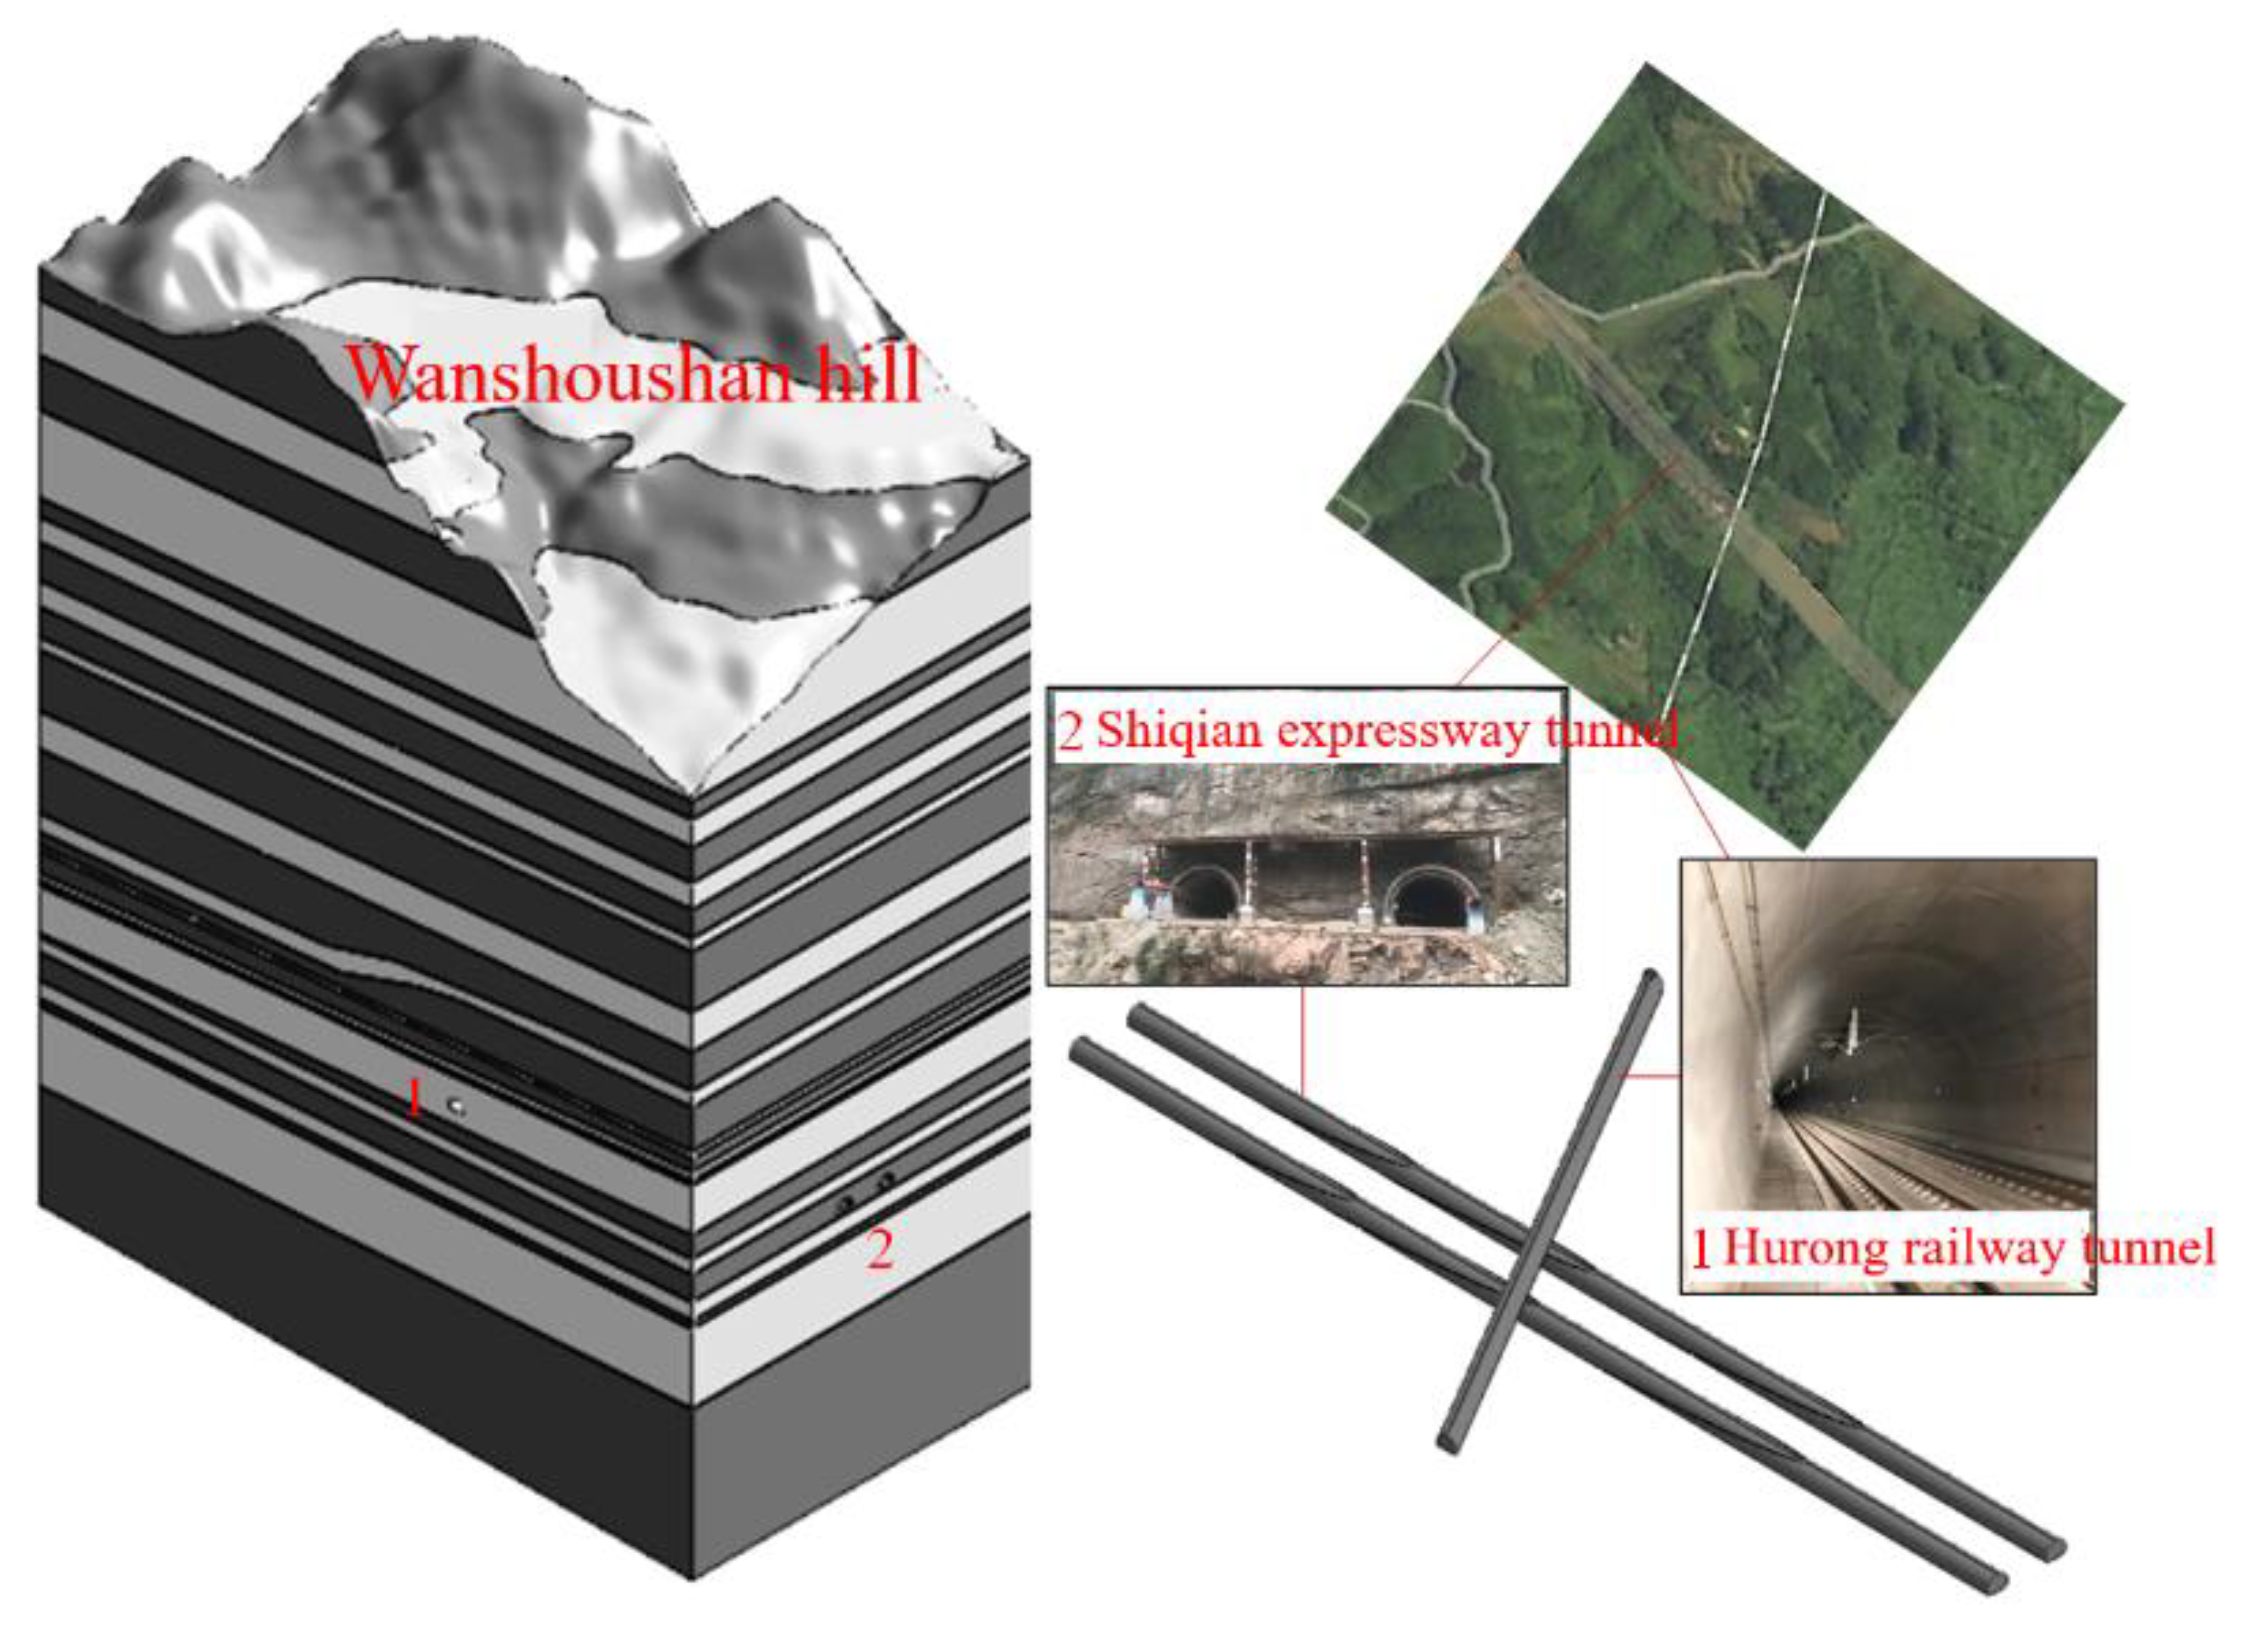
Figure 2.
Three-dimensional spatial key data of the underpass tunnel project.
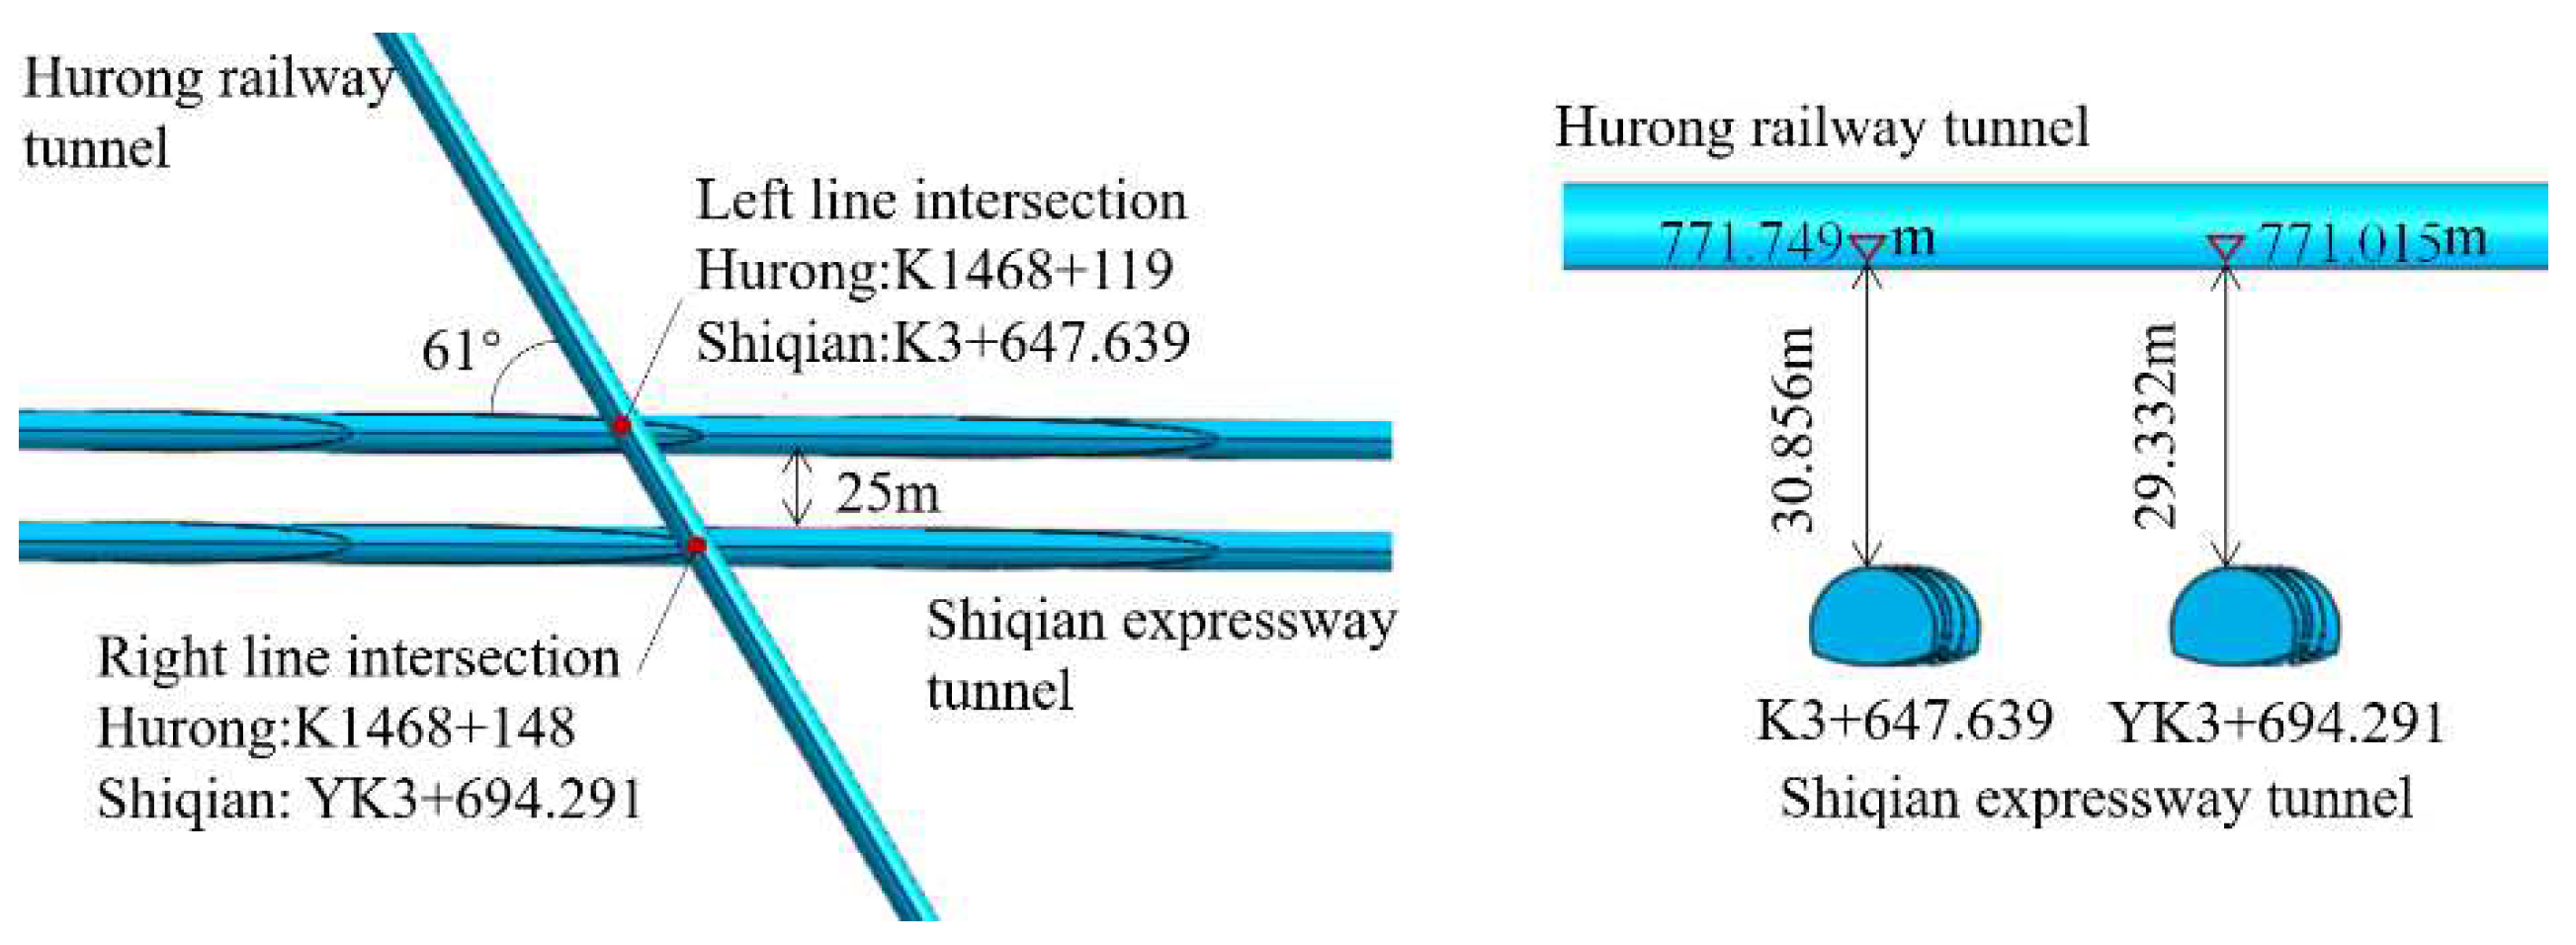
Figure 3.
Cross-section of rock layer and surrounding rock grade distribution of Wanshoushan Highway Tunnel of Shiqian Expressway.
Figure 3.
Cross-section of rock layer and surrounding rock grade distribution of Wanshoushan Highway Tunnel of Shiqian Expressway.
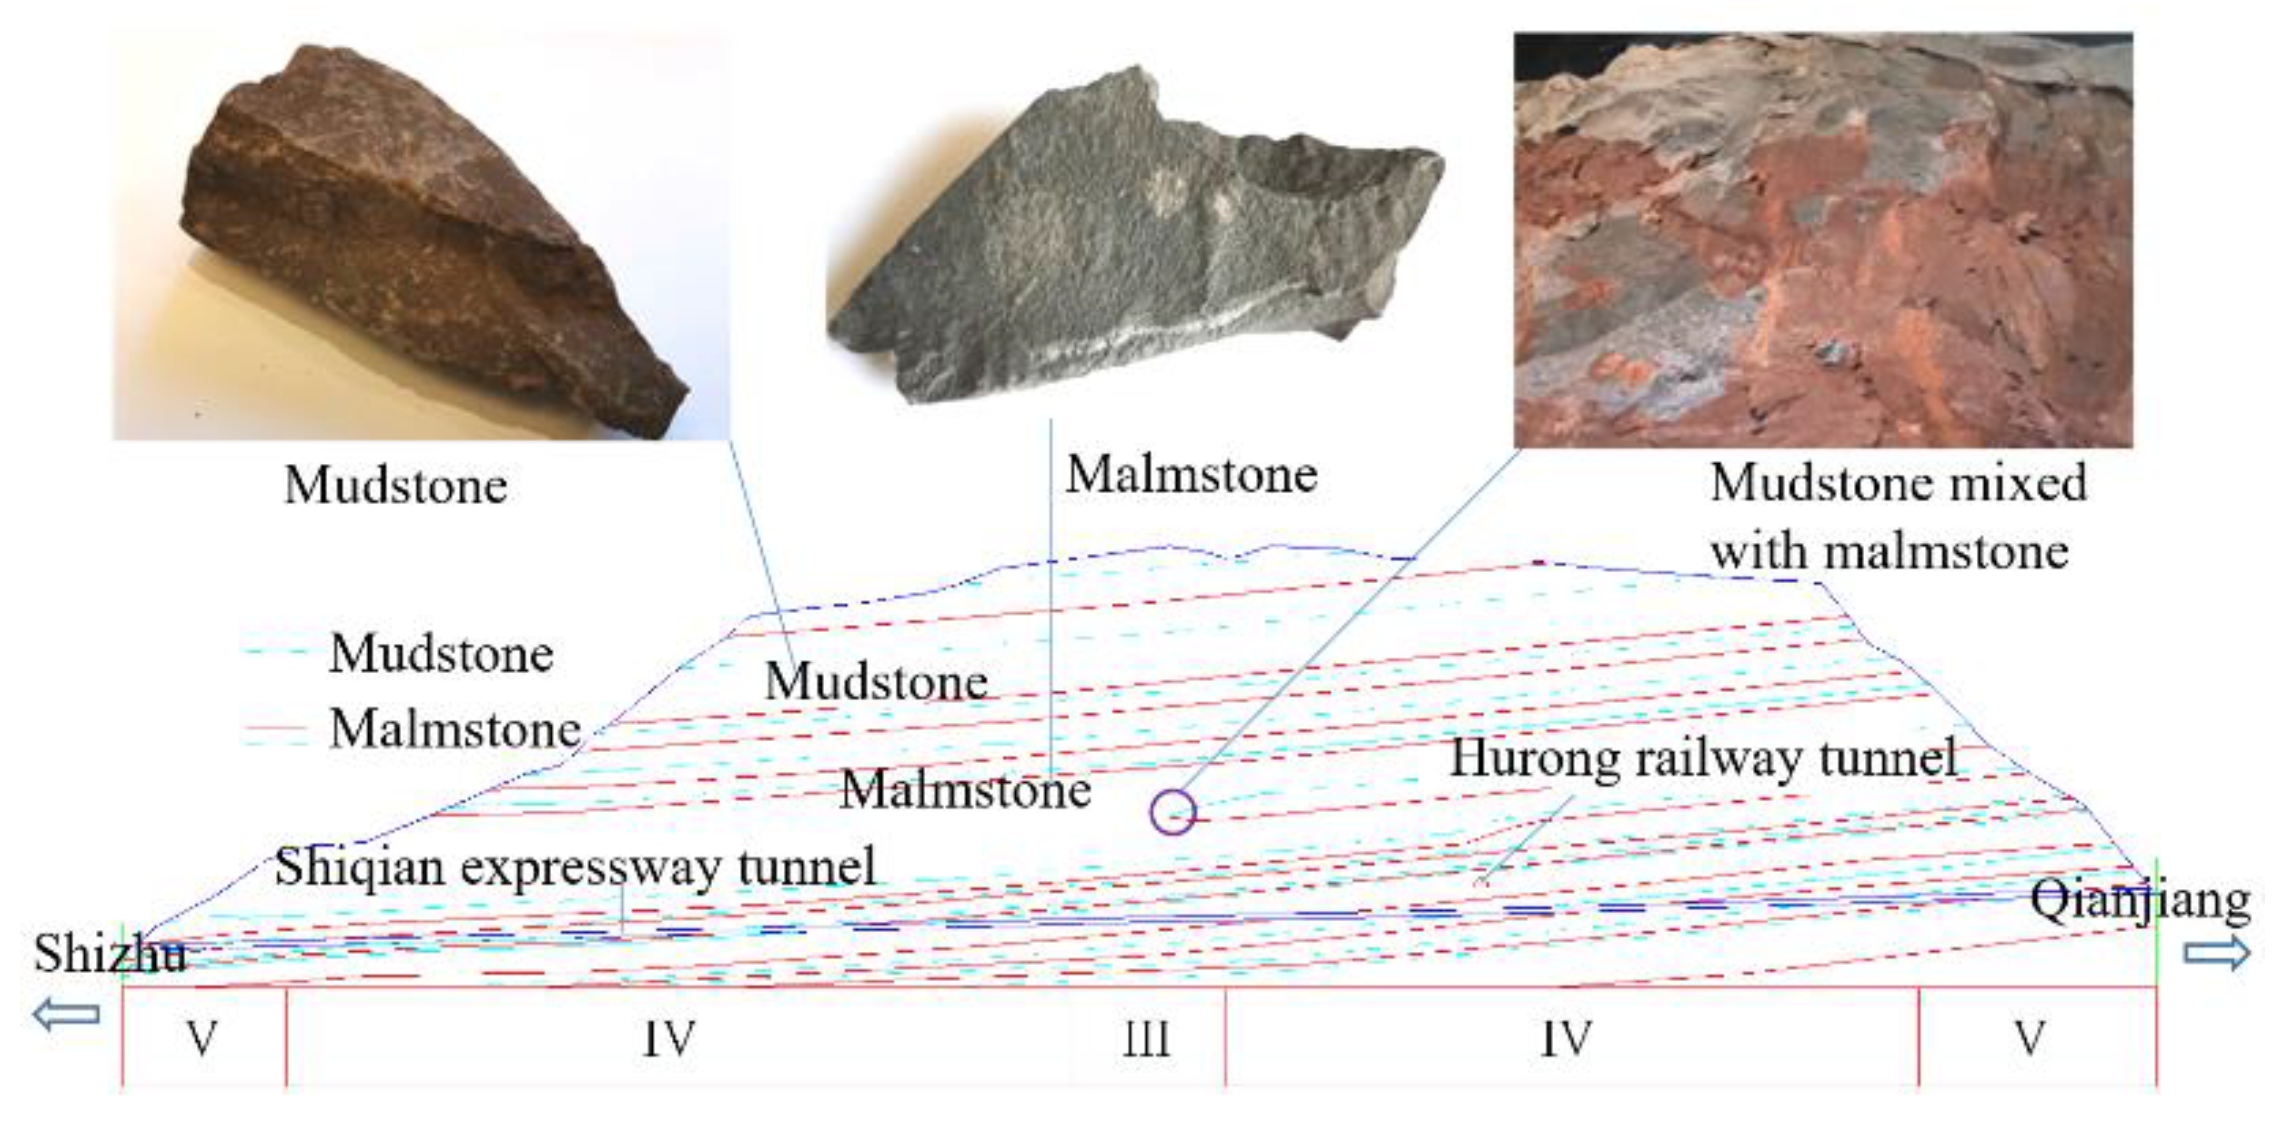
Figure 4.
D solid model building steps: (a) geological topographic map; (b) CAD digitization; (c) TGM ground surface; (d) stratigraphic profile; (e) 3-D solid model.
Figure 4.
D solid model building steps: (a) geological topographic map; (b) CAD digitization; (c) TGM ground surface; (d) stratigraphic profile; (e) 3-D solid model.
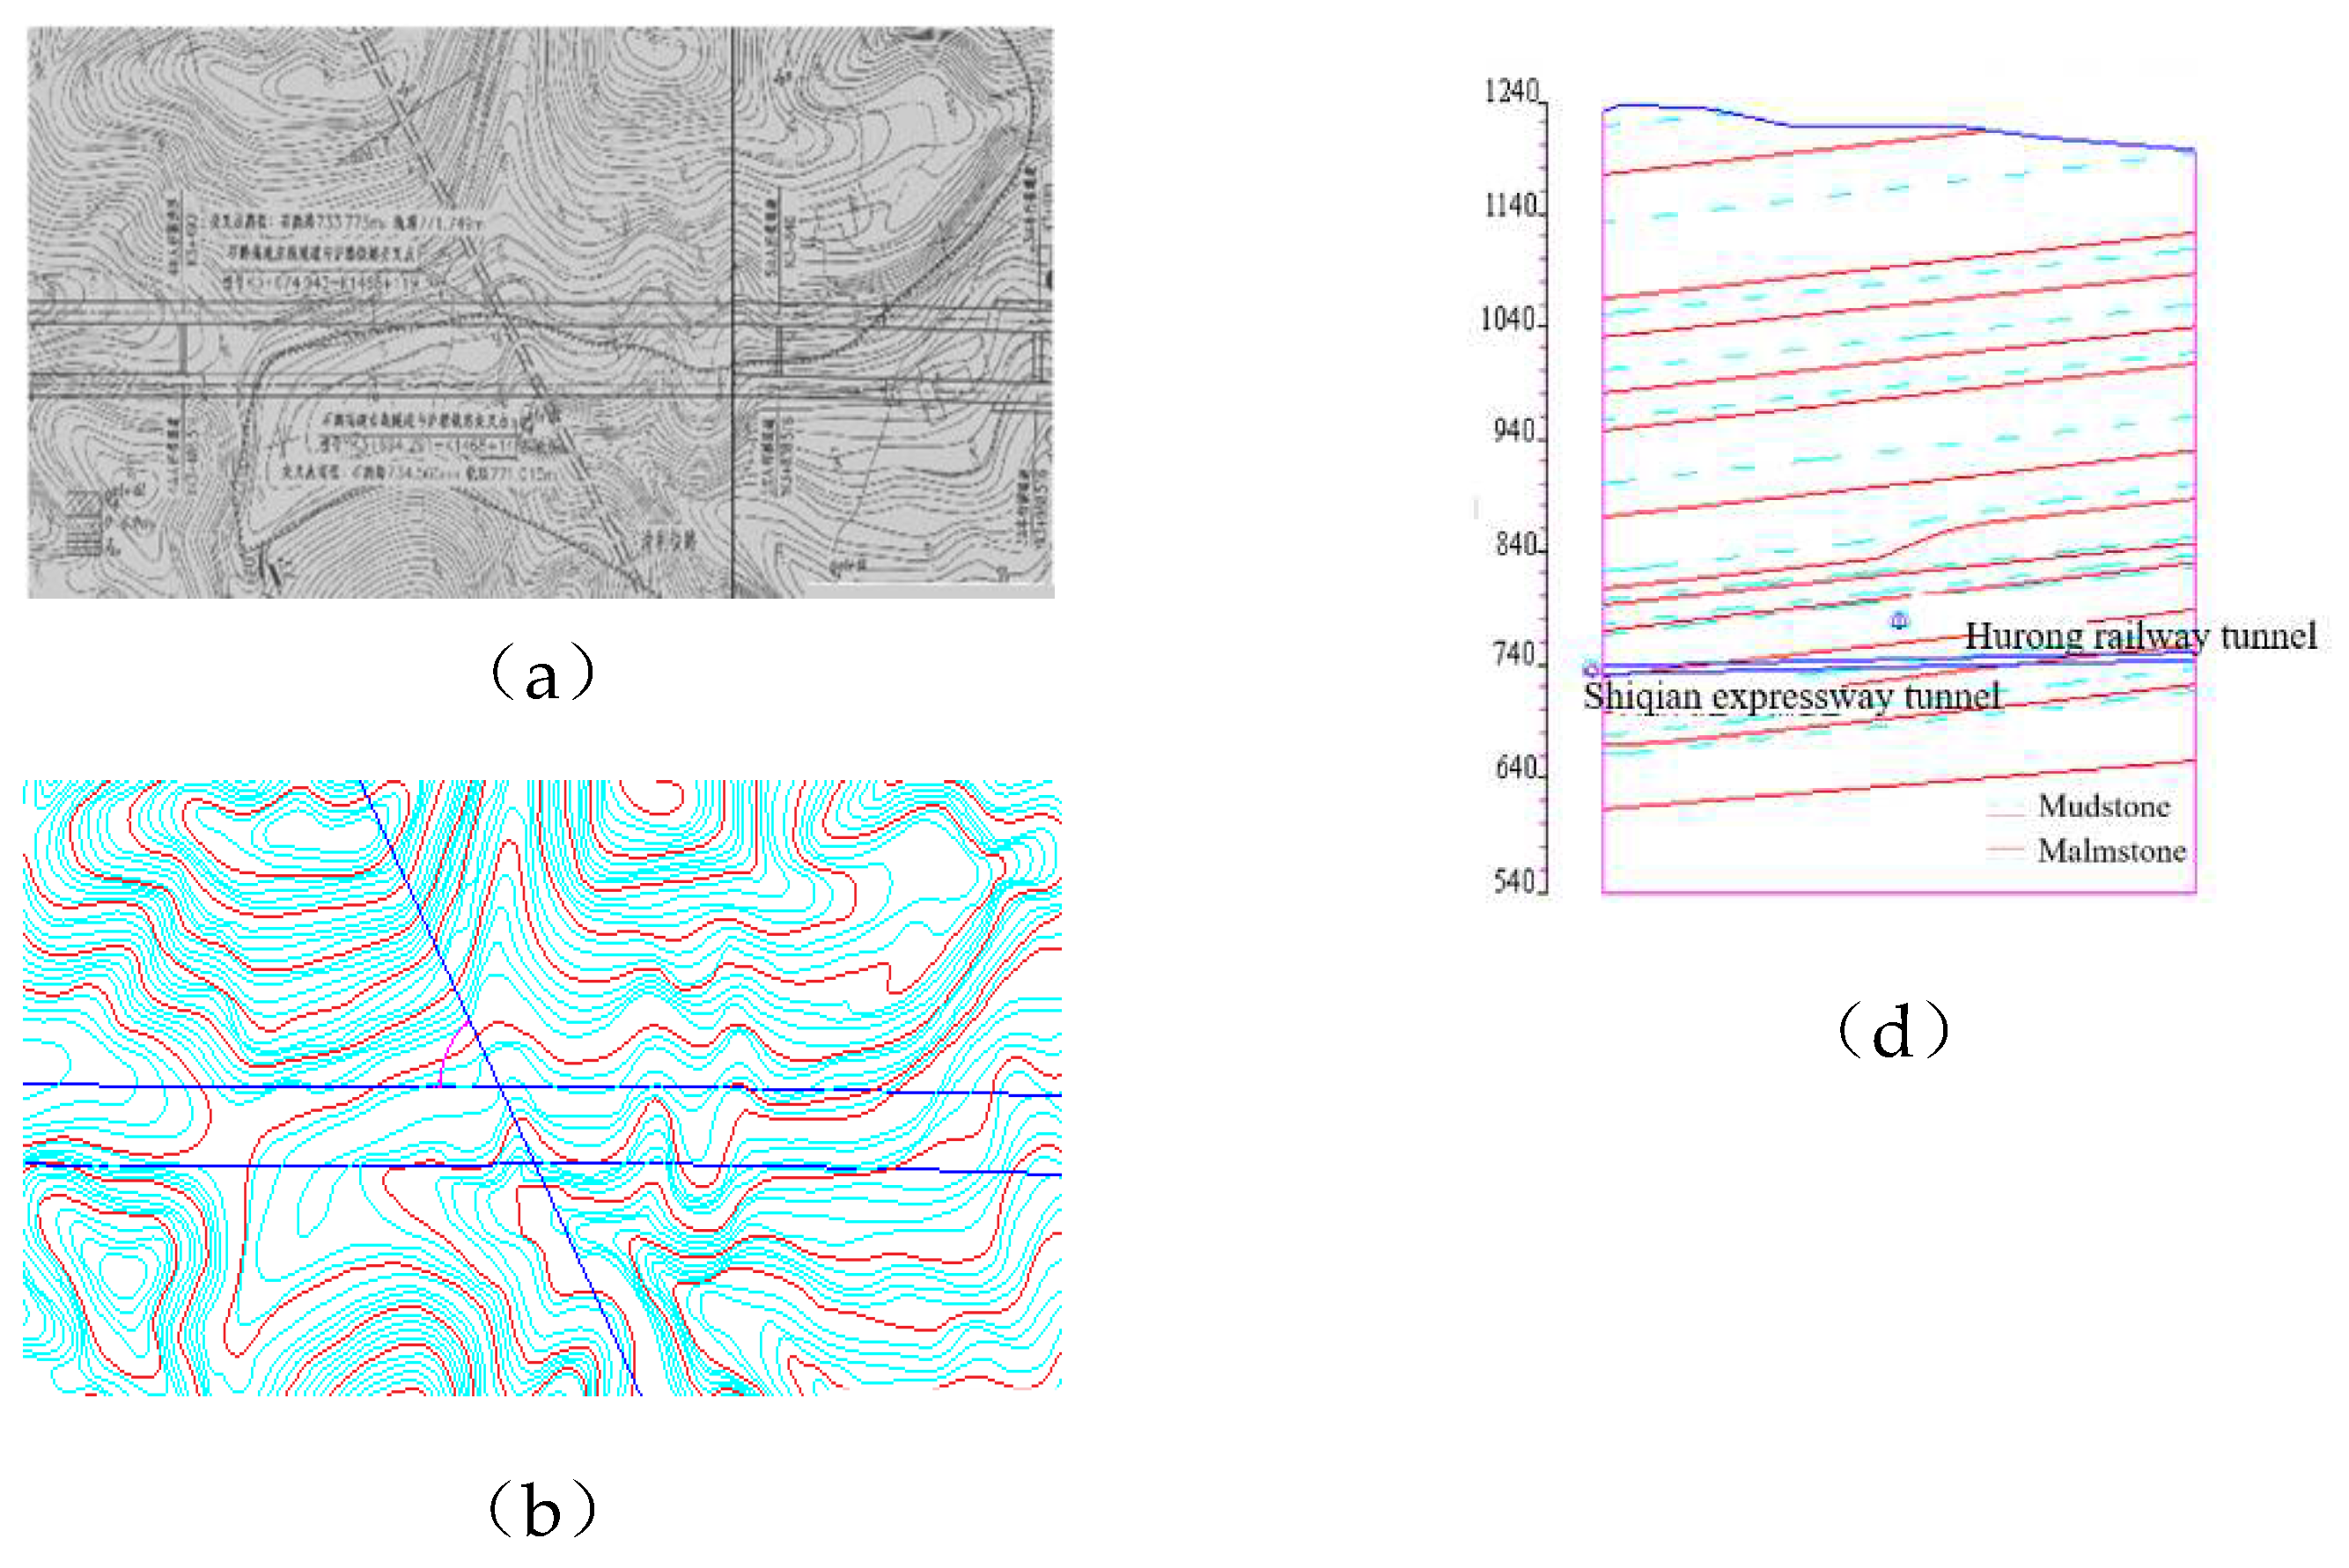
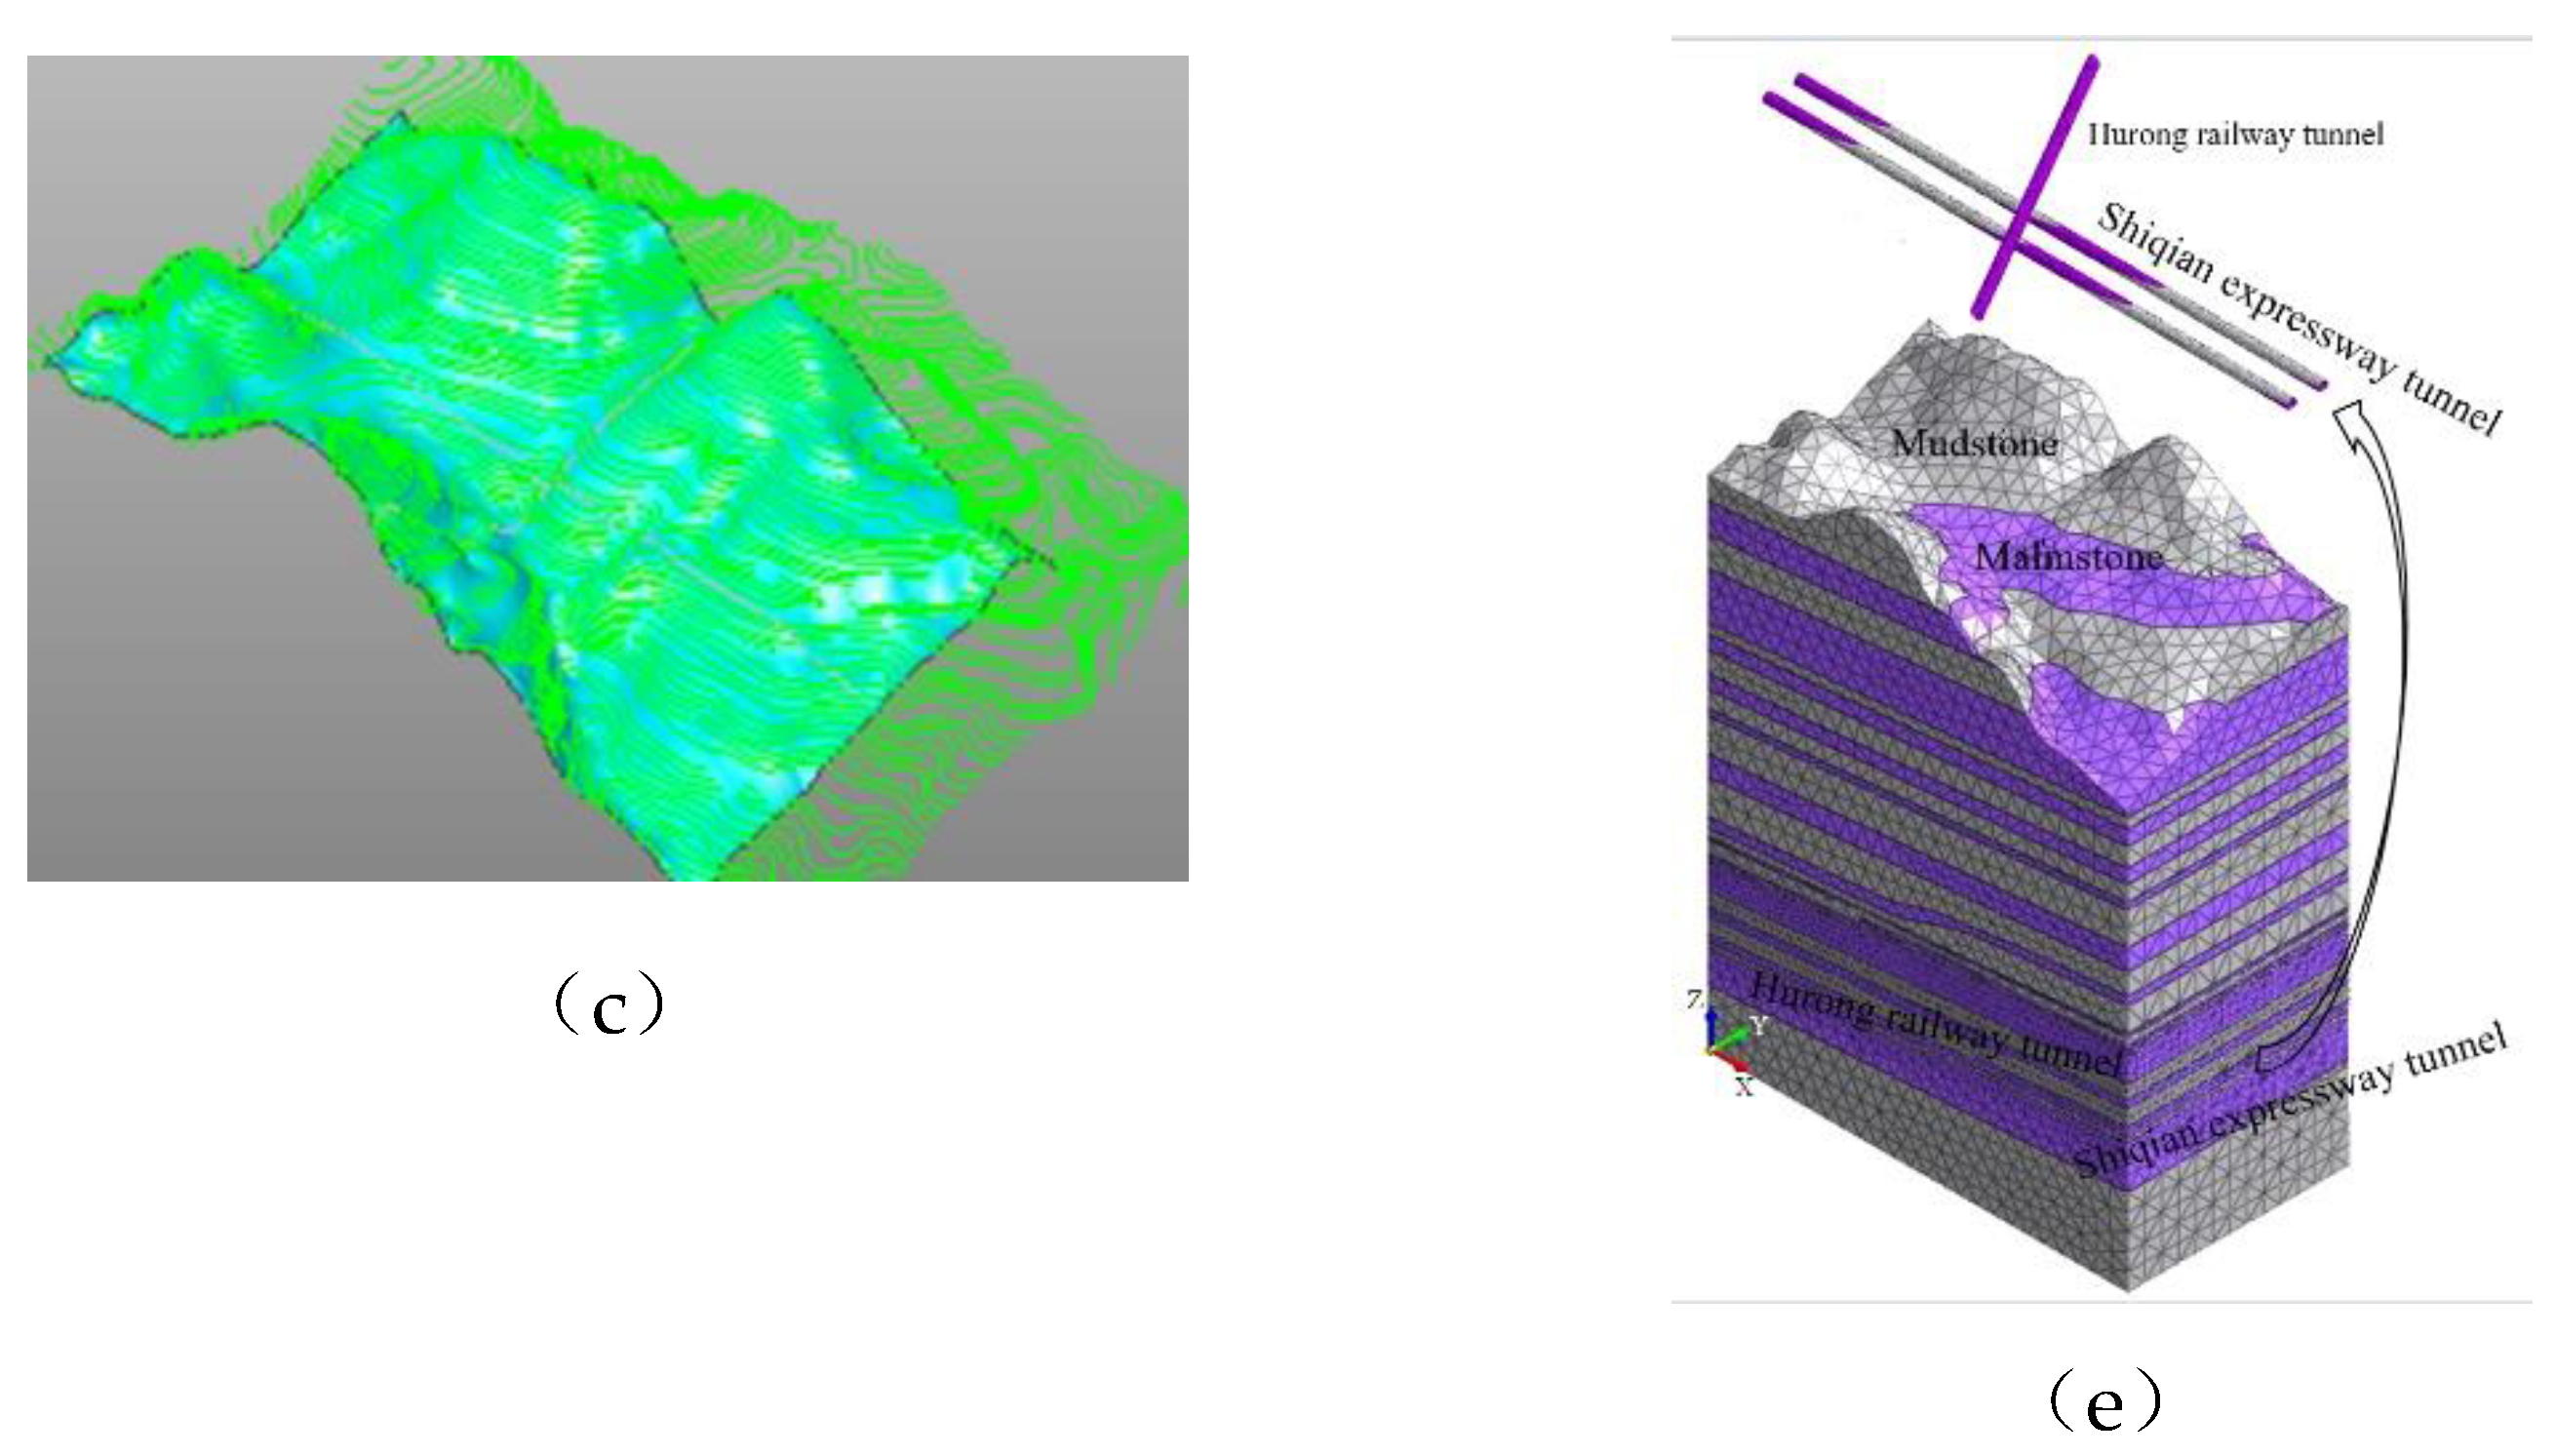
Figure 5.
Cross-section of peripheral rock support of Shiqian Wanshoushan Highway Tunnel.
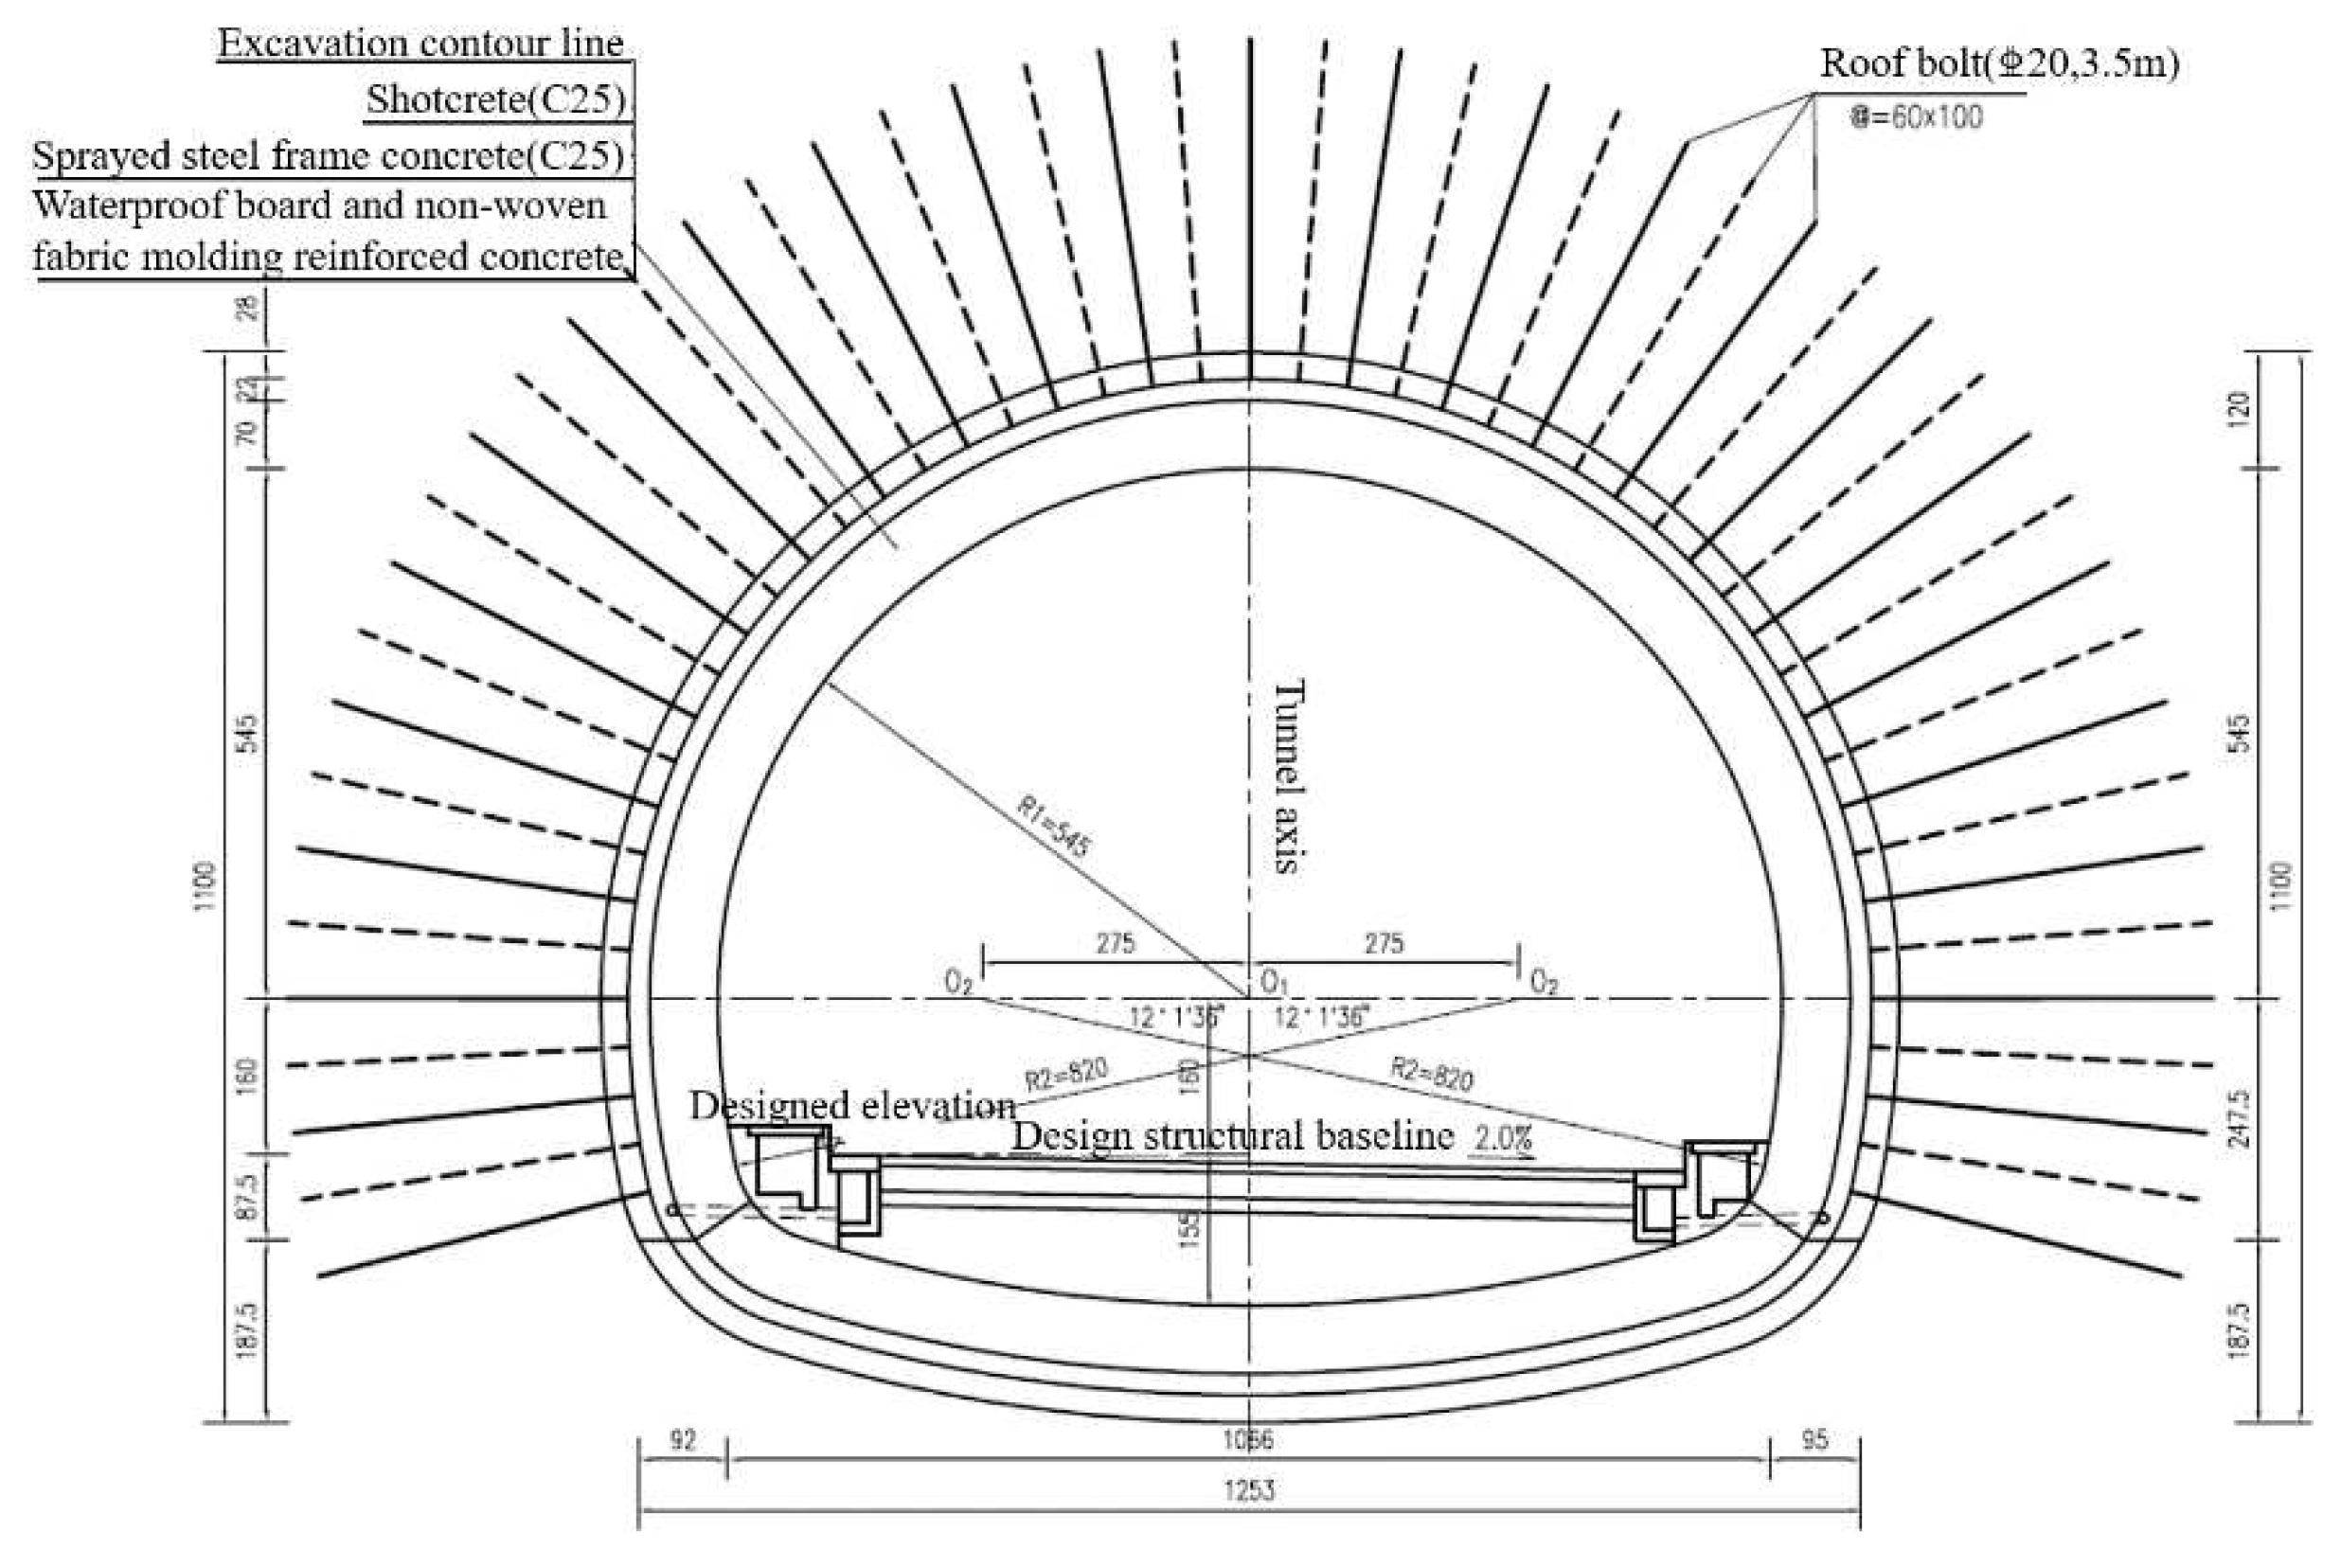
Figure 6.
Time-step diagram for extracting excavation data for new tunnels.
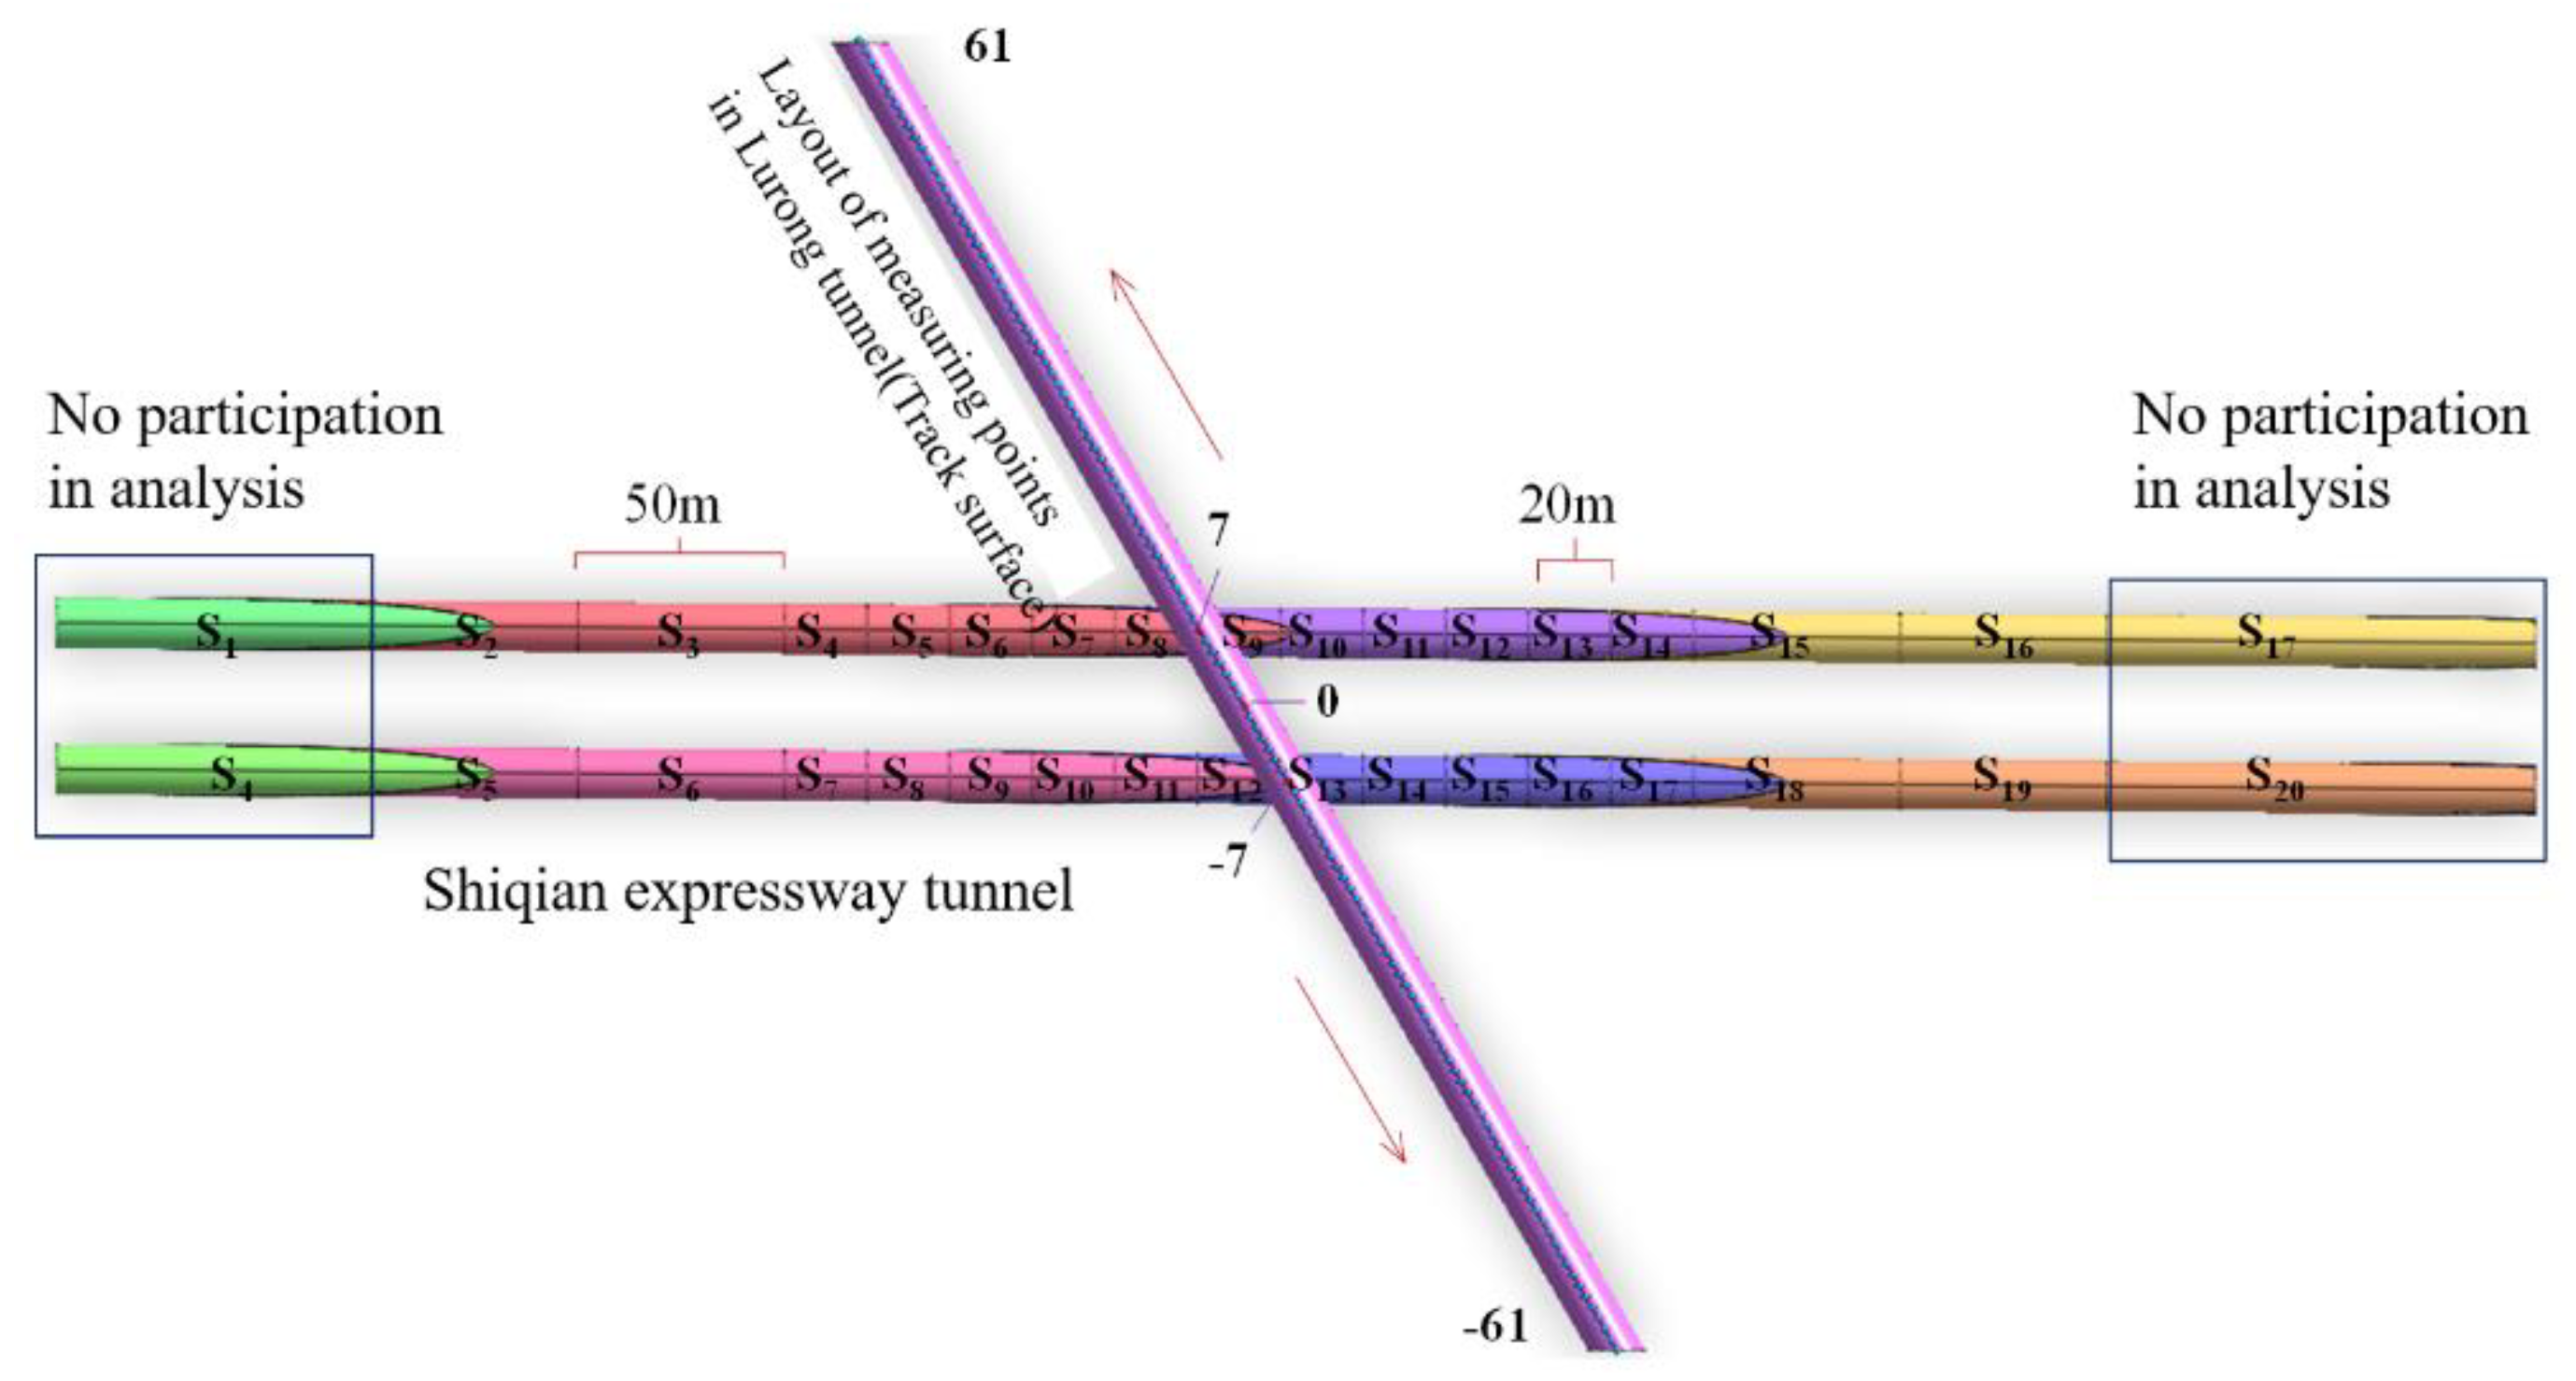
Figure 7.
Graph of eigenvalue analysis results.
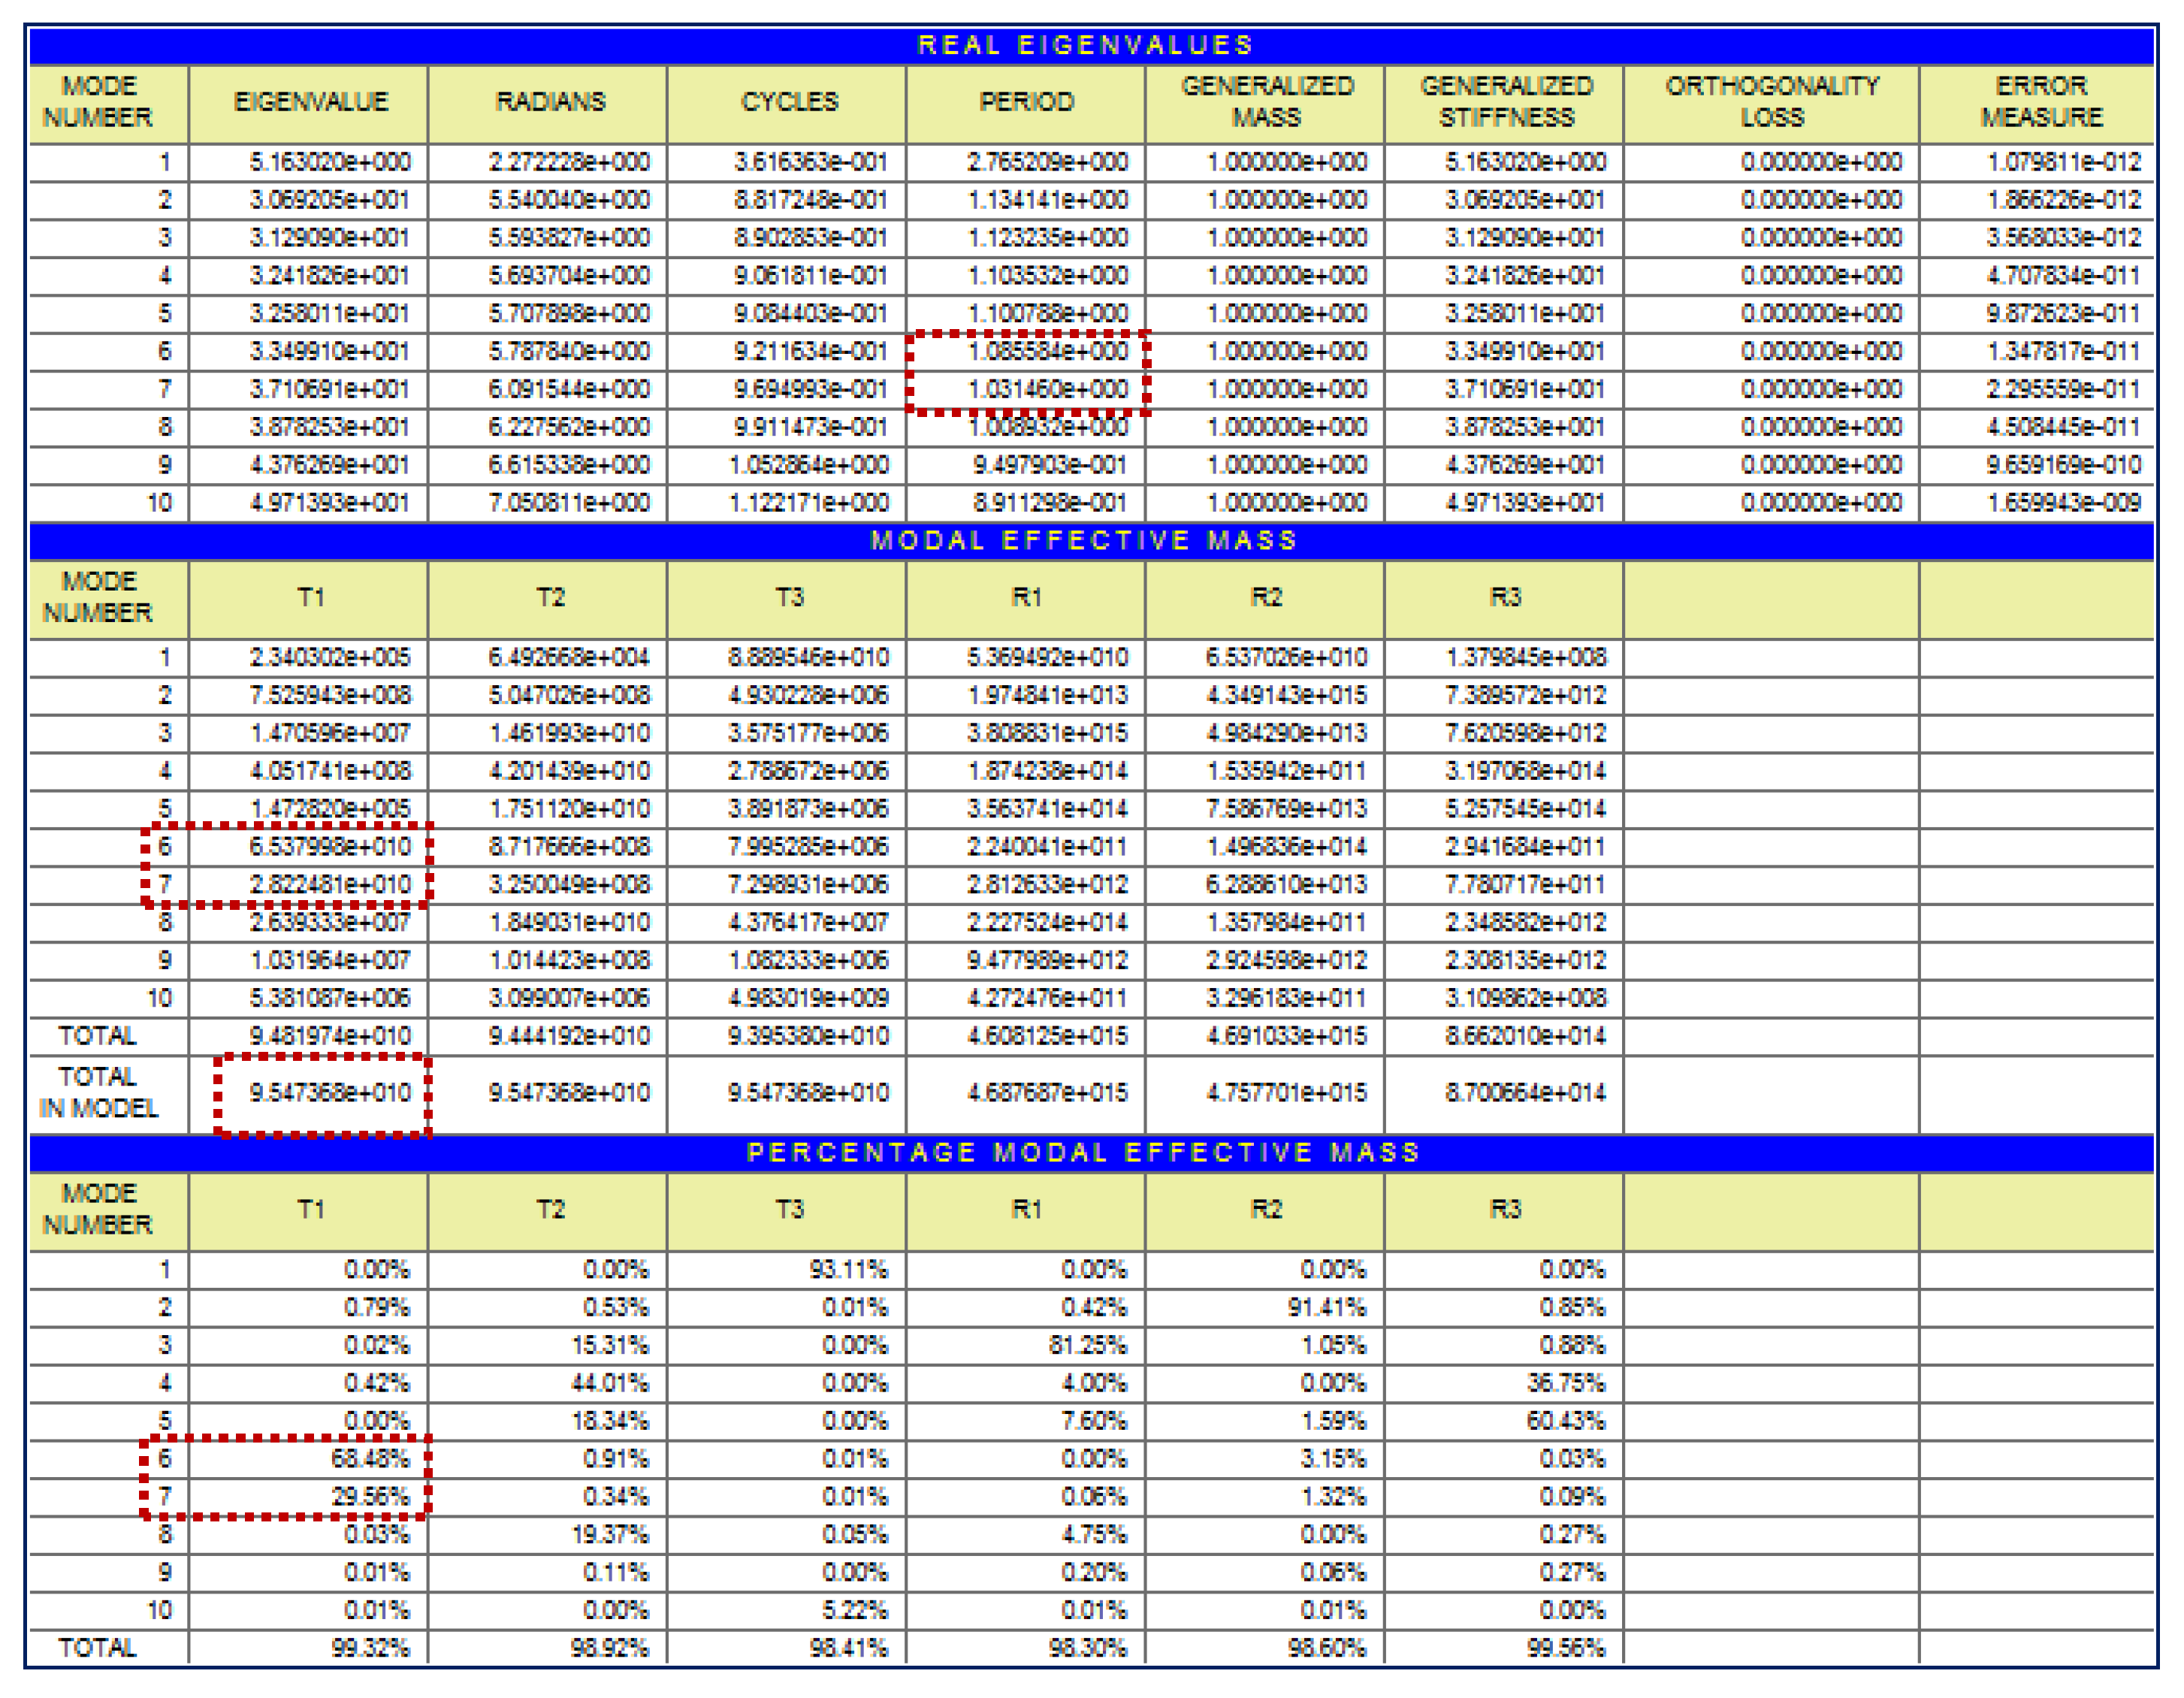
Figure 8.
Design cross-section of blasting holes for upper and lower step excavation.
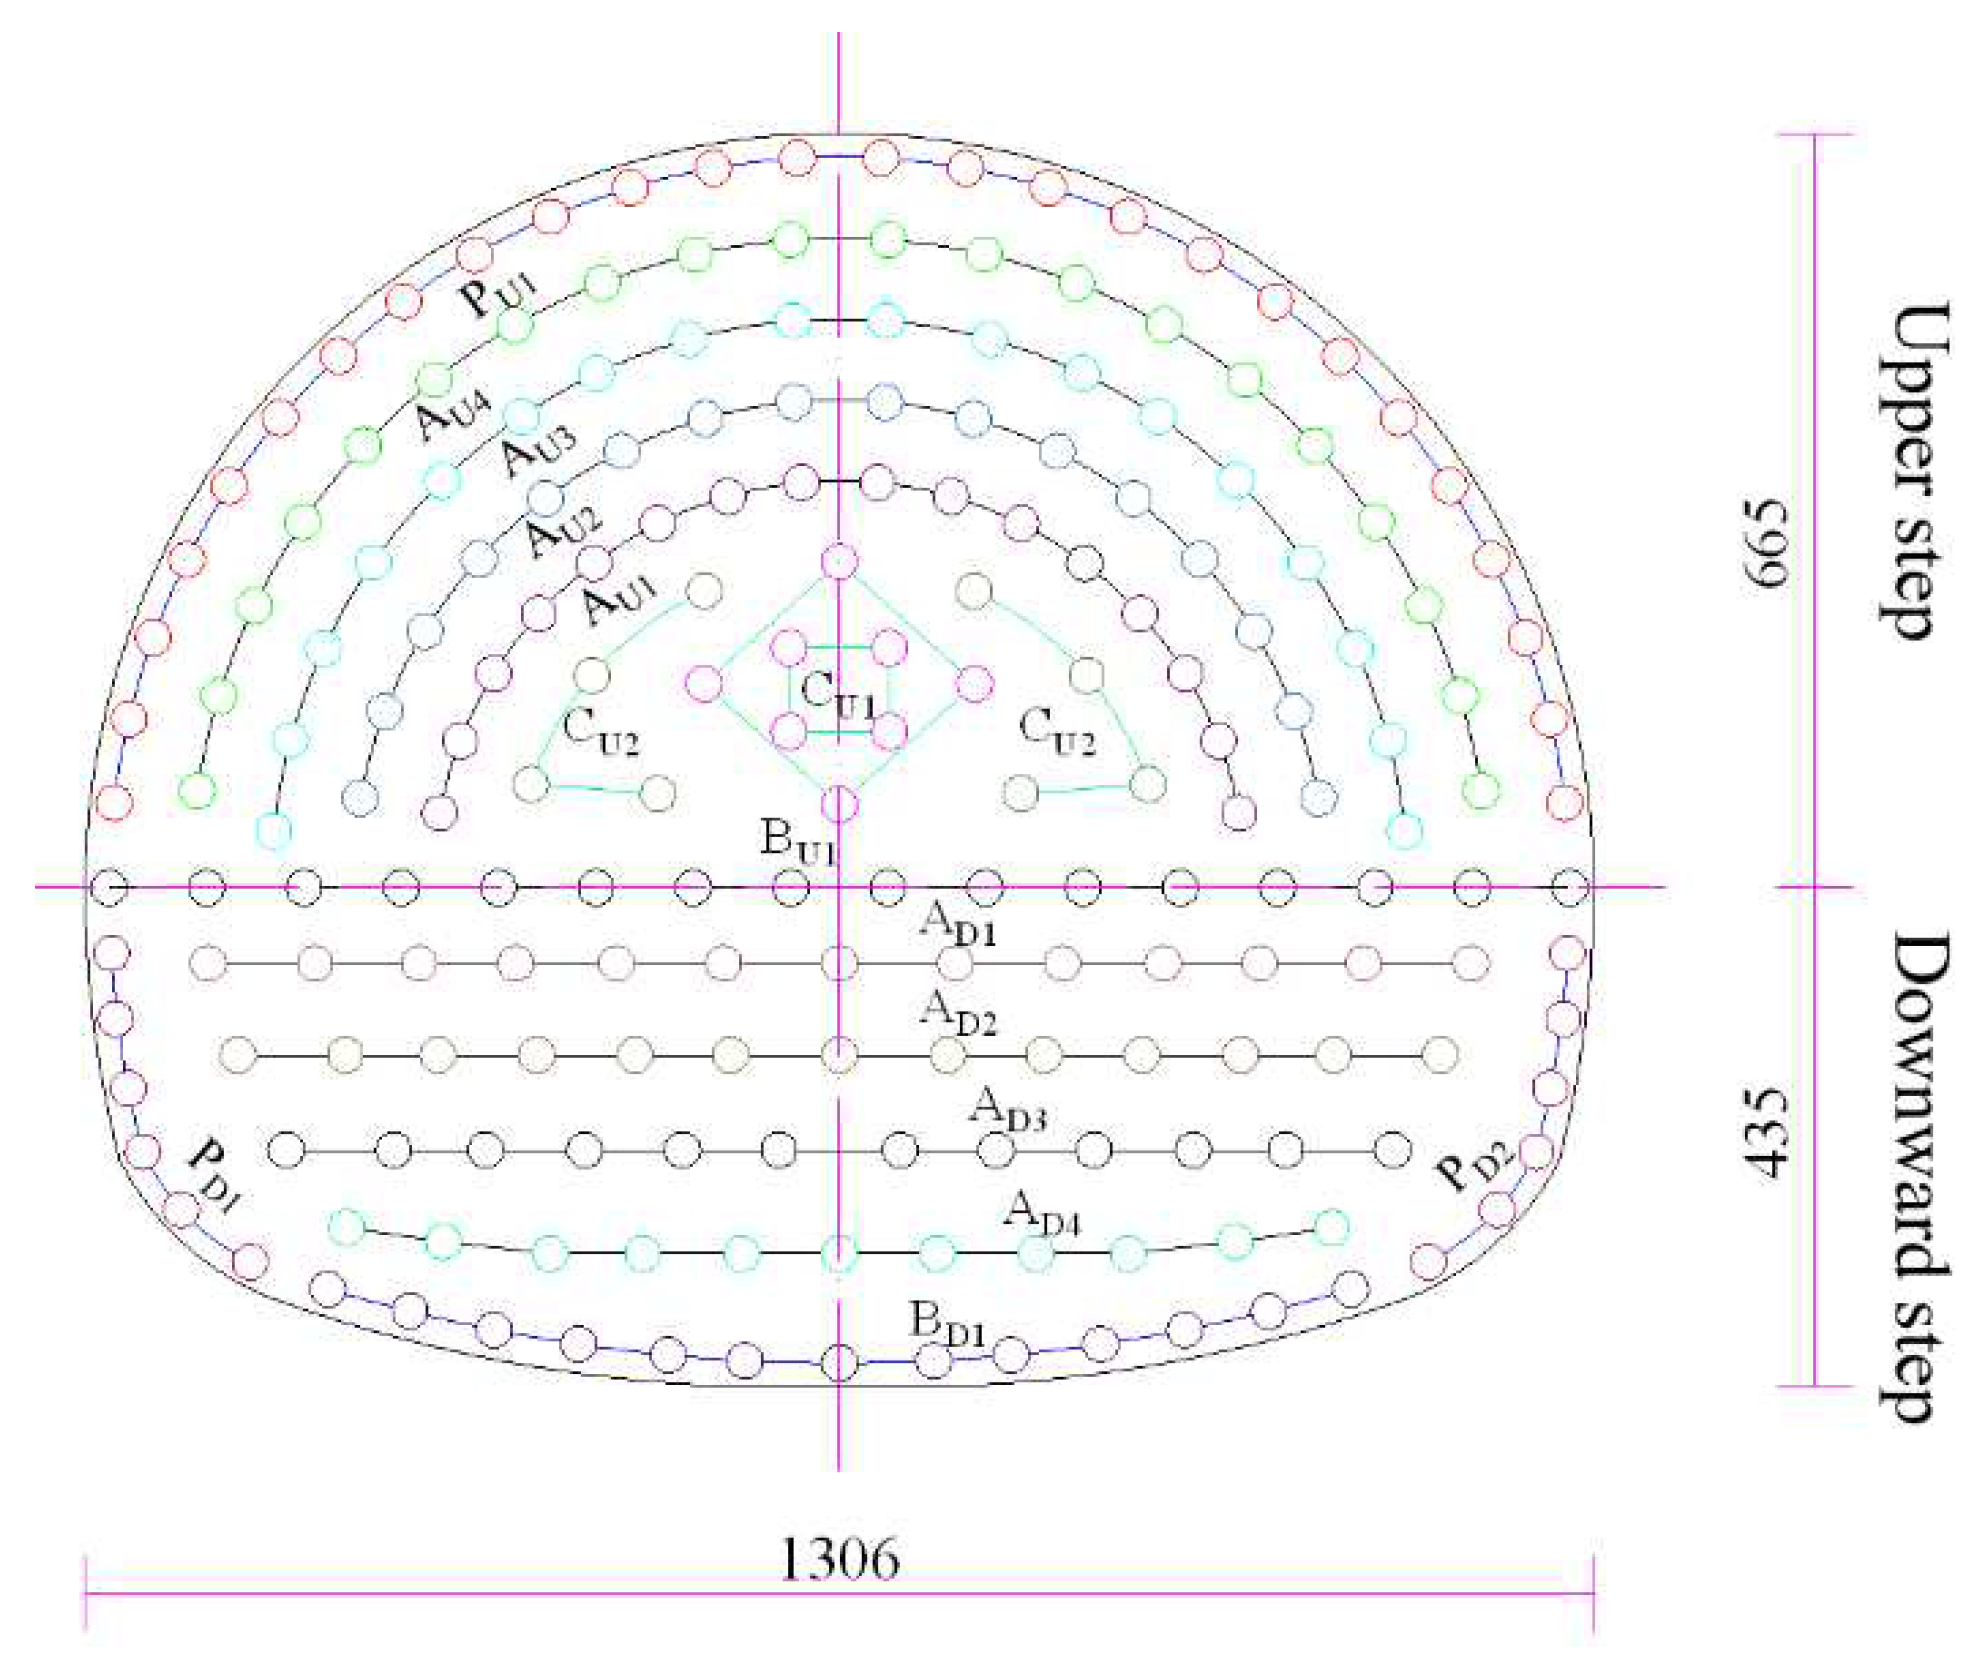
Figure 9.
Eigenvalues of track irregularities in the UK.
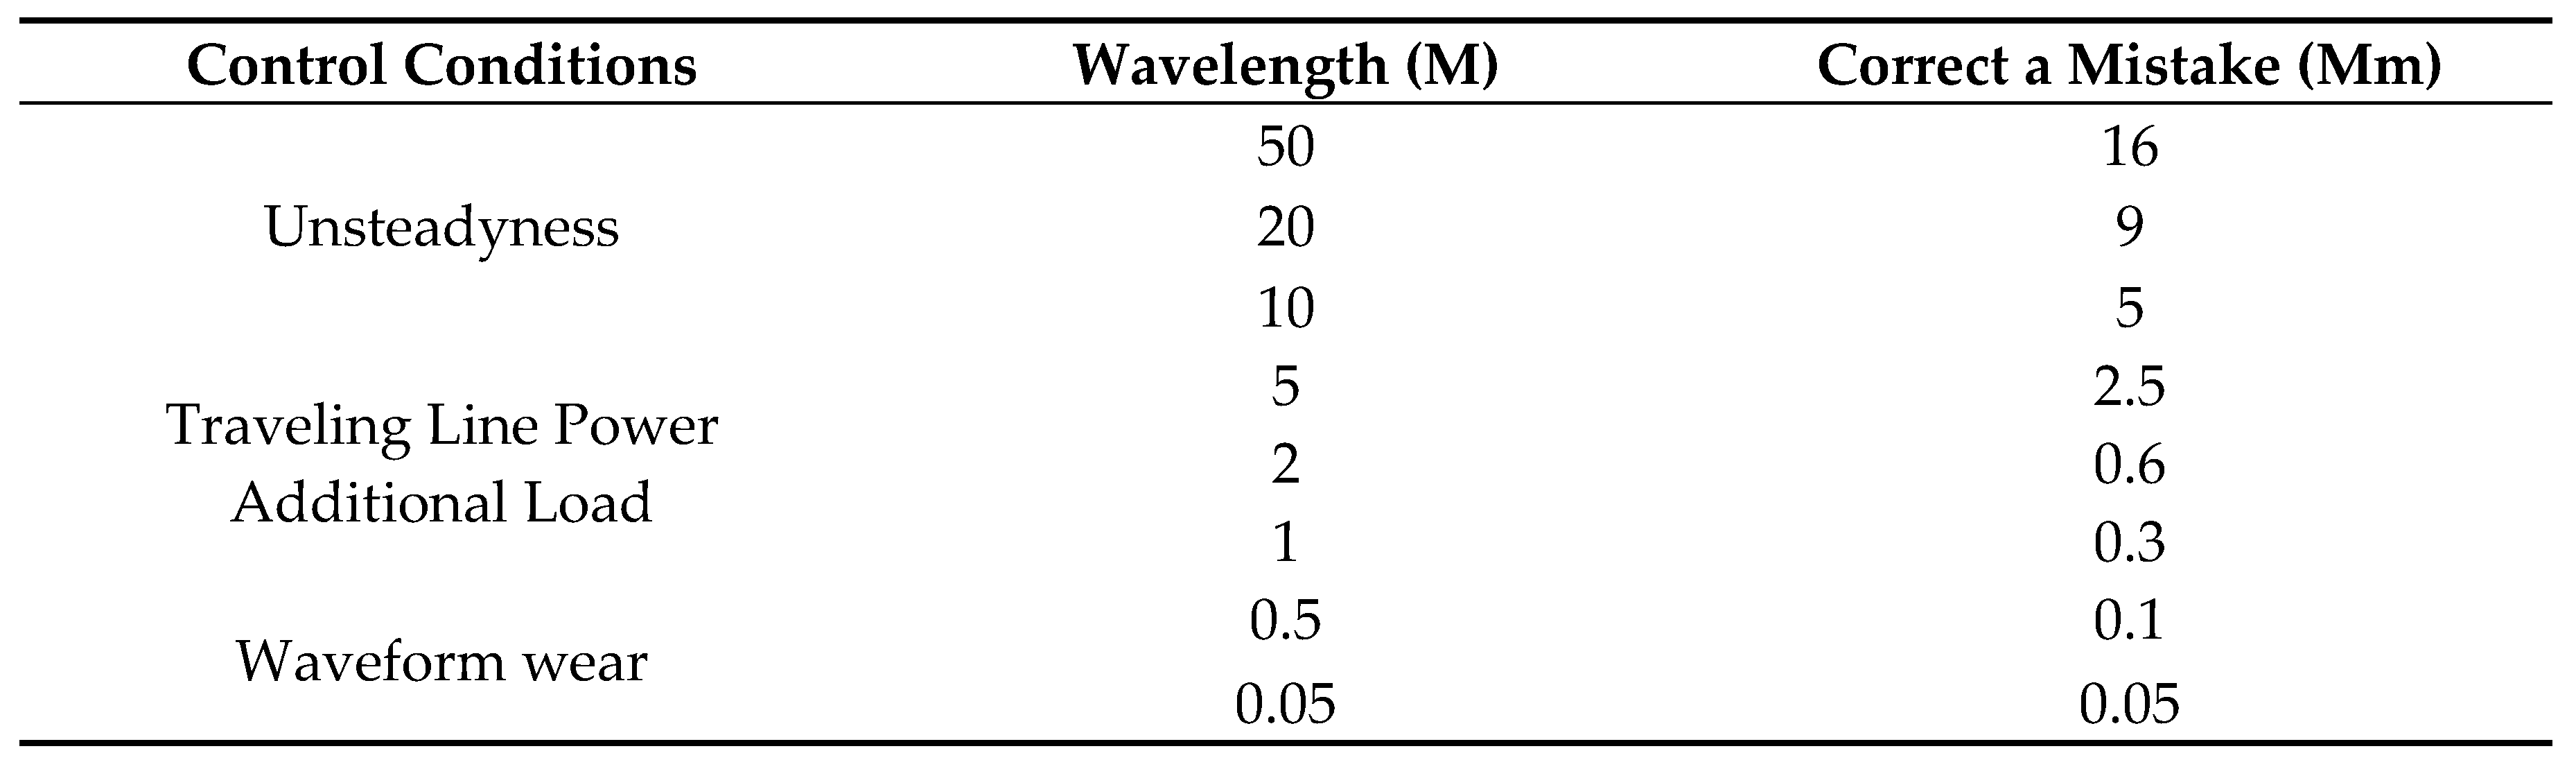
Figure 10.
Train load time curve.
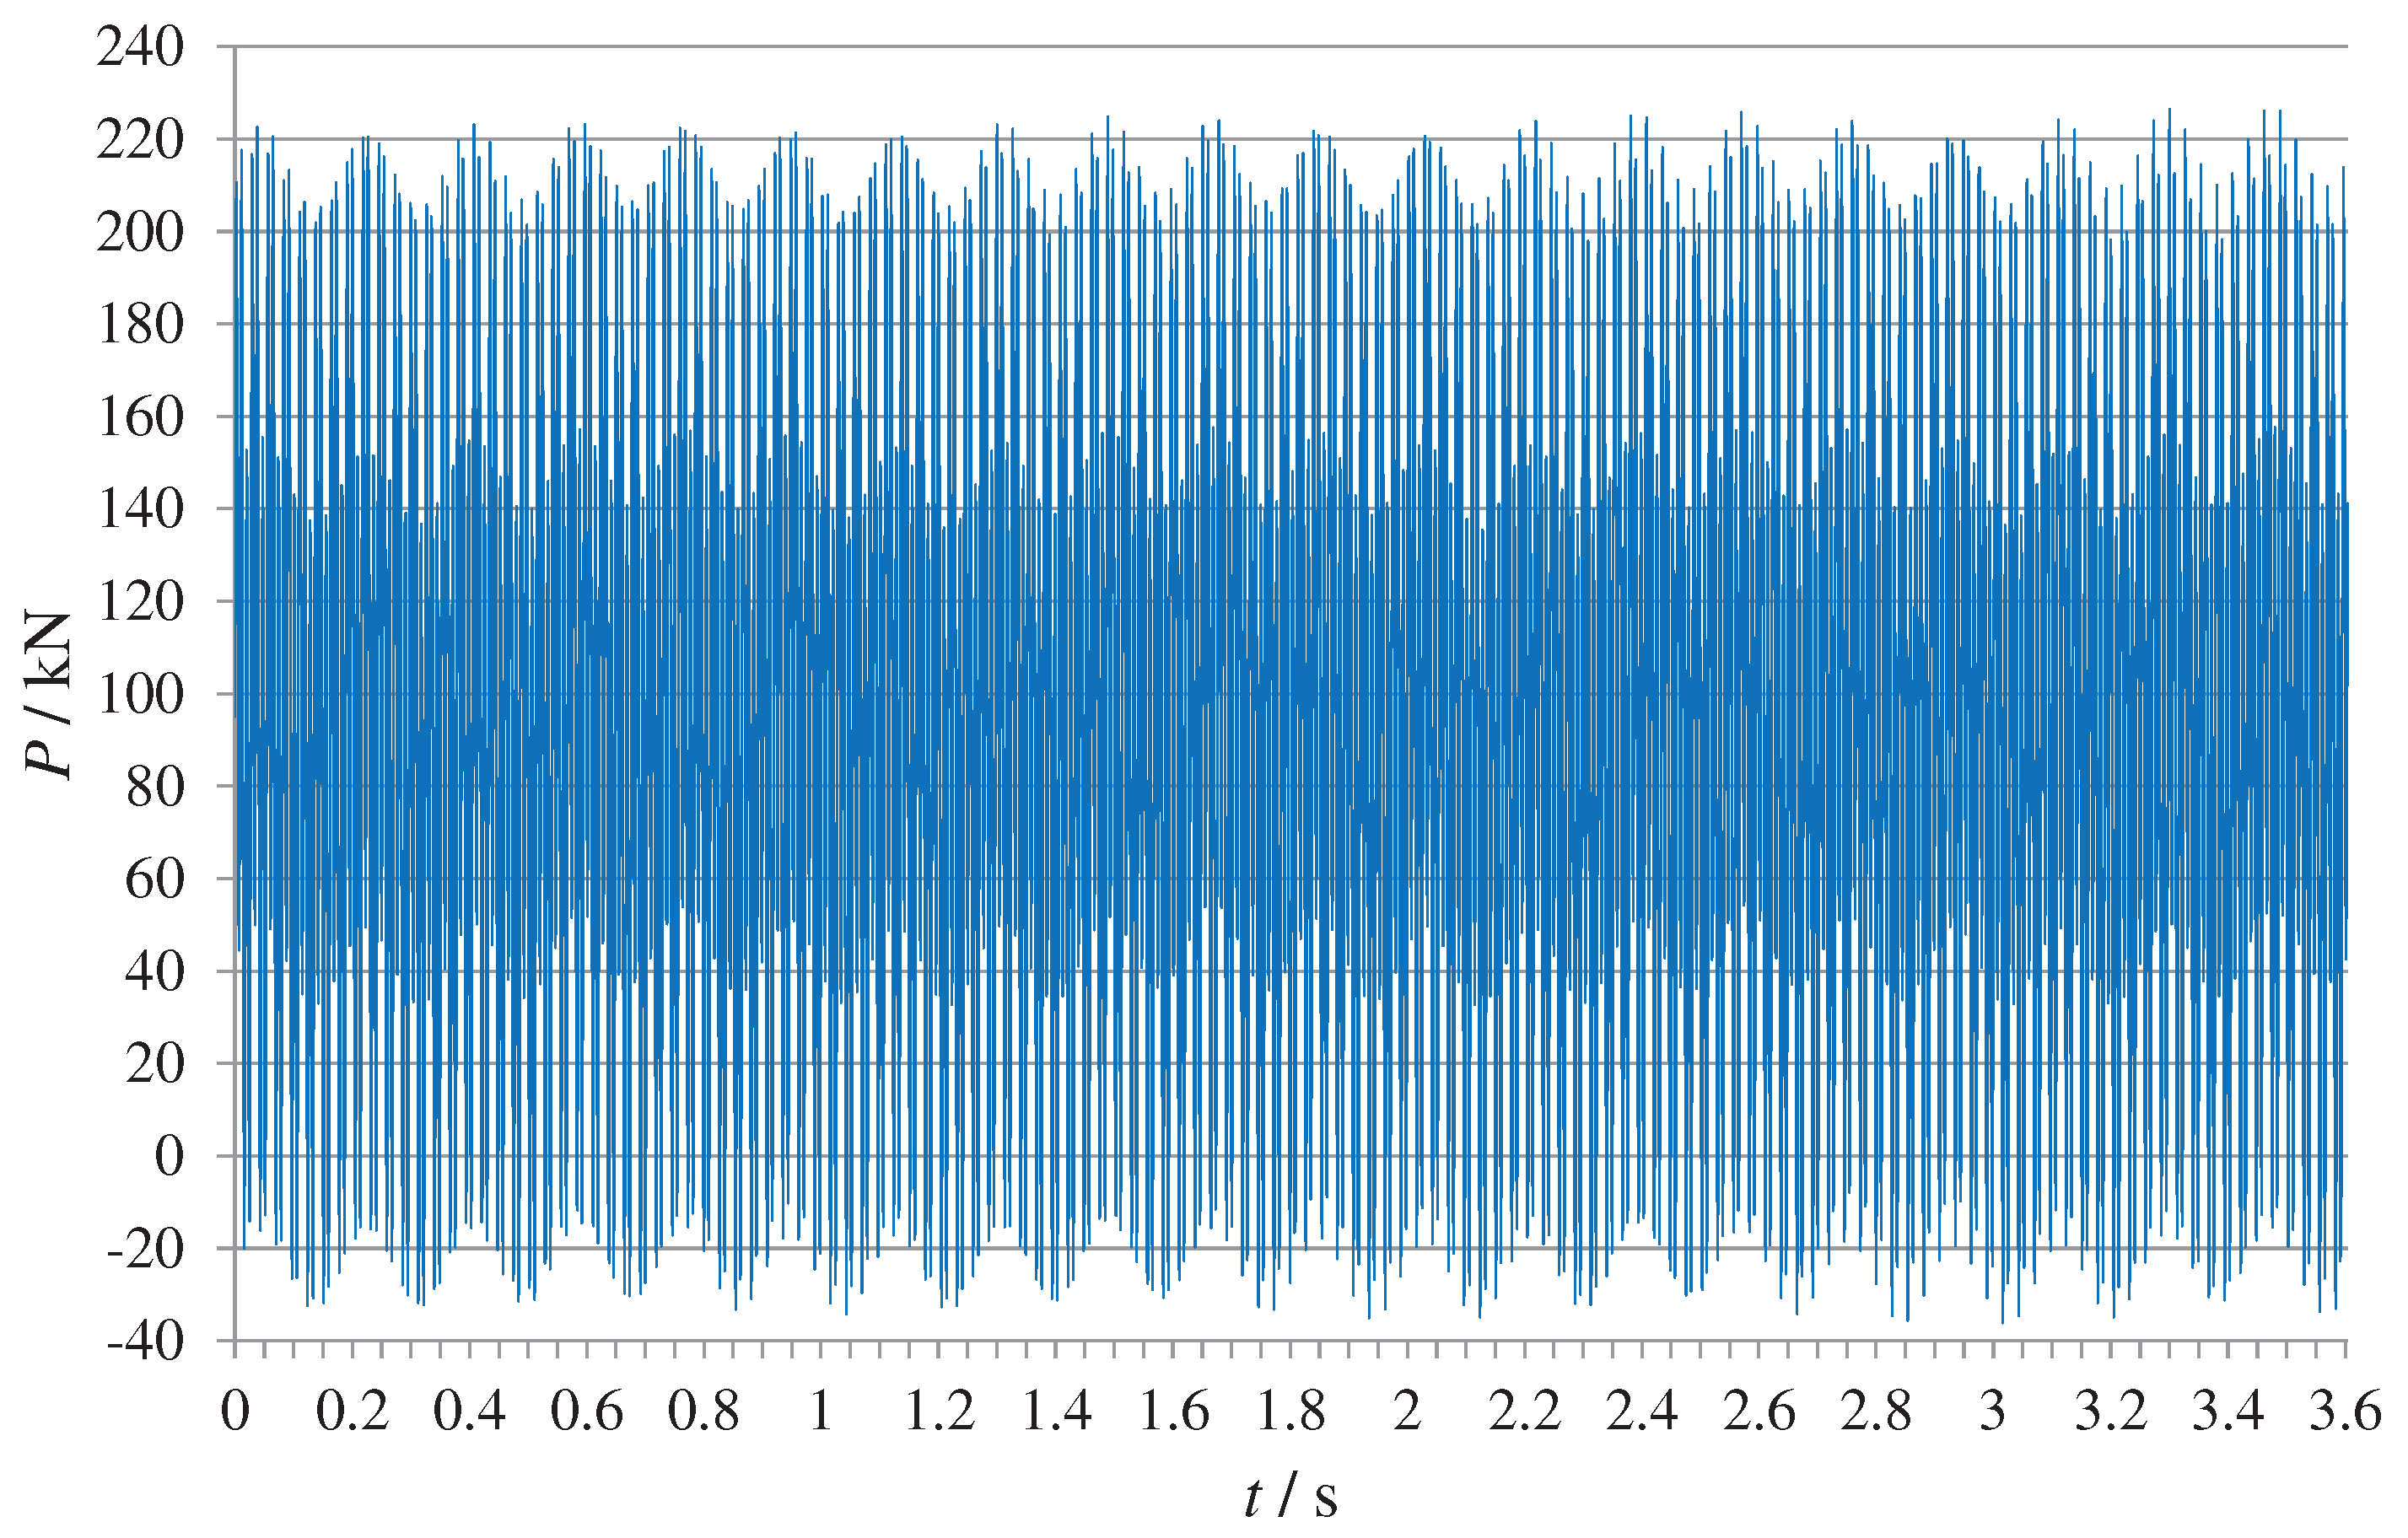
Figure 11.
Overall displacement maps of existing tunnels at different data extraction time steps.
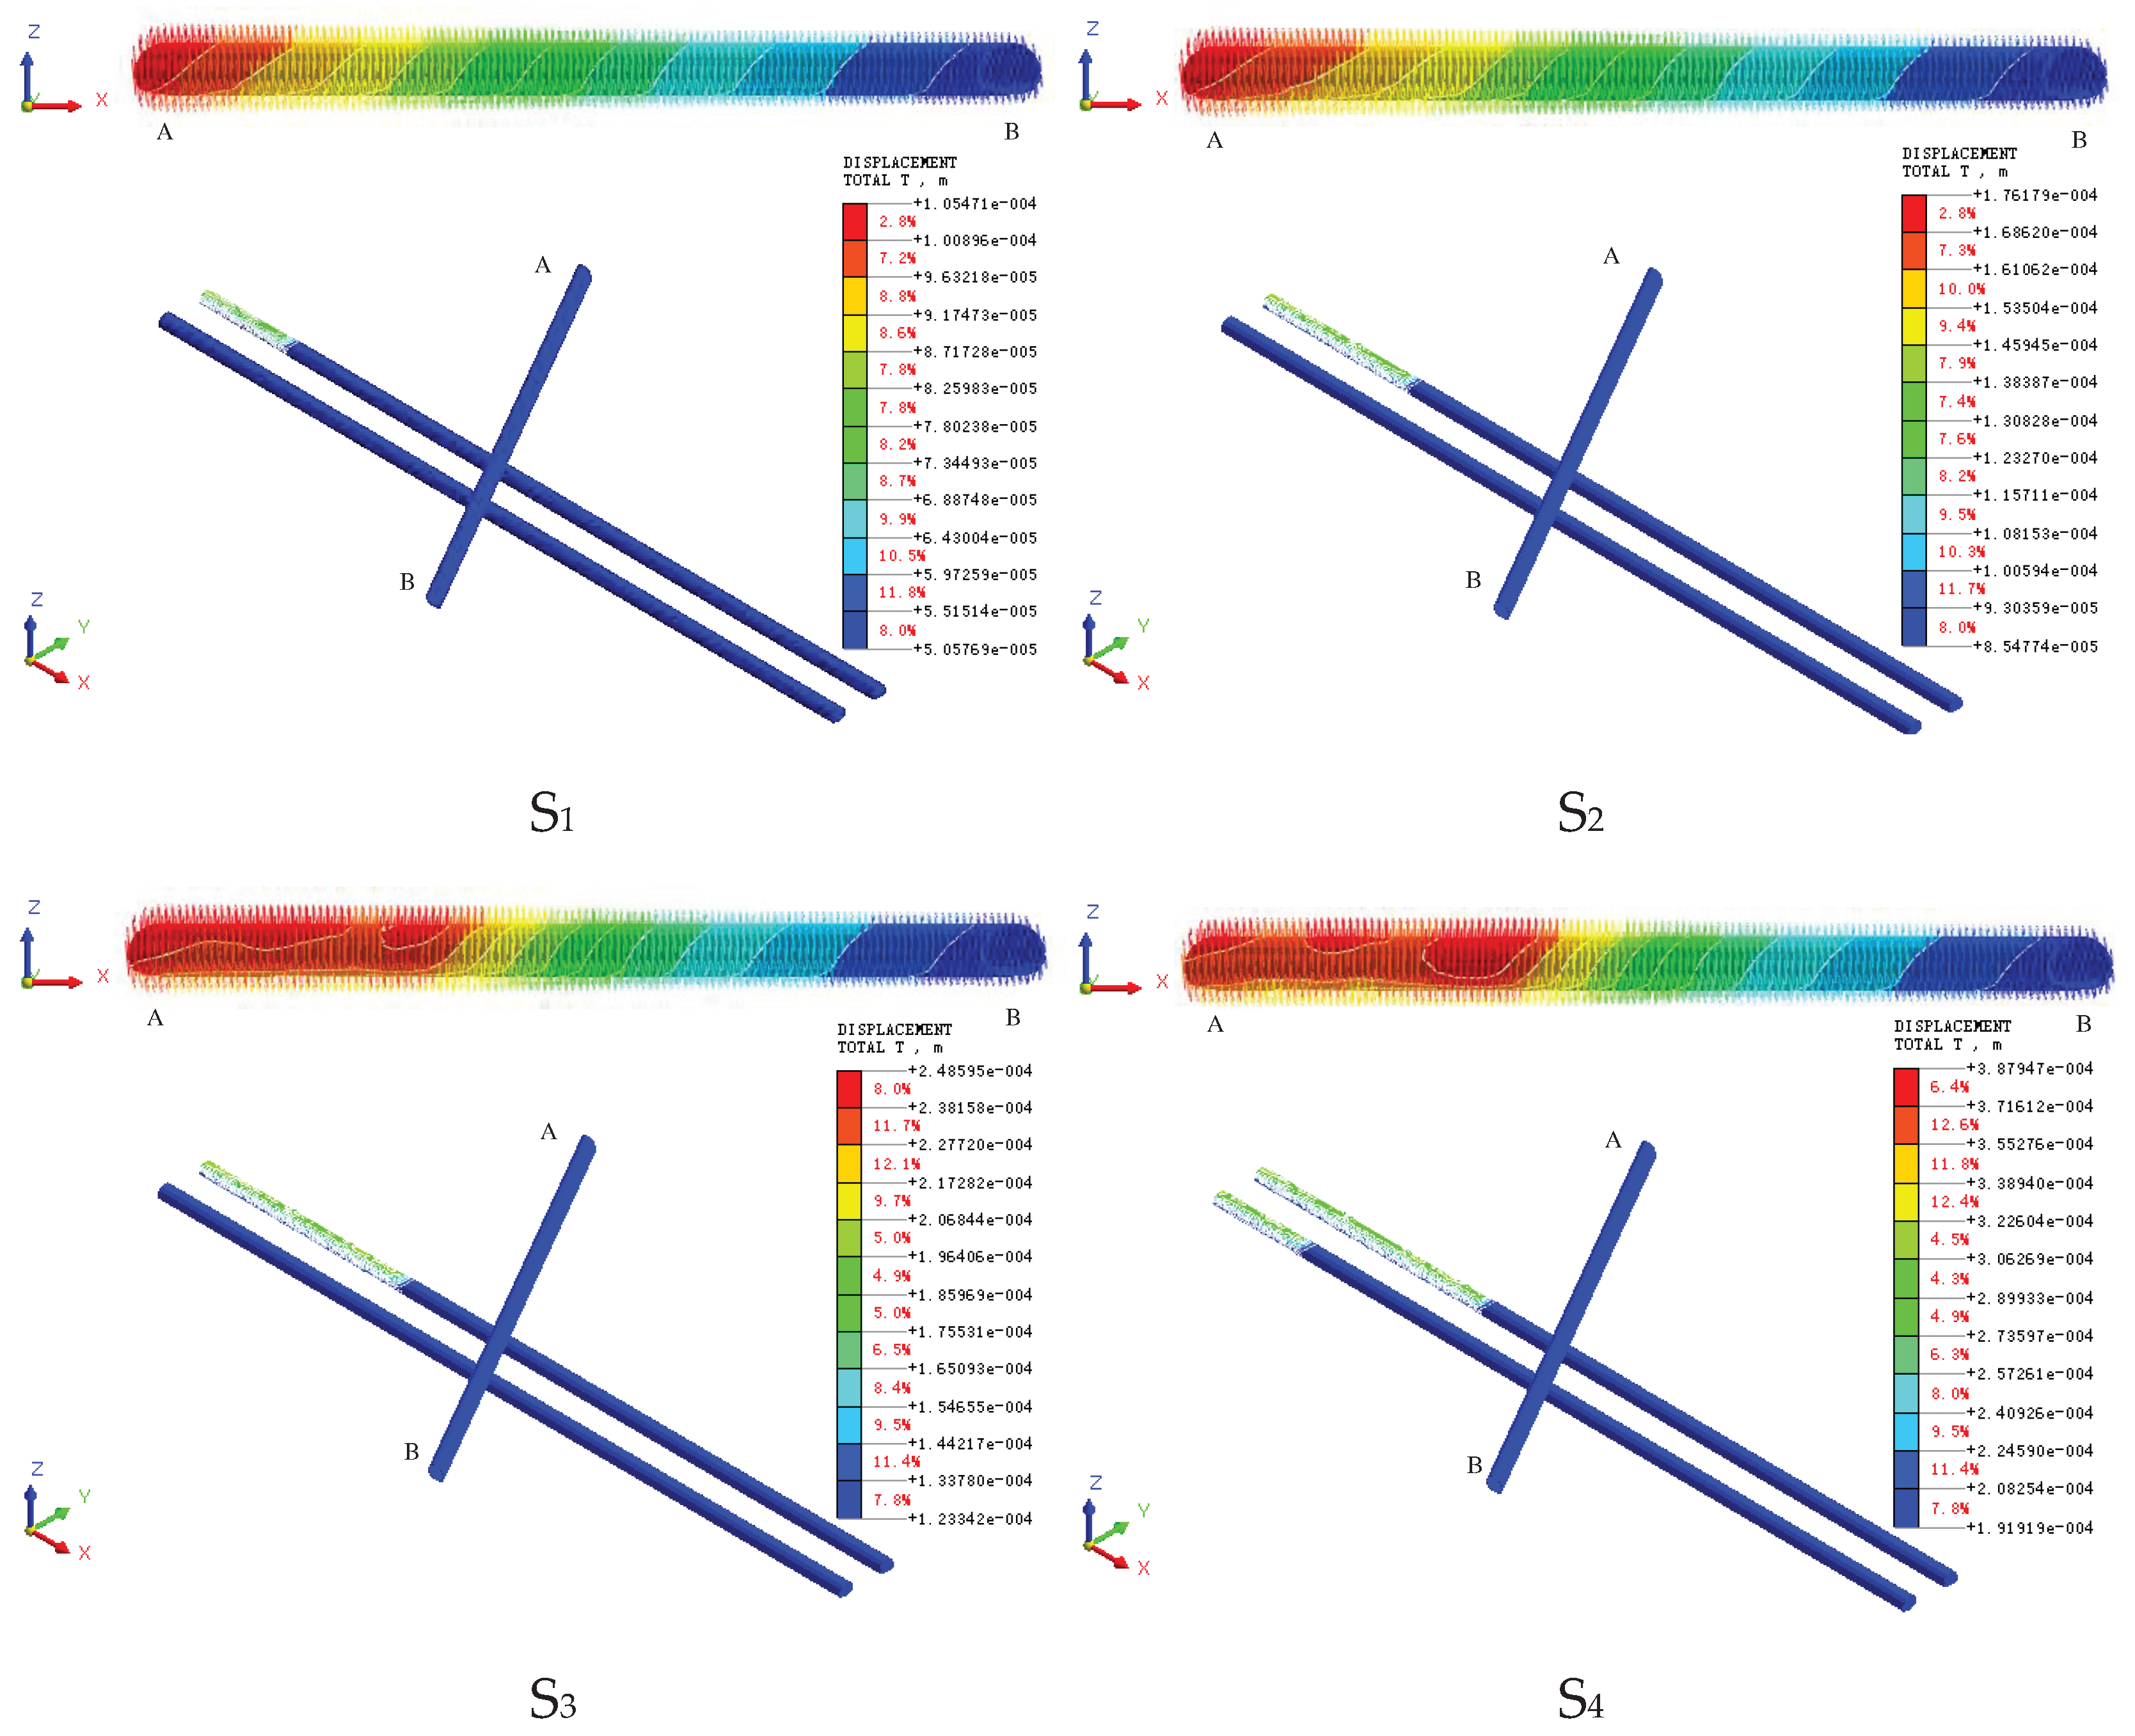
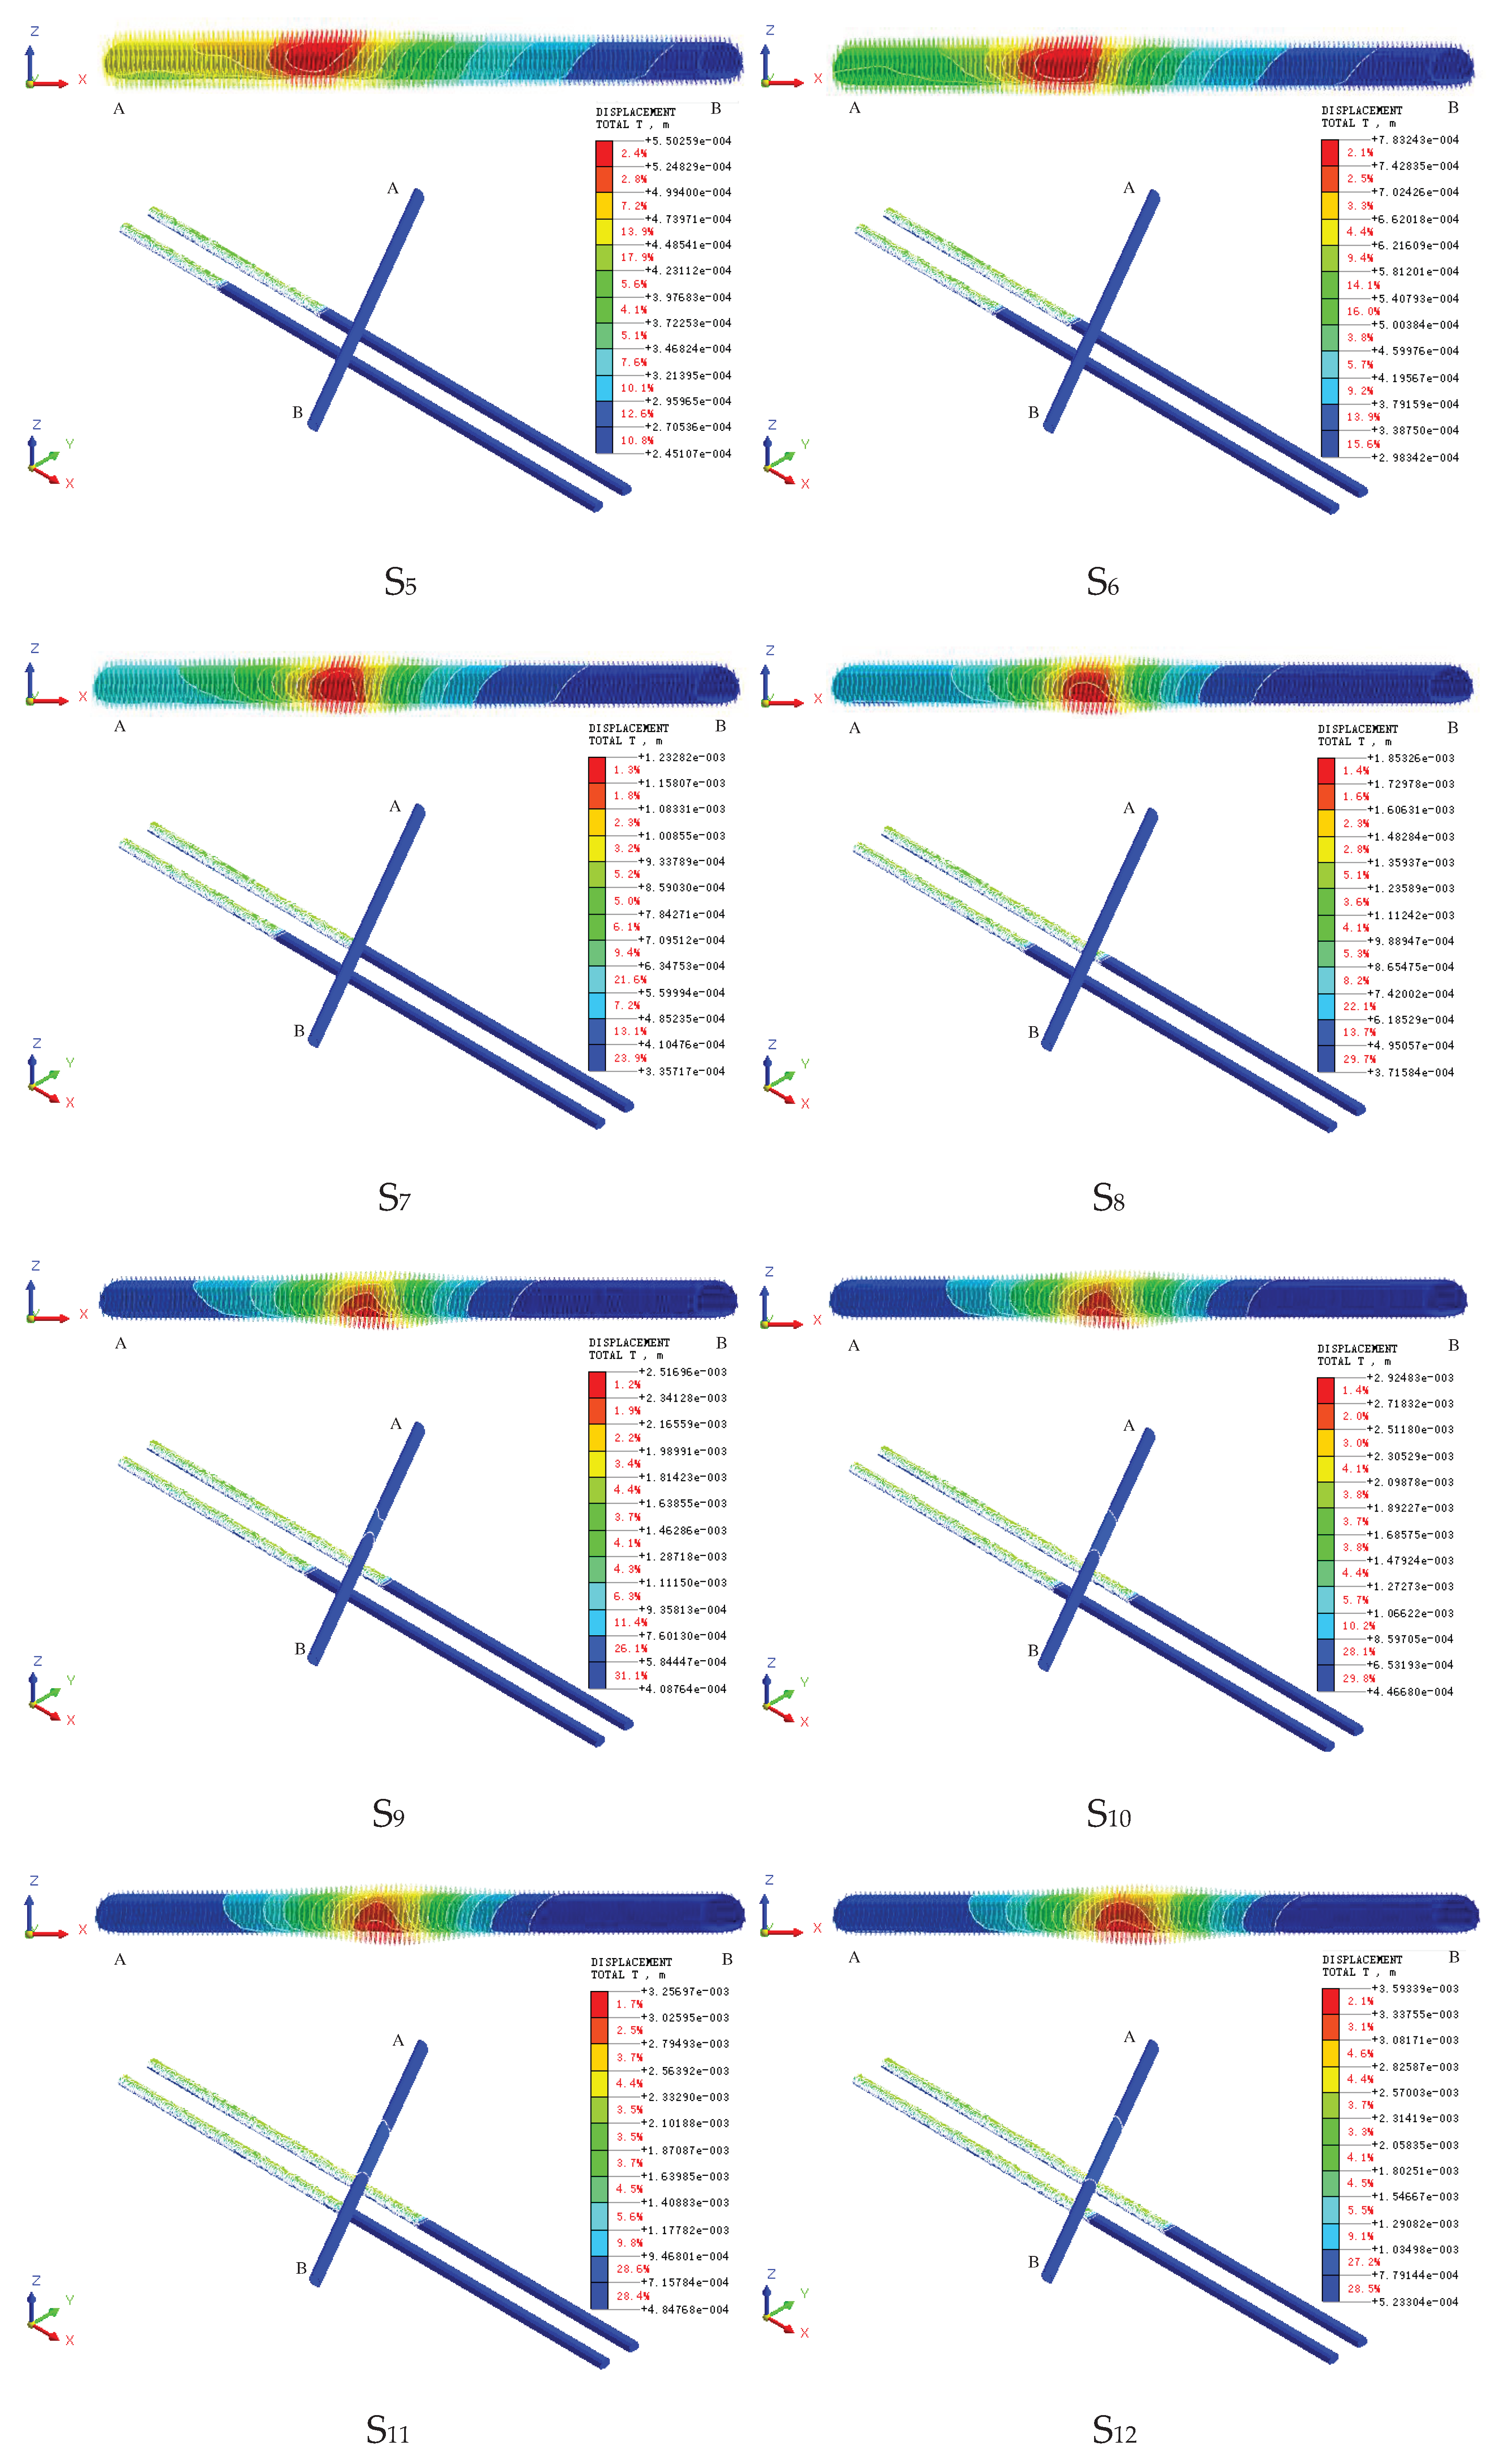
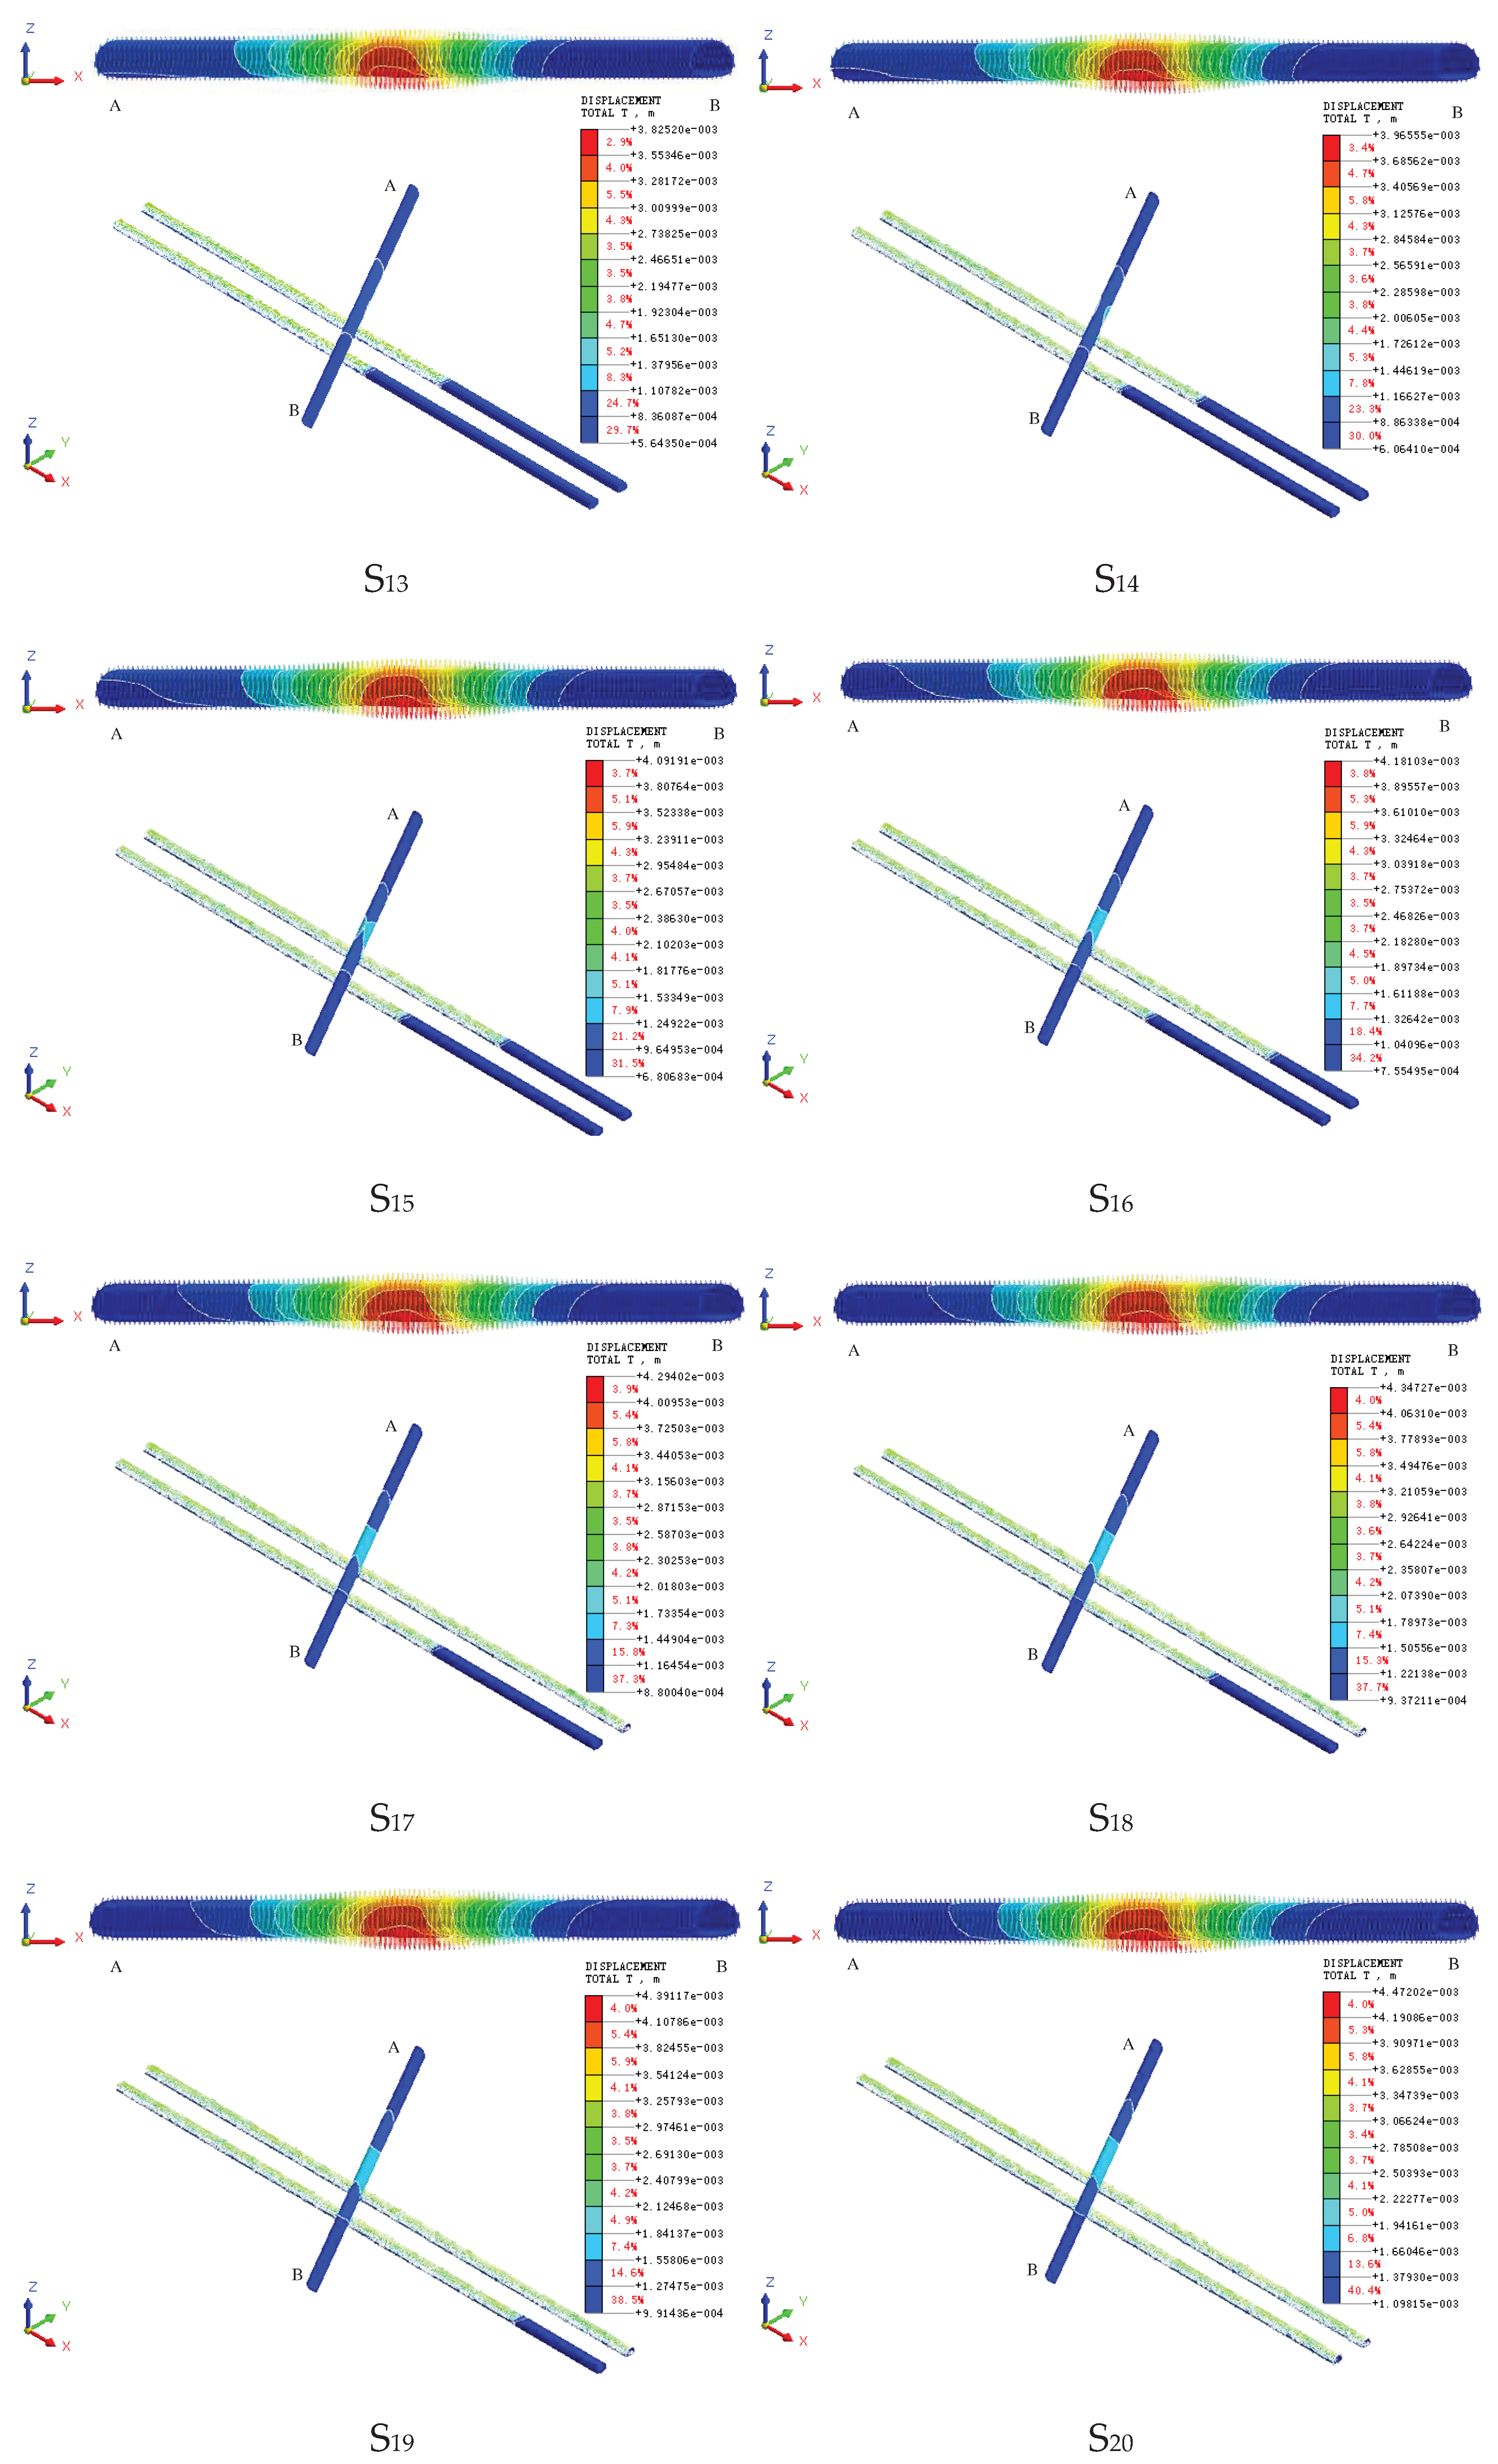
Figure 12.
Overall peak deformation and track surface settlement curves of existing tunnels at different timing steps.
Figure 12.
Overall peak deformation and track surface settlement curves of existing tunnels at different timing steps.
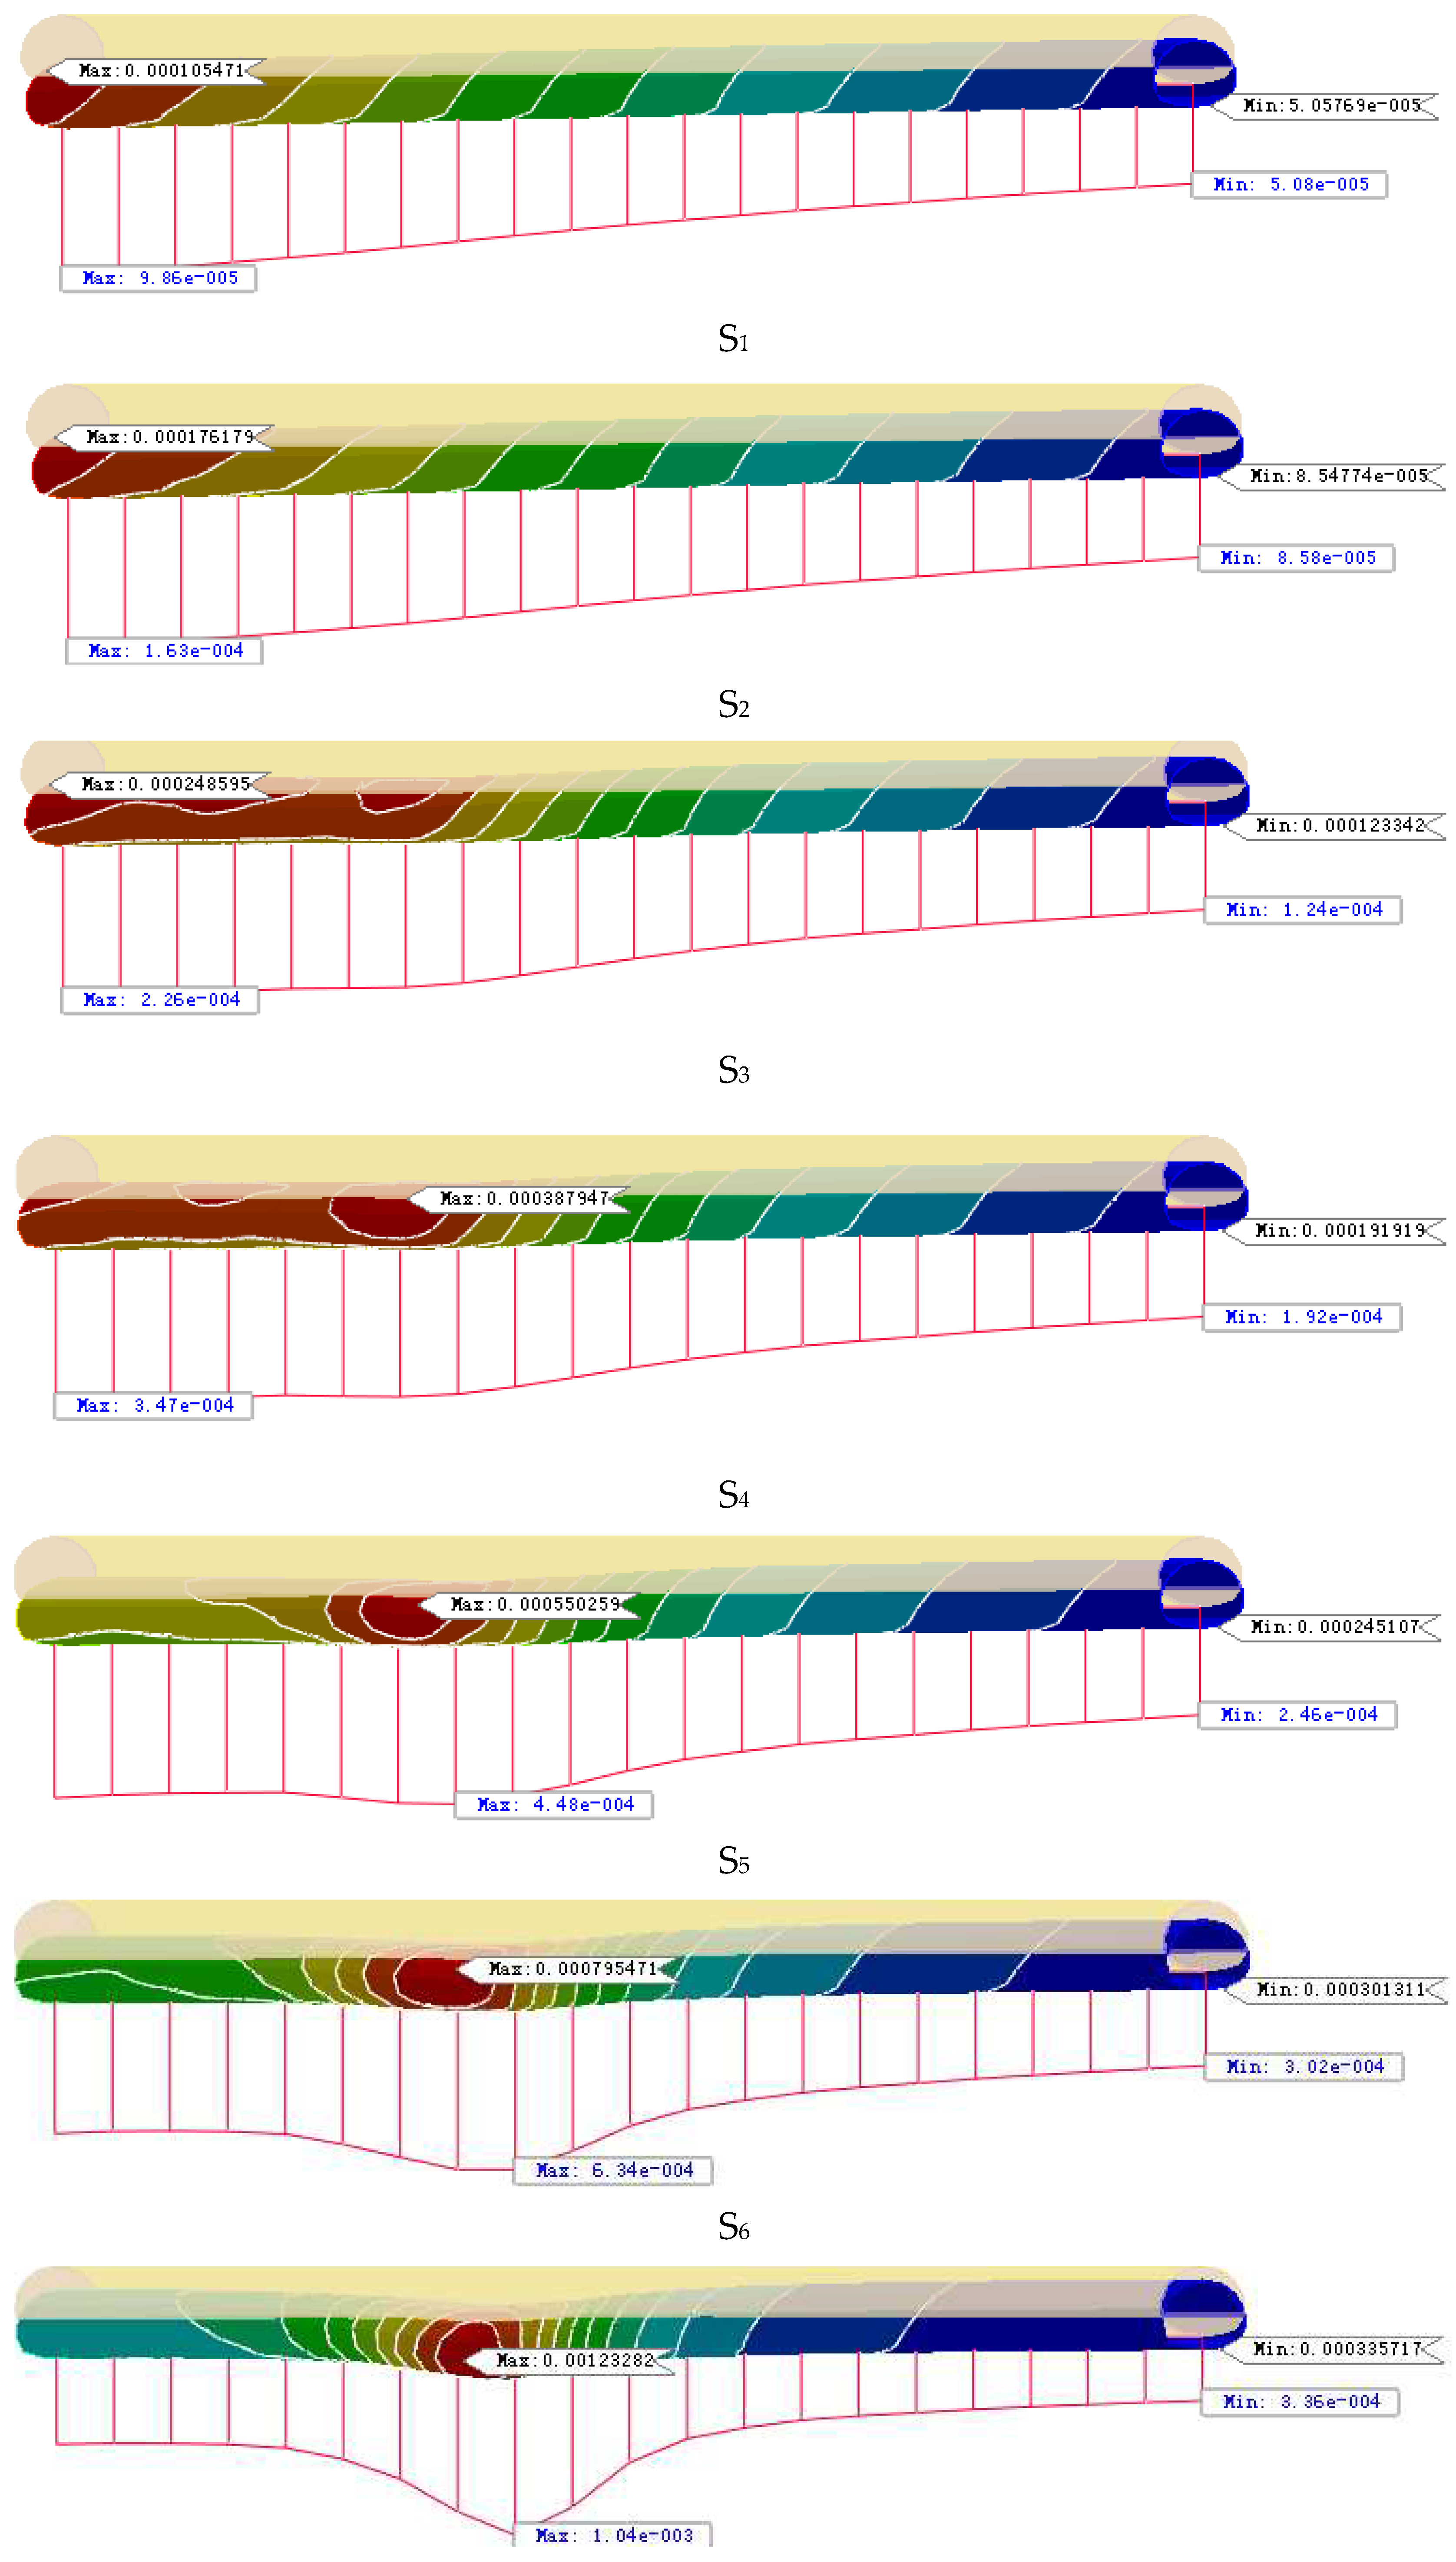
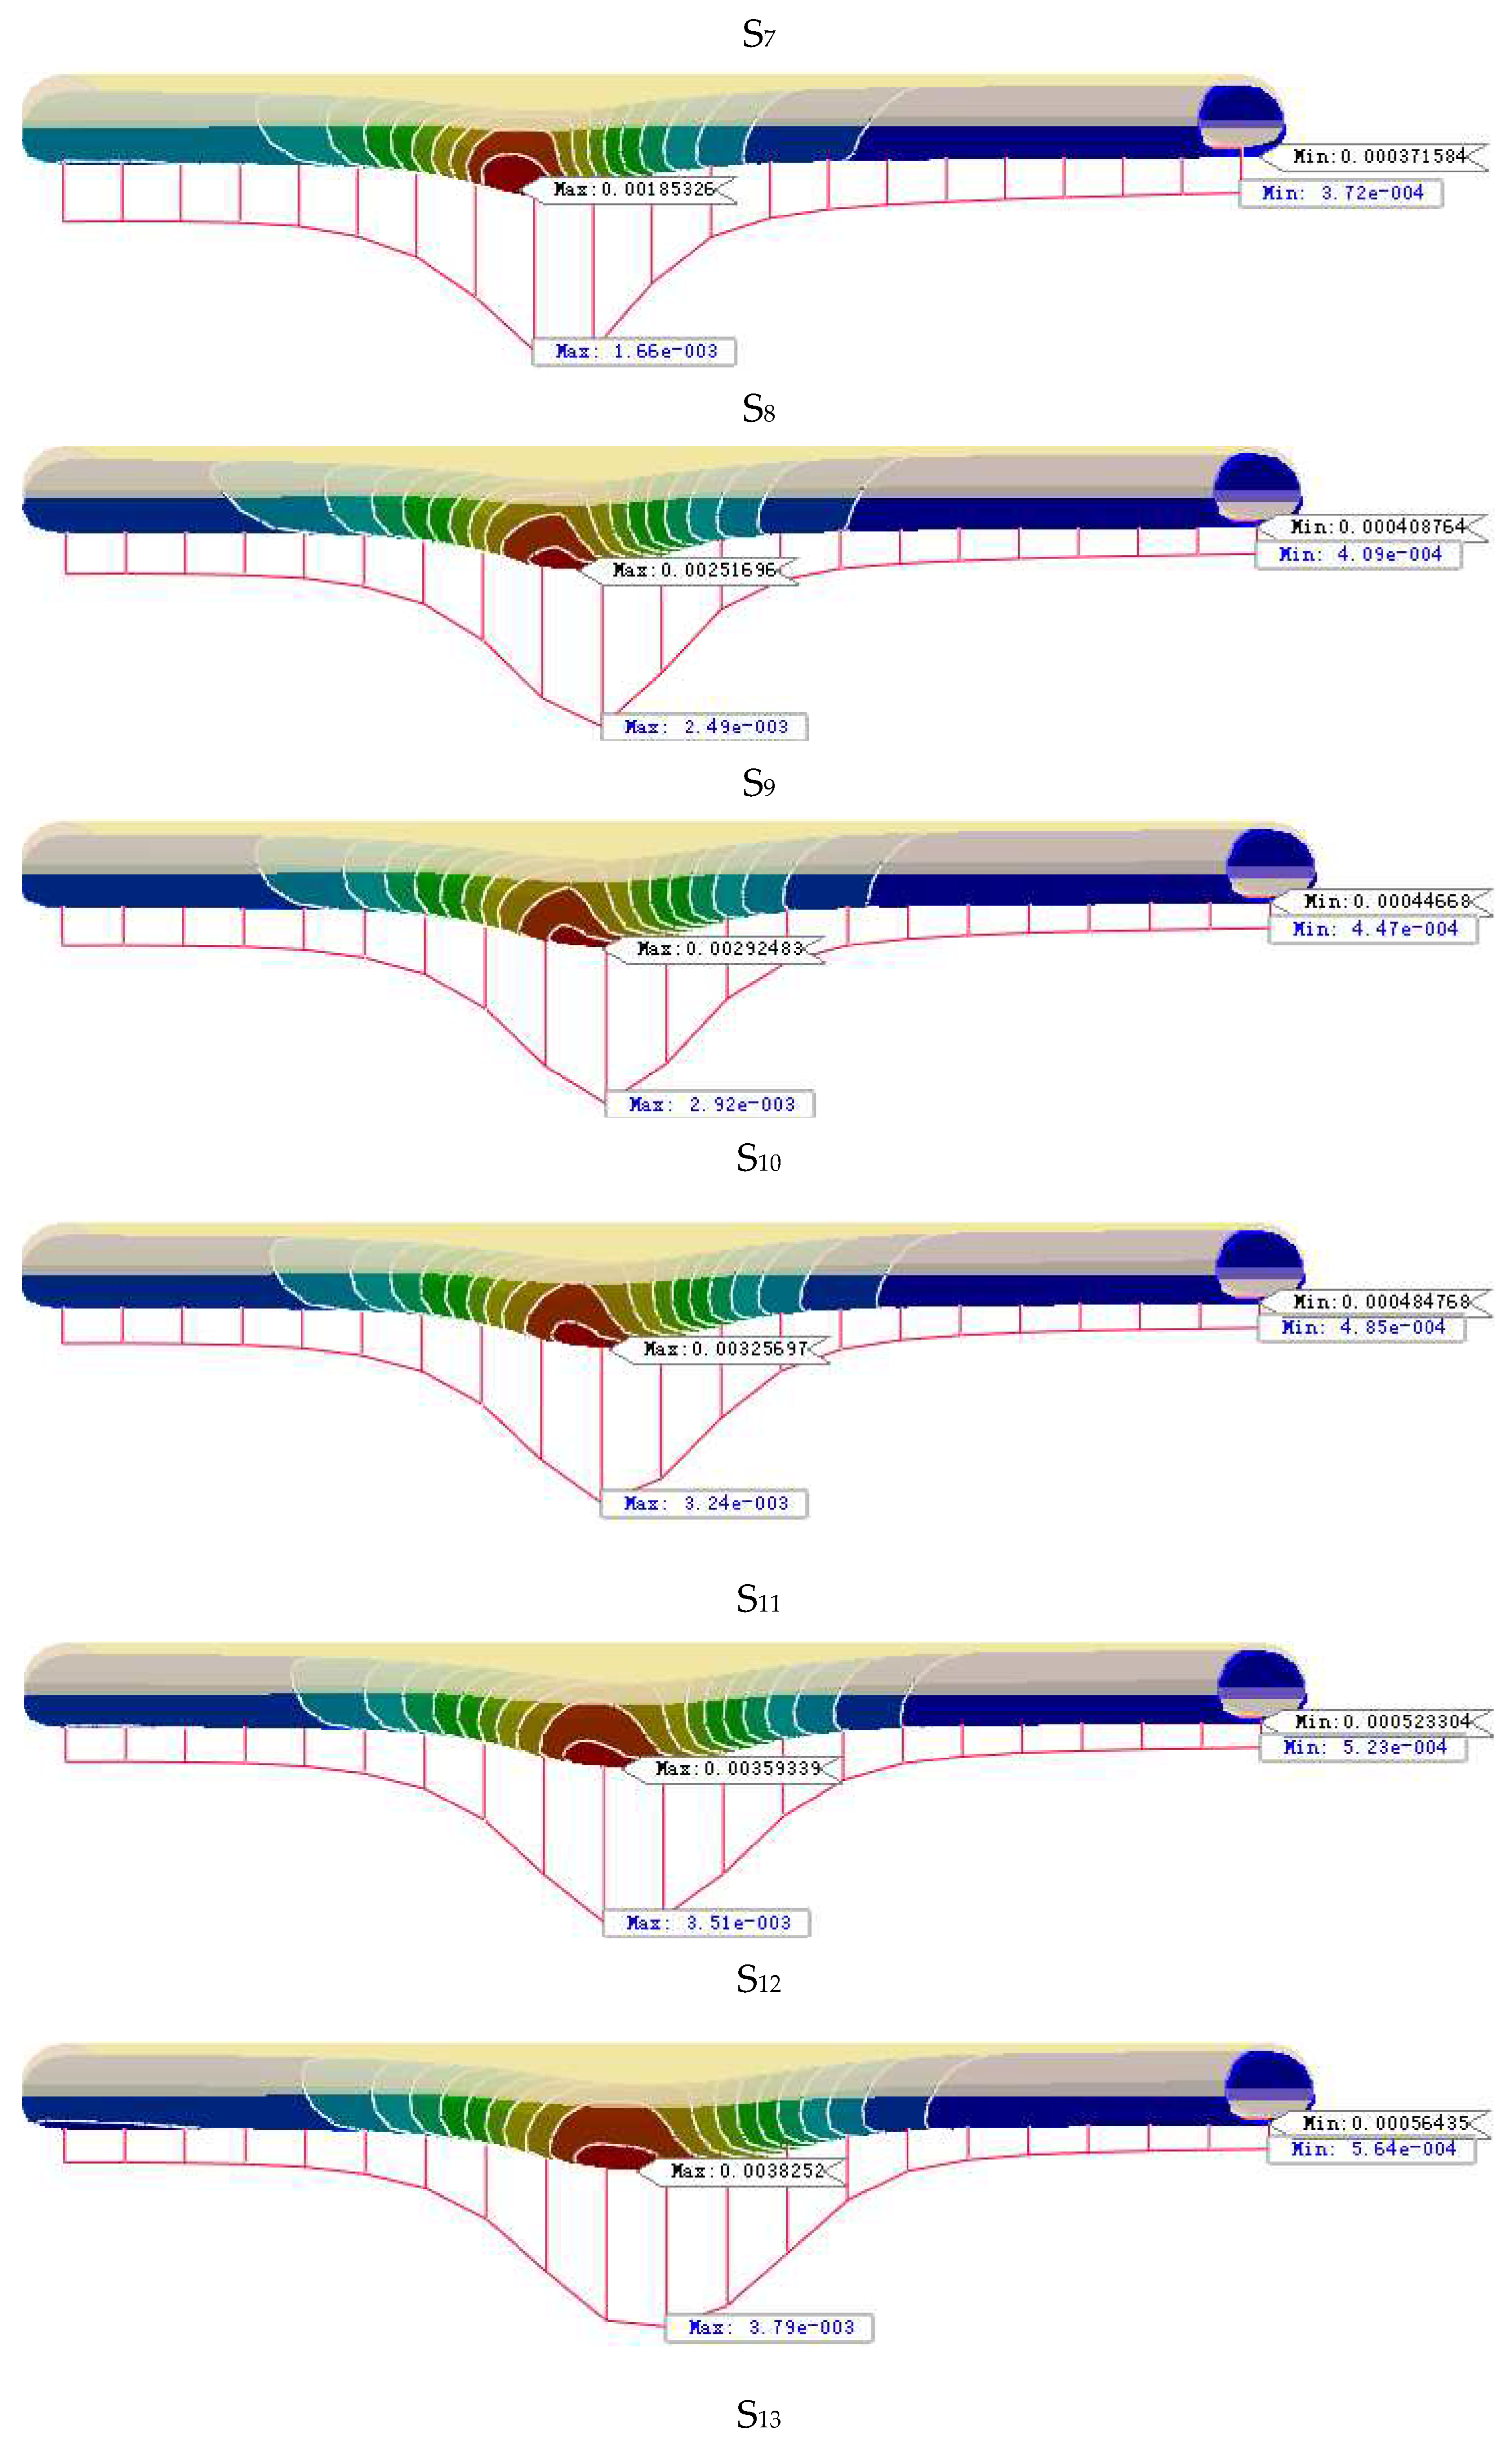
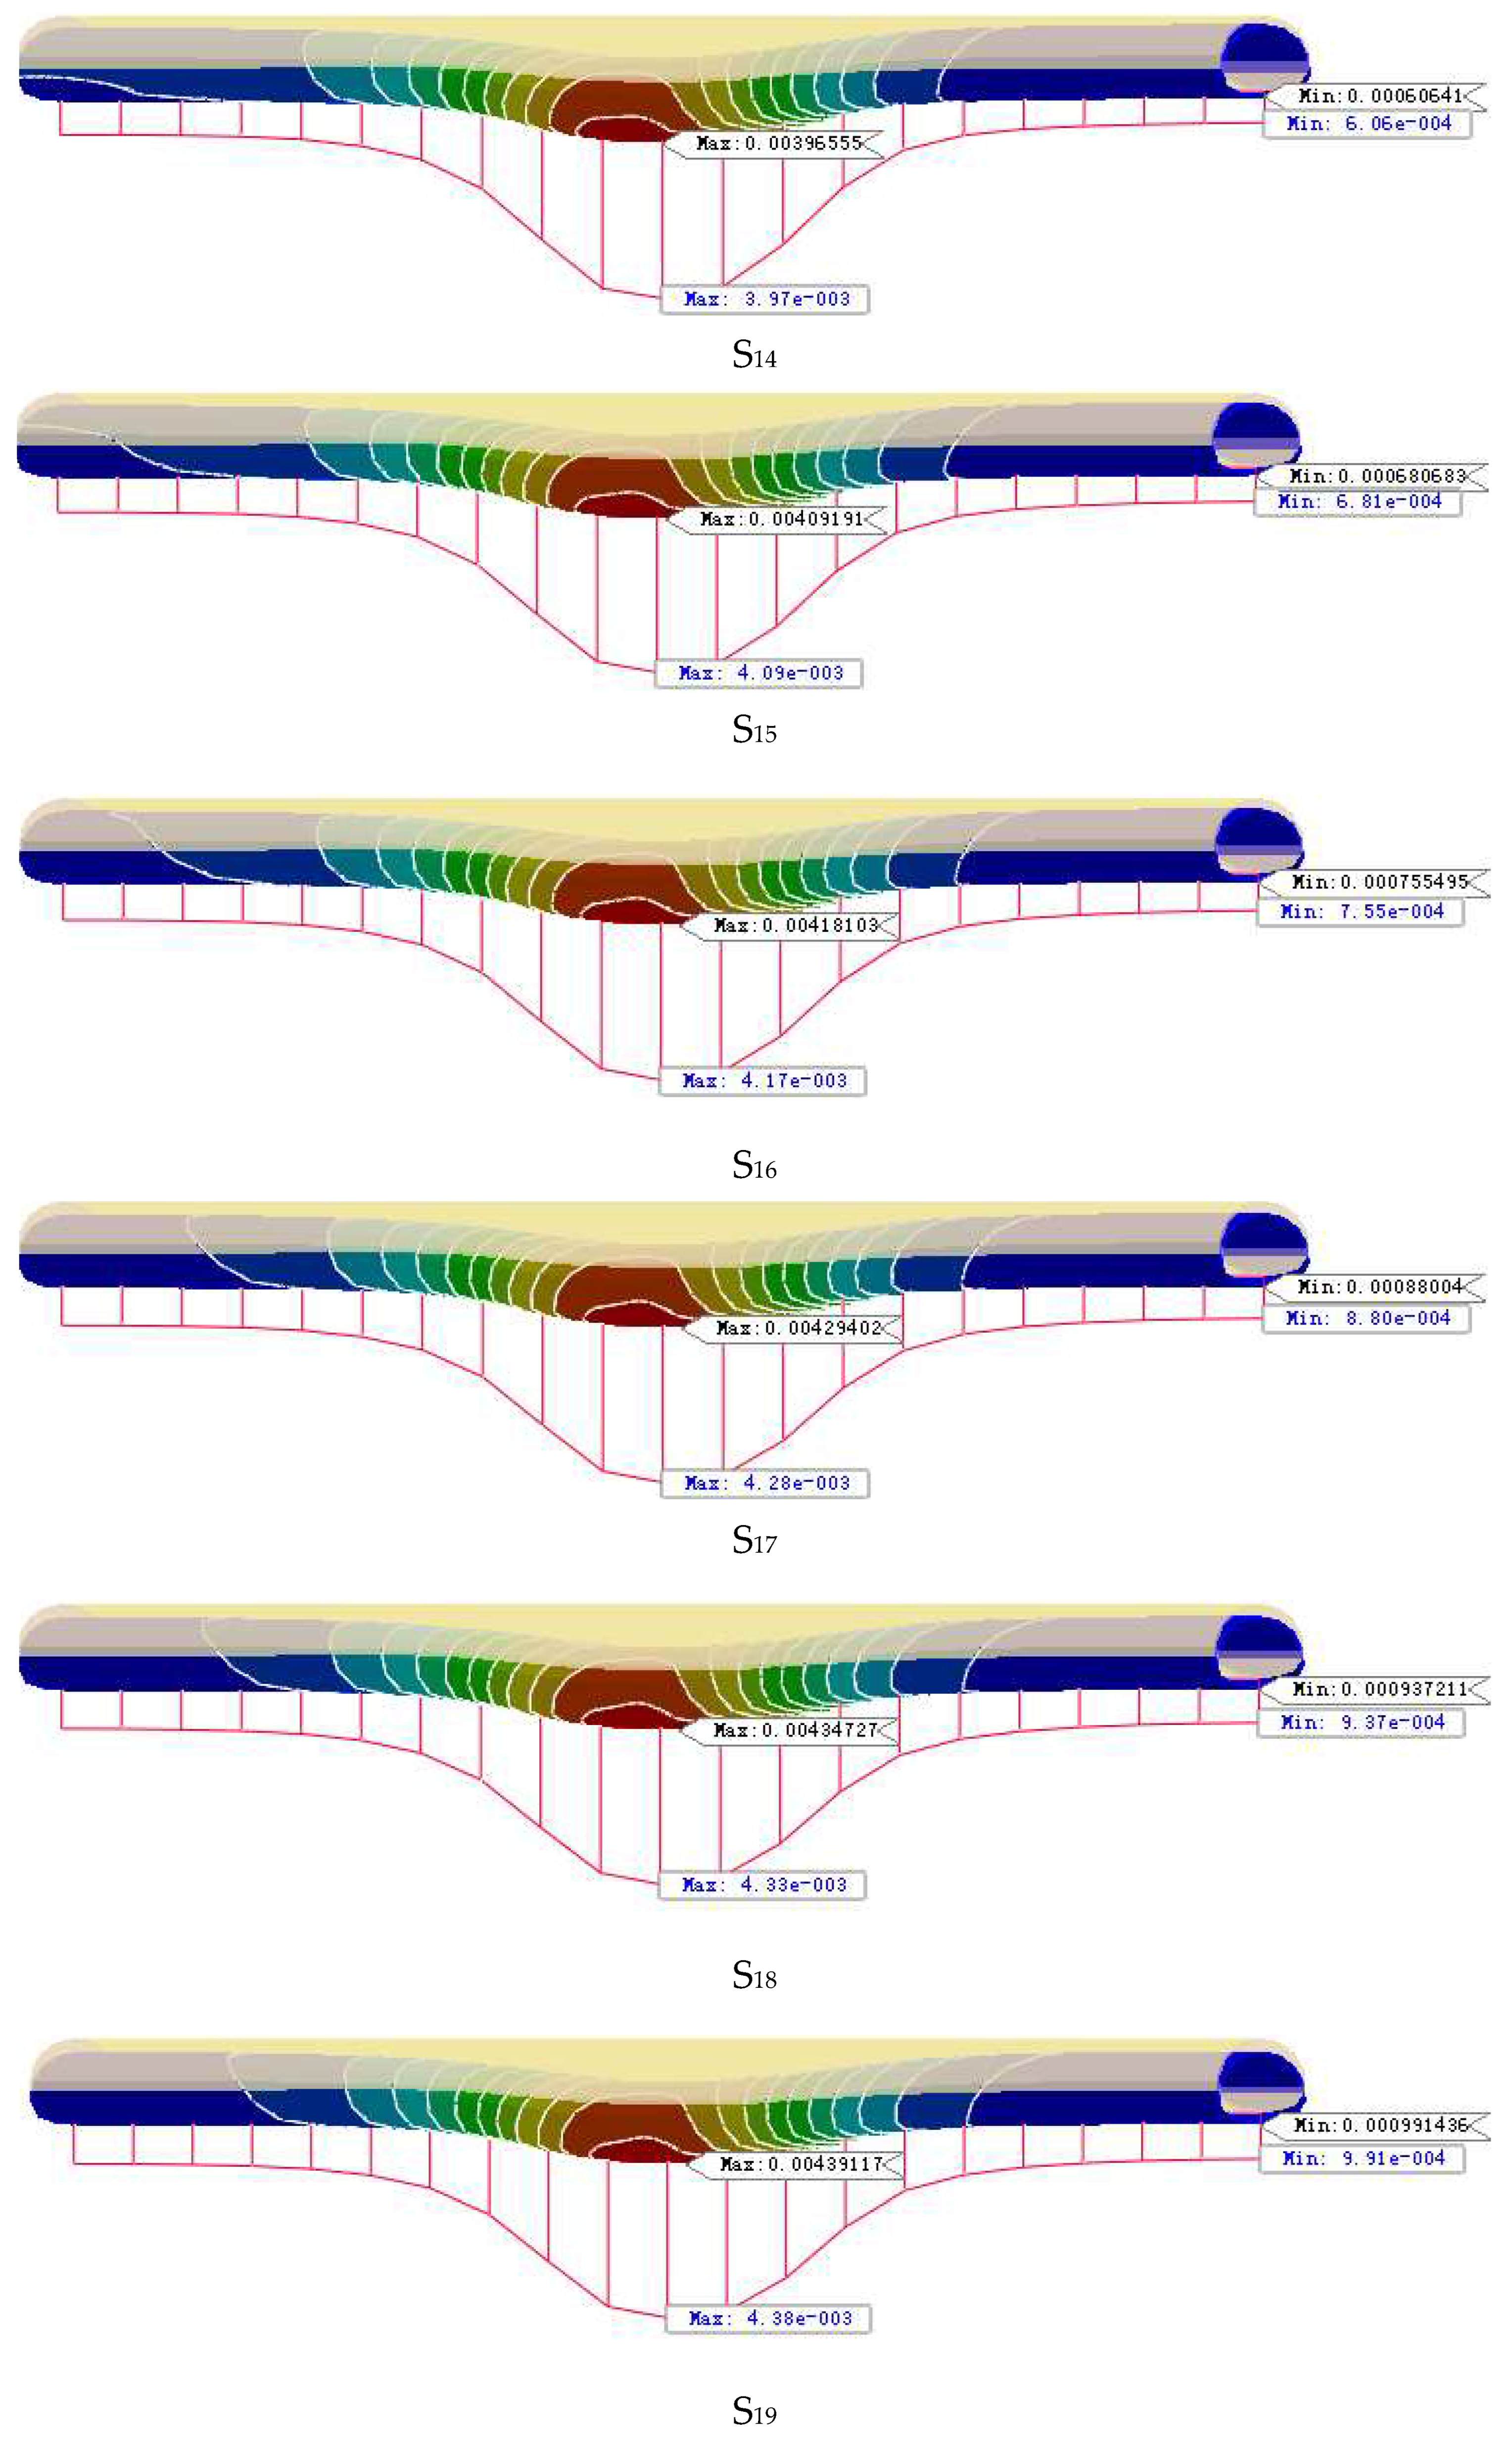
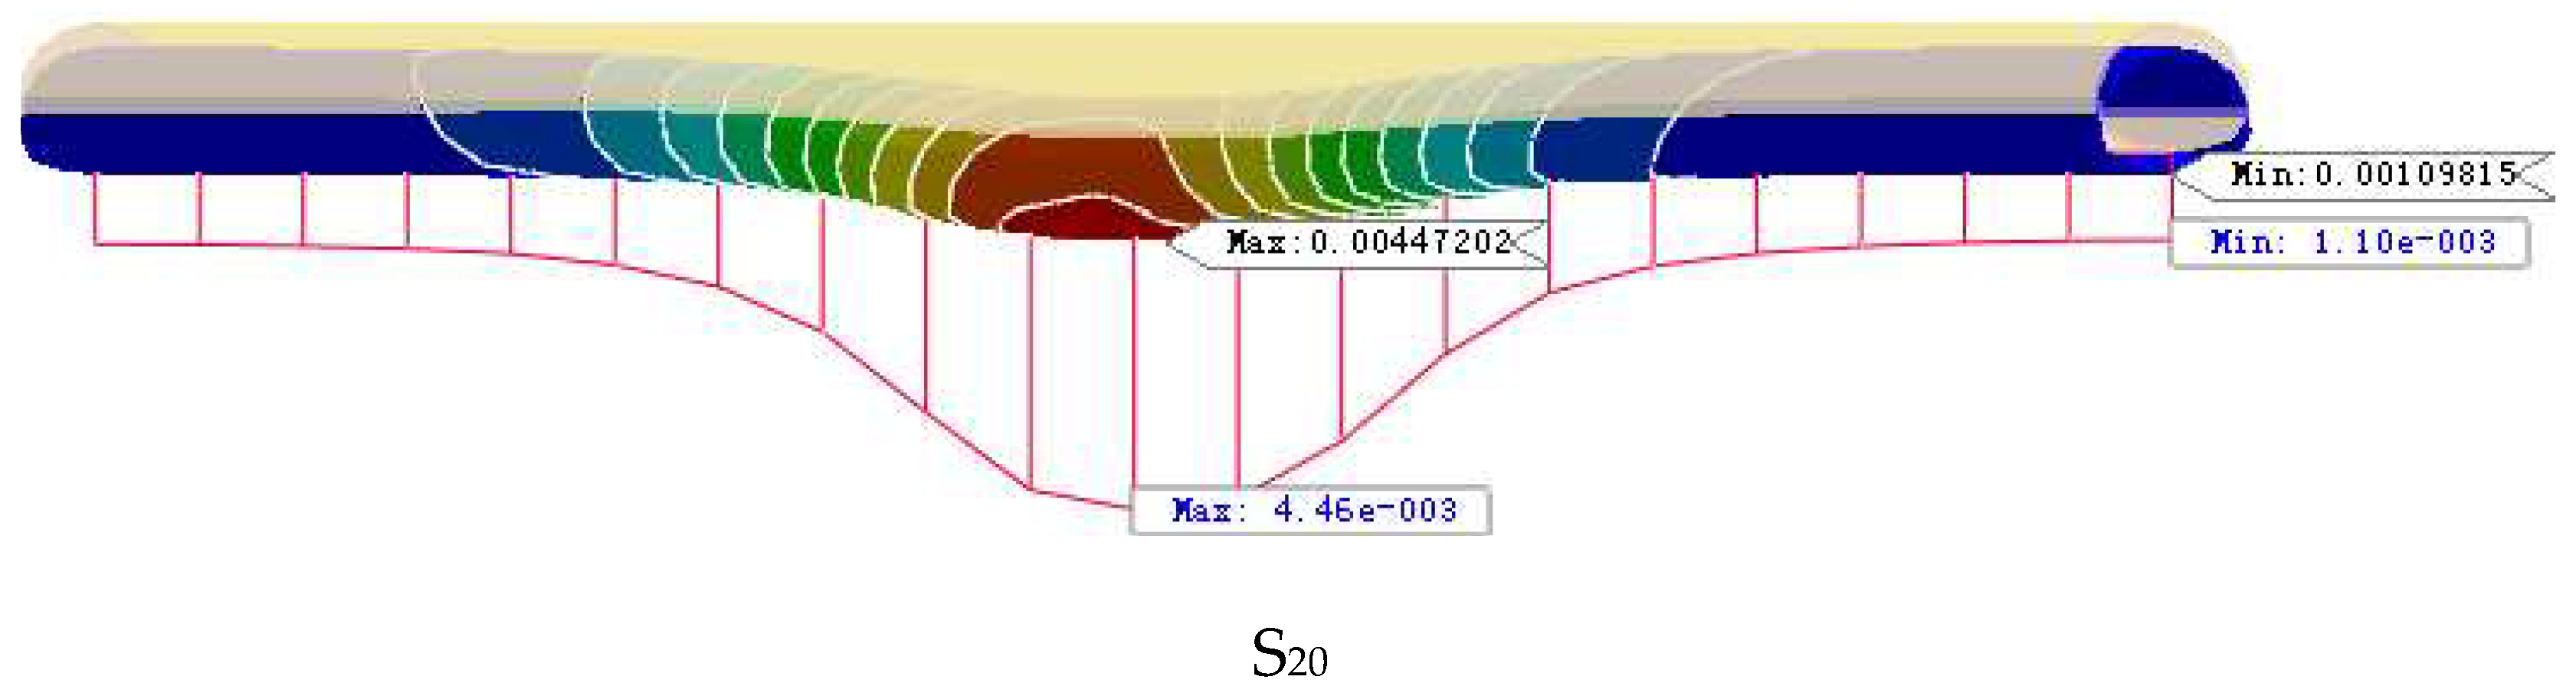
Figure 13.
Combination of track surface settlement curves of existing tunnels with different timing steps.
Figure 13.
Combination of track surface settlement curves of existing tunnels with different timing steps.
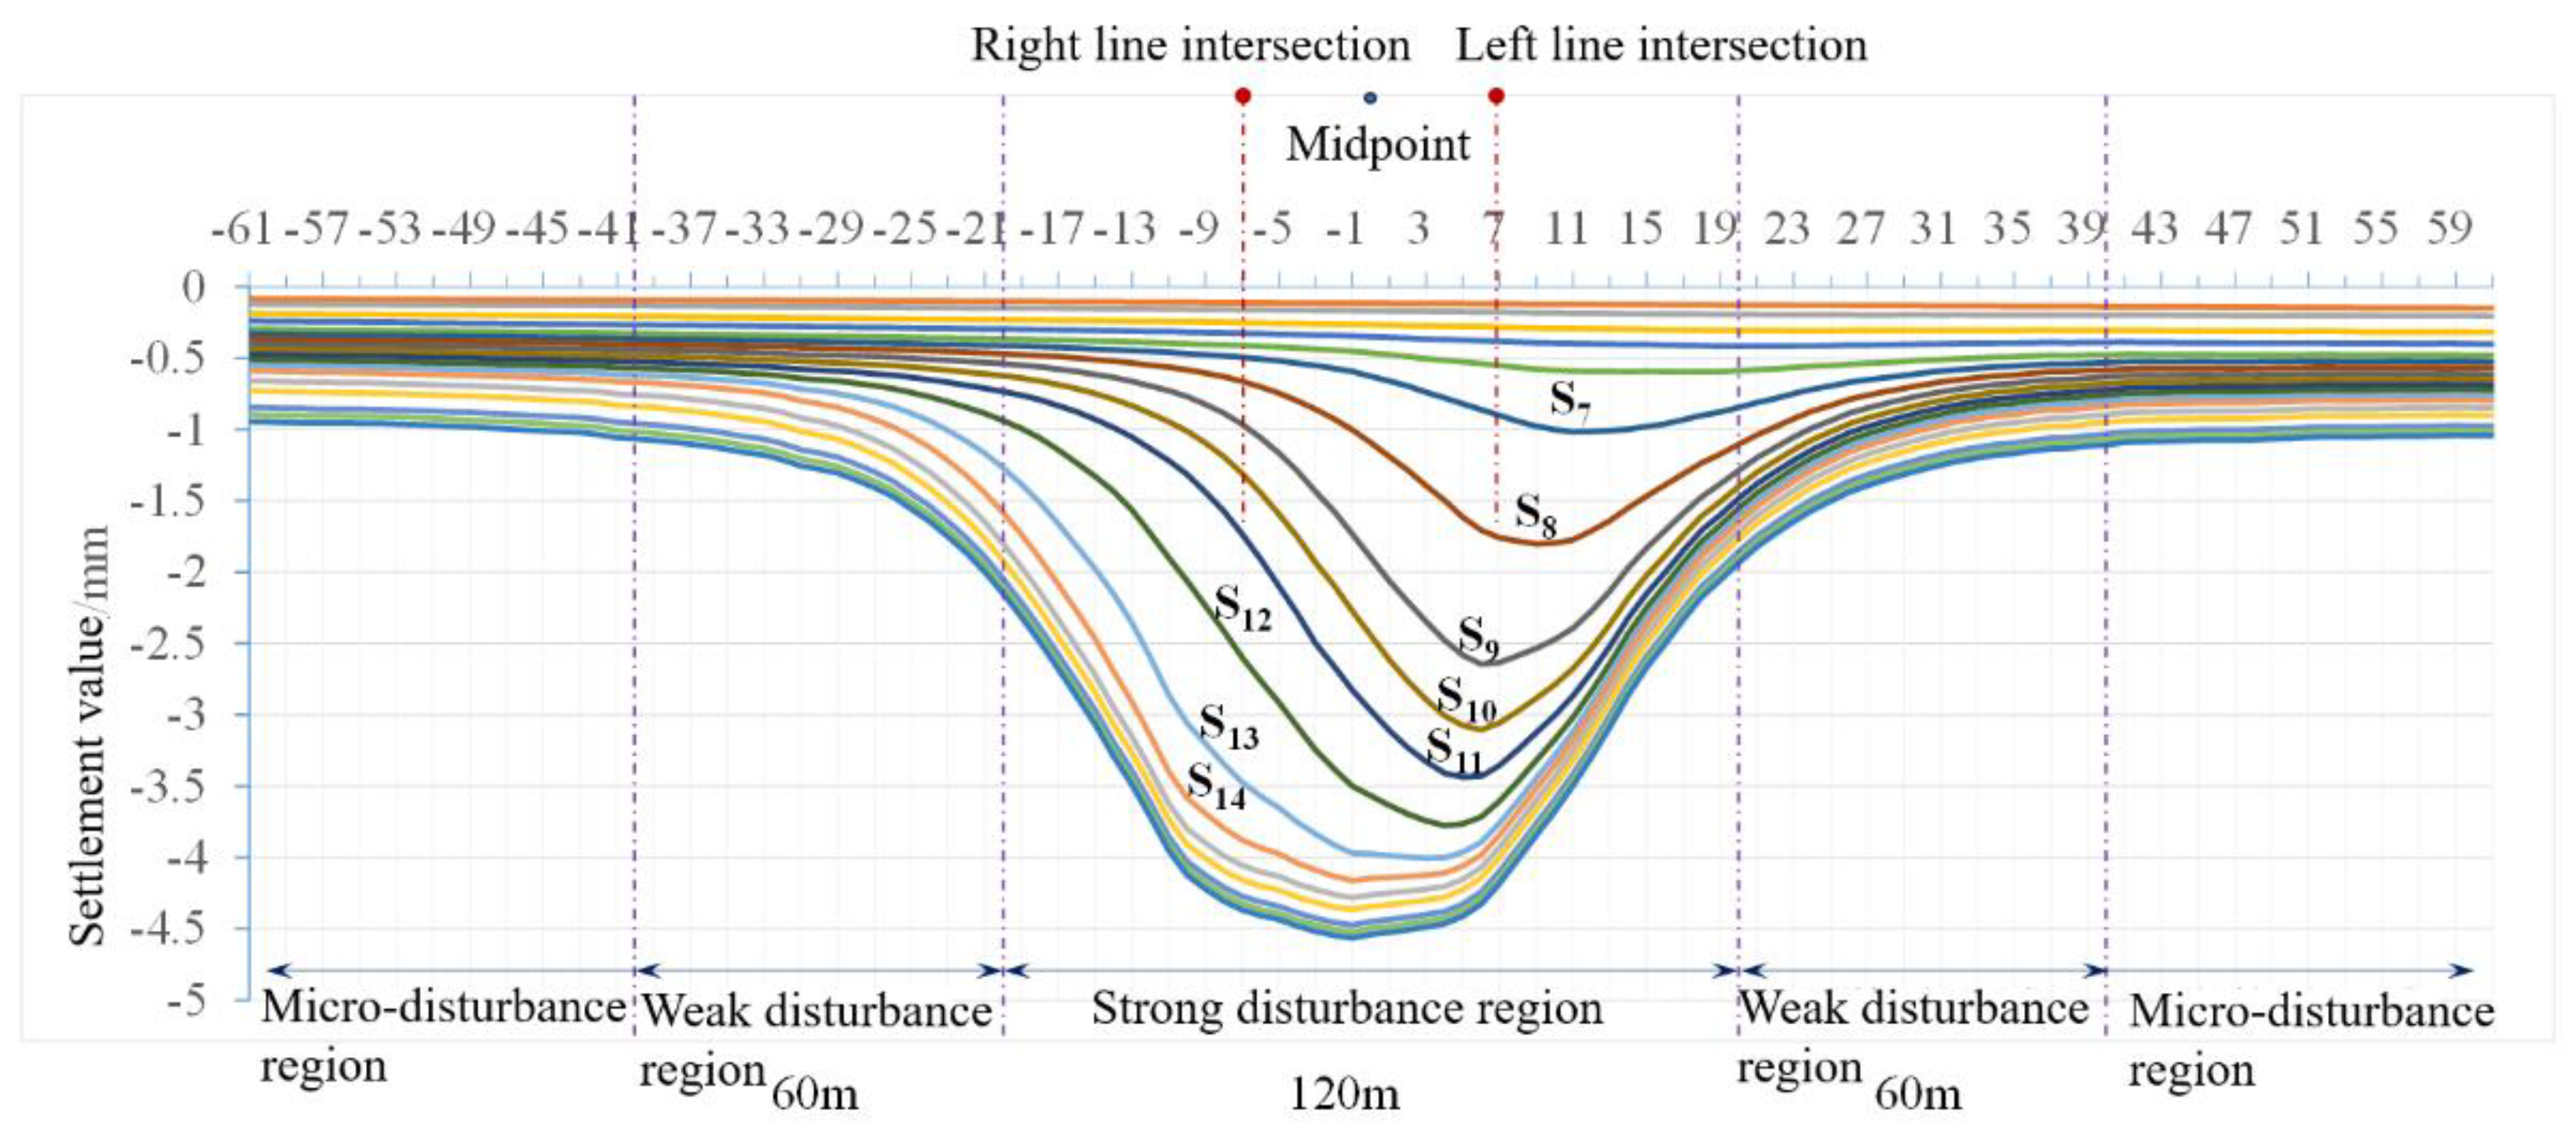
Figure 14.
Clouds of the overall displacement of the rock layer under blasting loads.
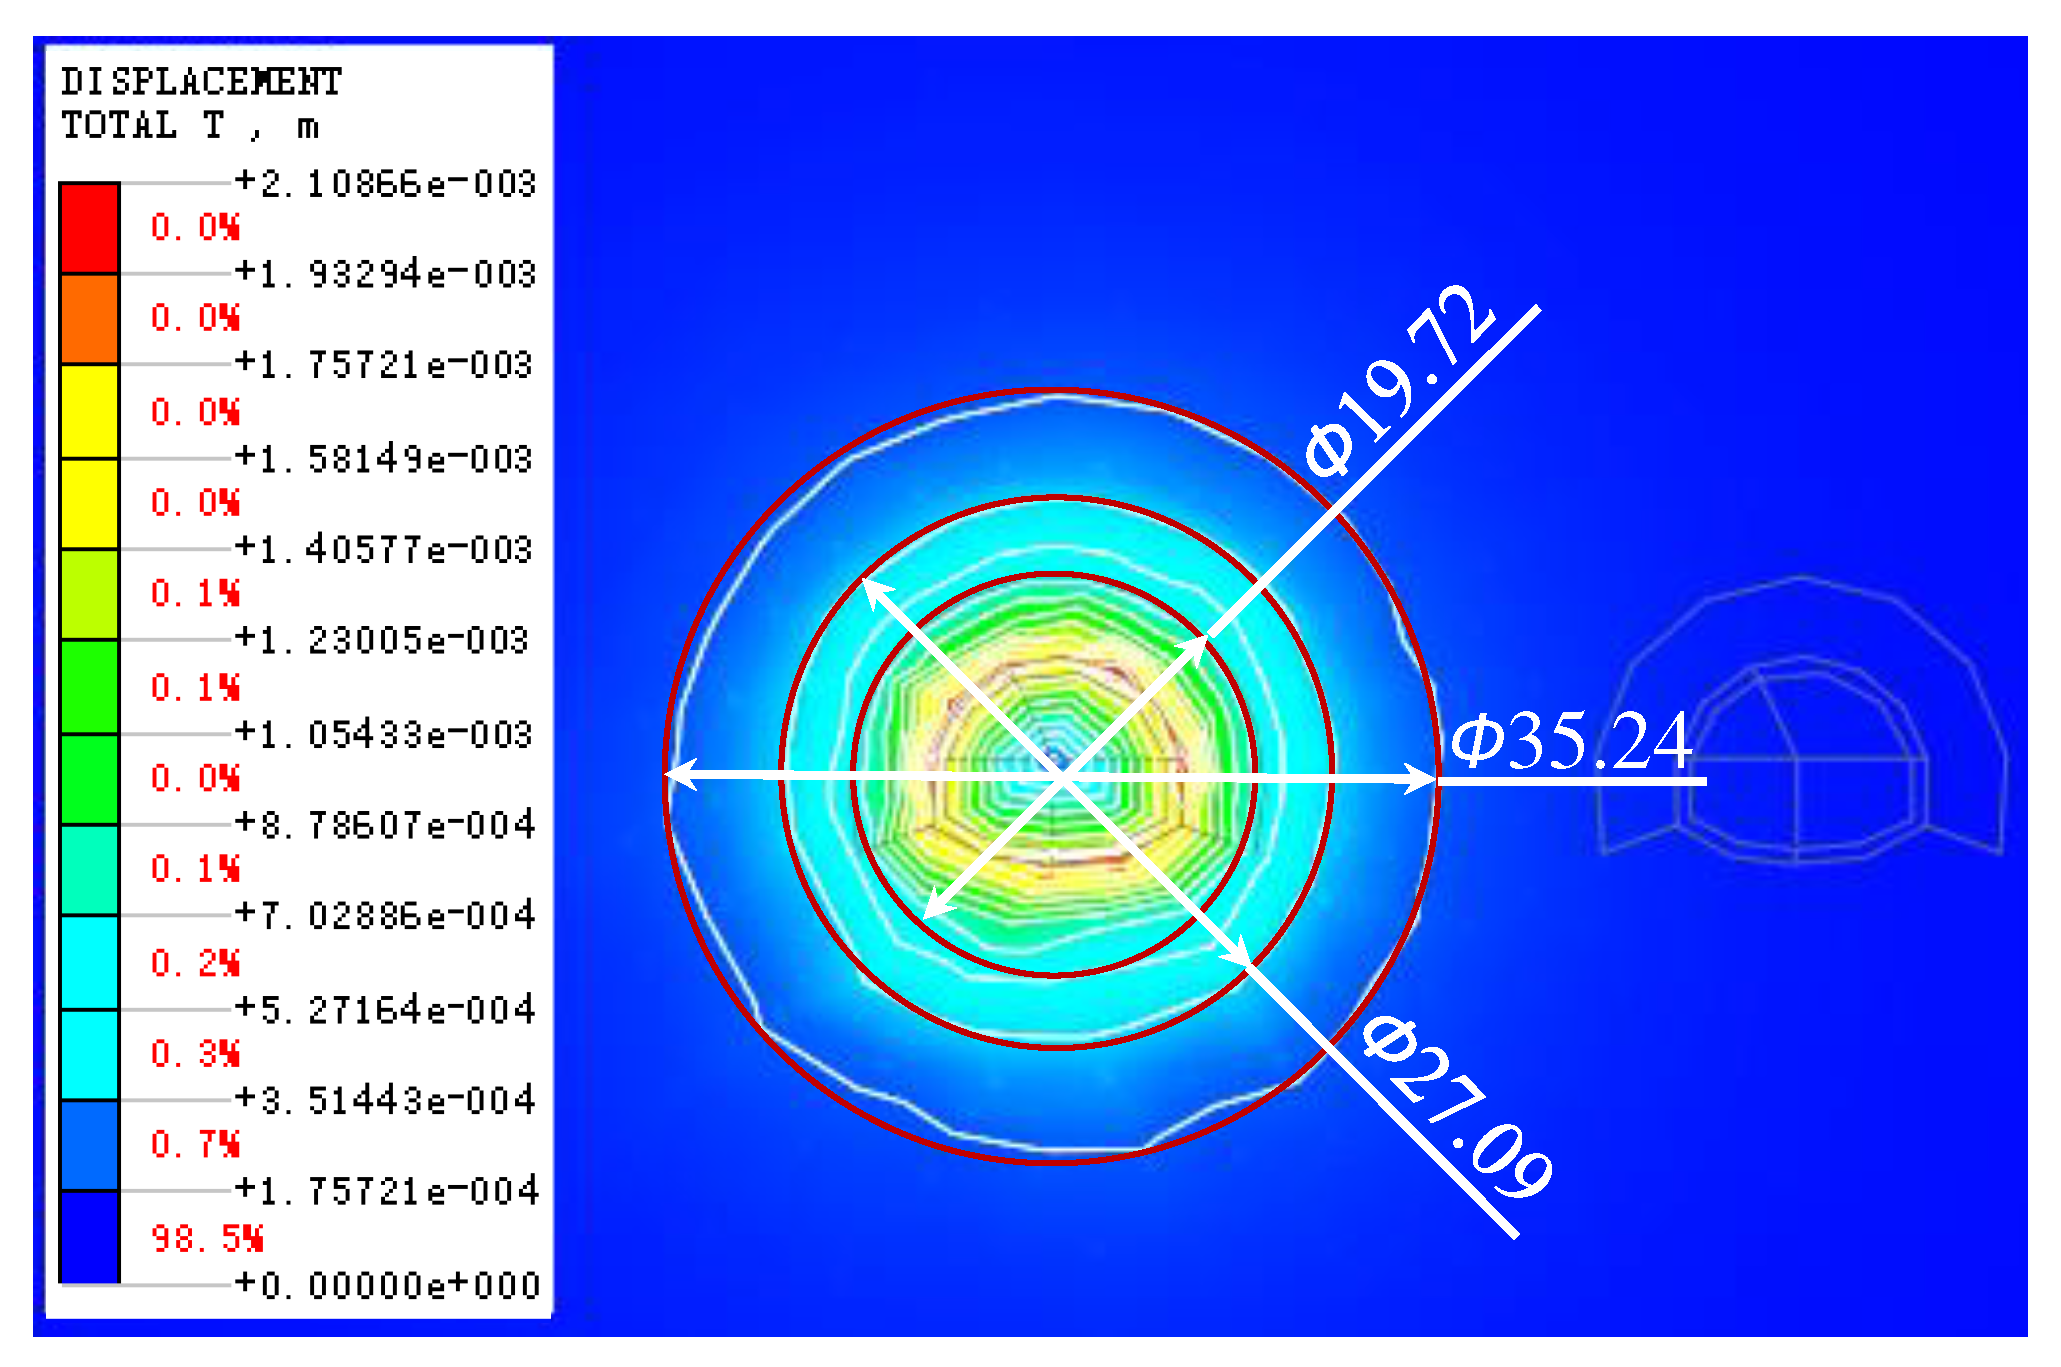
Figure 15.
Clouds of the overall vibration velocity of the rock formation under blasting loads.
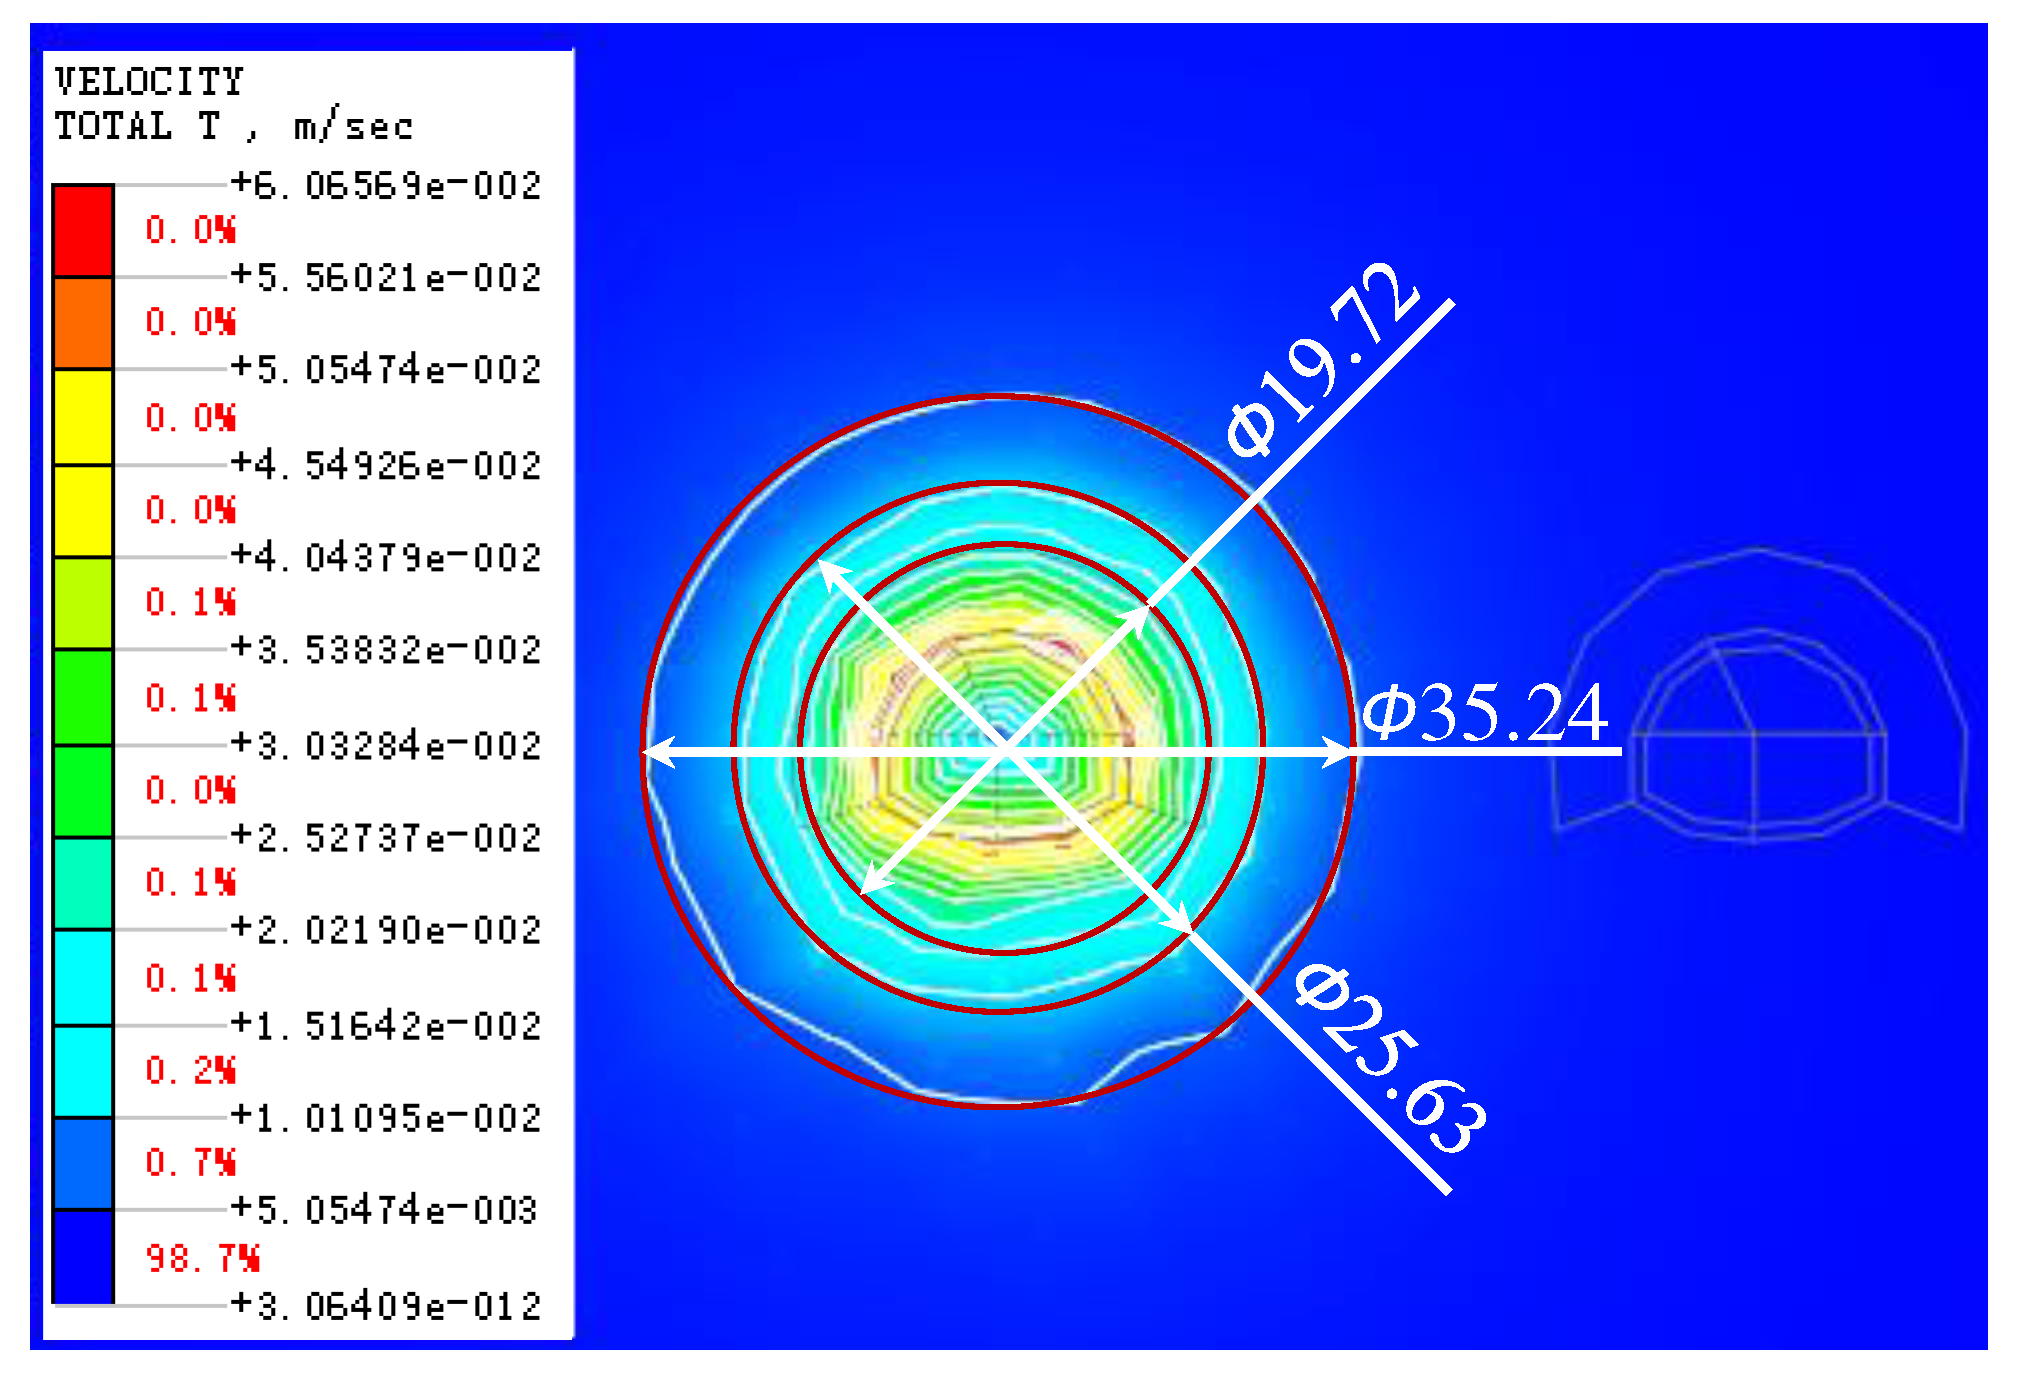
Figure 16.
Von Mises stress cloud of rock formation under blasting loads.
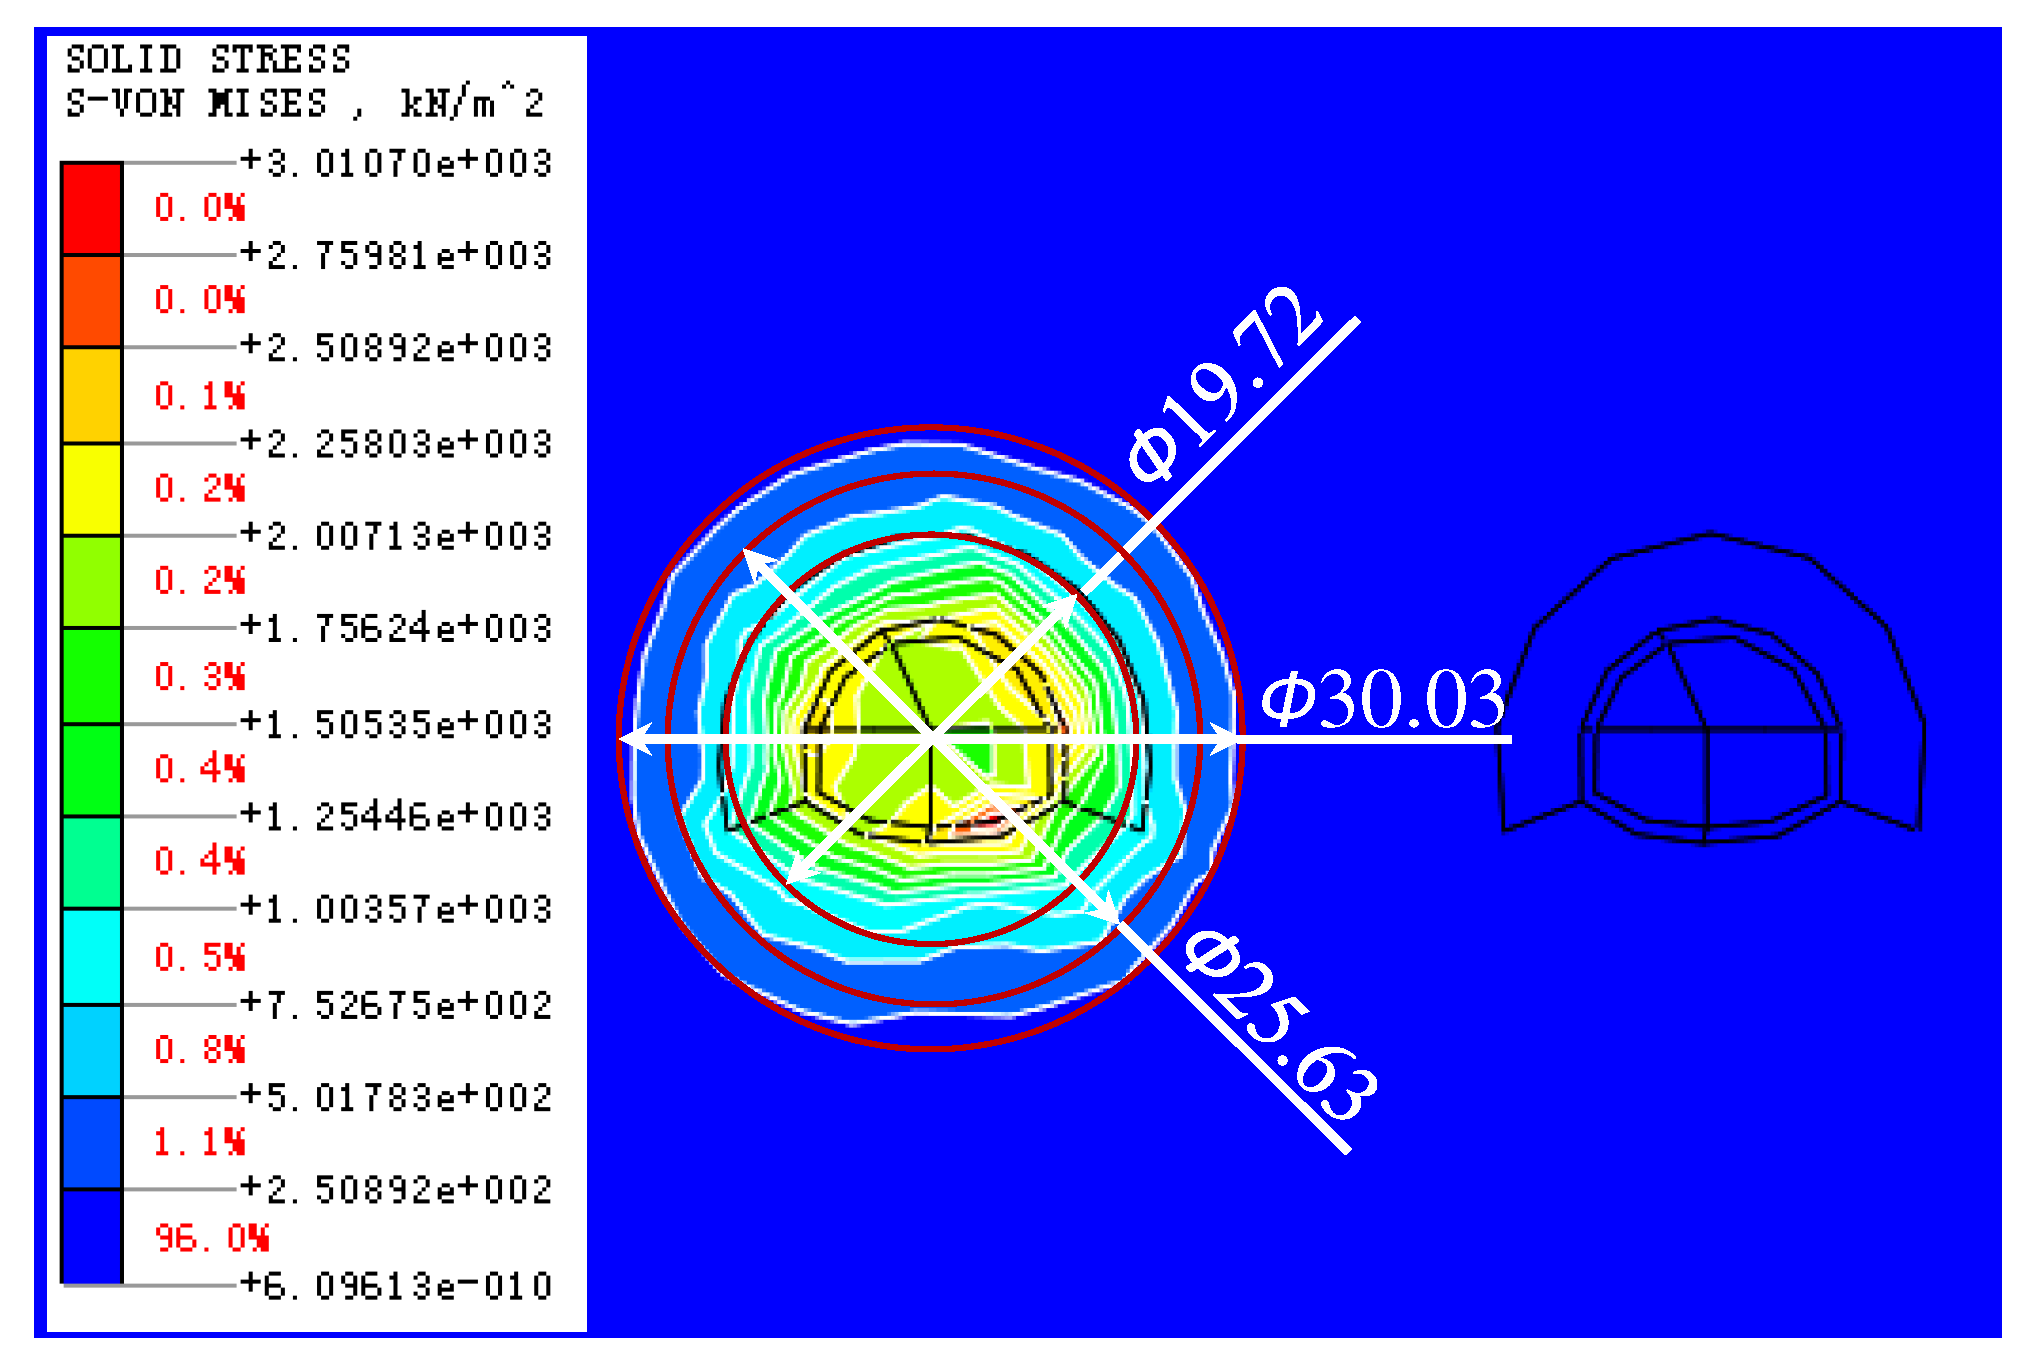
Figure 17.
Clouds of the overall displacement of the rock layer under the dynamic load of the train.
Figure 17.
Clouds of the overall displacement of the rock layer under the dynamic load of the train.
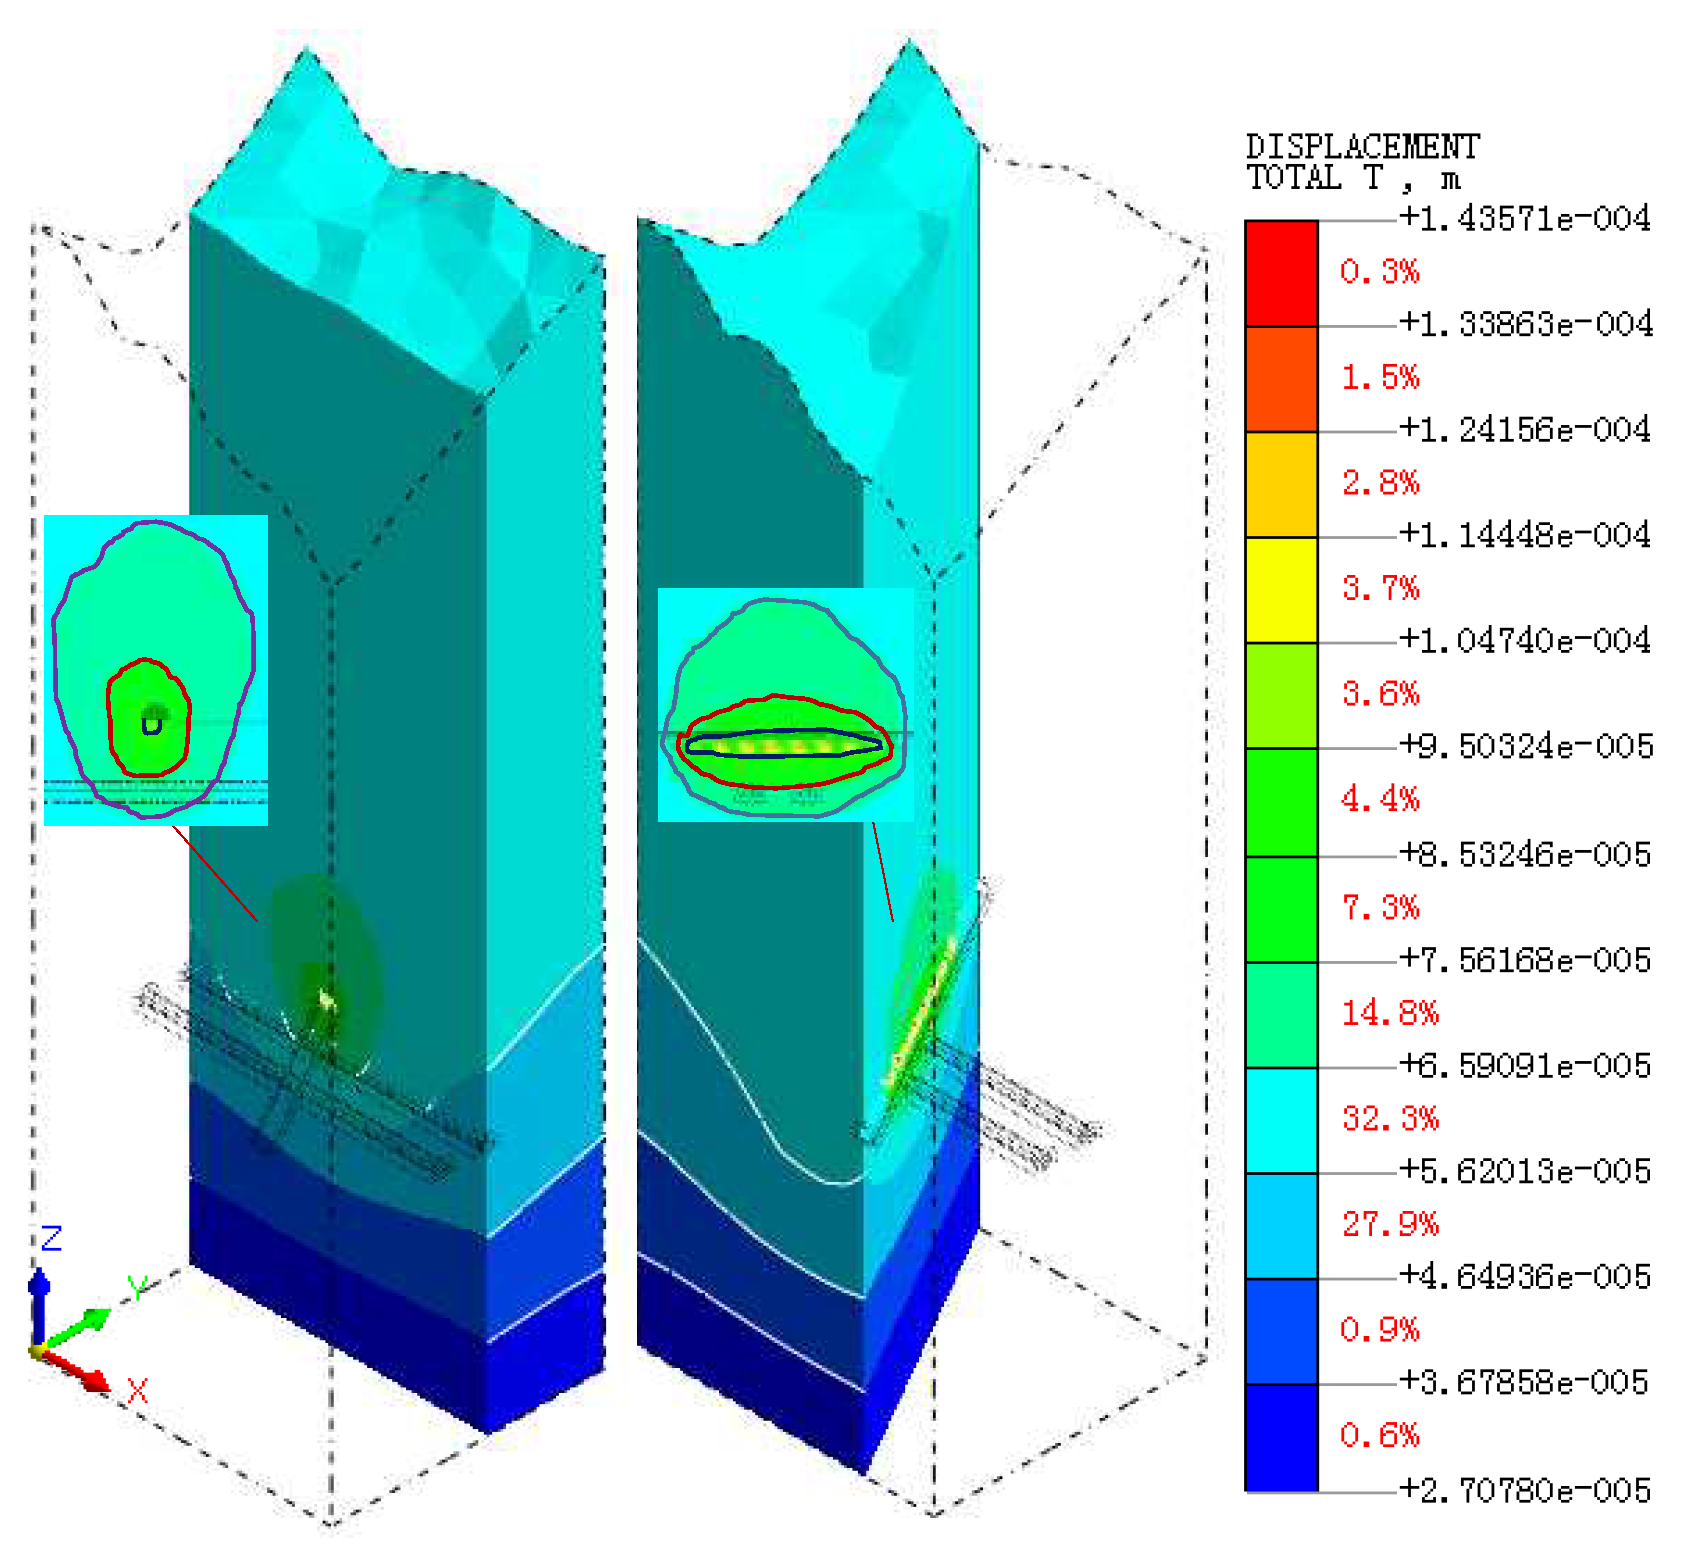
Figure 18.
Overall vibration velocity of the rock formation under dynamic train loading.
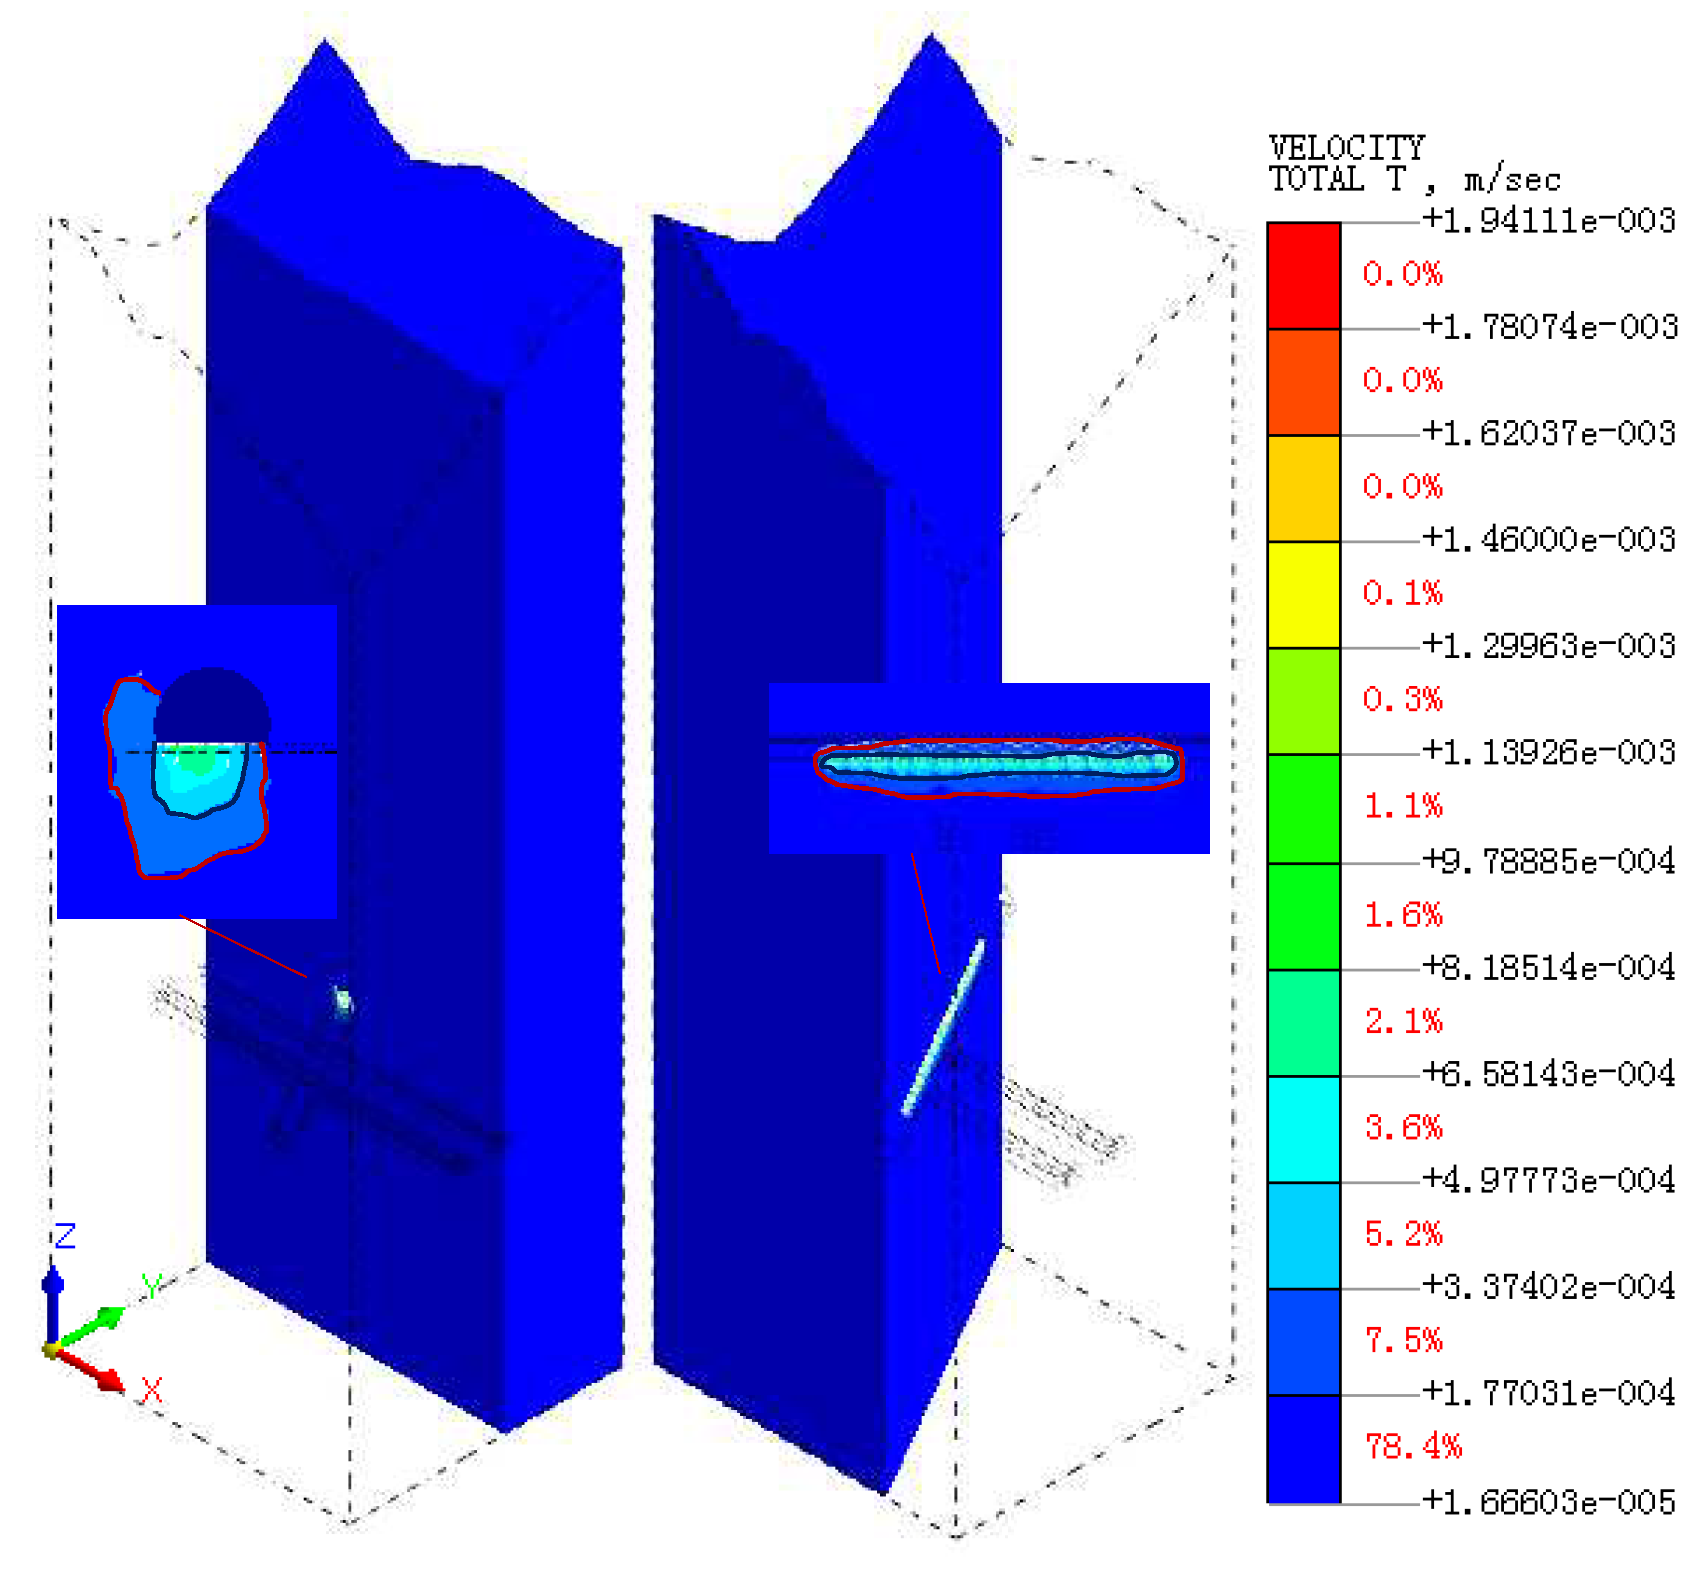
Figure 19.
Von Mises stress map of the rock layer under dynamic train loading.
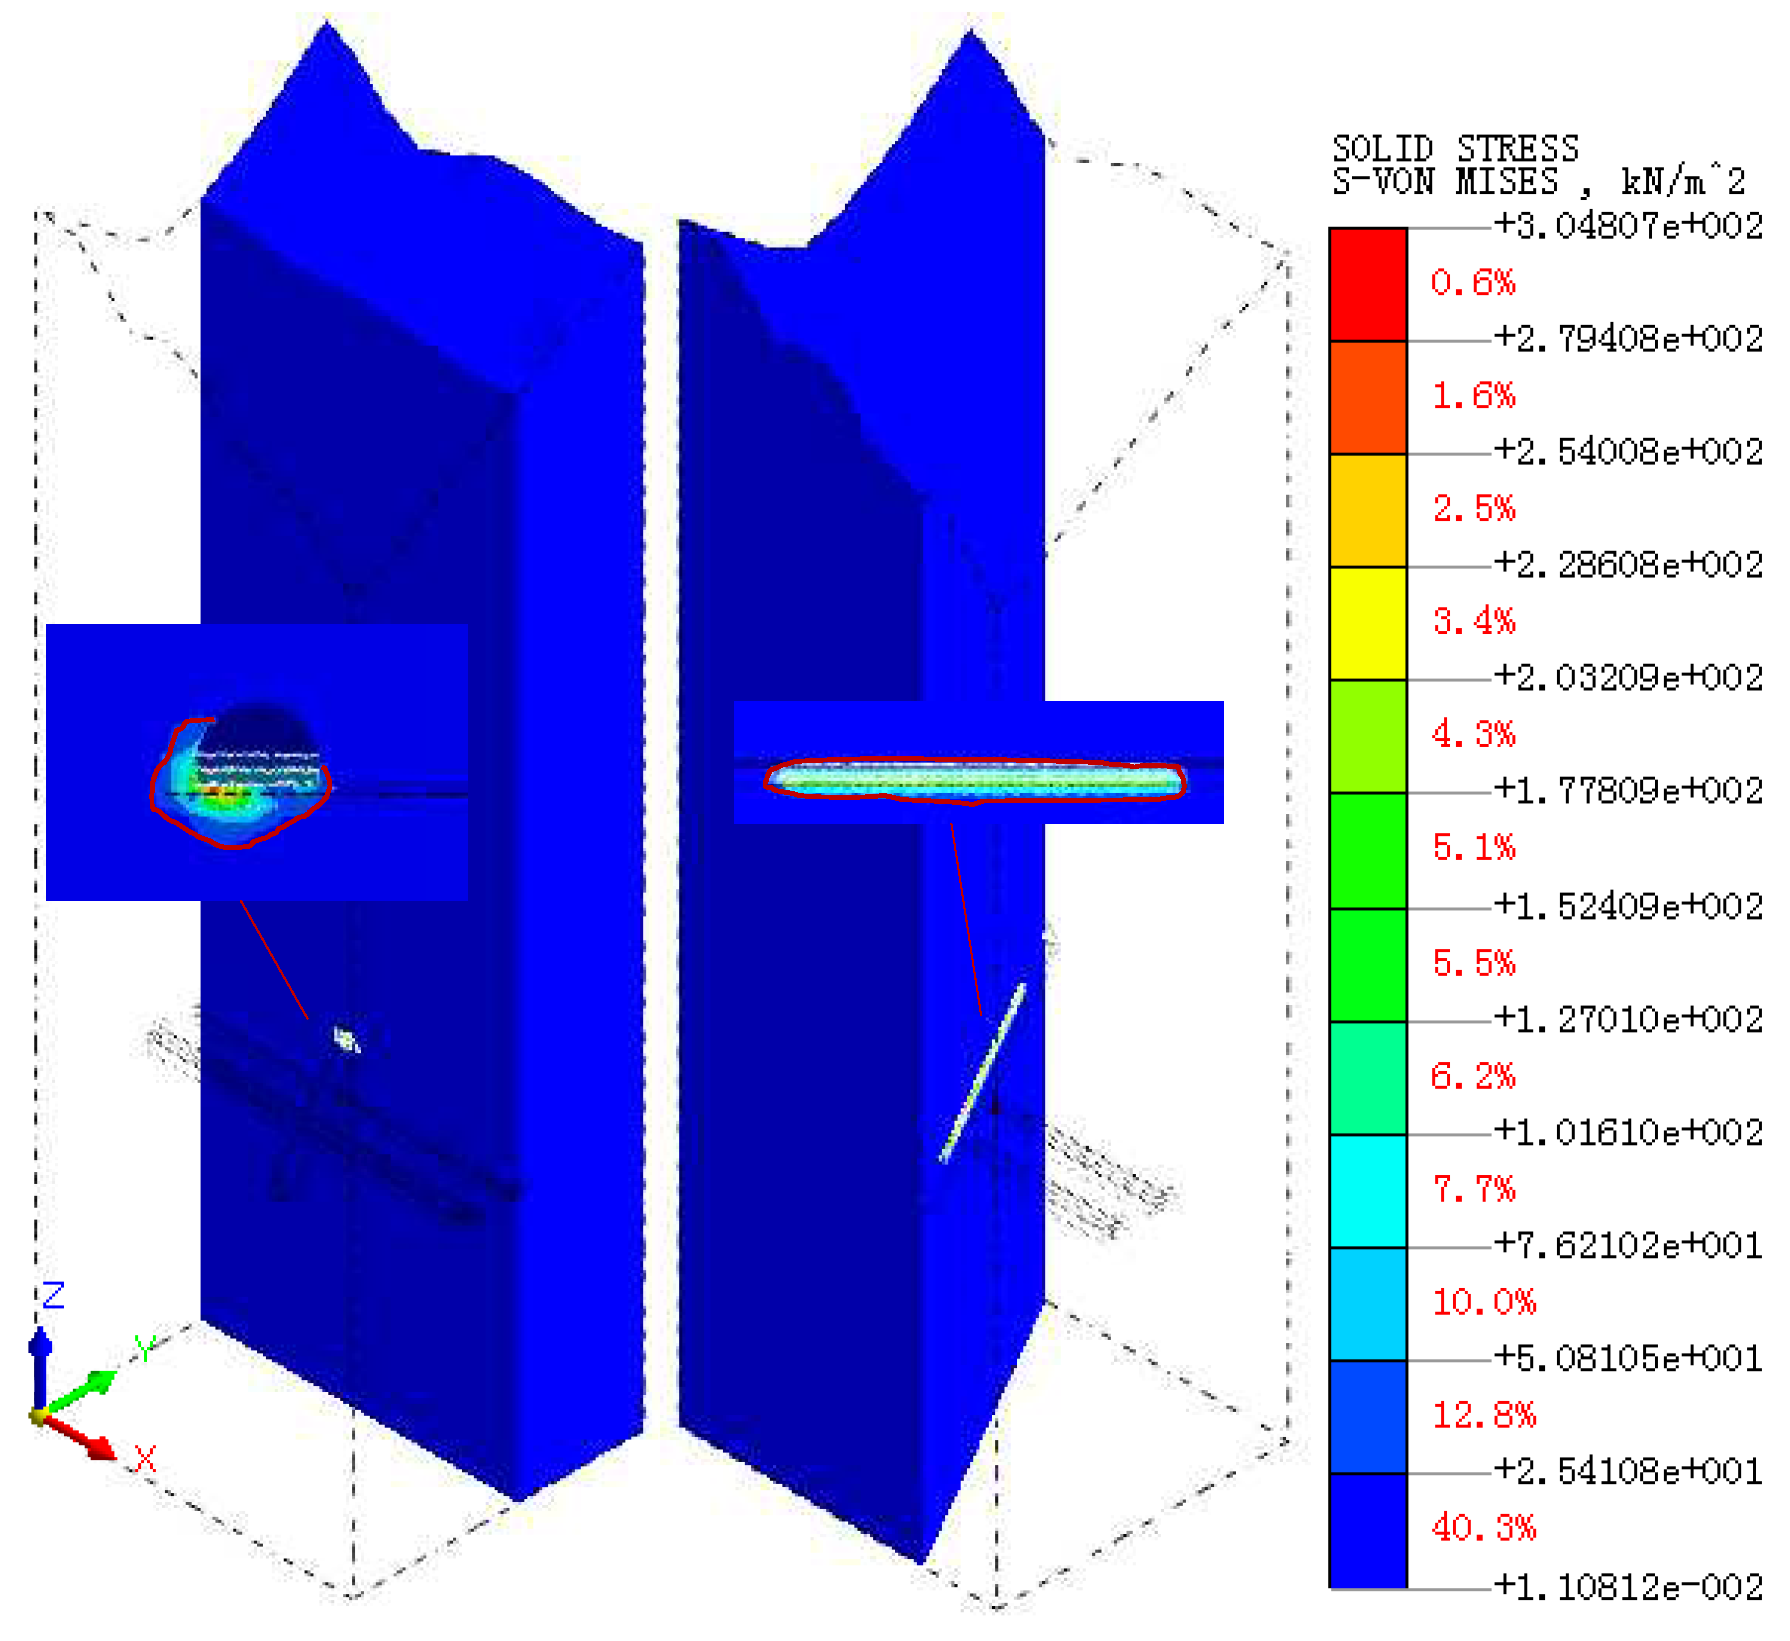
Figure 20.
Determination of the region of influence of rock formations under dynamic train loads.
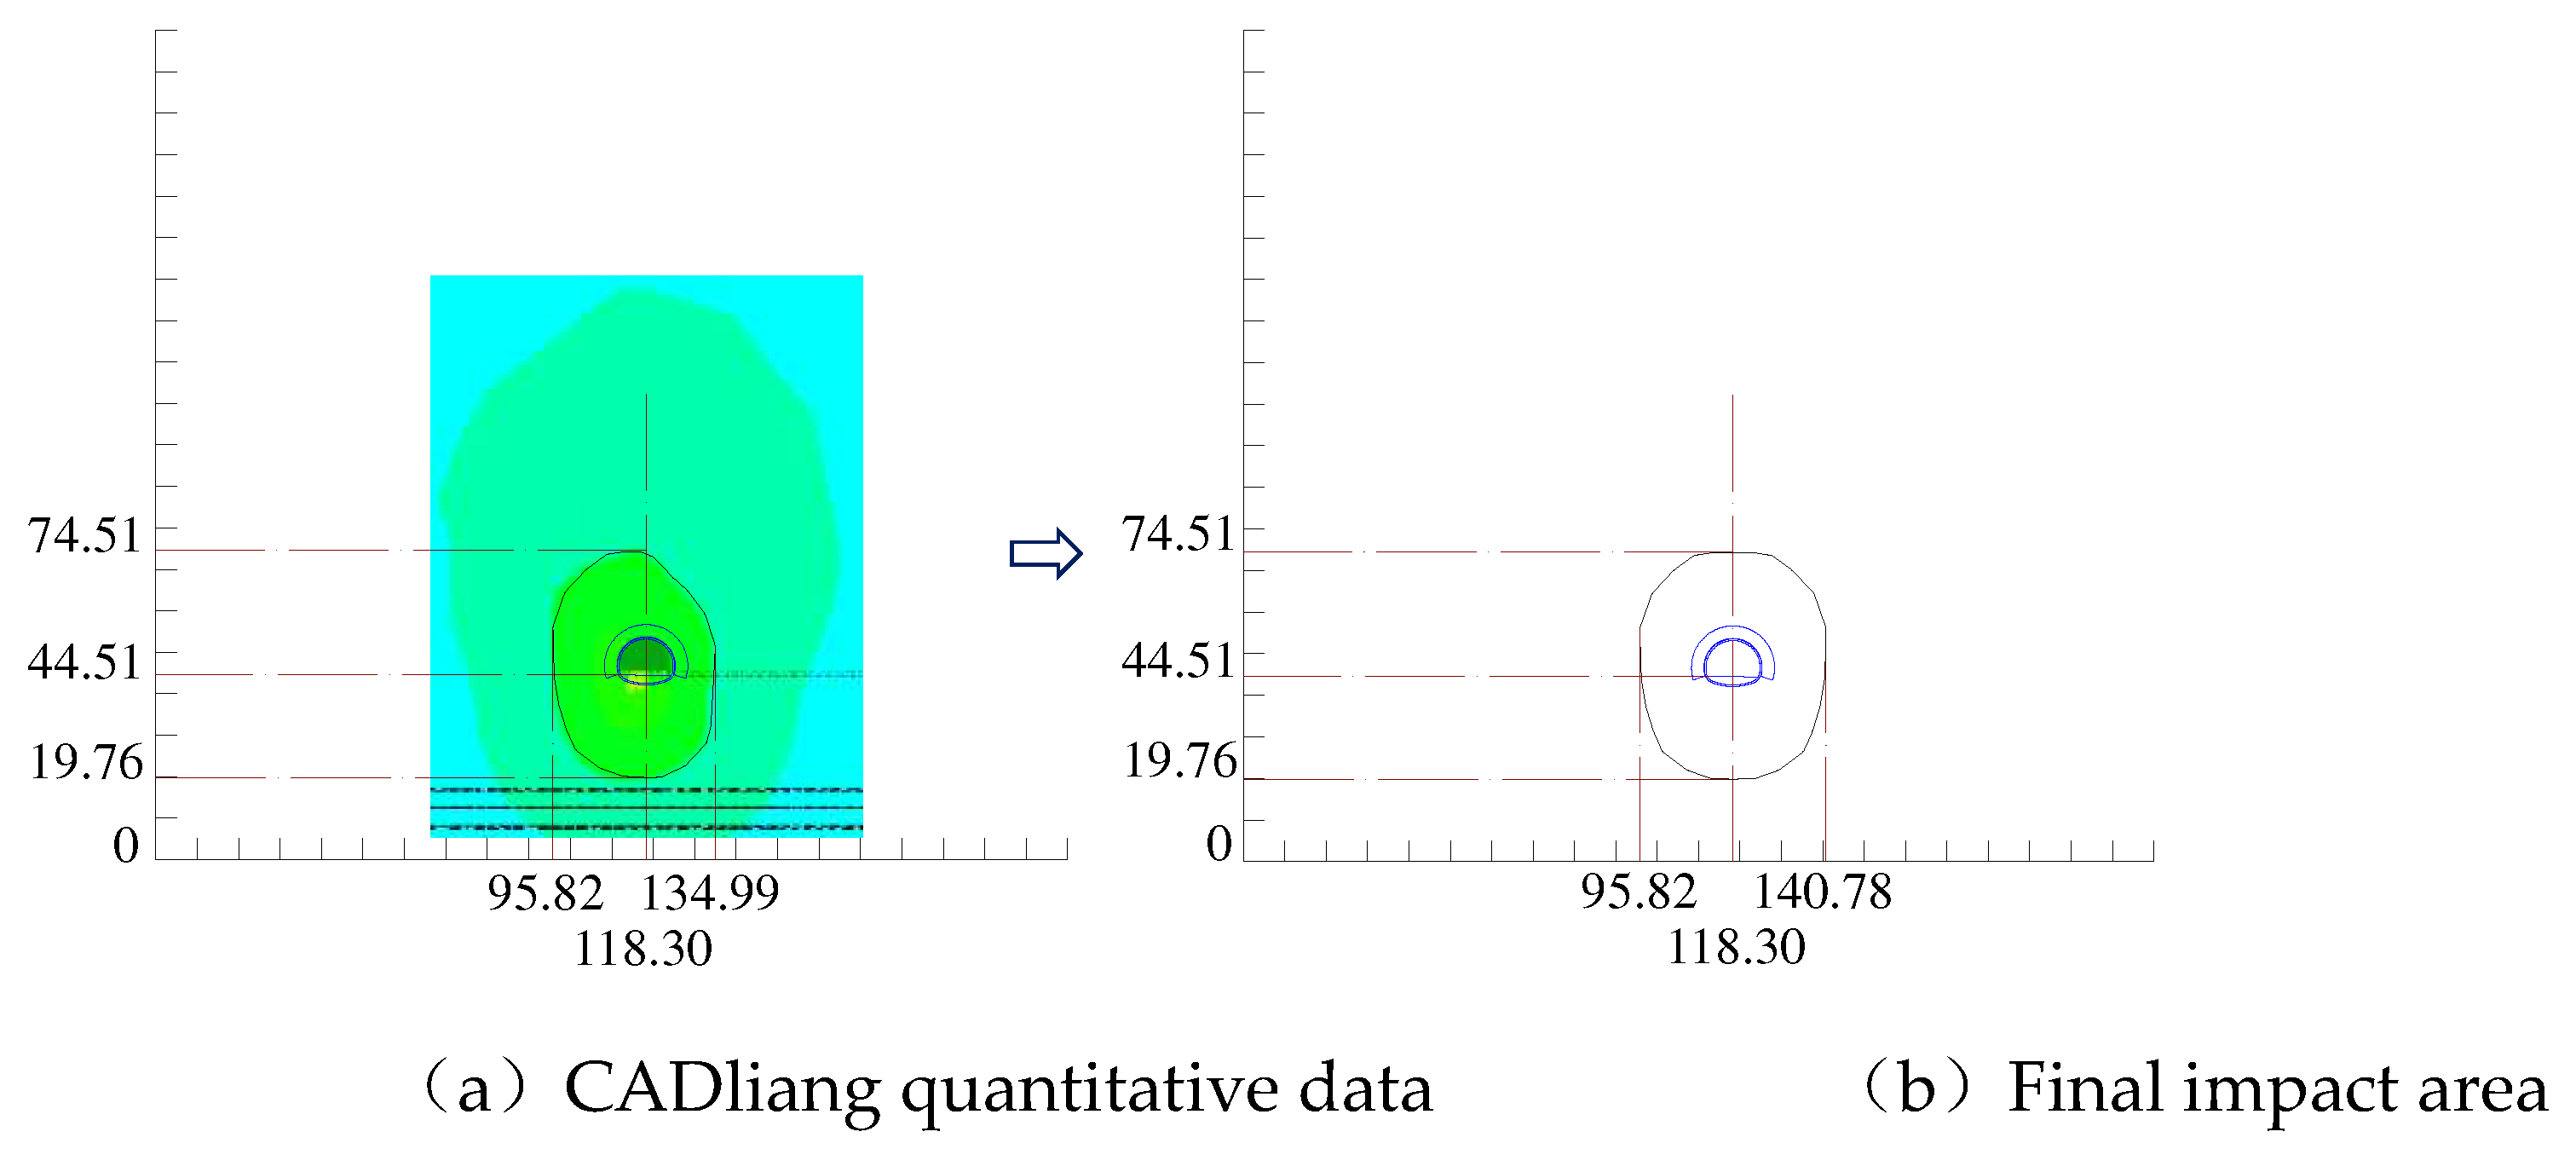
Figure 21.
Areas affected by the excavation of new tunnels.
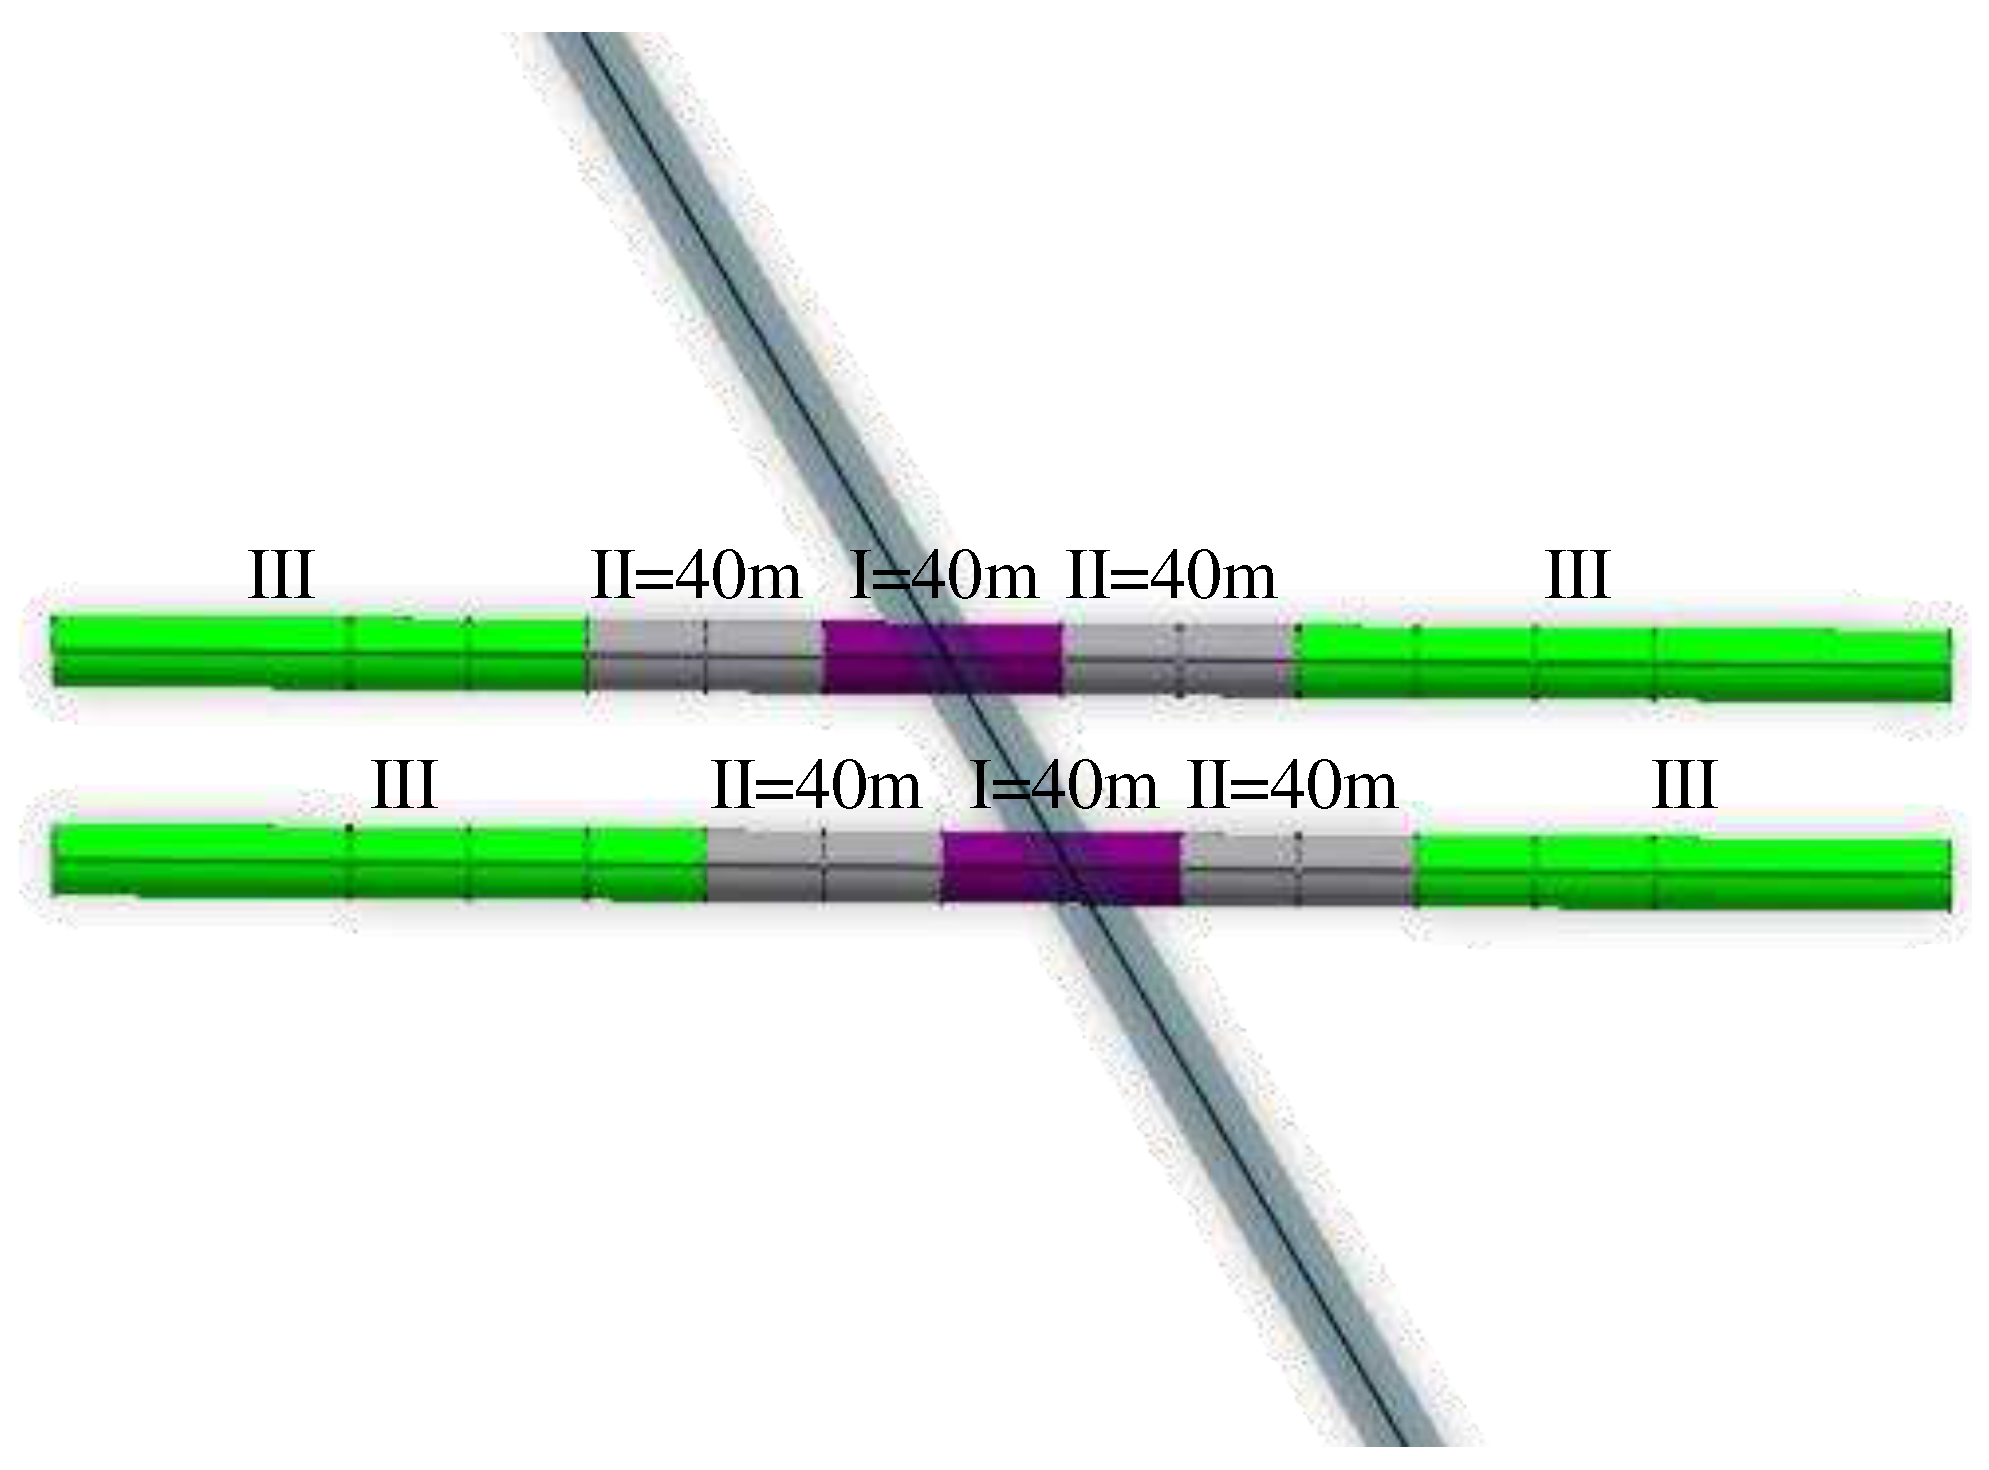
Figure 22.
Two-Lane Highway Tunnel Underpass Existing Railway Tunnel Excavation Impact Area.
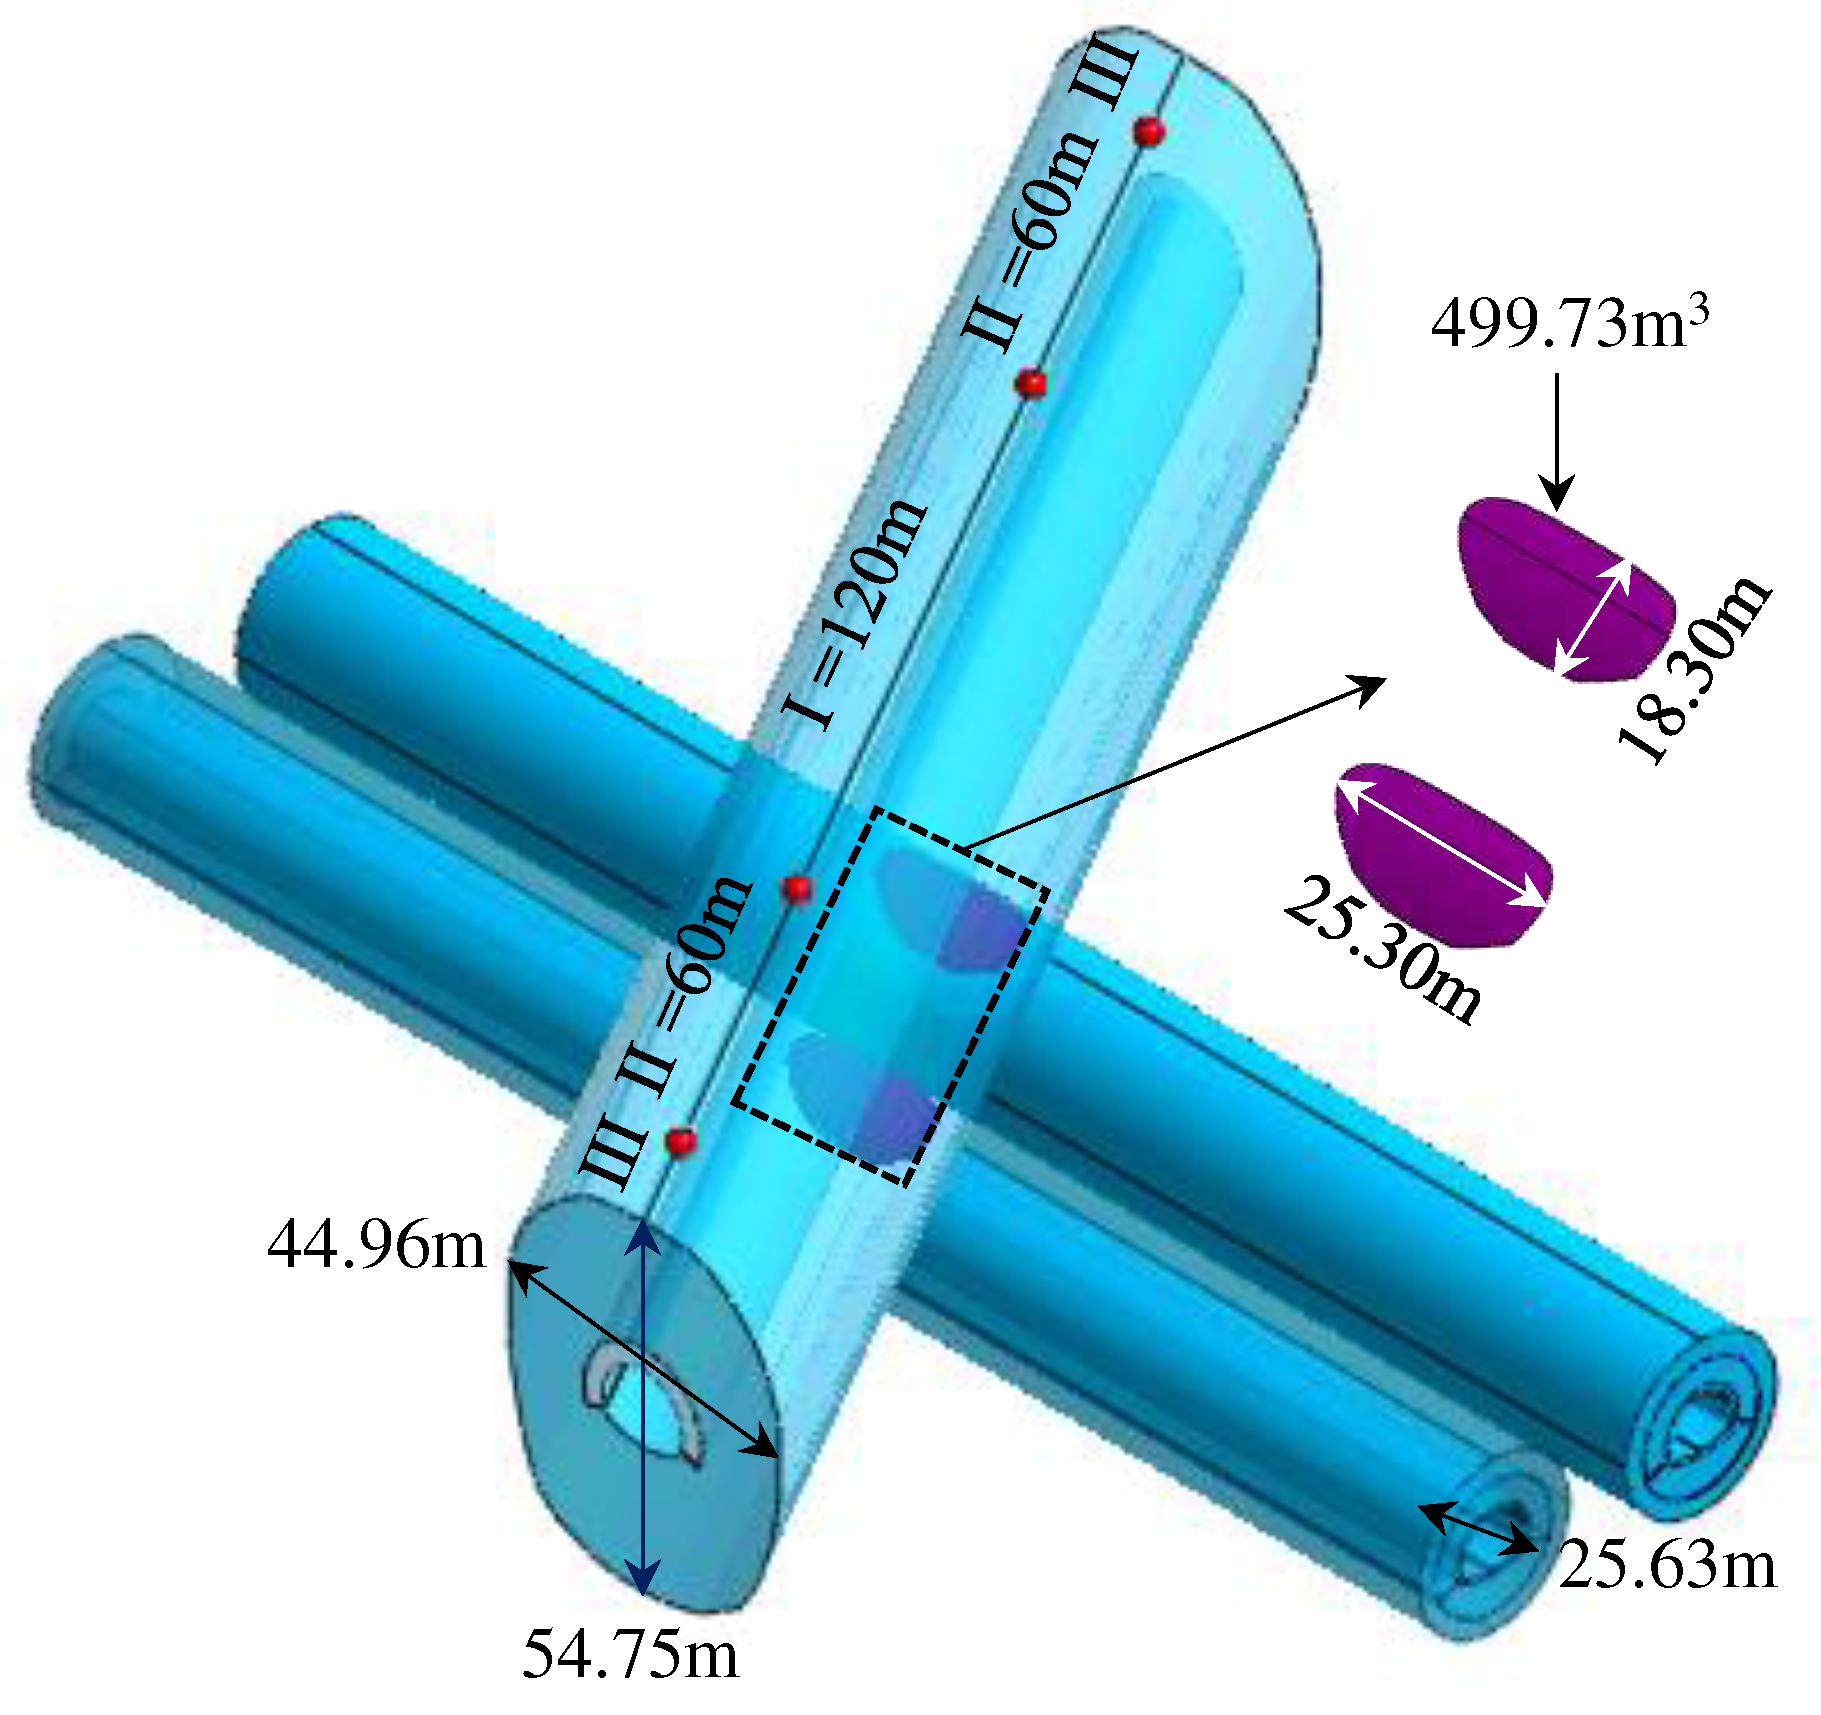

Table 1.
Parameters of peripheral rock support of Shiqian Wanshoushan Highway Tunnel.
| Sports Event | Tunnel Support Parameters of Shiqian Expressway | Hurong Railway Tunnel Support Parameters | |
|---|---|---|---|
| Initial support | C25 spray concrete | 28cm | 23cm |
| Φ6.5 steel mesh | @20×20cm | @20×20cm | |
| Initial support reinforcement measures | 22a I-beam @60cm closed into a ring | 22a I-beam @60cm closed into a ring | |
| Sprayed steel-framed concrete | System anchor | @60×100cm, L=3.5m, C20 flux-coiled anchors | @120×100cm, L=3.5m, C20 flux-coiled anchors |
| C25 spray concrete | 22cm | 20cm | |
| Steel frame | 16a I-beam @60cm closed into a ring | 16a I-beam @100cm closed into a ring | |
| Secondary lining | 70cm C30 reinforced concrete | 45cm C35 reinforced concrete | |
| Vault | 70cm C30 reinforced concrete | 50cm C35 reinforced concrete | |
| Ancillary construction measures | T76L self-propelled anchor + small conduit in advance | T76L self-propelled anchor + small conduit in advance | |
Table 2.
Table of Rock Mechanical Parameters.
| Enterprise | Materials | E(GPa) | μ | γ(kN/m3) | c(MPa) | φ(°) | σ(MPa) |
|---|---|---|---|---|---|---|---|
| Stratum | Malmstone | 5.09 | 0.31 | 23.13 | 2.25 | 35.82 | 8.90 |
| Mudstone | 2.15 | 0.33 | 23.89 | 1.03 | 33.48 | 3.84 | |
| Highway tunnel | anchor support | 42 | 0.2 | ||||
| steel-frame grating support | 52 | 0.2 | |||||
| Railway tunnel | anchor support | 31 | 0.2 | ||||
| steel-frame grating support | 43 | 0.2 |
Note: γ=stratum unit weight;E=elastic modulus;μ=Poisson’s ratio;c=cohesion; φ=angle of internal friction; σ= compressive strength.
Table 3.
Vertical and horizontal rock reaction coefficients for different rock formations of 3D solid models.
Table 3.
Vertical and horizontal rock reaction coefficients for different rock formations of 3D solid models.
| Rock layers (top to bottom) | Model X, Y, Z direction rock reaction coefficient (t/m3) | ||||
|---|---|---|---|---|---|
| kLXh | kRXh | kFYh | kBYh | kZv | |
| Mudstone | 2665.52 | 4387.63 | 3145.71 | 2432.20 | |
| Malmstone | 7244.13 | 8970.20 | 7759.39 | 7153.64 | |
| Mudstone | 3000.16 | 3126.16 | 2946.43 | 2907.13 | |
| Malmstone | 5915.44 | 5884.53 | 5710.24 | 5710.24 | |
| Mudstone | 4530.42 | 4527.31 | 4384.49 | 4384.49 | |
| Malmstone | 9279.97 | 9156.92 | 8921.78 | 8921.78 | |
| Mudstone | 3433.82 | 3471.77 | 3330.95 | 3330.95 | |
| Malmstone | 9418.76 | 9440.04 | 9170.55 | 9170.55 | |
| Mudstone | 3778.67 | 4061.60 | 3665.52 | 3665.52 | |
| Malmstone | 12121.47 | 12114.00 | 11728.72 | 11728.72 | |
| Mudstone | 2872.95 | 2876.63 | 2781.49 | 2781.49 | |
| Malmstone | 8071.31 | 8006.92 | 7782.58 | 7782.58 | |
| Mudstone | 2849.02 | 3341.86 | 2944.74 | 2944.74 | |
| Malmstone | 10695.17 | 11704.80 | 10214.62 | 10214.62 | |
| Mudstone | 5055.50 | 3273.70 | 3833.84 | 3833.84 | |
| Malmstone | 16257.58 | 17026.51 | 16334.96 | 16334.96 | |
| Mudstone | 4388.29 | 4656.22 | 4334.61 | 4334.61 | |
| Malmstone | 14776.82 | 14146.10 | 14016.62 | 14016.62 | |
| Mudstone | 7913.75 | 8064.80 | 8000.96 | 8000.96 | |
| Malmstone | 7416.49 | 7348.26 | 7214.18 | 7214.18 | |
| Mudstone | 4157.90 | 4093.52 | 3915.15 | 3915.15 | |
| Malmstone | 10895.32 | 11533.88 | 10782.67 | 10782.67 | |
| Mudstone | 3940.98 | 3941.80 | 3755.93 | 3755.93 | |
| Malmstone | 11277.14 | 10721.60 | 10633.81 | 10633.81 | |
| Mudstone | 6106.59 | 6398.02 | 6045.57 | 6045.57 | |
| Malmstone | 6596.91 | 6338.03 | 6255.26 | 6255.26 | |
| Mudstone | 2212.34 | 2078.98 | 2073.10 | 2073.10 | 1556.58 |
Table 4.
Damping constants for different rock formations.
| Rock Stratum | cp | cs |
|---|---|---|
| Mudstone | 278.584 | 140.3275 |
| Malmstone | 407.594 | 212.2705 |
Table 5.
Table of maximum detonating charges for different distances and different vibration velocities.
Table 5.
Table of maximum detonating charges for different distances and different vibration velocities.
| Distance from the Centerline R (M) |
The Maximum Amount of Explosive Charge at a Time Q (Kg) |
Circular Footage (M) | Mass Vibration Velocity V (cm/S) |
|---|---|---|---|
| 30 | 1.7 | 0.6 | 2.00 |
| 40 | 4.0 | 0.6 | 2.00 |
| 50 | 8.0 | 1.0 | 2.00 |
| 60 | 8.0 | 1.0 | 1.52 |
| 70 | 12 | 1.0 | 1.48 |
| 80 | 18 | 1.0 | 1.48 |
| 90 | 26 | 2.0 | 1.49 |
| 100 | 36 | 2.0 | 1.50 |
| 110 | 48 | 3.0 | 1.50 |
| 120 | 62 | 3.0 | 1.48 |
Table 6.
Table of Blasting Parameters for Upper and Lower Step Excavation.
| Name of Shell Hole | Number of Millisecond Detonator Segments | Depth of Hole (m) |
Hole | Single Hole Charge (kg) |
Charge of Single Section (kg) |
|---|---|---|---|---|---|
| CU1 | 1 | 1.4 | 8 | 0.8 | 6.4 |
| CU2 | 3 | 1.3 | 8 | 0.6 | 4.8 |
| AU1 | 5 | 1.1 | 16 | 0.4 | 6.4 |
| AU2 | 7 | 1.1 | 16 | 0.4 | 6.4 |
| AU3 | 9 | 1.1 | 18 | 0.4 | 7.2 |
| AU4 | 11 | 1.1 | 20 | 0.4 | 8.0 |
| PU1 | 13 | 1.1 | 26 | 0.3 | 7.8 |
| BU1 | 15 | 1.1 | 16 | 0.5 | 8.0 |
| AD1 | 1 | 1.1 | 12 | 0.6 | 7.2 |
| AD2 | 3 | 1.1 | 12 | 0.6 | 7.2 |
| AD3 | 5 | 1.1 | 13 | 0.6 | 7.8 |
| AD4 | 7 | 1.1 | 13 | 0.6 | 7.8 |
| PD1 | 9 | 1.1 | 12 | 0.4 | 4.8 |
| BD1 | 11 | 1.3 | 13 | 0.6 | 7.8 |
| subtotal | 203 | 97.6 |
Note: A=auxiliary hole;B=floor hole; C=cut hole; P=peripheral hole; U=upper step; D=downward step.
Disclaimer/Publisher’s Note: The statements, opinions and data contained in all publications are solely those of the individual author(s) and contributor(s) and not of MDPI and/or the editor(s). MDPI and/or the editor(s) disclaim responsibility for any injury to people or property resulting from any ideas, methods, instructions or products referred to in the content. |
© 2023 by the authors. Licensee MDPI, Basel, Switzerland. This article is an open access article distributed under the terms and conditions of the Creative Commons Attribution (CC BY) license (http://creativecommons.org/licenses/by/4.0/).
Copyright: This open access article is published under a Creative Commons CC BY 4.0 license, which permit the free download, distribution, and reuse, provided that the author and preprint are cited in any reuse.
Submitted:
04 December 2023
Posted:
05 December 2023
You are already at the latest version
Alerts
A peer-reviewed article of this preprint also exists.
This version is not peer-reviewed
Submitted:
04 December 2023
Posted:
05 December 2023
You are already at the latest version
Alerts
Abstract
The research on the impact of excavation of underpass tunnels has already had certain results, but there is a lack of research cases of double-line highway tunnels with oblique angles underpass the existing railway tunnels, especially the method of determining the area of the impact of the dynamic and static loads of the new tunnels and existing trains to be enriched by considering them at the same time. In this paper, based on the tunnel project of the new double-line Shiqian Highway Tunnel with oblique angles underpass the Hurong Railway in Wanshoushan. By constructing a three-dimensional finite element model and simulating the application of static tunnel excavation load, dynamic blasting load and dynamic train operation load of the existing tunnel, the overall displacement of the existing tunnel and the settlement value of the bottom plate of the track surface by the static tunnel excavation load were analyzed. Then, the stresses, vibration speeds and displacements of the tunnel due to the dynamic blasting loads and the dynamic train operation loads were obtained. The results show that: the area of influence of the static loads of the new tunnel excavation on the existing tunnel is divided into three types of perturbations presenting strong, weak and slight; the area affected by the blasting dynamic load of new tunnel excavation is a circular domain with the datum point in the tunnel section as the center; the area affected by the dynamic load of train operation in the existing tunnel is an ellipse with the center of the track surface of the existing tunnel as the datum; there is an anomalous shape in the area affected by the blasting dynamic load of new tunnel excavation and the area affected by the dynamic load of train operation in the existing tunnel.
Keywords:
Subject: Environmental and Earth Sciences - Other
1. Introduction
With China's growing population and increasing traffic congestion, the development of underground space has become a mainstream trend, and the emergence of underground highway and railway tunnels has greatly eased traffic congestion [1,2,3]. However, due to the increase in the number of tunnels, it is inevitable that there will be spatial overlapping of tunnels, in which the lower part of new tunnels passes through the existing tunnels is a commonly used method in the project [4,5,6,7]. Excavation of new tunnels not only induces stress redistribution in the surrounding rock strata, but also generates additional stresses, settlement deformations and additional vibrations on the existing tunnels, resulting in the deterioration of the mechanical properties of the existing tunnel structures within a certain range of the underpass area [8,9,10]. When the clear distance between the cross section tunnels is small, there is an overlapping influence area between the excavation of the new tunnel and the train operation in the existing tunnel, which can lead to further deterioration of the mechanical properties of the surrounding rock [11,12,13]. Currently, there are fewer studies on the overlapping impact areas of tunnel crossing sections, especially lacking research cases of double-line highway tunnels passing under existing railway tunnels at oblique angles. Therefore, it is of great significance to study the area affected by excavation of road tunnels underpass existing railway tunnels.
At present, scholars have certain research results on the effects of static loads on excavation under existing tunnels for new tunnels [14,15,16]. Chakeri et al. [17] investigated the effect of tunnel depth, overburden pressure, tunnel dimensions and palisade pressure on tunnel displacements in a single-lane tunnel. Gue et al. [18] investigated the bending moments and deformation patterns of a newly constructed two-lane tunnel vertically crossing an existing tunnel at different clear distances by using centrifuge modeling tests. Avgerinos et al. [19] constructed a model of a newly constructed tunnel vertically underpass an existing tunnel by means of three-dimensional finite element (FE) software and analyzed the circumferential forces, bending moments, and lining deformations due to excavation. Chen et al. [20] systematically monitored the deformation characteristics and stress changes of new tunnels using a proximity earth pressure balance shield (EPBS) on existing tunnels based on a double tunnel project in sandy soil formation in Changsha City. It is proposed that the settlement development of the existing tunnel undergoes four stages: settlement, bulge, secondary settlement and reaching steady state, and it is found that the settlement caused by the second shield tunnel penetration is significantly larger than the settlement caused by the first tunnel penetration.
Vertical tunnel crossing is typical in the theoretical model, but in practical engineering, the angled crossing with more complex disturbances is often adopted. Shi et al. [21] investigated the response of underground pipes to tunnel boring by centrifuge tests. The results showed that the pipe-tunnel settlement and strain were related to the tunnel intersection angle, and the change was 20% higher at an intersection angle of 60° compared to 90° intersection angle. Lin et al. [22]studied the lateral deformation, transverse internal force and torsional deformation of new two-lane tunnels diagonally angled down through the existing tunnels based on the Changsha Metro Line 2 and Line 4 projects in China. The results show that the lateral deformation and lateral internal force of the existing tunnel show obvious asymmetric characteristics, and there are irrecoverable local torsional deformations on both sides of the new tunnel; the angle of intersection has almost no effect on the maximum settlement at the top of the existing tunnel, but it has a significant effect on the maximum settlement at the bottom, and it can be divided into three phases, i.e., a slow decrease (0-30°), a sharp decrease (30-60°) and slow decrease (60-90°).Further, Charles et al. [23] analytically summarized the stress redistribution patterns of new tunnels passing under existing tunnels at different angles of intersection by 3D centrifuge modeling.
At the same time, in addition to the static loads of excavation, more results have been obtained for the role of the dynamic loads of blasting excavation in new tunnels and the dynamic loads of train operation in existing tunnels.
In terms of dynamic loading of blasting and excavation of new tunnels, Shin et al. [24] used numerical methods to simulate the dynamics of soft rock tunnels, and investigated the particle velocity of the blast vibration and the displacement and lining stress change of the tunnels, and proposed the concept of blast protection zone. Zhao et al. [25] investigated the effects of blasting vibration velocity and vibration frequency of neighboring tunnels on the existing tunnels through the finite element method (FEM) and on-site monitoring experiments. Tian et al. [26] carried out on-site tunnel blasting vibration tests and processed the signals such as power spectrum, wavelet energy, and wavelet packet energy analysis with the help of MATLAB software. According to the severity of the affected degree, the tunnel blasting area is divided into hazardous area, warning area, blasting control area, and safety area. Duan et al. [27] investigated the peak particle velocity (PPV) change, stress distribution and crown settlement of cross tunnels under blasting vibration conditions by on-site monitoring and numerical simulation methods based on the Gaojiu Road-Jiahua Tunnel Project in Chongqing. Cao et al. [28] studied the effect of excavation blasting on the supporting structure of the front tunnel in the transition section of the rear tunnel under different levels of surrounding rock, excavation process, distance from the explosive source and clear span. Ruan et al. [29] modeled the vibration velocity of deep rock blasting, proposed the safe allowable distances under different soil thicknesses, and verified them according to the field blasting parameters.
In terms of dynamic loading from train operation in existing tunnels, Gharehdash et al. [30] and Ma et al. [31] investigated the effect of subway operation on shield tunnel lining and ground vibration by establishing a three-dimensional dynamic finite element model of train-track-tunnel-soil, respectively. Lai et al. [32] analyzed the vibration response of vehicle loads in the new tunnel and train loads in the existing tunnel on the structure of the new tunnel with the help of Midas-GTS 3D finite element simulation software based on the intersection project of Metro Line 2 and Yongningmen Tunnel. Huang et al. [33] studied train-induced settlement of subway tunnels in saturated clay. Yan et al. [34] investigated the dynamic response of cross-shield tunnels under train vibration using nonlinear finite element software. Dong et al. [35] investigated the dynamic response characteristics of new tunnels underpass existing heavy railroad tunnels. Xue et al. [36] studied the effects of construction disturbance, train dynamics and vibration loads on the existing tunnels of super-large diameter shield tunnels based on the Shanghai North Cross-Strait Project.
In summary, the current research on the role of new tunnel excavation static loads, new tunnel blasting excavation dynamic loads and the existing tunnel operational loads has been more comprehensive, but at the same time consider the new tunnel excavation and the existing train dynamic and static loads affecting the region of the determination of the method needs to be enriched.
Therefore, based on the tunnel project of the new double-line Shiqian Highway Tunnel diagonally crossing the Hurong Railway at Wanshoushan, a three-dimensional model of the influence area of the crossing section was constructed by using Midas-GTS numerical simulation software. By applying the new tunnel excavation static load, blasting dynamic load and the existing tunnel train running dynamic load for simulation calculation, the influence area of the three different load effects is studied.
2. Project Summary
2.1. Engineering Background
The research project described in this paper focuses on the cross tunnel between the Hurong Railway and the Shiqian Expressway at the Wanshoushan section. As Figure 1 shows, the Hurong Wanshoushan Railway is a two-lane tunnel with one uphill side and a gradient of 15.5%. The maximum width of the tunnel clear section is 12.26m, the height is 10.03m, and the clear area is 99.49m2.Shiqian Wanshoushan Highway Tunnel is a detached double-bore tunnel, with a length of 2,718m on the left and 2,729m on the right. the maximum width of the tunnel's clear section is 10.66m, the height is 8.60m, and the clear area is 76.85m2.
As shown in Figure 2, the spacing of the two-lane Shiqian highway tunnel is 25m, and it passes through the railroad tunnel in the form of 61° oblique angle. The pile number of left line intersection Shiqian highway tunnel is K3+674.943, and the pile number of Hurong railroad tunnel is K1468+119 (operation pile number), and the static spacing of structure is 30.856m; the pile number of right line intersection Shiqian highway tunnel is YK3+694.291, and the pile number of Hurong railroad tunnel is K1468+148 (operation pile number), and the static spacing of structure is 29.332m.
2.2. Engineering Geological Conditions
Shiqian Expressway Tunnel is approaching from Shizhu to Qianjiang direction, and the lower part of the tunnel crosses the surrounding rock of Wanshoushan Tunnel section of Hurong Railway. As shown in Figure 3, the lithology of the project area is mainly mudstone and malmstone, and the inlet section and outlet section are class V surrounding rock, and the cave section is mainly class III and IV surrounding rock (necessary for the classification of surrounding rock).
The malmstone belongs to the Upper Shaximiao Formation of the Middle Jurassic, which is a hard rock. The direction of the rock strata intersects with the axis of the cave at an angle of 32°, the inclination of the rock strata is about 10~12°, and two groups of joints are mainly developed. The rock body is more complete, with thick layer structure, and the combination between layers is generally better.
The mudstone belongs to Upper Shaximiao Formation of the Middle Jurassic System, which is a soft rock, and the thickness of mudstone is thin. The direction of the rock layer is intersected with the axis of the cave at an angle of 25~26°, the inclination of the rock layer is about 11°, and two groups of joints are mainly developed. The rock body is more complete, for thin ~ medium-thick layer structure, the combination between layers is general ~ good.
Tunnels through the area of lithology for the mudstone malmstone, is a weak water-bearing strata, part of the fissure is more developed section of the existence of drop-shaped or linear outflow of water. The tunnel body is an elliptical mound, with good conditions for surface water and groundwater drainage. Tunnel environmental action category for chemical erosion environment and chlorine salt environment, take the nearby ditch water and groundwater for water quality analysis, no erosion of concrete structure, so ignore the impact of groundwater. The impact of groundwater is therefore ignored.
According to China Earthquake Parameter Zoning Map (GB18306-2015) and Code for Seismic Design of Buildings (GB50011-2022), the peak acceleration of ground vibration in the survey area is 0.05g, and the intensity of seismic defense of buildings is 6 degrees.
3. Three-Dimensional Numerical Model
3.1. Finite Element Calculation Model
In this paper, a 3D geologic model was created by Midas GTS software. In order to minimize the negative influence of the boundary constraints on the calculation results in the finite element model, the left and right outer boundaries are taken to be 3-5 times of the width of the excavation area, and the upper and lower boundaries are taken to be 3-5 times of the height of the excavation area: the length (X-direction) × width (Y-direction) × height (Z-direction) of the finite element model is 600 m × 316 m × 749.6 m, and it can be considered to be unaffected by the construction factors, such as excavation, etc., outside the taken range. construction factors such as excavation.
The boundary constraints imposed during the calculation are: the ground surface is free constraint; the front and rear boundaries of the model are constrained by displacement in the Y-axis direction and the left and right boundaries are constrained by displacement in the X-axis direction due to the presence of extrusion in the subsurface geotechnical body; the lower boundaries of the model are fixed constraints, which limit the vertical and horizontal displacements and rotations.
The 3D solid model building process is shown in Figure 4. Firstly, according to the contour data of the actual geological topographic map, the TGM (terrain generator) in GTS NX is used to generate the actual free ground surface, then the solid model is generated according to the dimensions, and finally the solid model is generated by combining the stratigraphic section, the tunnel dimensions and the spatial relationship.
The surrounding rocks around the tunnel structure are symmetrically seeded with linear gradients to divide the fine cells to improve the calculation accuracy, with a grid size of 2~10m, and the 3D grid model is generated with 689,200 cells after giving the rock parameters and the intrinsic model.
3.2. Finite Element Calculation Parameters
3.2.1. Static Loads for New Tunnel Excavation
1). Basic parameters
The paper uses three-dimensional four-sided structural units to simulate mudstones and malmstones using the Drucker-Prager model.Mudstone and malmstone samples were taken from the typical Class IV rock section of Shiqian Wanshoushan Highway Tunnel, and density test, uniaxial compression and deformation test, and triaxial compression test were carried out with reference to the national standards of "Rock Testing Procedures for Water Conservancy and Hydropower Engineering" (SL264-2020) and "Standard of Testing Methods for Engineering Rocks" (GB/T50266-2013). Table 1 shows the parameters of peripheral rock support of Shiqian Wanshoushan Highway Tunnel.
As shown in Figure 5, the peripheral rock support of Shiqian Wanshoushan highway tunnel is shown. Anchor support is discounted to the modulus of elasticity of the rock body in the reinforced area by stiffness, and steel frame and grid support is discounted to the initial lining of sprayed concrete by stiffness, and the reinforced area of rock anchors is estimated according to Duraksha's formula [28]: steel frame or grid discounting formula:
where: Ec - modulus of elasticity of spray concrete after conversion (MPa);Ec0 - modulus of elasticity of original spray concrete (MPa);Sg --Steel frame or grille frame cross-sectional area (m2);Eg - modulus of elasticity of steel frame or grill (MPa);Sc - cross-sectional area of concrete (m2).
E = Ec0 + Sg ✕ Eg / Sc
Anchor support discount formula:
where: Er - modulus of elasticity of the rock mass after conversion (MPa);Er0 - modulus of elasticity of original spray concrete (MPa);Vb - volume of anchor rods in the support area (m3);Eb - modulus of elasticity of anchor rod (MPa);Vr - volume of rock body in the support area (m3).
Er = Er0 + Vb ✕ Eb / Vr
The parameters of the mudstone and malmstone rock mass and the discounted anchor support and steel-frame grating support are shown in Table 2.
2) Numerical simulation process
- (1)
- The corresponding rock properties are assigned to the strata and the initial ground stress field is balanced. There is no influence of tectonic joints in the cross-section tunnel project, and the ground stress is considered according to the initial self-gravitational stress field.
- (2)
- Simulate the excavation of the whole section of the existing railroad tunnel, apply initial support and secondary lining, and zero the displacement field.
- (3)
- Excavation of new highway tunnel. Tunnel each excavation footage of 2m, after excavation for the initial support and secondary lining, in order to facilitate data analysis for multiple excavation steps as a whole encapsulated into different data results extracted when the step Si. set the left side of the tunnel for the first excavation of the tunnel, from the inlet (left) to the exit (right) excavation, the right side of the tunnel for the excavation after the front and back of the tunnel difference of 3 Si, Si No. for the S1, S2, S3. S20, ......S20. The left hole S1 and S17, the right hole S4 and S20 are the time step of going to the boundary effect, which is 90m respectively. left hole S2=S3=S15=S16=50m,S4=S5=S6=S7=S8=S9=S10=S11=S12=S13=S14=20m.right hole S5=S6=S18=S19=S14=20m. S6=S18=S19=50m, S7=S8=S9=S10=S11=S12=S13=S14=S15=S16=S17=20m as shown in Figure 6.
- (4)
- Layout of monitoring points in existing tunnels. Along the Hurong Tunnel floor layout measurement points, tunnel left and right intersection of the center of the line is set as 0 measurement points, to the left hole extension line layout 0 ~ 61 measurement points, to the right hole extension line layout 0 ~ -61 measurement points measurement point interval distance of 3m, the 7th measurement point for the left line of the intersection, the -7th measurement point for the right line of the intersection.
3.2.2. Dynamic Blasting Loads for New Tunnels
1) Eigenvalue analysis (general formula, refer to established running literature [A])
Eigenvalue is used to analyze the inherent dynamic characteristics of the structure, which is an important parameter for the design of the structure subjected to dynamic loads. Through the eigenvalue analysis [37], the dynamic characteristics of the structure such as vibration shape, self-oscillation period, and vibration parameter coefficients can be obtained.
The characteristic equations for the calculation of vibration shape and intrinsic period are as follows:
where K is the stiffness matrix of the structure; M is the mass matrix of the structure; "ω" _"n" ^ "2" is the eigenvalue of the nth vibration mode; "Ф" ̅_"n" is the eigenvector of the nth vibration mode, and the spatial iterative method is used to calculate the eigenvectors to converge [41].
- (1)
- Boundary conditions
According to the literature [31,38], the elastic boundary is defined by the curved surface spring and the spring coefficient is calculated according to the foundation reaction coefficient of the road design code.
Vertical rock formation reaction force coefficient:
kv = kv0·(Bv/30)-3/4
Horizontal rock formation reaction factor:
where kv0 = kh0 = E0/30, Bv = Av1/2, Bh = Ah1/2, Av is the vertical cross-section area of the rock layer, Ah is the horizontal cross-section area of the rock layer, and E0 is the elastic modulus of the rock layer.
kh = kh0·(Bh/30)-3/4
After extracting the cross-sectional area in each direction based on the 3D solid model (Figure 4), the vertical and horizontal foundation reaction coefficients are calculated by Eqs. 4 and 5, as shown in Table 3.
- (2)
- Analysis of results
As shown in Figure 7, the calculation is carried out through Equation 1, and the comprehensive comparison of the eigenvalue results of the mass participation coefficients and periods of different vibration modes, and the final determination of the period values of vibration modes 6 and 7, 1.085584 and 1.031460, are used as the basis data for the calculation of damping of vibration modes of the time-range analysis.
- (3)
- Time course analysis
Time-course analysis is the process of calculating the dynamic characteristics of the structure and the structural response (displacement, internal force, velocity, etc.) at any moment in time.According to the literature [39,40,41], the power balance equations used are as follows:
where M is the total mass matrix of the finite element system; C is the total damping matrix of the finite element system; K is the total stiffness matrix of the finite element system; ("u") ̈"(t)", ("u") ̇"(t)", and "u(t)" are the acceleration, velocity, and displacement vectors of each node of the system; and "p(t)" is the dynamic load.
- (1)
- Boundary conditions
Define the viscous boundary through the surface spring [31,38], the P-wave and S-wave damping calculations in the X, Y and Z directions of the rock layer required to establish the viscous boundary are shown in Equations (7) and (8).
P-wave damping calculation formula:
CP = ρ·A·[(λ+2G)/ρ]1/2 = γ·A·[(λ+2G)/(λg)]1/2 = cp·A
S-wave damping formula:
where ρ is the density, kg/m3; γ is the bulk weight, t/m3; λ = vE/[(1+v)(1-2v)], the bulk modulus, t/m2; G = E/2(1+v), the shear modulus, t/m2; E is the modulus of elasticity, t/m2; v is the Poisson's ratio; g is the acceleration of gravity; A is the cross-sectional area of the boundary rock layer, m3; cp is the P-wave damping constant; cs is the S-wave damping constant.
CS = ρ·A·(G/ρ)1/2 = γ·A·[(G/(λg)]1/2 = cs·A
When inputting damping in GTS NX, only cp and cs can be input because the program automatically calculates the cross-sectional area of each unit. According to Eqs. (7) and (8) combined with the mechanical parameters of the rock formation, the results of cp and cs are shown in Table 4.
- (2)
- Dynamic load
Blasting load parameters include loading waveform, peak stress, location and direction of action, loading and unloading time, total vibration time and loading boundary.
The blast load waveform adopts the triangular load waveform, the peak load is reached quickly in 10 ms, and the unloading time is 100 ms. The peak load is determined by the empirical formula according to the literature [42], and the empirical formula is as follows:
where Z is the proportional distance; R is the distance from the gun hole to the loading surface, m; Q is the gun hole charge.
Pmax = 139.97/Z + 844.81/Z2 + 2154/Z3 -0.8034
Z = R/Q1/3
Under the tunnel blasting excavation of existing railroad tunnels mass vibration velocity requirements do not exceed 2cm / s, according to the literature [43], a one-time detonation of the maximum allowable amount of drug formula:
where V is the existing tunnel media mass vibration velocity; Q is a one-time permitted under the tunnel detonation of the total charge, kg; R is the center of the source of self-explosion to the distance of the protected building, m; K is the medium factor; a for the blasting vibration coefficient.
Q=R3(V/K)3/a
According to new tunnels and existing tunnels engineering geological conditions, K take 250, a take 1.5, through the formula (11) calculations, the existing tunnel floor from the center line of different distances from the maximum amount of detonation charge and mass vibration velocity, see Table 5
The maximum charge of 8.0 kg was selected as the base data for calculating the peak blasting load in conjunction with the spatial relationship of the cross tunnels. According to the maximum charge requirements for the upper and lower steps of the excavation section blasting design, the design of the shell hole section shown in Figure 8, blasting parameters are shown in Table 6.
Combined with the excavation section blasting design, the distance from the gun hole to the load surface is 1.0 m, based on the formula (7) and (8) to obtain the peak blasting load of 20.89 MPa. Blasting load in the form of pressure applied to the tunnel excavation boundary rock layer, the direction of action for the perimeter of the tunnel vertical direction.
3.2.3. Existing Tunnel Operational Loads
- (1)
- Train dynamic load
The dynamic load of each wheel during train operation is simplified into a series of vertical concentrated forces whose size changes dynamically with time, and the artificial excitation function method is utilized to determine the train vibration load. The excitation function consists of a static load and a series of sinusoidal functions superimposed on the dynamic load [44,45], whose expression is:
where is the static wheel load; 、、 are the peak loads corresponding to smoothness of travel, line power additional load, and waveform wear; is the mass of the train under the springs; is the uneven vibration wavelengths of the smoothness of travel, line power additional load, and waveform wear control conditions; is the lost height corresponding to the uneven vibration wavelength of the three control conditions; v is the train speed.
According to the existing tunnel train operation information, comprehensively considering the relevant parameters of CRH series trainsets, the train parameters are selected as eight cars, length 200m, speed 200km/h (55.5m/s), axle weight 19t, unsprung mass 2t, and static wheel weight 95kN on one side. According to the track unevenness laying accuracy standard (Figure 9) mentioned in the literature [32], the uneven wavelength and vector height are determined under three control conditions: L1=10 m, a1=3.5 mm; L2=2 m, a2=0.4 mm; L3=0.5 m, a3=0.1 mm. According to the formulae (12)~(13) to get the train dynamic loading time curve, as shown in Figure 10.
4. Results
4.1. New Tunnel Excavation
Figure 11 shows the cloud diagram of the overall displacement of the existing tunnel at different timing steps, and Figure 12 shows the overall peak deformation of the existing railroad tunnel and the overall deformation curve of the centerline of the bottom plate of the track surface at different timing steps.
Combining Figure 11 and Figure 12, it can be seen that the sensitive area of the existing tunnel impact after S1 excavation is in the 26m area on the excavation side of the A end of the new tunnel, and the maximum settlement is 0.11mm at the location of the arch of the existing tunnel, and the minimum settlement is 0.05mm at the location of the tunnel floor at the B end; the maximum settlement of the track floor is 0.09mm, and the minimum settlement is 0.05mm, which occurs at the tunnel end; the settlement value does not change much in the sensitive area, and gradually decreases as it moves away from the sensitive area.
The settlement pattern of the existing tunnel after excavation of S2 and S3 is the same as that of S1, with the maximum and minimum values occurring at the same location, and the influence area expanding to the B-end; the maximum value of the tunnel settlement after excavation of S2 is 0.18mm, and the minimum value is 0.08mm; the maximum settlement of the track base plate is 0.16mm, and the minimum settlement is 0.08mm, and the influence sensitive area expanding to 40m; the maximum value of the tunnel settlement after excavation of S3 is 0.25mm, and the minimum value The maximum value of tunnel settlement after S3 excavation is 0.25mm, the minimum value is 0.12mm; the maximum settlement of track floor is 0.23mm, the minimum settlement is 0.12mm, and the influence sensitive area extends to 90m.
After S4 excavation, the location of the maximum value of the existing tunnel settlement has changed, which occurs in the arch waist position on the excavation side of the new tunnel, 80m from end A, with a settlement value of 0.39mm, affecting the sensitive area in the 100m area on the excavation side of the new tunnel at end A. There is no change in the location of the minimum value of the tunnel settlement and the maximum and minimum value of the track floor, with the maximum settlement of the track floor being 0.35mm, and the minimum settlement of 0.19mm. 0.19mm.
S5 after excavation, the maximum settlement occurs in the new tunnel excavation side arch waist position, 85m from end A, the settlement value is 0.55mm; the maximum settlement of the track base plate occurs 90m from end A, the settlement value is 0.45mm; the tunnel settlement sensitive area moves from end A to the middle of the tunnel.
After S6 excavation, the existing tunnel settlement pattern is the same as that of S5, the maximum settlement value of tunnel and track surface moves to the middle of the tunnel, and the sensitive area of tunnel settlement moves to the middle of the tunnel from the A end, and the settlement changes in the middle of the tunnel are obvious; the maximum settlement value of the tunnel is 0.80mm, and the maximum settlement of the track base plate is 0.63mm.
S7 and S8 excavation tunnel and track surface settlement maximum value occurs in the same location as S6, but the maximum settlement value point from the tunnel arch waist position to the bottom of the arch position to move; S7 excavation tunnel maximum settlement value of 1.23mm, the maximum settlement of the track base plate for 1.04mm; S8 excavation tunnel maximum settlement value of 1.85mm, the maximum settlement of the base plate for 1.66mm; the maximum value of the tunnel to the two ends of the tunnel The maximum settlement value is 1.66mm at both ends of the tunnel, and the settlement becomes smaller in a symmetrical trend.
S9~S12 after excavation, the maximum settlement of tunnel and track surface tends to coincide with the location of the maximum value, which occurs in the location of the tunnel floor, 120m away from the A-end; the tunnel sensitive area occurs in the 120m area on both sides of the maximum settlement value, and the A-end area is larger than the B-end area; the maximum settlement value of the tunnel after excavation of S9 is 2.52mm, and the maximum settlement of the track floor is 2.49mm; the maximum settlement value of the tunnel after excavation of S10 is 2.92mm and that of the track floor is 1.66mm; the maximum value becomes smaller towards both ends of the tunnel. S10 after excavation, the maximum settlement of the tunnel is 2.92mm, and the maximum settlement of the track base plate is 2.92mm; S11 after excavation, the maximum settlement of the tunnel is 3.26mm, and the maximum settlement of the track base plate is 3.24mm; S12 after excavation, the maximum settlement of the tunnel is 3.59mm, and the maximum settlement of the track base plate is 3.51mm; the maximum value of the tunnel is the same as that of the tunnel at the two ends of the settlement law.
The maximum settlement of tunnel and track surface after excavation of S13~S20 is 130m away from the A end of the tunnel floor, and the increase of settlement value is small.
Figure 13 shows the combined settlement curves of the track surface of the existing tunnel under different timing steps. In Figure 13, it can be seen that the maximum settlement of the track surface from S7 to S11 occurs to the right of the left line crossing point. This is because the excavation of the new tunnel is at an angle of 61° with the existing tunnel (as shown in Figure 6), and the left line is the first to be excavated and is three timing steps ahead of the right line, so the left line of the existing tunnel is the first to be affected by the excavation of the new tunnel. As the tunnel excavation progresses, the maximum settlement value gradually approaches the measurement point. At the end of the excavation, it can be observed that the settlement curve is symmetrically distributed based on the measurement points.
From Figure 13, it can be clearly seen that the track surface settlement curve is characterized by significant features: the excavation area of S7~S14 is the sensitive area affected by the excavation of the new tunnel on the existing tunnel, and the settlement changes are large; the settlement of the new tunnel on the existing tunnel is concentrated in the strong disturbance area of 120m at the measurement point, and the weak disturbance area is 60m around the strong disturbance area.
4.2. New Tunnel Blasting
The overall displacement cloud, overall vibration velocity cloud, and Von Mises stress cloud of the rock layer under blasting action were extracted and analyzed in order to determine the area affected by blasting dynamic loads in the new tunnel excavation.
Figure 14 shows the overall displacement of the rock layer under blasting load. As can be seen from Figure 14, with the centerline of the tunnel section as the reference point, the overall displacement of the rock layer under the dynamic blasting load is divided into three zones: the first zone is centered on the reference point, the diameter of the circle of 19.72m, the overall displacement in the range of 0.88~2.11mm; the second zone is the first segment of the circle to the diameter of the circle of the extension to the 27.09m circle, the overall displacement in the range of 0.35~0.88mm; the third zone is the second segment of the circle to the extension to the diameter of 35.24m circle, the overall displacement in the range of 0.35~2.11mm. 0.88mm; the third section is the circular domain of the second section extended outward to the circular domain of 35.24m in diameter, and the overall displacement is 0.35~0.18mm.
As shown in Figure 15, the overall vibration velocity of the rock layer under blasting load is shown in the cloud diagram. As can be seen from Figure 15, with the centerline of the tunnel section as the reference point, the overall vibration velocity of the rock layer under the dynamic blasting load is divided into three zones: the first zone is a circle with a diameter of 19.72m centered on the reference point, and the overall vibration velocity is in the range of 2.53-6.07cm/s; the second zone is a circular domain extending outward from the circular domain of the first zone to a circular domain with a diameter of 25.63m, and the overall displacement is in the range of 1.01-2.53cm/s; the third zone is a circular domain extending outward from the circular domain of the second zone to a circular domain with a diameter of 35.24m. 2.53cm/s; the third section is the circular domain of the second section extended outward to the circular domain of 35.24m in diameter, and the overall displacement is in the range of 0.51~1.01cm/s.
The Von Mises stress cloud of the rock formation under blasting load is shown in Figure 16. As can be seen from Figure 16, with the centerline of the tunnel section as the reference point, the Von Mises stress in the rock layer under dynamic blasting load is divided into three zones: the first zone is a circle with a diameter of 19.72m centered on the reference point, and the Von Mises stress is in the range of 1.25-3.01MPa; the second zone is a circle extending outward from the circle in the first zone to a circle with a diameter of 25.63m, and the Von Mises stress is in the range of 0.50-1.25MPa; and the third zone is a circle in the second zone, and the Von Mises stress is in the range of 0.50-1.25MPa. The second section is the circular domain of the first section extending outward to 25.63m in diameter, and the Von Mises stress is in the range of 0.50~1.25MPa; the third section is the circular domain of the second section extending outward to 30.03m in diameter, and the Von Mises stress is in the range of 0.25~0.50MPa.
Considering the overall displacement map, overall vibration velocity map, Von Mises stress impact area of the rock layer under the action of blasting dynamic load, combined with the impact characteristics of blasting load in tunnel excavation, it is determined to take the center of the datum point in the tunnel section and the circular domain with a diameter of 25.63m as the impact area of blasting dynamic load in the excavation of the new tunnel.
4.3. Existing Tunnel Operation
Overall displacement cloud, overall vibration velocity cloud, and Von Mises stress cloud of the rock layer under train dynamic loading were extracted and analyzed for the purpose of determining the area affected by the dynamic loading of train operation in existing tunnels.
Figure 17 shows a cloud diagram of the overall displacement of the rock formation under the dynamic load of the train. The overall displacement of the rock layer under the dynamic train load is along the axis of the existing tunnel, and the influence range is largest in the center of the dynamic train load application area, and the symmetry decreases to both sides, and the overall course is ellipsoidal. Taking the section at the center of the dynamic load application area of the existing tunnel as the benchmark, three impact zones are quantitatively described: the first zone is distributed within 5m below the track surface, with an irregular semicircular shape, and an overall displacement of 0.10-0.14mm; the second zone is distributed within 40-50m around the tunnel section, with an irregular ellipsoidal shape, and an overall displacement of 0.07-0.10mm; the third zone is distributed within 40-50m around the tunnel section, with an irregular ellipsoidal shape, and an overall displacement of 0.10mm; and the third zone is distributed in the tunnel section, with an overall displacement of 0.10mm. The third zone is distributed in the range of 70~100m around the tunnel section, with an irregular oval shape and an overall displacement of 0.69~0.07mm.
As shown in Figure 18, the overall vibration velocity of the rock layer under the dynamic load of the train is shown in the cloud diagram. From Figure 18, it can be seen that the overall vibration velocity of the rock layer under dynamic train loads varies irregularly along the axis of the existing tunnel, but the overall influence area does not change much. Taking the cross-section at the center of the dynamic load application area of the existing tunnel as the reference, three impact zones are quantitatively described: the first zone is distributed in the track surface area, and the overall vibration velocity is in the range of 1.29~1.94m/s; the second zone is in the range of 6m below the track surface, with the shape of an irregular semicircle, and the overall vibration velocity is in the range of 0.34~1.29m/s; and the third zone is in the range of 10m below the track surface, with the irregular semicircle and the left side wall in the range of 3m. The third zone is in the area of irregular semicircle in the range of 10m below the track surface and the area in the range of 3m on the left side wall, and the overall vibration speed is 0.18~0.34m/s.
The Von Mises stress cloud of the rock formation under the dynamic train load is shown in Figure 19. From Figure 19, it can be seen that the Von Mises stresses under dynamic train loads change irregularly along the axis of the existing tunnel, but the overall influence area does not change much. Taking the section at the center of the dynamic load application area of the existing tunnel as the reference, three impact zones are quantitatively described: the first zone is distributed in the track area, and the Von Mises stresses are in the range of 0.18-0.30MPa; the second zone is in the irregular semicircular area within 3m below the track surface and in the area within 2m of the left side wall, and the Von Mises stresses are in the range of 0.05-0.18MPa; The second section is in the irregular semicircular area within 5m below the track surface and the area within 3m on the left side wall, and the Von Mises stress is 0.03~0.05MPa.
Considering the overall displacement map, overall vibration velocity map and Von Mises stress influence area of the rock layer under the dynamic load of train, and combining with the repetitive characteristics of the dynamic load of train, it is determined that the influence area of the existing tunnel is the range of the second section of the overall displacement. Taking the overall displacement maps as the basic data, the quantification is carried out by AutoCAD software to get the quantified data of the second section of the influence area (Figure 20(a)), and the influence area of the rock layer under the dynamic load of the train is finally determined through the symmetry of the data (Figure 20 (b)): taking the center of the track surface of the existing tunnel as the reference, the influence area is elliptical, with the long axis of 54.75m, and the short axis of 44.96m. The long axis is 54.75m and the short axis is 44.96m.
4.4. Impact Area Determination
Comprehensive analysis of the new tunnel excavation static load on the existing tunnel impact area, the new tunnel excavation blasting dynamic load impact area, the existing tunnel train running dynamic load impact area data, through the entity model to quantify, and finally determine the two-lane highway tunnel under the existing railroad tunnel excavation impact area.
As shown in Figure 21, the new tunnel excavation static load influence area: 40mI area on both sides of the center of the crossing point is the strong disturbance area of the new tunnel excavation, 40mII area on both sides of the strong disturbance area is the weak disturbance area, and III area is the micro-disturbance area. As shown in Figure 22, there is a heterogeneous overlapping area with a length of 25.30m, a width of 18.30m and a volume of 499.73m3 in the dynamic loaded area of the new tunnel excavation and the dynamic loaded area of the existing tunnel train operation.
5. Conclusions and Discussion
In this paper, the excavation impact area of a two-lane new highway tunnel passing through an existing railroad tunnel is investigated. A finite element three-dimensional analysis model is constructed, and the impact area of the tunnel under three kinds of loads is investigated by applying the static load of the new tunnel excavation, the dynamic load of the new tunnel blasting excavation, and the dynamic load of the train running in the existing tunnel for simulation calculation.
The results of the study show that there are strong and weak disturbance zones in the influence area of new tunnel excavation static loads on existing tunnels; and there are heterogeneous superimposed influence areas in the influence area of new tunnel excavation blasting dynamic loads and dynamic train operation loads in existing tunnels. In this paper, a method of determining the influence area of dynamic and static loads on new tunnel excavation and existing tunnels is identified, which can provide reference for similar projects in the future.
Numerical simulation software is used to further analyze and come up with the following conclusions:
- (1)
- The region of influence of the static load of new tunnel excavation on the existing tunnel. Existing tunnels from the center of the intersection to both sides of 120m for the strong disturbance area, strong disturbance area on both sides of 60m for the weak disturbance area, and other micro-disturbance area; intersection of the center of both sides of 40m for the new tunnel excavation of the strong disturbance area, strong disturbance area on both sides of 40m for the weak disturbance area, and other micro-disturbance area.
- (2)
- New tunnel excavation blasting dynamic load impact area. Tunnel section in the center of the reference point, 25.63m diameter circle for the new tunnel excavation blasting dynamic load impact area.
- (3)
- the existing tunnel train running dynamic load impact area. The center of the existing tunnel track surface as a reference, the impact area is oval, the long axis of 54.75m, the short axis of 44.96m.
- (4)
- Overlapping influence area. The dynamic load impact area of the new tunnel blasting excavation and the dynamic load impact area of the existing tunnel train operation have a heteromorphic superimposed impact area of 25.30m in length, 18.30m in width and 499.73m3 in volume.
Comprehensive comparison found that the new tunnel excavation static load influence area is the largest, followed by excavation and blasting dynamic load, the existing tunnel train operation dynamic load area is the smallest, and there is a heterogeneous overlap influence area between the new tunnel excavation and blasting dynamic load influence area and the existing tunnel train operation dynamic load. The method of determining the overlap region in the current study also needs to be enriched, and less attention is paid to the mechanical effect of the overlap region of influence.
This paper only considered the overall displacement and deformation cases when studying the static loads of new tunnel excavation, ignoring the lateral deformation, transverse internal force and torsional deformation effects. At the same time, the study of the tunnel impact area is based on finite element simulation software, the accuracy of which is affected by the mesh density and calculation parameters, and it is only an approximate numerical solution, which lacks on-site monitoring data to verify the accuracy of the anisotropic overlap area proposed in the numerical simulation.
Therefore, perfecting the effect of excavation static load on the tunnel and verifying the accuracy of the simulation results by combining with on-site monitoring data are the topics that need to be further studied.
Author Contributions
Methodology, Y.L.; Formal analysis, Y.L., C.H. and H.L.; Resources, C.H.; Data.curation, C.H., H.L. and C.M.; Writing—original draft, C.H., H.L. and C.M.; Writing—review & editing,H.L. and C.M.; Visualization, C.H., H.L. and C.M.; Funding acquisition, Y.L. All authors have read and agreed to the published version of the manuscript.
Funding
This work is supported by the Hongjian Lu: Natural Science Foundation of Hebei Province (No. E2021209006).
Institutional Review Board Statement
Not applicable.
Informed Consent Statement
Not applicable.
Data Availability Statement
Data sharing is not applicale.
Conflicts of Interest
The authours declare no conflict of interest.
References
- CHEN Z L, CHEN J Y, LIU H, et al. Present status and development trends of underground space in Chinese cities: Evaluation and analysis [J]. Tunnelling and Underground Space Technology, 2018, 71: 253-70. [CrossRef]
- DEBROCK S, VAN ACKER M, ADMIRAAL H. Design recommendations for sustainable urban underground spaces [J]. Tunnelling and Underground Space Technology, 2023, 140. [CrossRef]
- VON DER TANN L, STERLING R, ZHOU Y X, et al. Systems approaches to urban underground space planning and management - A review [J]. Underground Space, 2020, 5(2): 144-66. [CrossRef]
- CHENG H Z, CHEN J, CHEN G L. Analysis of ground surface settlement induced by a large EPB shield tunnelling: a case study in Beijing, China [J]. Environmental Earth Sciences, 2019, 78(20). [CrossRef]
- ISLAM M S, ISKANDER M. Twin tunnelling induced ground settlements: A review [J]. Tunnelling and Underground Space Technology, 2021, 110. [CrossRef]
- SHI J W, NG C W W, CHEN Y H. A simplified method to estimate three-dimensional tunnel responses to basement excavation [J]. Tunnelling and Underground Space Technology, 2017, 62: 53-63. [CrossRef]
- XIE X Y, YANG Y B, JI M. Analysis of ground surface settlement induced by the construction of a large-diameter shield-driven tunnel in Shanghai, China [J]. Tunnelling and Underground Space Technology, 2016, 51: 120-32. [CrossRef]
- WENG X L, SUN Y F, YAN B H, et al. Centrifuge testing and numerical modeling of tunnel face stability considering longitudinal slope angle and steady state seepage in soft clay [J]. Tunnelling and Underground Space Technology, 2020, 101. [CrossRef]
- YIN X S, CHEN R P, MENG F Y. Influence of seepage and tunnel face opening on face support pressure of EPB shield [J]. Computers and Geotechnics, 2021, 135. [CrossRef]
- ZOU J F, QIAN Z H. Face-Stability Analysis of Tunnels Excavated below Groundwater Considering Coupled Flow Deformation [J]. International Journal of Geomechanics, 2018, 18(8). [CrossRef]
- LI Y Q, ZHANG W G. Investigation on passive pile responses subject to adjacent tunnelling in anisotropic clay [J]. Computers and Geotechnics, 2020, 127. [CrossRef]
- NEMATOLLAHI M, DIAS D. Three-dimensional numerical simulation of pile-twin tunnels interaction - Case of the Shiraz subway line [J]. Tunnelling and Underground Space Technology, 2019, 86: 75-88. [CrossRef]
- PHUTTHANANON C, LERTKULTANON S, JONGPRADIST P, et al. Numerical investigation on the responses of existing single piles due to adjacent twin tunneling considering the lagging distance [J]. Underground Space, 2023, 11: 171-88. [CrossRef]
- FANG Q, ZHANG D L, LI Q Q, et al. Effects of twin tunnels construction beneath existing shield-driven twin tunnels [J]. Tunnelling and Underground Space Technology, 2015, 45: 128-37. [CrossRef]
- NG C W W, FONG K Y, LIU H L. The effects of existing horseshoe-shaped tunnel sizes on circular crossing tunnel interactions: Three-dimensional numerical analyses [J]. Tunnelling and Underground Space Technology, 2018, 77: 68-79. [CrossRef]
- YIN M L, JIANG H, JIANG Y S, et al. Effect of the excavation clearance of an under-crossing shield tunnel on existing shield tunnels [J]. Tunnelling and Underground Space Technology, 2018, 78: 245-58. [CrossRef]
- CHAKERI H, OZCELIK Y, UNVER B. Effects of important factors on surface settlement prediction for metro tunnel excavated by EPB [J]. Tunnelling and Underground Space Technology, 2013, 36: 14-23. [CrossRef]
- GUE C Y, WILCOCK M J, ALHADDAD M M, et al. Tunnelling close beneath an existing tunnel in clay - perpendicular undercrossing [J]. Geotechnique, 2017, 67(9): 795-807. [CrossRef]
- AVGERINOS V, POTTS D M, STANDING J R. Numerical investigation of the effects of tunnelling on existing tunnels [J]. Geotechnique, 2017, 67(9): 808-22. [CrossRef]
- CHEN R P, LIN X T, KANG X, et al. Deformation and stress characteristics of existing twin tunnels induced by close-distance EPBS under-crossing [J]. Tunnelling and Underground Space Technology, 2018, 82: 468-81. [CrossRef]
- SHI J W, WANG Y, NG C W W. Three-Dimensional Centrifuge Modeling of Ground and Pipeline Response to Tunnel Excavation [J]. Journal of Geotechnical and Geoenvironmental Engineering, 2016, 142(11). [CrossRef]
- LIN X T, CHEN R P, WU H N, et al. Deformation behaviors of existing tunnels caused by shield tunneling undercrossing with oblique angle [J]. Tunnelling and Underground Space Technology, 2019, 89: 78-90. [CrossRef]
- NG C W W, WONG Y Y A, SHAKEEL M. Effects of the skew angle of new tunneling on an existing tunnel: three-dimensional centrifuge and numerical modeling [J]. Canadian Geotechnical Journal, 2022. [CrossRef]
- SHIN J H, MOON H G, CHAE S E. Effect of blast-induced vibration on existing tunnels in soft rocks [J]. Tunnelling and Underground Space Technology, 2011, 26(1): 51-61. [CrossRef]
- ZHAO H B, LONG Y, LI X H, et al. Experimental and numerical investigation of the effect of blast-induced vibration from adjacent tunnel on existing tunnel [J]. Ksce Journal of Civil Engineering, 2016, 20(1): 431-9. [CrossRef]
- TIAN X X, SONG Z P, WANG J B. Study on the propagation law of tunnel blasting vibration in stratum and blasting vibration reduction technology [J]. Soil Dynamics and Earthquake Engineering, 2019, 126. [CrossRef]
- DUAN B F, GONG W Z, TA G S, et al. Influence of Small, Clear Distance Cross-Tunnel Blasting Excavation on Existing Tunnel below [J]. Advances in Civil Engineering, 2019, 2019. [CrossRef]
- CAO F, ZHANG S, LING T H. Blasting-Induced Vibration Response of the Transition Section in a Branching-Out Tunnel and Vibration Control Measures [J]. Advances in Civil Engineering, 2020, 2020. [CrossRef]
- RUAN J B, WANG T H, ZHAO Z K, et al. Discussion on Blasting Vibration Velocity of Deep Rock Mass Considering Thickness of Overlying Soil Layer [J]. Periodica Polytechnica-Civil Engineering, 2023. [CrossRef]
- GHAREHDASH S, BARZEGAR M. Numerical modeling of the dynamic behaviour of tunnel lining in shield tunneling [J]. Ksce Journal of Civil Engineering, 2015, 19(6): 1626-36. [CrossRef]
- MA M, LIU W N, QIAN C Y, et al. Study of the train-induced vibration impact on a historic Bell Tower above two spatially overlapping metro lines [J]. Soil Dynamics and Earthquake Engineering, 2016, 81: 58-74. [CrossRef]
- LAI J X, WANG K Y, QIU J L, et al. Vibration Response Characteristics of the Cross Tunnel Structure [J]. Shock and Vibration, 2016, 2016. [CrossRef]
- HUANG Q, HUANG H W, YE B, et al. Dynamic response and long-term settlement of a metro tunnel in saturated clay due to moving train load [J]. Soils and Foundations, 2017, 57(6): 1059-75. [CrossRef]
- YAN Q X, SONG L Y, CHEN H, et al. Dynamic Response of Segment Lining of Overlapped Shield Tunnels Under Train-Induced Vibration Loads [J]. Arabian Journal for Science and Engineering, 2018, 43(10): 5439-55. [CrossRef]
- DONG J, ZHONG S, WANG H L, et al. Dynamic response characteristics of crossing tunnels under heavy-haul train loads [J]. Geomechanics and Engineering, 2020, 20(2): 103-12. [CrossRef]
- ZHANG X, ZHANG M X, JAVADI A A. Influence of a Super-Large Diameter Shield Tunnel Excavation on the Lining Structure of the Metro Lines in Operation [J]. Iranian Journal of Science and Technology-Transactions of Civil Engineering, 2023. [CrossRef]
- GALLI G, GRIMALDI A, LEONARDI A. Three-dimensional modelling of tunnel excavation and lining [J]. Computers and Geotechnics, 2004, 31(3): 171-83. [CrossRef]
- WANG W H, WANG L L, DU Y Z, et al. Numerical and experimental analysis on motion performance of new sandglass-type floating body in waves [J]. Marine Structures, 2016, 46: 56-77. [CrossRef]
- YANG C S, MO H H, CHEN J S, et al. Influence of Seismic Loading on Segment Opening of a Shield Tunnel [J]. Scientific World Journal, 2014. [CrossRef]
- LAI J X, GUO C X, QIU J L, et al. Static Analytical Approach of Moderately Thick Cylindrical Ribbed Shells Based on First-Order Shear Deformation Theory [J]. Mathematical Problems in Engineering, 2015, 2015. [CrossRef]
- NEJATI H R, AHMADI M, HASHEMOLHOSSEINI H. Numerical analysis of ground surface vibration induced by underground train movement [J]. Tunnelling and Underground Space Technology, 2012, 29: 1-9. [CrossRef]
- SHI C H, ZHAO Y W, ZHAO C Y, et al. Water-Sealed Blasting Control Measures of the Metro Station Undercrossing Existing Structures in Ultra-Close Distances: A Case Study [J]. Frontiers in Earth Science, 2022, 10. [CrossRef]
- WU X D, GONG M, WU H J, et al. Vibration reduction technology and the mechanisms of surrounding rock damage from blasting in neighborhood tunnels with small clearance [J]. International Journal of Mining Science and Technology, 2023, 33(5): 625-37. [CrossRef]
- YE F, HE C, WANG S M, et al. Landscape design of mountain highway tunnel portals in China [J]. Tunnelling and Underground Space Technology, 2012, 29: 52-68. [CrossRef]
- LAI J X, MAO S, QIU J L, et al. Investigation Progresses and Applications of Fractional Derivative Model in Geotechnical Engineering [J]. Mathematical Problems in Engineering, 2016, 2016. [CrossRef]
Figure 1.
Spatial relationship diagram of the underpass tunnel project.
Figure 2.
Three-dimensional spatial key data of the underpass tunnel project.
Figure 3.
Cross-section of rock layer and surrounding rock grade distribution of Wanshoushan Highway Tunnel of Shiqian Expressway.
Figure 3.
Cross-section of rock layer and surrounding rock grade distribution of Wanshoushan Highway Tunnel of Shiqian Expressway.
Figure 4.
D solid model building steps: (a) geological topographic map; (b) CAD digitization; (c) TGM ground surface; (d) stratigraphic profile; (e) 3-D solid model.
Figure 4.
D solid model building steps: (a) geological topographic map; (b) CAD digitization; (c) TGM ground surface; (d) stratigraphic profile; (e) 3-D solid model.
Figure 5.
Cross-section of peripheral rock support of Shiqian Wanshoushan Highway Tunnel.
Figure 6.
Time-step diagram for extracting excavation data for new tunnels.
Figure 7.
Graph of eigenvalue analysis results.
Figure 8.
Design cross-section of blasting holes for upper and lower step excavation.
Figure 9.
Eigenvalues of track irregularities in the UK.
Figure 10.
Train load time curve.
Figure 11.
Overall displacement maps of existing tunnels at different data extraction time steps.
Figure 12.
Overall peak deformation and track surface settlement curves of existing tunnels at different timing steps.
Figure 12.
Overall peak deformation and track surface settlement curves of existing tunnels at different timing steps.
Figure 13.
Combination of track surface settlement curves of existing tunnels with different timing steps.
Figure 13.
Combination of track surface settlement curves of existing tunnels with different timing steps.
Figure 14.
Clouds of the overall displacement of the rock layer under blasting loads.
Figure 15.
Clouds of the overall vibration velocity of the rock formation under blasting loads.
Figure 16.
Von Mises stress cloud of rock formation under blasting loads.
Figure 17.
Clouds of the overall displacement of the rock layer under the dynamic load of the train.
Figure 17.
Clouds of the overall displacement of the rock layer under the dynamic load of the train.
Figure 18.
Overall vibration velocity of the rock formation under dynamic train loading.
Figure 19.
Von Mises stress map of the rock layer under dynamic train loading.
Figure 20.
Determination of the region of influence of rock formations under dynamic train loads.
Figure 21.
Areas affected by the excavation of new tunnels.
Figure 22.
Two-Lane Highway Tunnel Underpass Existing Railway Tunnel Excavation Impact Area.
Table 1.
Parameters of peripheral rock support of Shiqian Wanshoushan Highway Tunnel.
| Sports Event | Tunnel Support Parameters of Shiqian Expressway | Hurong Railway Tunnel Support Parameters | |
|---|---|---|---|
| Initial support | C25 spray concrete | 28cm | 23cm |
| Φ6.5 steel mesh | @20×20cm | @20×20cm | |
| Initial support reinforcement measures | 22a I-beam @60cm closed into a ring | 22a I-beam @60cm closed into a ring | |
| Sprayed steel-framed concrete | System anchor | @60×100cm, L=3.5m, C20 flux-coiled anchors | @120×100cm, L=3.5m, C20 flux-coiled anchors |
| C25 spray concrete | 22cm | 20cm | |
| Steel frame | 16a I-beam @60cm closed into a ring | 16a I-beam @100cm closed into a ring | |
| Secondary lining | 70cm C30 reinforced concrete | 45cm C35 reinforced concrete | |
| Vault | 70cm C30 reinforced concrete | 50cm C35 reinforced concrete | |
| Ancillary construction measures | T76L self-propelled anchor + small conduit in advance | T76L self-propelled anchor + small conduit in advance | |
Table 2.
Table of Rock Mechanical Parameters.
| Enterprise | Materials | E(GPa) | μ | γ(kN/m3) | c(MPa) | φ(°) | σ(MPa) |
|---|---|---|---|---|---|---|---|
| Stratum | Malmstone | 5.09 | 0.31 | 23.13 | 2.25 | 35.82 | 8.90 |
| Mudstone | 2.15 | 0.33 | 23.89 | 1.03 | 33.48 | 3.84 | |
| Highway tunnel | anchor support | 42 | 0.2 | ||||
| steel-frame grating support | 52 | 0.2 | |||||
| Railway tunnel | anchor support | 31 | 0.2 | ||||
| steel-frame grating support | 43 | 0.2 |
Note: γ=stratum unit weight;E=elastic modulus;μ=Poisson’s ratio;c=cohesion; φ=angle of internal friction; σ= compressive strength.
Table 3.
Vertical and horizontal rock reaction coefficients for different rock formations of 3D solid models.
Table 3.
Vertical and horizontal rock reaction coefficients for different rock formations of 3D solid models.
| Rock layers (top to bottom) | Model X, Y, Z direction rock reaction coefficient (t/m3) | ||||
|---|---|---|---|---|---|
| kLXh | kRXh | kFYh | kBYh | kZv | |
| Mudstone | 2665.52 | 4387.63 | 3145.71 | 2432.20 | |
| Malmstone | 7244.13 | 8970.20 | 7759.39 | 7153.64 | |
| Mudstone | 3000.16 | 3126.16 | 2946.43 | 2907.13 | |
| Malmstone | 5915.44 | 5884.53 | 5710.24 | 5710.24 | |
| Mudstone | 4530.42 | 4527.31 | 4384.49 | 4384.49 | |
| Malmstone | 9279.97 | 9156.92 | 8921.78 | 8921.78 | |
| Mudstone | 3433.82 | 3471.77 | 3330.95 | 3330.95 | |
| Malmstone | 9418.76 | 9440.04 | 9170.55 | 9170.55 | |
| Mudstone | 3778.67 | 4061.60 | 3665.52 | 3665.52 | |
| Malmstone | 12121.47 | 12114.00 | 11728.72 | 11728.72 | |
| Mudstone | 2872.95 | 2876.63 | 2781.49 | 2781.49 | |
| Malmstone | 8071.31 | 8006.92 | 7782.58 | 7782.58 | |
| Mudstone | 2849.02 | 3341.86 | 2944.74 | 2944.74 | |
| Malmstone | 10695.17 | 11704.80 | 10214.62 | 10214.62 | |
| Mudstone | 5055.50 | 3273.70 | 3833.84 | 3833.84 | |
| Malmstone | 16257.58 | 17026.51 | 16334.96 | 16334.96 | |
| Mudstone | 4388.29 | 4656.22 | 4334.61 | 4334.61 | |
| Malmstone | 14776.82 | 14146.10 | 14016.62 | 14016.62 | |
| Mudstone | 7913.75 | 8064.80 | 8000.96 | 8000.96 | |
| Malmstone | 7416.49 | 7348.26 | 7214.18 | 7214.18 | |
| Mudstone | 4157.90 | 4093.52 | 3915.15 | 3915.15 | |
| Malmstone | 10895.32 | 11533.88 | 10782.67 | 10782.67 | |
| Mudstone | 3940.98 | 3941.80 | 3755.93 | 3755.93 | |
| Malmstone | 11277.14 | 10721.60 | 10633.81 | 10633.81 | |
| Mudstone | 6106.59 | 6398.02 | 6045.57 | 6045.57 | |
| Malmstone | 6596.91 | 6338.03 | 6255.26 | 6255.26 | |
| Mudstone | 2212.34 | 2078.98 | 2073.10 | 2073.10 | 1556.58 |
Table 4.
Damping constants for different rock formations.
| Rock Stratum | cp | cs |
|---|---|---|
| Mudstone | 278.584 | 140.3275 |
| Malmstone | 407.594 | 212.2705 |
Table 5.
Table of maximum detonating charges for different distances and different vibration velocities.
Table 5.
Table of maximum detonating charges for different distances and different vibration velocities.
| Distance from the Centerline R (M) |
The Maximum Amount of Explosive Charge at a Time Q (Kg) |
Circular Footage (M) | Mass Vibration Velocity V (cm/S) |
|---|---|---|---|
| 30 | 1.7 | 0.6 | 2.00 |
| 40 | 4.0 | 0.6 | 2.00 |
| 50 | 8.0 | 1.0 | 2.00 |
| 60 | 8.0 | 1.0 | 1.52 |
| 70 | 12 | 1.0 | 1.48 |
| 80 | 18 | 1.0 | 1.48 |
| 90 | 26 | 2.0 | 1.49 |
| 100 | 36 | 2.0 | 1.50 |
| 110 | 48 | 3.0 | 1.50 |
| 120 | 62 | 3.0 | 1.48 |
Table 6.
Table of Blasting Parameters for Upper and Lower Step Excavation.
| Name of Shell Hole | Number of Millisecond Detonator Segments | Depth of Hole (m) |
Hole | Single Hole Charge (kg) |
Charge of Single Section (kg) |
|---|---|---|---|---|---|
| CU1 | 1 | 1.4 | 8 | 0.8 | 6.4 |
| CU2 | 3 | 1.3 | 8 | 0.6 | 4.8 |
| AU1 | 5 | 1.1 | 16 | 0.4 | 6.4 |
| AU2 | 7 | 1.1 | 16 | 0.4 | 6.4 |
| AU3 | 9 | 1.1 | 18 | 0.4 | 7.2 |
| AU4 | 11 | 1.1 | 20 | 0.4 | 8.0 |
| PU1 | 13 | 1.1 | 26 | 0.3 | 7.8 |
| BU1 | 15 | 1.1 | 16 | 0.5 | 8.0 |
| AD1 | 1 | 1.1 | 12 | 0.6 | 7.2 |
| AD2 | 3 | 1.1 | 12 | 0.6 | 7.2 |
| AD3 | 5 | 1.1 | 13 | 0.6 | 7.8 |
| AD4 | 7 | 1.1 | 13 | 0.6 | 7.8 |
| PD1 | 9 | 1.1 | 12 | 0.4 | 4.8 |
| BD1 | 11 | 1.3 | 13 | 0.6 | 7.8 |
| subtotal | 203 | 97.6 |
Note: A=auxiliary hole;B=floor hole; C=cut hole; P=peripheral hole; U=upper step; D=downward step.
Disclaimer/Publisher’s Note: The statements, opinions and data contained in all publications are solely those of the individual author(s) and contributor(s) and not of MDPI and/or the editor(s). MDPI and/or the editor(s) disclaim responsibility for any injury to people or property resulting from any ideas, methods, instructions or products referred to in the content. |
© 2023 by the authors. Licensee MDPI, Basel, Switzerland. This article is an open access article distributed under the terms and conditions of the Creative Commons Attribution (CC BY) license (http://creativecommons.org/licenses/by/4.0/).
Copyright: This open access article is published under a Creative Commons CC BY 4.0 license, which permit the free download, distribution, and reuse, provided that the author and preprint are cited in any reuse.
Numerical Stability Analysis of Large Section Tunnels Using the Double-Side Heading Method: A Case Study of Xiamen Haicang Evacuate-Channel
Jianxiu Wang
et al.
Applied Sciences,
2022
Aerodynamic Performance of a High-Speed Train Passing through Three Standard Tunnel Junctions under Crosswinds
Xiujuan Miao
et al.
Applied Sciences,
2020
Comparative Study on the Influence of Different Forms of New Tubular Roof Method Construction on Railway Tracks
Xiaoxue Li
et al.
Symmetry,
2022


MDPI Initiatives
Important Links
© 2024 MDPI (Basel, Switzerland) unless otherwise stated