Preprint
Article

Adsorption of Uranium (VI) from Aqueous Solution Using Melamine Formaldehyde Organo Clay Nanocomposite Foam as a Novel Adsorbent

Altmetrics

Downloads

111

Views

48

Comments

0

A peer-reviewed article of this preprint also exists.

Submitted:

04 December 2023

Posted:

05 December 2023

You are already at the latest version

Alerts
Abstract
Abstract: Uranium is a toxic radioactive element and is usually found in the environment in hexavalent form. It has become a necessity to remove uranium, which can enter the environment in excessive amounts through nuclear industrial activities, from access waters. Melamine formaldehyde organo clay nano composite foam (MFCNCF) was prepared as a novel adsorbent by hardening with thermal treatment. Structural, crystallographic textural and surface morphological characterization of the prepared adsorbent was made by FTIR and XRD spectroscopic and SEM and HRTEM microscopic techniques. This study aims to investigate the adsorption of U(VI) from aqueous solution by MF organo clay nanocomposite and its dependence on various variables such as initial uranium concentration, adsorption time, adsorbent dosage, initial pH, and temperature. Additionally, adsorption isotherm analysis and adsorption kinetics and thermodynamics were also examined. For this purpose, the batch adsorption experiments were carried out and the equilibrium concentration of U(VI) in the aqueous solution was measured with a UV-Vis spectrophotometer at a wavelength of 433 nm, which corresponds to its maximum absorptivity. The results regarding adsorption kinetics show that 30 min is sufficient to reach adsorption equilibrium and the data show a high fit to the pseudo-second-order kinetic model. Isotherm analysis also revealed a high fit of the data to the Type III isotherm and the Halsey model. Based on this fit, an adsorption mechanism involving two regions (electrostatic and complex formation) was proposed for the current adsorption system. The adsorption isosteric enthalpy and entropy values for the first and second regions are 3.65 and -51.02kJ/mol and 1.77 and -167.28J/mol, respectively. It was found in kmol. Experimental results showed that the prepared nanocomposite foam adsorbent is an effective and potential alternative for the effective removal of U(VI) from aqueous solutions.
Keywords: 
Subject: Chemistry and Materials Science  -   Nanotechnology

1. Introduction

Uranium, which is a toxic radionuclide and can generally be found in the environment as a hexavalent ion, is considered one of the important energy sources as nuclear fuel. Uranium, which can originate from various processes related to mining, enrichment and nuclear power plants, nuclear weapons production and electron microscopy, has a high potential to reach aqueous environments. [1,2,3]. Uranium found in wastewater and air can cause acute toxic effects and harmful diseases such as lung, pancreas and liver cancer in humans. The formation and migration of wastes, which generally contain high levels of dissolved uranium, lead to contamination of soils and aquifers, but it is possible to protect groundwater for long periods of time with multiple barrier systems such as compressed bentonite fill [4]. Multiple barrier systems, as geotechnical and geological barriers, are used to minimize or even prevent access to water and the potential for the release of radionuclides from reservoirs near the site. Clay minerals are considered suitable materials for geotechnical and geological barriers due to their high adsorption ability and capacity, swelling properties and low water permeability [5]. Illite , montmorillonite and illite/montmorillonite mixtures are the main components of claystone rocks [6,7]. The recovery of uranium from natural seawater, river water, stagnant water and industrial wastewater is also a priority research topic [8].The main strategy of nuclear waste management discussed worldwide is their disposal in deep geological formations, where salt dome, crystalline rocks and clay rocks are considered potential areas for nuclear waste storage [9].On the other hand, it is known that in a nuclear waste repository hosted by clay rock, radioactive decay of actinides and their fission products can cause high temperature increases of up to 100 o C near waste containers [10,11].Determining the transport regime and amount of radioactive contaminants within aquifers, soils, or rock formations requires detailed knowledge of the geochemistry of the system and radionuclide retention mechanisms such as adsorption, association, and precipitation. The World Health Organization (WHO) and the United States Environmental Protection Agency (USEPA) recommend limit values of 0.015 and 0.030 mg/L, respectively, for the maximum uranium concentration in drinking water [12]. The retention potential of radio pollutants largely depends on their adsorption/desorption behavior [13]. Controlling the mobility of uranium in temporary storage, waste processing and contaminated land is important for the safe disposal of uranium and supporting the management of operations at nuclear facilities. Due to their high thermal and radiation resistance, carbon-based materials are used for the removal and recovery of uranium from aqueous solutions using solid phase extraction techniques [14]. Additionally, organic exchange resins and various inorganic sorbents are other commonly used materials. Carbon fiber with high specific surface area and adsorption capacity, uniform pore size and mechanical strength, graphene with high electronic and thermal conductivity, excellent mechanical strength as well as ultra-light weight and large specific surface area, and graphene oxide, which has basal plane modified with carbonyl, carboxyl, epoxide and hydroxyl groups, can be listed as adsorbents of great interest in this field [15,16]. One of the most promising separation technologies for the removal and recovery of uranium from radioactive waste is solid phase extraction (SPE) due to its properties such as flexibility and emulsion-freeness. Among various solid phase extractants, carbon nanotubes (CNTs) have also attracted intense attention for their advantages such as higher thermal and radiation resistance, high acid-base stability, and large specific surface area [17,18,19,20]. However, the fact that CNT particles, which are highly hydrophobic, easily aggregate in aqueous solution may prevent effective adsorption behavior and cause a decrease in adsorption capacity [9,10]. Therefore, by adding various hydrophilic functional groups to CNTs, their dispersibility and adsorption performance can be increased [9,10,21]. There are many studies examining the behavior of uranium in aqueous systems containing amberlite resin and its adsorption to the solid phase. The main processes affecting the retention of radionuclides are absorption and precipitation at the solid/water interface, which need to be studied in detail from quantitative, kinetic and thermodynamic perspectives. [22,23,24,25]. Various processes such as chemical precipitation, liquid-liquid extraction, nano-ultra filtration, membrane separation, ion exchange, electrodeposition, solid phase extraction, electro dialysis, photo catalysis and adsorption are widely used to remove radioactive ions from wastewater [26,27,28,29,30,31,32,33]. Adsorption is one of the most popular methods and the easiest way to remove radioactive ions from aqueous solutions and is therefore widely applied in the removal of uranium from industrial wastes [34,35,36,37,38,39,40].Uranium adsorption on various natural adsorbents and ion exchange resins with various properties such as porosity and selective affinity is important for the purification, economic, environmental and disposal of radioactive waste [39,41,42].Anion exchange resins have also been used successfully in the mining industry, particularly in the recovery of uranium from leaching fluid [43,44,45,46,47,48]. In addition, activated carbon and zeolites, immobilized siloxane polymers, natural and modified clay, and synthetic anion exchangers are also widely used [49,50,51,52].Clay minerals, and especially bentonite, are a particularly preferred material for filling and capping high-level radioactive waste repositories.2:1 type clay minerals such as illite and montmorillonite, which are layered alumino-silicates in which TOT (tetrahedron-octahedron-tetrahedron) layers are repeated and have a permanent negative charge with isomorphic displacements within the lattice, are popular for such uses with their large surface areas and strong adsorption capacities. [5,6,53]. Montmorillonite is characterized by permanently negatively charged basal planes and amphoteric hydroxyl groups on the edge planes. It is a very suitable adsorbent for lanthanide/actinide cations due to its ability to bind to basal planes predominantly in the outer sphere mode through cation exchange at low pH and inner sphere complexation to occur at the edges at high pH [54,55,56]. A model frequently applied to describe the interactions of various radionuclides with clay minerals was developed by Bradbury and Baeyens. This semi mechanical two-domain model of protolysis, non-electrostatic surface complexation, and cation exchange was used to successfully describe sorption isotherm data over a wide pH range [6]. Under oxidative conditions, uranium exists in the hexavalent oxidation state as the uranyl ion UO2+2 and can form highly soluble aqueous complexes with many ligands found in groundwater. Dissolved carbonate is ubiquitous, especially in surface and deep groundwater, and can form strong aqueous complexes with U(VI) [58]. The formation of such complexes could potentially lead to a decrease in adsorption and thus an increase in the migration rates of U(VI). A detailed understanding of sorption processes under a wide range of conditions is extremely important in the development of sorption models. Various surface complexation models based on macroscopic sorption experiments have been developed to explain the adsorption behavior of uranyl, especially on montmorillonite [59,60,61,62,63]. It has been suggested that at low ionic strengths, uranyl will adsorb primarily to cation exchange sites in the interlayer below pH 5 and to edge sites (silanol and/or luminol) above this pH. It has been predicted that at high ionic strengths, cation exchange will decrease strongly and sorption will occur mainly in the edge regions of montmorillonite from pH 5 onwards [61,64].In the presence of carbonate, the adsorption of U(VI) on montmorillonite and bentonite was investigated, and the sharp decrease in absorption observed at pHs greater than 6.5 was explained by the formation of negatively charged uranyl-carbonate complexes [65,66,67,68]. Depending on pH and U(VI) charge, outer sphere complexation, that is, cation exchange, occurring in the edge regions of clay minerals can be distinguished from inner sphere complexation [13]. Natural polymers such as polysaccharides have shown excellent potential, especially in the removal of heavy metals from waters, and are advantageous due to their low cost, availability and the presence of hydroxyl, amino and other compounds [69].In addition to the existing traditional methods in wastewater treatment, the adsorption process using polymer-grafted biomaterials such as cellulose, chitosan, chitin, starch and some synthetic polymers is gaining increasing importance [70,71,72].
Melamine formaldehyde, a common synthetic polymer, is structurally similar to exchange resins and offers a high adsorption potential in removing positively charged uranium ions from aqueous solution [73,74,75]. Additionally, by obtaining nano composites using nano fillers, the surface area and the number of oxy and azo groups on the surface can be increased. It is known that the incorporation of nano fillers into the polymer matrix is a powerful tool to improve polymer properties [76]. Bentonite, which has a 2:1 layered structure in particular, is one of the clays widely used to prepare organ clay due to its high ion exchange capacity and high specific area. By adding surfactants or modifying the surface by grafting, organ clay with the potential to turn into nanoparticles can be obtained. [77,78]. The novelty of this work can be defined as the synthesis and characterization of melamine formaldehyde organo clay nanocomposite and also the demonstration of its applicability as a new adsorbent in the removal of uranium from aqueous solution [79].
In this study, melamine formaldehyde organo clay nanocomposite (MFCNC) was prepared as a novel low-cost and promising solid adsorbent to remove U(VI), and its uranium (VI) adsorption performance from aqueous solution was examined. Additionally, variables such as adsorption time, initial pH, adsorbent dosage and temperature were selected as experimental parameters.

2. Materials and Methods

2.1. Materials

In this study, raw montmorillonite (MMT) with a specific surface area of 64.2 m2/g, obtained from Çankırı, Turkey, was used to prepare organo-montmorillonite (OMMT) to be used in the preparation of nanocomposite. The XRF composition of montmorillonite is given in Table 1.
For the synthesis of melamine formaldehyde resin to be used as the composite matrix, melamine, formaldehyde (37%), NaOH and acetic acid, and for the foam synthesis, non-ionic surfactant, Tween 80 and analytical grade glycerin were obtained from Merck Co. In addition, gasoline, which was a mixture of isooctane, butane and 3-ethyltoluene and used for foaming, was also supplied from a gas station.
The 0.12 M stock aqueous solution of U(VI) used as adsorbate was prepared using the acetate salt of uranium oxide (UO2(CH3COO)2H2O) (Merck Co.). Solutions of different concentrations for adsorption experiments were prepared by diluting this solution.

2.2. Method

2.2.1. Preparation of Organo Clay

Organo-clay (OMMT), cationic surfactant, Cetyltrimethyl Ammonium Bromide, CTAB (purchased from Merck Co.), was prepared by solution intercalation method using hydrocarbon material and montmorillonite, some of whose characteristics are given in Table 2. For synthesis, the same procedure as applied in previous work was followed [80,81].

2.2.2. Preparation of Melamine Formaldehyde Pre-Polymer (MF) and MF-Organo-Clay Nanocomposite

37 wt.% formaldehyde and melamine (1.0/1.1 ratio) were placed in a three-necked flat-bottomed flask equipped with a thermometer and cooling equipment, stirred magnetically, and heated at approximately 60 °C until a clear solution was formed. Then, the pH was adjusted to 8.5 with concentrated NaOH solution and refluxed for 1 h at approximately 95°C. Finally, sufficient amounts of concentrated acetic acid, 1.0 wt.% glycerin, Tween 80 and 6.0 wt.% gasoline were added to the pre polymer and vigorous mechanical mixing was done to make the mixture homogeneous. While MF organo clay nanocomposite was prepared by in situ synthesis, 0.15 wt.% organo clay was added to the flask. While preparing nanocomposites, a certain amount of powder MFCNC was added and mixing was continued. The resulting mixture was exposed to microwave radiation for 2 min in a suitable container. Finally, the mixture was taken into a modular square aluminum mold with an internal volume of 10 x 10 x 1 cm3 and subjected to heat treatment in a hot air heated oven at 140 °C for 1 hour to remove water and residual formaldehyde and ensure complete curing [82]. For textural, structural and crystallographic characterization of pure MF foam and MF organo clay nanocomposite foam, High-resolution transmission electron microscopy (HRTEM), Fourier transform infrared spectroscopy (FTIR) and X-Ray diffraction (XRD) analyzes were carried out [83].

2.2.3. Batch Adsorption Experiments

Adsorption of uranium (U(VI)) from aqueous solution onto powder MF organo clay nanocomposite foam was carried out by bulk adsorption experiments. For this, 0.1 g of powdered foam was added to aqueous solutions at various initial U(VI) concentrations (600, 1200, 2400, 3600, 4800 and 6000 µM) in 100 mL flat-bottom flasks. The flasks were shaken for various equilibrium adsorption times in a thermostatic shaker at 298 K, natural pH 4.3, and a stirring speed of 150 min-1. At the end of each adsorption period, the mixture was centrifuged for 5 min at 3,750 min-1, and the equilibrium U(VI) concentration in the supernatant was analyzed at 433 nm using a UV–vis spectrophotometer (Shimadzu 1201 UV-Vis). Equations 1,2, and 3 were used to calculate the distribution coefficients (D), the amount of U(VI) adsorbed (q), and the removal ratio (% R).
D = ( C o C e ) / C e
q ( μ g / g = C o C e V / m
R ( % ) = C o C e C o . 100
where, Co and Ce are initial and equilibrium U(VI) concentrations (µM), V total volume (L) and m, MFCNC foam mass (g), respectively.
In order to examine the change in adsorption of U (VI) with temperature and to obtain the necessary data for thermodynamic analysis, the experiments were performed at various initial U(VI) concentrations, three different temperatures (25, 45 and 65°C),0.1 g/100 mL solid/liquid ratio and natural pH for 60 min.
To investigate the effect of initial pH, the experiments were carried out at pH values of 1.0, 3.0, 11.0 and 13.0 at 25° for 60 min with an initial U(VI) concentration of 3.0 µM and a solid/liquid ratio of 0.1g /m L. The pH of the solutions was adjusted with concentrated HCl and NaOH solutions, and measurements were made using a WTW inoLab pH meter (WTW Inc., Germany).
Additionally, in order to reveal the effect of adsorbent dosage on U(VI) adsorption, experiments were performed at natural pH and 25°C for solid/liquid ratios of 0.05, 0.10, 0.15, 0.20 and 0.25 g/mL, with initial U(VI) concentration of 1200 µM for 60 min.

2.2.4. Zeta Potential Measurements

Zeta potentials of solid particles in MF organo clay nano composite /water suspensions and electrical conductivity values of the suspensions were measured using the Zeta Meter 3.0+ instrument.

2.2.5. Spectroscopic and Microscopic Analyzes

Structural, crystallographic and textural characterization of raw clay, organ clay, MF foam and MF organ clay nanocomposite foam was performed using spectroscopic techniques such as XRD and FTIR as well as microscopic technique such as HRTEM.
XRD diffraction diagrams for the prepared samples were taken using a PANalytical Empyrean
FTIR spectra were taken using a Vertex 70 V FTIR spectrometer, in the range from 4,000 to 400 cm−1, with an average of 100 scans and a resolution of 1 cm−1.
HRTM images were also taken using a HITACHI HT7700 high-resolution transmission electron microscope (LaB6 filament) at 120.0 kV.

3. Results and Discussion

3.1. Textural, Structural and Crystallographic Characterization of Raw Montmorillonite (MMT), Organo-Montmorillonite (OMMT), Melamine Formaldehyde Foam (MF) and Melamine Formaldehyde Organo-Clay Nanocomposite Foam (MFCNC)

In order to compare the textural structure of organo-montmorillonite (OMMT) with that of raw montmorillonite (MMT), HRTEM images of both samples were taken and shown in Figure 1a,b, respectively. The dark long fibrous lines in the HRTEM images correspond to the clay layers that form the clay grains. Figure 1b shows that the interlayer spaces of the clay layers widen significantly due to surface modification.
Figure 1c shows that pure MF foam aggregates in the form of microspheres and the aggregates develop in three dimensions. This textural arrangement is probably due to microwave irradiation-assisted foaming before curing. From Figure 1d, it can be seen that due to the exfoliation of organo clay platelets in the MF matrix, the MF clusters disperse or disintegrate uniformly while maintaining their spherical structure [84].
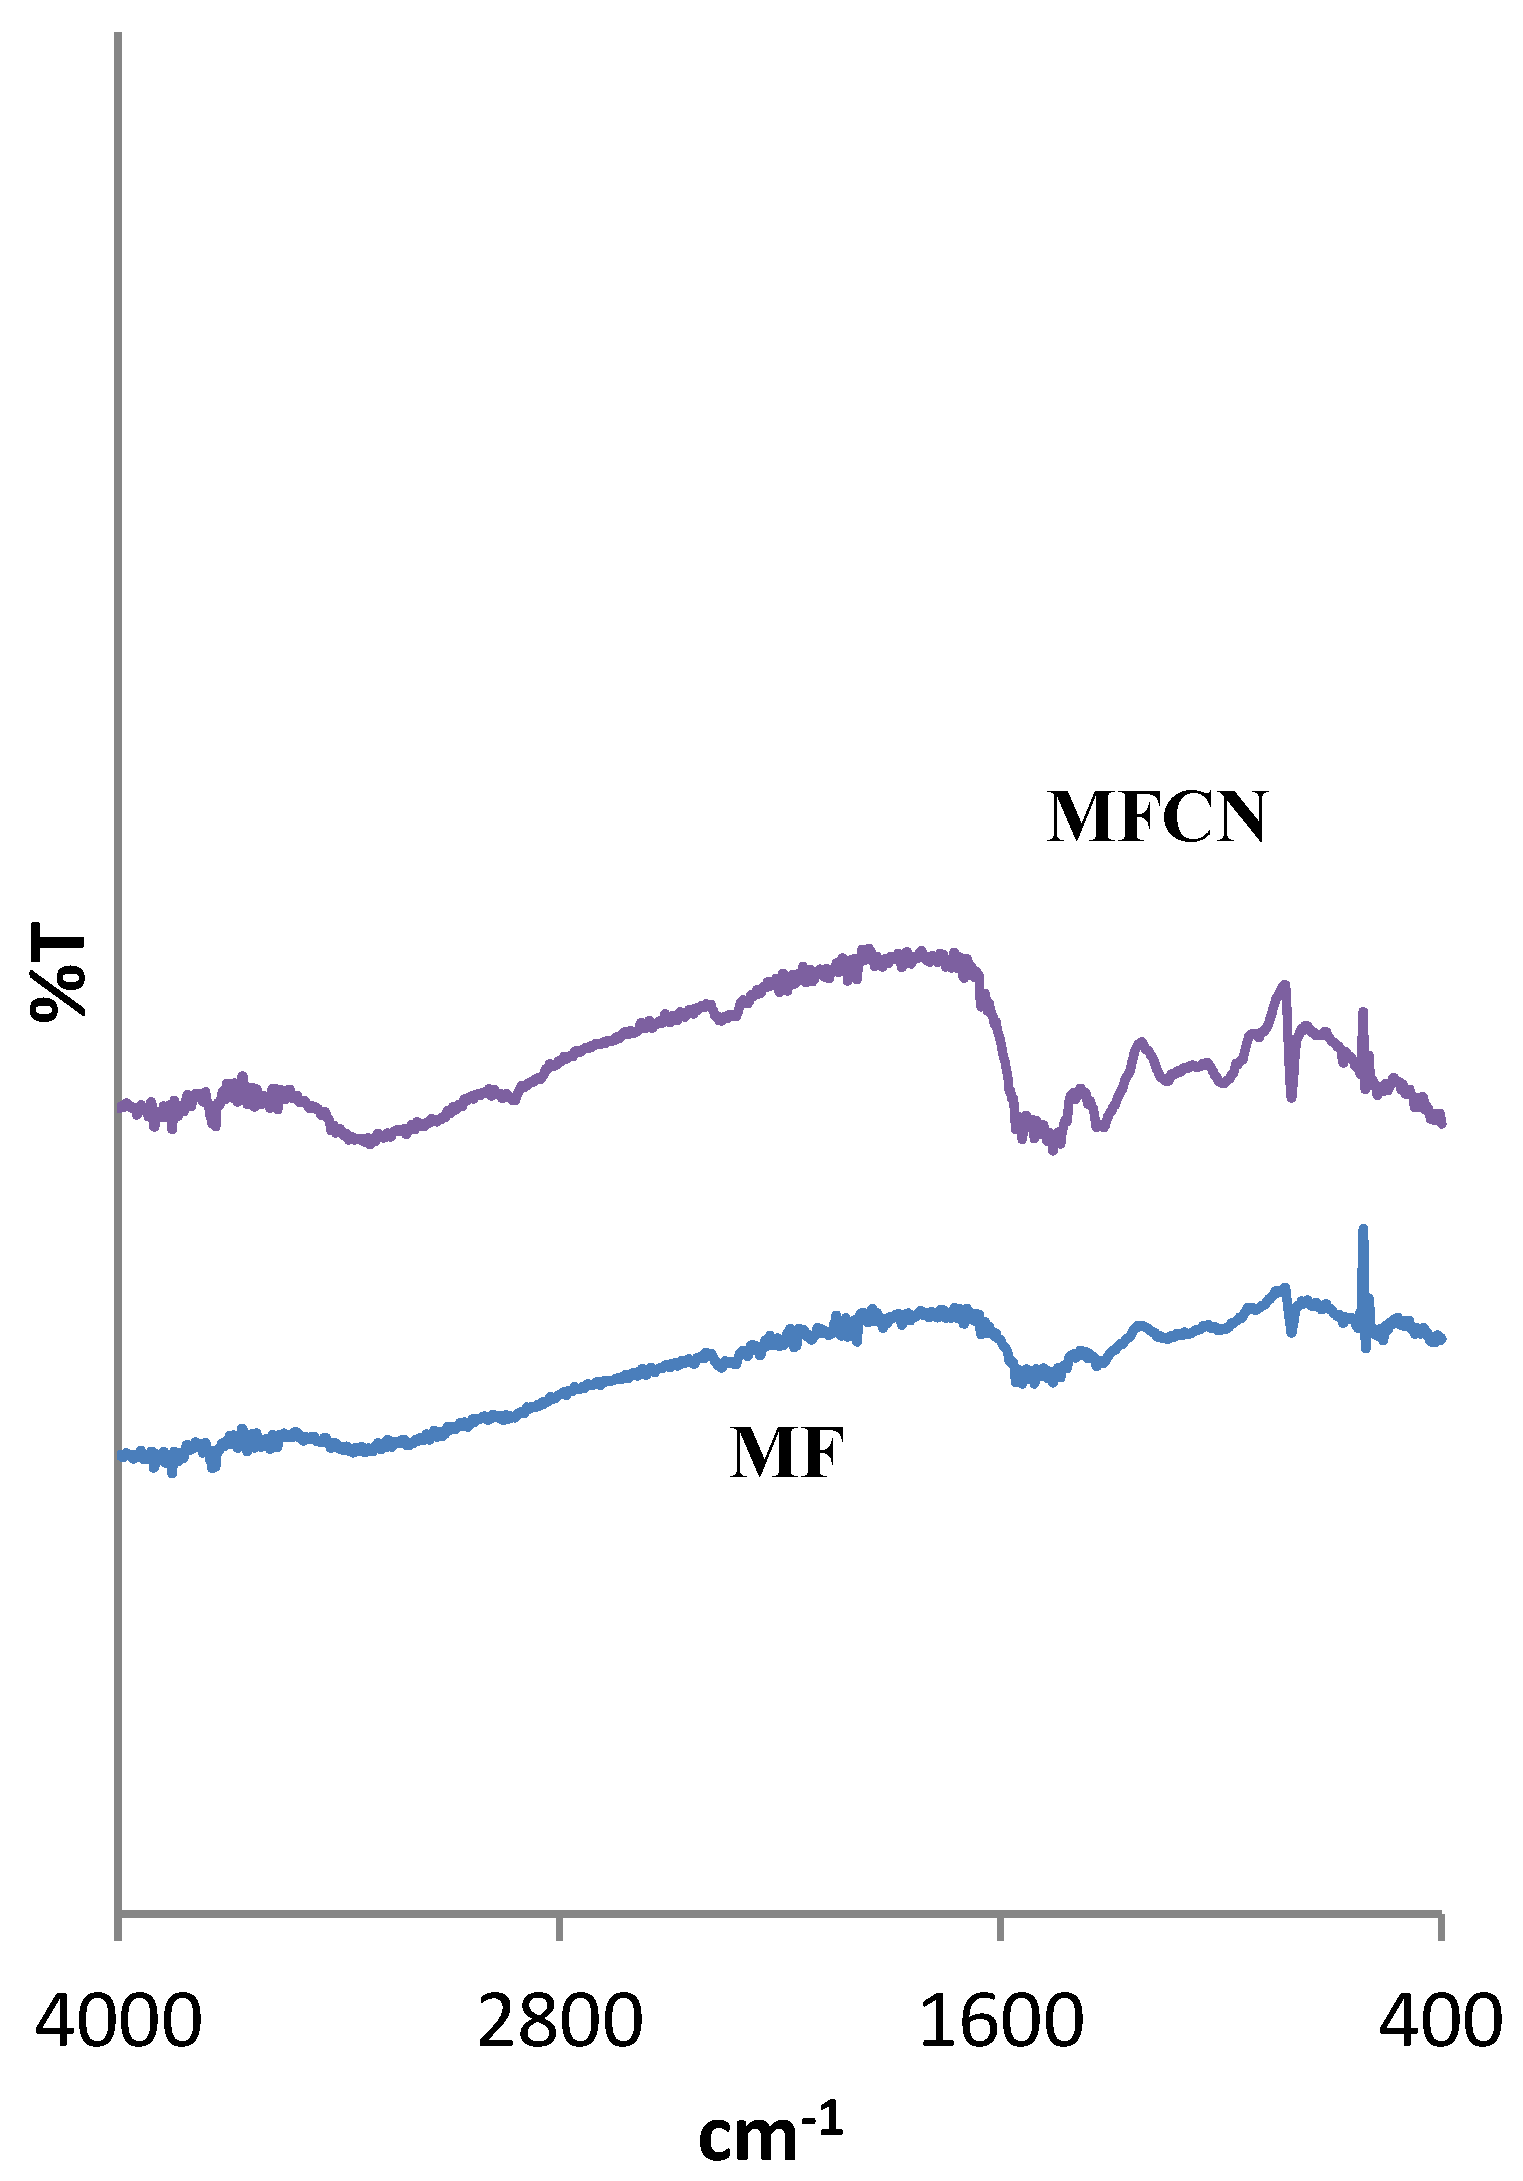
FTIR spectra of melamine formaldehyde foam (MF) and melamine formaldehyde nanocomposite foam (MFCNC) are shown in Figure 2. The peaks at 3327 cm−1, 1016 cm−1, 1541 cm−1 and 1450 cm−1 in the FTIR spectrum of MF correspond to the stretching vibration of N-H, O-H, C-O-C and C=N bonds, respectively [85].
From Figure 2, it can be seen that in the spectrum of MF-organo-clay nanocomposite (MFCNC), there are the strong peak at 3354 cm-1 originating from CTAB as well as the peaks at 2926, 2914 and 2881cm-1, which correspond to C–H anti-stretching, C–H stretching and amine group stretching. The fact that these specific peaks are both lower in intensity and shifted to lower values can be attributed to the intense interactions between the clay layers and CTA+ ions bonded with long-chain hydrocarbon molecules. Additionally, two peaks at 1454 cm-1 and 1129 cm-1, corresponding to C-N stretching and N-H bending of CTAB, and peaks in the range of 1302-1657 cm-1, corresponding to the shear vibration mode of CH2 and O-H bending of H2O, appeared. The main functional groups observed in the range from 1000 cm-1 to 500 cm-1 correspond to Si-O and Al-OH bonding, and the peak at 866 cm-1 corresponds to Al-OH bending vibrations. The peak of Si-O-Si double bonds of SiO2 origin at 802 cm-1 and the peak of Si-O stretching vibrations observed around 714-617 cm-1 also indicate quartz. Strong peaks around 3356-3730 cm-1 indicate the presence of hydroxyl bonds, but their appearance at low intensity and different from their specific values is associated with intense interactions between clay plates and CTA+ ions bound to long-chain hydrocarbons. [86,87].
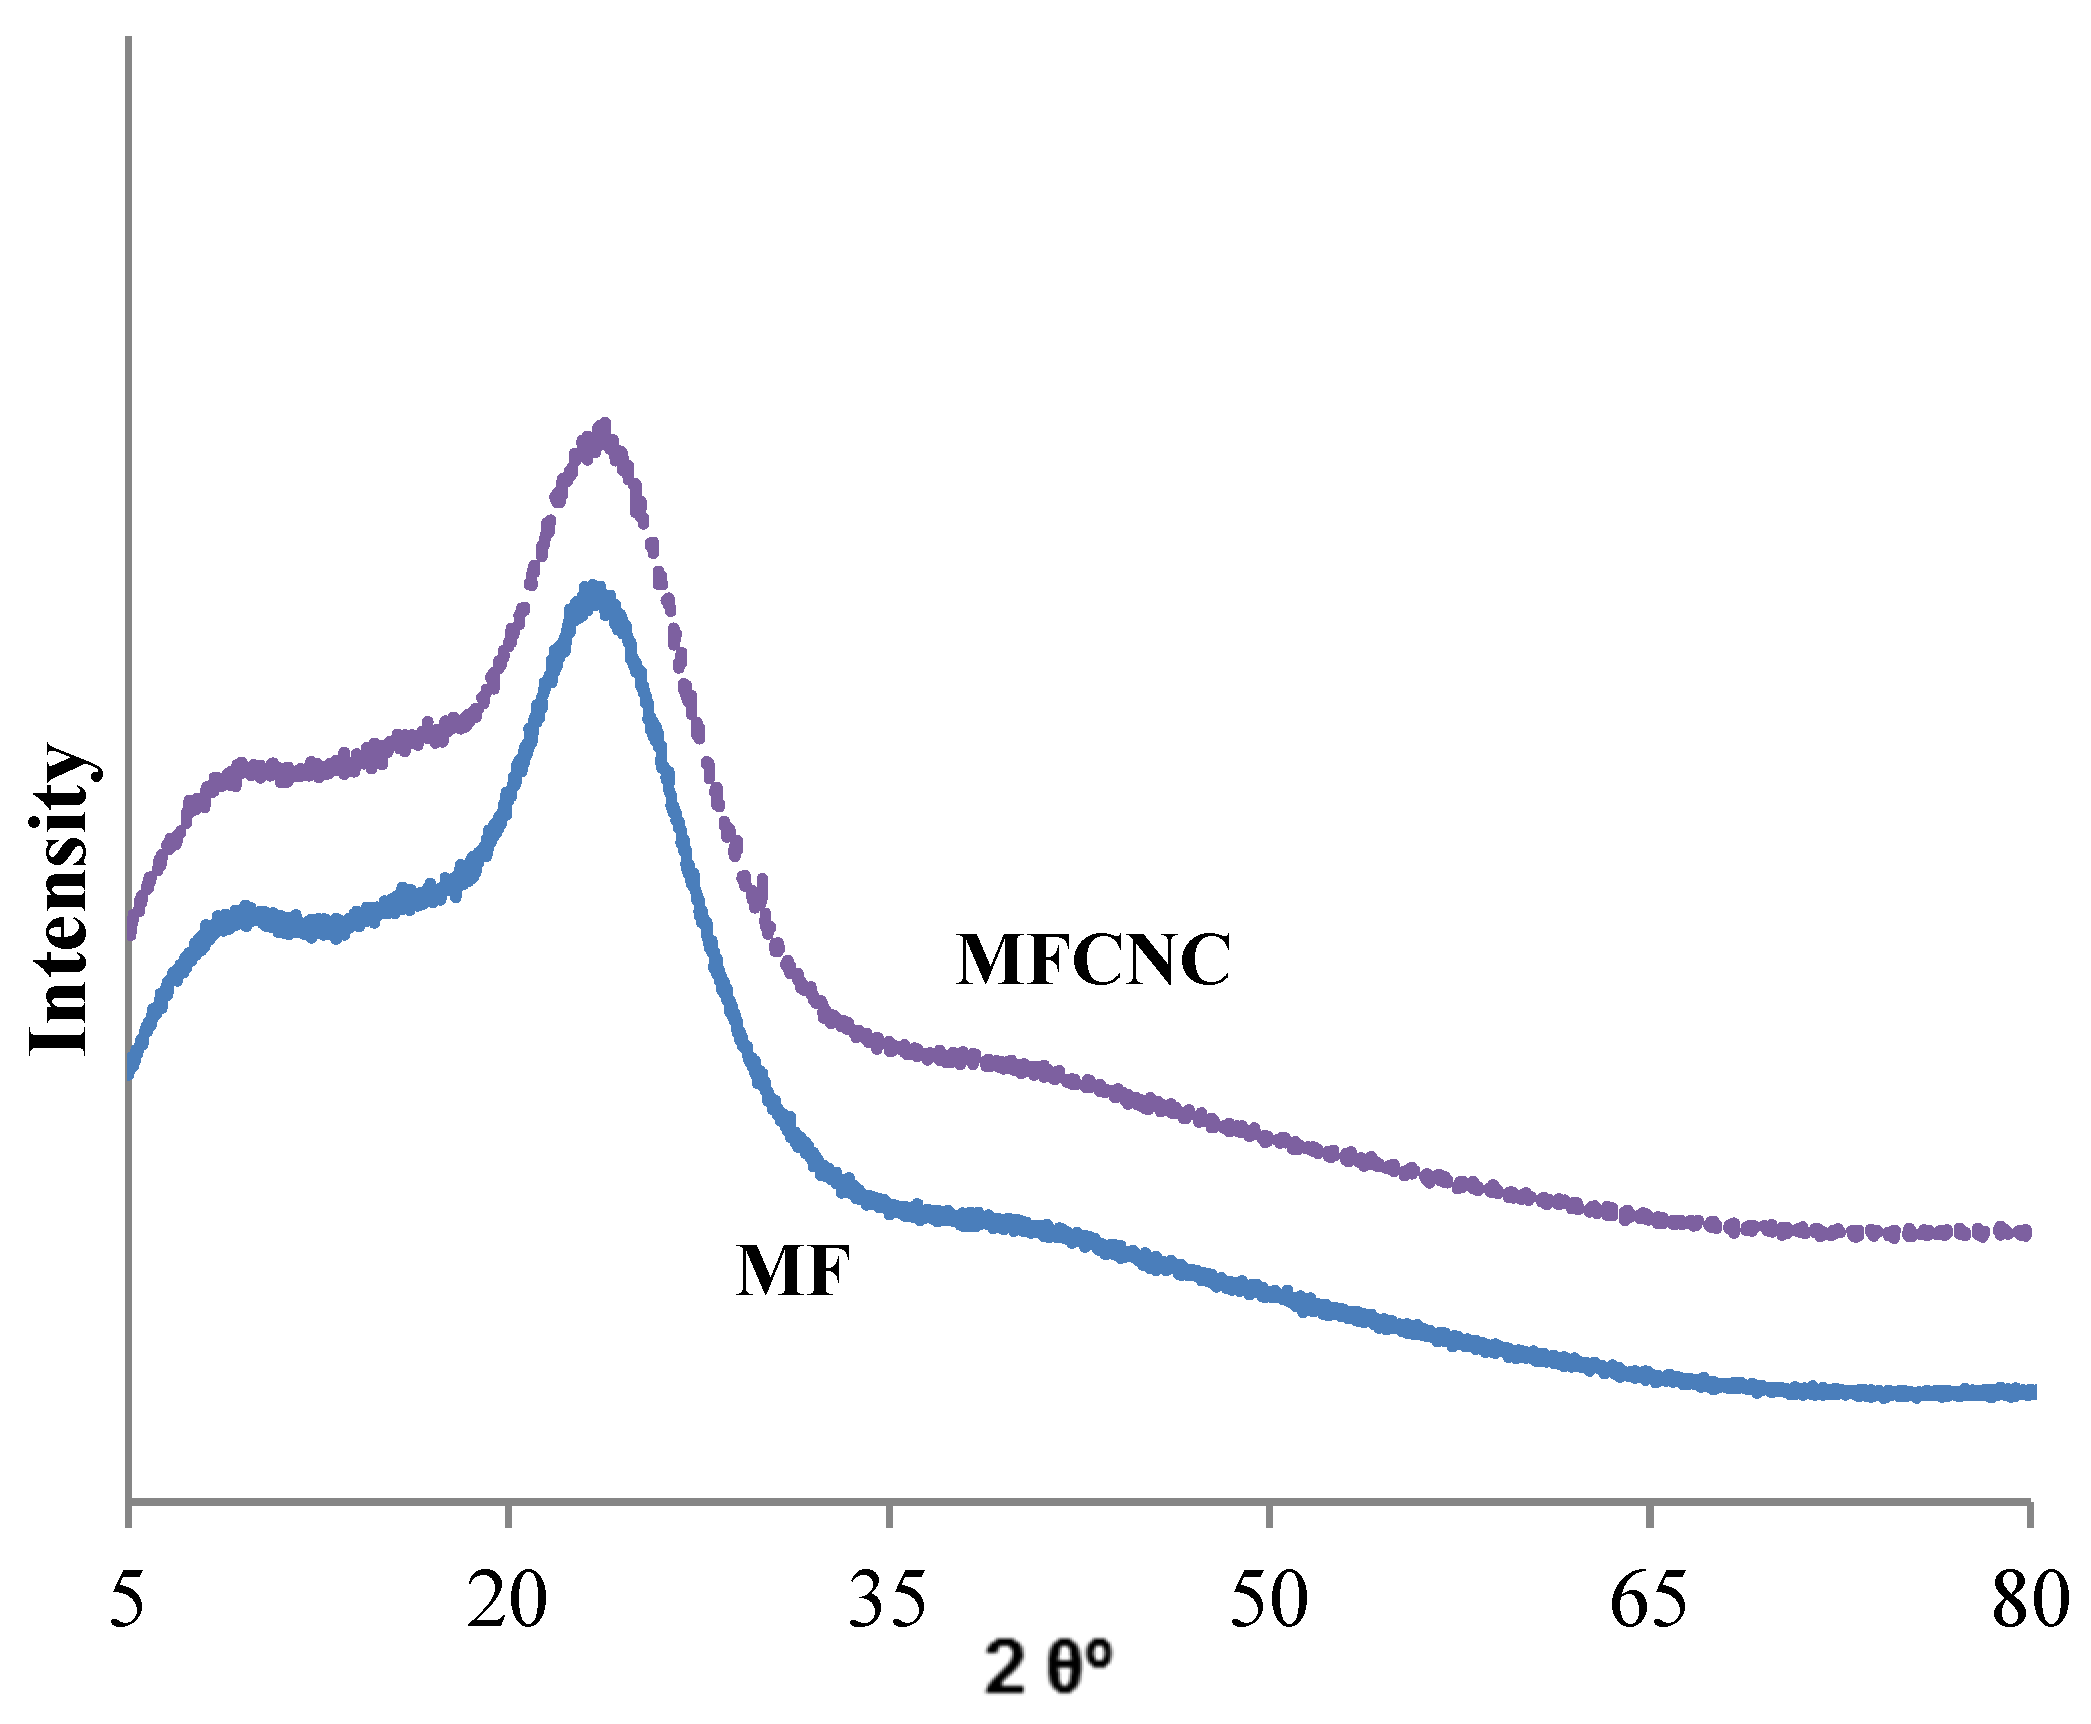
Figure 3 shows the XRD patterns of pure MF foam and MF-organo clay nanocomposite foam (MFCNC).
Two typical broad peaks at 9.4° and 23.8° appearing in the pattern of MF resin indicate its amorphous structure and indicate that melamine formaldehyde is composed of methylol monomers and propagation of the polymeric backbone has occurred. It can also be seen from this figure that the smaller of the two peaks of MF resin partially overlaps with the characteristic smectite peak at 8.1° [86,88]. The left-shifted and broadened smectite peak also shows that polymer molecules can intercalate into the interlayer space of the clay and thus the nanocomposite structure is formed (See Figure 1d).

3.2. Kinetic Studies

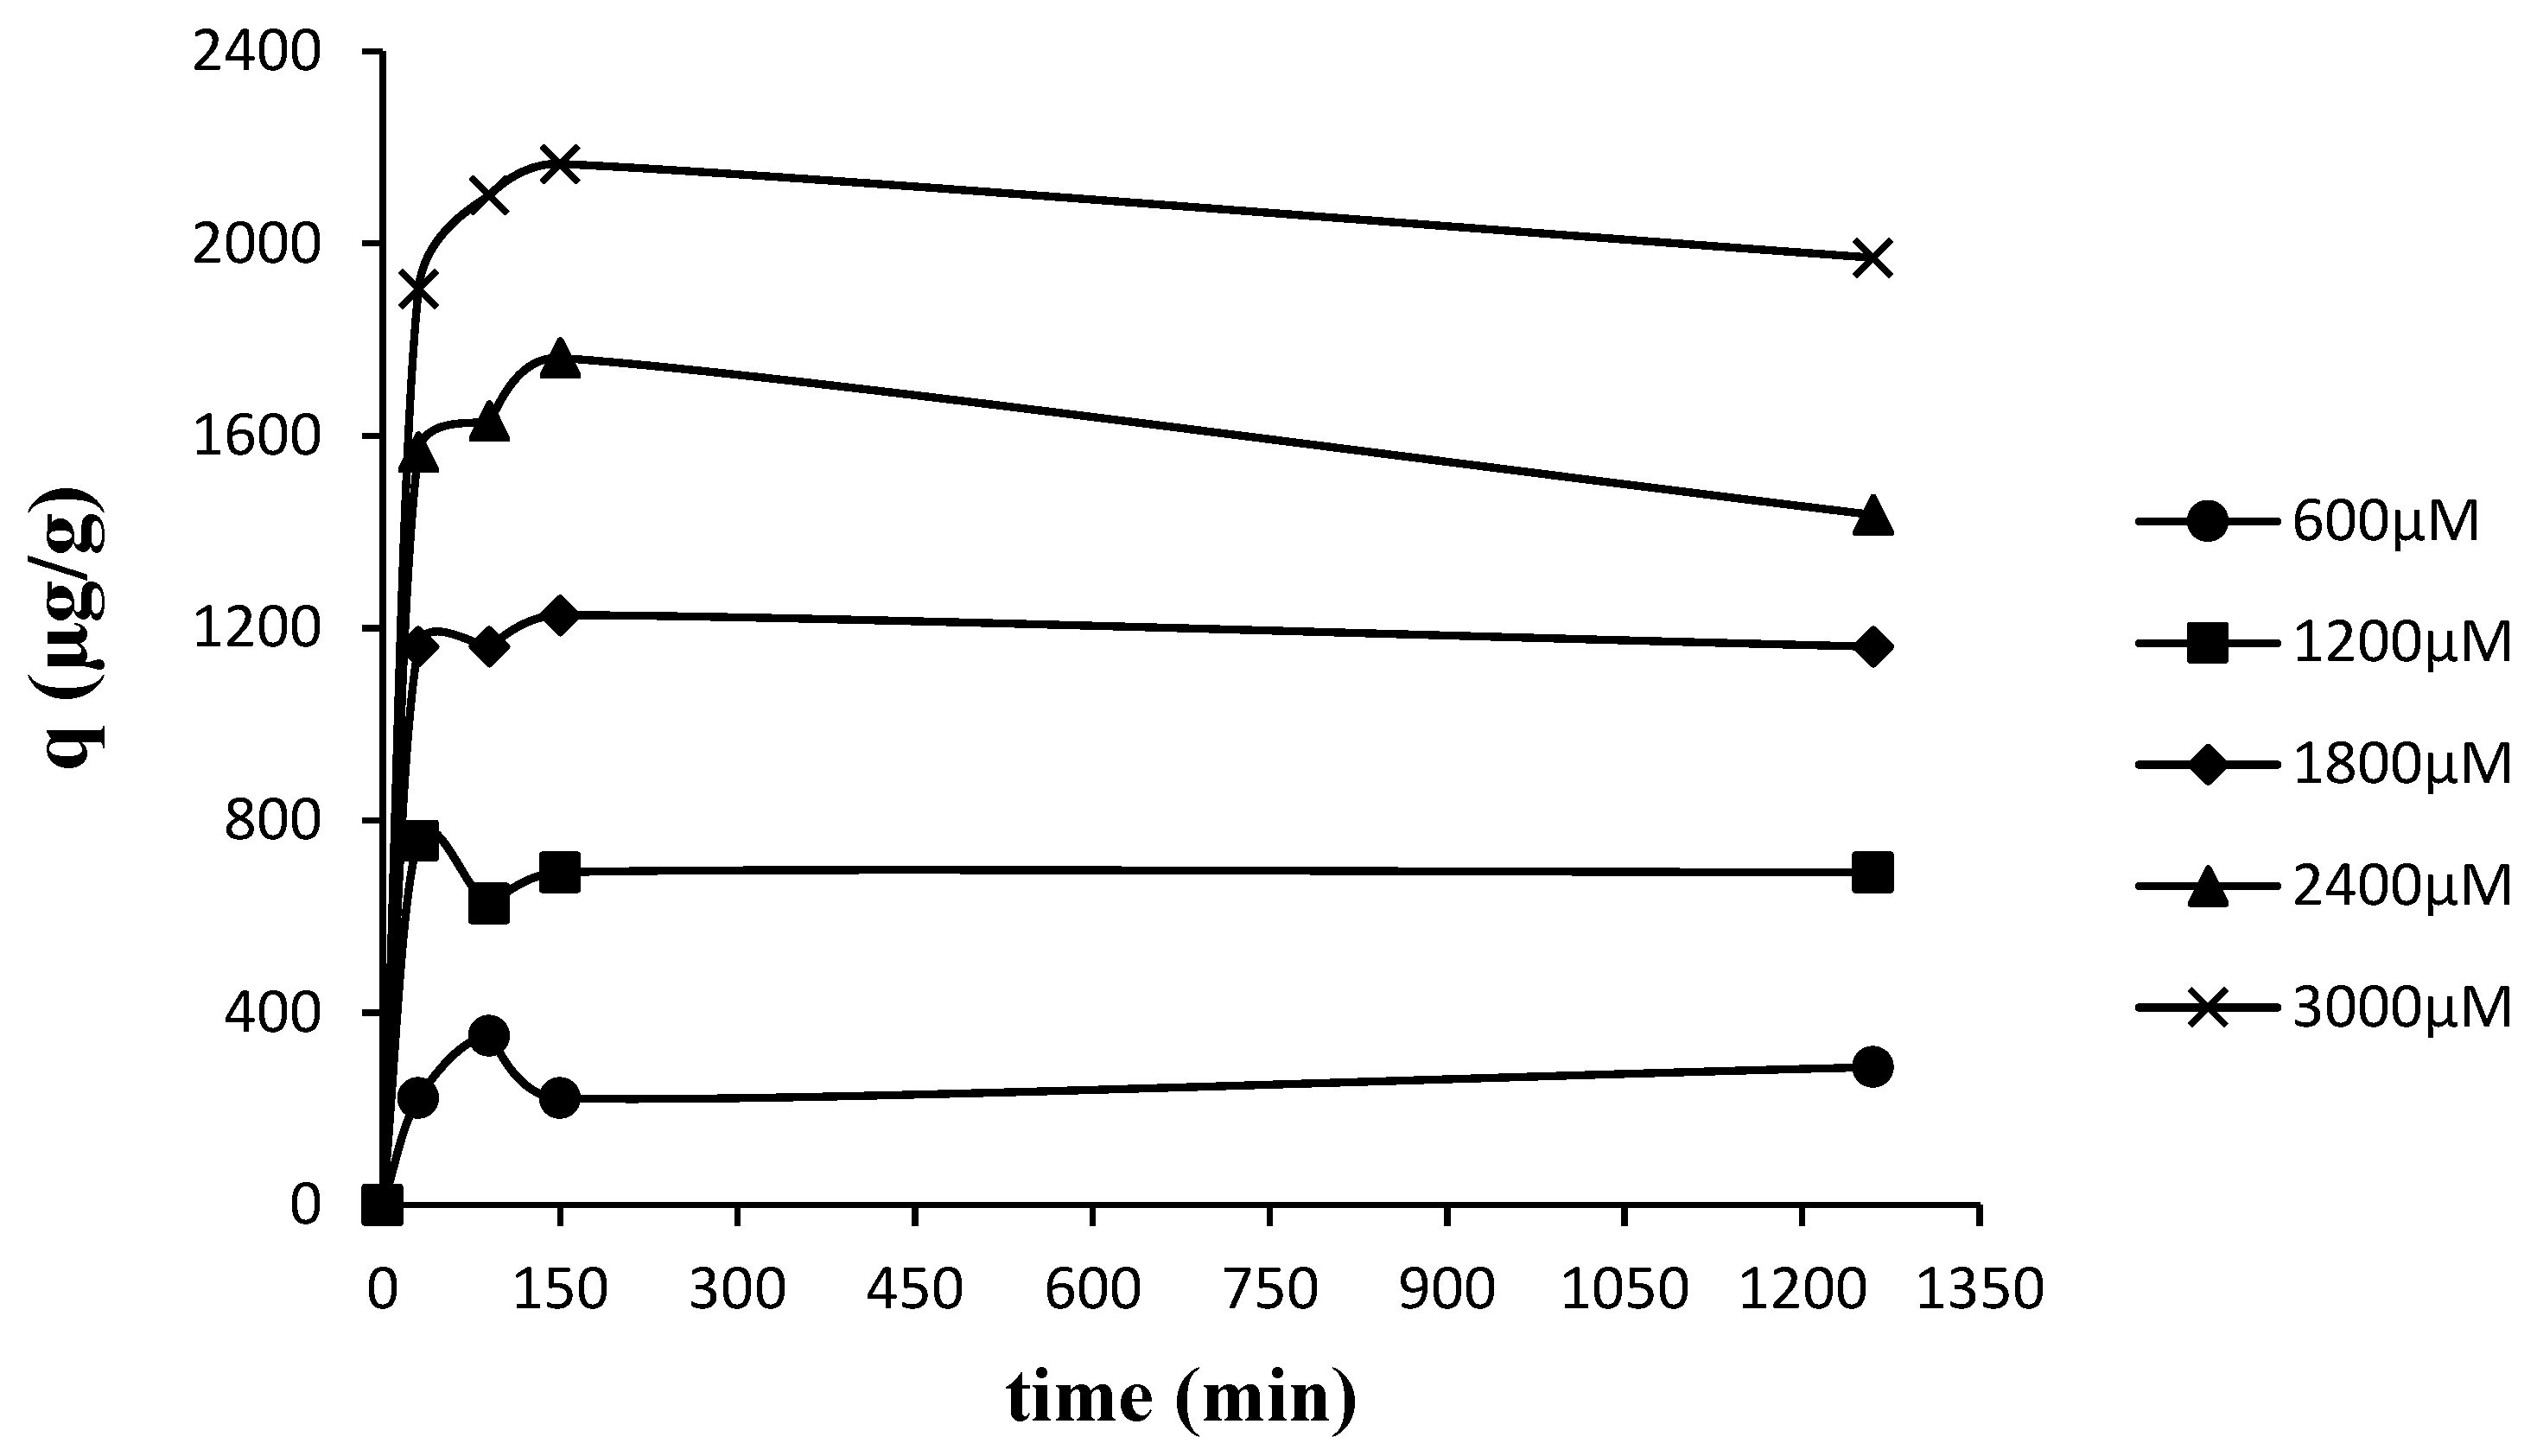
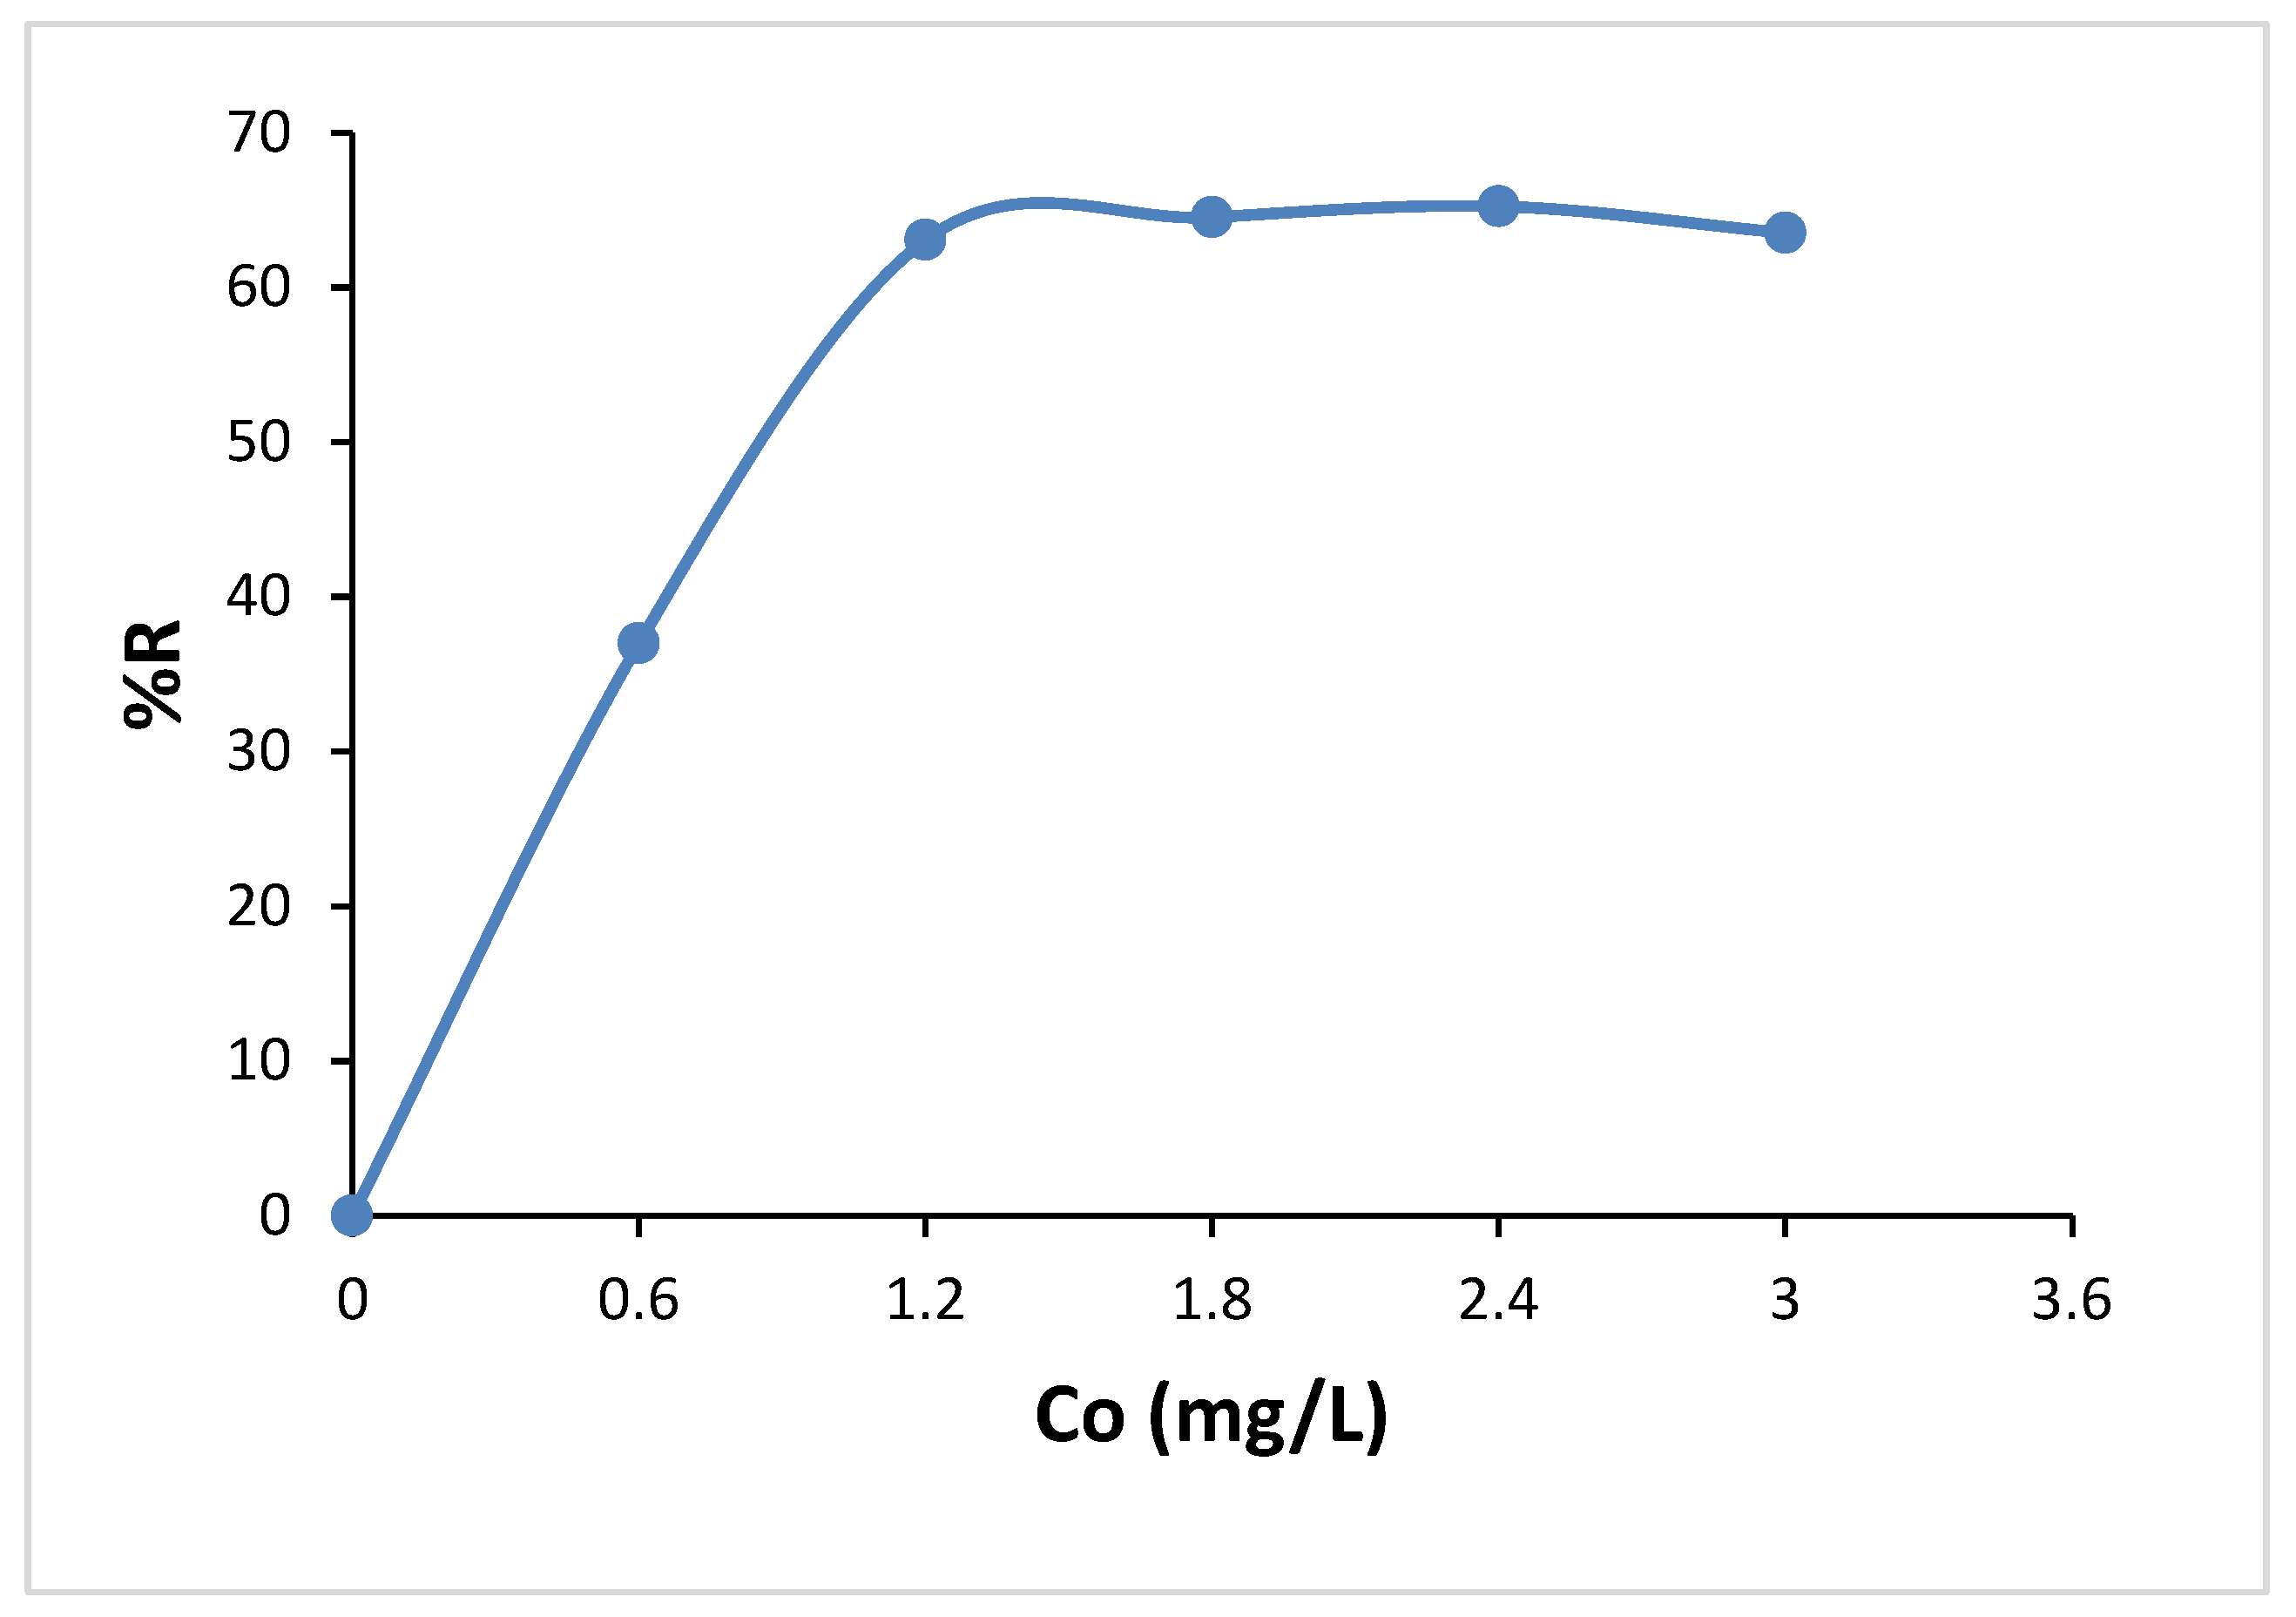
The results obtained from the experiments examining the change in the amount of U (VI) adsorbed by the powder nanocomposite (MFCNC) with the adsorption time are shown in Figure 4 as a function of the initial U (VI) concentration. Additionally, for 25°C, the variation of the % removal rate with the initial U (VI) concentration is given in Figure 4.
As can be seen from Figure 4, the adsorbed amounts of U(VI) first increased rapidly with the increase of adsorption time and remained almost constant after 30 min. Moreover, from the same figure, it can be seen that as the initial U (VI) concentration increases, the plateaus that appear in the 30-minute period and correspond to saturation adsorption gradually increase. Accordingly, it can be said that a rather short period of 30–60 min is sufficient for equilibrium adsorption, implying that the interactions occurring are physical. Moreover, the rapid removal of U (VI) in the initial stage of adsorption can be attributed to the presence of a large number of active sites suitable for the interaction of U (VI) ions in the nanocomposite matrix. These sites are probably the triazine rings of the polymer network, with which U(VI) interacts very effectively (bonding by polarization of pi electrons), oxy and azo groups (complexation), and hydrolyzed SiOH groups on the surface of exfoliated clay platelets (electrostatic attraction). Since the change in initial U(VI) concentration did not appear to have a dominant effect on the time required to reach saturation, the equilibrium adsorption time was taken as 60 min in subsequent experiments to ensure that adsorption equilibrium was reached.
The change in removal ratio with initial U(VI) concentration is graphed in Figure 5. From this figure, it can be seen that U(VI) on the powder nanocomposite can be removed with a very high removal ratio in a very short adsorption time, and the removal ratio does not change much with the increase of the initial concentration.
By studying adsorption kinetics, important information about the control mechanisms of adsorption can be obtained, and adsorption can generally be controlled by external or film diffusion, pore diffusion, and adsorption on the pore surface.In order to make predictions about the mechanism of U(VI) adsorption on the adsorption nanocomposite surface, the compatibility of experimental data with pseudo-first-order, pseudo-second-order and intra-particle diffusion models was examined [89,90,91]. The linear forms of the equations of these models are given in Equations 4, 5 and 6, respectively.
ln q e q t = l n q e k 1 t
1 / q t = 1 / k 2 q e 2 + t / q e
q t = k i d t + c
where qe (mg/g) is the amount adsorbed at equilibrium, qt (mg/g) is the amount adsorbed at time t (min), k1 (min−1), k2 (g/mg min) and kid (mg/g min1/2) are the rate constants of the pseudo-first-order model, the pseudo-second-order model, and the intra-particle diffusion model, respectively, and c is a constant related to the boundary layer thickness.
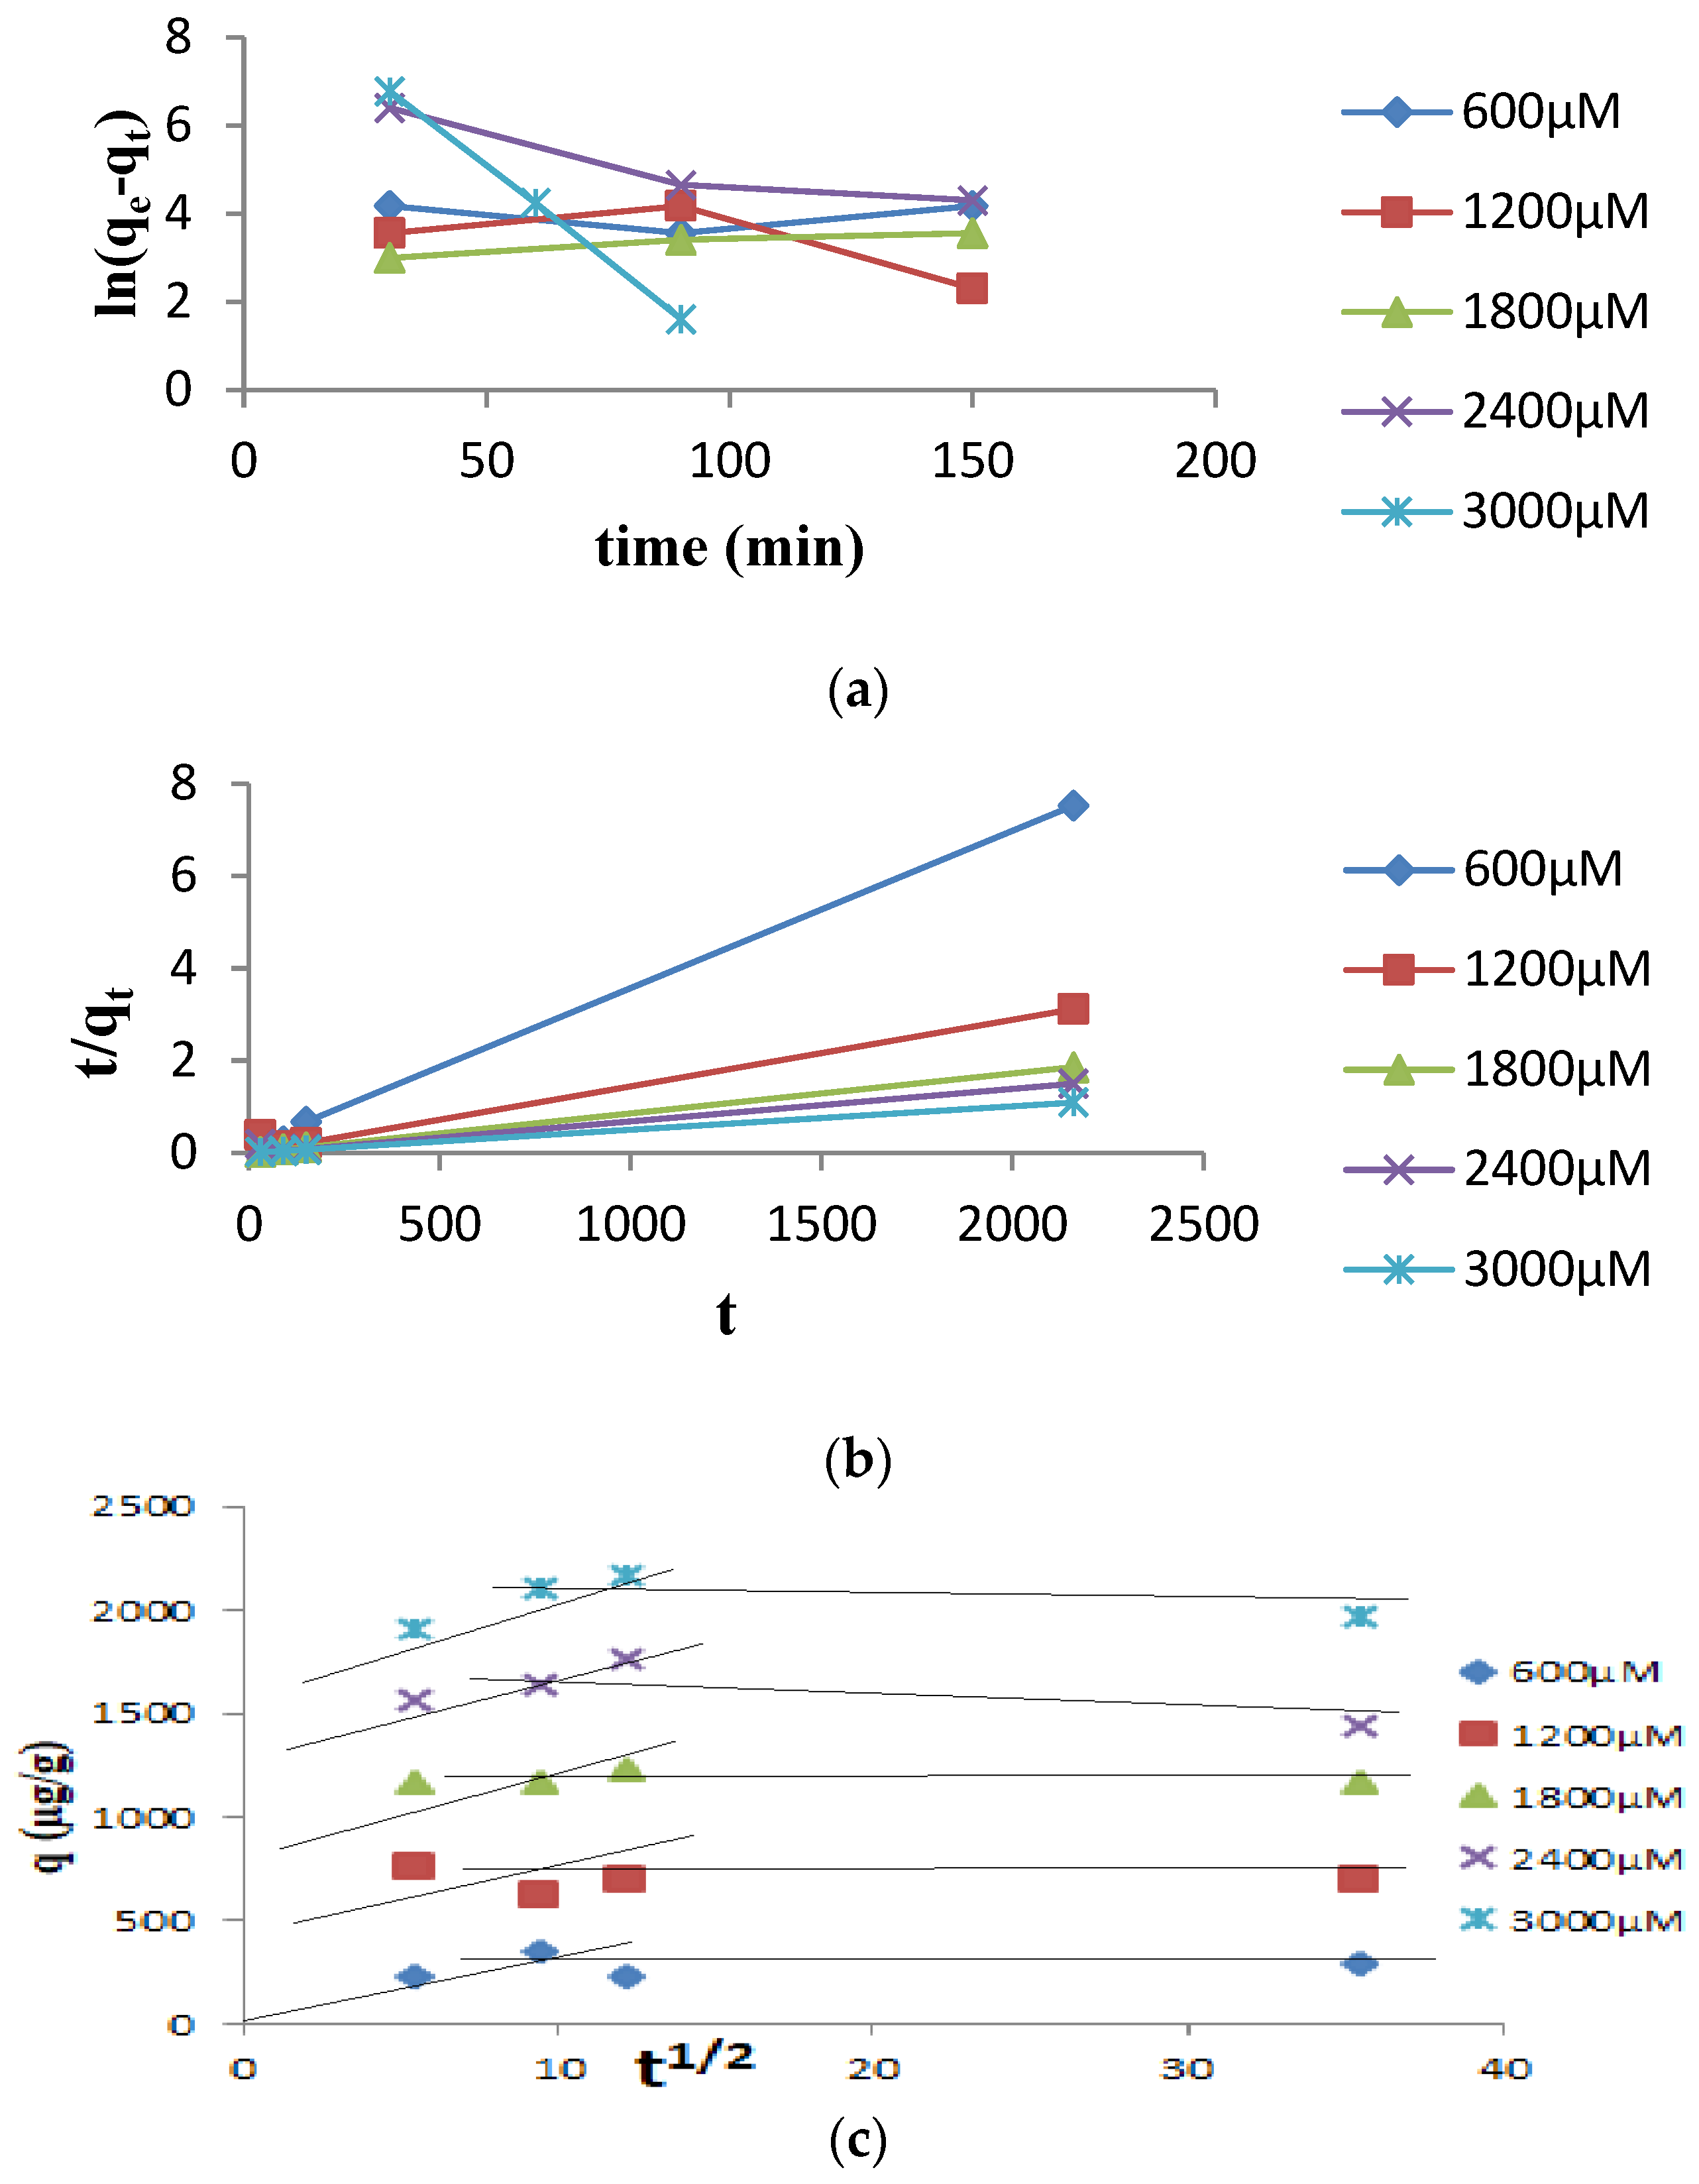
Graphs drawn for three models using experimental data are shown in Figure 6 a–c, and the calculated kinetic constants and regression coefficients are given in Table 3. In the figures and tables, it can be seen that the adsorption of U(VI) from aqueous solution onto powder nanocomposite (MFCNC) can best be described by the pseudo-second order model. Based on this fit, it can be concluded that there are very effective interactions such as complexation between U(VI) ions and the active sites on the MFCNC surface.
As seen in Figure 6c, the graph has two linear parts and does not pass through the origin. Thus, it can be argued that intra-particle diffusion is not the only step for speed control of the adsorption process and there may be other control mechanisms [92,93] The first and second parts of the graph can be attributed to the diffusion of UO22+ ions from solution to the outer surface of powder MFCNC through the boundary layer and the control of intra-particle diffusion, i.e., pore diffusion and adsorption on the pore surface, respectively. The lower value of the slopes of the linear parts corresponding to the rate means that the adsorption is slower [94,95]. Since the slope of the first part is higher than the slope of the second part, it can be argued that U022+ ions can be rapidly adsorbed on the outer surface through the boundary layer rather than in the voids of the nanocomposite foam, and they are only adsorbed on the inner surface of the nanocomposite network at high concentrations. The fit of the experimental data to the pseudo-second-order kinetic model also supports these explanations, because pseudo-second-order kinetics indicate the existence of strong interactions between the adsorbate and the adsorbent [96,97].

3.3. Adsorption Isotherms and the Effect of Temperature

Isotherm analysis can provide important information about the nature of the interactions between the adsorbate and the adsorbent surface in equilibrium, adsorption capacity, adsorption efficiency and effectiveness, orientation of the adsorbate on the surface, and the adsorption mechanism.
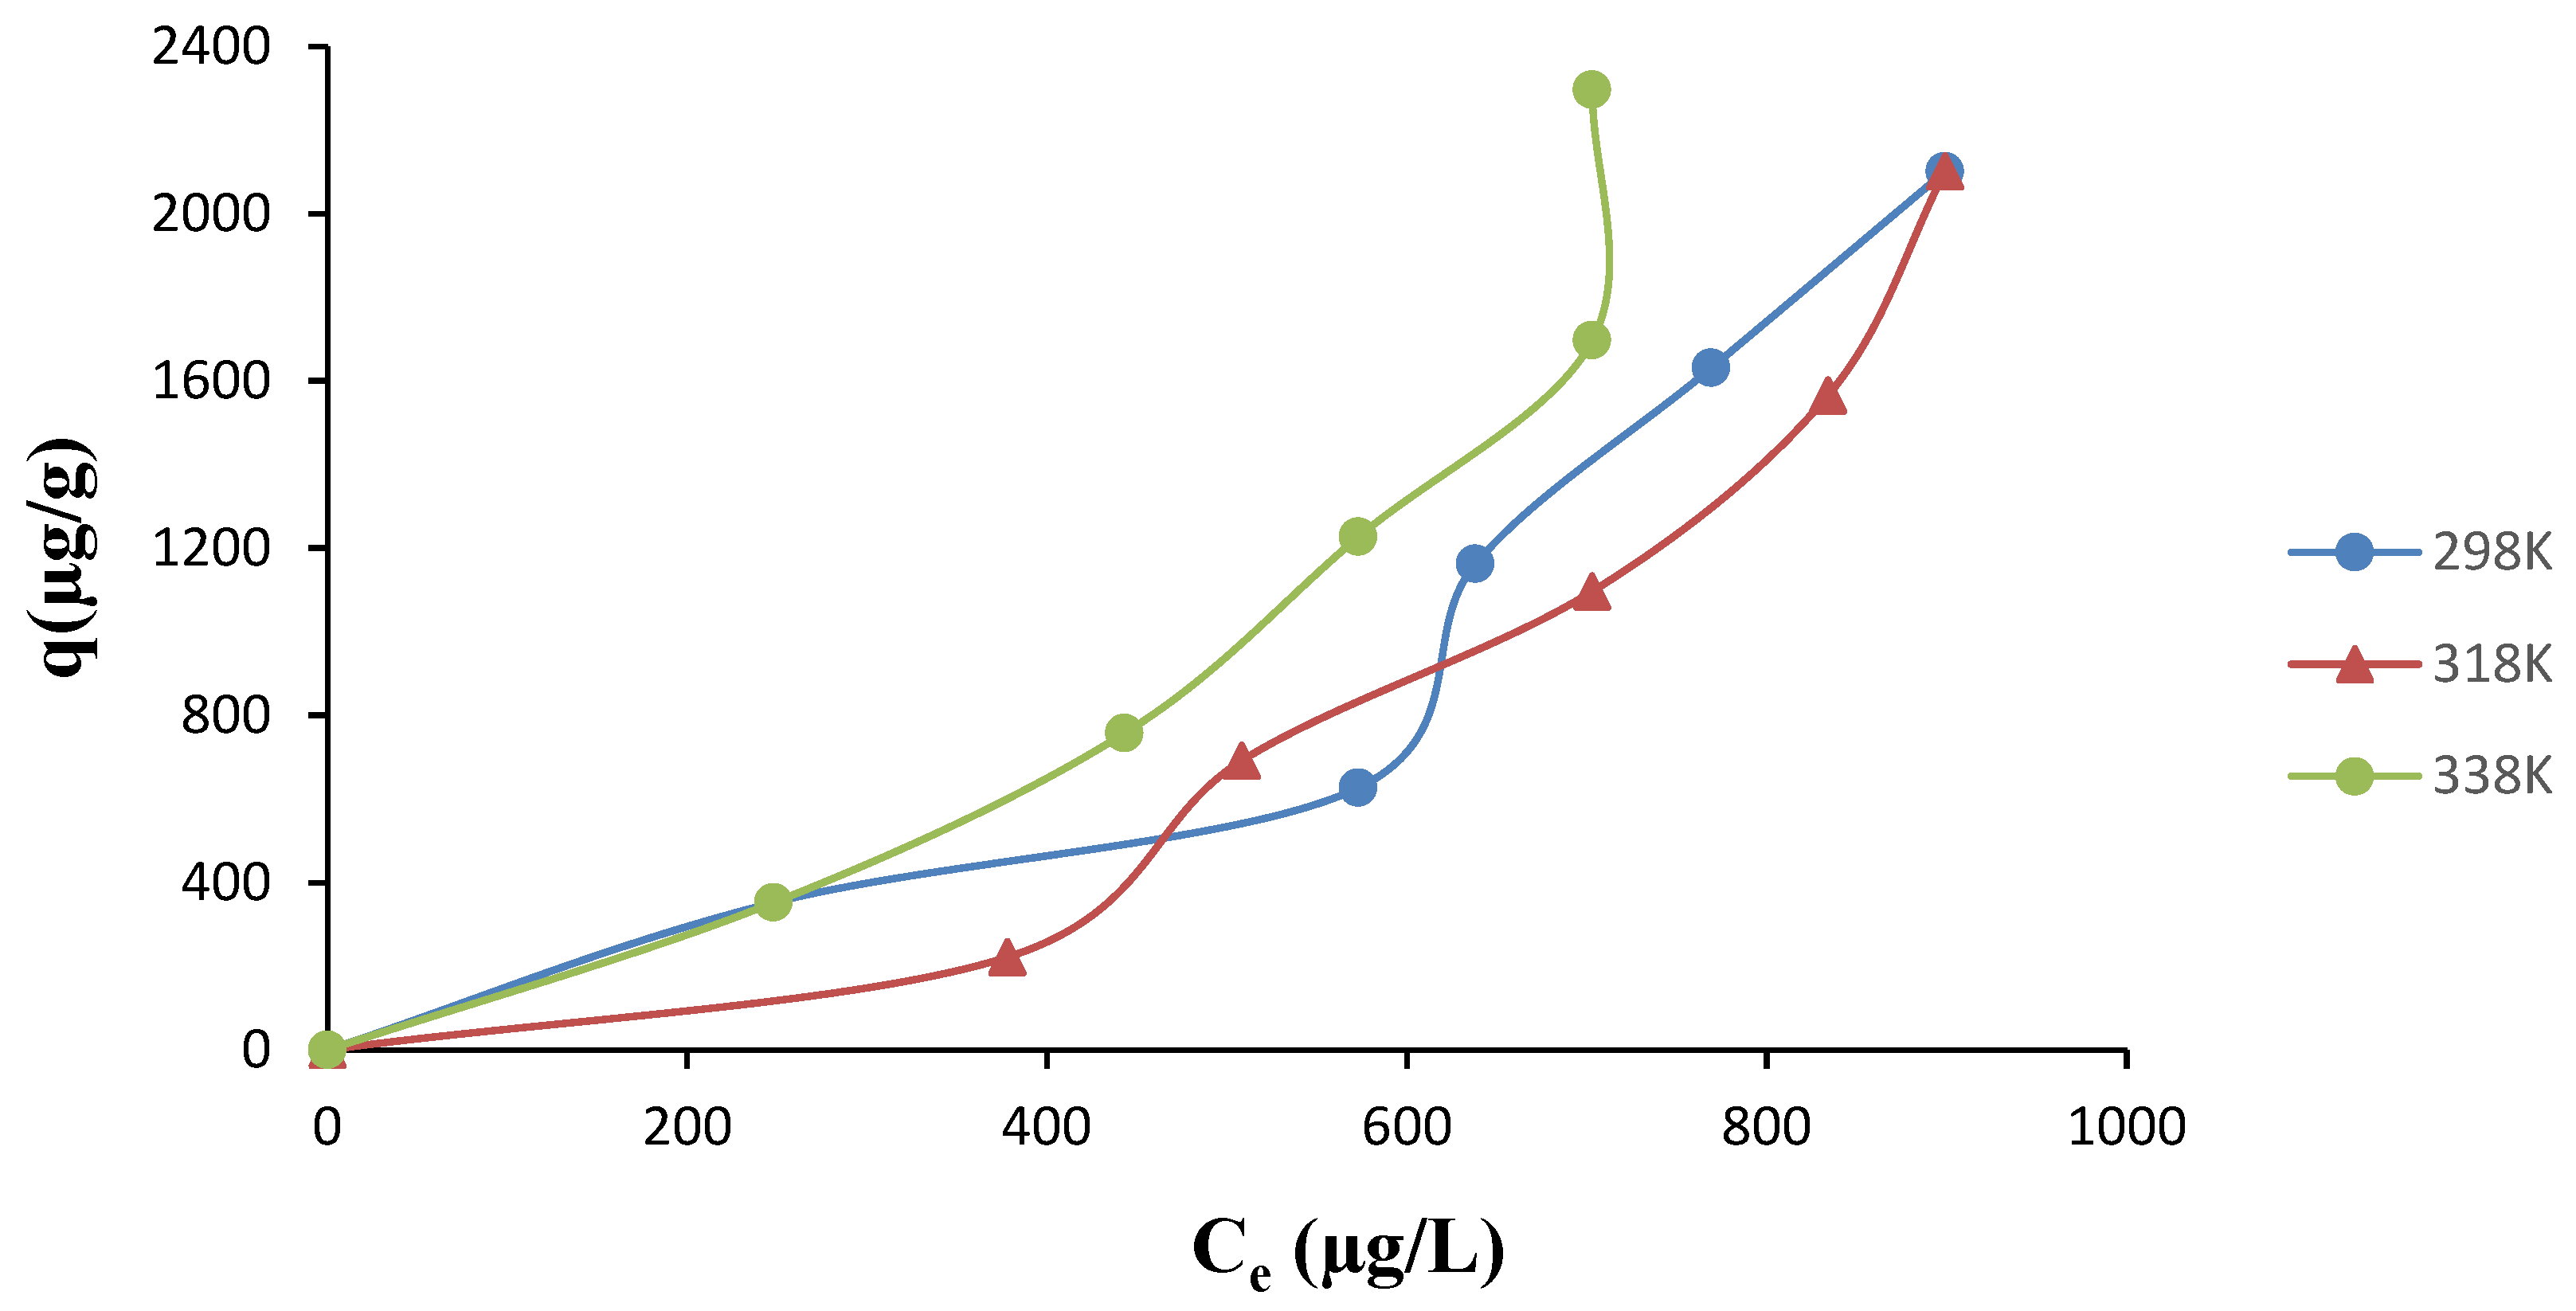
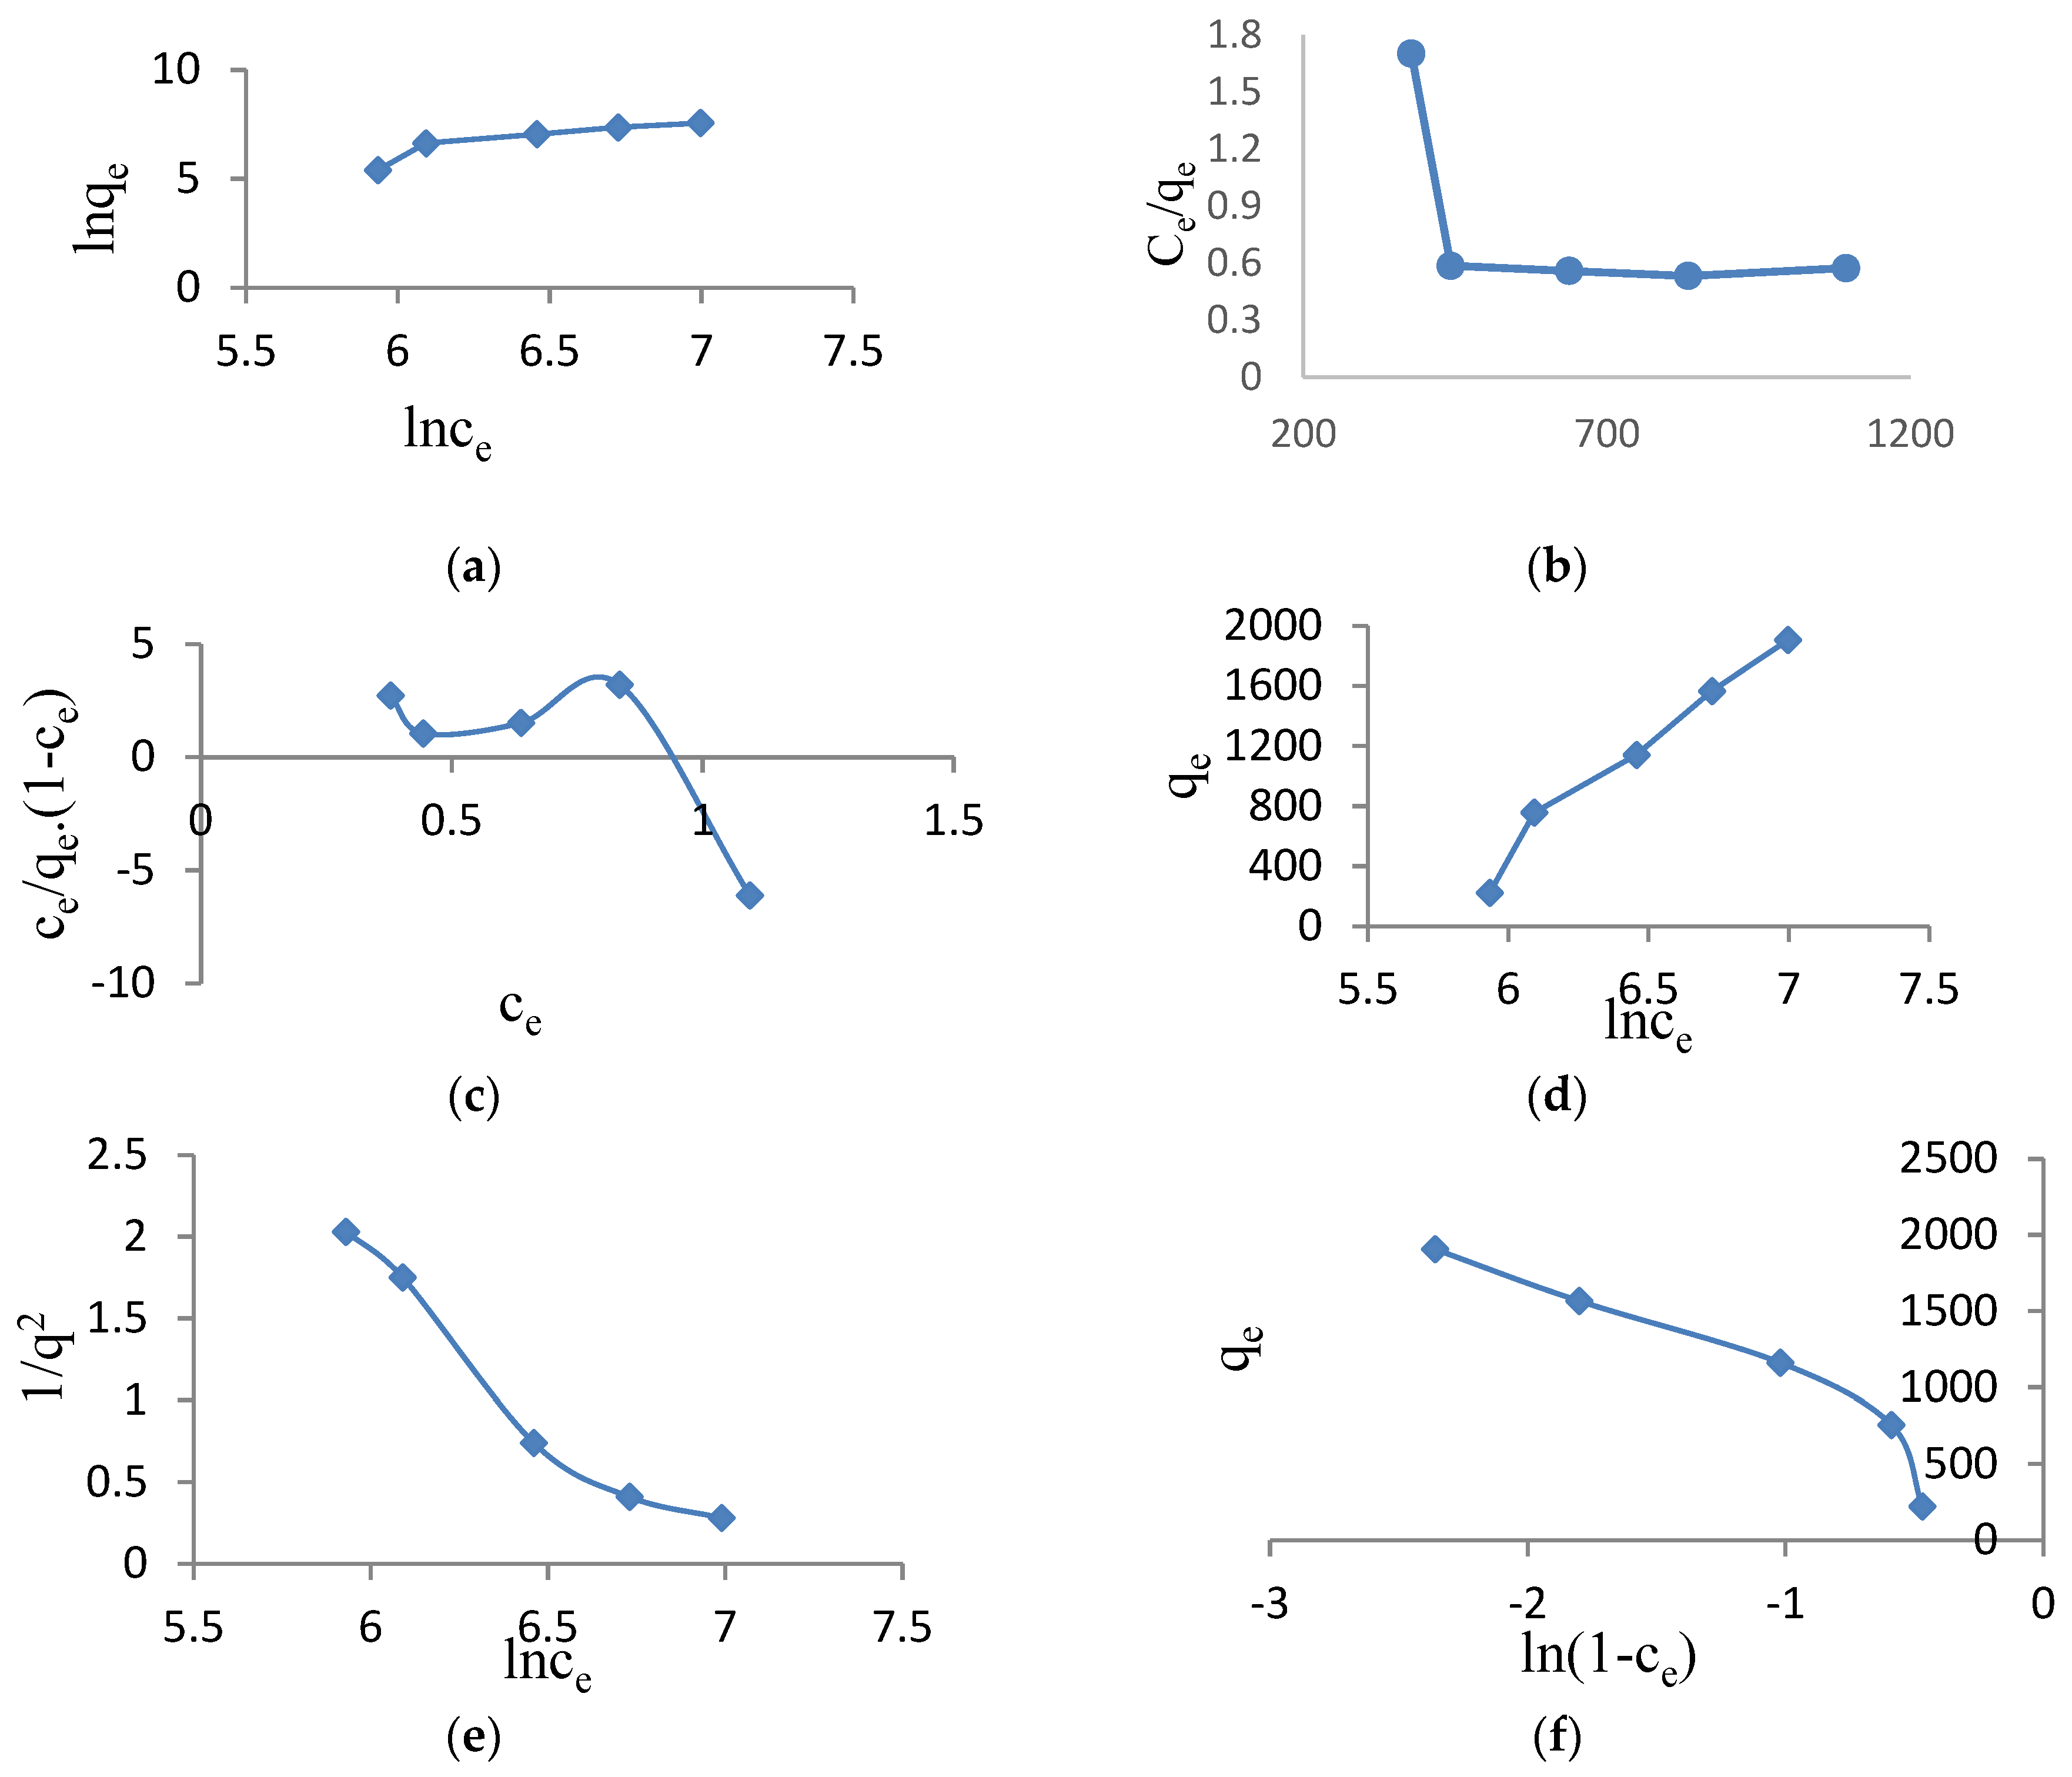
Experimental adsorption isotherms plotted for three different temperatures, 25, 45 and 65 °C, are shown in Figure 7. Additionally, in order to discuss the U(VI) adsorption on the powder MFCNC surface in detail, the compatibility of the experimental data with the Freundlich isotherm equation and Langmuir, Brunauer–Emmett–Teller, Halsey, Harkins-Jura and Smith isotherm models was also examined. The graphs drawn for these isotherm models and the Freundlich isotherm equation are shown in Figure 8. Calculated isotherm constants and regression coefficients (R2) for all isotherm models and the Freundlich isotherm equation are given in Table 4. The Freundlich isotherm equation is an empirical equation [95] and the BET adsorption isotherm model is based on multilayer adsorption assumptions. The Langmuir model assumes that there is no interaction between the adsorbed species, that the adsorption is localized, and that monolayer adsorption occurs on a homogeneous surface. The Halsey isotherm is based on the assumptions of multilayer adsorption and heterogeneity of pore size distribution. The Harkins-Jura isotherm model recognizes the possibility of multilayer adsorption on the surface of adsorbents with heterogeneous pore distribution [98]. The Smith adsorption isotherm was commonly developed to describe water adsorption on some polymeric materials such as cellophane, nylon, and cotton, and in particular sigmoid-shaped isotherms. [99]. The linear forms of all isotherm models and Freundlich equations are given in Equation 6-11.
l n q = 1 / n l n C e + l n K f
C e / q = 1 / q m K + C e / q m
C / q ( 1 C e ) = 1 / q m k + ( k 1 ) C e / q m k
q e = 1 / n H l n K H 1 / n H l n C e
1 / q 2 = ( B / A ) 1 / A l n C e
q = W b W l n 1 C e
where Ce (µM) is the equilibrium concentration, qe (mg/g) is the adsorbed amount at equilibrium, qm (mg/g) is the monolayer adsorption capacity, (1/n) and KF are Freundlich constants, K is the Langmuir constant, k is BET. parameter, n H and KH are Halsey constants, A and B are Harkins-Jura constants, and W b and W are Smith parameters [100,101].
The isotherm curve at 25oC drawn using experimental data fits the Type III isotherm type, defined by weak interactions between adsorbate and adsorbent, multilayer adsorption and adsorbent structure with heterogeneous pore size distribution. However, in the current adsorption system, there is no possibility of multilayer adsorption due to the adsorbent surface characteristics and the ionic structure of the adsorbate. For this reason, the high adsorption implying a multilayered structure, which is predicted to occur after the equilibrium adsorbate concentration reaches intermediate concentration values in Type III isotherms, can be attributed to the effective adsorption resulting from a mechanism change in the form of complexation in the MFCNC and U(VI) adsorption system. From Table 4, it can be seen that the experimental data are generally compatible with models that predict heterogeneous surface properties of multilayer adsorption, but the highest fit is obtained with the Halsey isotherm model.
It can be seen from Figure 5 that with increasing equilibrium U(VI) concentration, the adsorbed amounts increase with relatively low efficiency up to intermediate equilibrium U(VI) concentrations, with a similar trend for all three temperatures. However, interestingly, the isotherm parts at low concentrations at 25oC and 65oC overlap, and even, the isotherm part at 45oC shows a smaller slope than the others.
In the high U(VI) equilibrium concentration range, the adsorption efficiency is higher for all three temperatures and has similar behavior, but the slope of the isotherm at 65oC, i.e., the adsorption efficiency, is much higher than that at lower temperatures. The partial increase observed in adsorbed amounts with increasing temperature shows that adsorption efficiency and effectiveness are generally greatly affected by temperature and that the adsorption mechanism is directly dependent on temperature.
Thus, it can be argued that, at low U(VI) concentrations, adsorption occurs through attractive interactions resulting from the polarization of the pi electrons of the triazine rings in the polymeric matrix of the powder MFCNC by U(VI) ions. Moreover, despite the steric hindrance of the hydrocarbon chains of the organo clay platelets, the MFCNC Electrostatic attraction interactions between hydrolyzed Si-OH groups and UO22+ ions are also effective in adsorption. The observed significant increase in the adsorption efficiency and effectiveness of U(VI) at higher equilibrium U(VI) concentrations clearly indicates a possible change in the adsorption mechanism. This mechanism is probably based on complex formation between UO22+ ions and oxy and azo groups in the polymer matrix, and the adsorption is more sensitive to U(VI) concentration.

3.4. Adsorption Thermodynamics

In order to study the nature and thermodynamics of U(VI) adsorption on powder MFCNC,
two separate isosteric standard adsorption enthalpy (ΔH°) and entropy (ΔS°) were calculated for the adsorbed amounts corresponding to the first and second plateau formation on the isotherm curves at 25 and 65oC. For this, the calculation was made by taking into account the equilibrium U(VI) concentrations at two different temperatures corresponding to constant adsorption such as plateau formation (Equations 12 and 13).
d l n C e / d ( 1 / T ) = H ° a d s / R
d l n C e / d l n T = S ° a d s / R
where Ce is the equilibrium concentration (mM), R is the gas constant (8.3214J/Kmol), and T is the absolute temperature (K).
Isosteric adsorption enthalpy, ΔH°ads and isosteric adsorption entropy ΔS°ads were found from the slopes of the ln Ce vs 1/T and ln Ce vs ln T curves, respectively, and the obtained values are given in Table 5 together with the distribution coefficients (D).
Table 5 shows that the isosteric enthalpy and entropy changes roughly corresponding to the first and second plateau formation are 3.65 and -51.02 kJ mol-1 and 11.77 and -167.28 J mol-1 K-1, respectively. The very small and positive enthalpy change and the very small and positive entropy change corresponding to the formation of the first plateau indicate that the adsorption is endothermic in nature and the mechanism based on the polarization of pi electrons is dominant in the adsorption, and therefore the binding will produce disorder. On the other hand, the relatively high and negative enthalpy and the relatively high and negative entropy change corresponding to the formation of the second plateau may indicate that the adsorption is dominated by the complex formation mechanism, implying a stronger interaction between UO22+ ions and oxy groups, and thus the formation of a more ordered structure. In addition, the large degrees of distribution coefficients also support these evaluations.
3.5. pH effect
Solid surfaces, which can have highly charged groups in aqueous suspensions, are particularly sensitive to environmental conditions such as pH, ionic strength, and temperature. This often causes marked changes in the adsorption of ionic substances onto charged solid adsorbents.
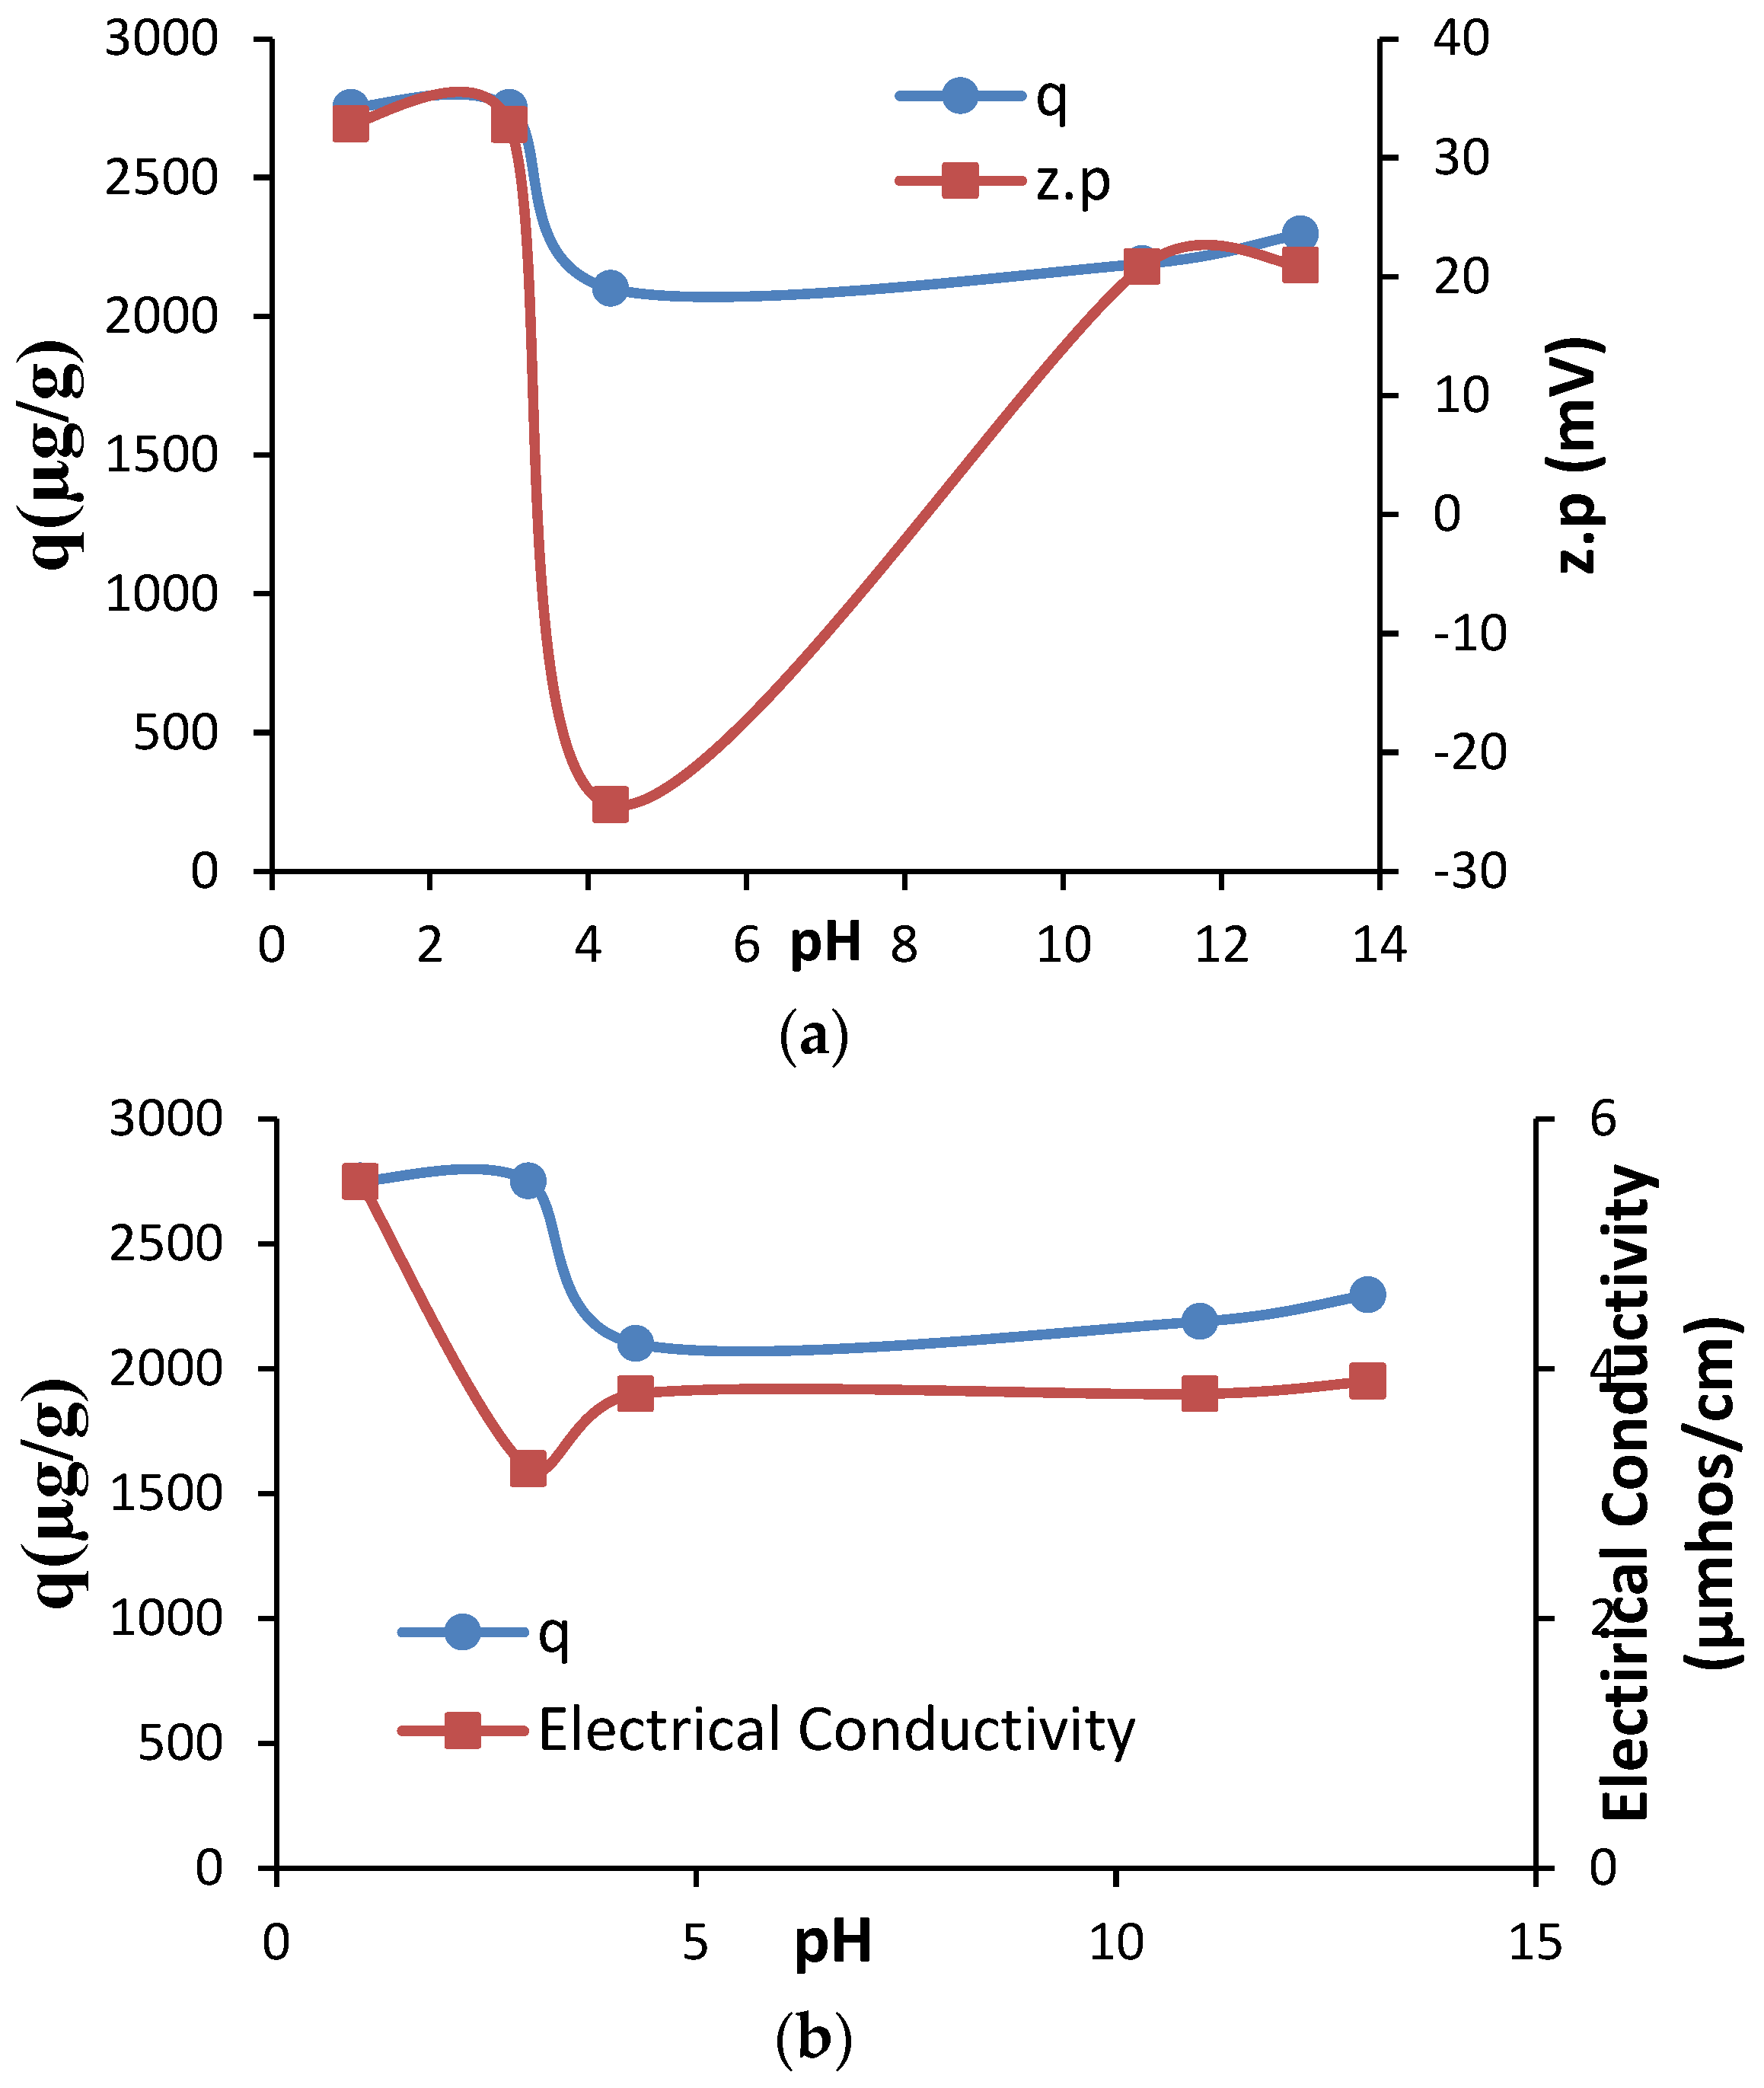
The change of adsorbed amount and zeta potential values and adsorbed amount and electrical conductivity values with initial pH are shown in Figure 9 a,b.
As the pH of the aqueous phase increases, the solid surface generally becomes more positive or less negative due to proton adsorption from solution to charged sites. From these graphs, it can be seen that the adsorption of positive UO22+ ions increases at low pHs, and the zeta potential values take on higher positive values in parallel, and the electrical conductivity values decrease due to the increased ionic species adsorption.
From these figures, it can be seen that at natural pH 4.3, adsorption and zeta potential values decreased, but electrical conductivity values partially increased, due to the increase in the concentration of hydrolysis products of uranium ions in the form of UO2(OH)+ and UO2(OH)2 in the suspension. On the other hand, it was observed that at very high pHs, due to the dominance of the UO2(OH)2 hydrolysis product and the removal of ionic species from the suspension by precipitation on the polymer surface, the adsorbed amount increased relatively and the zeta potential and electrical conductivity values tended to decrease and remain constant.

3.6. Effect of Adsorbent Dose

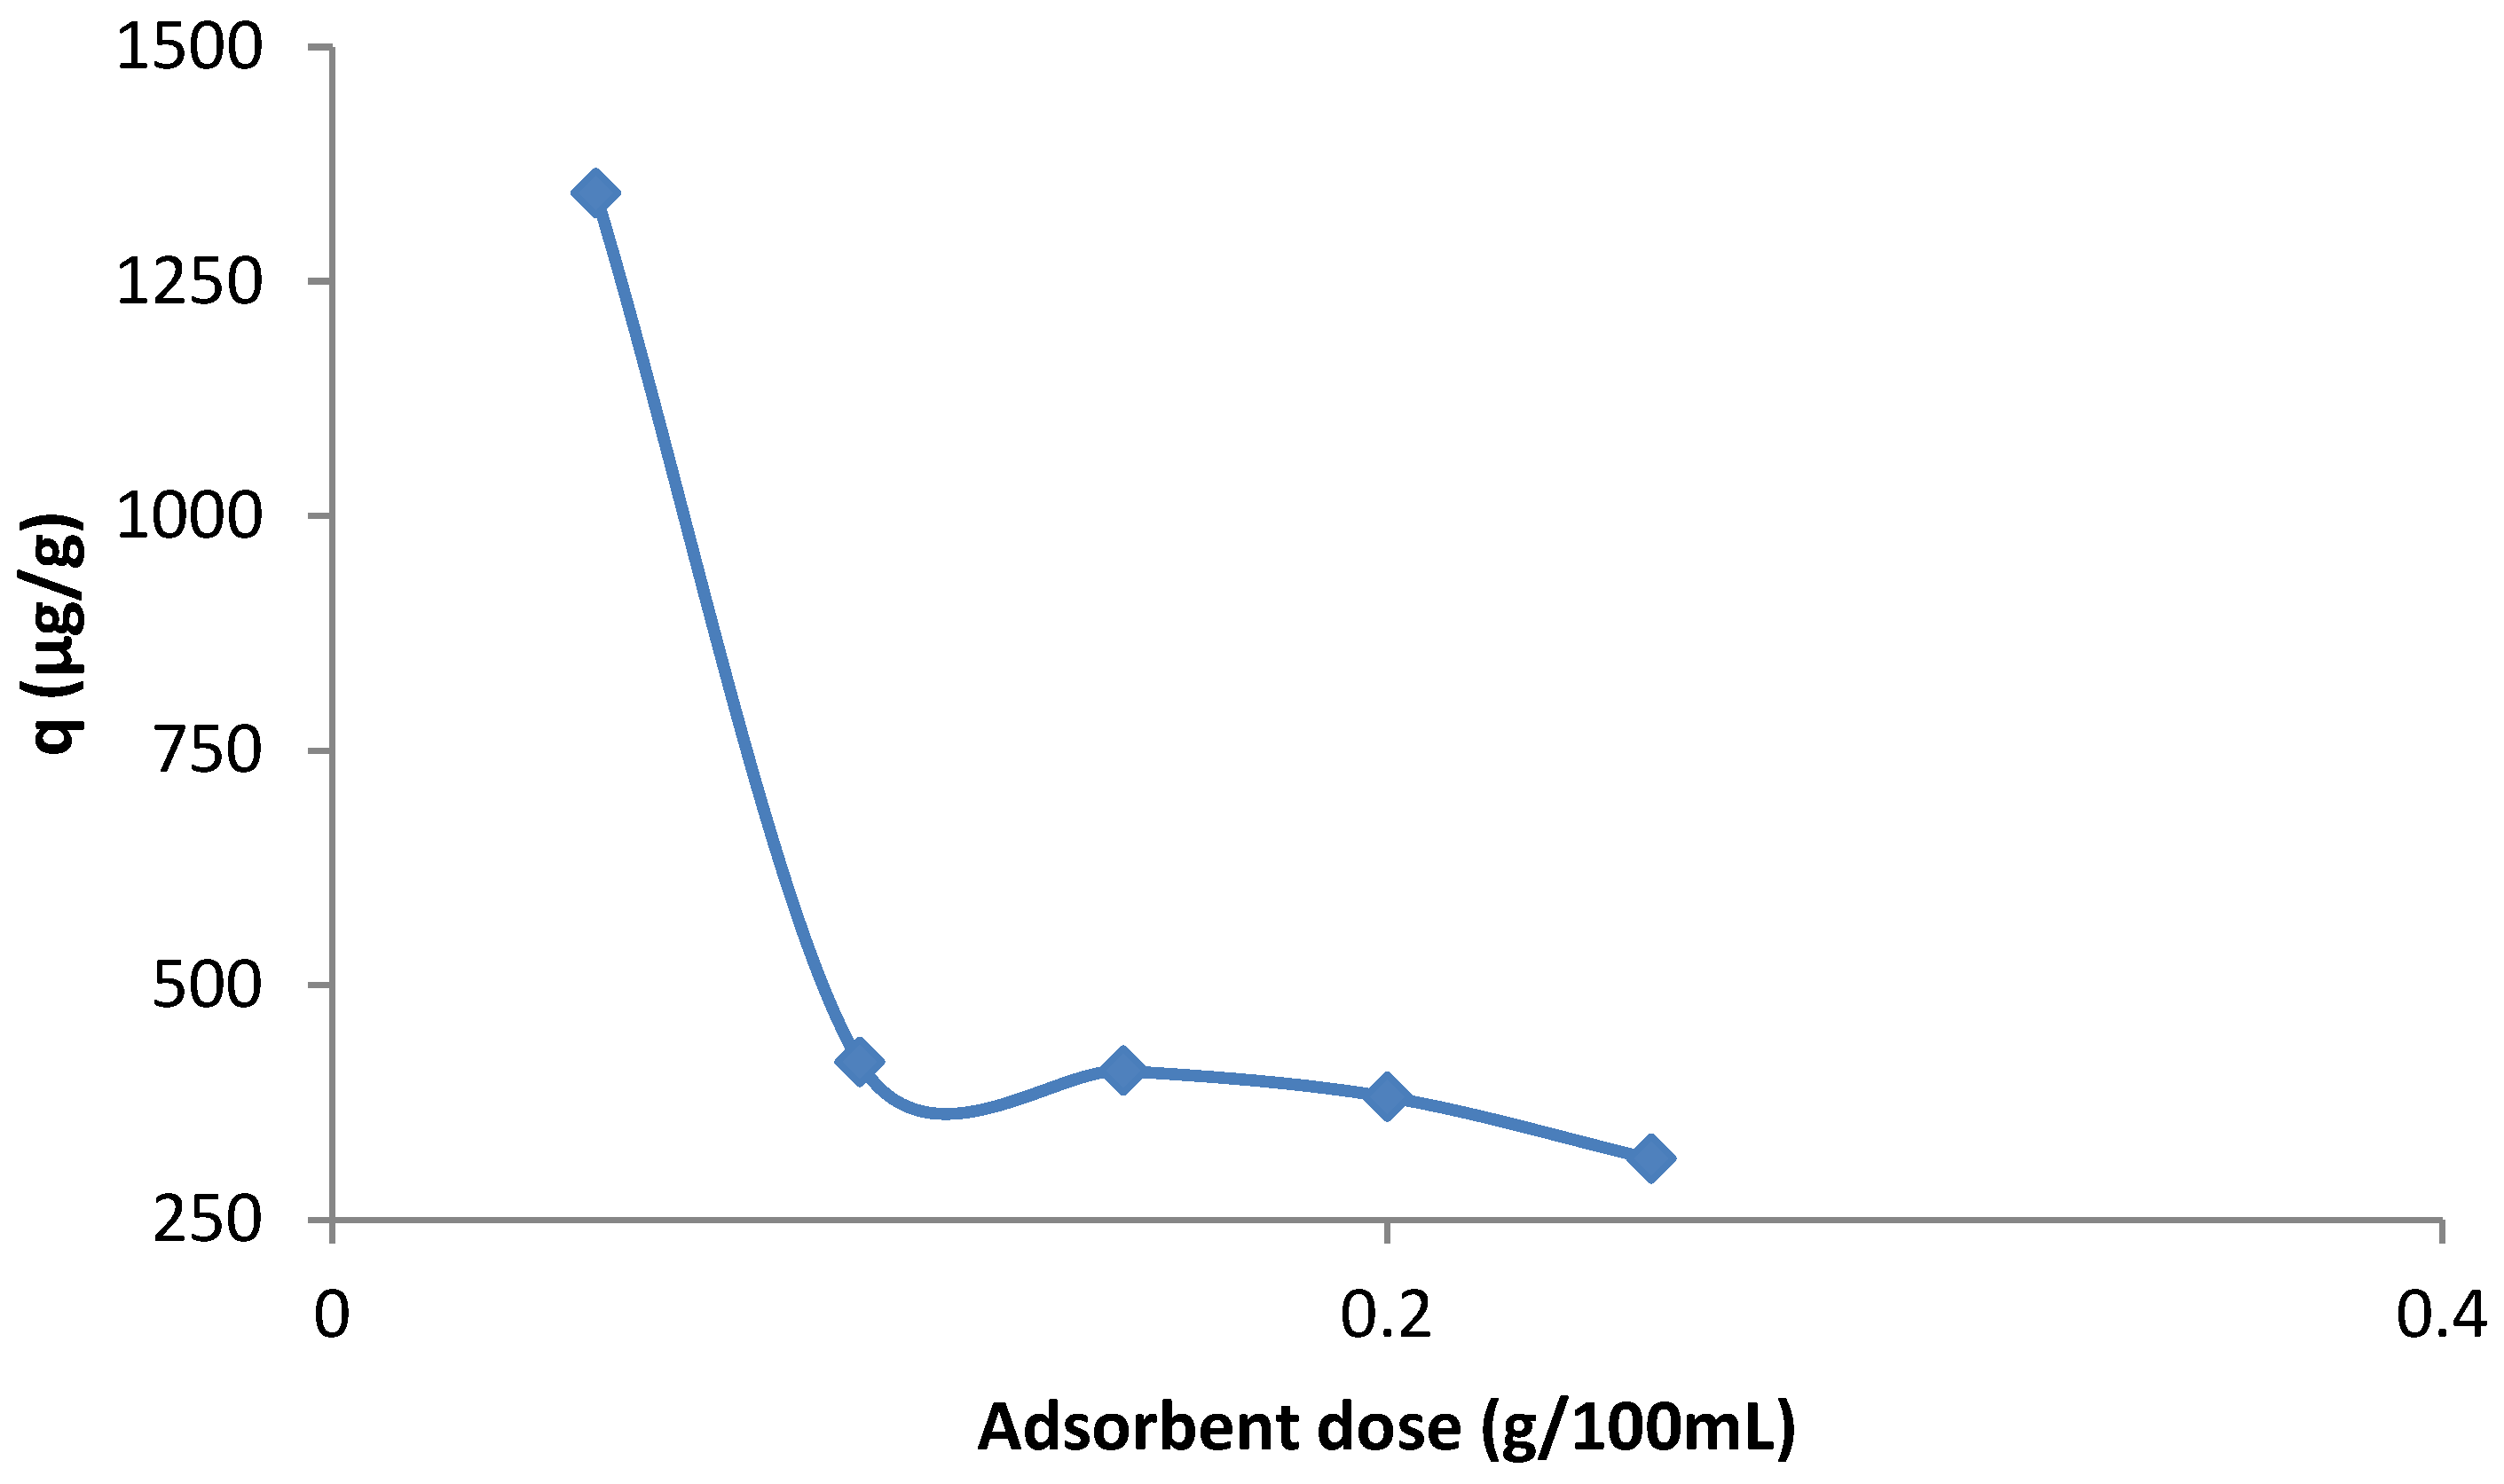
Adsorbent dosage or solid/liquid ratio is an important factor in determining the sorbent-sorbate balance of the system for adsorption and thus the optimal amount of adsorbent. In order to examine the effect of adsorbent dosage on U(VI) adsorption, experiments were carried out at solid/liquid ratios of 0.05, 0.10, 0.15, 0.20 and 0.25g/100 mL, and the results are shown graphically in Figure 10.
From Figure 10, it can be seen that with increasing adsorbent dosage, the adsorbed amount first decreases at a high ratio and then continues to decrease, although the decrease ratio becomes smaller This is normally surprising because increasing the amount of adsorbent increases the number of active sites. Therefore, it can be said that this decreasing trend is due to the fact that the adsorbed amount per unit mass does not change proportionally with the increase in the adsorbent dosage. In other words, at low adsorbent amounts, a very small number is divided by the adsorbed amount, which cannot grow in proportion to the adsorbent amount, that is, by a not very large number, which means that the ratio will gradually decrease. However, from this figure it can be concluded that the increase in the amount of adsorbent is not very decisive in terms of U(VI) adsorption and the selected solid/liquid ratio is an optimal value.

4. Conclusions

This study focuses on the preparation of a novel polymer nanocomposite material/adsorbent for the removal of U (VI) ions by adsorption from aqueous solutions and the examination of process parameters such as initial adsorbate concentration, temperature, contact time, initial pH and adsorbent dosage.
The results on adsorption kinetics showed that a short period of 30 min was sufficient to reach adsorption equilibrium and the data showed a high fit to the pseudo-second-order kinetic model. Adsorption Isotherm analysis revealed high fit of the data to the Type III isotherm and the Halsey model. Based on this compatibility, an adsorption mechanism involving two regions (electrostatic and complex formation) is proposed for the U(VI)/MFCNC nanocomposite adsorption system. In this context, in thermodynamic analyses, adsorption isosteric enthalpy and entropy values were calculated separately for the first and second regions. Thus, enthalpy and entropy changes of different magnitudes and signs, such as 3.65 and -51.02kJ/mol and 1.77 and -167.28J/Kmol, were obtained. Experimental results showed that lower pHs were more favorable in terms of adsorption efficiency and an adsorption dosage of 0.1g/100mL was also suitable for effective adsorption.
In conclusion, it can be claimed that the prepared nanocomposite foam adsorbent is an effective and potential alternative for the effective removal of U(VI) from aqueous solutions.

Author Contributions

Conceptualization, A.G.; Investigation, A.G.A.S.D.Y. and E.Ş; Writing—original draft, A.G and E.Ş. All authors have read and agreed to the published version of the manuscript.

Funding

This research received no external funding.

Data Availability Statement

Not applicable.

Acknowledgments

The authors would like to thank Atatürk University, Scientific Research Project Support Unit (BAP).

Conflicts of Interest

The authors declare that they have no conflict of interest.

References

  1. Bhalara, P.D.; Punetha, D.; Balasubramanian, K. A review of potential remediation techniques for uranium (VI) ion retrieval from contaminated aqueous environment. Journal of Environmental Chemical Engineering 2014, 2, 1621–1634. [Google Scholar] [CrossRef]
  2. Benedict, M., Pigford, T. H., & Levi, H. W. (1981). Nuclear chemical engineering (Vol. 2). New York: McGraw-Hill.
  3. Burns, P.C.; Finch, R.J. Wyartite: crystallographic evidence for the first pentavalent-uranium mineral. American Mineralogist 1999, 84, 1456–1460. [Google Scholar] [CrossRef]
  4. Dinis MD, L.; Fiúza, A. Mitigation of uranium mining impacts—a review on groundwater remediation technologies. Geosciences 2021, 11, 250. [Google Scholar] [CrossRef]
  5. Sellin, P.; Leupin, O.X. The use of clay as an engineered barrier in radioactive-waste management–a review. Clays and Clay Minerals 2013, 61, 477–498. [Google Scholar] [CrossRef]
  6. Schnurr, A.; Marsac, R.; Rabung, T.; Lützenkirchen, J.; Geckeis, H. Sorption of Cm (III) and Eu (III) onto clay minerals under saline conditions: Batch adsorption, laser-fluorescence spectroscopy and modeling. Geochimica et Cosmochimica Acta 2015, 151, 192–202. [Google Scholar] [CrossRef]
  7. Bradbury, M.H.; Baeyens, B. Sorption modelling on illite. Part II: Actinide sorption and linear free energy relationships. Geochimica et Cosmochimica Acta 2009, 73, 1004–1013. [Google Scholar] [CrossRef]
  8. Abney, C.W.; Mayes, R.T.; Saito, T.; Dai, S. Materials for the recovery of uranium from seawater. Chemical reviews 2017, 117, 13935–14013. [Google Scholar] [CrossRef]
  9. Tsang, C.F.; Bernier, F.; Davies, C. Geohydromechanical processes in the Excavation Damaged Zone in crystalline rock, rock salt, and indurated and plastic clays—in the context of radioactive waste disposal. International Journal of Rock Mechanics and Mining Sciences 2005, 42, 109–125. [Google Scholar] [CrossRef]
  10. Johnson, D.; Leake, J.R.; Read, D.J. Transfer of recent photosynthate into mycorrhizal mycelium of an upland grassland: short-term respiratory losses and accumulation of 14C. Soil Biology and Biochemistry 2002, 34, 1521–1524. [Google Scholar] [CrossRef]
  11. Joseph, C.; Van Loon, L.R.; Jakob, A.; Steudtner, R.; Schmeide, K.; Sachs, S.; Bernhard, G. Diffusion of U (VI) in Opalinus Clay: Influence of temperature and humic acid. Geochimica et Cosmochimica Acta 2013, 109, 74–89. [Google Scholar] [CrossRef]
  12. Keith, L. S., & Faroon, O. M. (2022). Uranium. In Handbook on the Toxicology of Metals (pp. 885-936). Academic Press. [CrossRef]
  13. Fernandes, M.M.; Baeyens, B.; Dähn, R.; Scheinost, A.C.; Bradbury, M.H. U (VI) sorption on montmorillonite in the absence and presence of carbonate: a macroscopic and microscopic study. Geochimica et Cosmochimica Acta 2012, 93, 262–277. [Google Scholar] [CrossRef]
  14. Belloni, F.; Kütahyali, C.; Rondinella, V.V.; Carbol, P.; Wiss, T.; Mangione, A. Can carbon nanotubes play a role in the field of nuclear waste management. Environ. Sci. Technol. 2009, 43, 1250–1255. [Google Scholar] [CrossRef]
  15. Lian, P.; Zhu, X.; Liang, S.; Li, Z.; Yang, W.; Wang, H. Large reversible capacity of high quality graphene sheets as an anode material for lithium-ion batteries. Electrochimica Acta 2010, 55, 3909–3914. [Google Scholar] [CrossRef]
  16. Chen, S.; Hong, J.; Yang, H.; Yang, J. Adsorption of uranium (VI) from aqueous solution using a novel graphene oxide-activated carbon felt composite. Journal of Environmental Radioactivity 2013, 126, 253–258. [Google Scholar] [CrossRef]
  17. Ibrahim WA, W.; Nodeh, H.R.; Sanagi, M.M. Graphene-based materials as solid phase extraction sorbent for trace metal ions, organic compounds, and biological sample preparation. Critical reviews in analytical chemistry 2016, 46, 267–283. [Google Scholar] [CrossRef] [PubMed]
  18. Mishra, R.K.; Chianella, I.; Goel, S.; Nezhad, H.Y. (2022). Exploring the Nexus Between Structure, Properties and Applications in Graphene Conductors. Biomaterials and Polymers Horizon (2022) 1(4).
  19. Wang, Y.; Gu, Z.; Yang, J.; Liao, J.; Yang, Y.; Liu, N.; Tang, J. Amidoxime-grafted multiwalled carbon nanotubes by plasma techniques for efficient removal of uranium (VI). Applied surface science 2014, 320, 10–20. [Google Scholar] [CrossRef]
  20. Xue, J.H.; Zhang, H.; Ding, D.X.; Hu, N.; Wang, Y.D.; Wang, Y.S. Linear β-cyclodextrin polymer functionalized multiwalled carbon nanotubes as nanoadsorbent for highly effective removal of U (VI) from aqueous solution based on inner-sphere surface complexation. Industrial & Engineering Chemistry Research 2019, 58, 4074–4083. [Google Scholar] [CrossRef]
  21. Wang, Y.; Gu, Z.; Yang, J.; Liao, J.; Yang, Y.; Liu, N.; Tang, J. Amidoxime-grafted multiwalled carbon nanotubes by plasma techniques for efficient removal of uranium (VI). Applied surface science 2014, 320, 10–20. [Google Scholar] [CrossRef]
  22. Shaw, S.; Neill, T.S.; Bryan, N.; Sherriff, N.; Natrajan, L.S.; Wilson, H.; Lopez-Odriozola, L.; Rigby, B.; Haigh, S.J.; Zou, Y.-C.; Harrison, R.; Morris, K. Hydrotalcite Colloidal Stability and Interactions with Uranium (VI) at Neutral to Alkaline pH. Langmuir 2022, 38, 2576–2589. [Google Scholar] [CrossRef]
  23. Sadeghi, M.; Amiri, M.; Roshanfarzad, P.; Avila, M.; Tenreiro, C. Radiochemical studies relevant to the no-carrier-added production of 61, 64Cu at a cyclotron. Radiochimica Acta 2008, 96, 399–402. [Google Scholar] [CrossRef]
  24. Metwally, E.; Saleh, A.S.; El-Naggar, H.A. Extraction and separation of uranium (VI) and thorium (IV) using tri-n-dodecylamine impregnated resins. Journal of Nuclear and Radiochemical Sciences 2005, 6, 119–126. [Google Scholar] [CrossRef] [PubMed]
  25. Sh, S.A.; El-Naggar, H. A. Extraction and Separation of Uranium (VI) and Thorium (IV) Using Tri-n-dodecylamine Impregnated Resins. Journal of nuclear and radiochemical sciences 2005, 6, 119–126. [Google Scholar] [CrossRef]
  26. Zhang, X.; Gu, P.; Liu, Y. Decontamination of radioactive wastewater: State of the art and challenges forward. Chemosphere 2019, 215, 543–553. [Google Scholar] [CrossRef]
  27. Peng, H.; Guo, J. Removal of chromium from wastewater by membrane filtration, chemical precipitation, ion exchange, adsorption electrocoagulation, electrochemical reduction, electrodialysis, electrodeionization, photocatalysis and nanotechnology: a review. Environmental Chemistry Letters 2020, 18, 2055–2068. [Google Scholar] [CrossRef]
  28. Aly, M.M.; Hamza, M.F. A review: studies on uranium removal using different techniques. Overview. Journal of dispersion science and technology 2013, 34, 182–213. [Google Scholar] [CrossRef]
  29. Fomina, M.; Gadd, G.M. Biosorption: current perspectives on concept, definition and application. Bioresource technology 2014, 160, 3–14. [Google Scholar] [CrossRef] [PubMed]
  30. Michard, P.; Guibal, E.; Vincent, T.; Le Cloirec, P. Sorption and desorption of uranyl ions by silica gel: pH, particle size and porosity effects. Microporous materials 1996, 5, 309–324. [Google Scholar] [CrossRef]
  31. Tsuruta, S.; Teter, M.A.; Takatsuka, T.; Tatsumi, T.; Tamagaki, R. Confronting neutron star cooling theories with new observations. The Astrophysical Journal 2002, 571, L143. [Google Scholar] [CrossRef]
  32. Mirjalili, K.; Roshani, M. Resin-in-pulp method for uranium recovery from leached pulp of low grade uranium ore. Hydrometallurgy 2007, 85, 103–109. [Google Scholar] [CrossRef]
  33. Singh, B.; Sharma, D.K.; Kumar, R.; Gupta, A. Controlled release of the fungicide thiram from starch–alginate–clay based formulation. Applied Clay Science 2009, 45, 76–82. [Google Scholar] [CrossRef]
  34. Nakajima, A.; Sakaguchi, T. Recovery of uranium from uranium refining waste water by using immobilized persimmon tannin. Journal of radioanalytical and nuclear chemistry 1999, 242, 623–626. [Google Scholar] [CrossRef]
  35. Kilislioglu, A.; Bilgin, B. Adsorption of uranium on halloysite. Radiochimica Acta 2002, 90, 155–160. [Google Scholar] [CrossRef]
  36. Atun, G.; Kilislioglu, A. The adsorption behavior of natural sand in contact with uranium contaminated seawater. Journal of Environmental Science and Health, Part A 2002, 37, 1295–1305. [Google Scholar] [CrossRef] [PubMed]
  37. Merdivan, M.; Düz, M.Z.; Hamamci, C. Sorption behaviour of uranium (VI) with N, N-dibutyl-N′-benzoylthiourea impregnated in Amberlite XAD-16. Talanta 2001, 55, 639–645. [Google Scholar] [CrossRef] [PubMed]
  38. Ghasemi, J.B.; Zolfonoun, E. Simultaneous spectrophotometric determination of trace amounts of uranium, thorium, and zirconium using the partial least squares method after their preconcentration by α-benzoin oxime modified Amberlite XAD-2000 resin. Talanta 2010, 80, 1191–1197. [Google Scholar] [CrossRef] [PubMed]
  39. Metilda, P.; Sanghamitra, K.; Gladis, J.M.; Naidu GR, K.; Rao, T.P. Amberlite XAD-4 functionalized with succinic acid for the solid phase extractive preconcentration and separation of uranium (VI). Talanta 2005, 65, 192–200. [Google Scholar] [CrossRef] [PubMed]
  40. Karve, M.; Rajgor, R.V. Amberlite XAD-2 impregnated organophosphinic acid extractant for separation of uranium (VI) from rare earth elements. Desalination 2008, 232, 191–197. [Google Scholar] [CrossRef]
  41. Qadeer, R.; Hanif, J. Adsorption of dysprosium ions on activated charcoal from aqueous solutions. Carbon 1995, 33, 215–220. [Google Scholar] [CrossRef]
  42. Rahmati, A.; Ghaemi, A.; Samadfam, M. Kinetic and thermodynamic studies of uranium (VI) adsorption using Amberlite IRA-910 resin. Annals of Nuclear Energy 2012, 39, 42–48. [Google Scholar] [CrossRef]
  43. Zhang, Z.; Clifford, D.A. Exhausting and regenerating resin for uranium removal. Journal-American Water Works Association 1994, 86, 228–241. [Google Scholar] [CrossRef]
  44. Ahn, K.H.; Song, K.G. Treatment of domestic wastewater using microfiltration for reuse of wastewater. Desalination 1999, 126, 7–14. [Google Scholar] [CrossRef]
  45. Huikuri, P.; Salonen, L. Removal of uranium from Finnish groundwaters in domestic use with a strong base anion resin. Journal of Radioanalytical and Nuclear chemistry 2000, 245, 385–393. [Google Scholar] [CrossRef]
  46. Chellam, S.; Clifford, D.A. Physical–chemical treatment of groundwater contaminated by leachate from surface disposal of uranium tailings. Journal of Environmental Engineering 2002, 128, 942–952. [Google Scholar] [CrossRef]
  47. Ladeira, A.C.Q.; Morais, C.A.D. Uranium recovery from industrial effluent by ion exchange—column experiments. Minerals engineering 2005, 18, 1337–1340. [Google Scholar] [CrossRef]
  48. Semnani, F.; Asadi, Z.; Samadfam, M.; Sepehrian, H. Uranium (VI) sorption behavior onto amberlite CG-400 anion exchange resin: effects of pH, contact time, temperature and presence of phosphate. Annals of nuclear energy 2012, 48, 21–24. [Google Scholar] [CrossRef]
  49. Kütahyalı, C.; Eral, M. Sorption studies of uranium and thorium on activated carbon prepared from olive stones: kinetic and thermodynamic aspects. Journal of Nuclear Materials 2010, 396, 251–256. [Google Scholar] [CrossRef]
  50. Akperov, E.O.; Maharramov, A.M.; Akperov, O.G. Uranyl ion adsorption using novel cross-linked maleic anhydride–allyl propionate–styrene terpolymer. Hydrometallurgy 2009, 100, 76–81. [Google Scholar] [CrossRef]
  51. Korichi, S.; Bensmaili, A. Sorption of uranium (VI) on homoionic sodium smectite experimental study and surface complexation modeling. Journal of hazardous materials 2009, 169, 780–793. [Google Scholar] [CrossRef]
  52. Hritcu, D.; Humelnicu, D.; Dodi, G.; Popa, M.I. Magnetic chitosan composite particles: evaluation of thorium and uranyl ion adsorption from aqueous solutions. Carbohydrate Polymers 2012, 87, 1185–1191. [Google Scholar] [CrossRef]
  53. Fernandes, M.M.; Vér, N.; Baeyens, B. Predicting the uptake of Cs, Co, Ni, Eu, Th and U on argillaceous rocks using sorption models for illite. Applied Geochemistry 2015, 59, 189–199. [Google Scholar] [CrossRef]
  54. Stockmann, M.; Fritsch, K.; Bok, F.; Fernandes, M.M.; Baeyens, B.; Steudtner, R.; Schmeide, K. New insights into U (VI) sorption onto montmorillonite from batch sorption and spectroscopic studies at increased ionic strength. Science of The Total Environment 2022, 806, 150653. [Google Scholar] [CrossRef] [PubMed]
  55. Stumpf, T.; Bauer, A.; Coppin, F.; Fanghänel, T.; Kim, J.I. Inner-sphere, outer-sphere and ternary surface complexes: a TRLFS study of the sorption process of Eu (III) onto smectite and kaolinite. Radiochimica Acta 2002, 90, 345–349. [Google Scholar] [CrossRef]
  56. Geckeis, H.; Lützenkirchen, J.; Polly, R.; Rabung, T.; Schmidt, M. Mineral–water interface reactions of actinides. Chemical reviews 2013, 113, 1016–1062. [Google Scholar] [CrossRef] [PubMed]
  57. Bradbury, M.H.; Baeyens, B. Sorption of Eu on Na-and Ca-montmorillonites: Experimental investigations and modelling with cation exchange and surface complexation. Geochimica et Cosmochimica Acta 2002, 66, 2325–2334. [Google Scholar] [CrossRef]
  58. Guillaumont, R., & Mompean, F. J. (2003). Update on the chemical thermodynamics of uranium, neptunium, plutonium, americium and technetium (Vol. 5, pp. 64–70). Amsterdam: Elsevier.
  59. Zachara, J.M.; McKinley, J.P. Influence of hydrolysis on the sorption of metal cations by smectites: Importance of edge coordination reactions: Dedicated to Paul W. Schindler on his retirement. Aquatic Sciences 1993, 55, 250–261. [Google Scholar] [CrossRef]
  60. McKinley, J.P.; Zachara, J.M.; Smith, S.C.; Turner, G.D. The influence of uranyl hydrolysis and multiple site-binding reactions on adsorption of U (VI) to montmorillonite. Clays and clay minerals 1995, 43, 586–598. [Google Scholar] [CrossRef]
  61. Pabalan, R.T.; Turner, D.R. Uranium (6+) sorption on montmorillonite: Experimental and surface complexation modeling study. Aquatic Geochemistry 1996, 2, 203–226. [Google Scholar] [CrossRef]
  62. Kowal-Fouchard, A.; Drot, R.; Simoni, E.; Ehrhardt, J.J. Use of spectroscopic techniques for uranium (VI)/montmorillonite interaction modeling. Environmental science & technology 2004, 38, 1399–1407. [Google Scholar] [CrossRef]
  63. Bradbury, M.H.; Baeyens, B. Experimental measurements and modeling of sorption competition on montmorillonite. Geochimica et Cosmochimica Acta 2005, 69, 4187–4197. [Google Scholar] [CrossRef]
  64. Bachmaf, S.; Planer-Friedrich, B.; Merkel, B.J. Effect of sulfate, carbonate, and phosphate on the uranium (VI) sorption behavior onto bentonite. Radiochimica Acta 2008, 96, 359–366. [Google Scholar] [CrossRef]
  65. Dent, A.J.; Ramsay, J.D.; Swanton, S.W. An EXAFS study of uranyl ion in solution and sorbed onto silica and montmorillonite clay colloids. Journal of colloid and interface science 1992, 150, 45–60. [Google Scholar] [CrossRef]
  66. Chisholm-Brause, C.; Conradson, S.D.; Buscher, C.T.; Eller, P.G.; Morris, D.E. Speciation of uranyl sorbed at multiple binding sites on montmorillonite. Geochimica et Cosmochimica Acta 1994, 58, 3625–3631. [Google Scholar] [CrossRef]
  67. Sylwester, E.R.; Hudson, E.A.; Allen, P.G. The structure of uranium (VI) sorption complexes on silica, alumina, and montmorillonite. Geochimica et Cosmochimica Acta 2000, 64, 2431–2438. [Google Scholar] [CrossRef]
  68. Catalano, J.G.; Brown, G.E., Jr. Uranyl adsorption onto montmorillonite: Evaluation of binding sites and carbonate complexation. Geochimica et Cosmochimica Acta 2005, 69, 2995–3005. [Google Scholar] [CrossRef]
  69. Joseph, L.; Jun, B.M.; Flora, J.R.; Park, C.M.; Yoon, Y. Removal of heavy metals from water sources in the developing world using low-cost materials: A review. Chemosphere 2019, 229, 142–159. [Google Scholar] [CrossRef] [PubMed]
  70. Nasrollahzadeh, M.; Sajjadi, M.; Iravani, S.; Varma, R.S. Starch, cellulose, pectin, gum, alginate, chitin and chitosan derived (nano) materials for sustainable water treatment: A review. Carbohydrate polymers 2021, 251, 116986. [Google Scholar] [CrossRef]
  71. Sanchez-Salvador, J.L.; Balea, A.; Monte, M.C.; Negro, C.; Blanco, A. Chitosan grafted/cross-linked with biodegradable polymers: A review. International Journal of Biological Macromolecules 2021, 178, 325–343. [Google Scholar] [CrossRef] [PubMed]
  72. Singh, P. P. (2021). Natural polymer-based hydrogels for adsorption applications. In Natural polymers-based green adsorbents for water treatment (pp. 267-306). Elsevier. [CrossRef]
  73. Baraka, A. (2006). Removal of heavy metals from aqueous solutions by novel melamine-formaldehyde-polyaminopolycarboxylic acid chelating adsorbents.
  74. Xie, Y.; Chen, C.; Ren, X.; Wang, X.; Wang, H.; Wang, X. Emerging natural and tailored materials for uranium-contaminated water treatment and environmental remediation. Progress in Materials Science 2019, 103, 180–234. [Google Scholar] [CrossRef]
  75. Wei, K.; Wang, Q.; Huang, L.; Sun, L. Amino-functionalized urea–formaldehyde framework mesoporous silica for U (VI) adsorption in wastewater treatment. Industrial & Engineering Chemistry Research 2016, 55, 12420–12429. [Google Scholar] [CrossRef]
  76. Rudresh, B.M.; Ravi Kumar, B.N.; Madhu, D. Combined effect of micro- and nano-fillers on mechanical, thermal, and morphological behavior of glass–carbon PA66/PTFE hybrid nano-composites. Adv. Compos. Hybrid Mater. 2019, 2, 176–188. [Google Scholar] [CrossRef]
  77. Rudresh, B.M.; Ravi Kumar, B.N.; Lingesh, B.V. Fibridization effect on the mechanical behavior of PA66/PTFE blend based fibrous composites. Trans. Indian Inst. Met. 2017, 70, 2683–2694. [Google Scholar] [CrossRef]
  78. Morreale, M.; Liga, A.; Mistretta, M.C.; Ascione, L.; La Mantia, F.P. Mechanical, Thermomechanical and Reprocessing Behavior of Green Composites from Biodegradable Polymer and Wood Flour. Materials 2015, 8, 7536–7548. [Google Scholar] [CrossRef]
  79. Anirudhan, T.S.; Deepa, J.R. Synthesis and characterization of multi-carboxyl-functionalized nanocellulose/nanobentonite composite for the adsorption of uranium (VI) from aqueous solutions: Kinetic and equilibrium profiles. Chemical Engineering Journal 2015, 273, 390–400. [Google Scholar] [CrossRef]
  80. Gürses, A.; Güne¸s, K.; Mindivan, F.; Korucu, M.E.; Açıkyıldız, M.; Do˘gar, Ç. The investigation of electrokinetic behaviour of micro-particles produced by CTA+ ions and Na-montmorillonite. Appl. Surf. Sci. 2014, 318, 79–84. [Google Scholar] [CrossRef]
  81. Singla, P.; Mehta, R.; Upadhyay, S.N. Clay Modification by the Use of Organic Cations. Green Sustain. Chem. 2012, 2, 21–25. [Google Scholar] [CrossRef]
  82. dos Santos, E.C.; Bandeira, R.M.; Vega, M.L.; Junior, J.R.d.S. Poly(melamine-formaldehyde-silica) Composite Hydrogel for Methylene Blue Removal. Mater. Res. 2021, 24. [Google Scholar] [CrossRef]
  83. Zhu, P.; Gu, Z.; Hong, S.; Lian, H. Preparation and characterization of microencapsulated LDHs with melamine-formaldehyde resin and its flame retardant application in epoxy resin. Polym. Adv. Technol. 2018, 29, 2147–2216. [Google Scholar] [CrossRef]
  84. Gürses, A.; Barın, T.B. Preparation, Structural Characterization and Evaluation of Some Dynamic and Rheological Properties of a New Type of Clay Containing Mastic Material, Clay-Mastic. Minerals 2023, 13, 705. [Google Scholar] [CrossRef]
  85. Chen, Z.; Wang, J.; Yu, F.; Zhang, Z.; Gao, X. Preparation and properties of graphene oxide-modified poly (melamineformaldehyde) microcapsules containing phase change material n-dodecanol for thermal energy storage. J. Mater. Chem. A 2015, 3, 11624–11630. [Google Scholar] [CrossRef]
  86. Gürses, A.; Do˘gar, Ç.; Köktepe, S.; Mindivan, F.; Güne¸s, K.; Aktürk, S. Investigation of Thermal Properties of PUF/colored Organoclay Nanocomposites. Acta Phys. Pol. A 2015, 127, 979–983. [Google Scholar] [CrossRef]
  87. Wanyika, H.; Maina, E.; Gachanja, A.; Marika, D. Instrumental characterization of montmorillonite clays by X-ray fluorescence spectroscopy, fourier transform infrared spectroscopy, X-ray diffraction and uv/visible spectrophotometry. J. Agric. Sci. Technol. 2016, 17, 224–239. [Google Scholar]
  88. Yu, C.; Xu, W.; Zhao, X.; Xu, J.; Jiang, M. Effects of the reaction degree of melamine-formaldehyde resin on the structures and properties of melamine-formaldehyde/polyvinyl alcohol composite fiber. Fibers Polym. 2014, 15, 1828–1834. [Google Scholar] [CrossRef]
  89. Lagergren, S.K. About the theory of so-called adsorption of soluble substances. Sven. Vetenskapsakad. Handingarl 1898, 24, 1–39. [Google Scholar]
  90. Weber, W.J., Jr.; Morris, J.C. Kinetics of adsorption on carbon from solution. Journal of the sanitary engineering division 1963, 89, 31–59. [Google Scholar] [CrossRef]
  91. Ho, Y.S.; McKay, G. Pseudo-second order model for sorption processes. Process biochemistry 1999, 34, 451–465. [Google Scholar] [CrossRef]
  92. Gürses, A.; Doğar, Ç.; Yalçın, M.; Açıkyıldız, M.; Bayrak, R.; Karaca, S. The adsorption kinetics of the cationic dye, methylene blue, onto clay. Journal of Hazardous Materials 2006, 131, 217–228. [Google Scholar] [CrossRef]
  93. Foo, K.Y.; Hameed, B.H. Coconut husk derived activated carbon via microwave induced activation: effects of activation agents, preparation parameters and adsorption performance. Chemical Engineering Journal 2012, 184, 57–65. [Google Scholar] [CrossRef]
  94. Oguntimein, G.B. Biosorption of dye from textile wastewater effluent onto alkali treated dried sunflower seed hull and design of a batch adsorber. Journal of Environmental Chemical Engineering 2015, 3, 2647–2661. [Google Scholar] [CrossRef]
  95. El Maguana, Y.; Elhadiri, N.; Benchanaa, M.; Chikri, R. Activated carbon for dyes removal: modeling and understanding the adsorption process. Journal of Chemistry 2020, 2020, 1–9. [Google Scholar] [CrossRef]
  96. Hubbe, M.A.; Azizian, S.; Douven, S. Implications of apparent pseudo-second-order adsorption kinetics onto cellulosic materials: A review. BioResources 2019, 14. [Google Scholar] [CrossRef]
  97. Ugbe, F.A.; Abdus-Salam, N. Kinetics and thermodynamic modelling of natural and synthetic goethite for dyes scavenging from aqueous systems. Arabian Journal of Chemical and Environmental Research 2020, 7, 12–28. [Google Scholar]
  98. Galamini, G.; Ferretti, G.; Medoro, V.; Tescaro, N.; Faccini, B.; Coltorti, M. Isotherms, kinetics, and thermodynamics of nh4+ adsorption in raw liquid manure by using natural chabazite zeolite-rich tuff. Water 2020, 12, 2944. [Google Scholar] [CrossRef]
  99. Majd, M.M.; Kordzadeh-Kermani, V.; Ghalandari, V.; Askari, A.; Sillanpää, M. Adsorption isotherm models: A comprehensive and systematic review (2010−2020). Science of The Total Environment 2022, 812, 151334. [Google Scholar] [CrossRef] [PubMed]
  100. Adusei, J.K.; Agorku, E.S.; Voegborlo, R.B.; Ampong, F.K.; Awarikabey, E.; Danu, B.Y.; Amarh, F.A. Zero Valent Iron Impregnated Sodium Alginate Grafted (Acrylamide-Co-Acrylic Acid) Adsorbents for the Removal of Methylene Blue in Aqueous Systems. Journal of Macromolecular Science, Part B 2023, 62, 265–279. [Google Scholar] [CrossRef]
  101. Gürses, A.; Güneş, K.; Şahin, E.; Açıkyıldız, M. Investigation of the removal kinetics, thermodynamics and adsorption mechanism of anionic textile dye, Remazol Red RB, with powder pumice, a sustainable adsorbent from waste water. Frontiers in Chemistry 2023, 11, 1156577. [Google Scholar] [CrossRef]
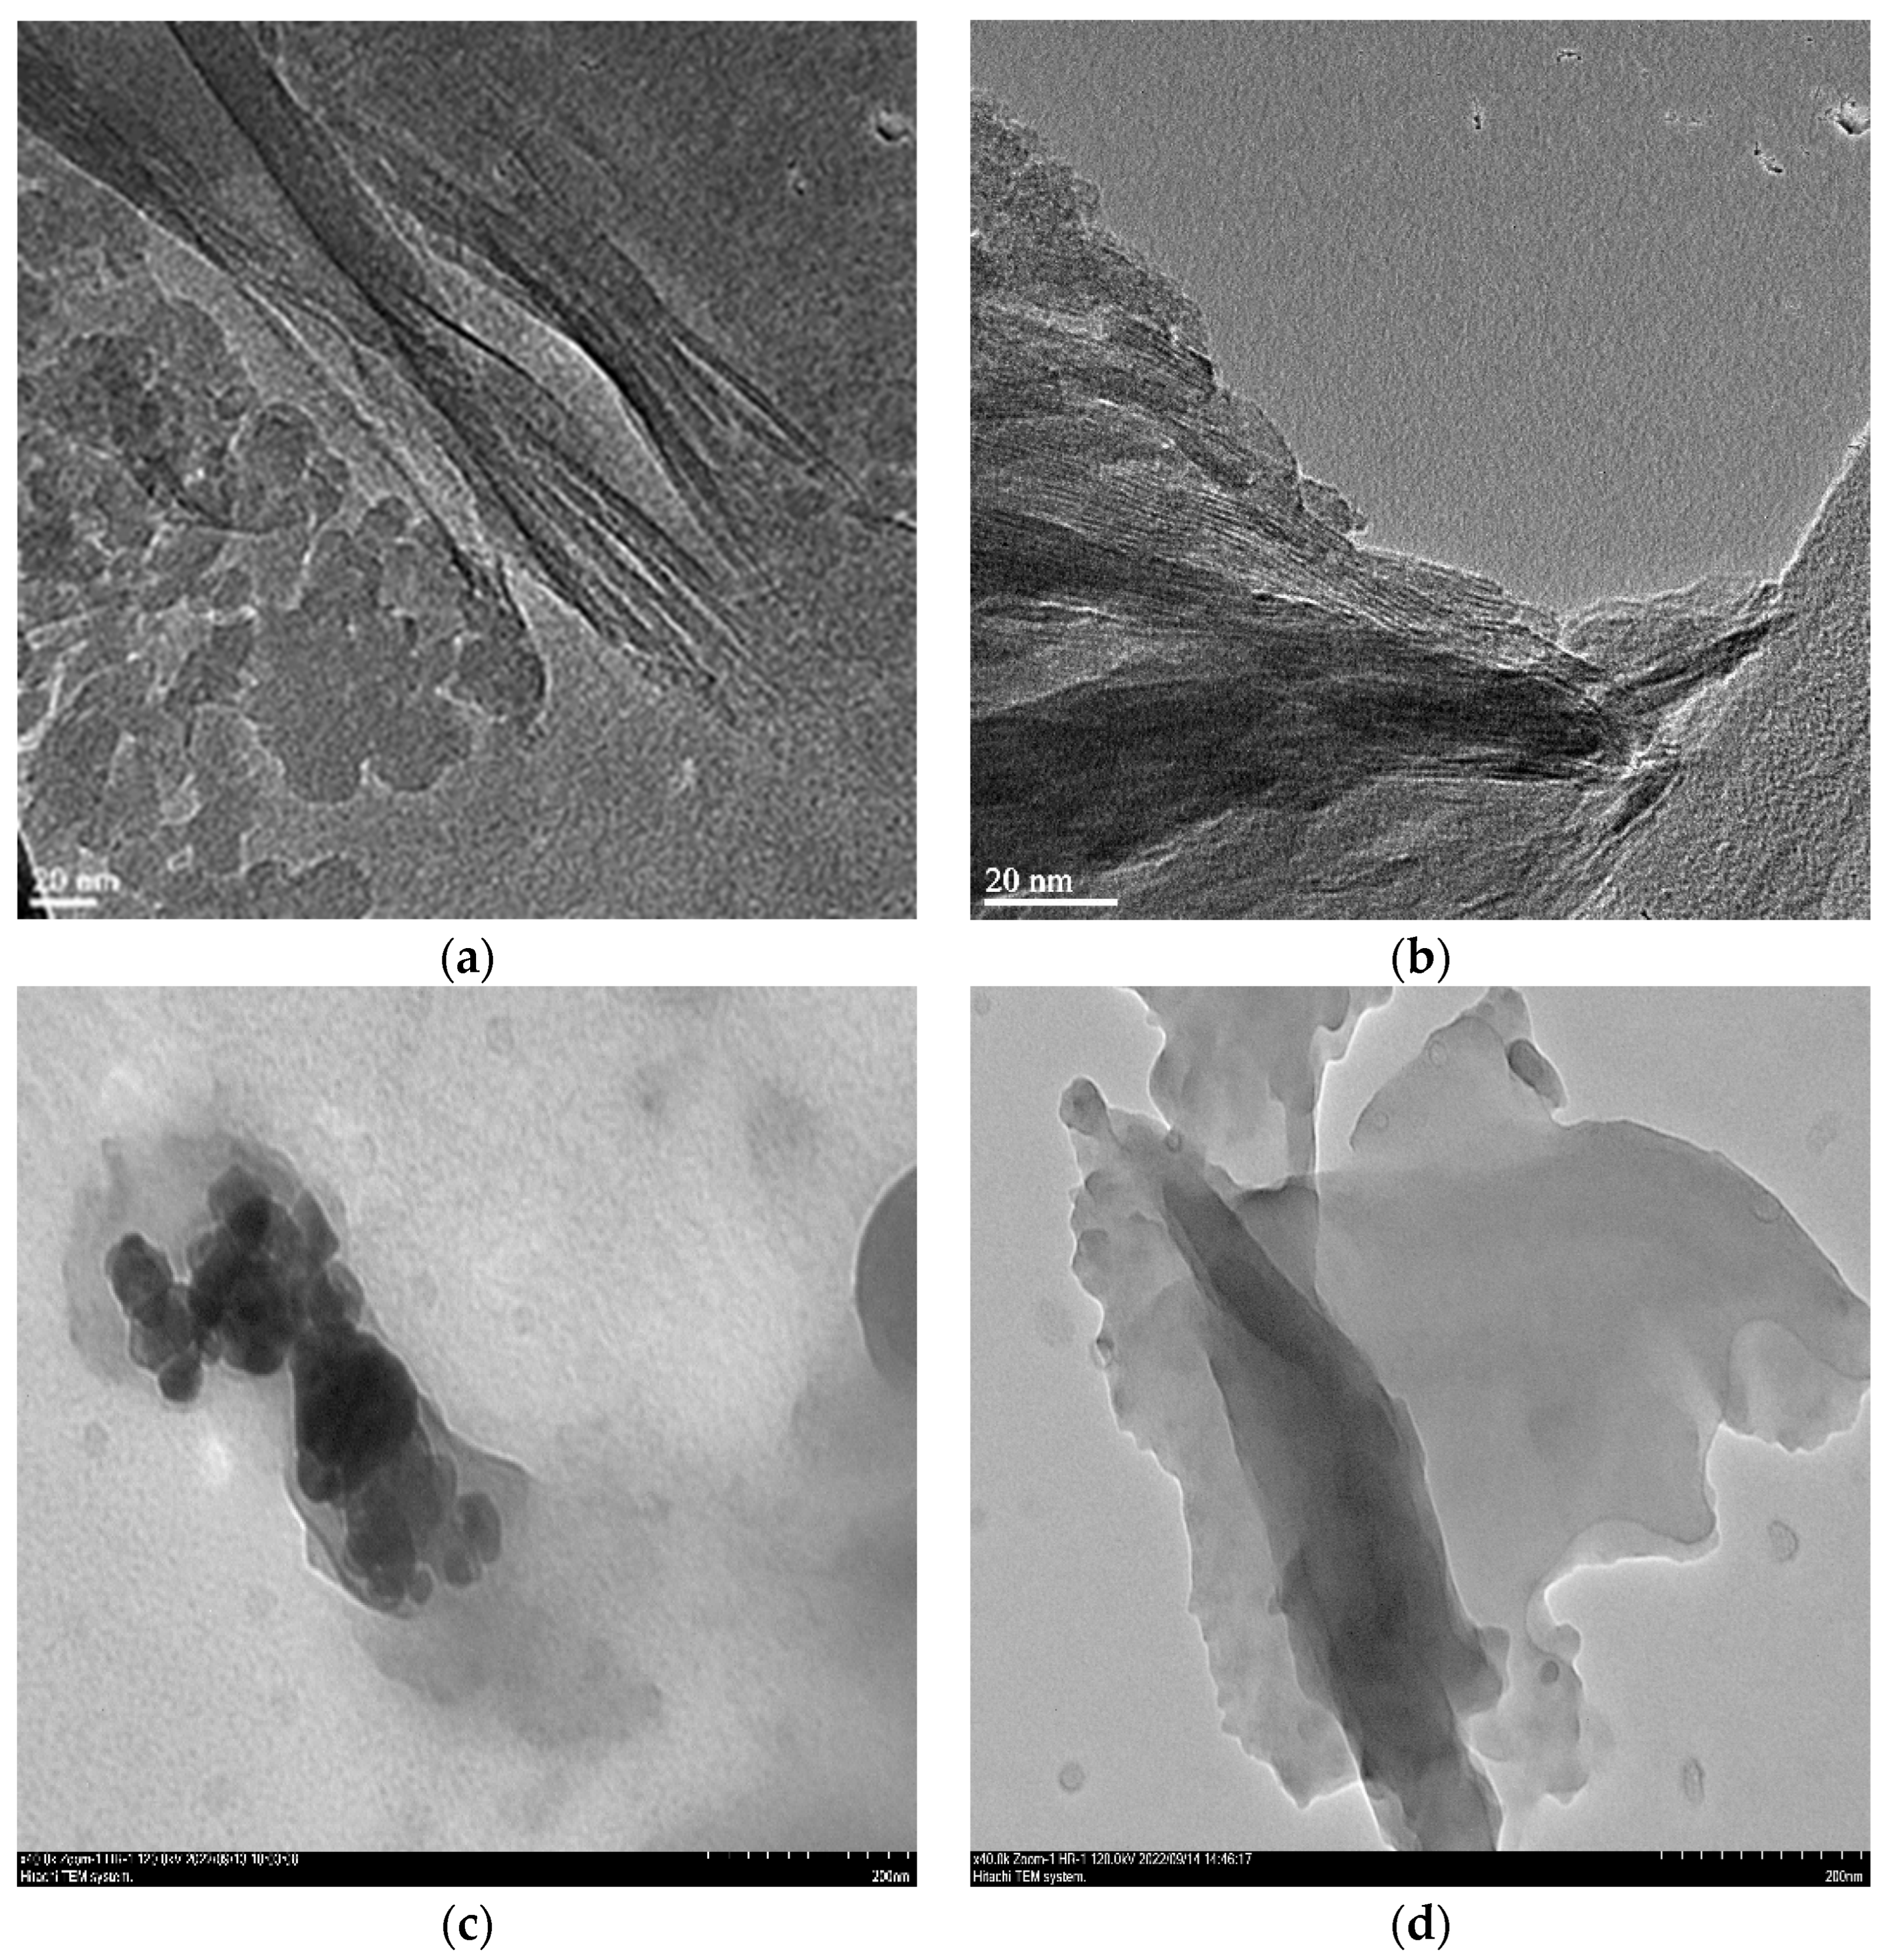
Figure 1. HRTEM Images of Raw Montmorillonite (MMT) (a), Organo-Montmorillonite (OMMT) (b), Melamine Formaldehyde Foam (MF)(c) and Melamine Formaldehyde Nanocomposite Foam (MFCNC) (d).
Preprints 92217 g001
Figure 2. FTIR Spectra of Melamine Formaldehyde Foam (MF) and Melamine Formaldehyde Nanocomposite Foam (MFCNC).
Preprints 92217 g002
Figure 3. XRD Diffractograms of Melamine Formaldehyde Foam (MF) and Melamine Formaldehyde Nanocomposite Foam (MFCNC).
Preprints 92217 g003
Figure 4. Plot of adsorbed amount versus adsorption time as a function of initial U(VI) concentration.
Preprints 92217 g004
Figure 5. Variation of removal ratio with initial U(VI) concentration.
Preprints 92217 g005
Figure 6. Graphs drawn for the fit of experimental data to (a) pseudo-first-order, (b) pseudo-second-order and (c) intra-particle diffusion models.
Preprints 92217 g006
Figure 7. Experimental adsorption isotherms for three different temperatures (25,45 and 65oC) (Time: 60 min; solid/liquid ratio: 0.1/100 g/mL, shaking speed: 150 min−1 and natural pH: 3.4).
Preprints 92217 g007
Figure 8. Isotherms drawn for the Freundlich isotherm equation (a), Langmuir model (b), Brunauer–Emmett–Teller (BET) model (c), Halsey model (d), Harkins-Jura model (e) and Smith model (f).
Preprints 92217 g008
Figure 9. Variation of (a) adsorbed amount and zeta potential values and (b) adsorbed amount and electrical conductivity values with initial pH (Initial dye concentration: 1200µM, temperature: 25°C, time: 60 min, solid/liquid ratio :0.1/100 g/100 mL and shaking speed:150 min−1).
Preprints 92217 g009
Figure 10. Variation of the amount of U(VI) adsorbed with adsorbent dosage ((Initial dye concentration: 1200µM, temperature: 25°C, time: 60 min, natural pH:4.3, and shaking speed:150 min−1).
Preprints 92217 g010
Table 1. XRF chemical compositions of Montmorillonite(MMT).
Component (%)
SiO2 Al2O3 Fe2O3 MgO CaO Na2O K2O TiO2 SO3 Other
Montmorillonite 59.32 17.19 5.95 3.63 2.21 1.68 0.97 0.74 0.51 7.81
Table 2. Some characteristics of hydrocarbon material.
Density
(15 °C), kg/m3
Calorific Value
MJ/kg
Flash Point °C Water by Distillation,
wt. %
C H N S Ash
990.7 42.74 105.8 0.1 83.4 11.9 0.8 1.5 0.03
Table 3. Calculated kinetic parameters for pseudo-first-order and pseudo-second-order kinetic models for the adsorption of U(VI) on powder MFCNC (25°C, solid/liquid ratio: 0.1/100 g/mL and pH: 4.3).
Cint
(µg L−1)
Temperature
K
Pseudo-first-order Pseudo-second-order Intra particle diffusion (first part) Intra particle diffusion (second part)
k1 R2 k2 R2 kid,1
mg s−1/2 g−1
R2 kid,2
mg s−1/2 g−1
R2
600 298 - - 0.029 0.999 39.14 0.9697 6.32 0.8261
1200 298 - - 0.002 0988 28.03 0.9137 10.04 0.7638
1800 298 - - 0.001 1.000 11.24 0.6531 1.09 0.1714
2400 298 - - 0.001 0.952 8.91 03469 1.53 0.3379
3000 298 - - 0.007 1.000 2.34 0.0112 0.44 0.0093
Table 4. Linear equations of the Freundlich isotherm equation (a), Langmuir model (b), Brunauer–Emmett–Teller (BET) model (c), Halsey model (d), Harkins-Jura model (e) and Smith model (f). and isotherm constants and regression coefficients.
Isotherm equations Constant parameter Regression coefficients(R2)
Freundlich n 0.569 0.8110
ln q=1/n ln Ce + lnKf Kf 1.506
Langmuir qm 1000 0.3352
Ce/q = 1/qmK +Ce/qm K 0.001
BET qm 5.649 0.5088
C/q(1-Ce)=1/qmk + (k-1)Ce/qmk k 1.170
Halsey nH 0.0005 0.9734
qe = 1/nHlnKH-1/nH lnCe KH 1.445
Harkins-Jura A 0.566 0.9431
1/q2= (B/A) -1/A lnCe B 7.031
Smith Wb -327.3 0.7137
q =Wb - Wln(1-Ce) W 564.5
Table 5. Isosteric adsorption enthalpy, ΔH°ads, isosteric adsorption entropy ΔS°ads values and distribution coefficients corresponding to the first and second plateaus in the isotherm curves.
Temperature
(K)
ΔH°ads (kJ/mol)
For the first plateau

D1
ΔH°ads (kJ/mol)
for the second plateau

D1
ΔS°ads
(J/mol K)
for the first
plateau

D2
ΔS°ads (J/molK)
for the second plateau

D2
298
3.65

1.08

-51.02

3.59

1.77

1.71

-167.28

5.92
338
Disclaimer/Publisher’s Note: The statements, opinions and data contained in all publications are solely those of the individual author(s) and contributor(s) and not of MDPI and/or the editor(s). MDPI and/or the editor(s) disclaim responsibility for any injury to people or property resulting from any ideas, methods, instructions or products referred to in the content.
Copyright: This open access article is published under a Creative Commons CC BY 4.0 license, which permit the free download, distribution, and reuse, provided that the author and preprint are cited in any reuse.
Prerpints.org logo

Preprints.org is a free preprint server supported by MDPI in Basel, Switzerland.

Subscribe

© 2024 MDPI (Basel, Switzerland) unless otherwise stated