1. Introduction
The petrochemical industry is the basis for the development of various industries and has been developing rapidly in recent years. In petrochemical plants, the petrochemical control room is the center of the entire production process, controlling the operating status of the petrochemical plant, and is also a place where more staff gathers. At the present stage, the petrochemical plants shows the development trend of the large-scale, centralized and intensive, and the risk of explosion accidents in petrochemical plants is also rising rapidly, leading to devastating consequences such as structural damage, casualties, and substantial economic losses [
1].
Past accidents serve as stark reminders of the potential dangers that loom in petrochemical plants, for instance, the ExxonMobil Torres Refinery accident in Texas, USA (2005), where the loss of 15 lives and over 170 injuries occurred [
2]. The vapor cloud explosion in Buncefield (UK) (2005) caused significant blast damage to surrounding commercial buildings and industrial equipment [
3].The BP refinery explosion in Texas City, also in 2005, marked one of the worst industrial disasters in the history of the United States, claiming 15 lives and injuring 180 people [
4]. Furthermore, the Yanshan Petrochemical Company accident in Beijing, China (2013) resulted in at least 5 deaths and multiple injuries [
5]. These accidents underscore the pressing need to enhance the blast resistance and energy absorption capacity of petrochemical control room structures. In light of such potential risks, the development of an innovative structural system for petrochemical control rooms becomes indispensable.
Petrochemical control rooms typically require highly complex structural design specifications, including provisions for seismic, wind, and blast resistance. Additionally, these control rooms utilize high-strength and durable building materials and must adhere to specialized design requirements, such as protection against chemical corrosion and precise control of temperature and humidity. These factors contribute to differing structural responses and levels of damage between petrochemical control rooms and typical building structures when subjected to the same type of explosion. The TNT equivalent method, representing the effects of vapor cloud explosions as TNT equivalents, is widely used in structural specifications [
6,
7] to facilitate the implementation of the design procedure. The ASCE (2010) Design Guide comprehensively addresses methods for predicting blast overpressure resulting from accidental explosions in petrochemical plants, along with quantifying the effects of such blasts on structures [
8]. This guide offers blast resistant design and structural reinforcement techniques to mitigate the hazards caused by unforeseen petrochemical explosions. Studies investigating damage for various structures caused by vapor cloud explosions have been conducted. Pritchard and Roberts [
9] observed that the extent of damage of the structures depended on the distance from the center of the explosion. Clubley [
10] performed full-scale experiments and finite element simulations to analyze the response of cylindrical shell structures subjected to high-power, prolonged explosions from sources such as hydrocarbon vapor clouds. Li et al. [
11] examined the dynamic response of a reinforced concrete frame structure subjected to long-distance blast loading caused by an explosion, and their findings revealed that the cladding panels were particularly affected due to variations in blast forces acting on the structure. Blast-resistant walls, such as profiled/corrugated panels, are extensively utilized in the industry to provide safety barriers against hydrocarbon explosions for personnel, facilities, and critical equipment on offshore platforms. The response of blast-resistant walls under hydrocarbon explosions has been extensively analyzed using nonlinear finite element models, and these findings have been compared with design guidelines [
12]. Furthermore, the response of steel profiled blast barriers without passive impact barrier systems and with passive impact barrier systems placed at specific offset locations behind the blast barriers under hydrocarbon explosions has been investigated [
13]. Additionally, in scenarios involving terrorist attacks and accidental explosions in the petrochemical industry, the corresponding studies have shown that the protective walls or barriers is effective in minimizing blast effects and building damage [
14]. Kiakojouri and his colleagues’ research emphasize the potential impact of progressive collapse on structures. They particularly focus on the pivotal role of strengthening and retrofitting techniques in mitigating such collapses, while also examining several parameters, including structural topology, the nature of triggering events, the initial collapse scale, collapse types, and seismic design requirements, and their influence on strengthening strategies [
15,
16].
Existing technologies for enhancing blast resistance in petrochemical control rooms mainly involve increasing the size of traditional reinforced concrete walls and columns. However, this conventional approach poses several challenges, especially in terms of cost-effectiveness and feasibility. Enlarging walls and columns significantly raises project expenses and becomes difficult to implement within existing space constraints [
17]. Conversely, the use of lattice sandwich structures is gaining popularity in the construction sector due to their numerous benefits, including cost-effectiveness, lightweight properties, and thermal insulation. It is important to acknowledge that the sandwich panels with metal cores might encounter accidental industrial blast loads during their operational lifespan. Moreover, these sandwich panels have found widespread application in the aerospace, automotive, shipbuilding, defense industries, and others. Hence, conducting a thorough investigation into the performance of these structural panels under blast loading becomes imperative.
There are numerous studies in the literatures focusing on the resistance of composite plates subjected to impact or blast loading. Metallic honeycomb cores with random and periodic microstructures [
18], such as metallic foams, honeycombs, and lattices, have shown potential for sandwich panels due to their excellent energy absorption capacity. Over the past decades, researchers have extensively investigated the plastic deformation, damage modes, and energy absorption behavior of sandwich panels with metal cores under explosive loading. Zhu et al. [
19] conducted a study on the structural response of square metal sandwich panels with honeycomb cores under explosive loading using both experimental and numerical methods. The research provided insights into the deformation and damage modes, and highlighted that the large plastic deformation of the metal core effectively dissipates input energy. Furthermore, the effects of face sheet and core configurations on the structural response were also explored. Shen et al. [
20] experimentally studied curved sandwich panels with aluminum foam cores under airburst loading. They found that the curvature of the panels altered the deformation/collapse pattern and improved blast resistance. Numerical and theoretical investigations have also been conducted to study the damage modes, blast resistance, and energy absorption of metallic cylindrical sandwich shells with closed-cell aluminum foam cores under blast loads and projectile impacts [
21,
22]. Furthermore, Chen and Hao [
23] examined the performance of multi-arched bi-layered panels under uniform impact loads. Dharmasena et al. [
24] demonstrated experimentally and numerically that a honeycomb metal core within a sandwich structure is a suitable choice for deflection-constrained design against air blast loads. Yang Yu et al. [
25] investigated the low-velocity impact response of hybrid honeycomb sandwich panels and examined the effect of sandwich panel parameters on the response. The study showed that the energy absorption performance of hybrid honeycomb sandwich panels was better than that of conventional honeycomb sandwich panels.
The performance of lattice sandwich materials in response to blast loading is outstanding, and extensive studies have revealed several key advantages. Ashkan Vaziri et al. studied the deformation patterns of lattice sandwich structures under blast loading, including tensile deformation of the upper and lower panels, plastic deformation of the sandwich rods, and shear deformation between the core rods [
26]. Similarly, Nan et al. investigated the mechanical properties of pyramidal kokomatsu sandwich panels under impact loads, providing a comprehensive analysis of rod diameter, aspect ratio, number of units, and plies, further showcasing the superiority of lattice sandwich materials [
27]. Moreover, Guoqi Zhang et al. conducted experiments to evaluate the stress-strain curves and energy absorption mechanisms of a pyramidal truss sandwich structure composed of carbon fiber-reinforced polymer (CFRP) panels and an aluminum alloy core, demonstrating its excellent energy absorption performance [
28]. The numerical study by Ubade Kemerli et al. verified the advantages of lattice sandwich materials, particularly highlighting the conjugate forced convective heat transfer effect in sandwich panels with Kagome truss cores. Their findings indicated that adjusting the length and diameter of stubs significantly improved the pressure drop and Nusselt number of fractional sandwich materials [
29]. Parametric studies further reinforced the excellent performance of the lattice sandwich materials. By modeling seven combinations of outer layer thickness in ANSYS Workbench Explicit Dynamics, researchers evaluated the effects of continuous blast loading on sandwich panel performance. The results revealed that pyramidal lattice panels exhibited high energy dissipation capacity in all different configurations, achieving energy absorption ranging from 5% to 48% [
30]. In summary, lattice sandwich materials offer great potential in the design of blast-resistant petrochemical control rooms, given their exceptional blast resistance, lightweight properties, superior thermal insulation, and remarkable energy absorption capabilities. These materials warrant further research and wider application in practical engineering projects within the petrochemical industry.
Considering the influence factors of the radius of the truss core rod and thickness of the upper and lower panels, in this paper, blast-resistant performance of a real steel petrochemical control room with 3D-Kagome truss core sandwich wall is analyzed. The study includes numerical modeling of the control room structure subjected to vapor cloud explosion loads, optimal blast-resistant design of the 3D-Kagome sandwich blast-resistant wall, and dynamic response analysis of the control room structure.
2. Geometry of 3D-Kagome sandwich panels
With the development of material manufacturing technologies, the truss lattice material as a porous material has received great attention from various fields, which has excellent multifunctional performances of light weight, high strength, blast resistance, heat insulation and sound absorption. For the truss core sandwich panel, it mainly includes three types, tetrahedral type, pyramid one and 3D-Kagome one, among which 3D-Kagome sandwich panel outperforms other two types on aforementioned multifunctional performances [
31]. Therefore, the 3D-Kagome truss core sandwich structure is chosen in this paper. The structural model of this truss core sandwich panel is shown in
Figure 1 and it consists of three parts: upper panel, middle truss core sandwich and lower panel.
It is observed from
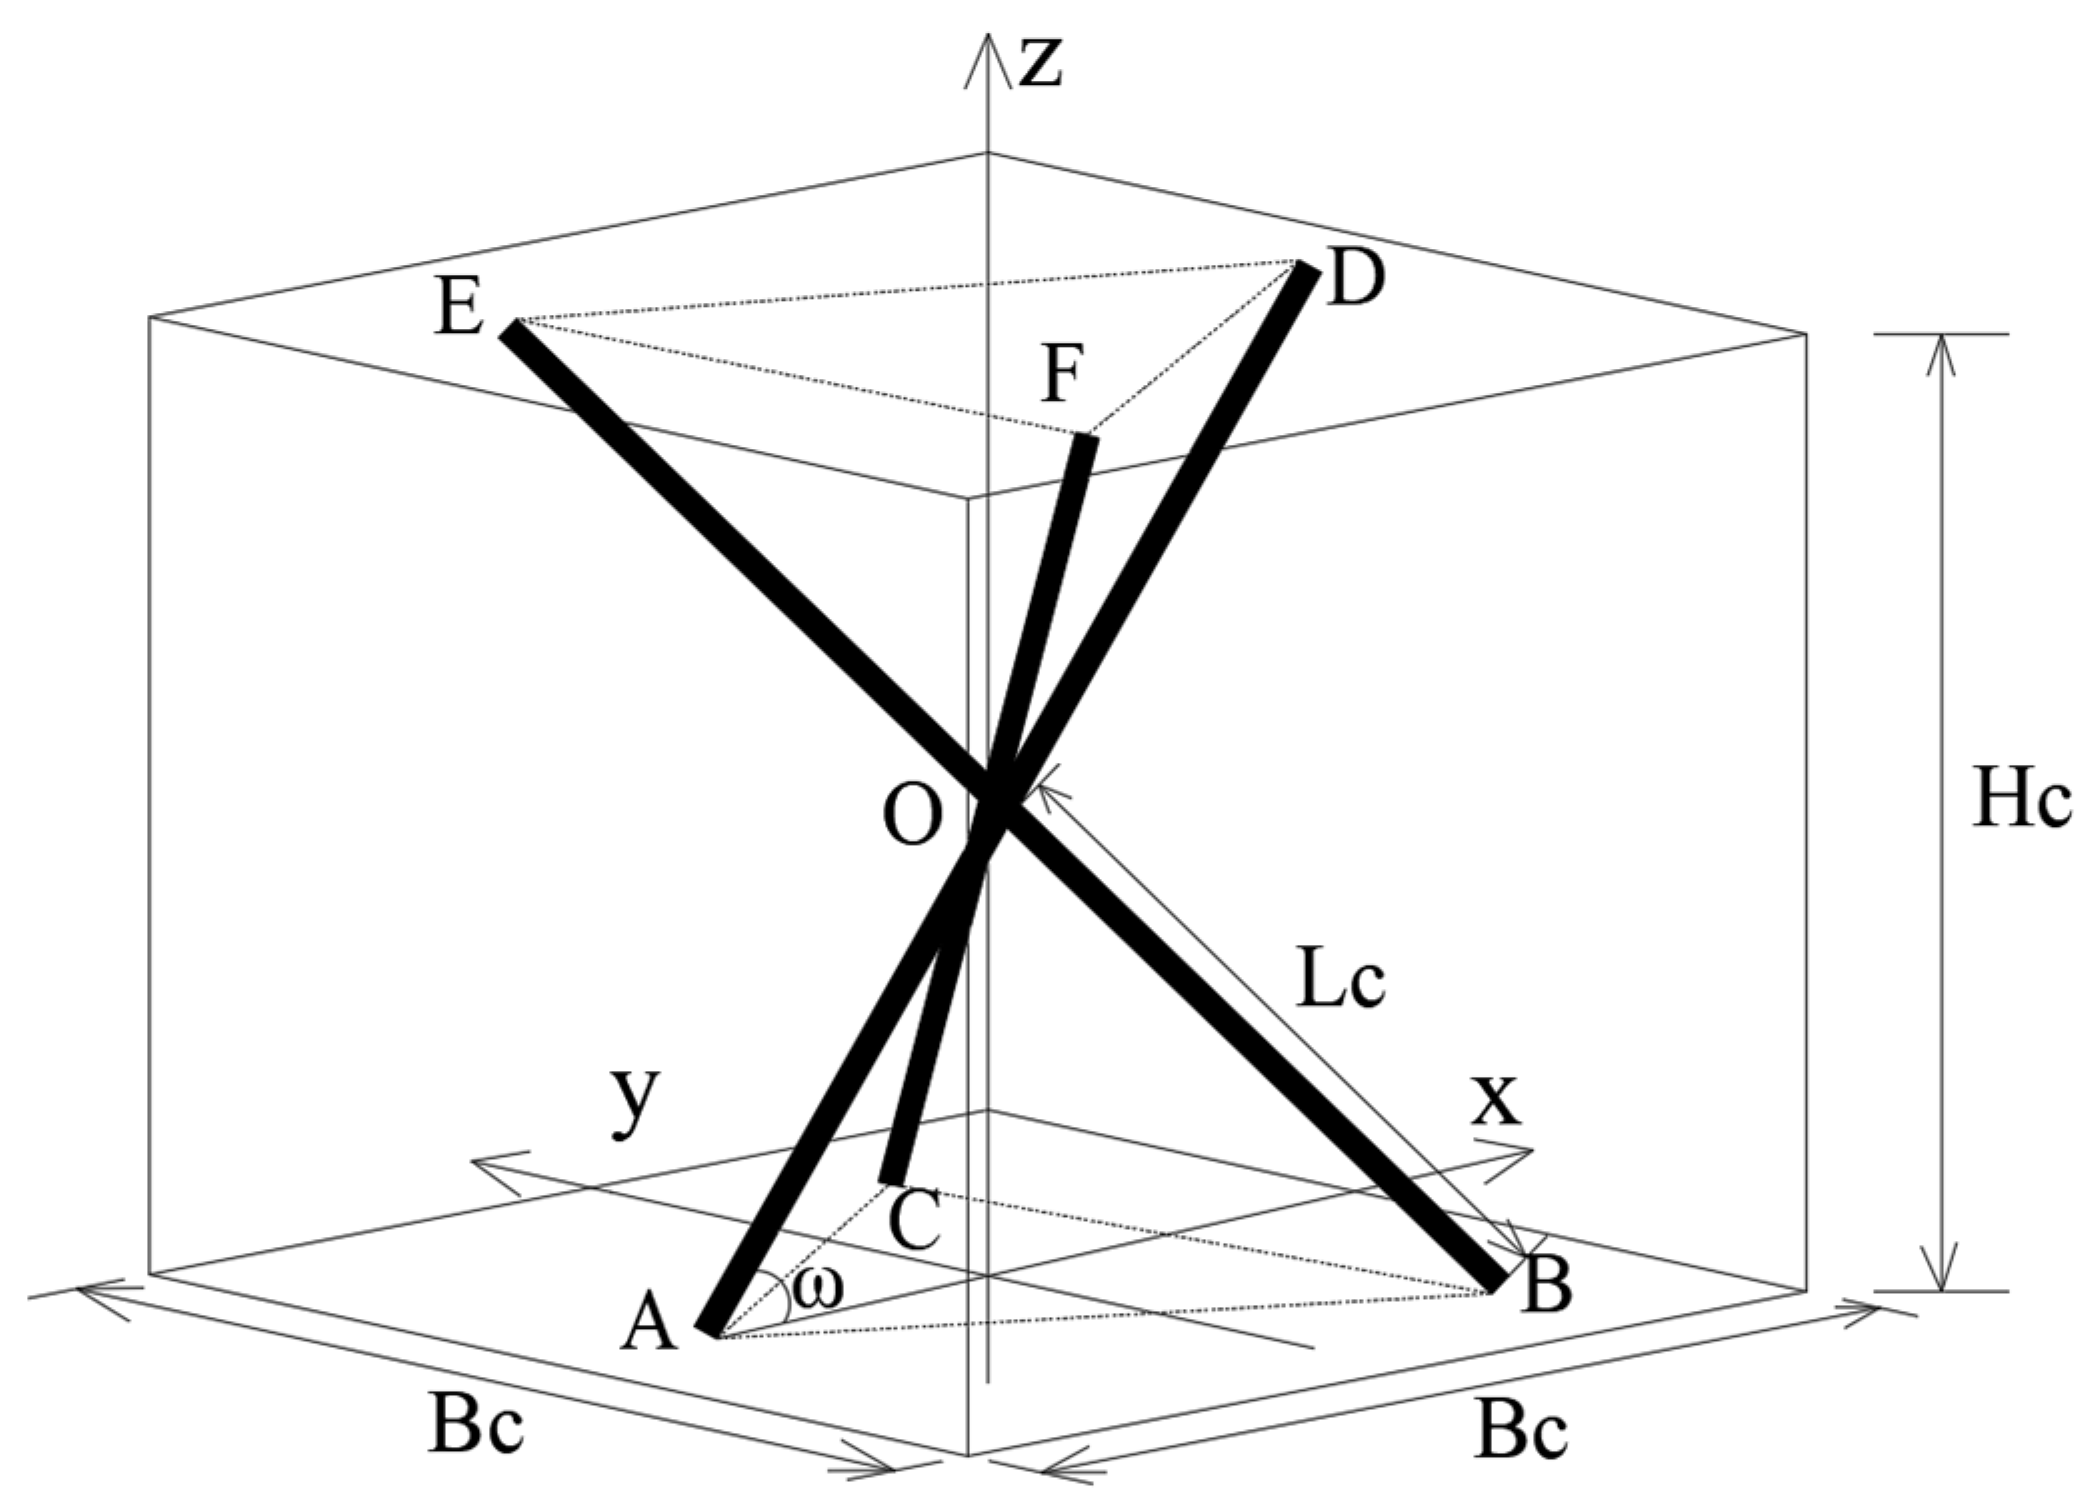
Figure 1 that the 3D-Kagome truss core sandwich panel is constituted by periodic arrangement of the same single cells. The truss core of the single cell structure is shown in
Figure 2 in which B
c is the distance between different single cells, H
c is the height of the sandwich layer, R
c is the radius of the truss core rod, 2L
c is the length of the truss core rod, and ɷ is the angle between the truss core rod axis and the upper/ lower panels.
The relative density is one of the important parameters for the 3D-Kagome truss core sandwich panel, which consists of relative density of the truss core layer and ones of upper and lower sandwich panels. The relative density of the 3D-Kagome truss core sandwich panel is described by the following equations [
32]:
Substituting Eq.(1) into Eq.(2) will transfer them to the following form
where
is the relative density of the truss core of single cell,
is the relative density of the sandwich structure of single cell, and
h is the thickness of the upper and lower panels.
Under the blast load, the deformation of 3D-Kagome truss core sandwich panels mainly includes tensile deformation of upper and lower panels, plastic deformation of truss core layer and shear deformation between core layer and upper/lower panels. The blast energy is mainly absorbed by truss of core layer.
3. Finite element model (FEM) of petrochemical control room structure
To ensure the feasibility of the FEM of a real steel petrochemical control room with 3D-Kagome truss core sandwich wall, the following simplifications were made:
(1) The impact of doors and windows on the explosion load was not considered, and the structures were treated as fully enclosed.
(2) Interaction between the foundation and the upper structure of the petrochemical control room was not taken into account.
(3) Contact keywords were used to ensure that there was no relative sliding or separation at the connection points.
(4) The potential secondary effects of the explosion, such as fires, on the structure were not considered.
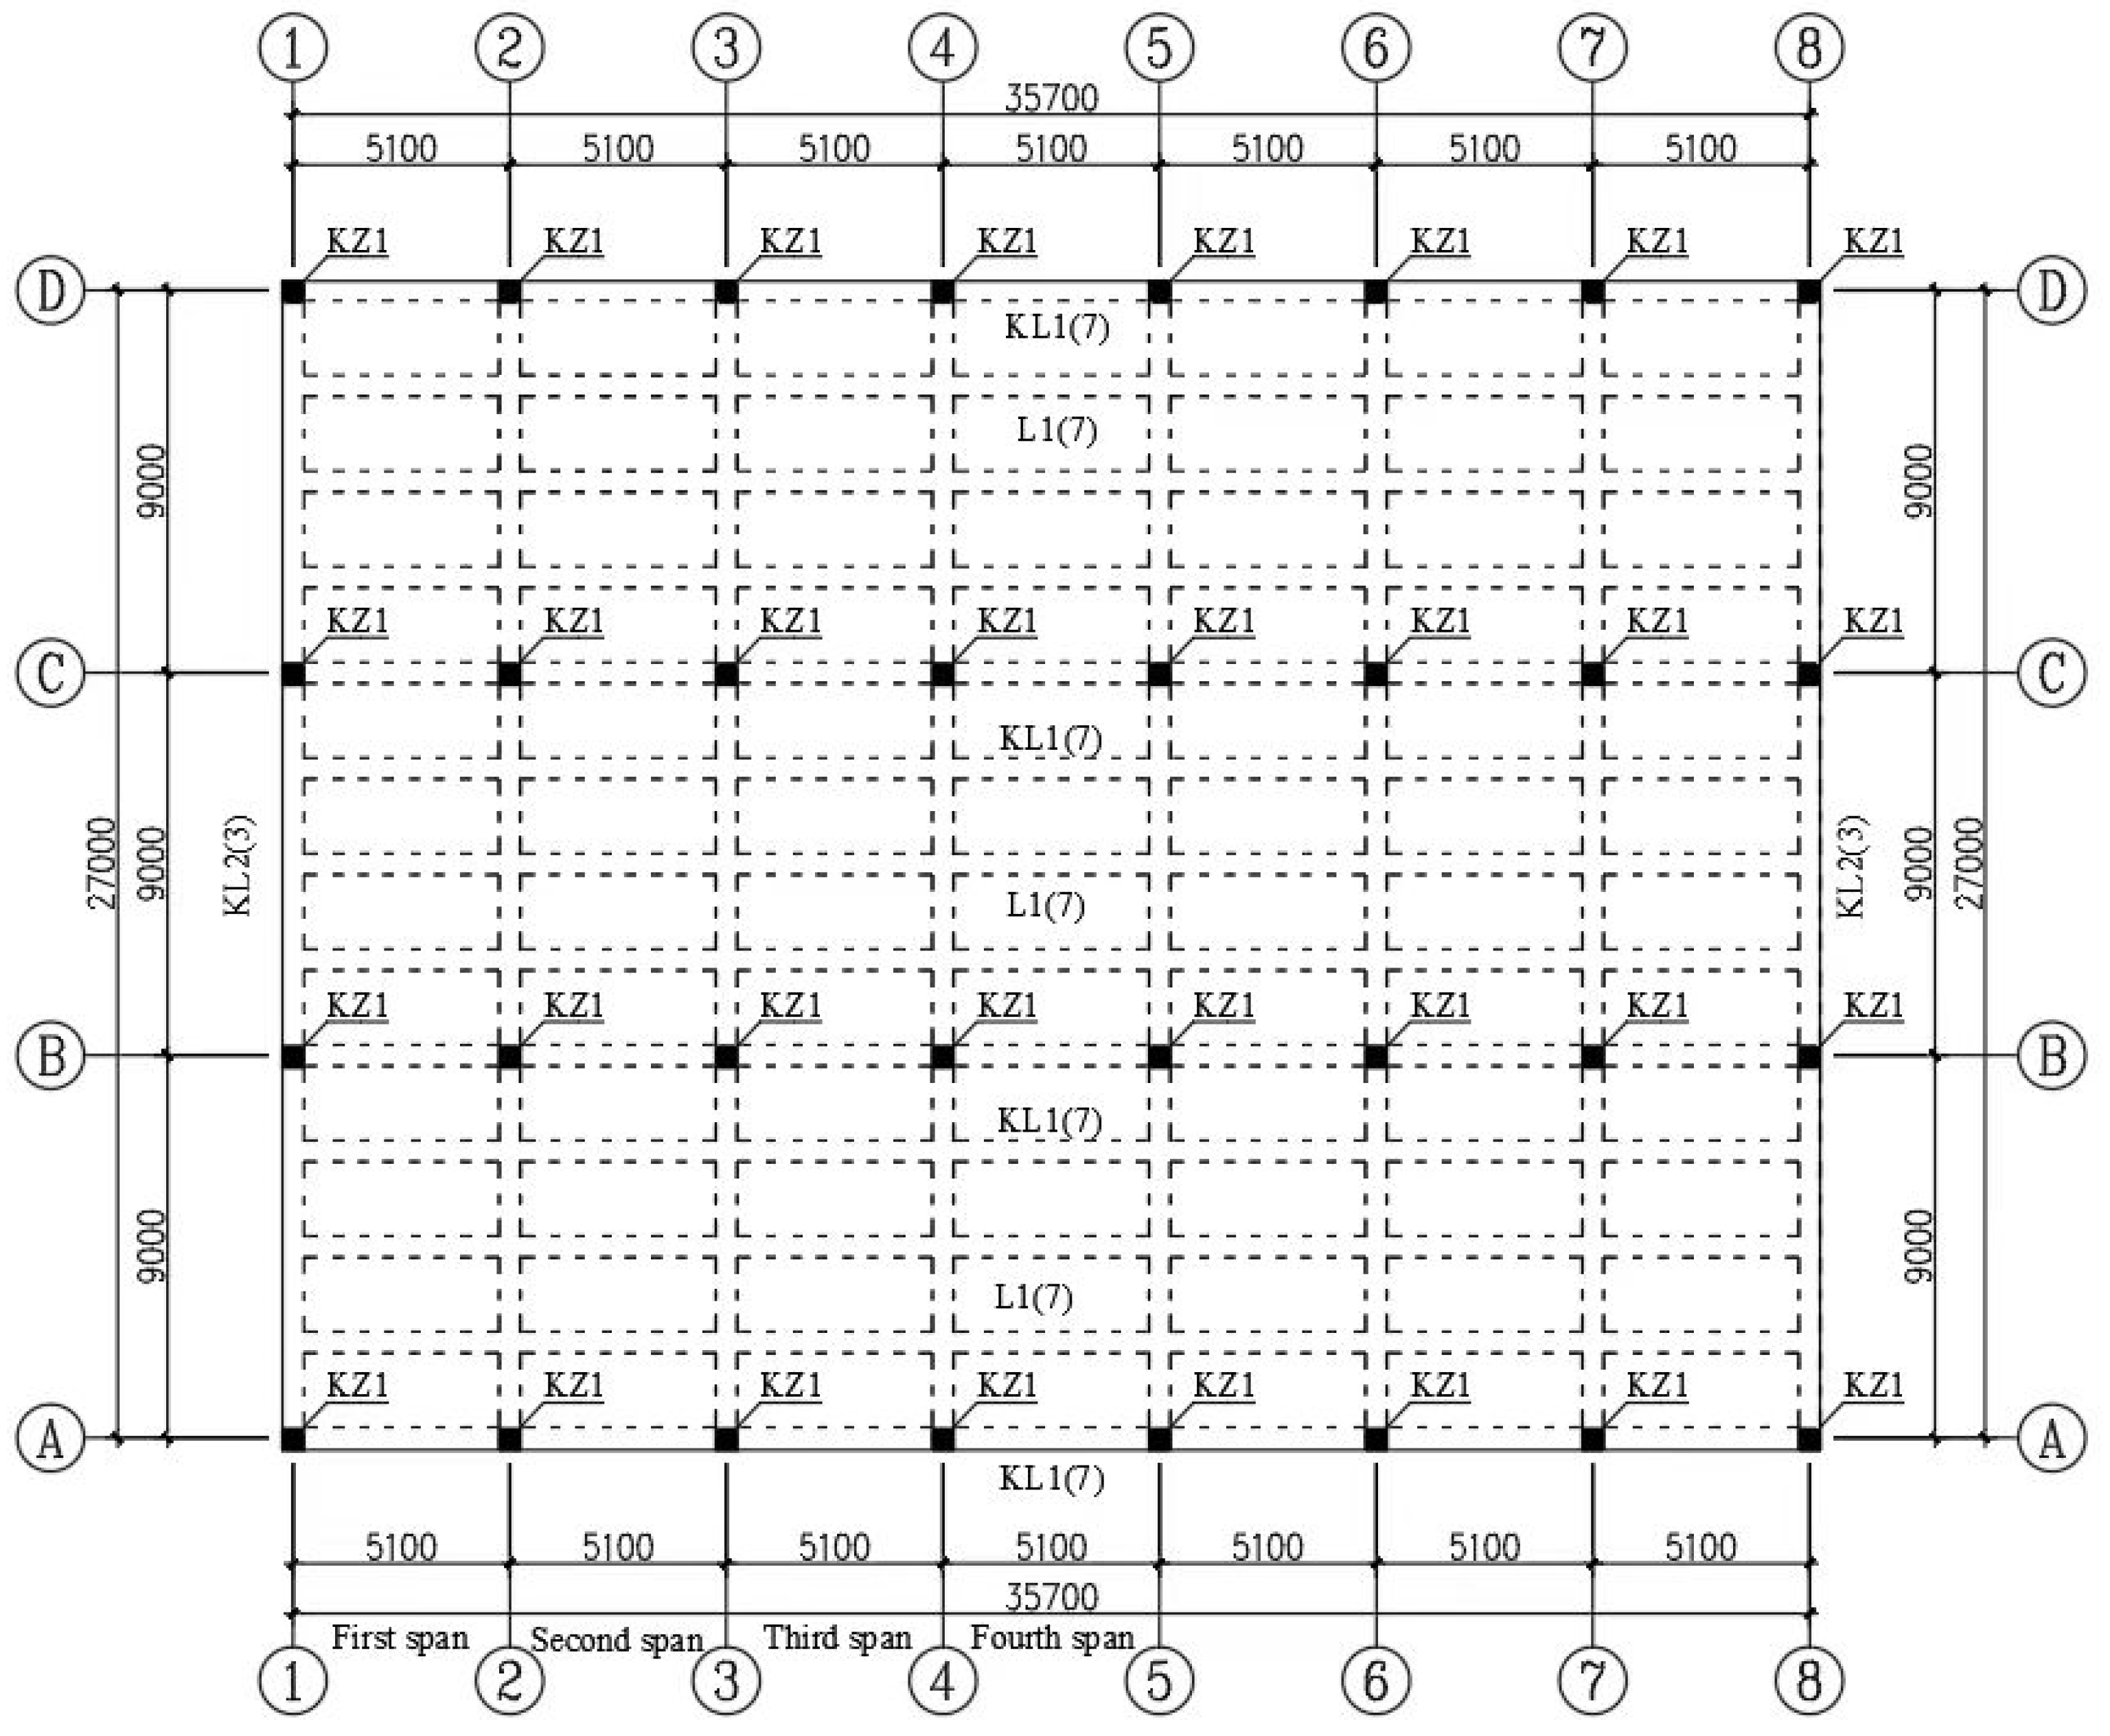
The real steel petrochemical control structure shown in
Figure 3 is presented in this paper to testify the blast-resistant performance of new 3D-Kagome truss sandwich wall. The length of the structure is 35.7m, the width is 27.0m, and the height is 6.0m. The main members of the structure, such as the steel frame beam and column, are chosen with H section, and the cross-sectional size of each member is shown in
Table 1.
The FEM of the steel petrochemical structure is shown in
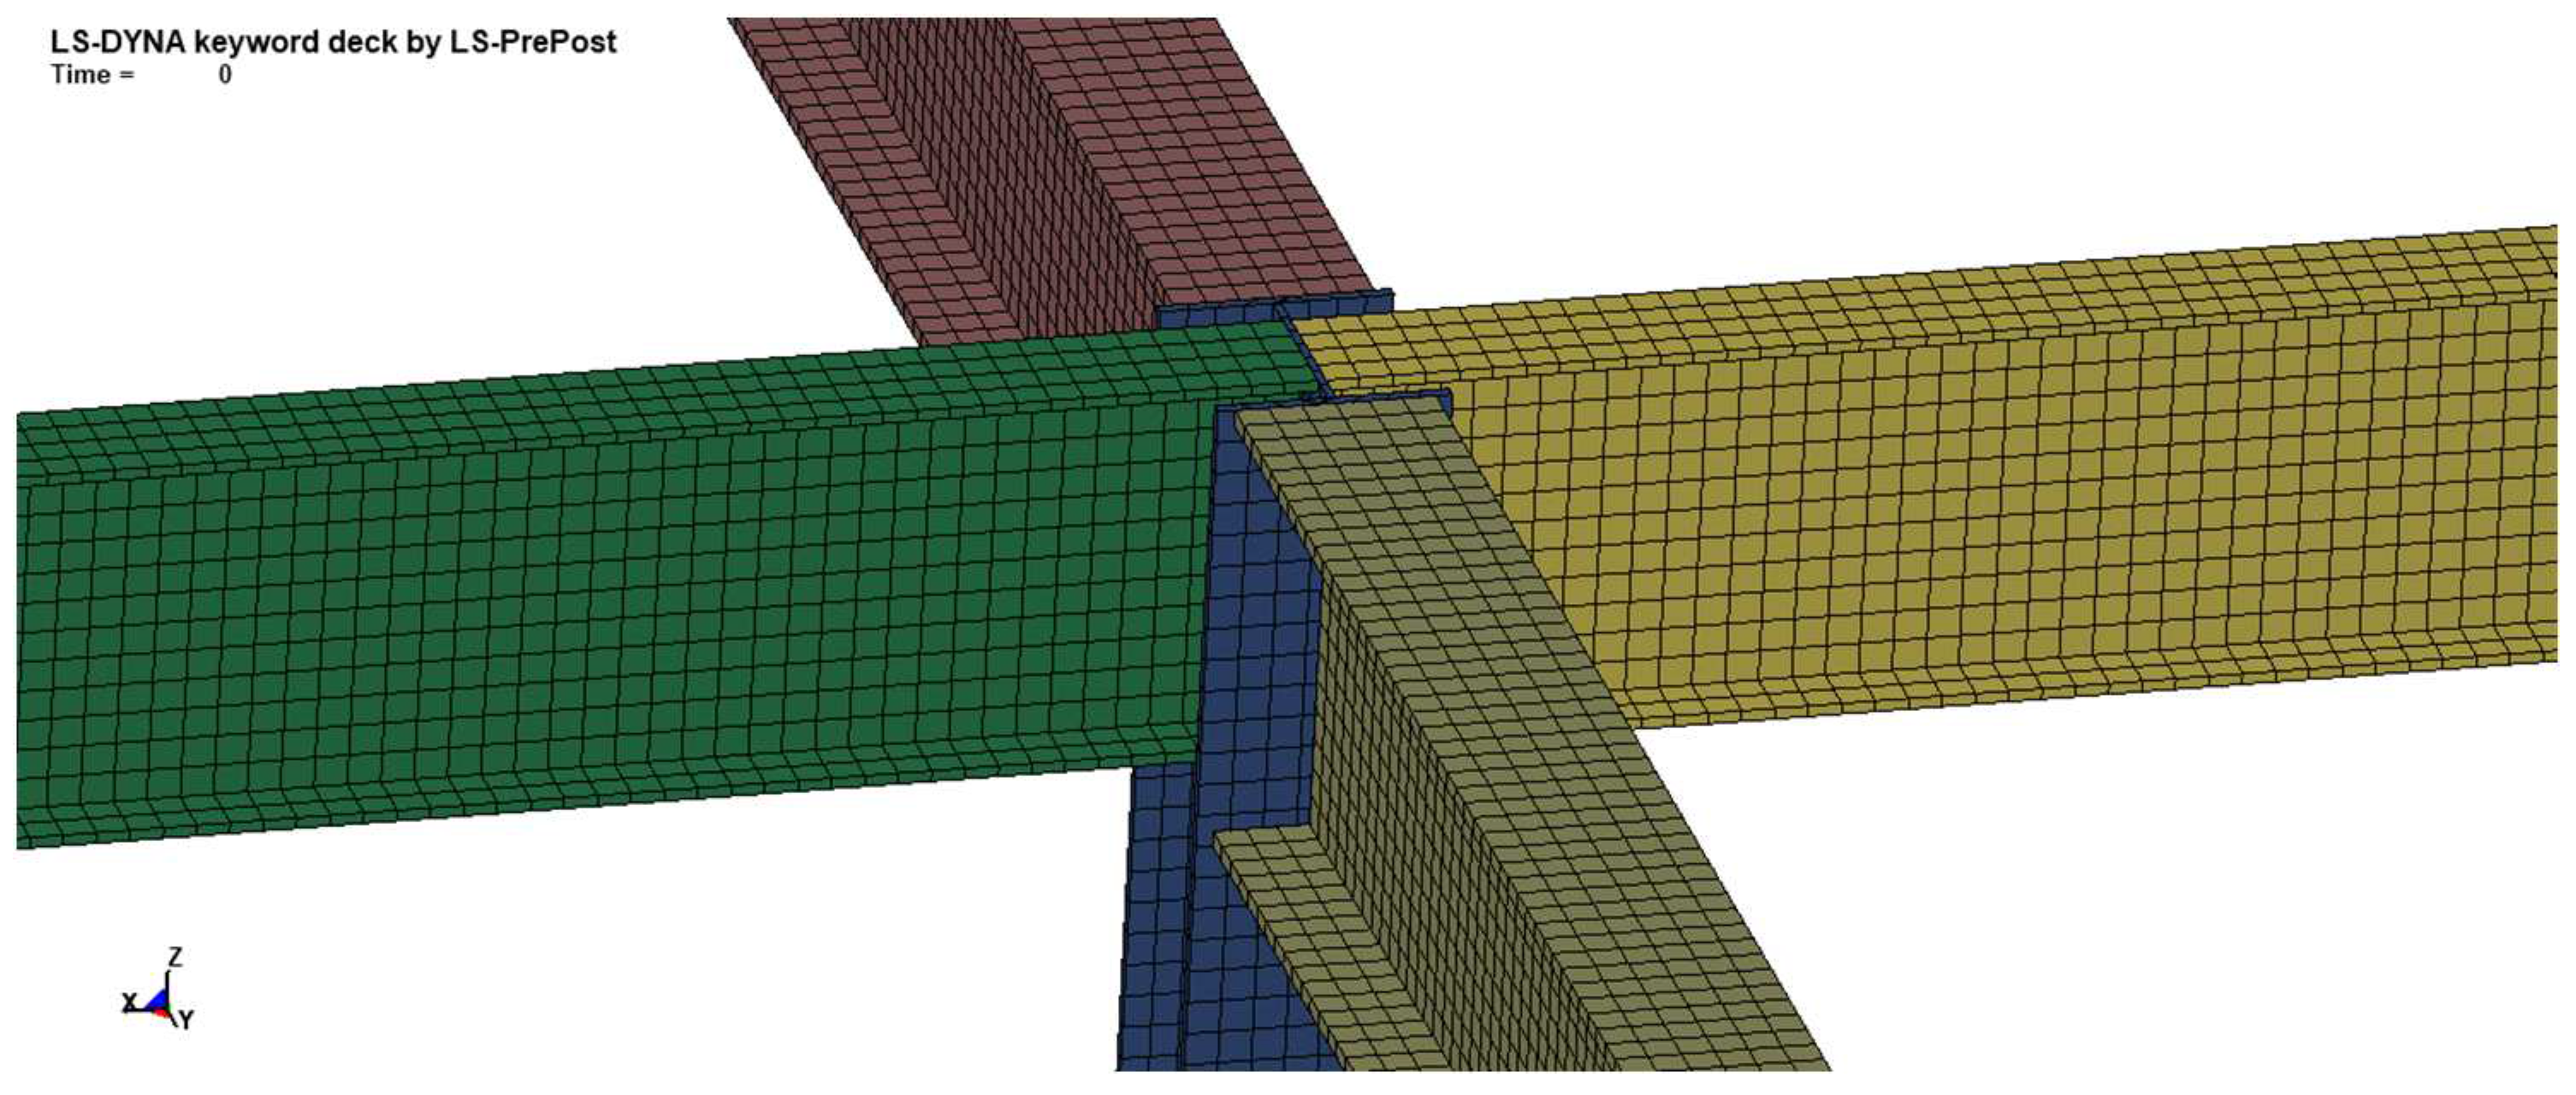
Figure 4, where all components of the structure are simulated by using solid units. Additionally, it should be noted that the model of the petrochemical control structure includes a perimeter of shear walls, strategically placed around the structure for enhanced stability and resistance to lateral forces. The connection node (welding or bolting) between the structural column and main beam is depicted in
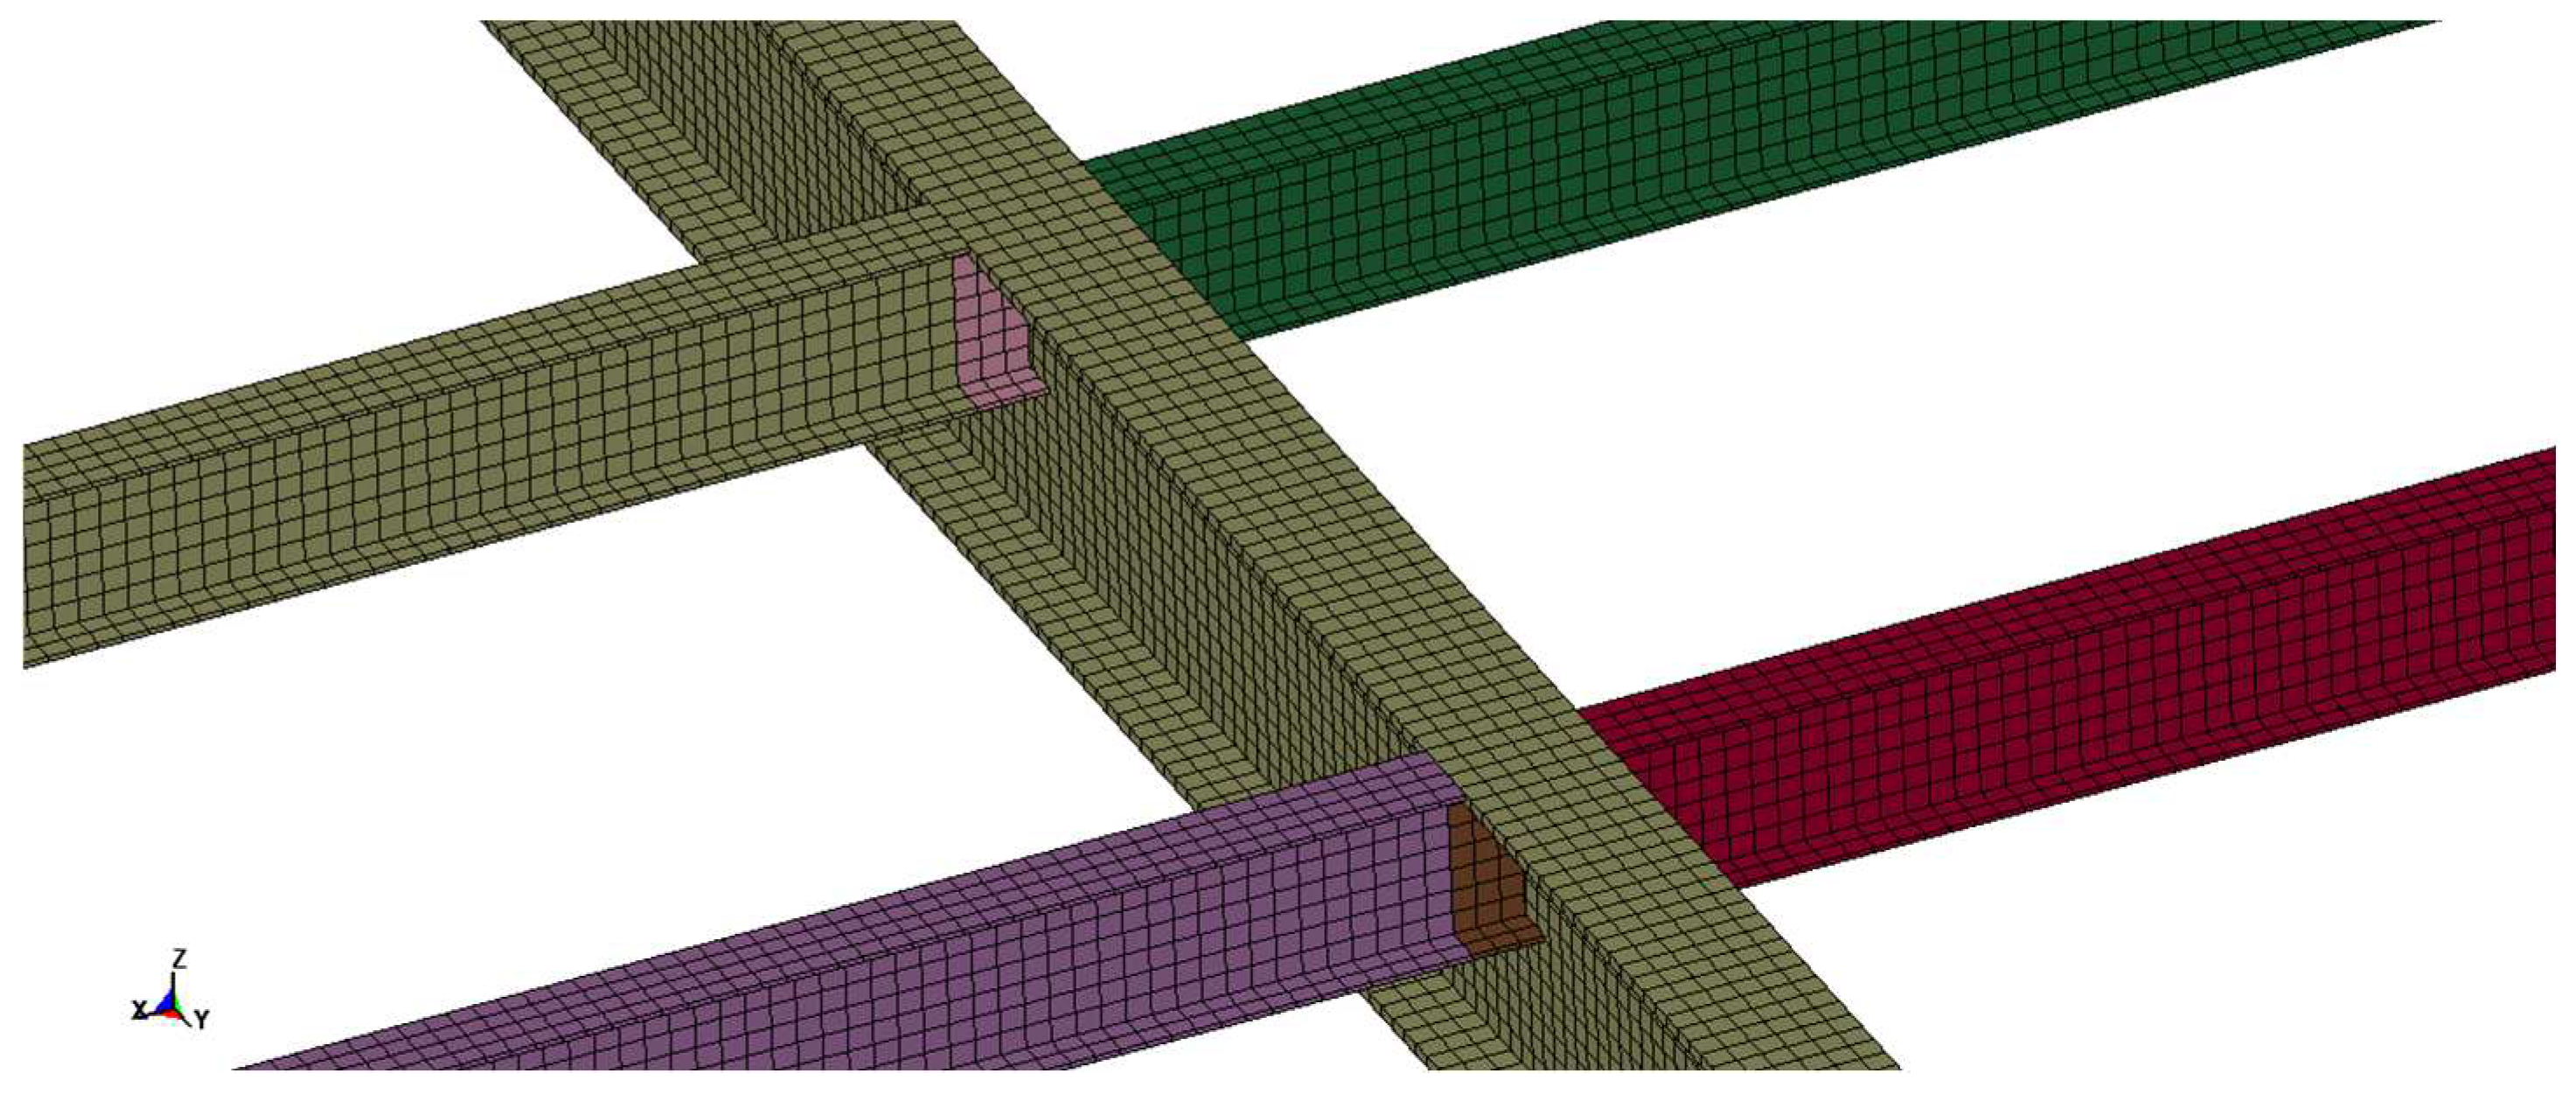
Figure 5, while the connection node between the main beam and secondary beam is shown in
Figure 6. In the simulation, the column foot condition is represented by fixed constraints, and all contact units are defined as "CONTACT AUTOMATIC SURFACE TO SURFACE".
Johnson and Cook (1983) [
33] proposed a concise model to characterize the plastic response of metals subjected to dynamic loading. The model establishes a relationship between the equivalent flow stress and the variables of strain, strain rate, and temperature. In this paper, the Johnson-Cook (J-C) material model and the GRUNEISEN state equation are used for the structure, and the yield stress of the structural steel is calculated according to the Eq.(4) [
33]
where
A is the baseline yield strength,
B is the hardening factor of the yield strength,
n is the hardening exponent,
is the effective plastic strain,
is the strain rate,
C1 is the strain rate sensitivity coefficient,
is the reference temperature, and
M is the temperature dependency index.
Johnson and Cook (1985) [
34] expanded their basic model based on cumulative-damage, and the LS-DYNA implementation of the Johnson-Cook constitutive model includes this additional model feature. For the J-C failure model, the failure criterion is defined as
where
is the failure strain,
P is the stress,
is the effective stress,
is the plastic strain rate, and
,
,
,
,
are the material parameters.
The GRUNEISEN state equation is described by [
30]
where
p is pressure,
m is the compression ratio,
is the initial material density,
Cs is the speed of sound,
g0 is the Gruneisen parameter, α is the correction factor,
is the internal energy, and
,
,
are the parameters of the state equation.
The parameters of the J-C model and the GRUNEISEN state equation are shown in
Table 2 and
Table 3:
Avoiding the low efficiency of the traditional Arbitrary Lagrangian-Eulerian(ALE) algorithm for solving fluid-structure coupled problems, the CONWEP blast load model is used in which the blast load is calculated by defining the TNT charge, explosion surface, explosion location, explosion time and explosion pattern.
6. Conclusions
In this paper, it focuses on studying the blast resistant performance of control room subjected to vapor cloud explosion load in the petrochemical industry. The blast-resistant performance of the steel control room with an assembled 3D-Kagome sandwich blast-resistant wall is investigated using the finite element analysis method. The study includes numerical modeling of the control room structure, optimal blast-resistant design of the 3D-Kagome sandwich blast-resistant wall, and dynamic response analysis of the control room structure. The simulation results show that:
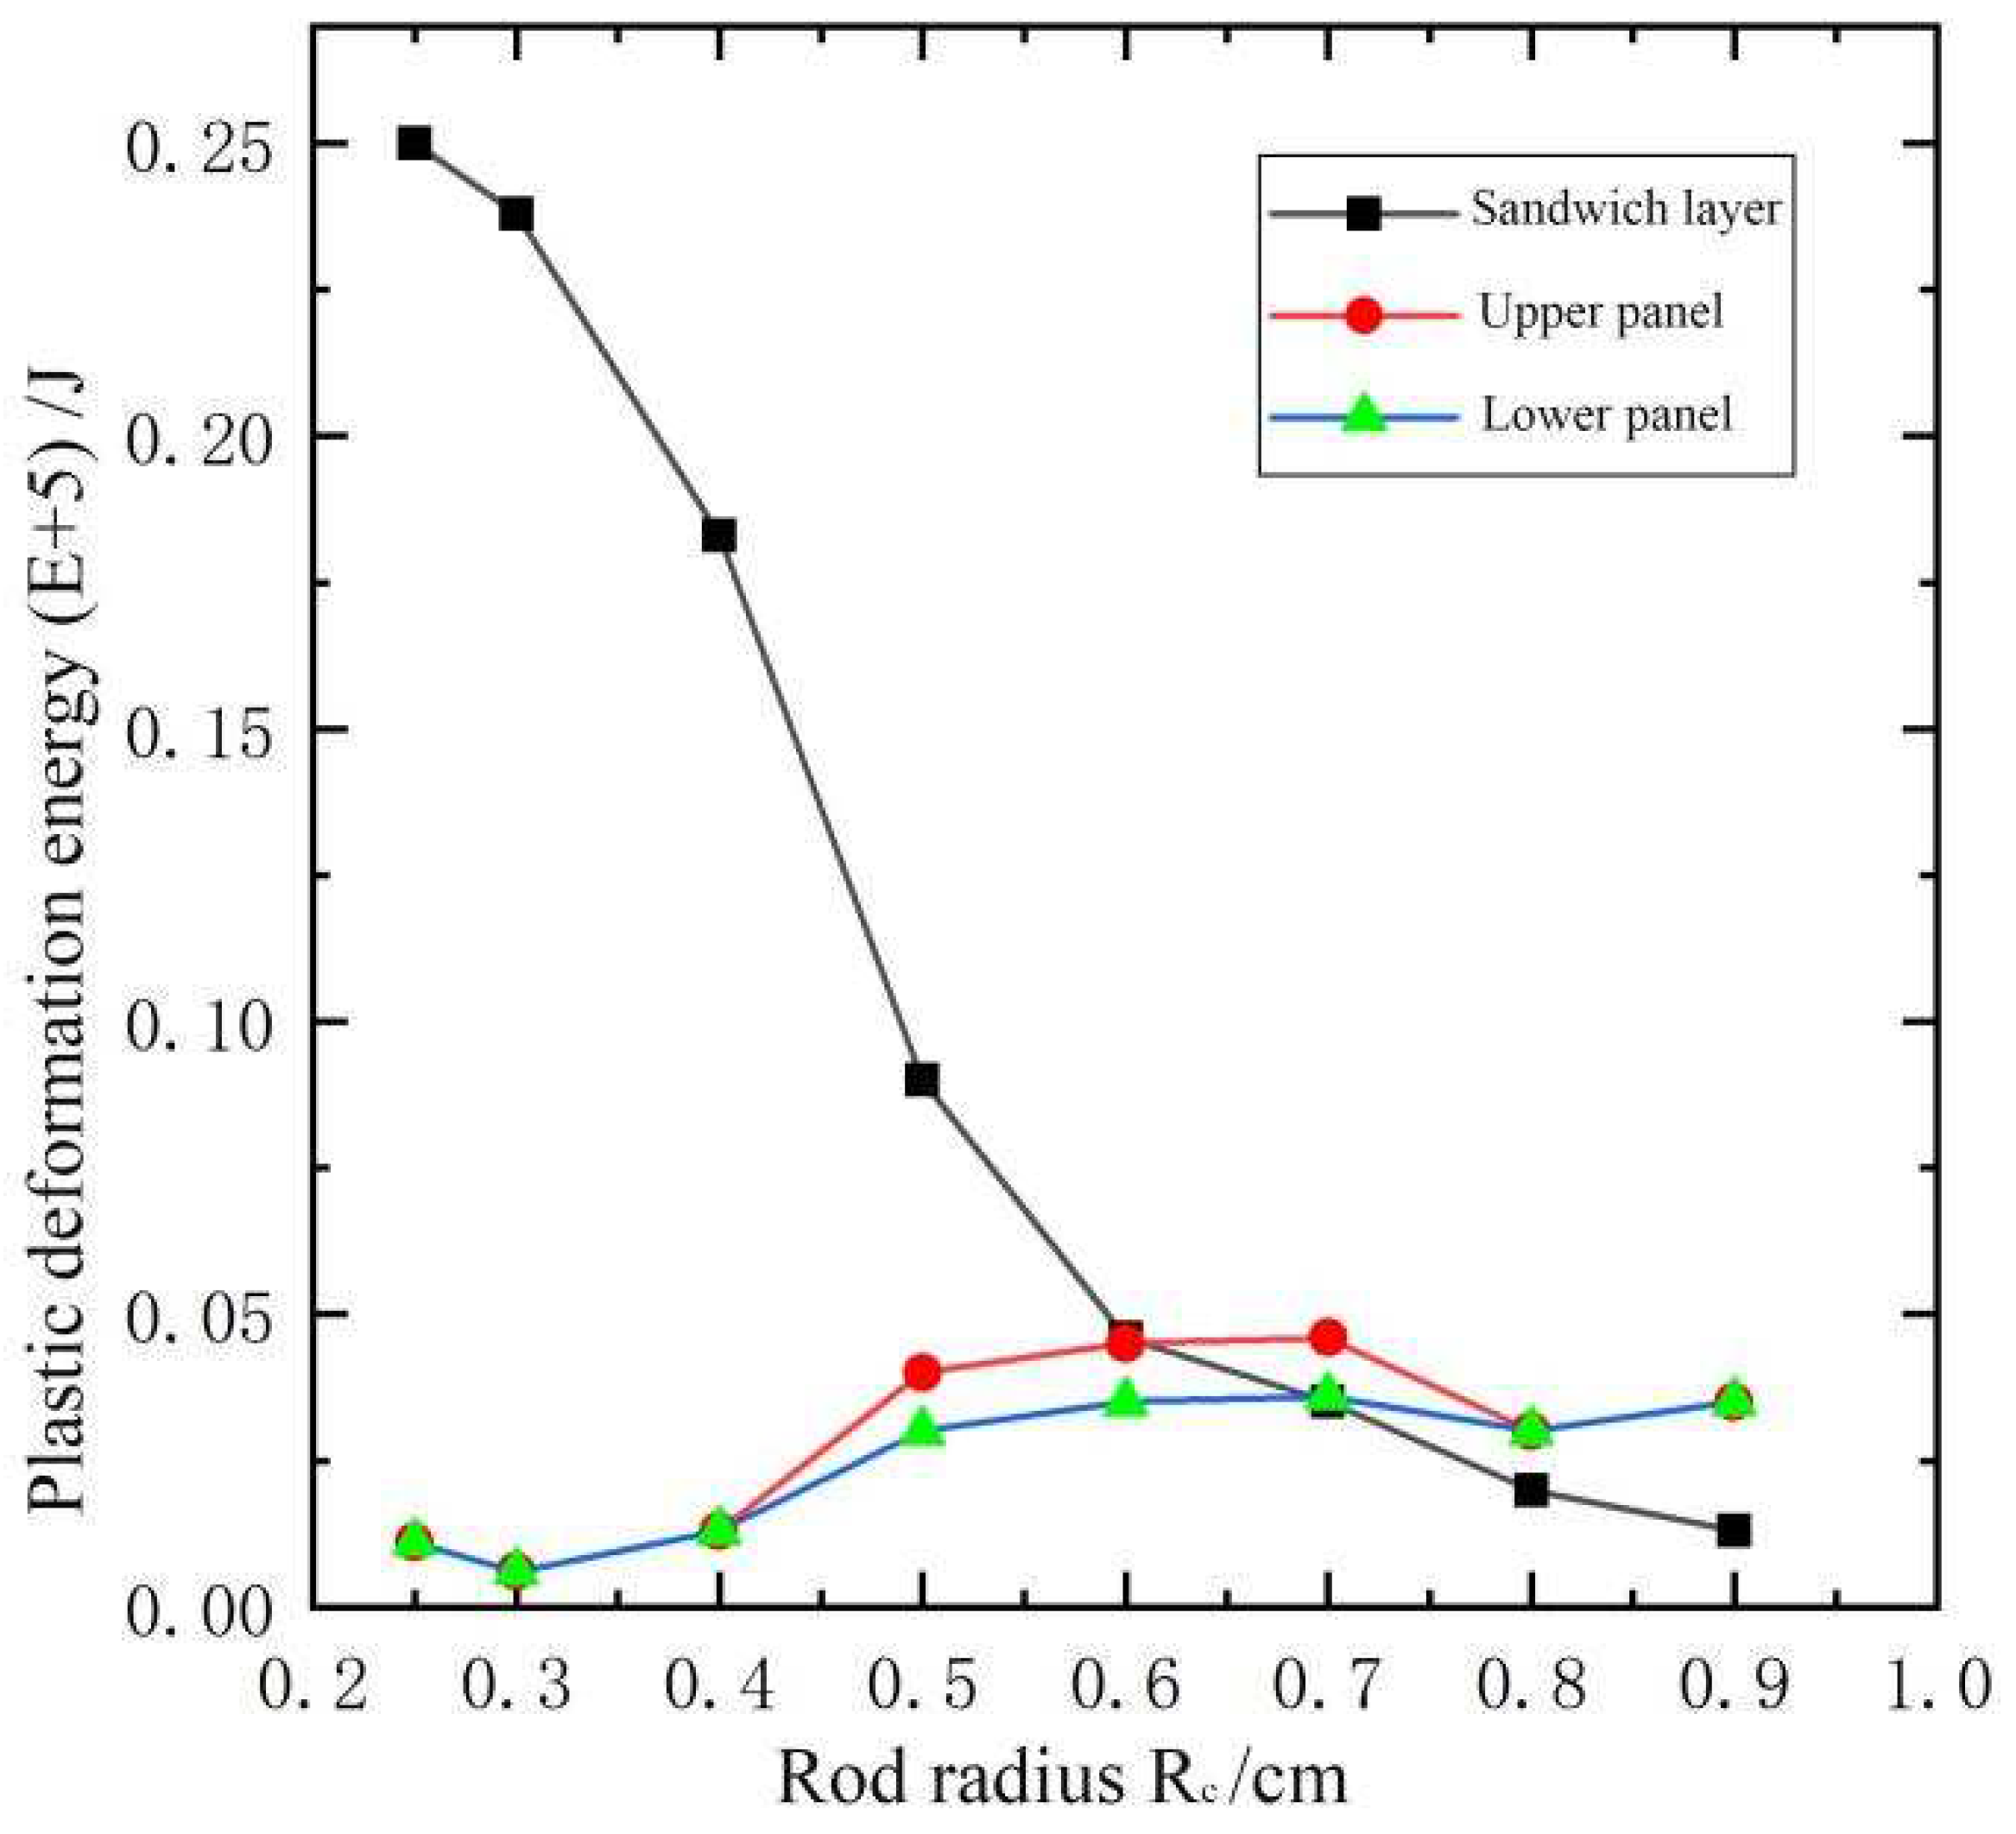
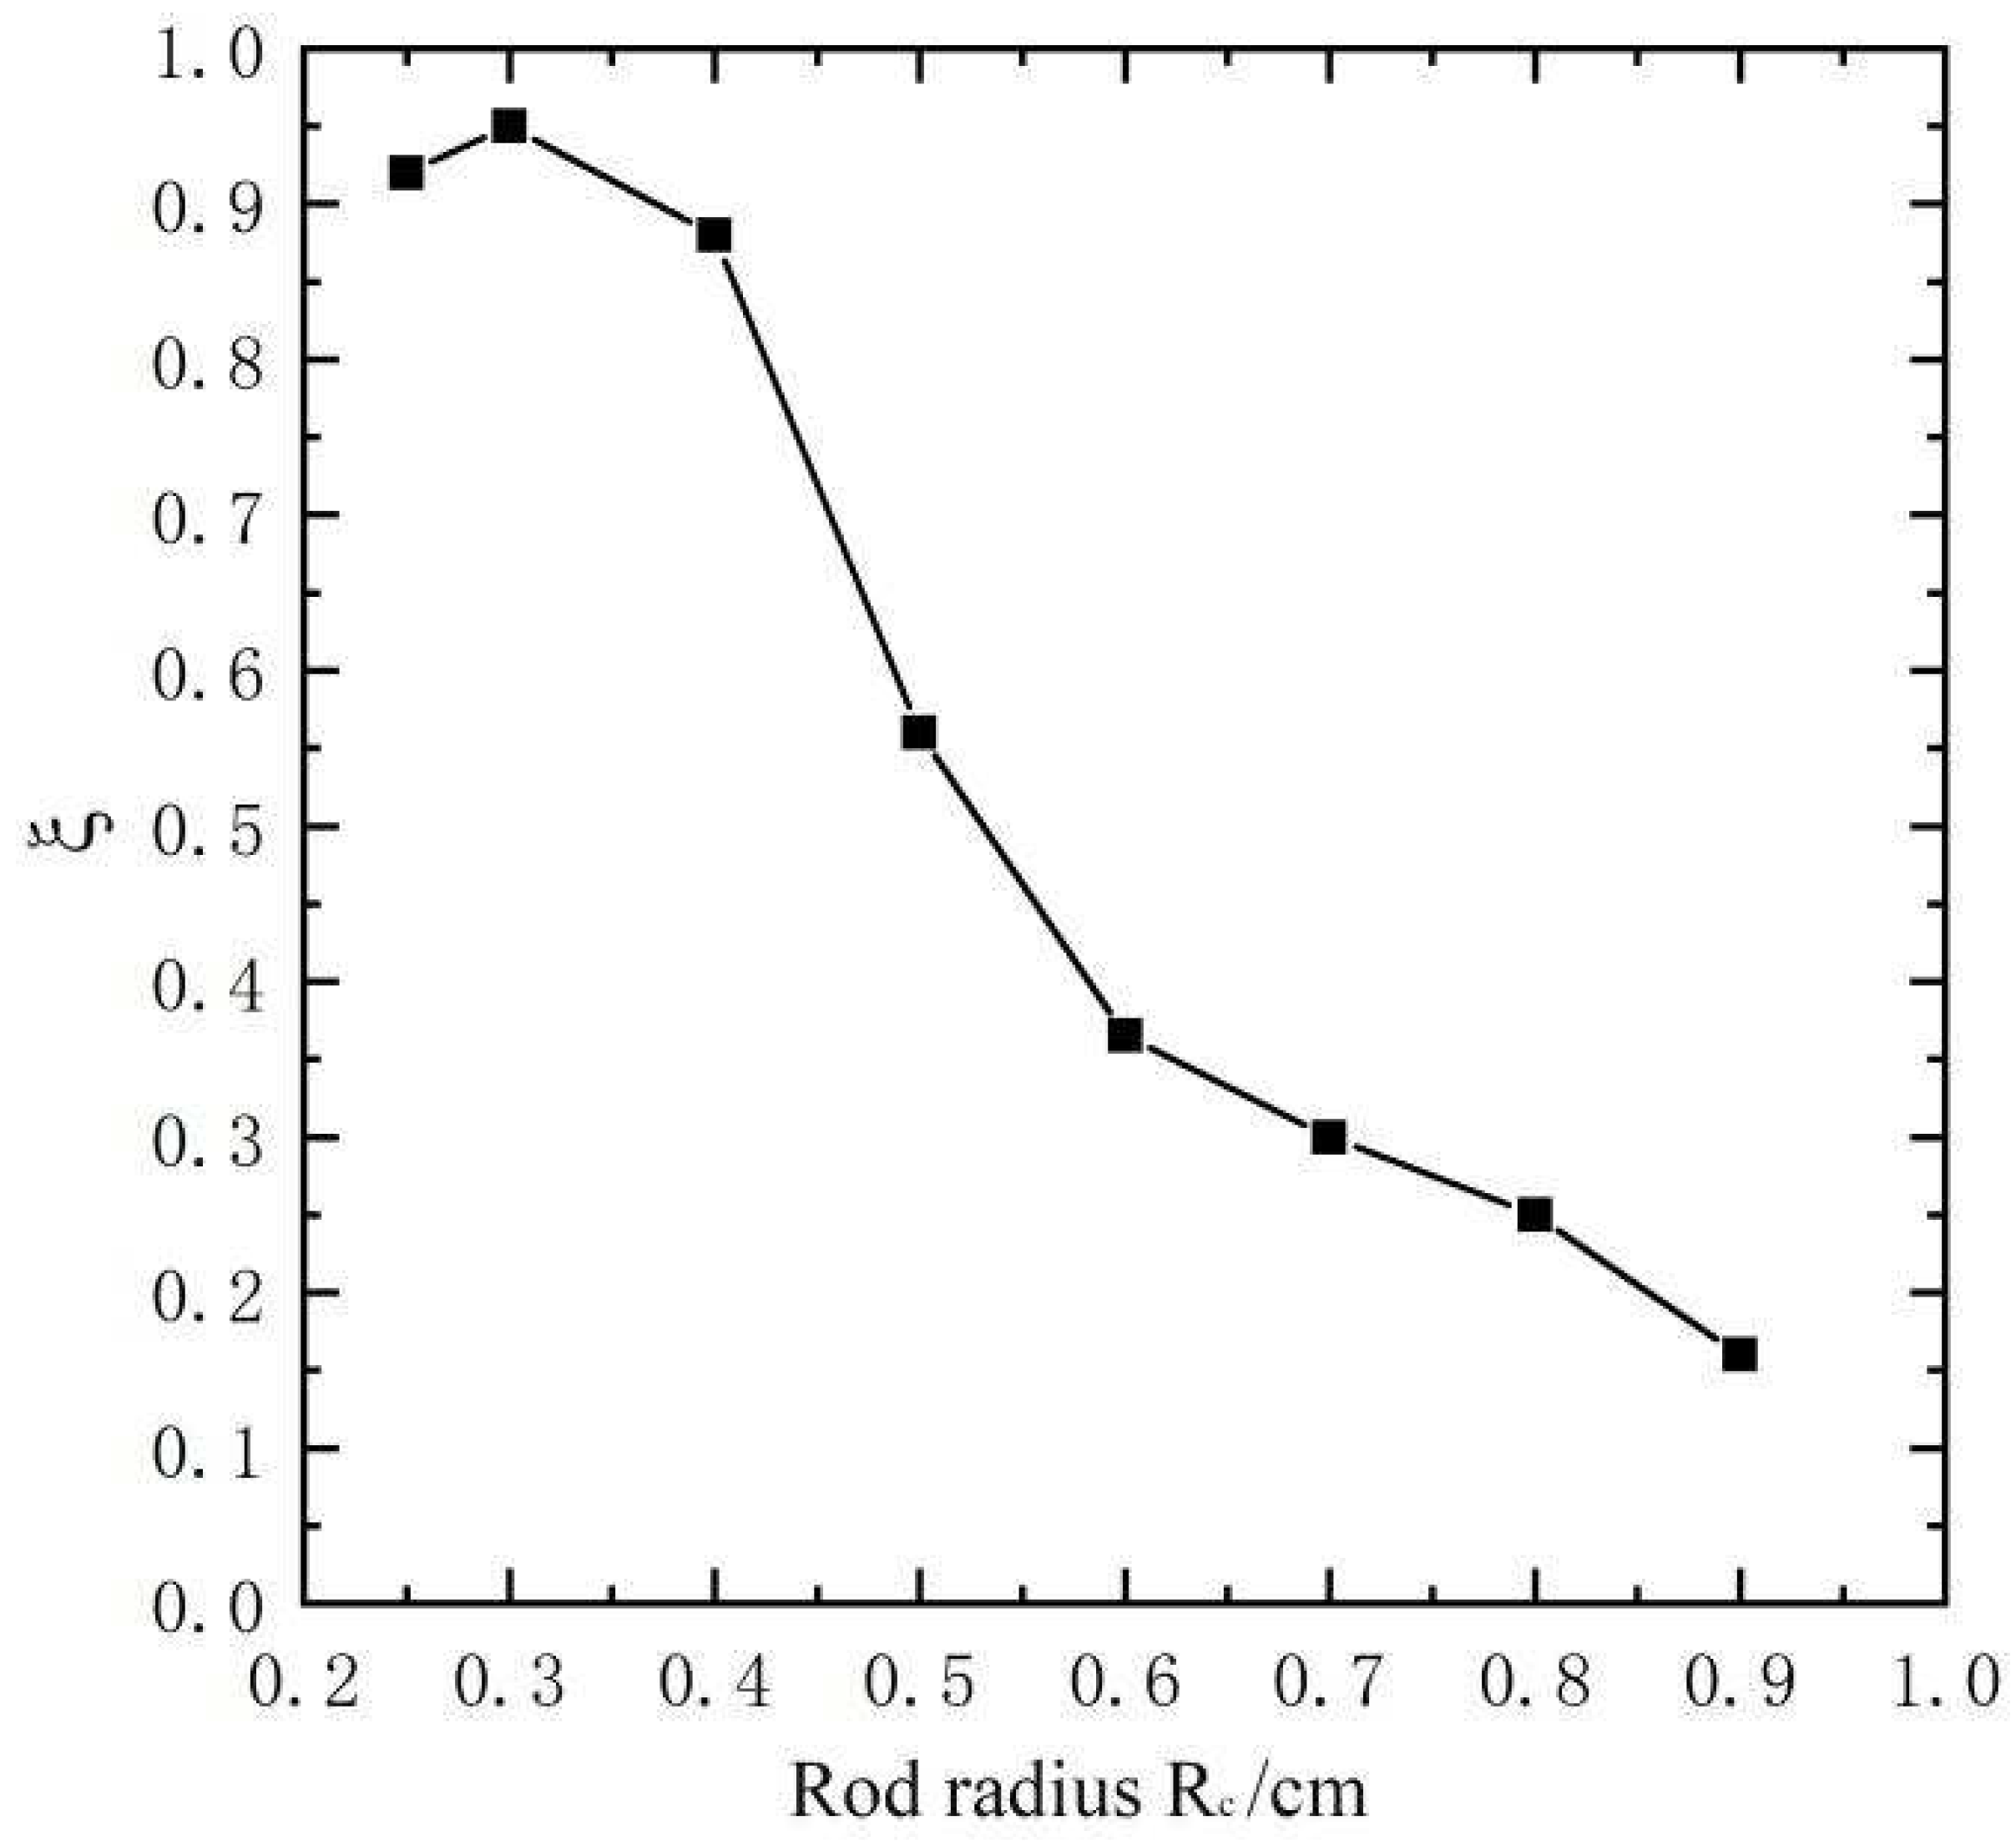
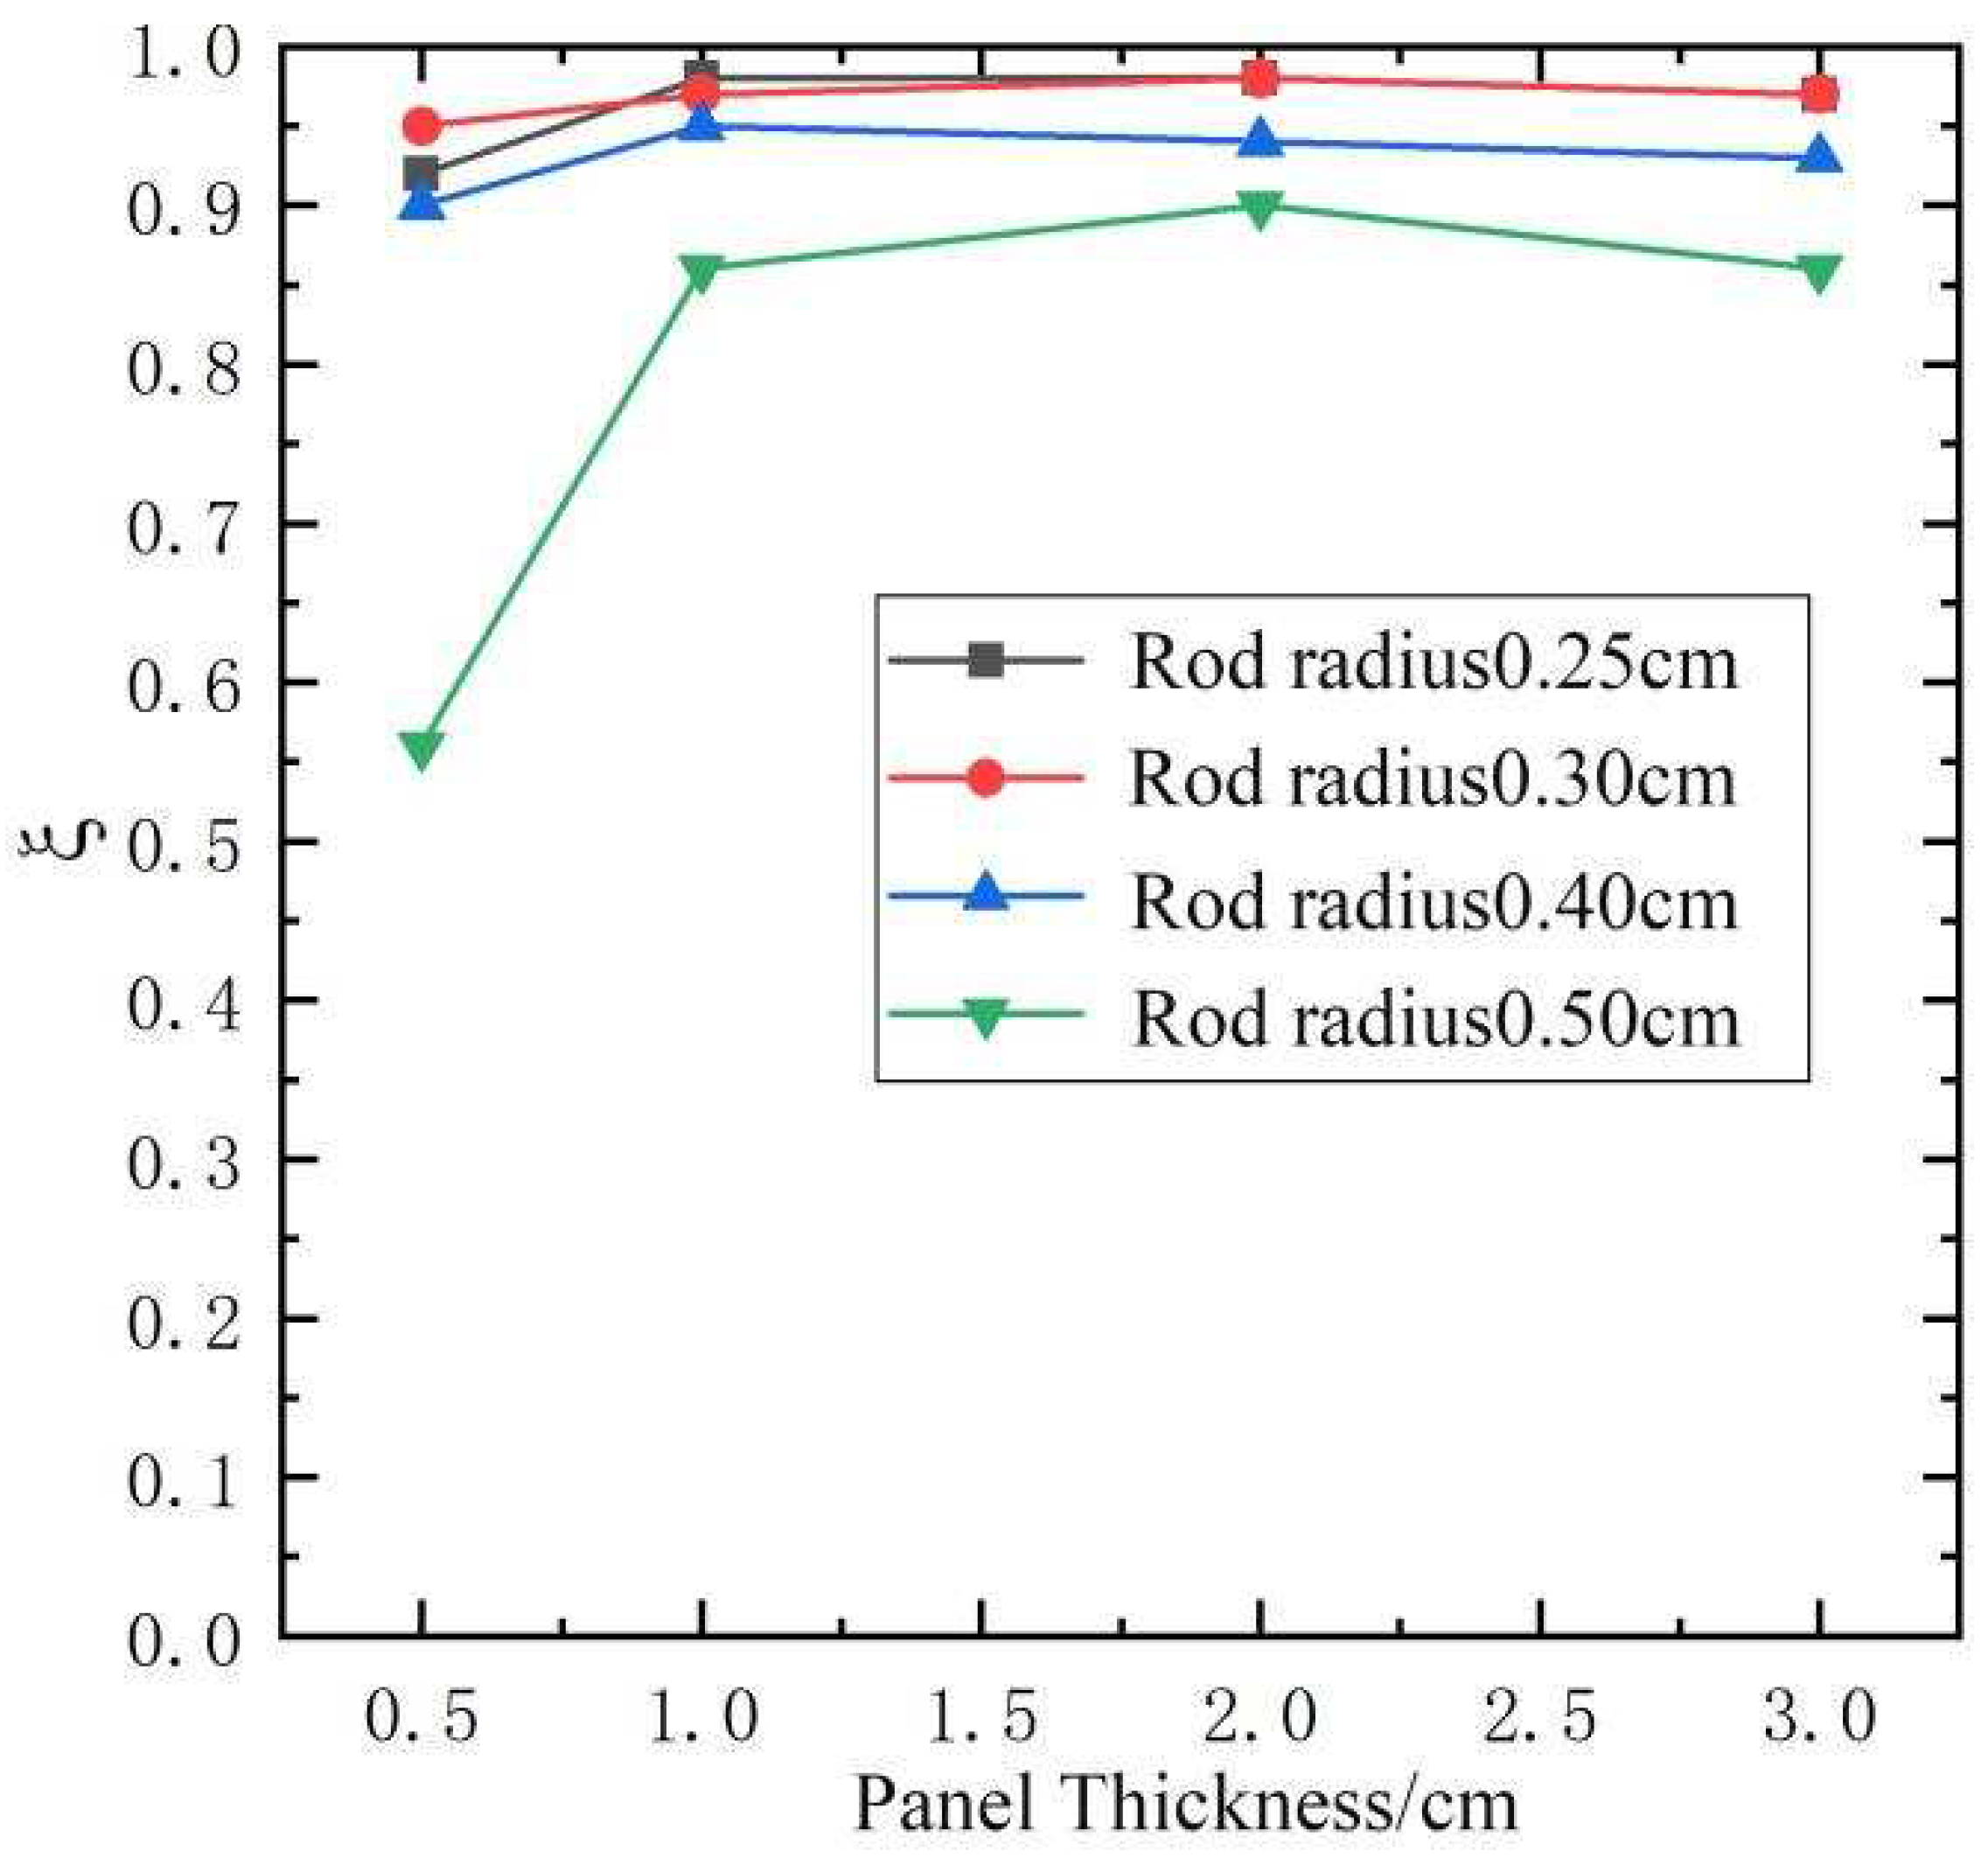
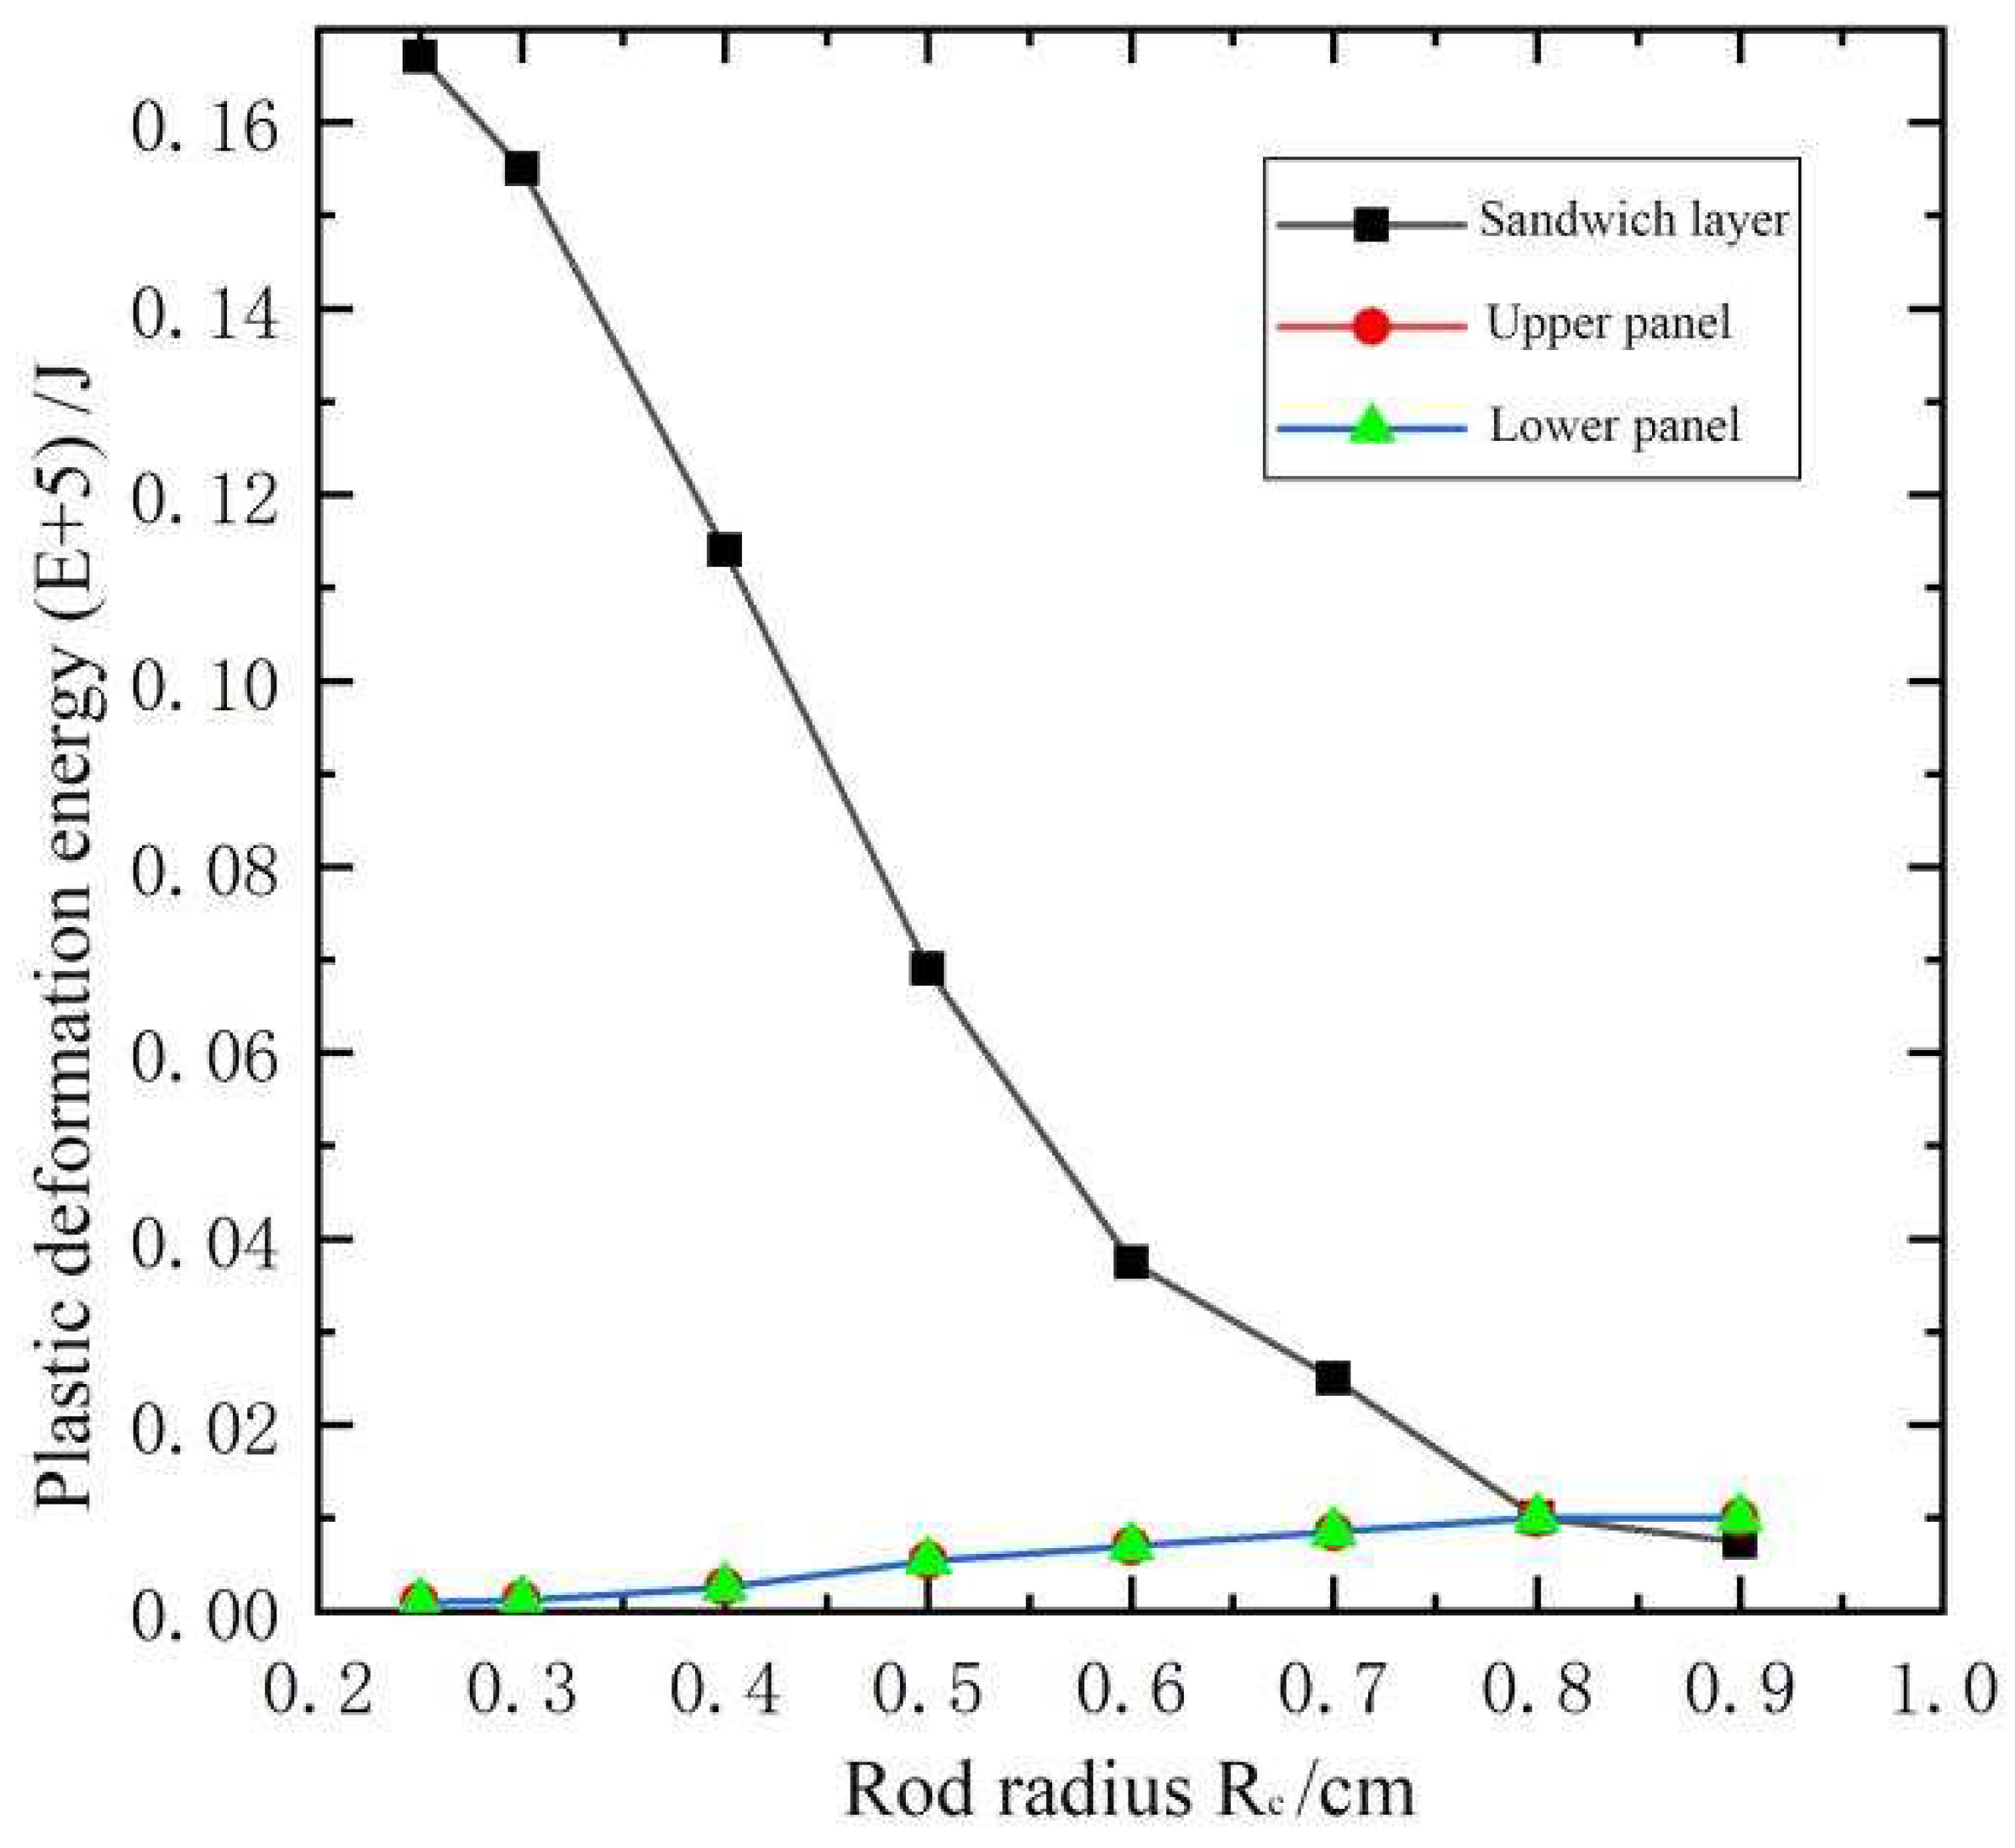
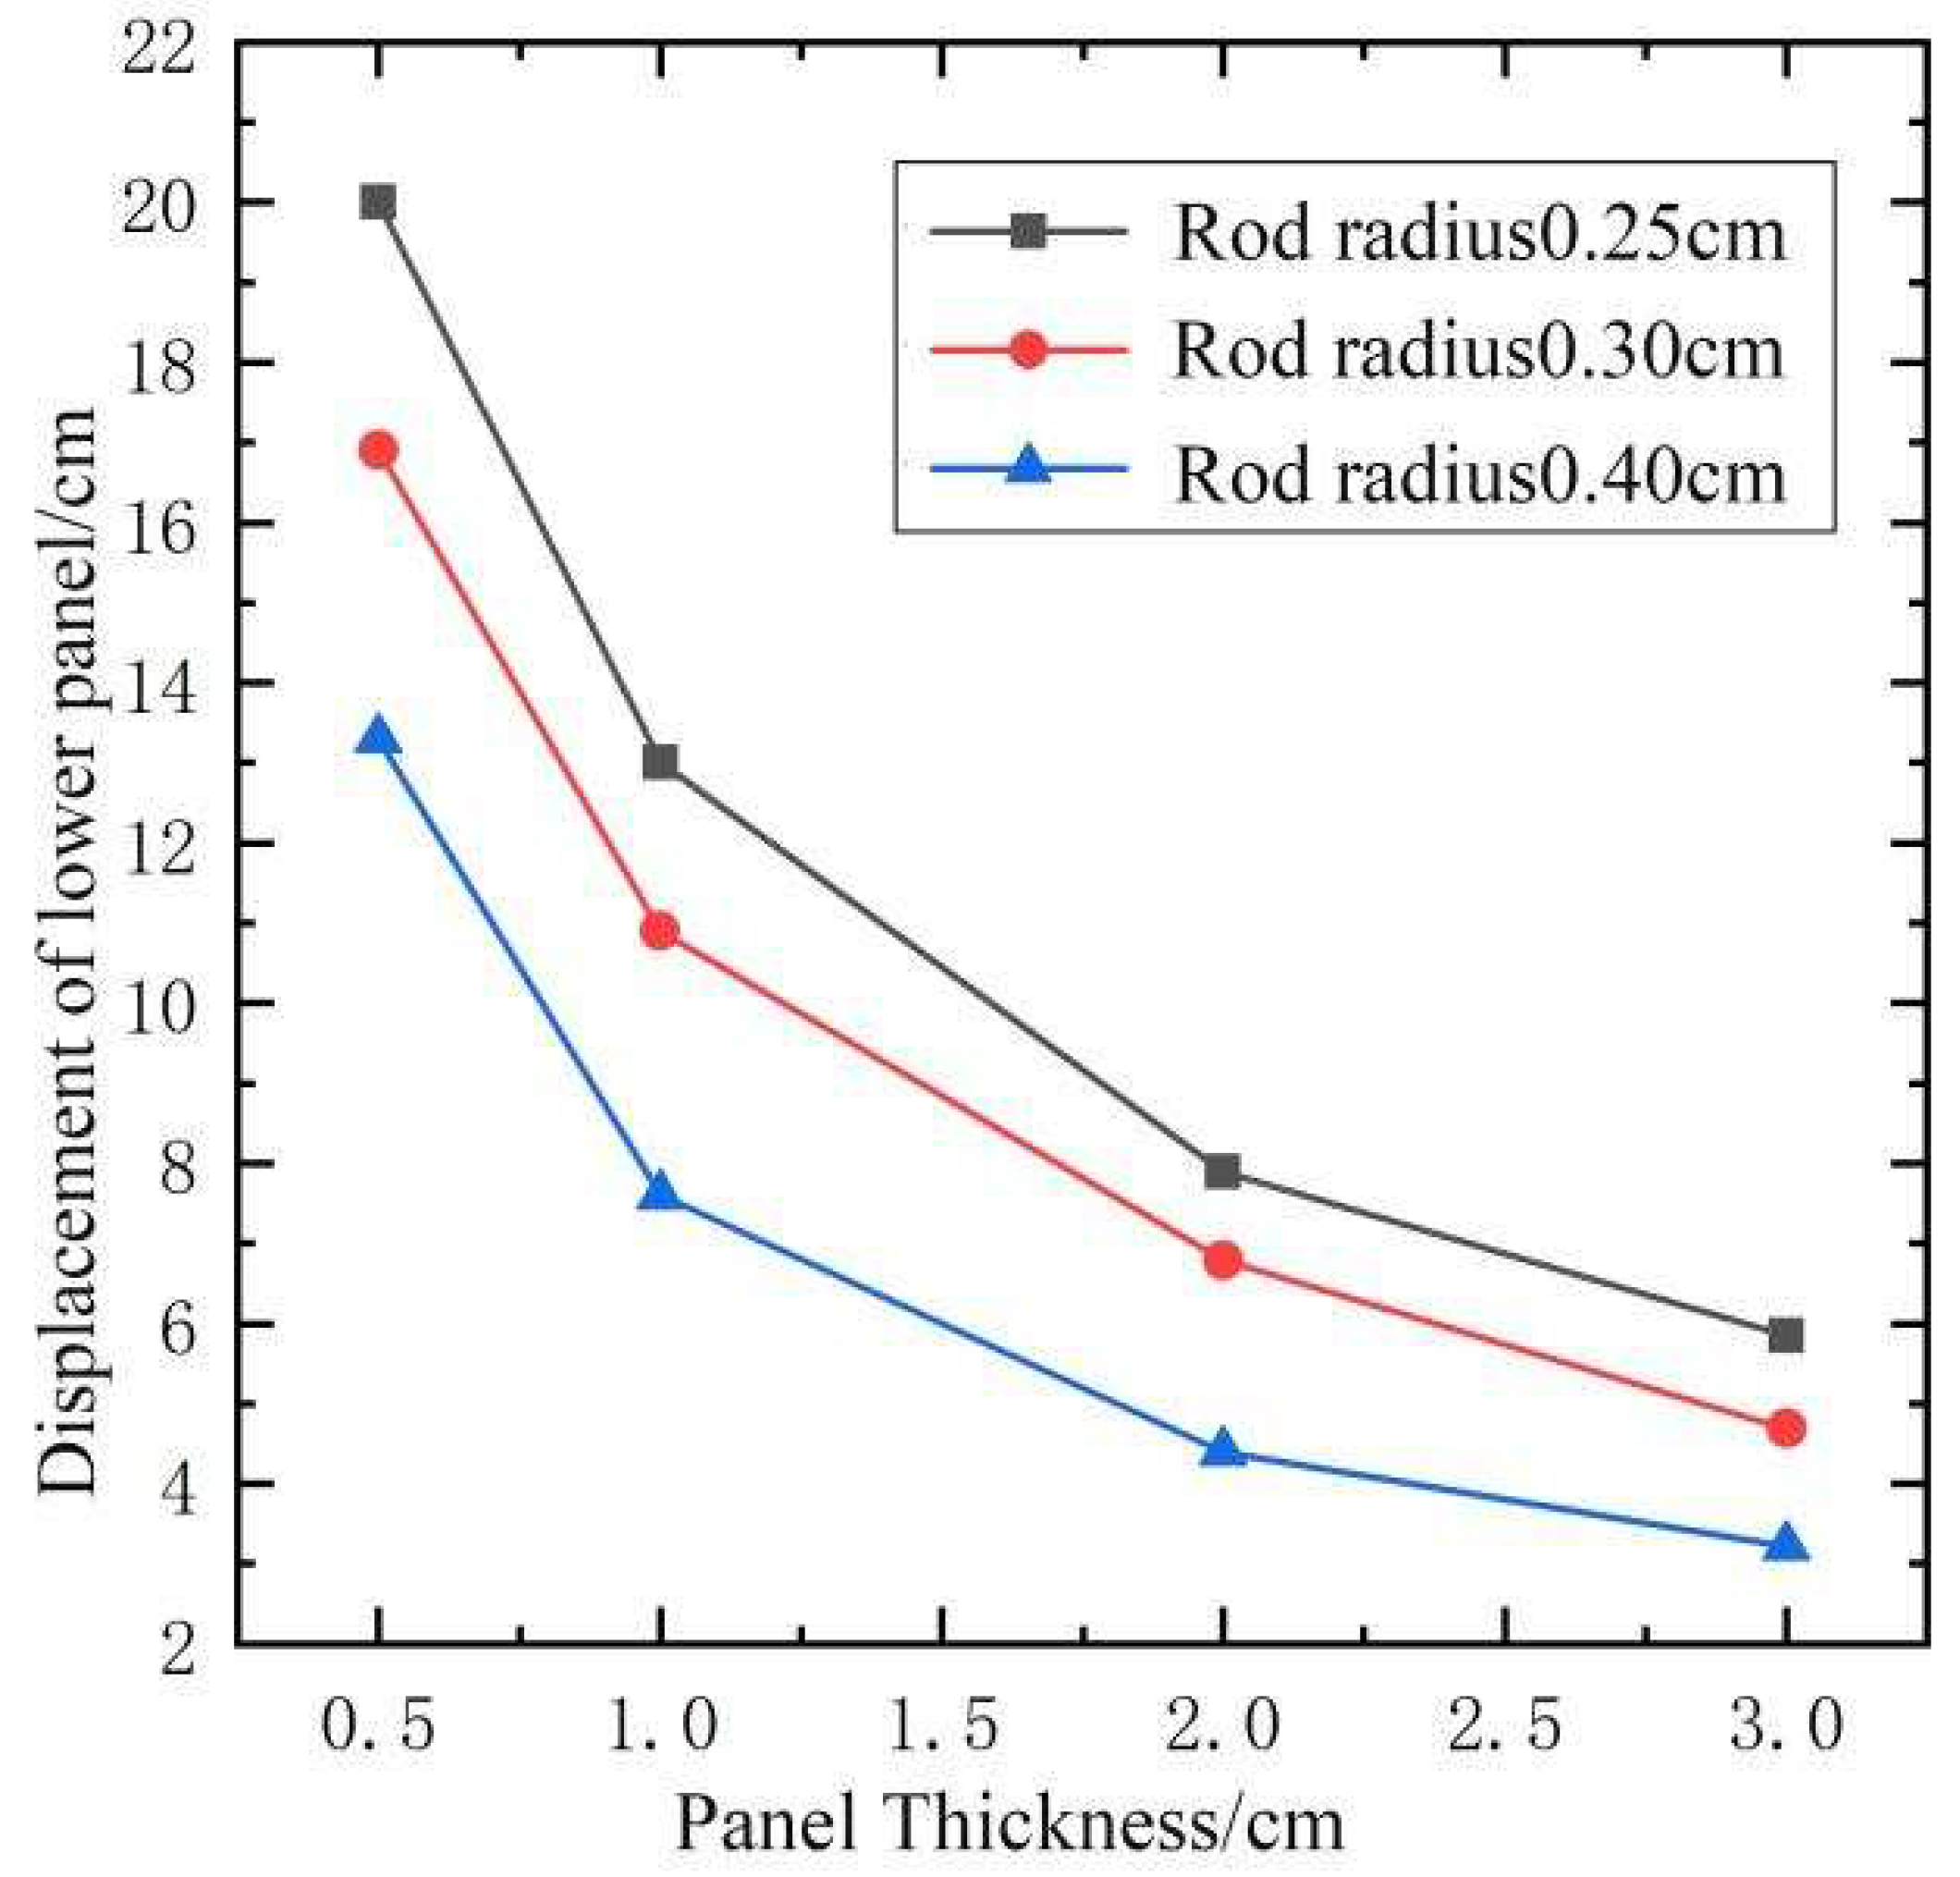
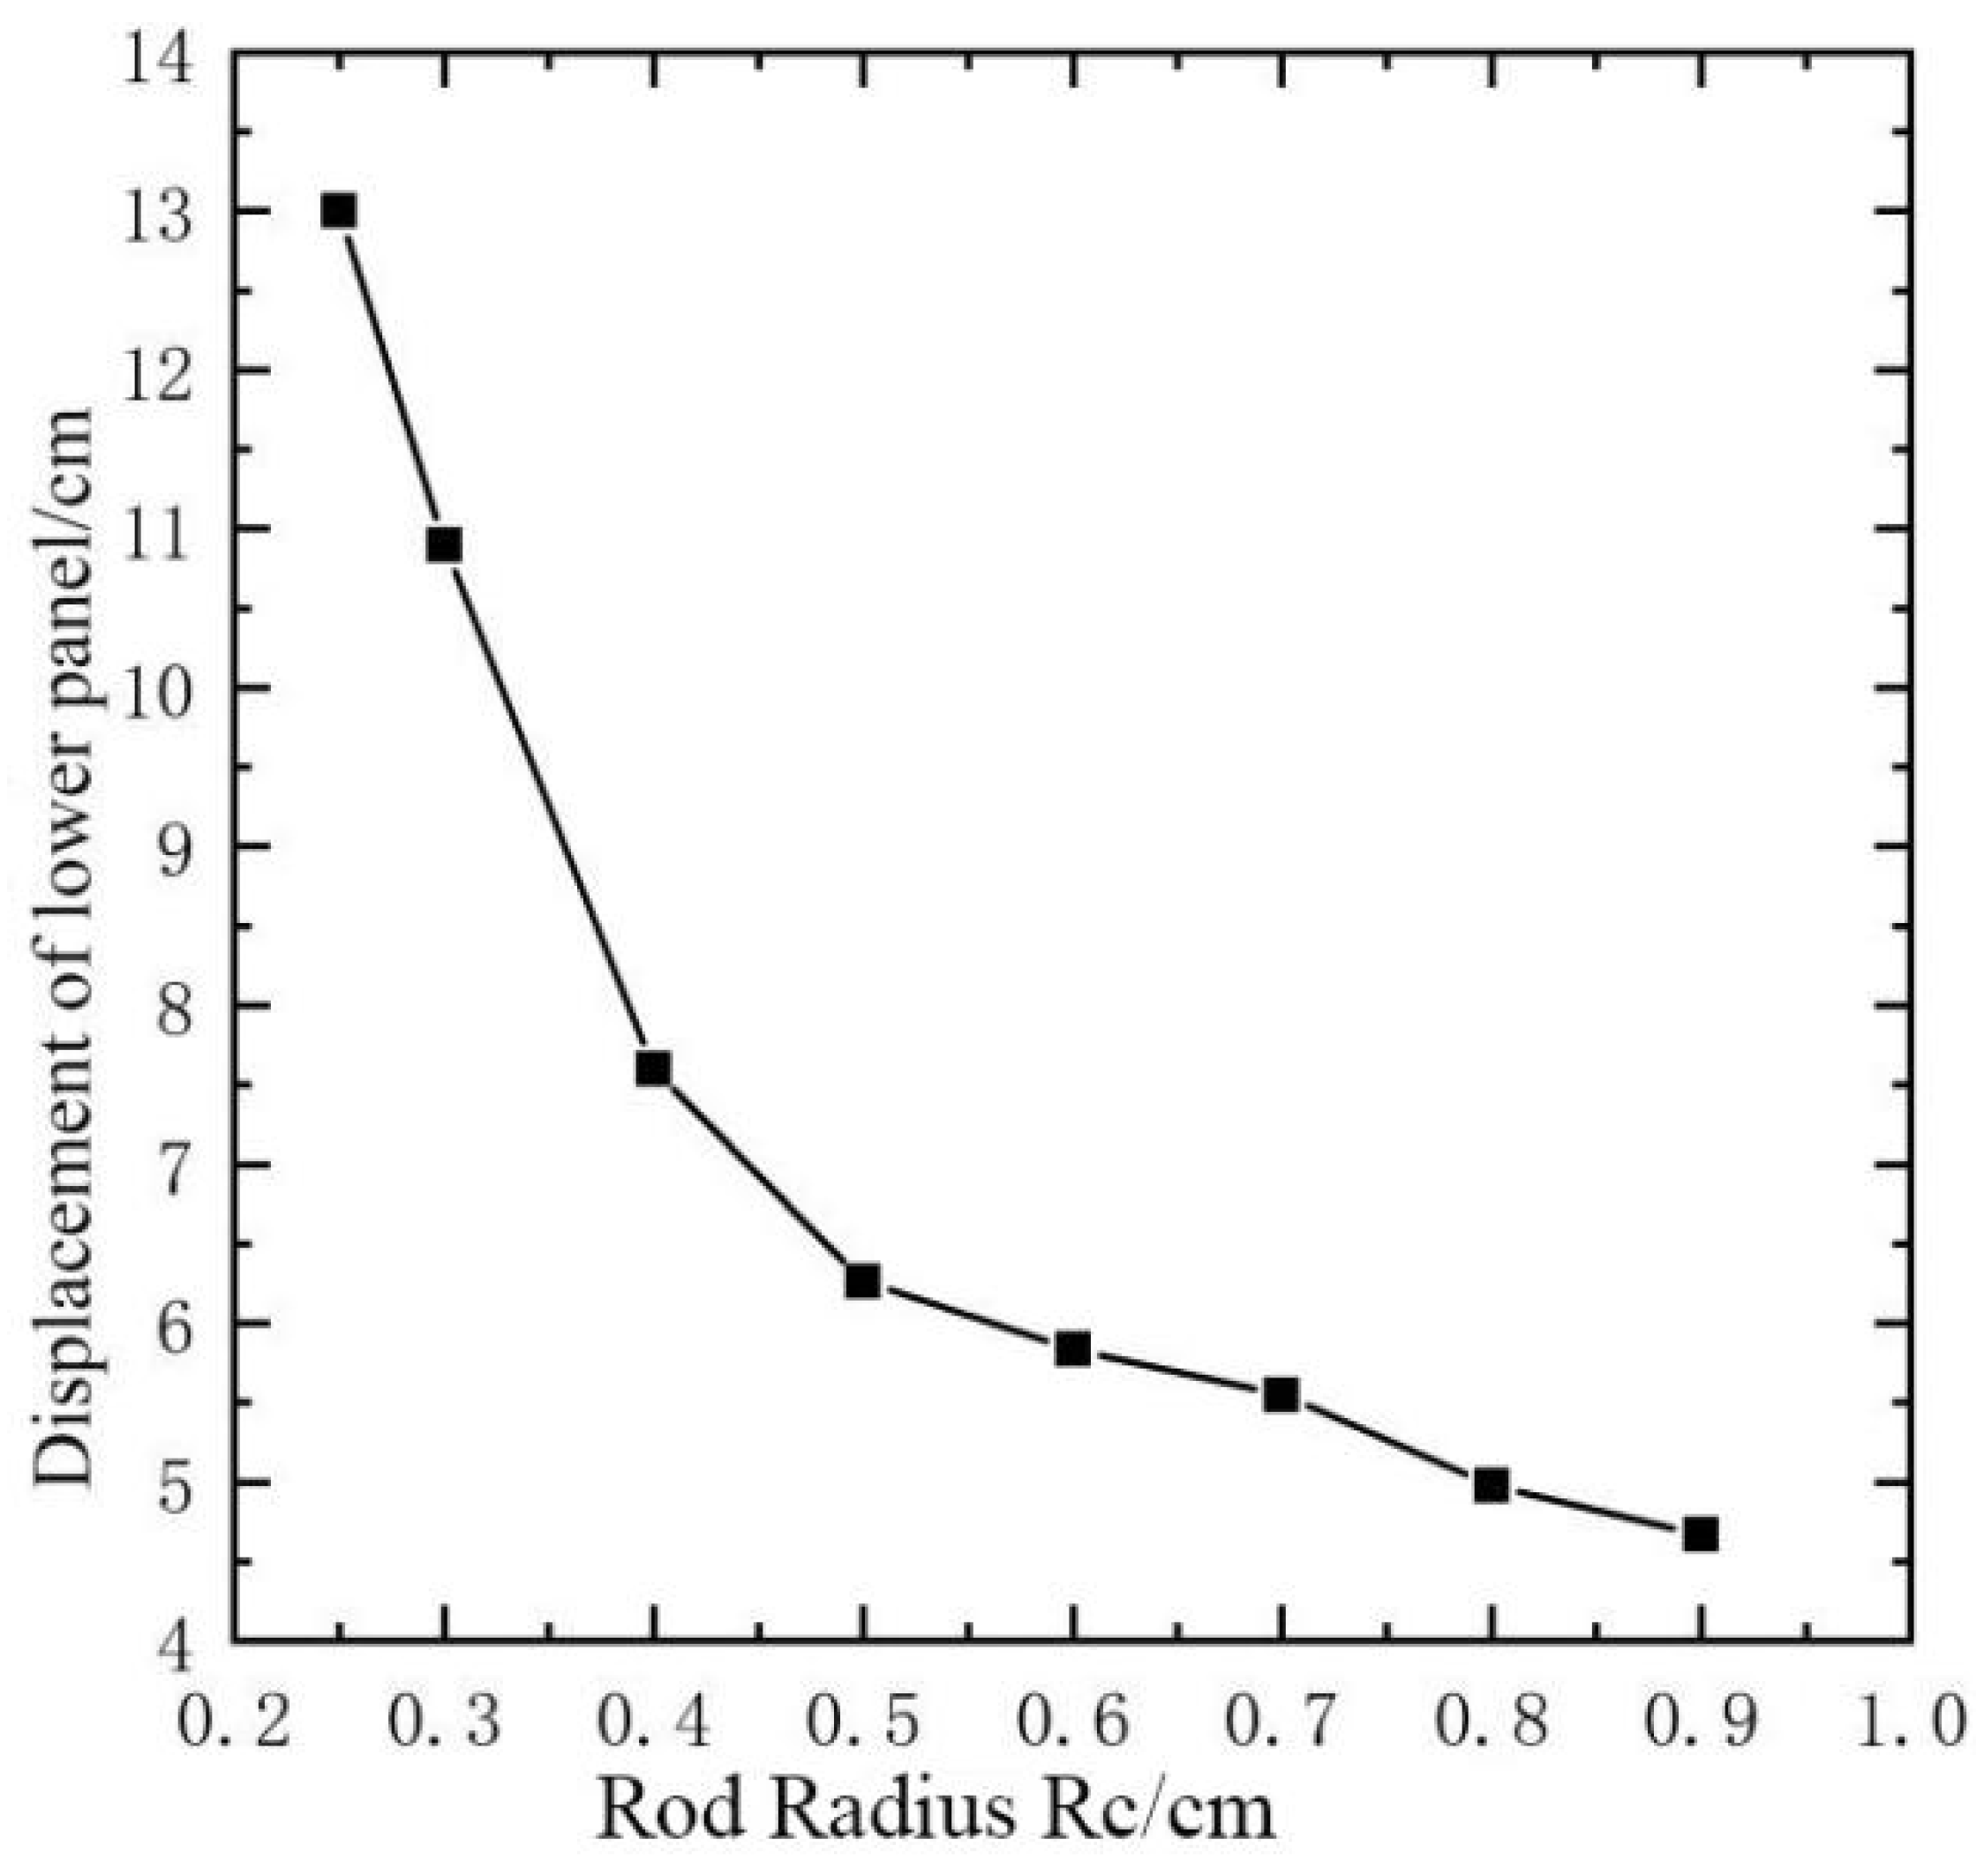
1. Increasing the diameter of the core layer rods leads to a continuous decrease in plastic deformation energy of the core layer, while the one of the upper and lower panels continue to increase. When the rod radius is too large, the upper and lower panels become the main energy-absorbing components of the sandwich blast-resistant wall. Increasing the thickness of the upper and lower panels initially improves plastic deformation energy of the core layer. The plastic deformation energy of the core layer accounts for approximately 90% of the total, indicating that excessively thick panel thickness does not significantly enhance the blast resistant performance of the sandwich wall.
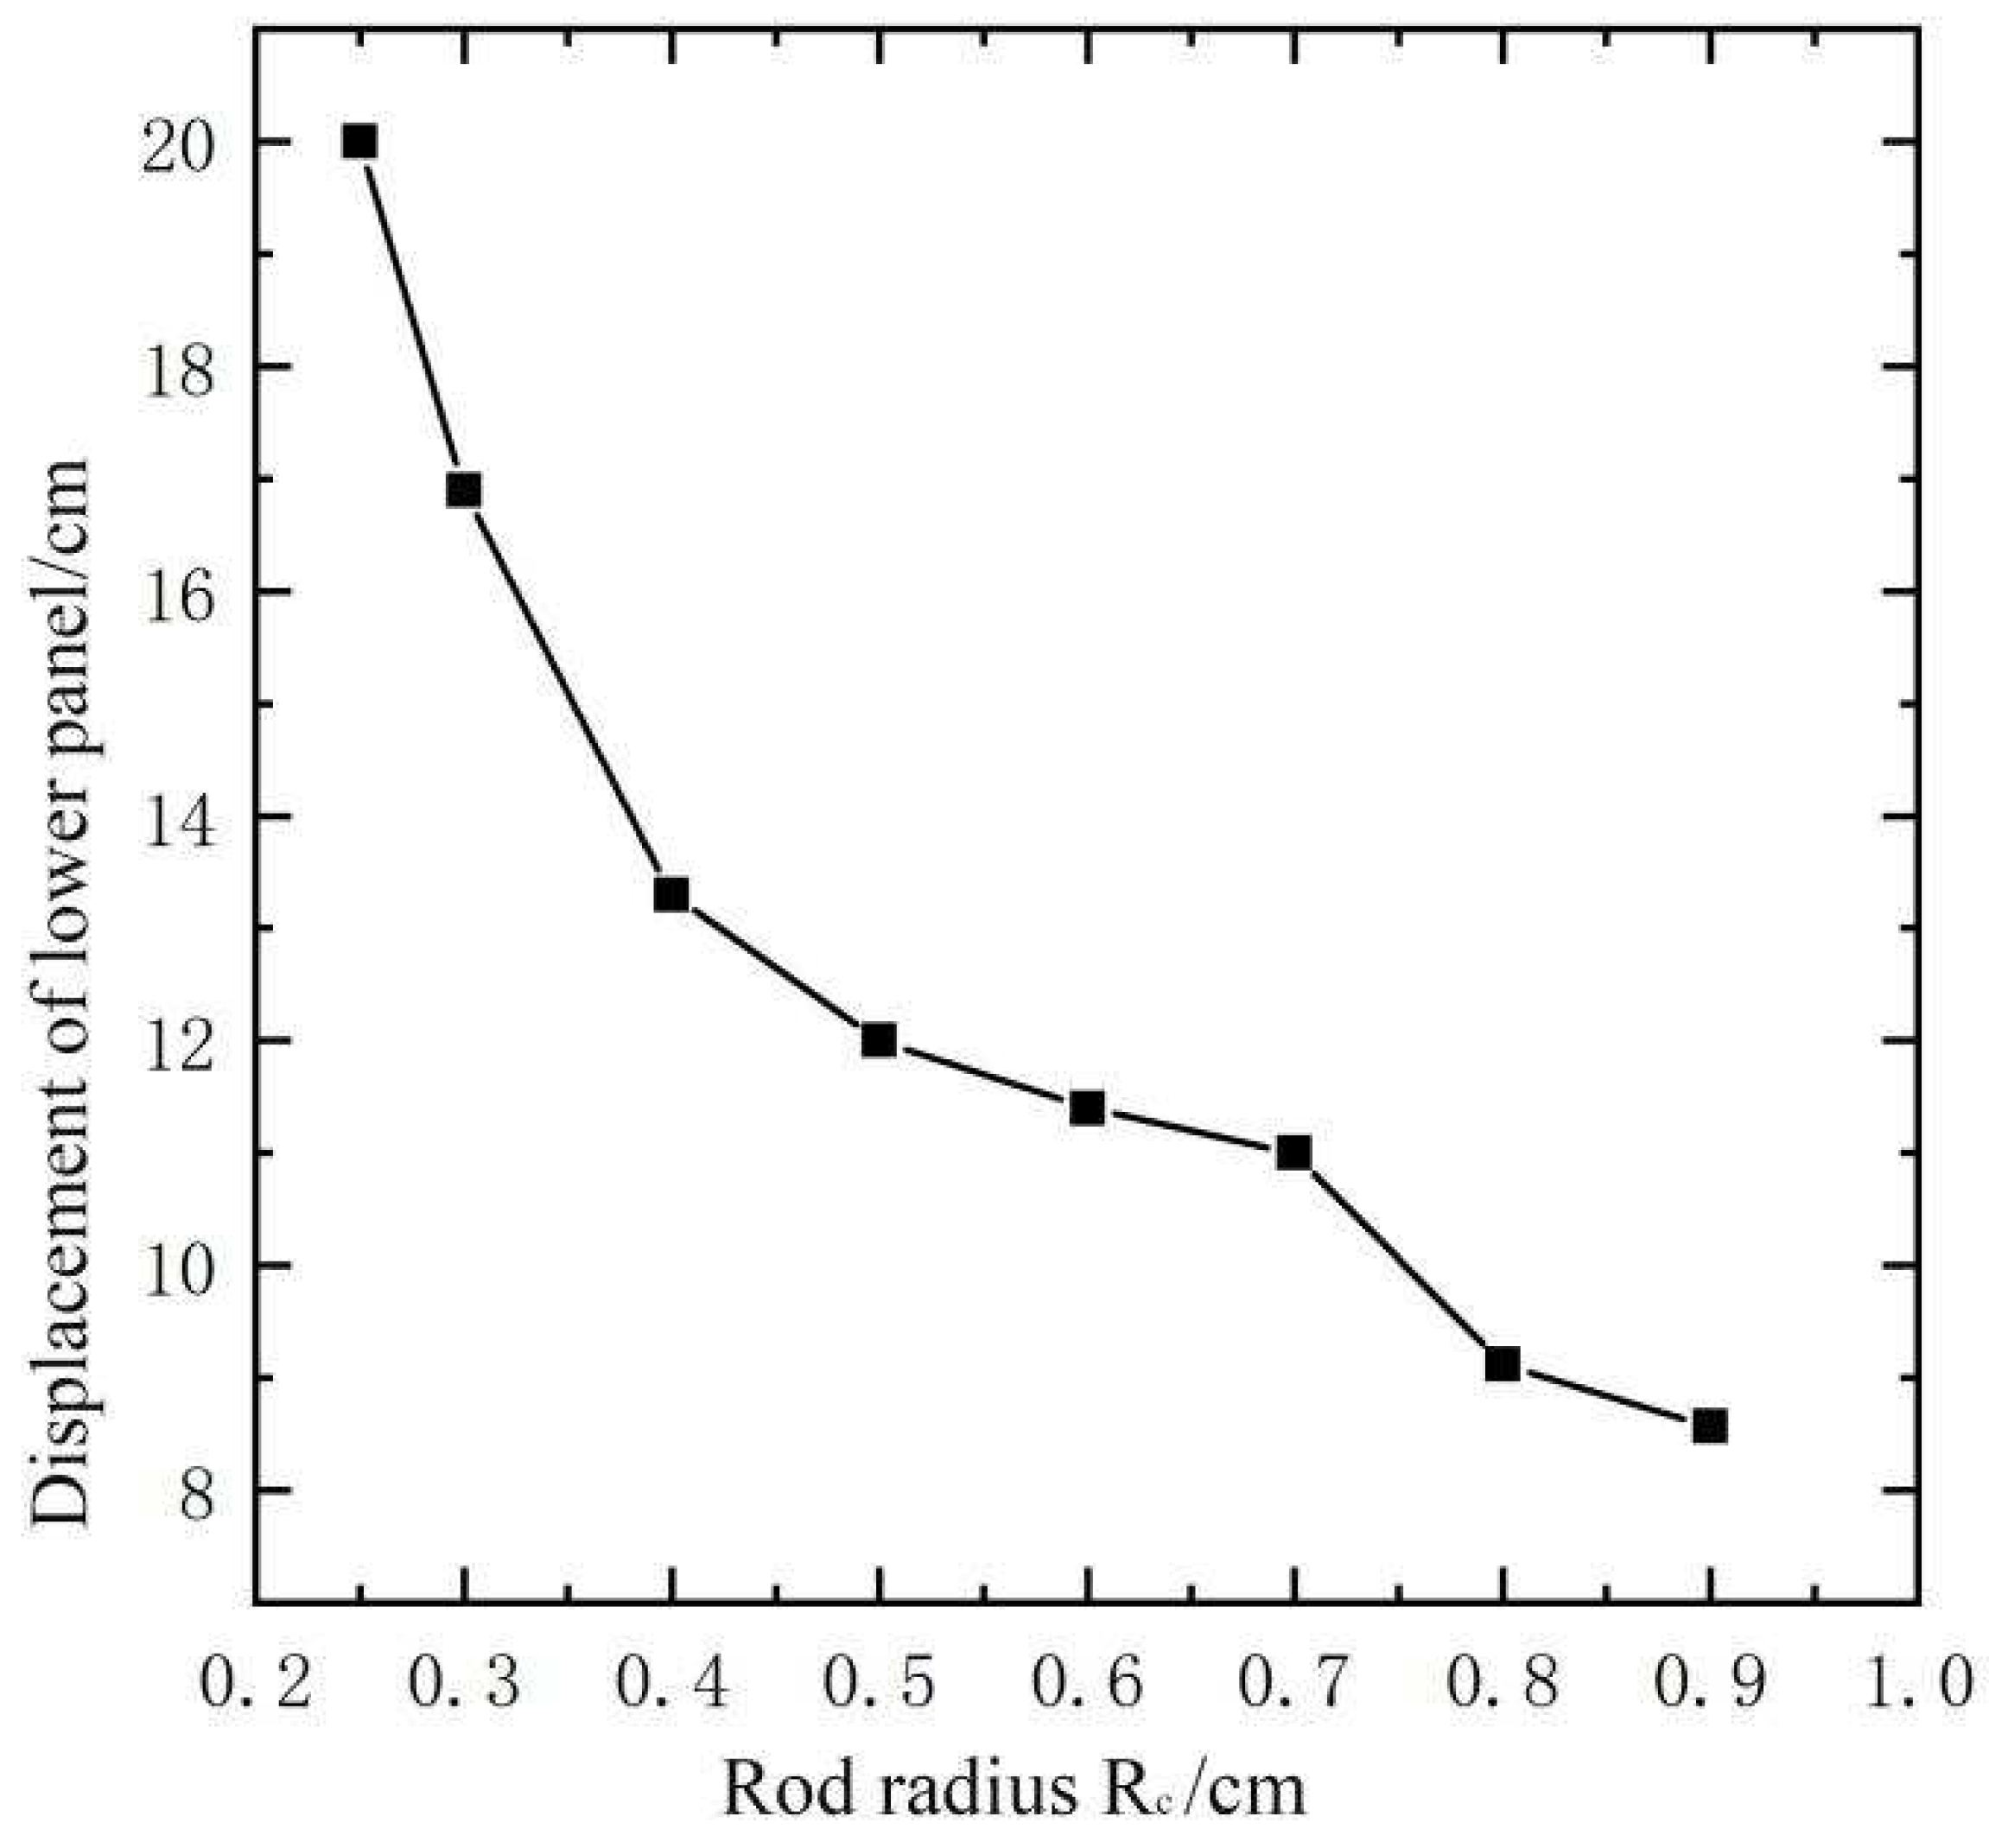
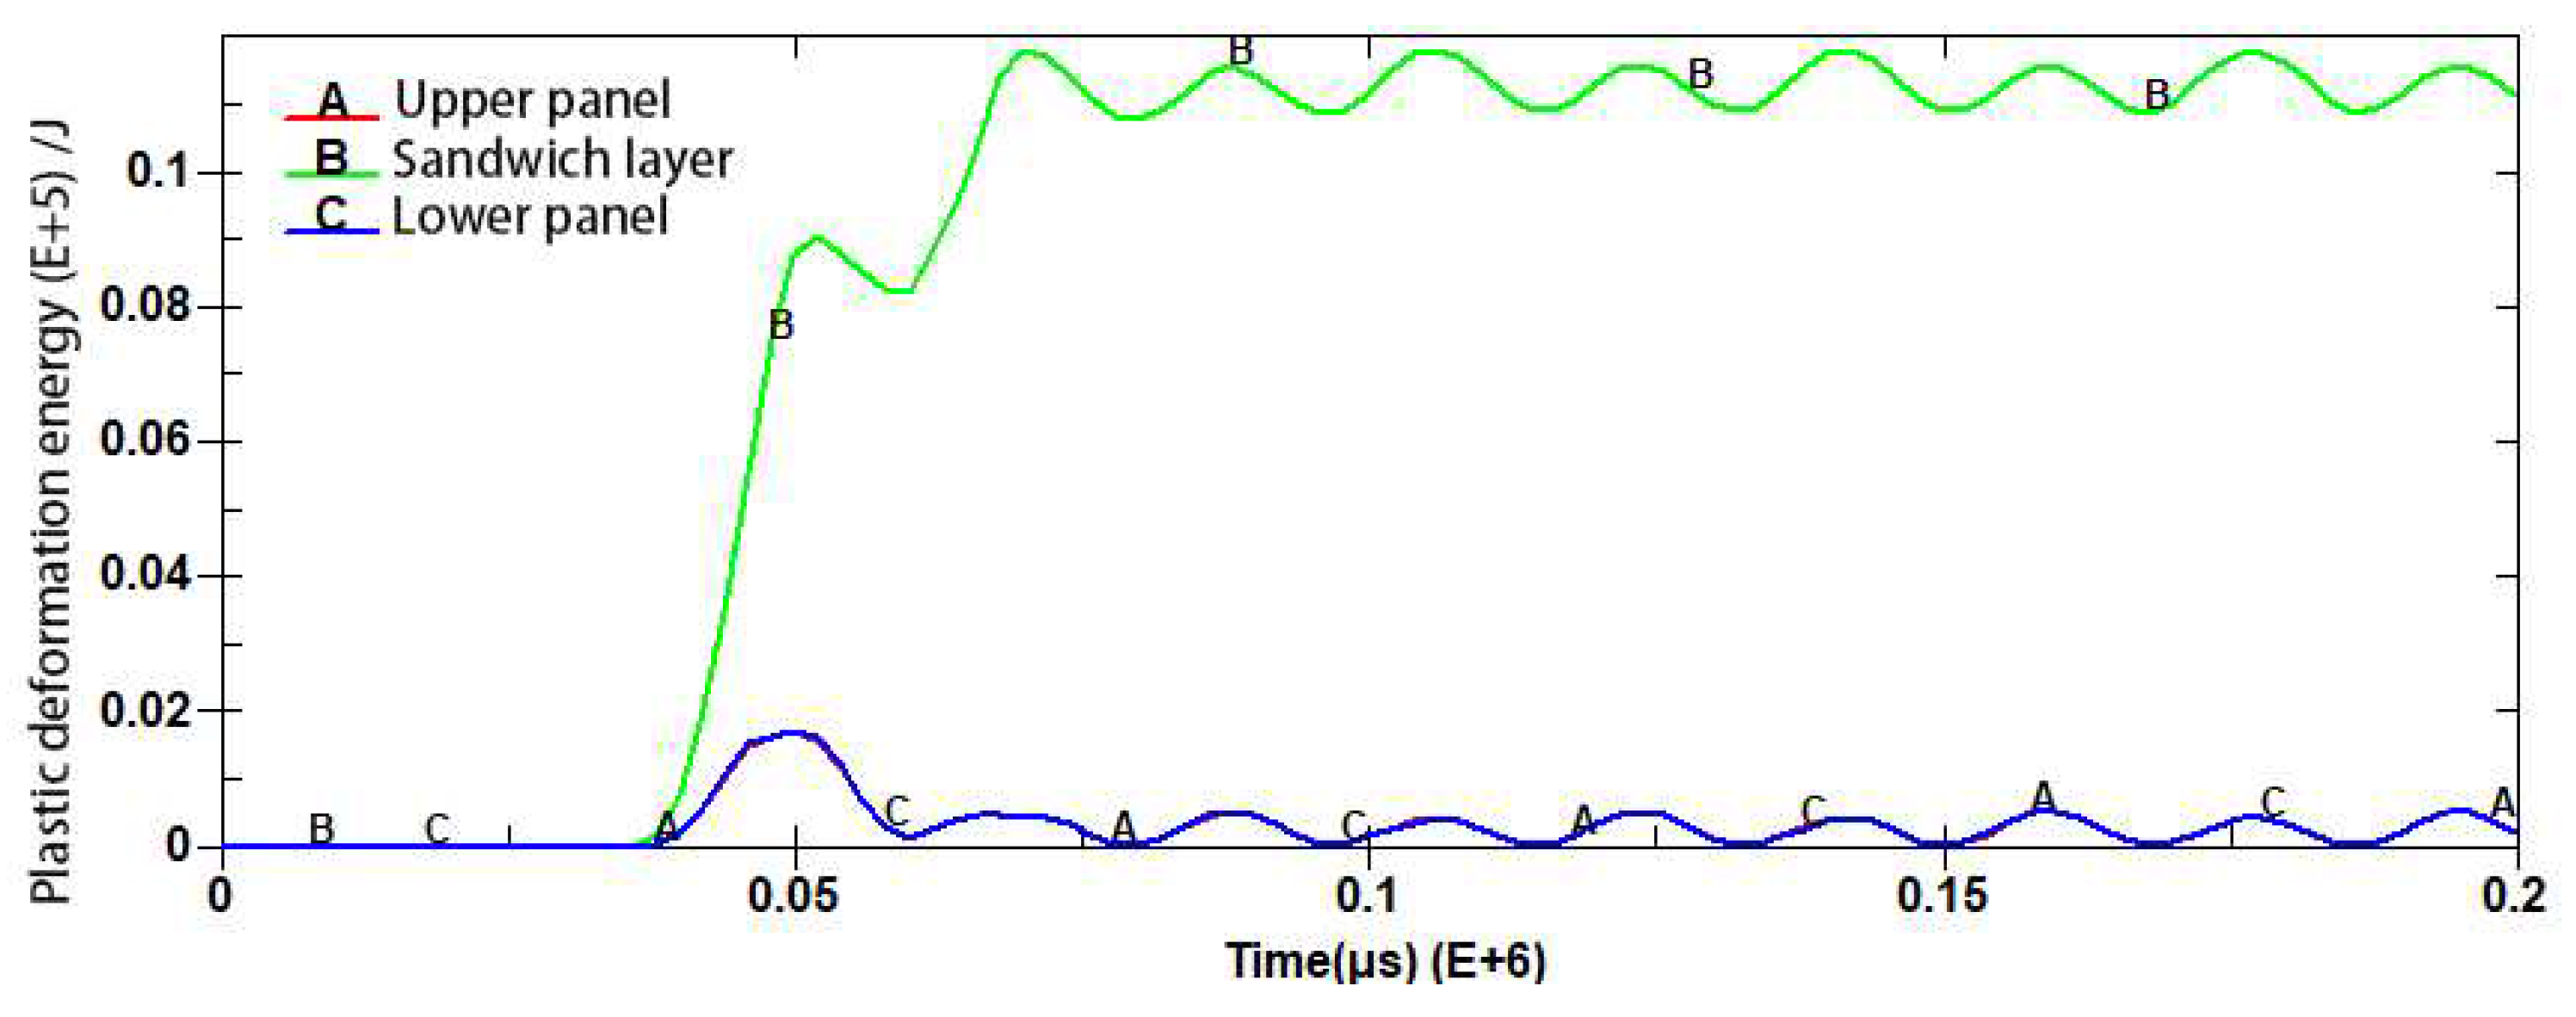
2. When the rod radius of the sandwich layer is 4mm, the thickness of upper/lower panel is 10mm, the plastic deformation energy of the sandwich layer accounts for 85% of the total. Additionally, the displacement at the center point of the lower panel meets the specified deformation requirements.
3. For the assembly of the blast-resistant wall subjected to a 1tTNT explosion at a distance of 30m, it experiences the highest displacement in the center of the blast wall. The displacement in the center spreads by a hemispherical manner to both sides. The displacement at the center point of the panel and the elasto-plastic corner displacement of different sections of the blast-resistant wall are compared with the specifications of design code.
Figure 1.
3D-Kagome sandwich structure: (a) 3D-Kagome truss core sandwich panel; (b) Single cell.
Figure 1.
3D-Kagome sandwich structure: (a) 3D-Kagome truss core sandwich panel; (b) Single cell.
Figure 2.
Truss core of single cell.
Figure 2.
Truss core of single cell.
Figure 3.
Plan of steel petrochemical control structure.
Figure 3.
Plan of steel petrochemical control structure.
Figure 4.
Structural model of petrochemical control room.
Figure 4.
Structural model of petrochemical control room.
Figure 5.
Nodes between column and main beam.
Figure 5.
Nodes between column and main beam.
Figure 6.
Nodes between main beam and secondary beam.
Figure 6.
Nodes between main beam and secondary beam.
Figure 7.
Quarter-scale model of a 3Daome truss core sandwich blast-resistant wall.
Figure 7.
Quarter-scale model of a 3Daome truss core sandwich blast-resistant wall.
Figure 8.
Plastic deformation energy with different bar radii.
Figure 8.
Plastic deformation energy with different bar radii.
Figure 9.
with different bar radii.
Figure 9.
with different bar radii.
Figure 10.
Displacement variation of lower panel with different bar radii.
Figure 10.
Displacement variation of lower panel with different bar radii.
Figure 11.
Displacement of the sandwich wall along Z-axis with 0.9 cm radius of the truss core rod.
Figure 11.
Displacement of the sandwich wall along Z-axis with 0.9 cm radius of the truss core rod.
Figure 12.
Parameter for different panel thickness.
Figure 12.
Parameter for different panel thickness.
Figure 13.
Plastic deformation energy for different rod radius.
Figure 13.
Plastic deformation energy for different rod radius.
Figure 14.
Displacement curves of lower panel with different panel thickness.
Figure 14.
Displacement curves of lower panel with different panel thickness.
Figure 15.
Displacement curves of lower panel with different rod radius.
Figure 15.
Displacement curves of lower panel with different rod radius.
Figure 16.
Out of plan displacement of the sandwich blast-resistant wall with 0.4 mm radius of the core rod.
Figure 16.
Out of plan displacement of the sandwich blast-resistant wall with 0.4 mm radius of the core rod.
Figure 17.
Plastic deformation energy time curve with 0.4cm rod radius.
Figure 17.
Plastic deformation energy time curve with 0.4cm rod radius.
Figure 18.
Connection between sandwich panel blast-resistant wall and steel columns (top view).
Figure 18.
Connection between sandwich panel blast-resistant wall and steel columns (top view).
Figure 19.
petrochemical control structural model.
Figure 19.
petrochemical control structural model.
Figure 20.
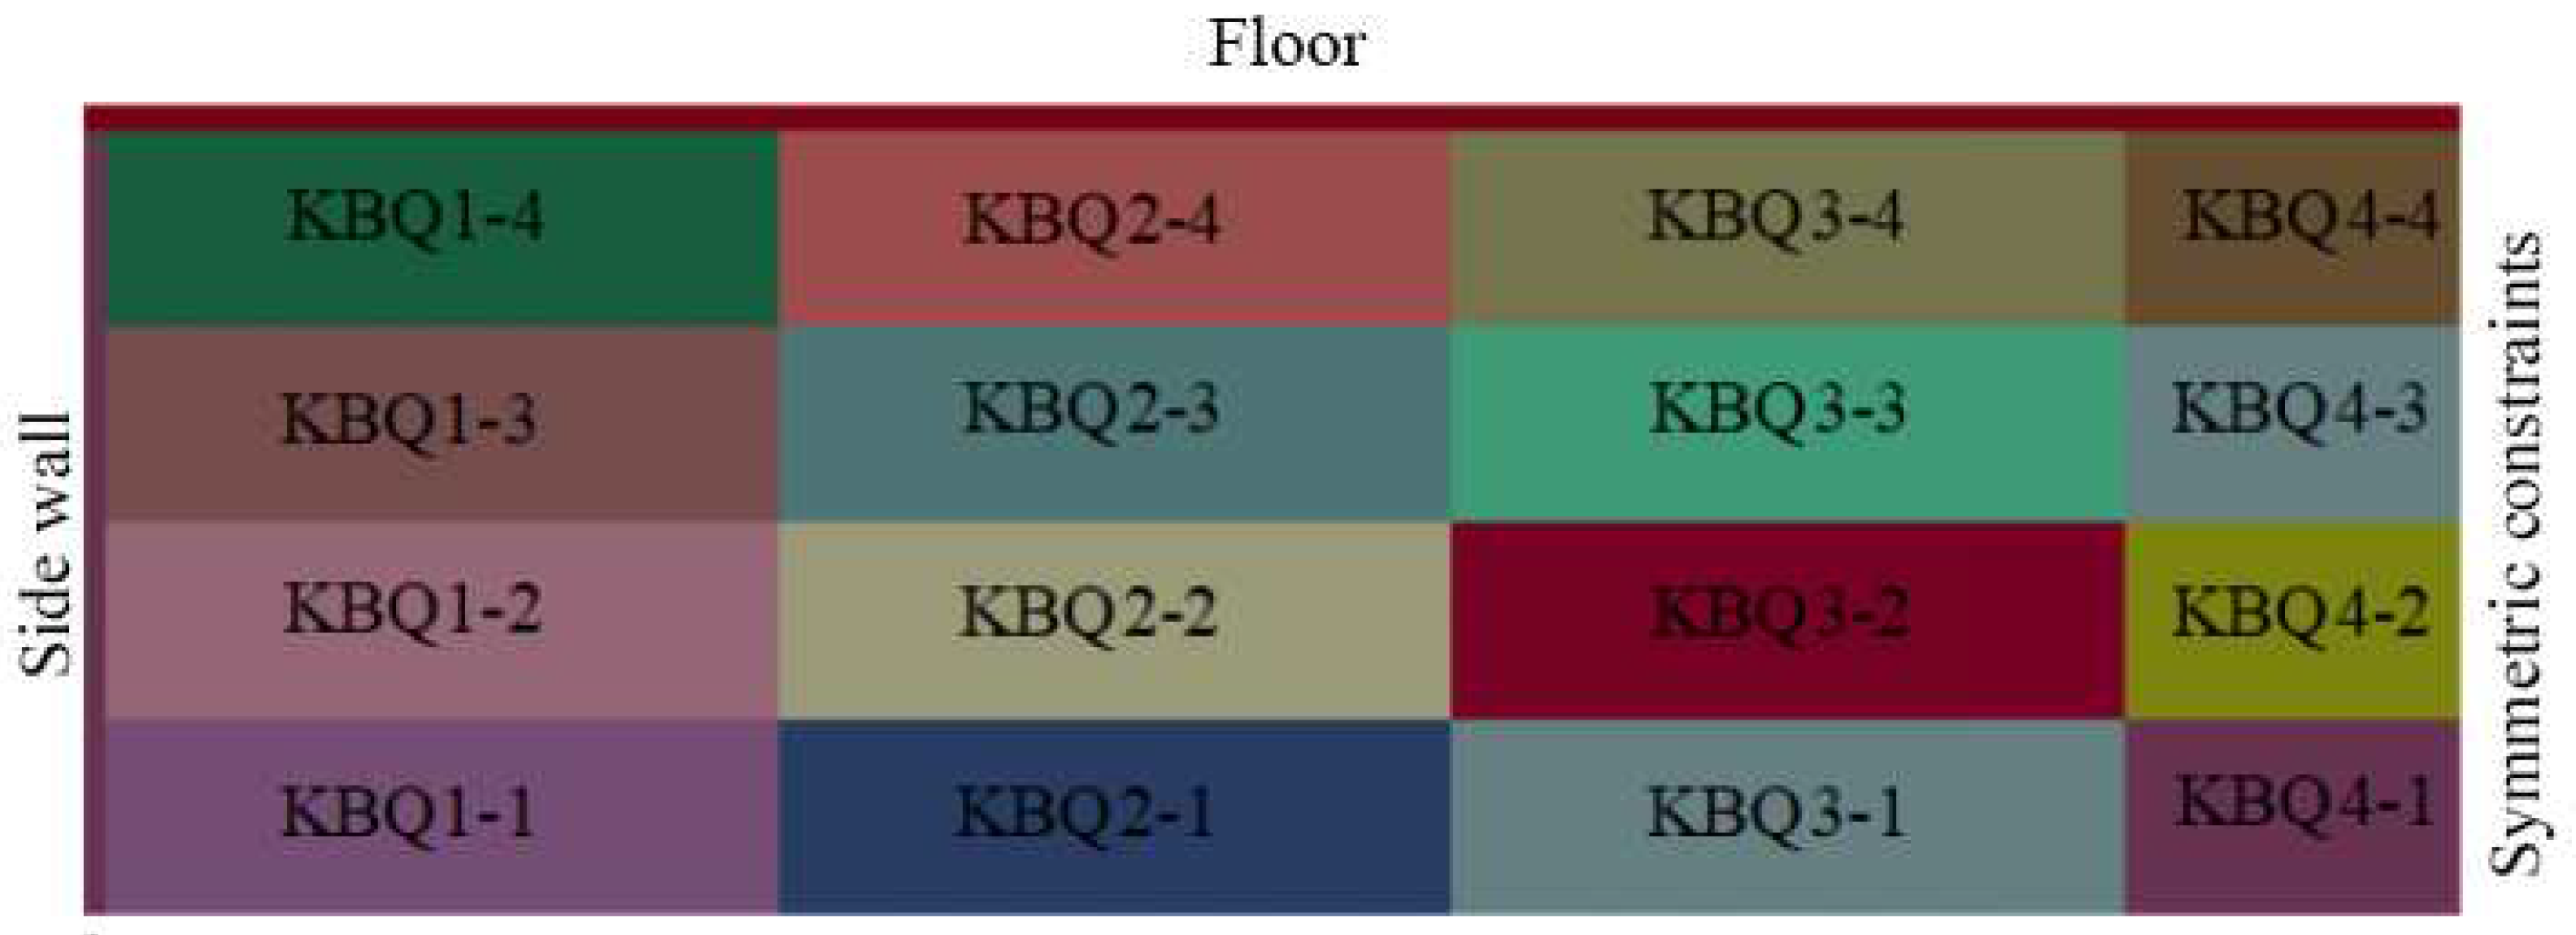
sandwich blast-resistant walls number.
Figure 20.
sandwich blast-resistant walls number.
Figure 21.
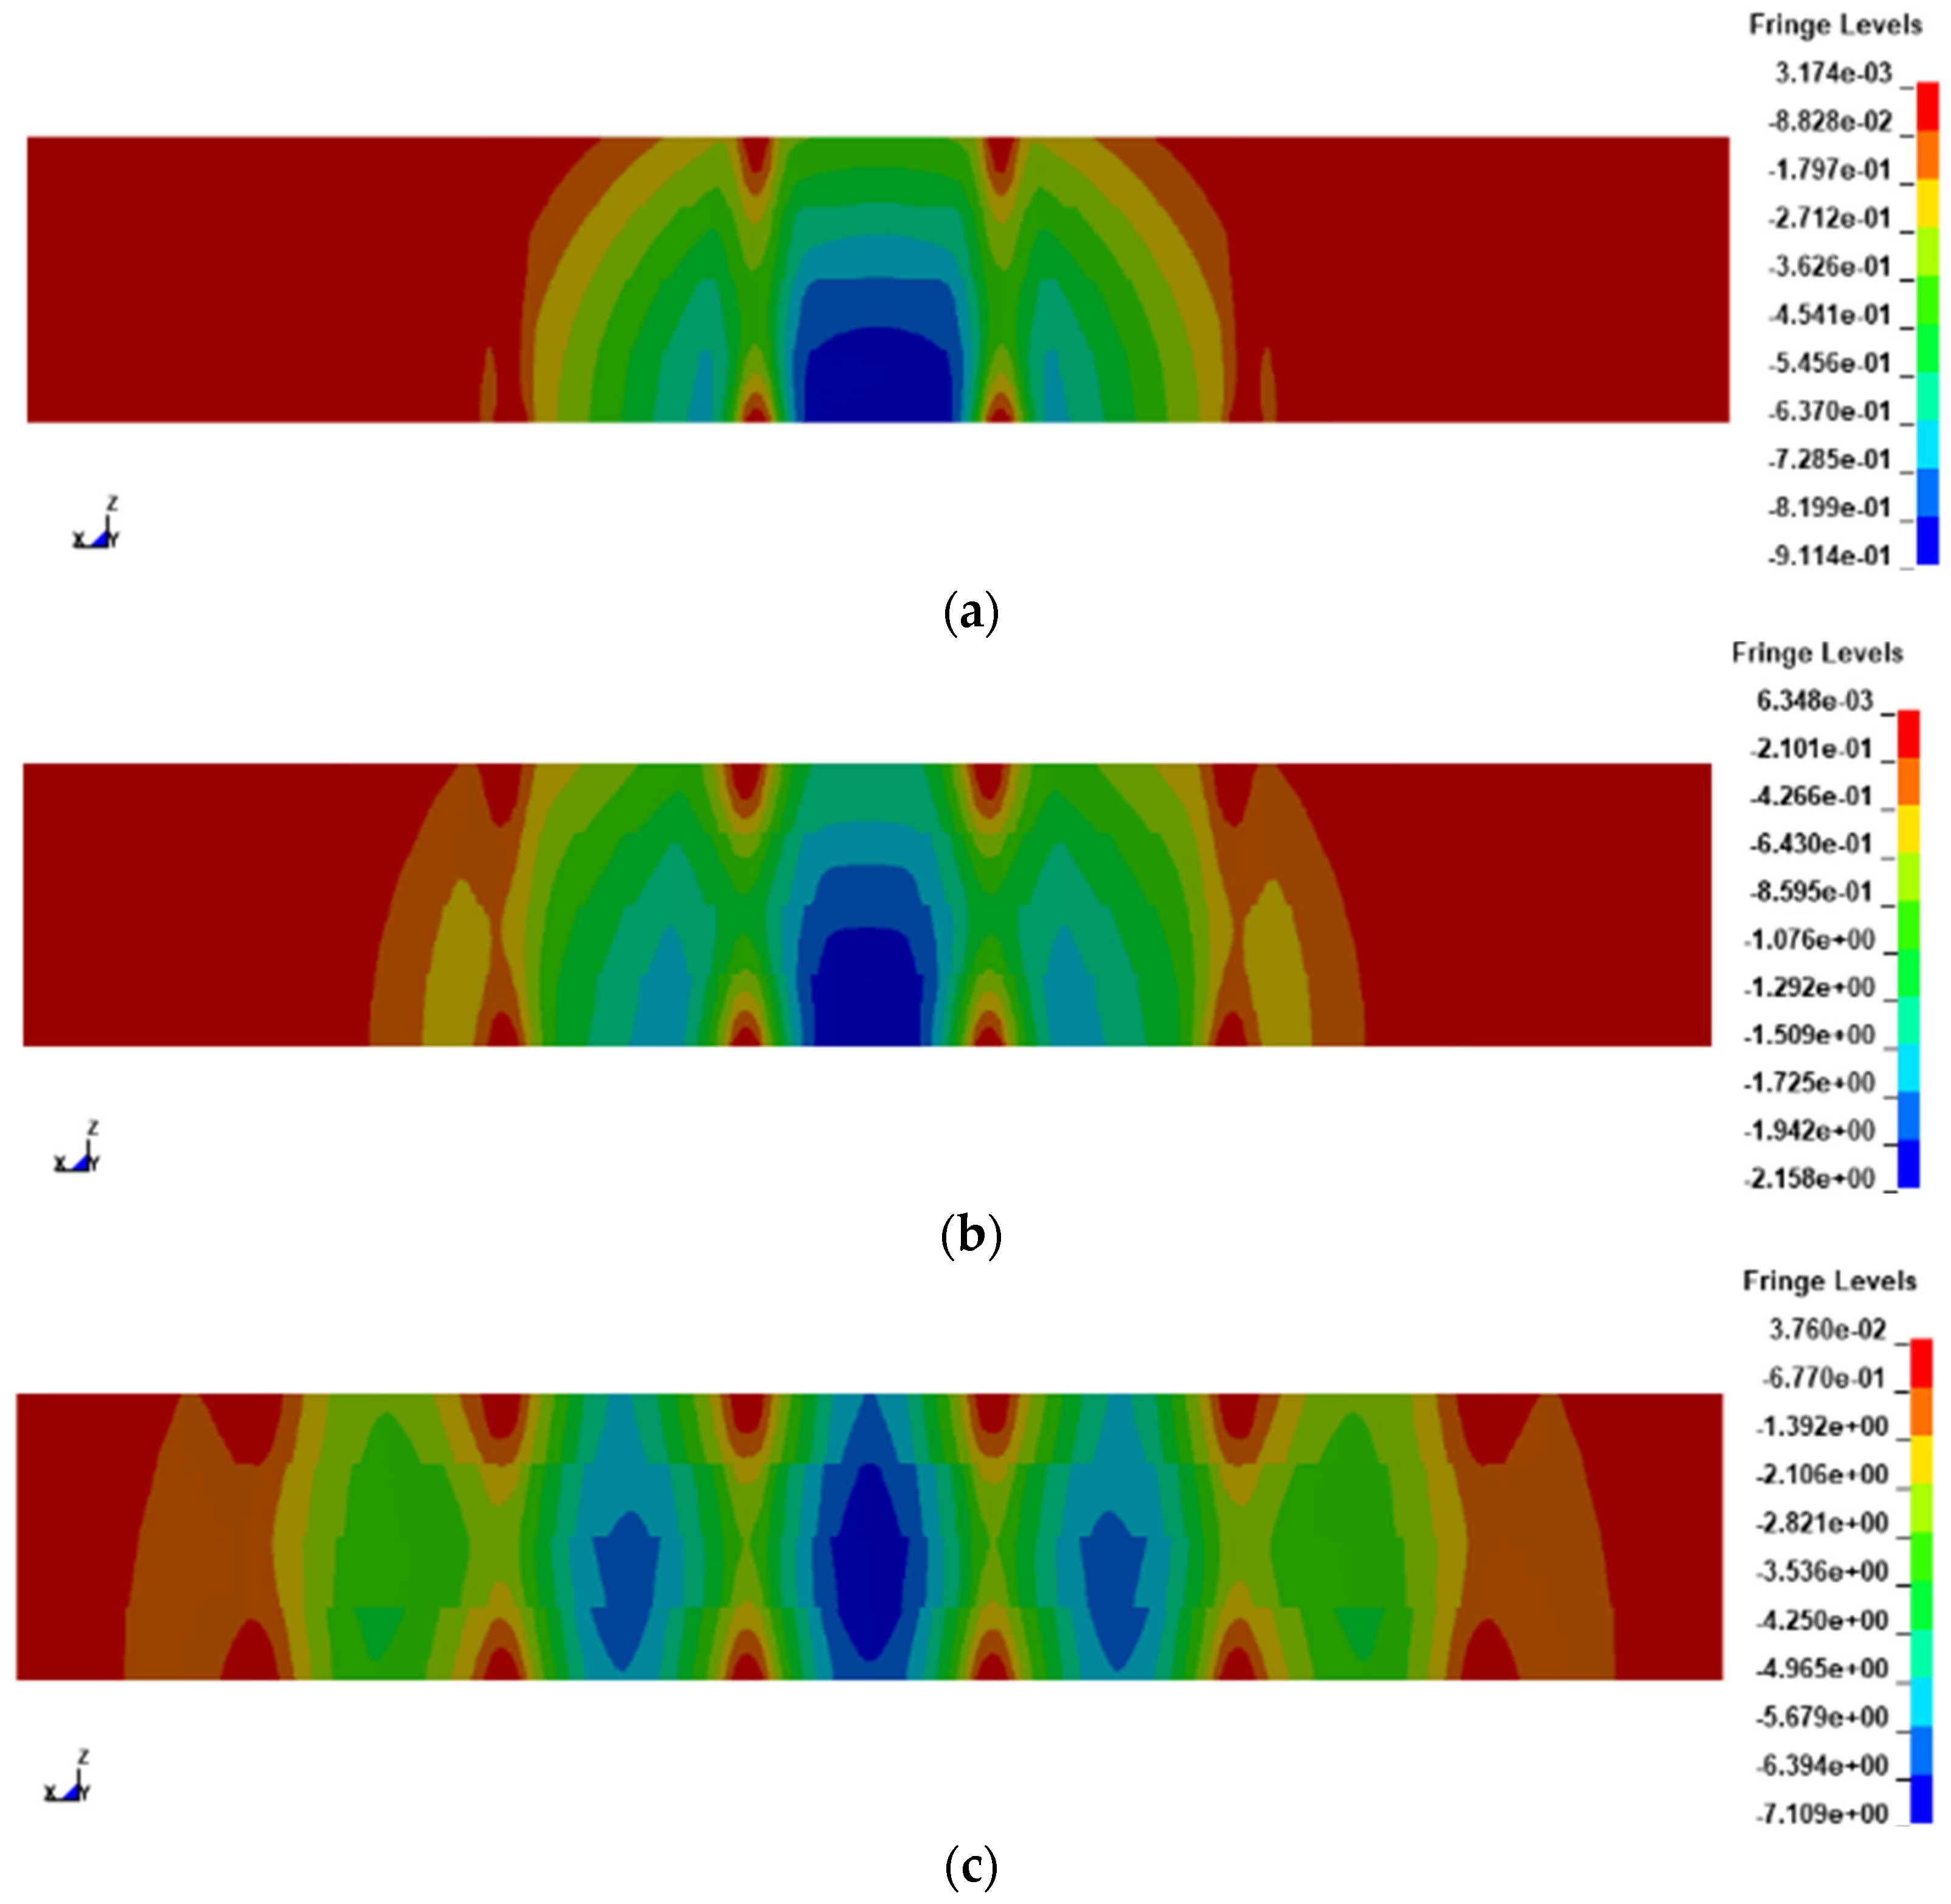
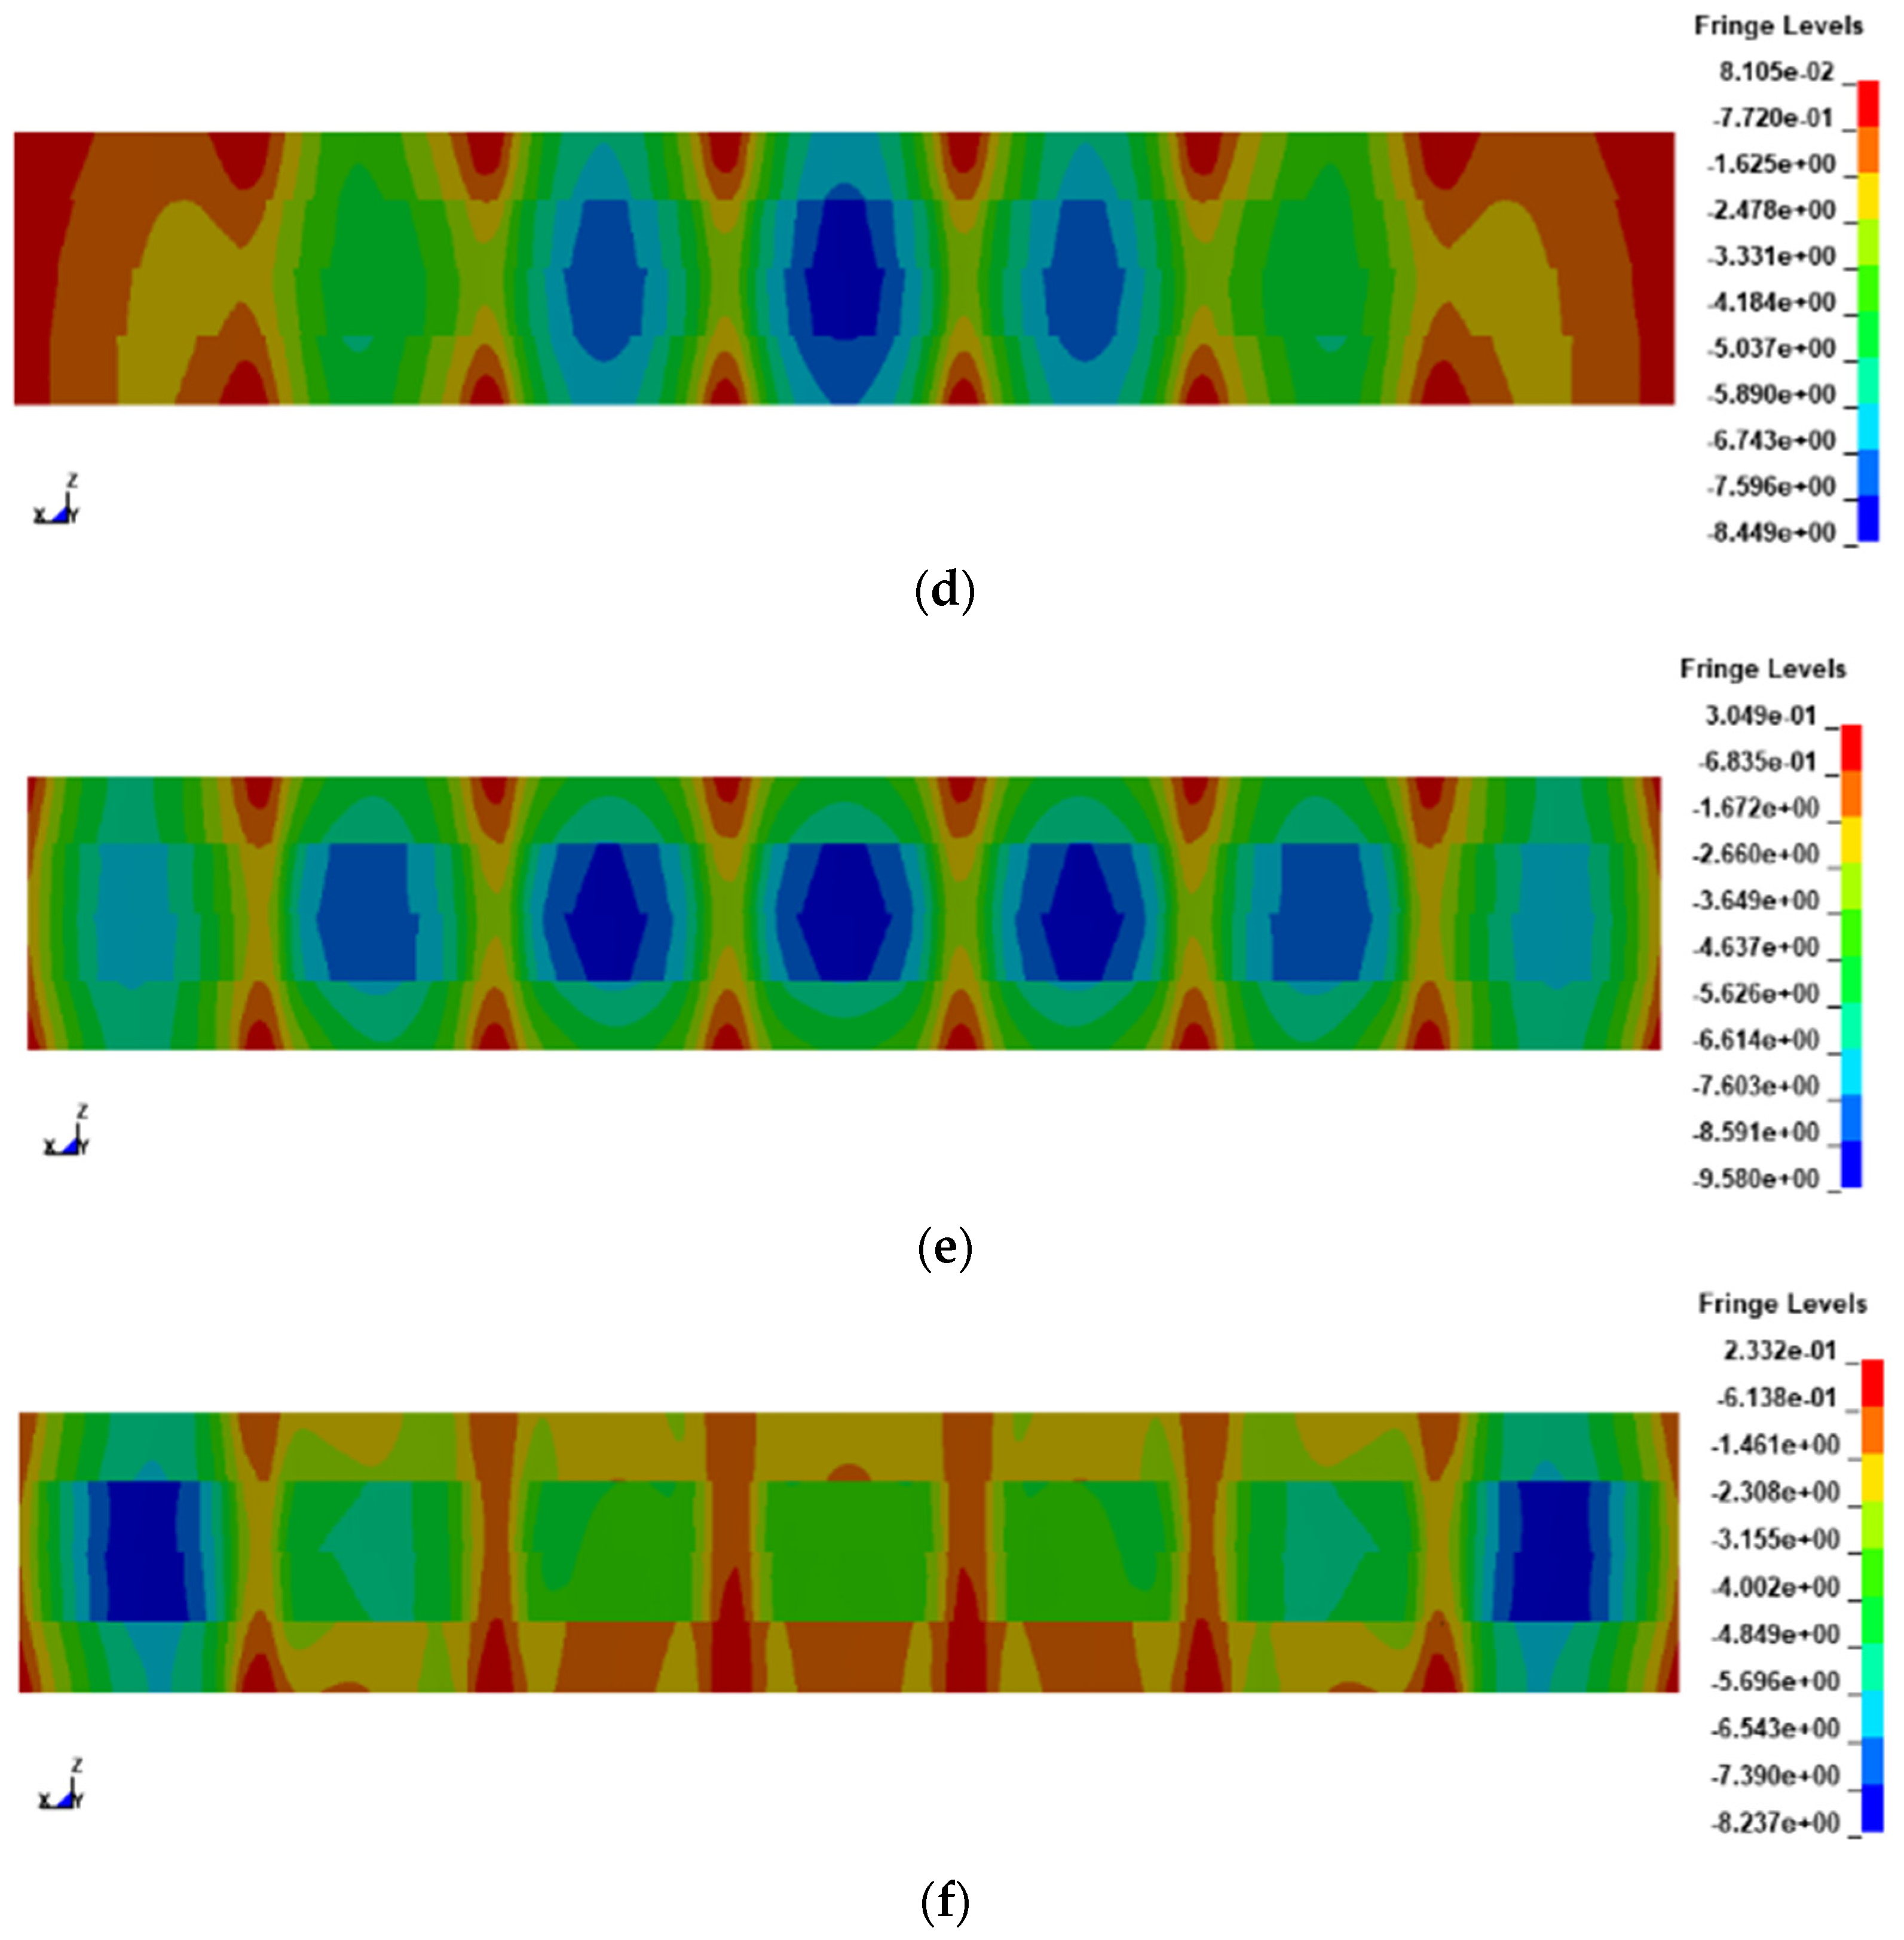
Y-directional displacement clouds of the blast-resistant wall of the truss core sandwich panel at different moments (cm): (a) t=0.004s; (b) t=0.0046s; (c) t=0.05s; (d) t=0.054s; (e) t=0.062s; (f) t=0.07s.
Figure 21.
Y-directional displacement clouds of the blast-resistant wall of the truss core sandwich panel at different moments (cm): (a) t=0.004s; (b) t=0.0046s; (c) t=0.05s; (d) t=0.054s; (e) t=0.062s; (f) t=0.07s.
Figure 22.
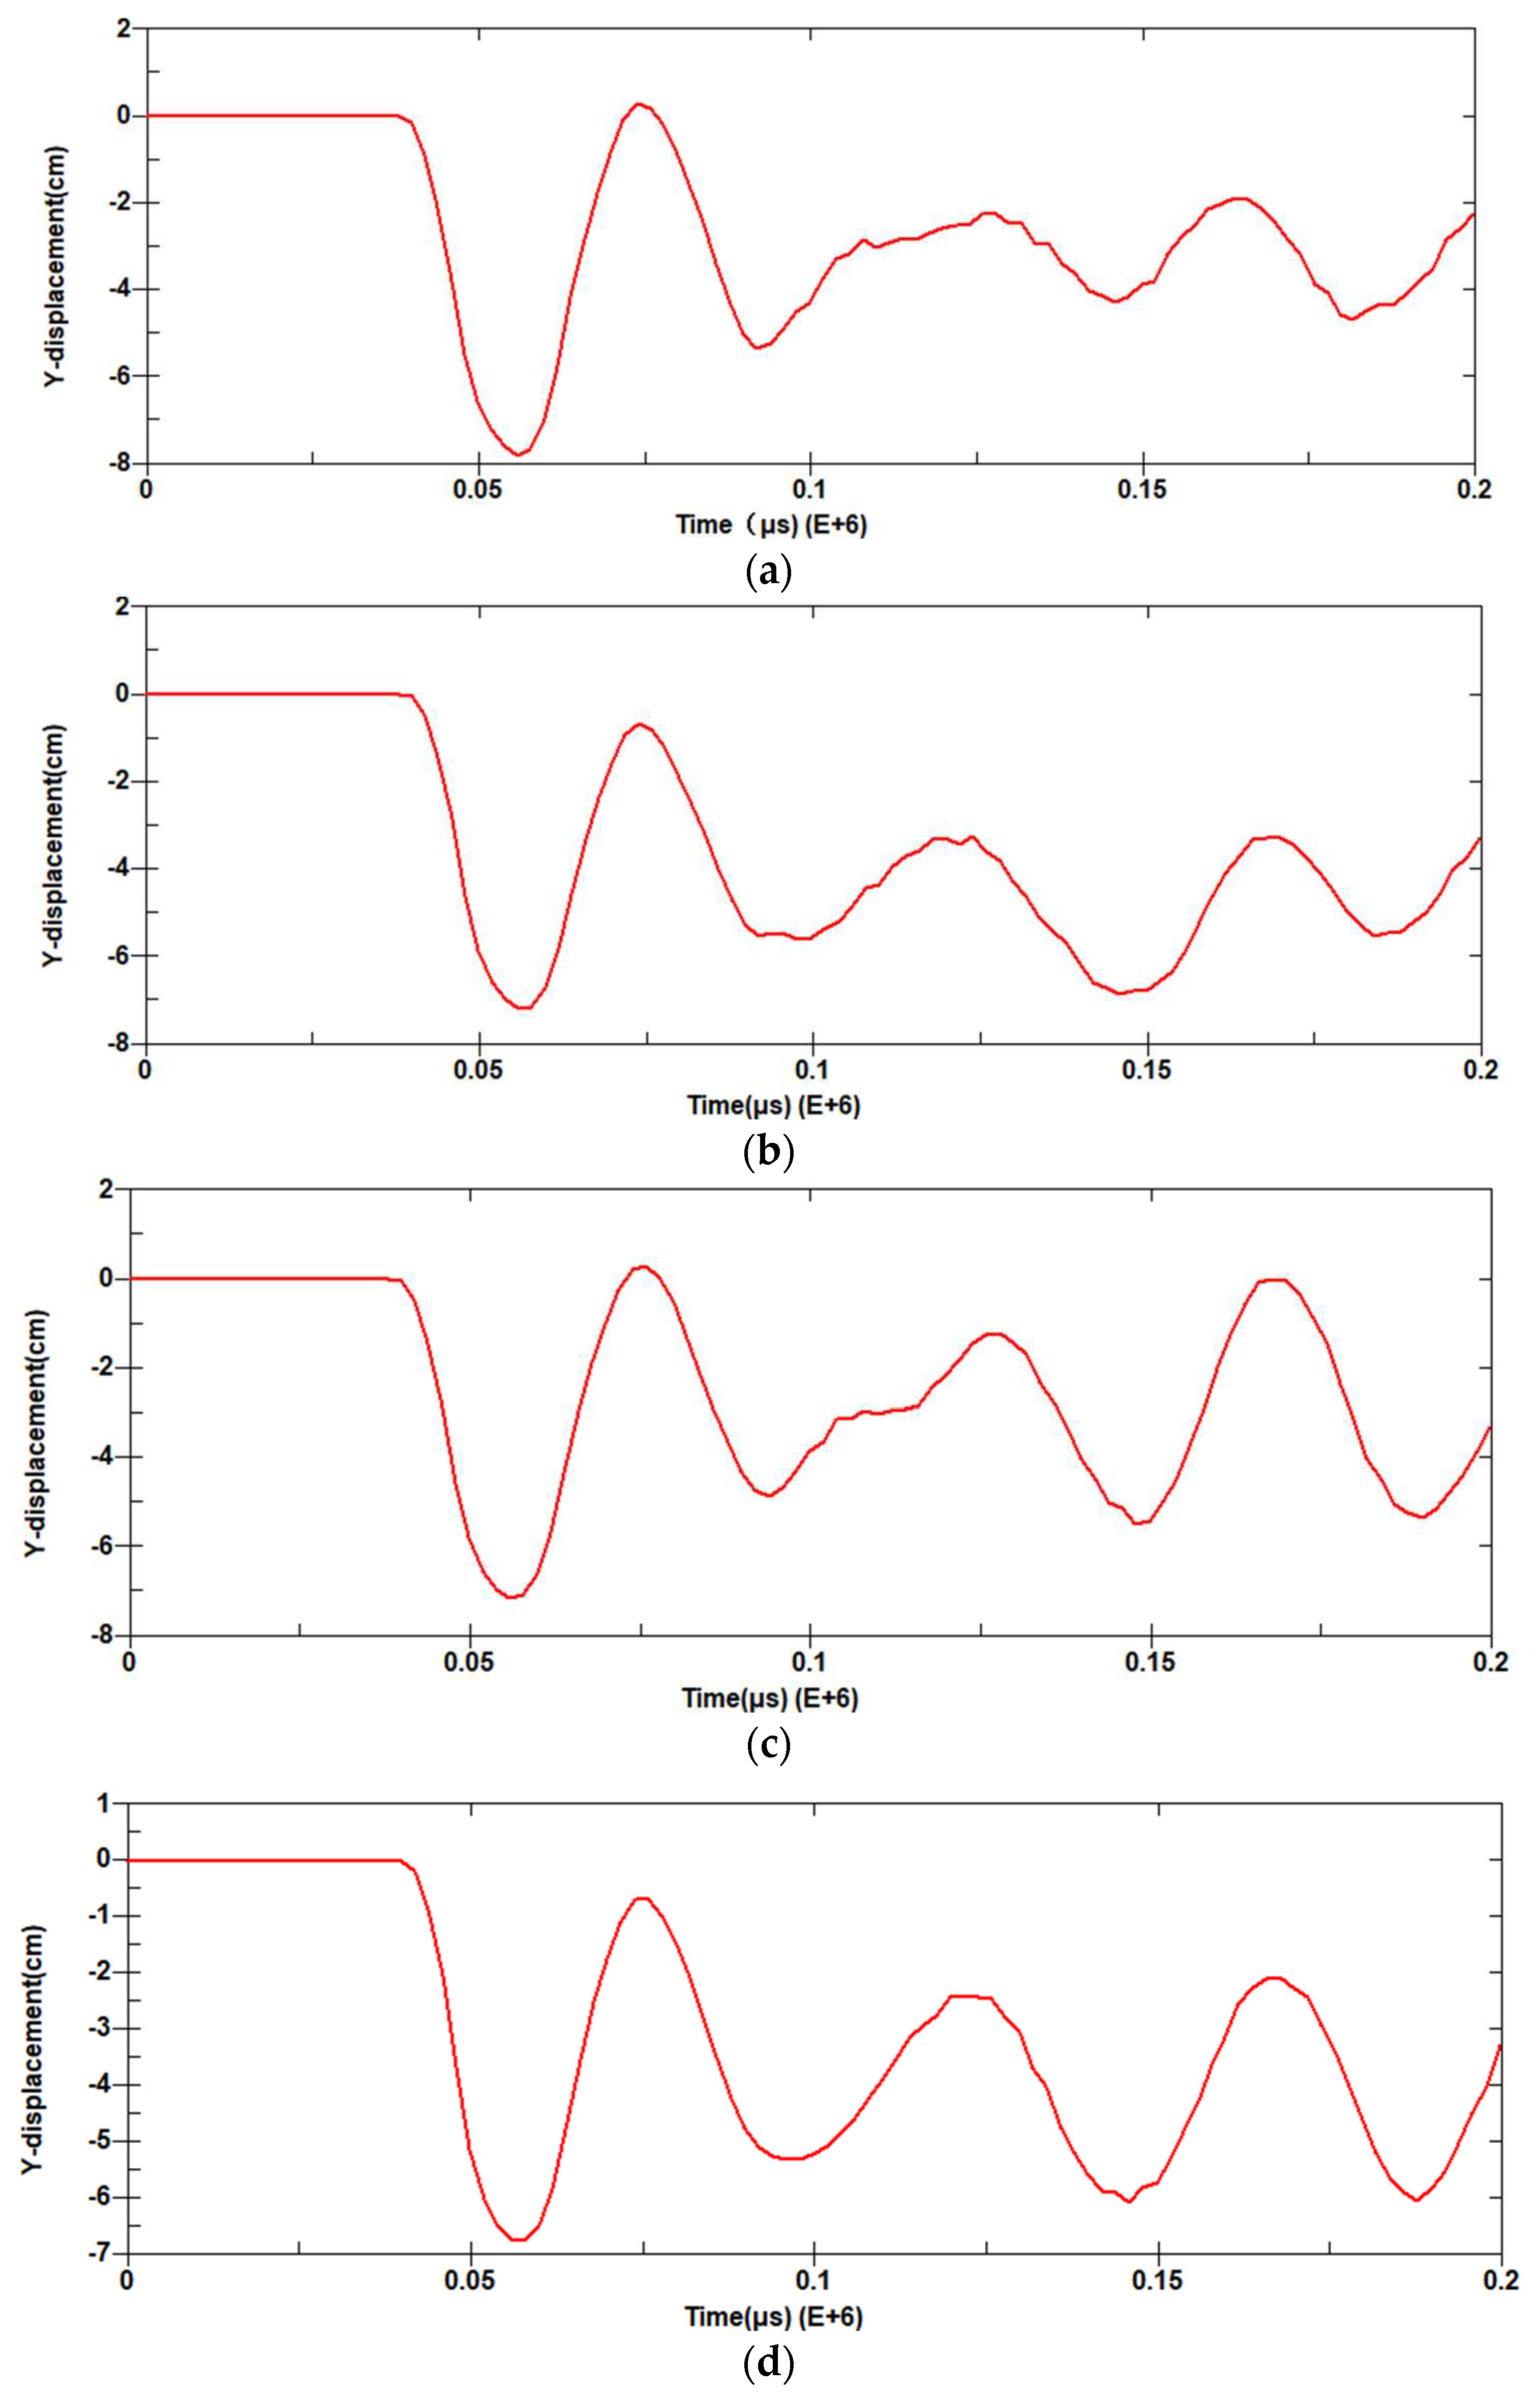
Lower panel displacement response: (a) Lower panel displacement response of the center of KBQ4-2 wall; (b) Lower panel displacement response of the center of KBQ4-3 wall; (c) Lower panel displacement response of the center of KBQ3-2 wall; (d) Lower panel displacement response of the center of KBQ3-3 wall.
Figure 23.
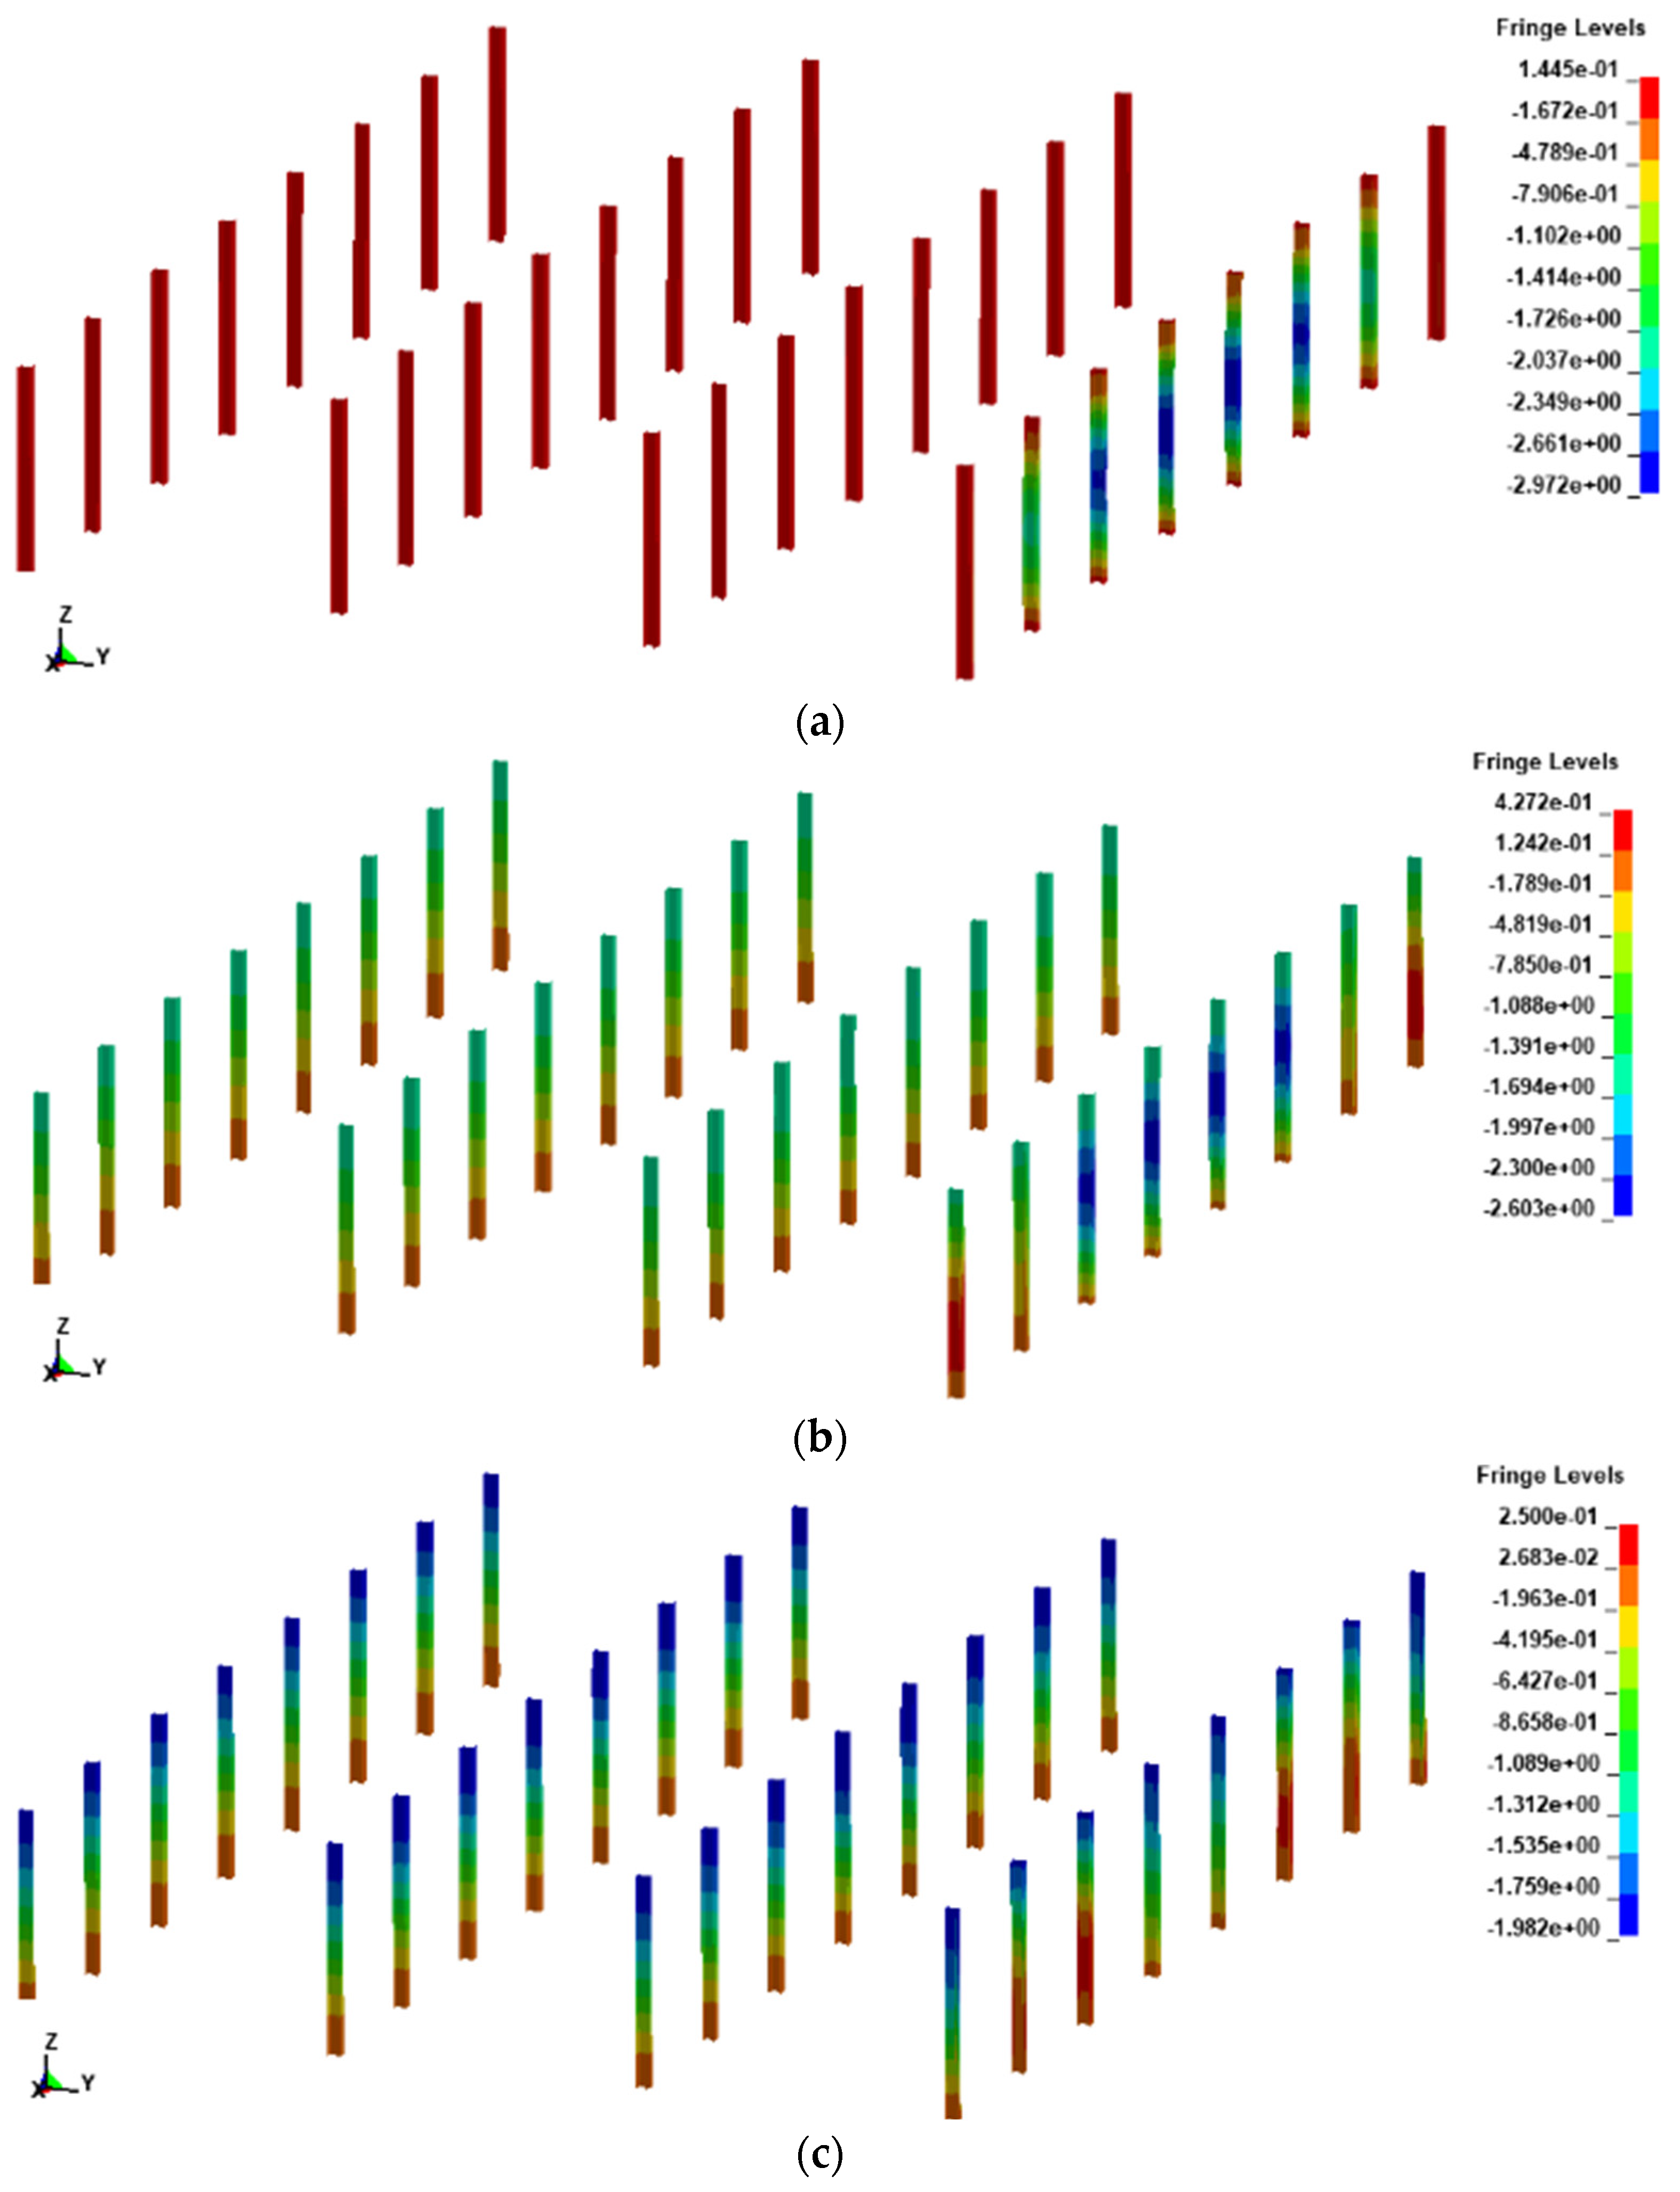
Y-directional displacement clouds of frame columns at different time instants: (a) t=0.052s; (b) t=0.1s; (c) t=0.182s.
Figure 23.
Y-directional displacement clouds of frame columns at different time instants: (a) t=0.052s; (b) t=0.1s; (c) t=0.182s.
Figure 24.
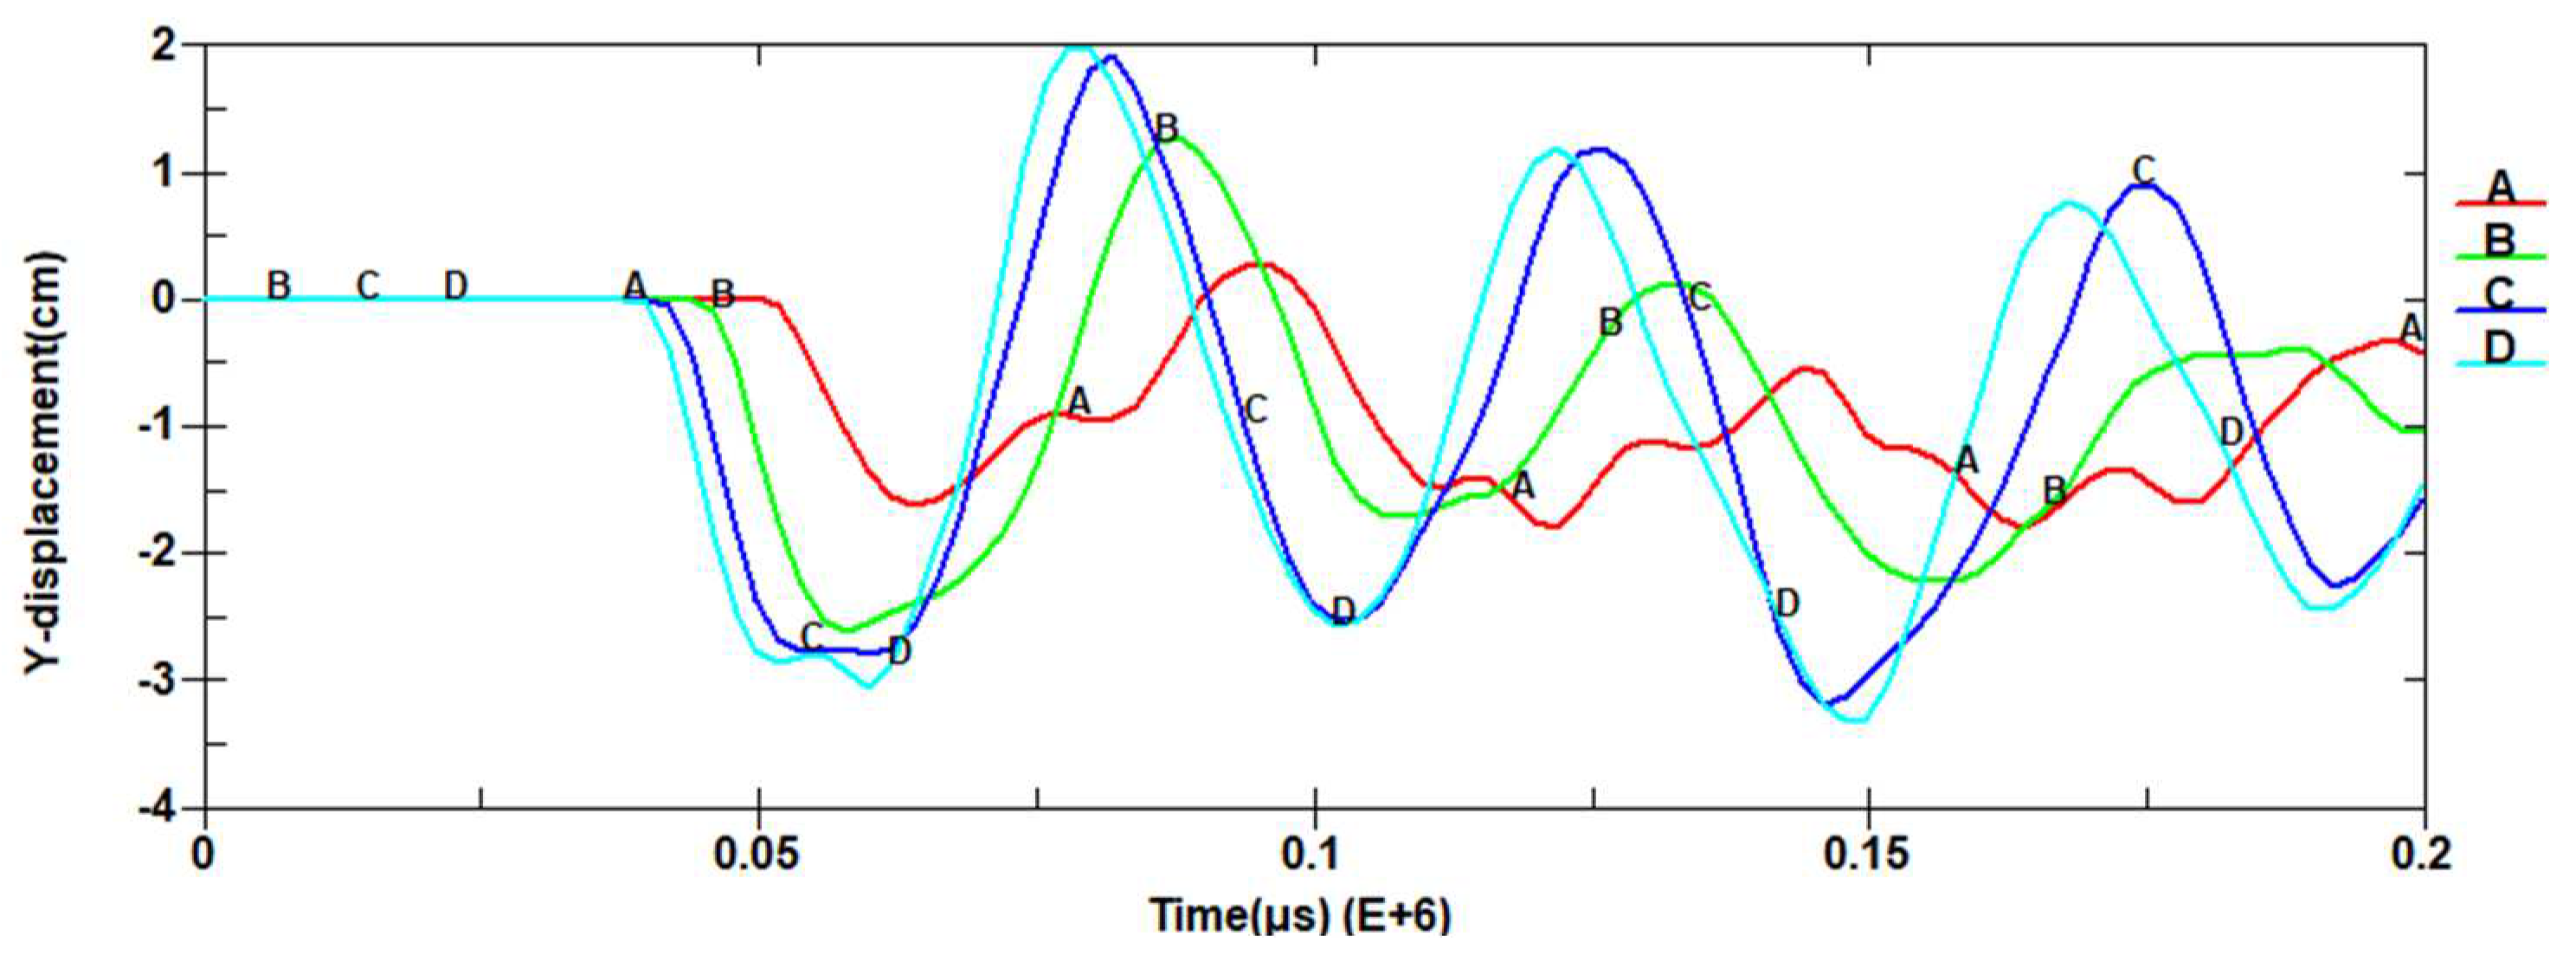
Displacement curve of frame column of the control structure.
Figure 24.
Displacement curve of frame column of the control structure.
Table 1.
Section sizes of the beam and column of the steel frame.
Table 1.
Section sizes of the beam and column of the steel frame.
| Type |
Symbol |
Cross-section size/mm |
| Column |
KZ1 |
3503501219 |
Beam
Reinforced Concrete Slab |
KL1 |
7003001324 |
| KL2 |
7003001324 |
L1
RCC Slab |
350175711
20001000120 |
Table 2.
J-C model parameters.
Table 2.
J-C model parameters.
| A |
B |
|
C |
M |
| 8E8 |
4.5E8 |
0.565 |
0.067 |
1.03 |
|
|
|
|
|
| 1793 |
0.0705 |
1.732 |
-0.54 |
-0.015 |
Table 3.
GRUNEISEN state equation parameters.
Table 3.
GRUNEISEN state equation parameters.
|
Cs
|
|
|
|
E0
|
| 0.45 |
1.49 |
0.0 |
0.0 |
0.0 |
Table 4.
Deformation limits of steel structural members.
Table 4.
Deformation limits of steel structural members.
| Structural elements |
|
| Main hot-rolled steel deck beam, secondary beam and purlin |
|
| Frame column, compression brace |
|
| Frame beam, tensile brace |
|
| Steel slab |
|
| Lattice beam |
|
| Cold-formed light steel panel (fixed end) |
|
| Cold-formed light steel panel (free end) |
|
| Secondary cold-formed light steel beam and purlin |
|
Table 5.
Center point displacement and bearing angle of sandwich blast-resistant walls.
Table 5.
Center point displacement and bearing angle of sandwich blast-resistant walls.
| Blast-resistant wall number |
|
|
Blast-resistant wall number |
|
|
| KBQ1-1 |
0.055 |
1.24 |
KBQ3-1 |
0.063 |
1.42 |
| KBQ1-2 |
0.058 |
1.30 |
KBQ3-2 |
0.071 |
1.59 |
| KBQ1-3 |
0.060 |
1.35 |
KBQ3-3 |
0.067 |
1.50 |
| KBQ1-4 |
0.054 |
1.21 |
KBQ3-4 |
0.061 |
1.37 |
| KBQ2-1 |
0.055 |
1.24 |
KBQ4-1 |
0.070 |
1.57 |
| KBQ2-2 |
0.062 |
1.39 |
KBQ4-2 |
0.079 |
1.77 |
| KBQ2-3 |
0.064 |
1.44 |
KBQ4-3 |
0.073 |
1.64 |
| KBQ2-4 |
0.052 |
1.17 |
KBQ4-4 |
0.068 |
1.53 |
| Scope |
0.052-0.064 |
1.17-1.44 |
|
0.061-0.079 |
1.37-1.77 |
Table 6.
maximum deformation and bearing angle of the frame column.
Table 6.
maximum deformation and bearing angle of the frame column.
| Frame column number |
|
|
| KZA |
0.017 |
0.32 |
| KZB |
0.027 |
0.52 |
| KZC |
0.031 |
0.60 |
| KZD |
0.033 |
0.63 |
| Scope |
0.017-0.033 |
0.032-0.063 |

