1. Introduction
Blood pressure (BP) monitoring is one of the crucial aspects of cardiovascular health management [
1], [
2]. Nevertheless, traditional cuff-based methods can prove inconvenient and uncomfort [
3]. In response, the SINTEC European project [
4] has developed an in- novative blood pressure estimation algorithm specifically designed for wearable cuffless devices. This algorithm utilizes SINTEC’s Electrocardiogram (ECG) and Photoplethysmo-gram (PPG) cuffless sensors, along with state-of-the-art Shimmer sensors [
5], demonstrating promising accuracy even with low-frequency sampled signals. In this work we present a BP monitoring device allowing frequent BP measurements (ideally continuous BP monitoring), with minimal discomfort.
This article explores the meticulous development and testing of the SINTEC algorithm in both laboratory and hospital settings, underscoring its potential to transform continuous and non-invasive blood pressure monitoring through wearable technology. The study involved a 20-minute recording to evaluate the machine learning regression coefficients crucial for algorithm calibration. SINTEC’s expertise played a key role in fine-tuning the algorithm to accommodate low-frequency sampled signals and different signal sampling frequencies for ECG ( fsE) and PPG ( fsP), all integrated into a unified algorithm. This adapt- ability not only ensures accuracy, but also positions the algorithm for future applications on wearable devices. This opens up prospects for measuring blood pressure in a convenientand dependable way, enhancing user comfort and overall reliability.
1.1. Key measurements relevant to Blood Pressure estimation: Heart Rate and and Pulse Transit Time
The BP algorithm relies on key measurements—Heart Rate (HR) and Pulse Transit Time (PTT)—from ECG and PPG signals to estimate BP [
6,
7]. The ECG captures the heart rhythm, allowing for the derivation of HR (Eq. (1)), [
8]. This parameter, given in beats perminute, is calculated from the time interval between R-peaks, offering a precise measure of cardiac activity [
9]:
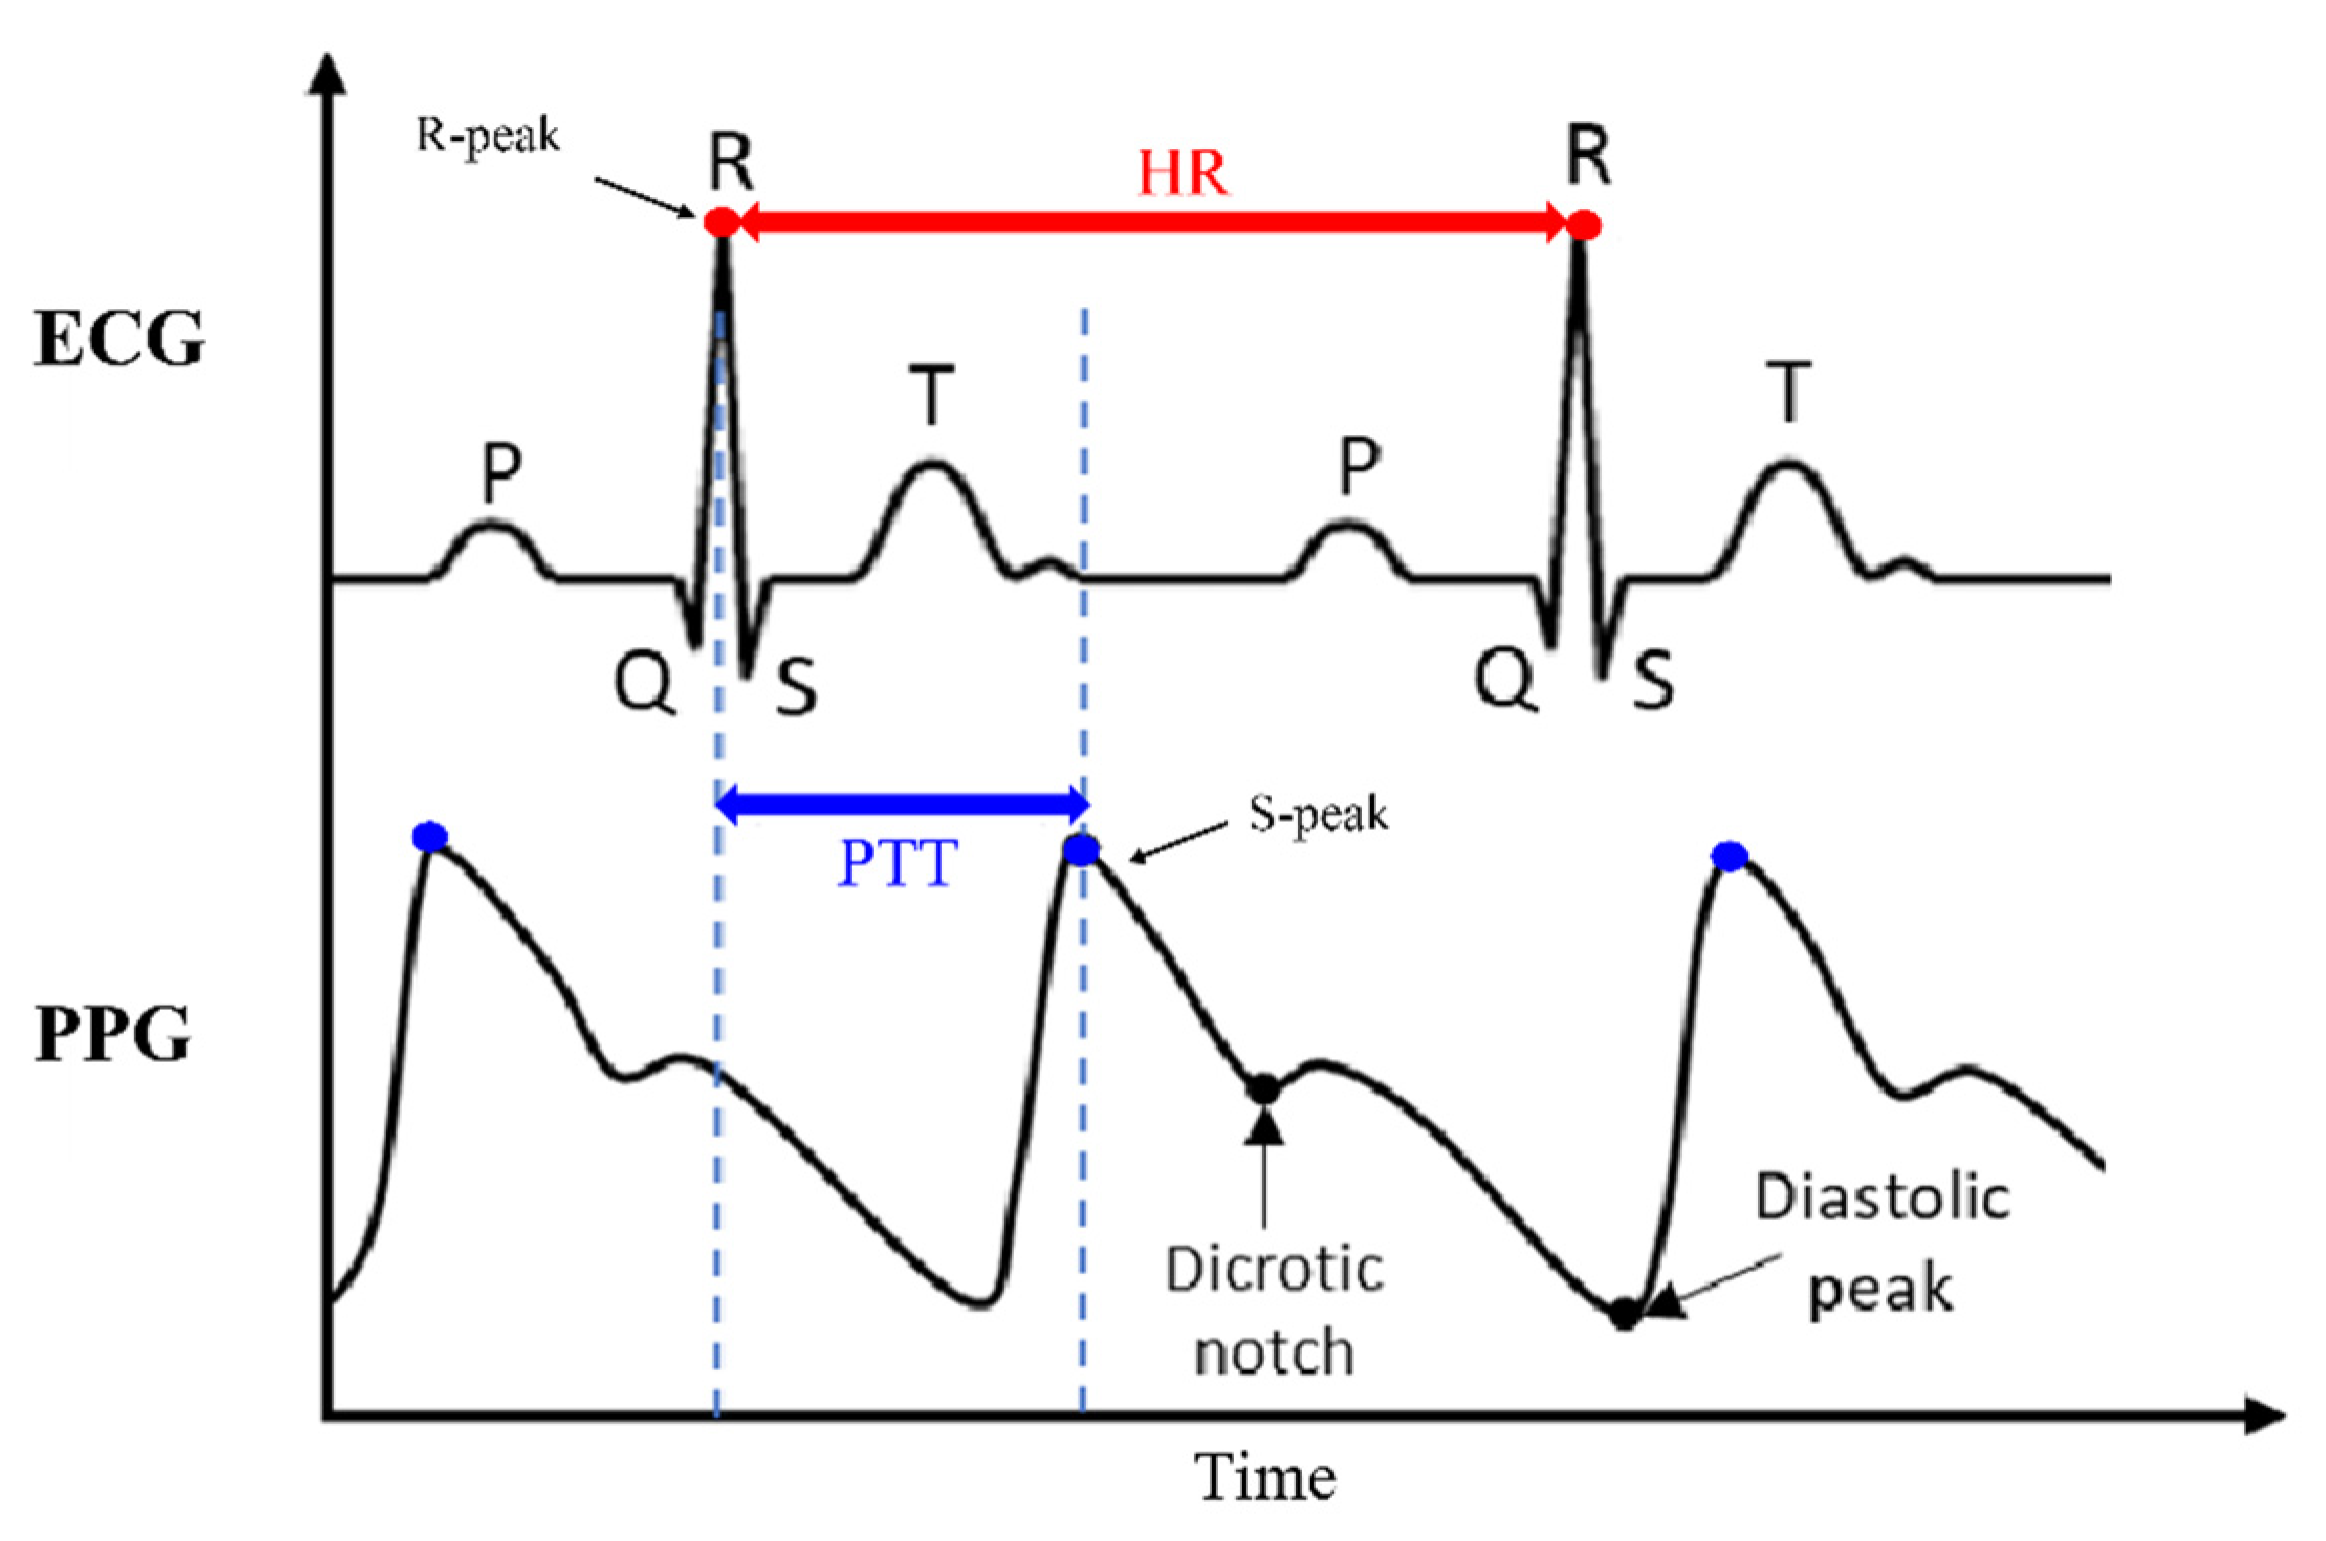
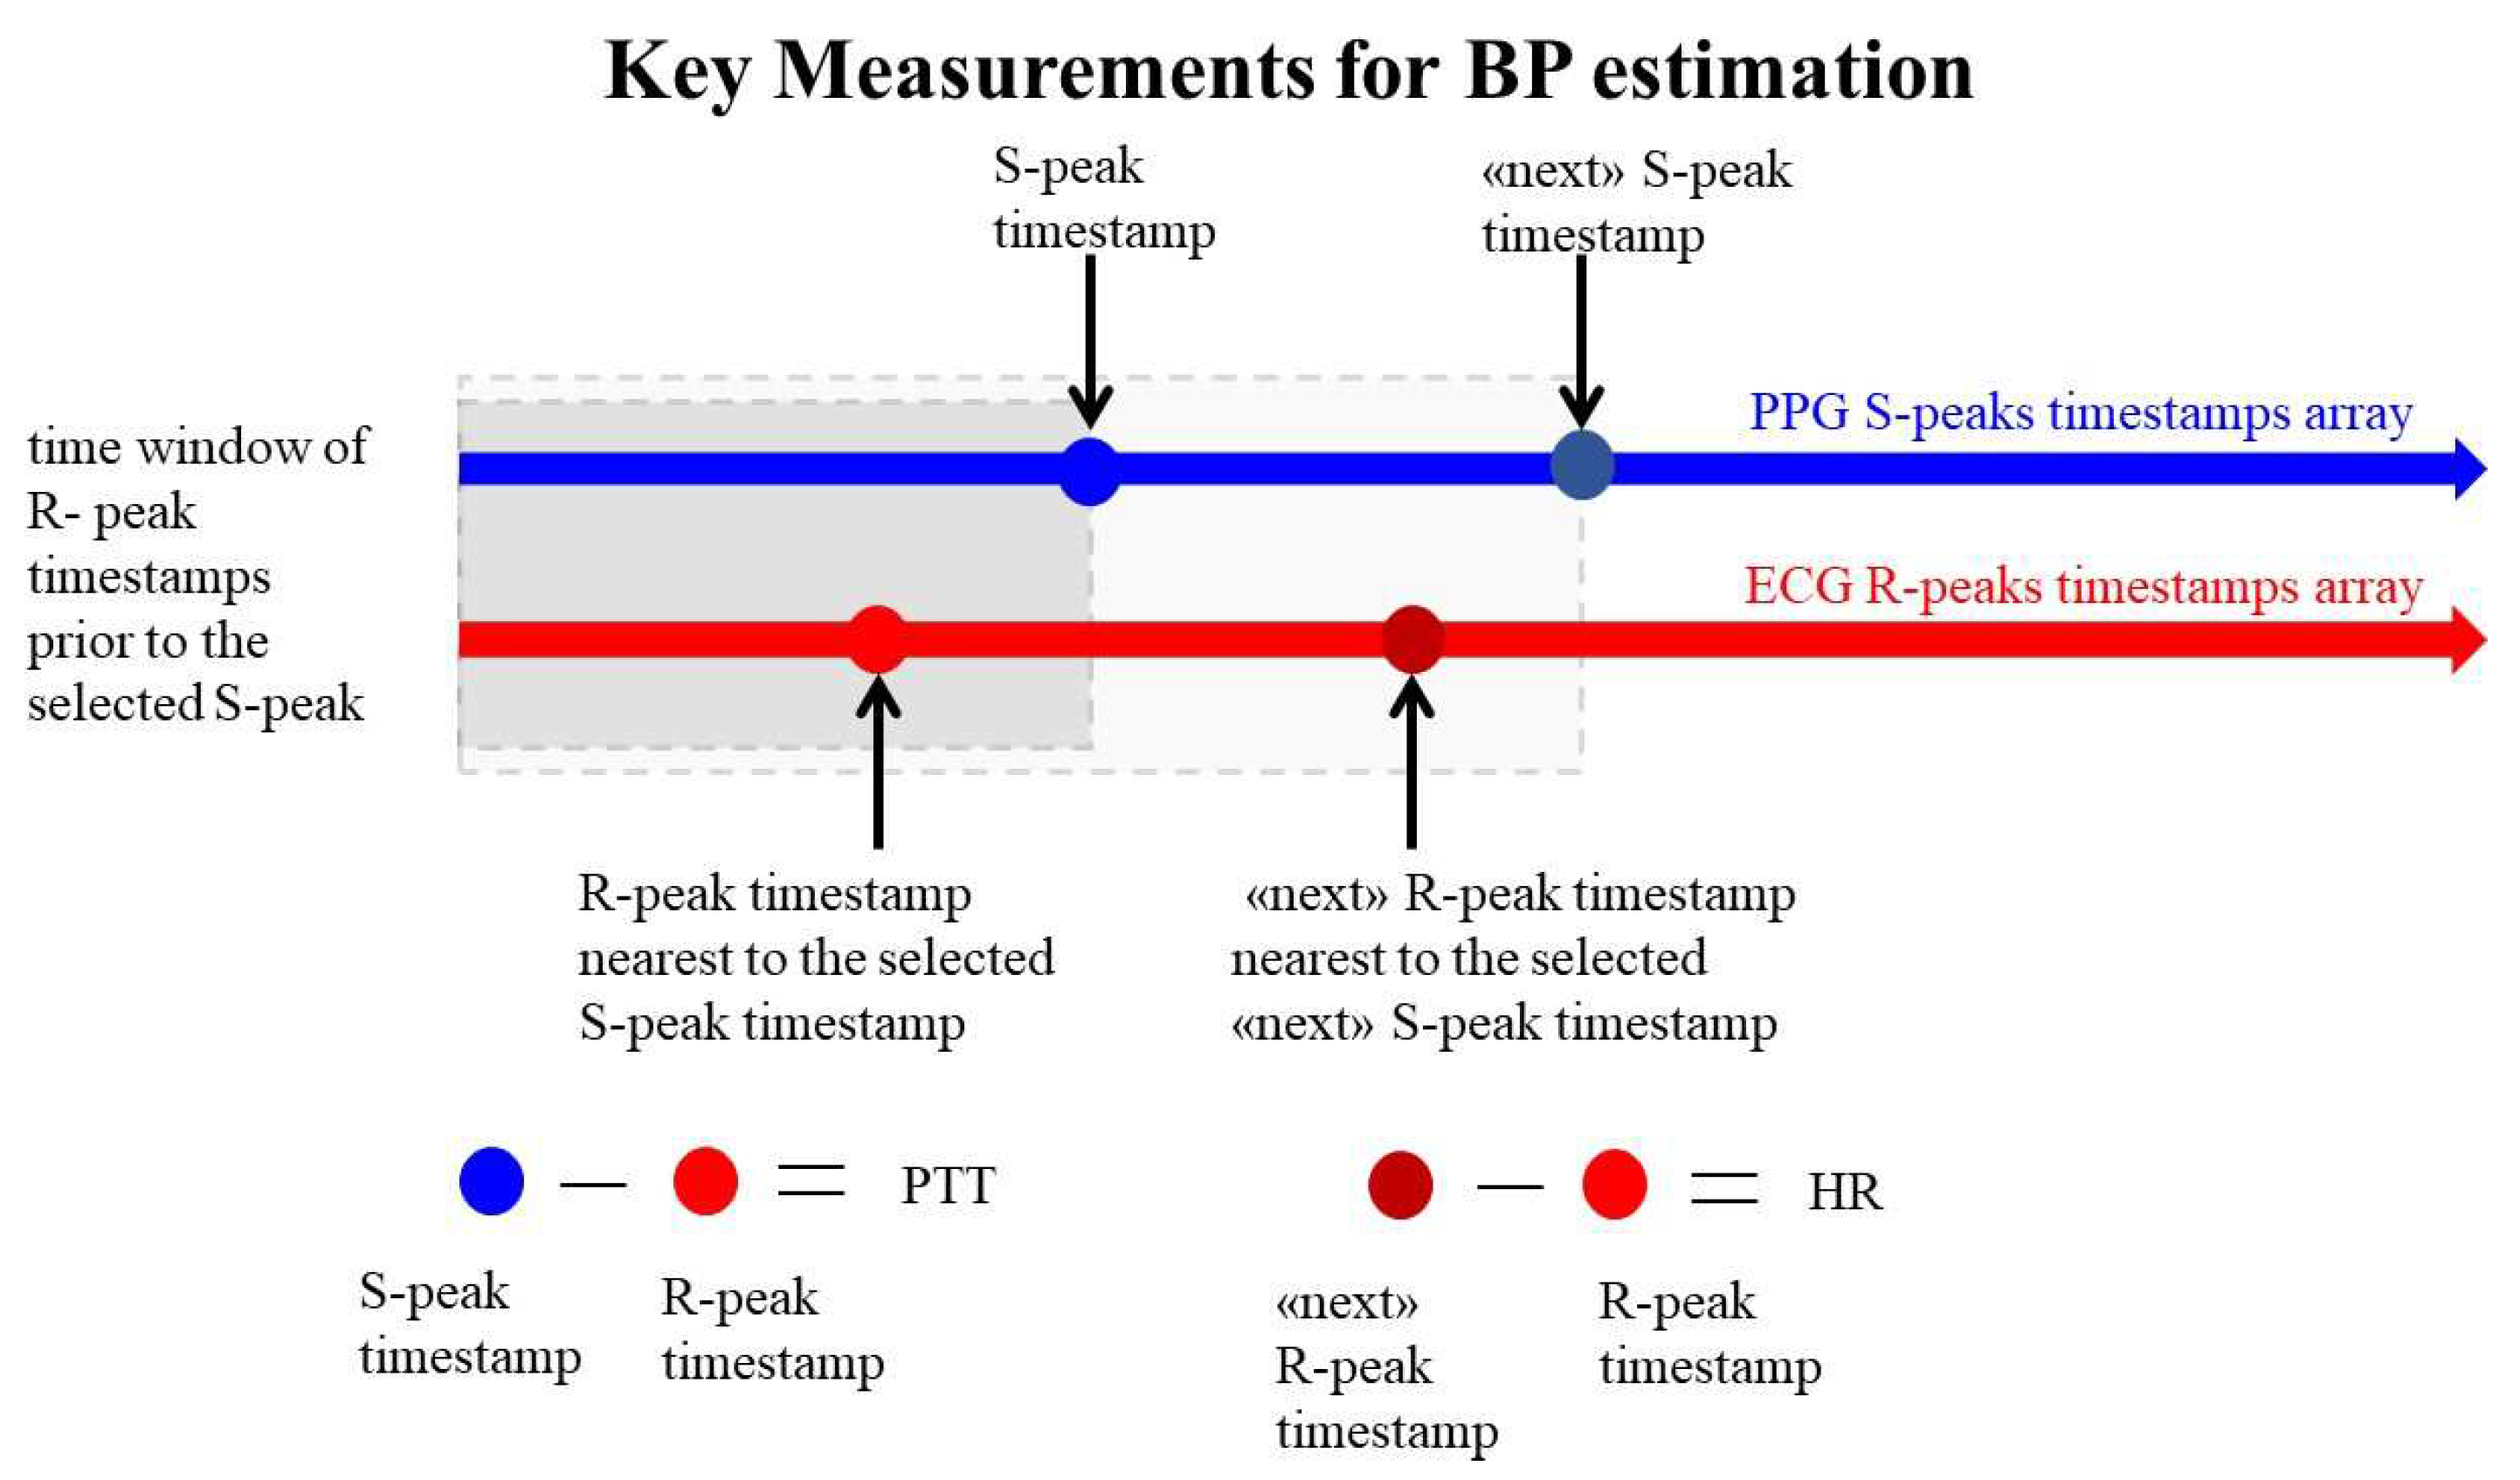
PPG, an optical signal, measures pulse patterns, revealing PTT: the duration it takes for blood to travel between two points in the circulatory system. PTT is assessed as the time interval between the R-peaks of ECG and the subsequent S-peak identified in PPG signal [
10], as illustrated in
Figure 1.
1.2. Estimation of Blood Pressure using Bramwell-Hills and Moens-Kortweg Equations
The correlation between BP and the HR and the PTT is established through the Bramwell-Hills and Moens-Kortweg equations, complemented by the pioneering findings of Leslie A. Geddes [
12,
13,
14]. The synthesis of these studies results in a linear approximation of BP, expressed in Eq. (2):
The coefficients a, b and c are subject-specific parameters that must be determinedthrough a calibration process. These coefficients depend on various factors, including vessel wall thickness, blood density, vessel diameter, length, and elastic modulus. Eq. (2) serves as the linear regression model employed in this study [
15], [
16]. To estimate maximum and minimum BP values, the assessment of Arterial Blood Pressure (ABP) is divided into Diastolic Blood Pressure (DBP) and Systolic Blood Pressure (SBP):
2. Material
2.1. Devices
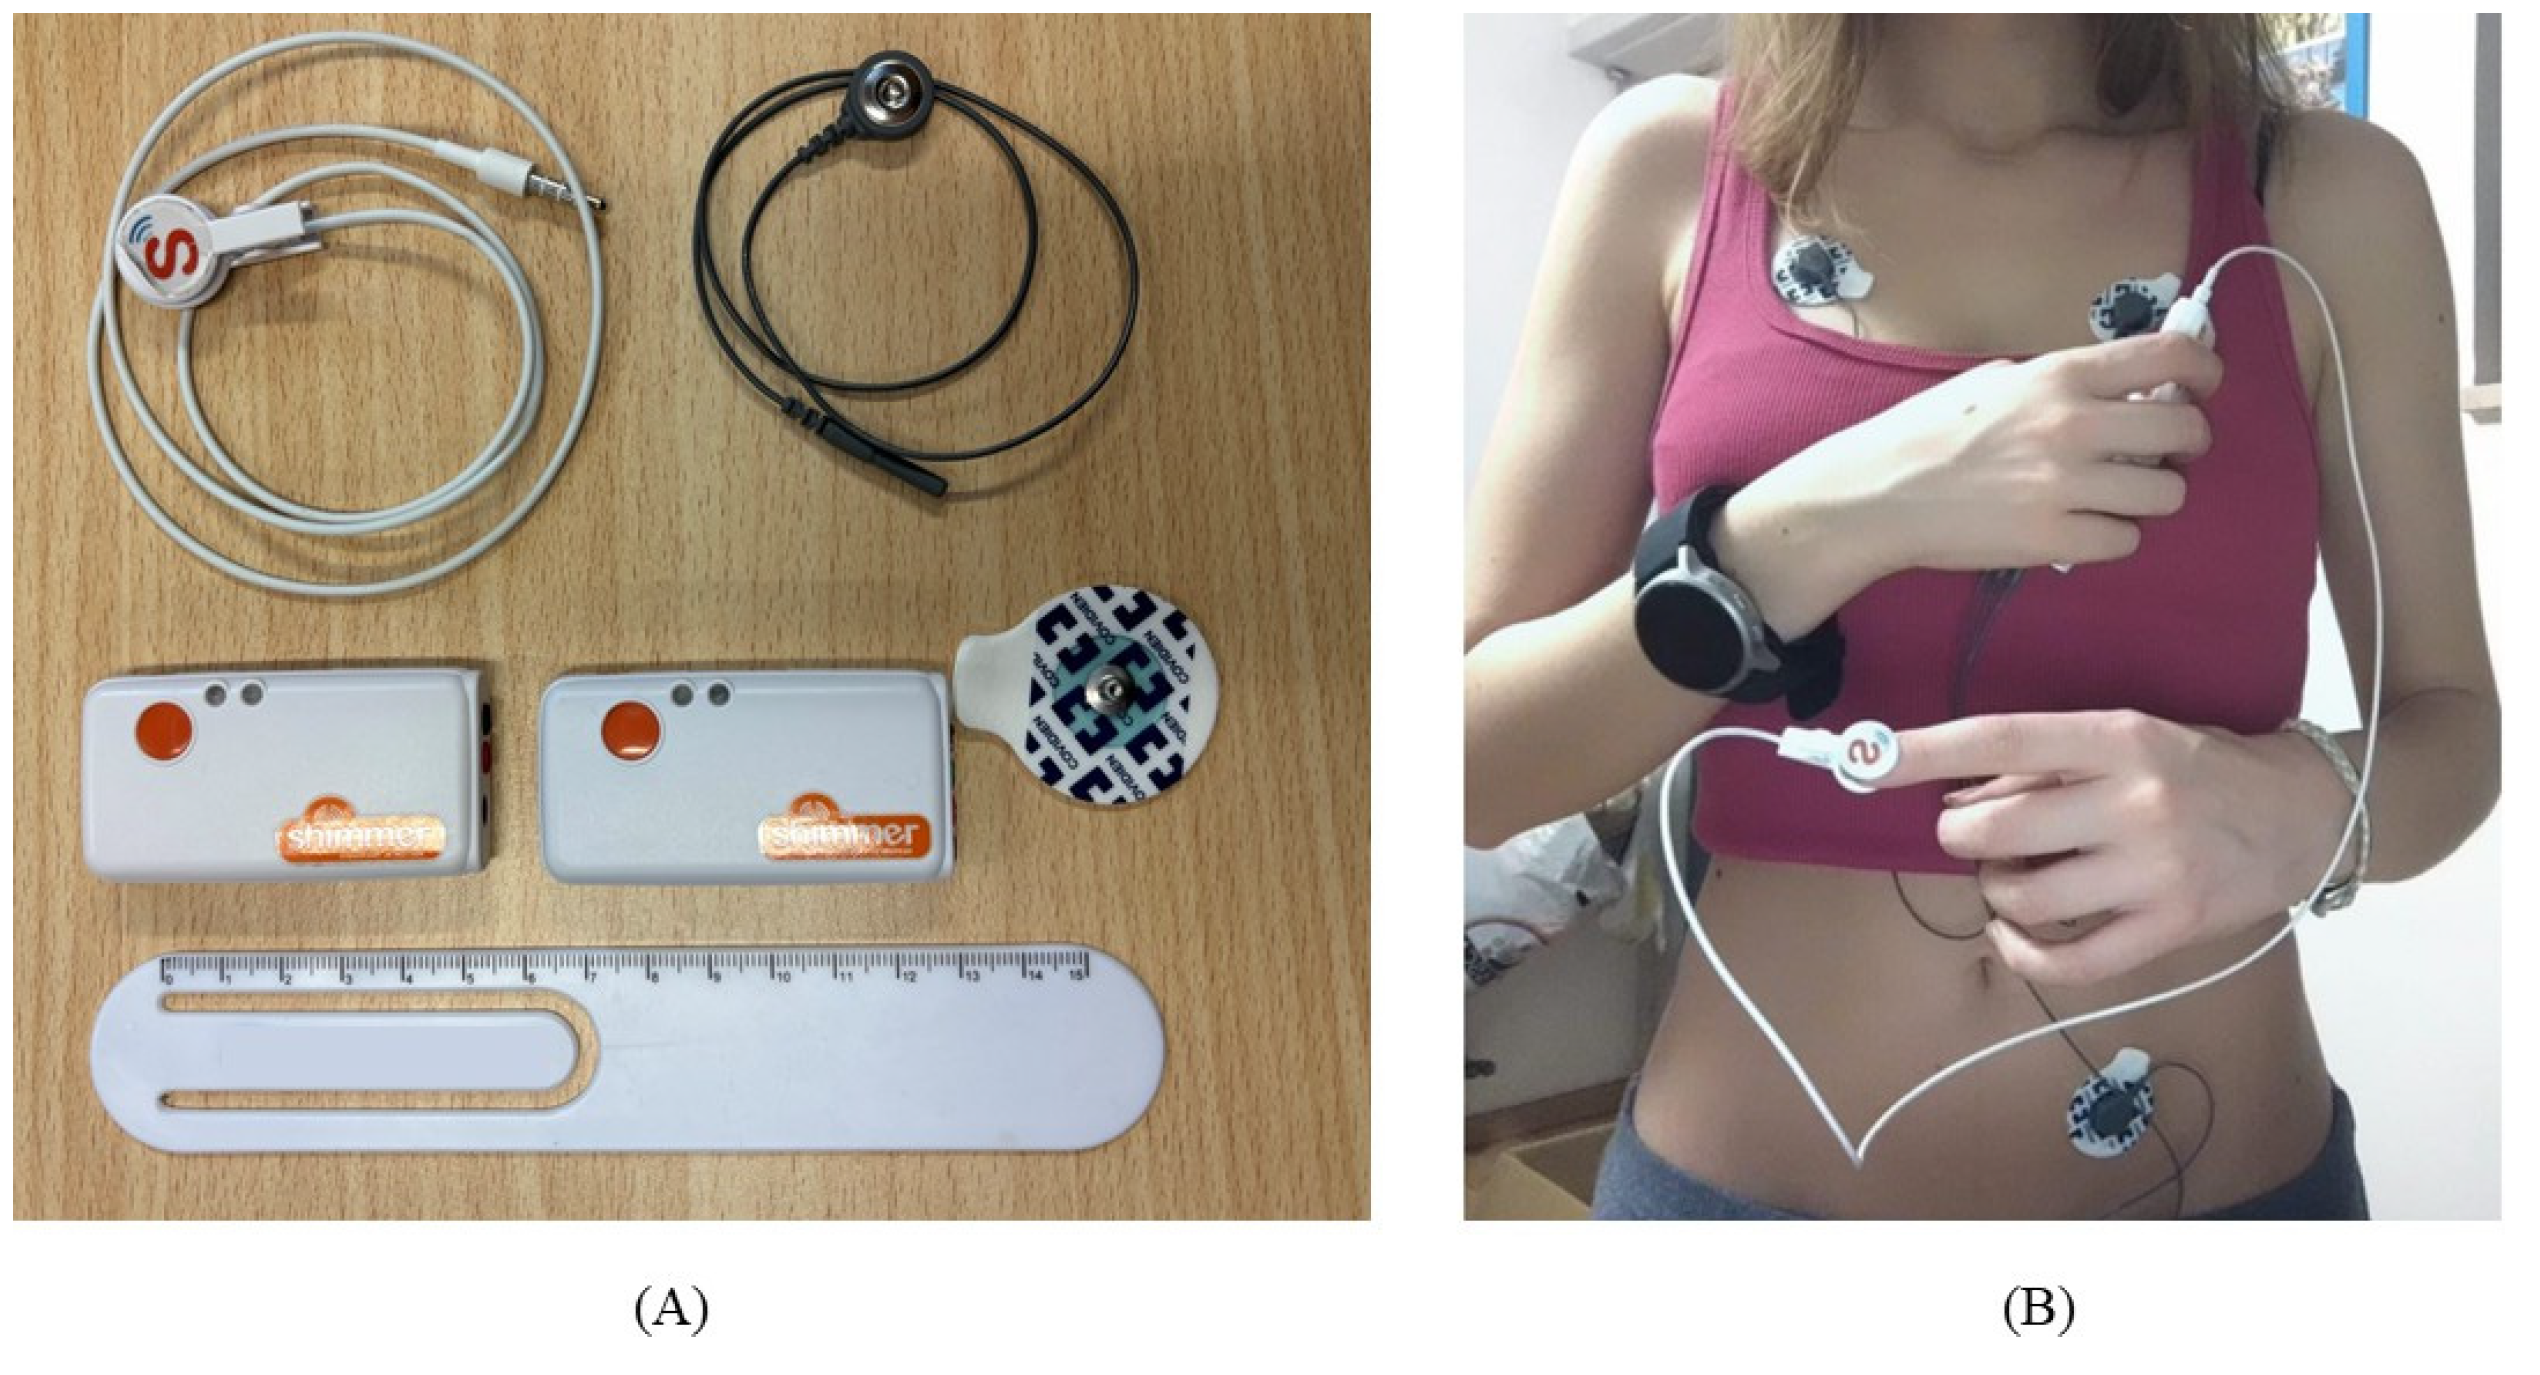
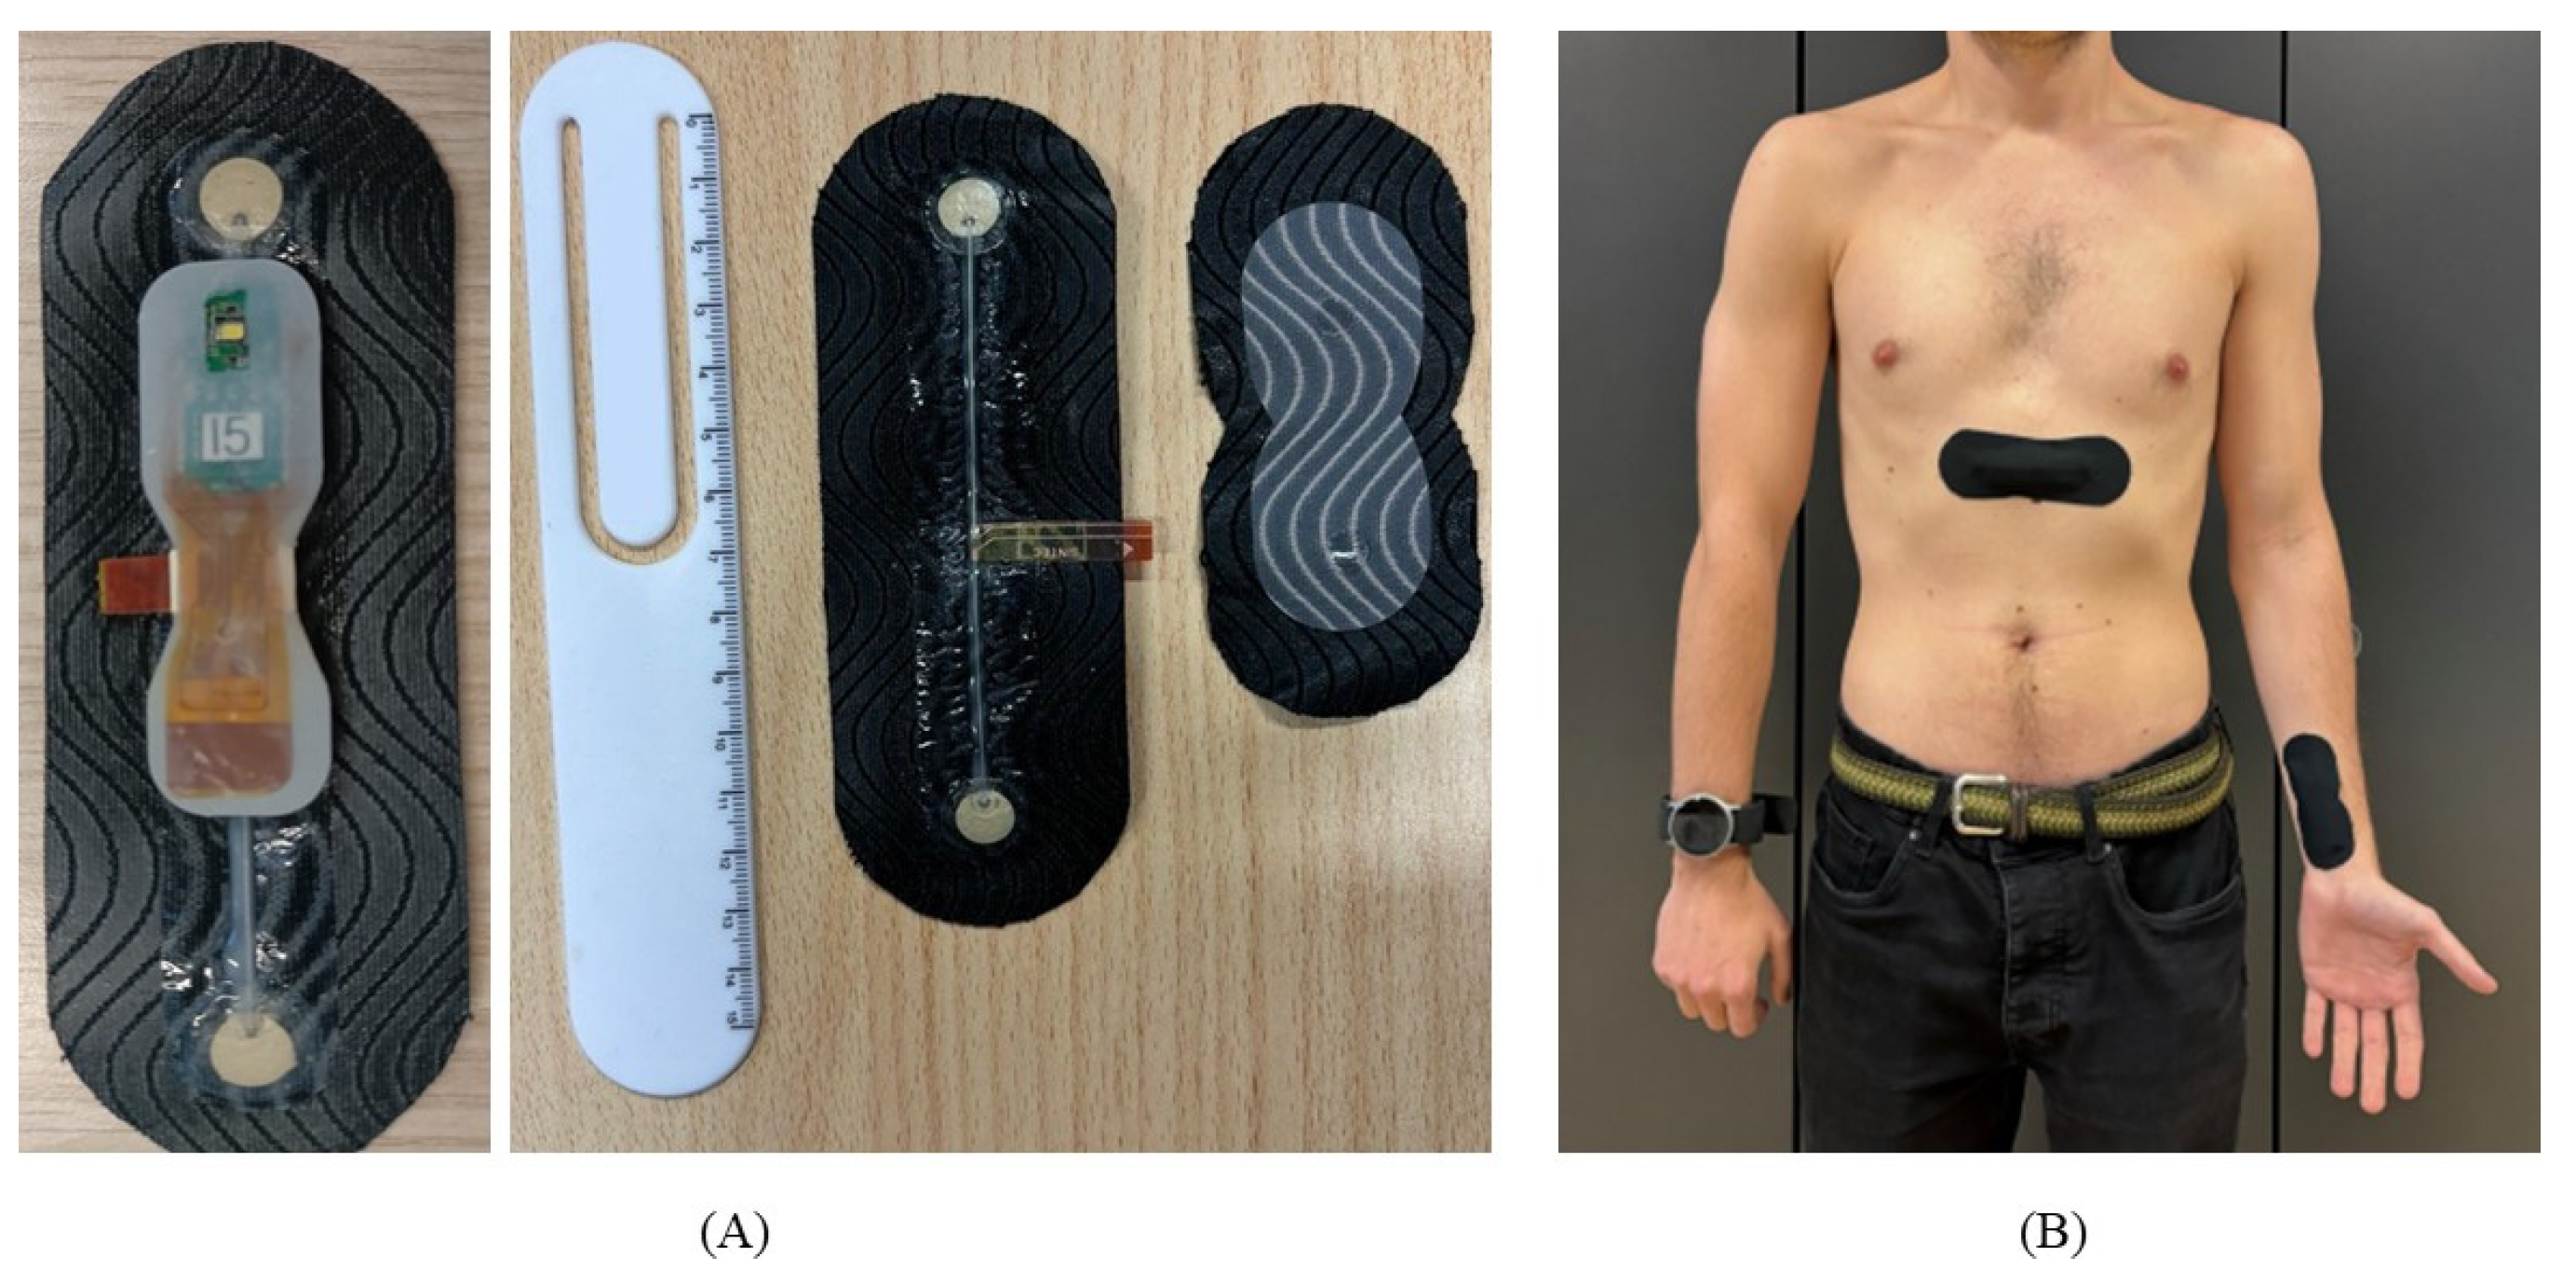
Shimmer and SINTEC devices and their respective setups, utilized in this study, are shown in
Figure 2 and
Figure 3. In
Table 1, the SINTEC devices are compared to the state-of- the-art Shimmer devices. The algorithm was trained while wearing devices with cuffs during the calibration phase. Laboratory recordings were conducted using the Omron HeartGuide [
17] to record BP values , whereas in the hospital environment, a professional sphygmomanometer was employed for accurate measurements.
2.2. Data collection
This study comprises 87 acquisitions, 18 conducted in a hospital and the remainder in a laboratory environment. Among them, 12 were acquired exclusively with SINTEC devices in the hospital setting. Additionally, in the hospital, it was possible to obtain 6 simultaneous acquisitions using both Shimmer and SINTEC devices on the same subjects. This study aims to understand the algorithm performance in various situations, considering different settings and signal characteristics.
3. The algorithm
In the section, the major steps of the BP algorithm are illustrated. The algorithm was implemented in Python; however, the code can be easily adapted for use in other coding environments like MATLAB.
3.1. Signal loading
ECG and PPG signals are provided in .mat files, each containing the signal data and the associated timestamp in Unix format. Additionally, a separate .csv file is loaded, containing 20 blood pressure recordings obtained from the reference device required for calibration. The .csv file is organized into three columns: Unix timestamp, SBP and DBP. To ensure consistency, the timestamps from the reference device were adjusted by subtracting 60 seconds from each value. This adjustment accommodates the fact that the measurements in the .csv file denote the time of the readings from the reference device, typically allowing for one minute per measurement. Then, it necessary to specify the sampling frequency for both ECG and PPG signals ( fsE, fsP).
3.2. Signal filtering
Signals are filtered after the loading phase. The delay introduced by the filtering techniques has minimal impact on the overall performance of the algorithm and it remains uncompensated. The delay introduced by the baseline removal function is identical in both signals, while the delay introduced by the low-pass Butterworth filter is negligible.
ECG filtering
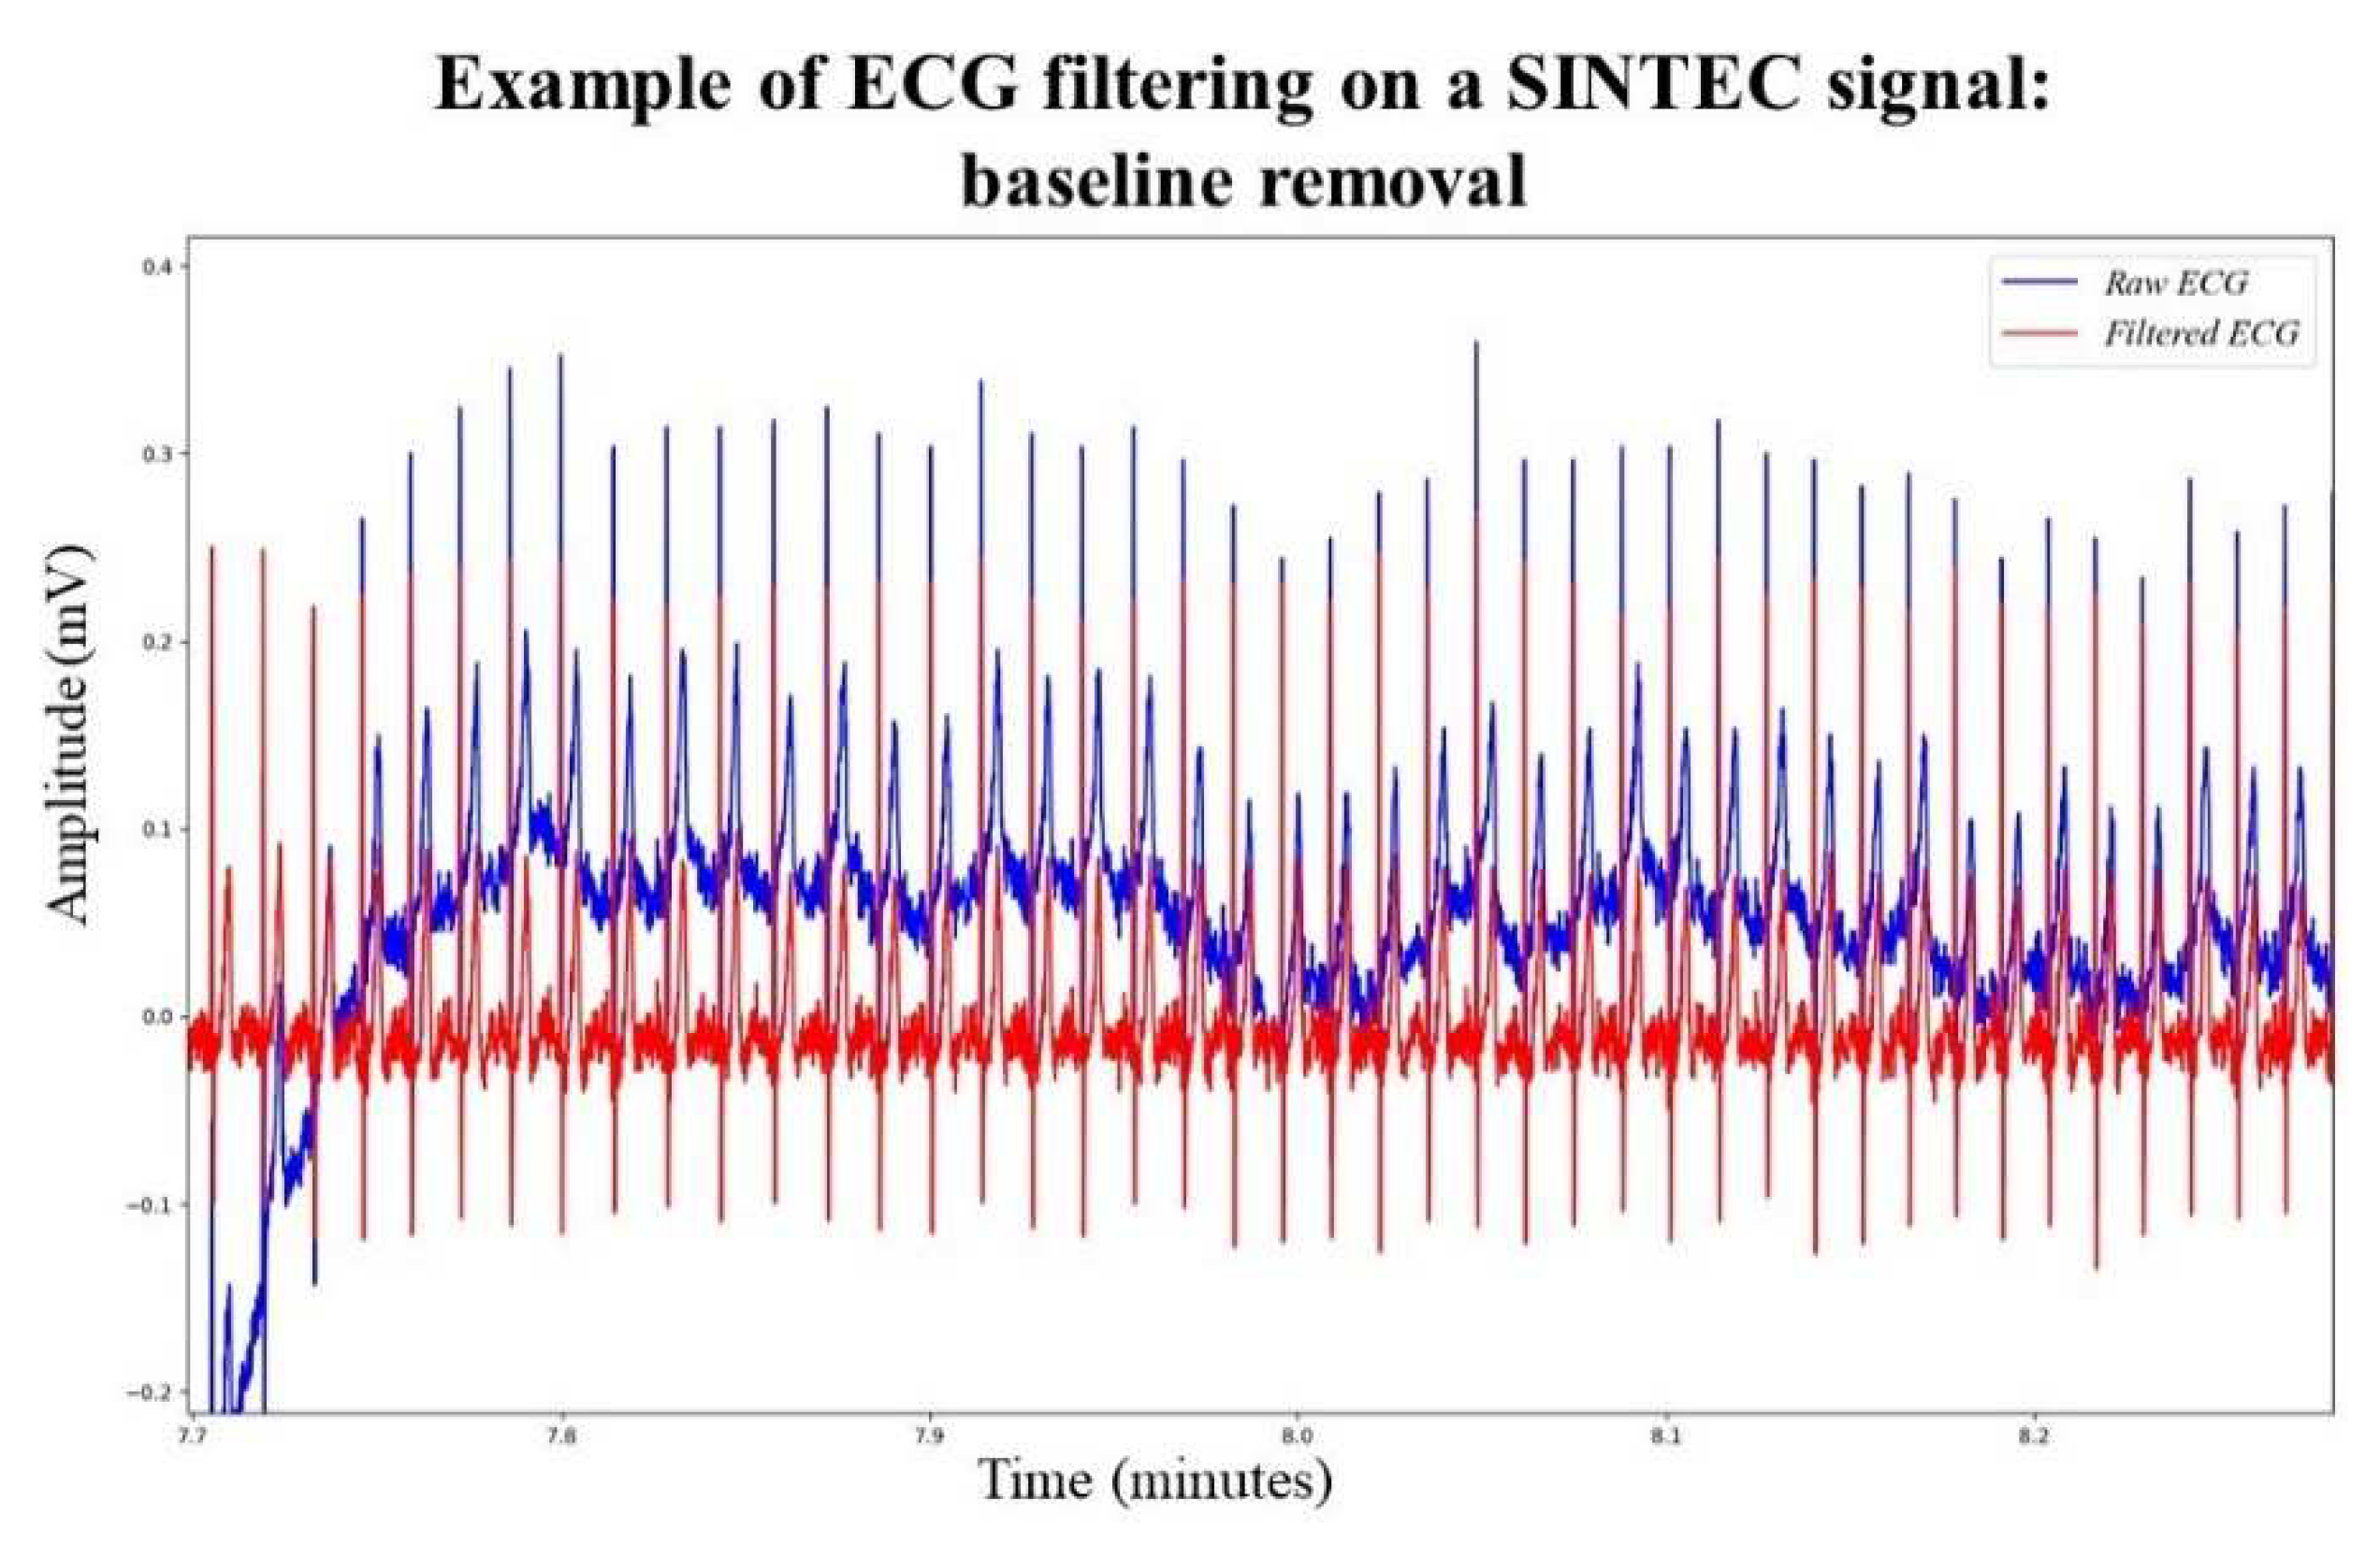
An initial signal quality assessment, done during SINTEC project, reveals that ECG signals can be affected by baseline wander, complicating the determination of R-peaks detection. In particular, the Shimmer ECG signals were more susceptible to baseline wander than the SINTEC ECG signals. To mitigate this, a function is introduced to flatten the input ECG signal and apply a moving average filter using a specified window size. The window size is experimentally set at 0.5 seconds. The smoothed signal is then subtracted from the original, eliminating the baseline noise,
Figure 4. This approach has demonstrated superior results compared to the baseline removal function based on envelopes adopted in [
16], as it minimizes peak distortion, especially in low-sampled signals.
PPG filtering
Due to the narrow bandwidth of PPG signals (with a low-frequency range of PPG Power Spectral Density from 1 Hz to 8 Hz) [
18], a non-equalized low-pass Butterworth filter is applied to the PPG signal to eliminate high-frequency noise. This filter is specifically configured with a 10 Hz cut-off frequency and a 8 Hz attenuation frequency. The chosen filter order is 4, as recommended in [
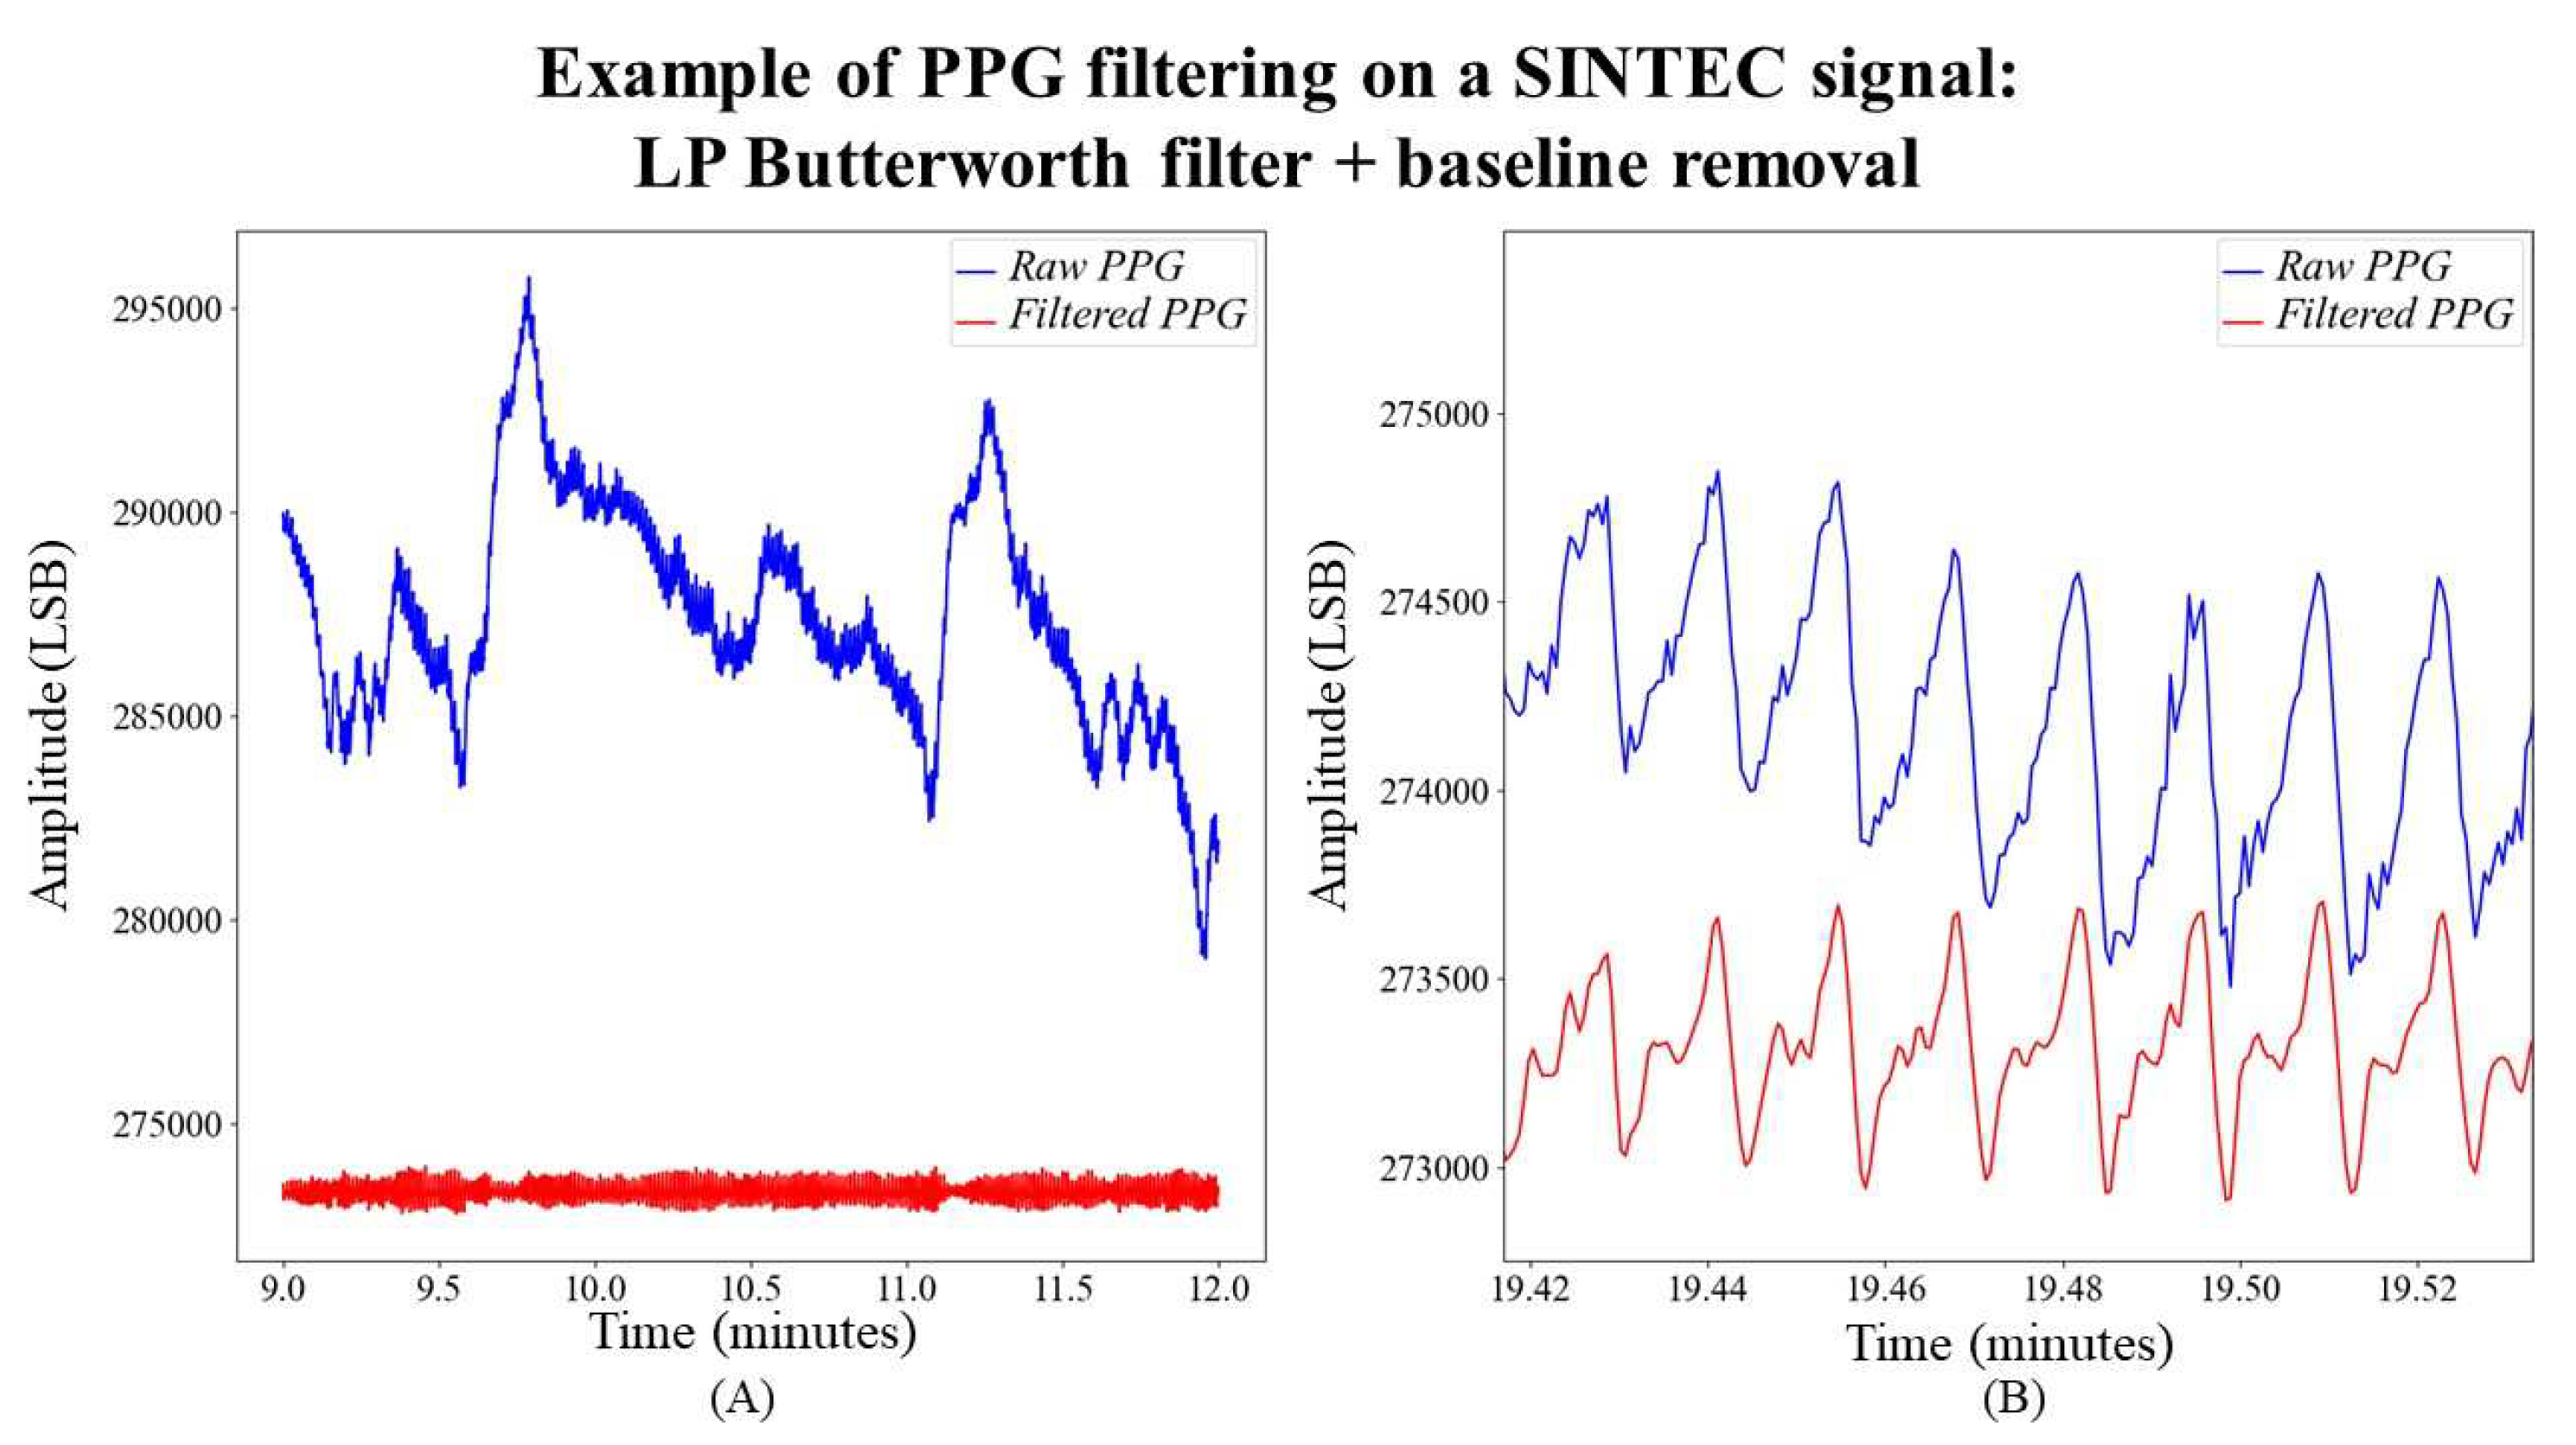
19]. The passband ripple and stopband attenuation are set at 0.1 dB and 15 dB, respectively. Following the filtering process, the signal undergoes further processing through the previously described baseline removal function, whose window size is set at 0.5 seconds. An example of the obtained result is shown in
Figure 5.
3.2. Signal preparing
Filtered signals are then aligned and cut in the following steps. Aligning signals is essential for optimal HR and PTT measurements. Ensuring simultaneous starts for both ECG and PPG signals is necessary, and this requires identifying corresponding start samples at the same time point. To achieve this alignment, the timestamp of the first measurement from the reference device is utilized. It helps determine the initial samples of both ECG and PPG by identifying the indices with the least positive differences between the reference timestamp and the signals. Then, the signals are cut to a duration of 20 minutes, according to this study scenario.
3.3. Key measurements for BP estimation: PTT and HR
A critical step involves detecting R-peaks and S-peaks from ECG and PPG signals. Experimentally selecting optimal thresholds for peak detection in both signals is necessary. To enhance peak detection precision, local maxima detection is performed by eliminating smaller peaks within a specific time interval. This interval is set experimentally as half of the time difference between adjacent peaks time stamps. R-peaks and S-peaks timestamps are then used for HR and PTT calculations. First, each S-peaks timestamp is matched with the corresponding R-peaks timestamp, sorted chronologically. The selected R-peaks timestamp is one that precedes the current S-peaks timestamp in processing order. If the R-peak timestamp is found, PTT is calculated by subtracting the R-peak timestamp from the current S-peak timestamp. The identified R-peaks timestamps are then used to calculate HR, as shown in
Figure 6.
This approach offers a dual advantage. It eliminates the requirement for ECG and PPG signals to be sampled at the same frequency. This flexibility proves beneficial in conserving bluetooth bit transfer rate, especially for wearable devices. Furthermore, PPG signal quality poses challenges as peaks can be significantly attenuated. By selecting key points from S-peaks timestamps, more reliable measurements can be obtained. This is because S-peaks detection involves selecting a threshold based on visual inspection, ensuring accurate identification of peaks.
3.5. Selection of training and test points
It is necessary to generate an interpolating time array from ECG and PPG timestamps to facilitate proper interpolation of the reference device timestamps and blood pressure values (SBP and DBP). The same interpolating time array is utilized for interpolating HR and PTT values. Subsequently, a function is applied to diminish the dimensionality of the data, yielding arrays representative of essential measurements over 10-second intervals.
3.6. Linear Regression
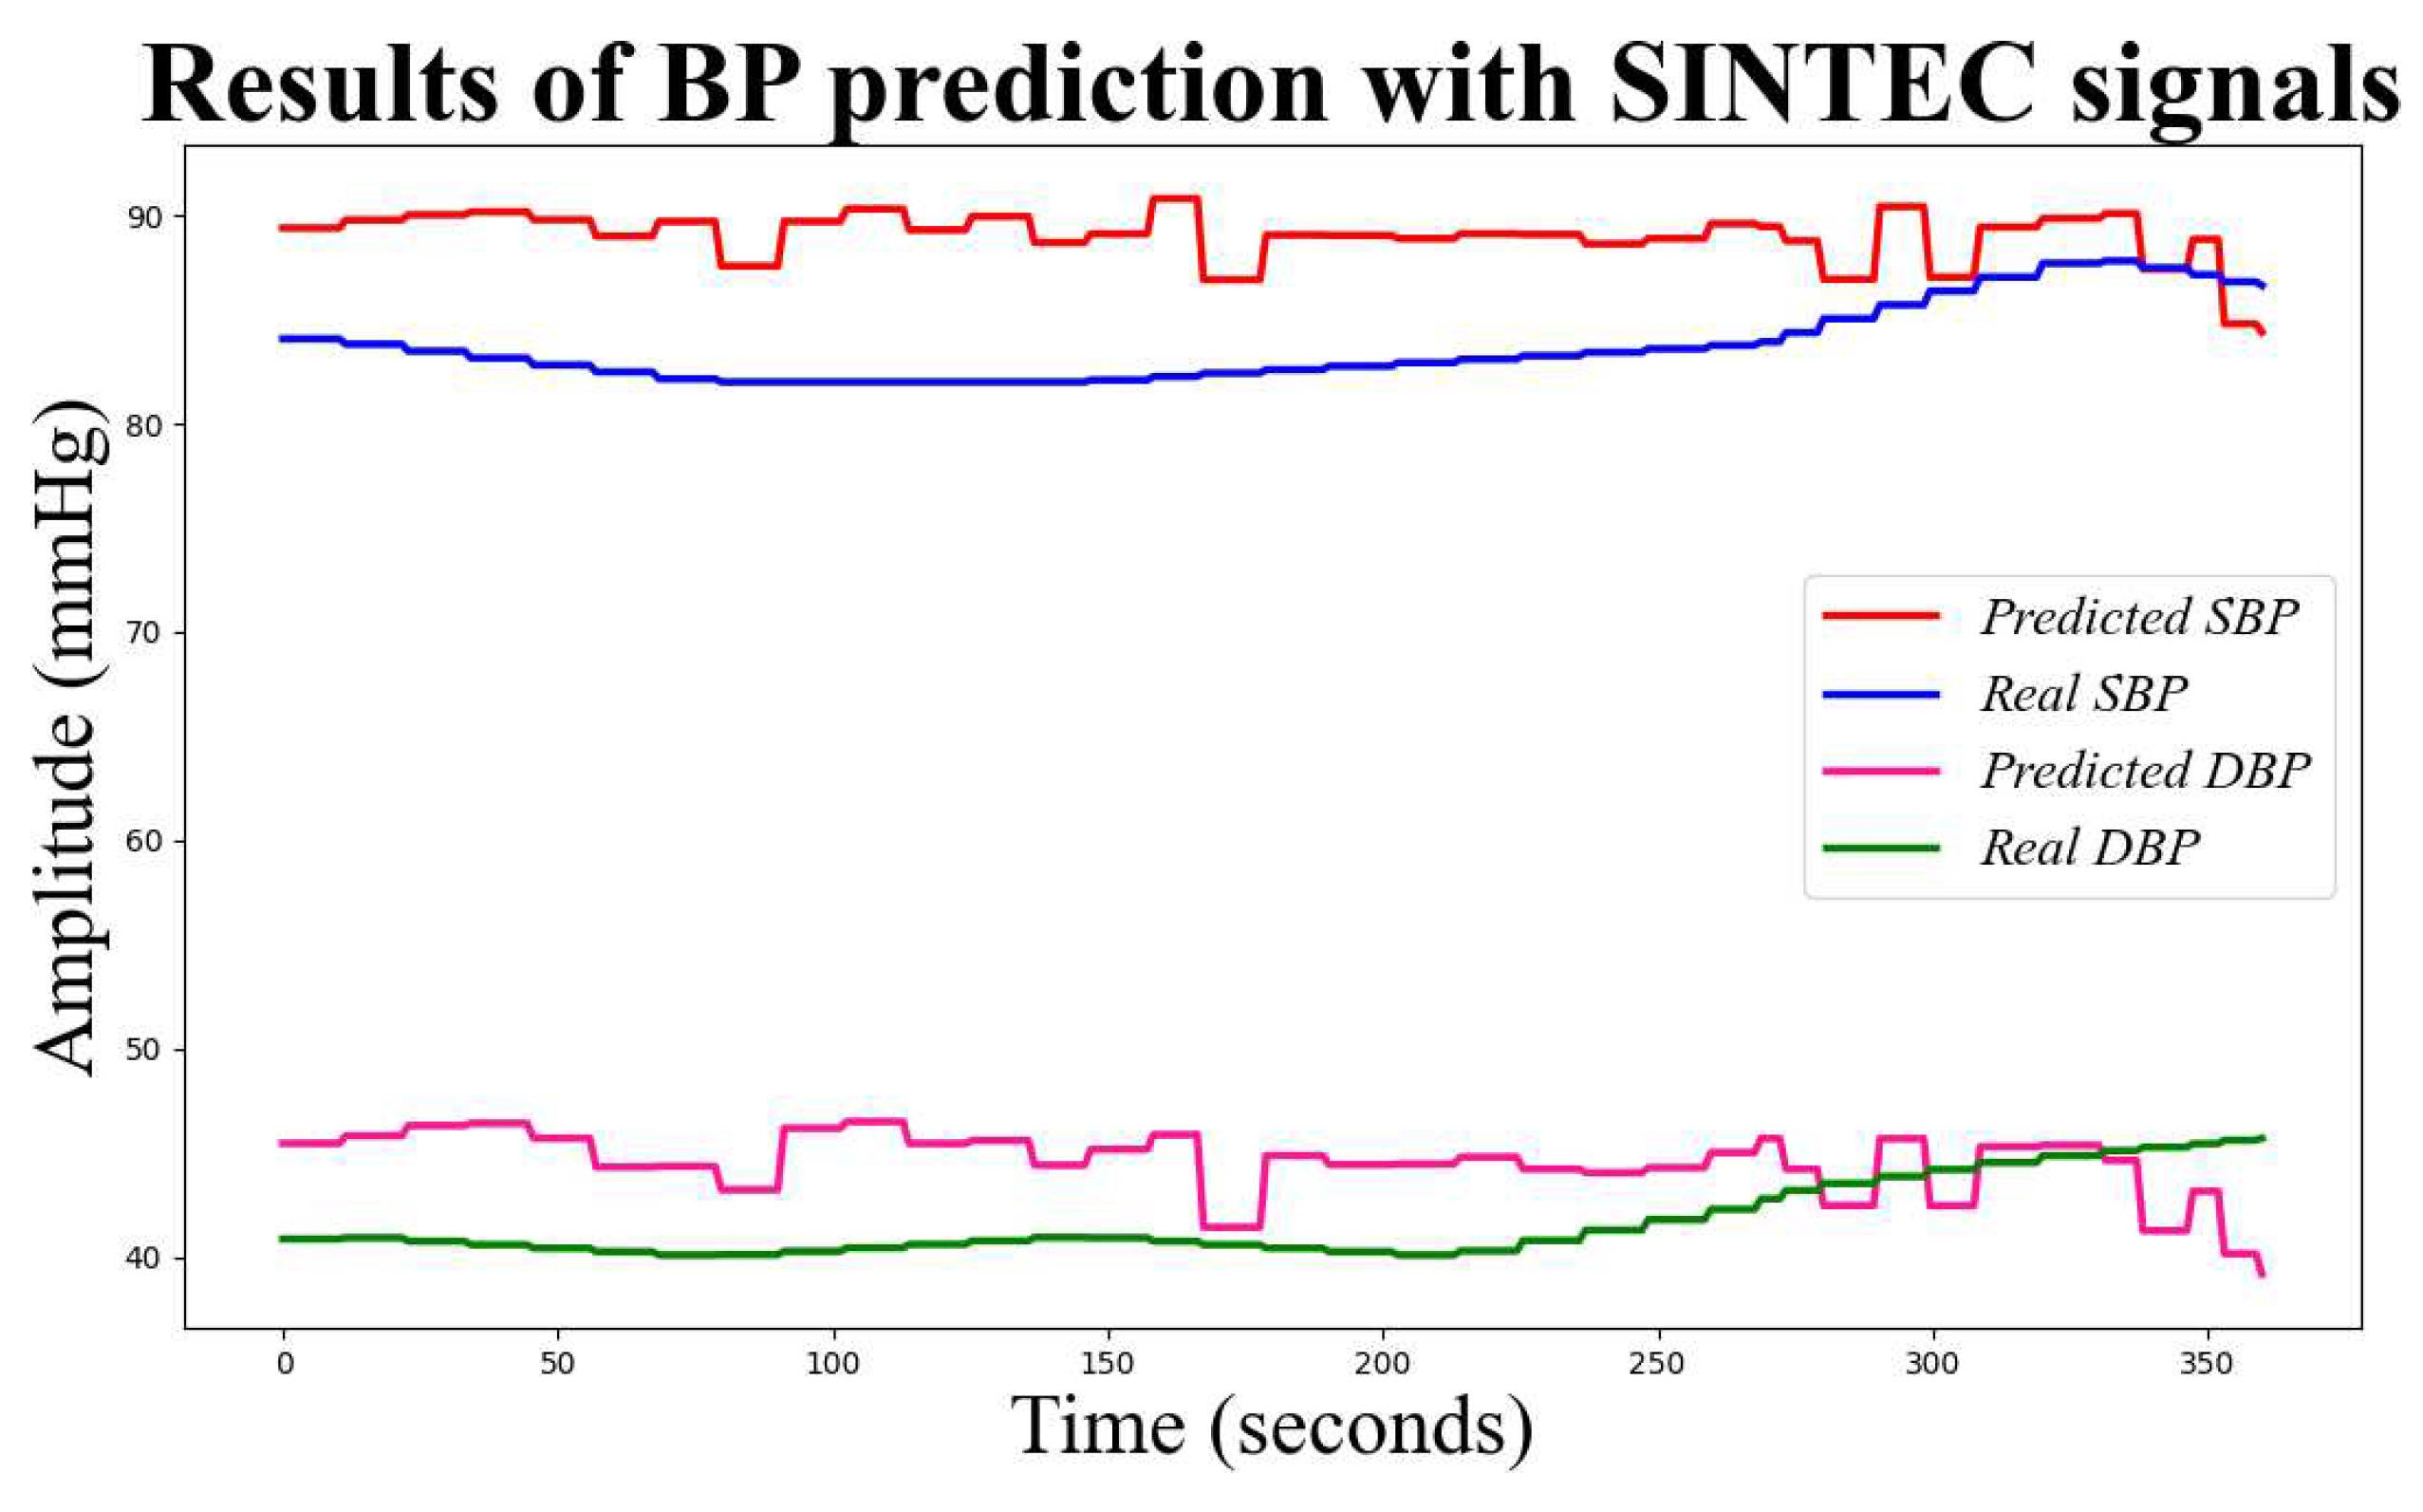
The final step involves preparing the training and test datasets, comprising 70% and 30% of the entire dataset, respectively. A cleaning process is performed on the training set. The outliers are identified using the mean and standard deviation. The mean and standard deviation of the PTT and HR data are calculated, and any data points that fall outside the range of mean ± standard deviation are considered outliers. PTT and HR serve as input data for the selected linear regression model in this study. The model is trained and tested using the SBP and DBP values of the reference device. Subsequently, the model provides predicted values for SBP and DBP, along with the corresponding mean absolute errors (MAE) and standard deviations (SD). In
Figure 7 predicted and actual values of SBP and DBP using the BP algorithm on SINTEC signals.
4. Results
According to ANSI/AAMI/ISO 810602:2018 [
20], for a database of at least 85 measurements, the difference between the investigated method and the reference device should be:
The BP algorithm, employing the timestamp approach, has demonstrated promising accuracy.
Table 2 presents the average MAE and SD values obtained across the entire database. The results, when compared with the ANSI/AAMI/ISO ISO 81060-2:2018 guideline [22], indicate significant potential for the practical application of the BP algorithm in real scenarios involving wearable devices.
In
Table 3, a comparison of BP accuracy results for SINTEC and Shimmer signals in a clinical environment is presented. A clinical setting, characterized by power line interference and other noises stemming from the concentrated presence of instruments, was considered [23]. Despite SINTEC devices facing challenges such as Bluetooth interruptions and high noise sensitivity, the results remained promising and demonstrated a slight improvement over the outcomes obtained in the same acquisition session with Shimmer 176 devices.
These results are encouraging for the feasibility of wearable solutions in BP monitoring algorithms using this study algorithm. It appears that achieving an acceptable level of accuracy in BP estimation does not necessarily require highly-frequency sampled signals, as demonstrated by the comparable performance of SINTEC and Shimmer signals. Focus on peaks, rather than the morphological goodness of signals, contributes to the robustness of BP estimation even at lower fs. This not only benefits Bluetooth communication and battery life but also highlights the resilience of the algorithm to interruptions and noise in clinical environments.
5. Discussion
BP algorithm aims to long-term monitoring of BP in both clinical settings and daily activities. However, prolonged monitoring poses challenges as both ECG [24,25] and PPG [26] signals become more susceptible to corruption by MA, potentially impacting prediction accuracy. To overcome this challenge, two strategies involving accelerometer signals have been envisioned. The following strategy has been assessed on 40 Shimmer signals deliberately corrupted by motion artifacts, and the results were discussed in [27], representing a starting point for future strategies.
5.1. Adaptive filter
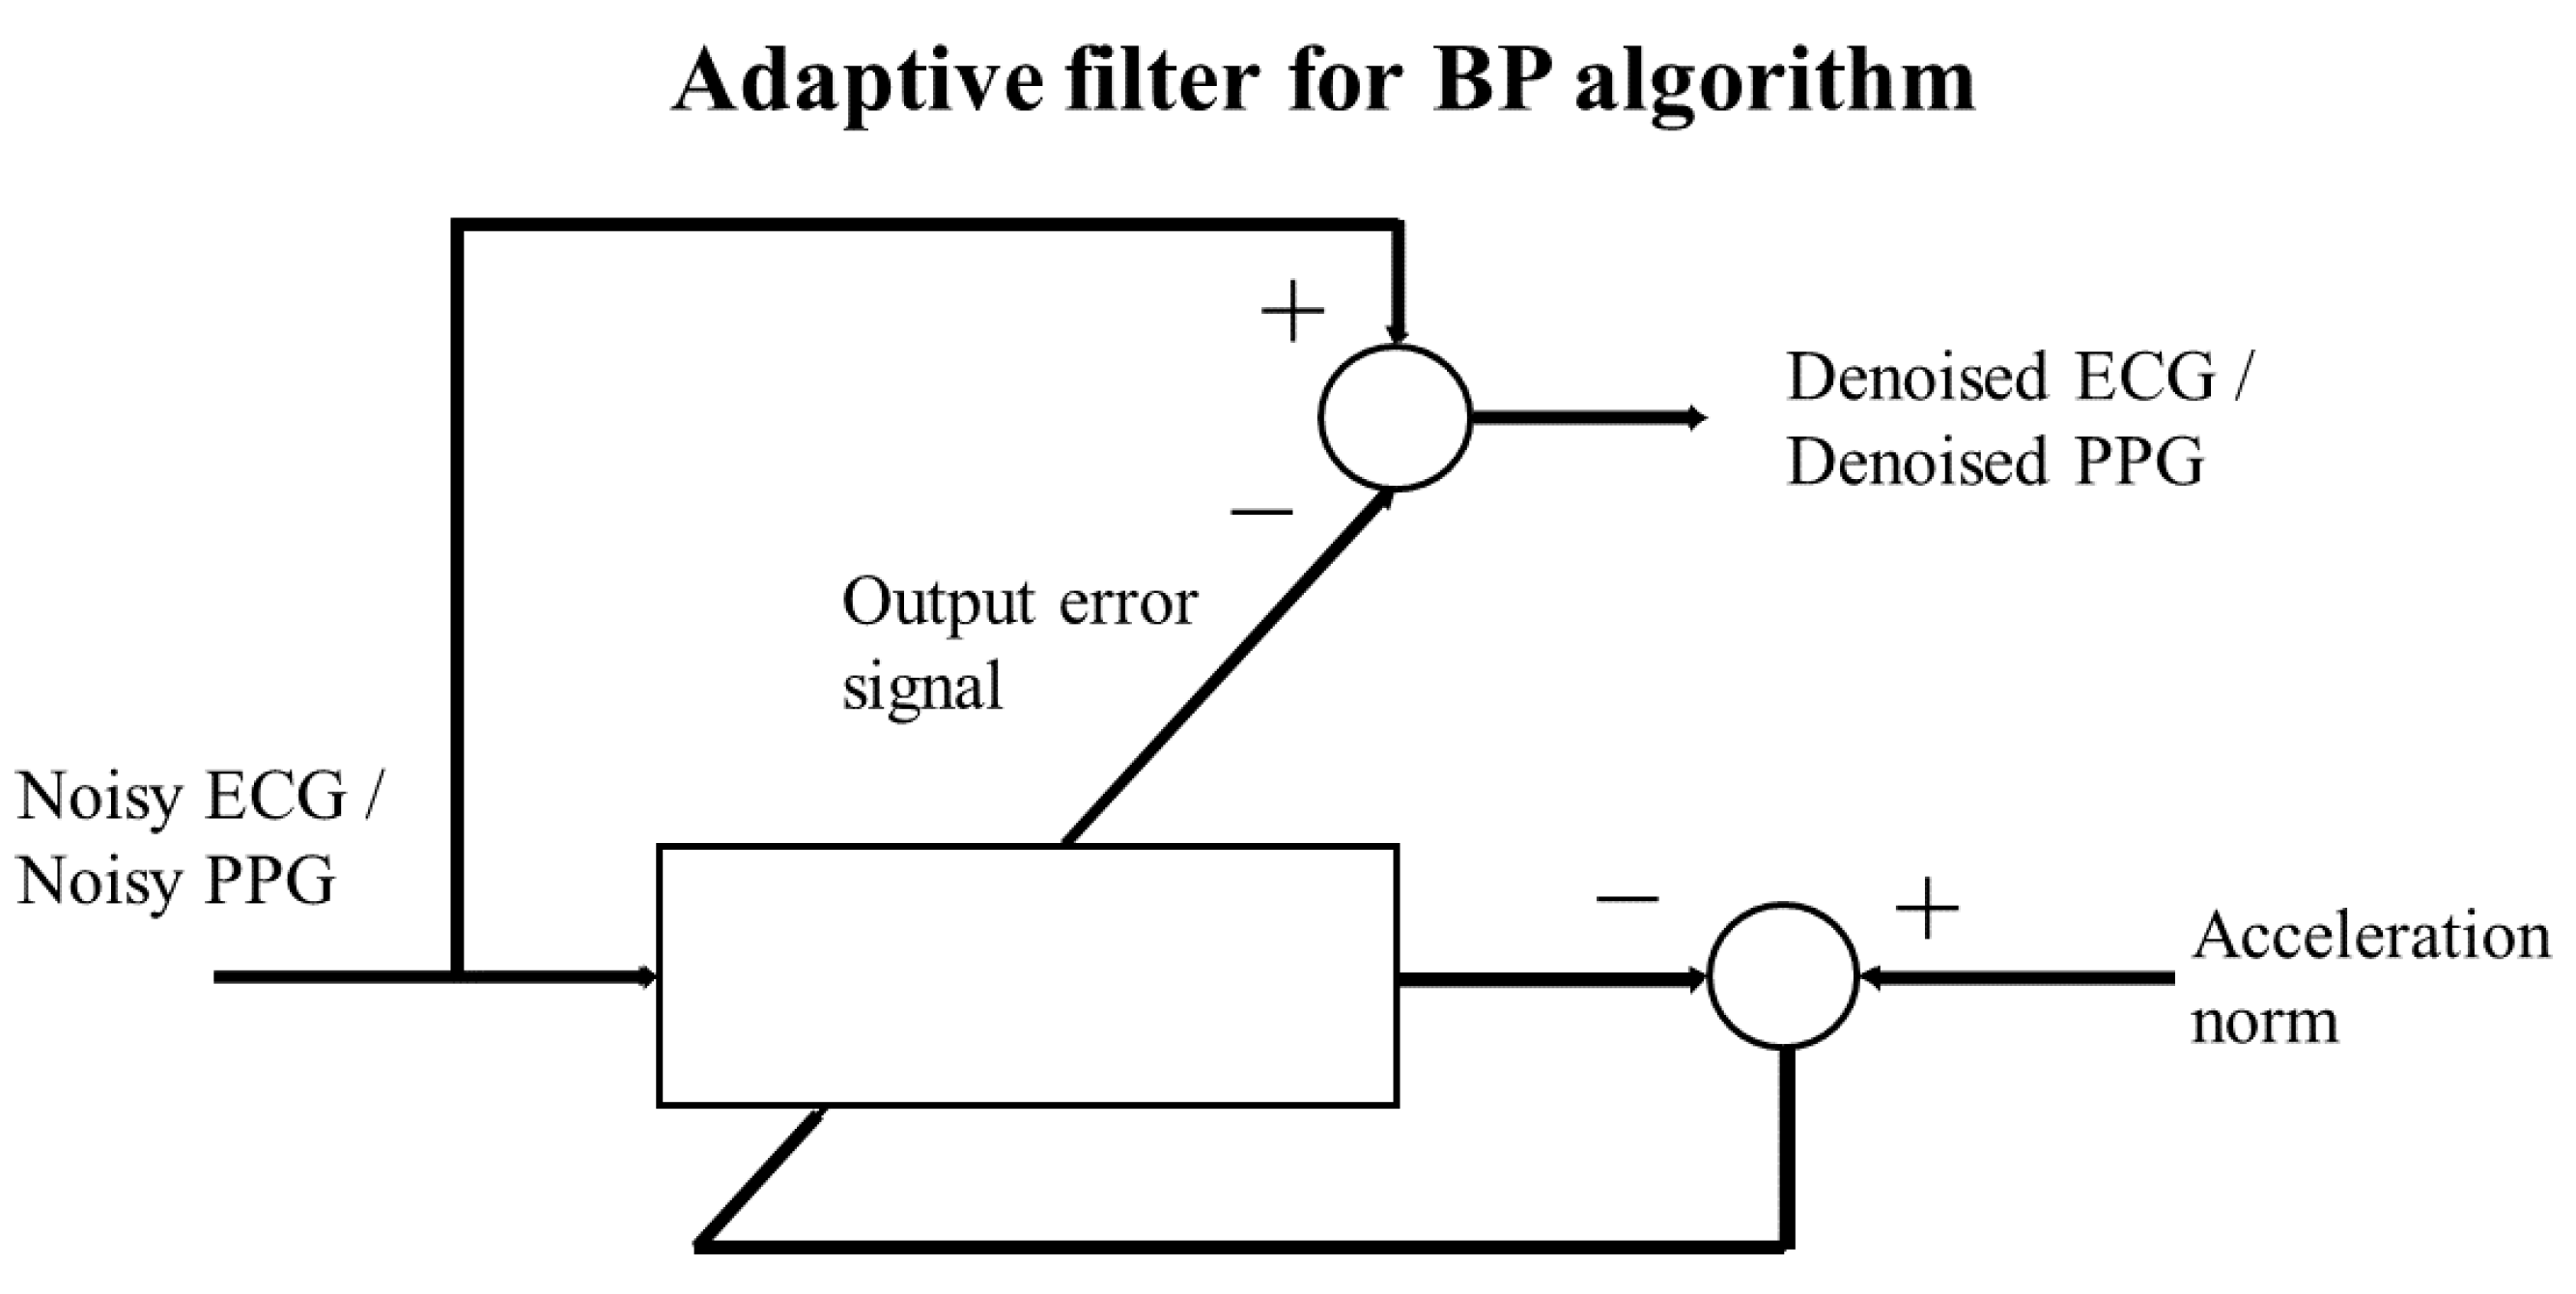
Ad discussed in [27] to mitigate potential motion artifacts induced by subtle movements, such as hand gestures or walking, an adaptive filter can be employed. Specifically, the filter utilizes the norm of accelerometer signals, recorded simultaneously with physio-logical signals, as the target signal for the Least Mean Squares (LMS) adaptive filter, [28]. The LMS filter takes the noisy PPG and ECG signals as input signals, producing denoised ECG and PPG signals by computing the difference between the noisy signals and the error output of the LMS filter, as illustrated in
Figure 8.
5.2. Peaks cleaning
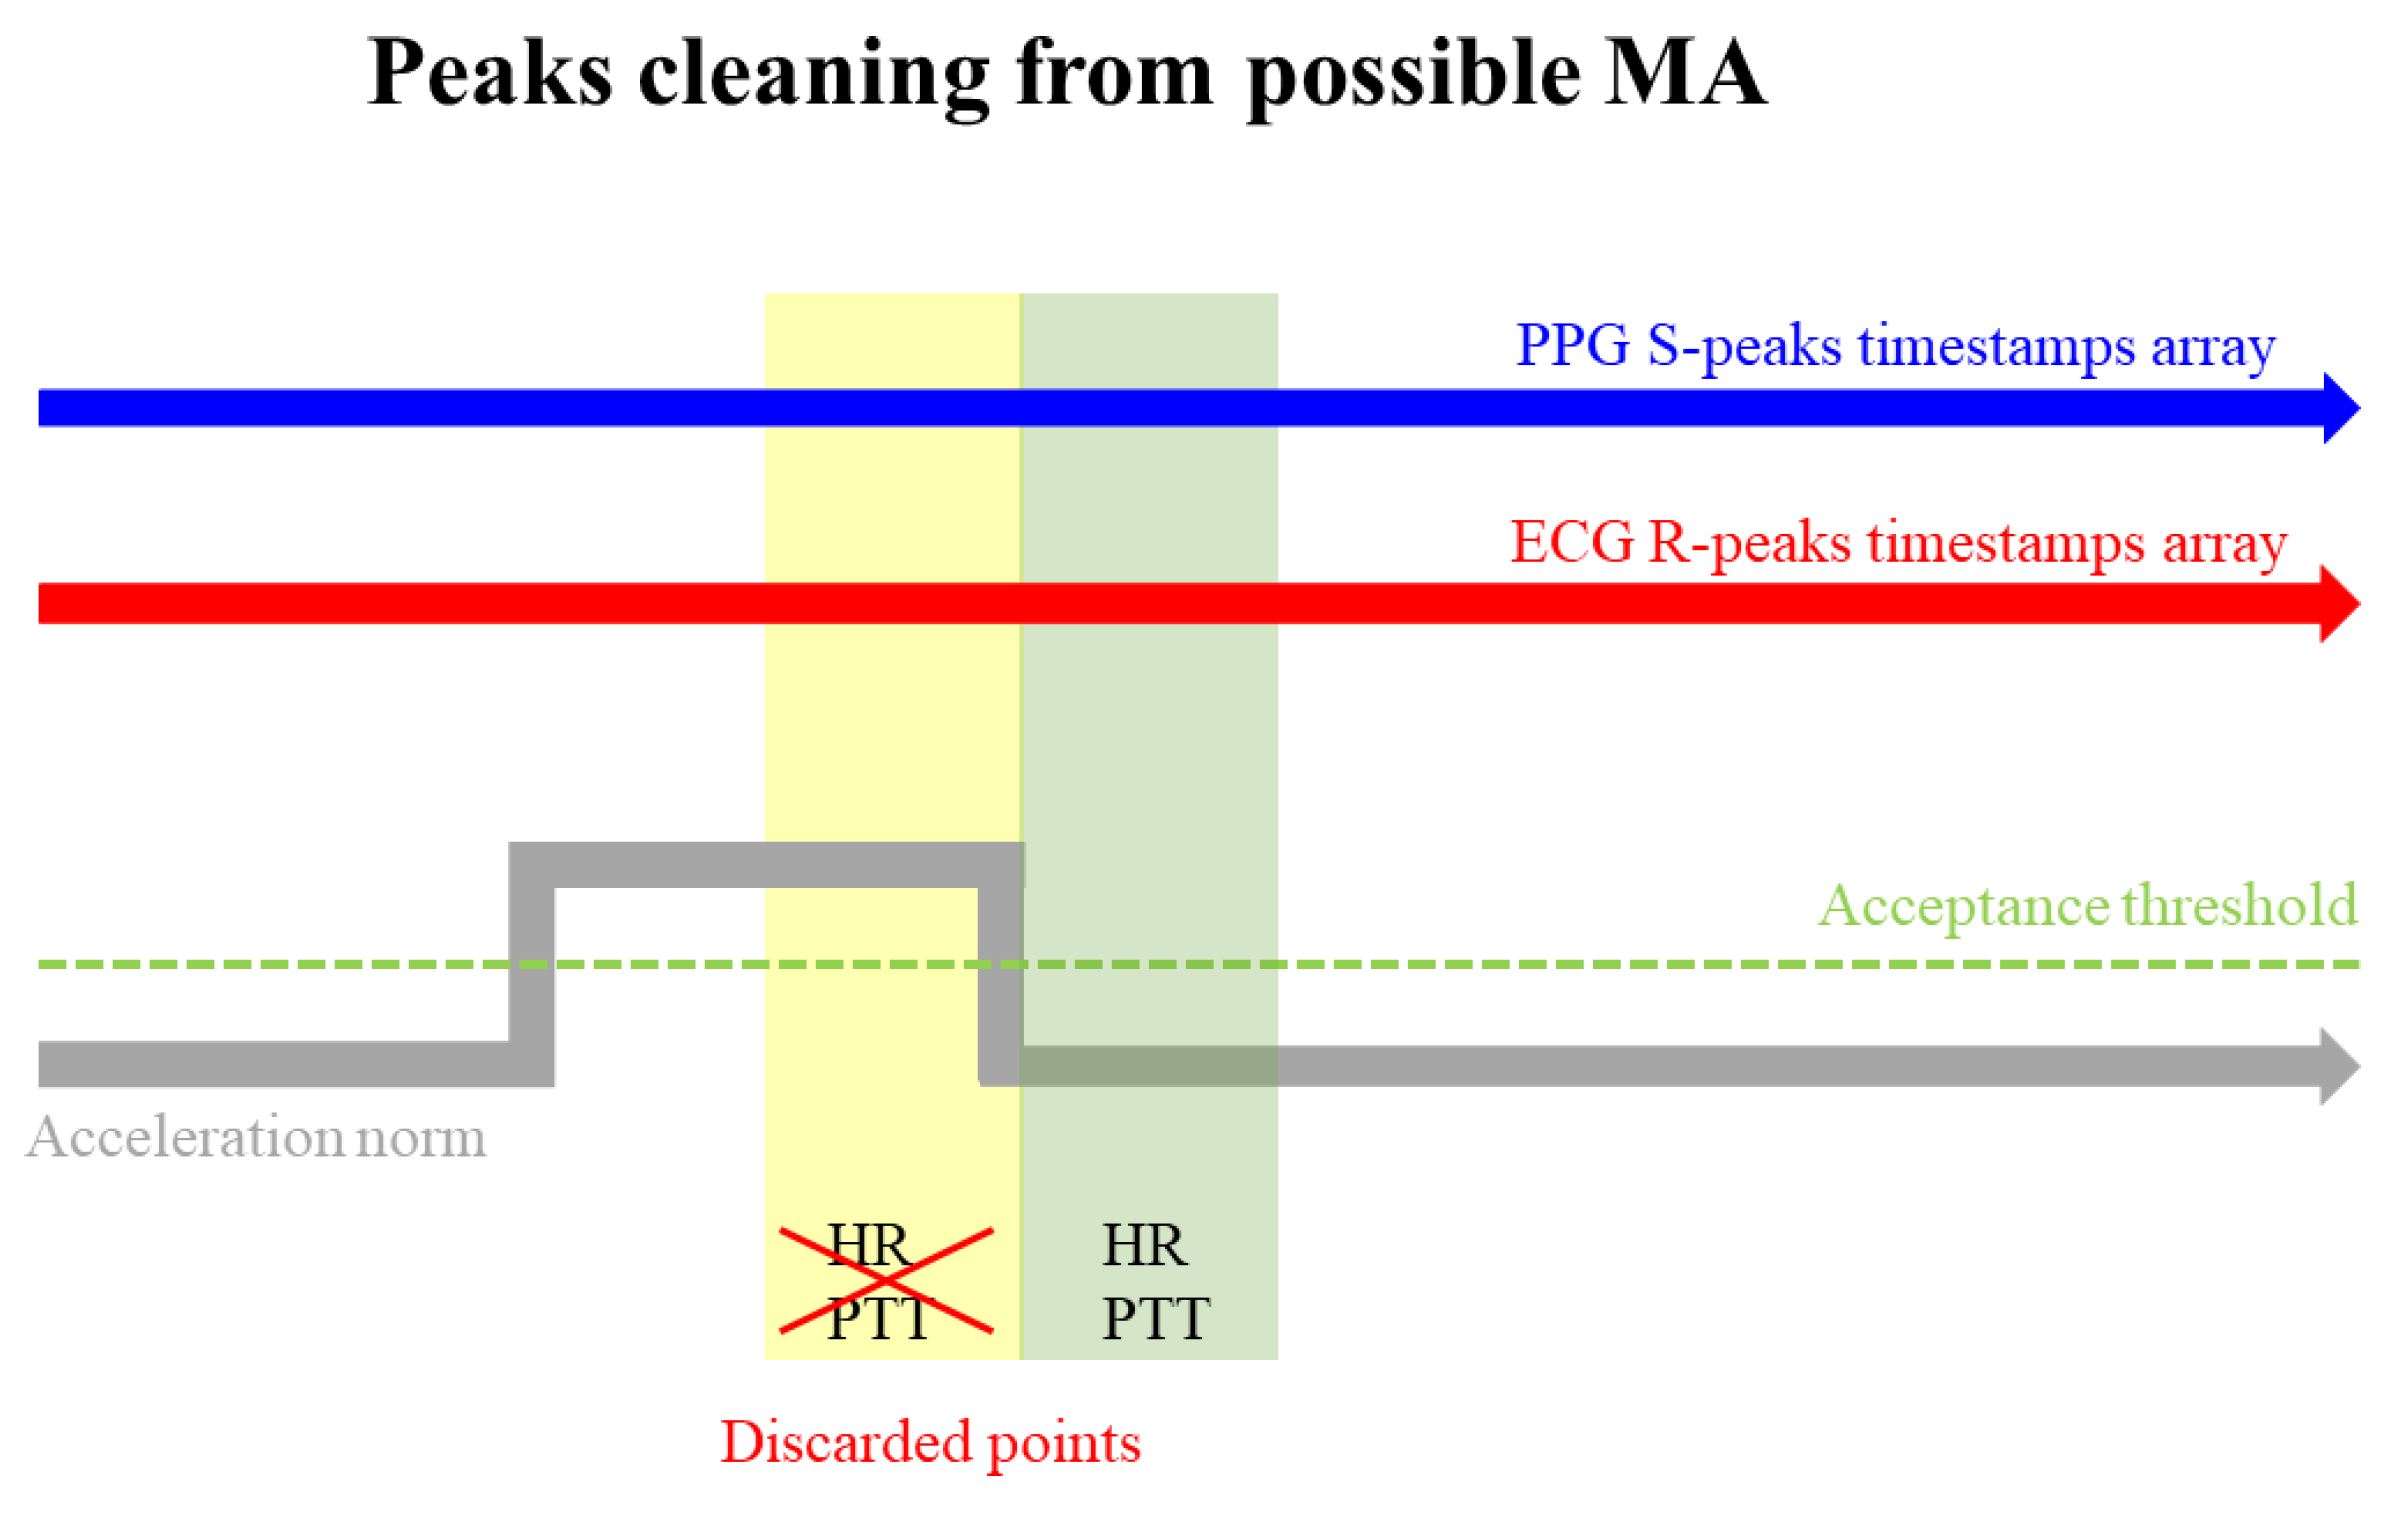
An additional improvement to the BP algorithm could involve the introduction of a signal peak cleaning mechanism, specifically designed to address instances where peaks may be attributed more to MA than physiological activity. This improvement utilizes the acceleration norm as a reference signal [29], enabling the algorithm to identify potential time windows susceptible to severe MA, as proposed in [27] and illustrated in
Figure 9
Thresholds employed to determine whether R-peaks and S-peaks fall within a critical time window should be meticulously chosen. Furthermore, by selecting the time window duration, the algorithm discards points with a heightened likelihood of being corrupted by motion artifacts.
6. Conclusion
This study investigated the timestamp approach algorithm, demonstrating its suitability in terms of accuracy for predicting BP using wearable and comfortable devices, even with low-frequency sampled signals. The proposed method for cuffless blood pressure monitoring has great potential for prevention and monitoring of diseases such as hypertension. While the results show promise, further investigation is needed, especially in exploring machine learning coefficients for long-term monitoring applications. This additional exploration should focus on potential changes over time and identify the optimal calibration approach for sustained accuracy [27,30]. Technological improvements are deemed essential to enhance market availability. The implementation of edge computing algorithms on wearable sensors holds the potential to further improve BP accuracy by deploying effective denoising techniques tailored to specific cases and integrating alarm systems. Future wearable systems should not only address technological alarms, such as electrode detachments, but also incorporate alerts for anomalous BP values [31].
Author Contributions
All authors contributed equally to this work.
Institutional Review Board Statement
All subjects gave their informed consent for inclusion before they participated in the study. The study was conducted in accordance with the Declaration of Helsinki to which all the experiments of the SINTEC project, whose identification code is 824984, are regulated.
Informed Consent Statement
Informed consent was obtained from all subjects involved in the study. Written informed consent was obtained from the patients to publish this paper.
Data Availability Statement
Acknowledgments
This work has been developed within SINTEC Project. This project has received funding from the European Union’s Horizon 2020 research and innovation programme under grant agreement no. 824984. An ackowledgment to all the participants in the experimentation for their availability and collaboration.
Conflicts of Interest
The authors declare no conflict of interest.
Abbreviations
The following abbreviations are used in this manuscript:
| BP |
Blood Pressure |
| DBP |
Diastolic Blood Pressure |
| ECG |
Electrocardiogram |
| MA |
Motion Artifact |
| MAE |
Mean Absolute Error |
| LMS |
Least Mean Squares |
| LSB |
Lower Side Band |
| PPG |
Photoplethysmogram |
| PTT |
Pulse Transit Time |
| SBP |
Systolic Blood Pressure |
| SD |
Standard Deviation |
| fs |
Sampling frequency |
| fs E |
Sampling frequency of ECG |
| fs P |
Sampling frequency of PPG |
References
- Vinyoles, E., Puig, C., Roso-Llorach, A. et al. Role of ambulatory blood pressure on prediction of cardiovascular disease. A cohort study. J Hum Hypertens 37, 279–285 (2023). [CrossRef]
-
H. Arima, F. Barzi, J. Chalmers. Mortality patterns in hypertension (2011). [CrossRef] [PubMed]
- Man PK, Cheung KL, Sangsiri N, Shek WJ, Wong KL, Chin JW, Chan TT, So RH. Blood Pressure Measurement: From Cuff-Based to Contactless Monitoring. Healthcare (Basel). 2022 Oct 21;10(10):2113. [CrossRef] [PubMed] [PubMed Central]
- SINTEC web site https://www.sintec-project.eu/ visited on october 2023.
- https://shimmersensing.com/ visited on october 2023.
- Chen W, Kobayashi T, Ichikawa S, Takeuchi Y, Togawa T. Continuous estimation of systolic blood pressure using the pulse arrival time and intermittent calibration. Med Biol Eng Comput. (2000) Sep;38(5):569-74. [CrossRef] [PubMed]
- M.Y. Wong, C.C. Poon, Y.T. Zhang. An evaluation of the cuffless blood pressure estimation based on pulse transit time technique: a half year study on normotensive subjects. (2009) Cardiovasc Eng. 2009 Mar;9(1):32-8. [CrossRef] [PubMed]
- Fisiologia - Stanfield Cindy | Libro Edises 10/2017 (2017, April 10).
- Yu, Qiong et al. “ECG R-wave peaks marking with simultaneously recorded continuous blood pressure.” PLoS ONE 14 (2019): n. pag.
- Ding, Xiaorong and Yuan-ting Zhang. “Photoplethysmogram intensity ratio: A potential indicator for improving the accuracy of PTT-based cuffless blood pressure estimation.” 2015 37th Annual International Conference of the IEEE Engineering in Medicine and Biology Society (EMBC) (2015): 398-401. [CrossRef]
- Loh, Huiwen Xu, Shuting Faust, Oliver Ooi, Chui Barua, Prabal Datta Chakraborty, Subrata Tan, Ru San Molinari, Filippo Acharya, U Rajendra. (2022). Application of Photoplethysmography signals for Healthcare systems: An in-depth review. Computer Methods and Programs in Biomedicine. 216. 106677. [CrossRef]
- Muntner, P.; Shimbo, D.; Carey, R.M.; Charleston, J.B.; Gaillard, T.; Misra, S.; Myers, M.G.; Ogedegbe, G.; Schwartz, J.E.; Townsend, R.R.; et al. Measurement of Blood Pressure in Humans: A scientific statement from the American Heart Association. Hypertension 2019, 73, e35–e66. [Google Scholar] [CrossRef] [PubMed]
- Moens, A.I. Die Pulscurve; Brill: Leiden, The Netherlands, 1878. [Google Scholar]
- Proença, J.; Muehlsteff, J.; Aubert, X.; Carvalho, V. Is pulse transit time a good indicator of blood pressure changes during short physical exercise in a young population? Annu. Int. Conf. IEEE Eng. Med. Biol. Soc. 2010, 2010, 598–601. [Google Scholar] [CrossRef] [PubMed]
- Yan, Y.; Zhang, Y. A novel calibration method for non-invasive blood pressure measurement using pulse transit time. In Proceedings of the 4th IEEE/EMBS International Summer School and Symposium on Medical Devices and Biosensors, Cambridge, UK, 19–22 August 2007. [Google Scholar] [CrossRef]
- Figini, V., Galici, S., Russo, D., Centonze, I., Visintin, M., Pagana, G. (2022). Improving Cuff-Less Continuous Blood Pressure Estimation with Linear Regression Analysis. Electronics. [CrossRef]
- https://www.omron-healthcare.it/prodotti/heartguide visited on october 2023.
- Elgendi M. Optimal Signal Quality Index for Photoplethysmogram Signals. Bioengineering (Basel). 2016 Sep 22;3(4):21. [CrossRef] [PubMed] [PubMed Central]
- Liang, Y., Elgendi, M., Chen, Z. et al. An optimal filter for short photoplethysmogram signals. Sci Data 5, 180076 (2018. [CrossRef]
- Wang L, Xian H, Guo J, Li W, Wang J, Chen Q, Fu X, Li H, Chen Q, Zhang W, Chen Y. A novel blood pressure monitoring technique by smart HUAWEI WATCH: A validation study according to the ANSI/AAMI/ISO 81060-2:2018 guidelines. Front Cardiovasc Med. 2022 Oct 11;9:923655. [CrossRef] [PubMed] [PubMed Central]
- Arras, Kai Oliver. “An Introduction To Error Propagation: Derivation, Meaning and Examples of Equation.” (1998). [CrossRef]
- ISO 81060-2:2018. (n.d.). ISO. https://www.iso.org/standard/73339.html.
- Kumar P, Sharma VK. Detection and classification of ECG noises using decomposition on mixed codebook for quality analysis. Healthc Technol Lett. 2020 Feb 18;7(1):18-24. [CrossRef] [PubMed] [PubMed Central]
- X. Xu, H. Chen, X. Chen, X. Li, and X. Li, “Adaptive motion artifact reduction based on empirical wavelet transform and wavelet thresholding for the noncontact ecg monitoring systems,” Sensors, vol. 19, no. 13, p. 2916, 2019. [CrossRef]
- C. C. Wu, I. W. Chen, and W.-C. Fang, “An implementation of motion artifacts elimination for ppg signal processing based on recursive least squares adaptive filter,” in 2017 IEEE Biomedical Circuits and Systems Conference, BioCAS 2017 - Proceedings, pp. 1–4, Institute of Electrical and Electronics Engineers Inc., 2018. [CrossRef]
- T. Tanweer, S. R. Hasan, and A. Kamboh, “Motion artifact reduction from ppg signals during intense exercise using filtered x-lms,” 2017. [CrossRef]
- Boschi Francesca, Enhancing the research toward wearable solutions for continuous noninvasive blood pressure monitoring. Politecnico di Torino, 2023.
- P. H. Prajapati and A. D. Darji, “Two stage step-size scaler adaptive filter design for ecg denoising,” in 2021 IEEE International Symposium on Circuits and Systems (ISCAS), pp. 1–5, 2021. [CrossRef]
- Lanata A, Guidi A, Baragli P, Valenza G, Scilingo EP. A Novel Algorithm for Movement Artifact Removal in ECG Signals Acquired from Wearable Systems Applied to Horses. PLoS One. 2015 Oct 20;10(10):e0140783. [CrossRef] [PubMed] [PubMed Central]
- R. Mukkamala and et al., “Evaluation of the accuracy of cuffless blood pressure measurement devices: Challenges and proposals,” Hypertension (Dallas, Tex. : 1979), vol. 78, no. 5, pp. 1161–1167, 2021. [CrossRef]
- X. Jin, L. X. Jin, L. Li, F. Dang, X. Chen, and Y. Liu, “A survey on edge computing for wearable technology,” Digital Signal Processing, vol. 125, p. 103146, 2022. [CrossRef]
Figure 1.
PTT determined by measuring the time interval between the R-peaks of the ECG and the subsequent S-peaks in the PPG signals [
11].
Figure 1.
PTT determined by measuring the time interval between the R-peaks of the ECG and the subsequent S-peaks in the PPG signals [
11].
Figure 2.
Shimmer devices and experimental setup. In subfigure (A) Shimmer EXG and GRS+ units, the PPG clip, an ECG electrode and ECG wire. In subfigure (B) the experimental setup used for data acquisition with the Shimmer devices. ECG electrodes are positioned in the first derivation, the PPG clip is positioned on the left index finger, and the reference device (Omron) is positioned on the right wrist.
Figure 3.
SINTEC devices and experimental setup. In subfigure (A) the MOR4 unit with the ECG electrodes patch and PPG patch. In subfigure (B) the experimental setup used for data acquisition with SINTEC devices. One ECG patch and MOR4 are positioned on the chest, while another MOR4 unit is positioned with the PPG patch on the left wrist.
Figure 4.
Impact of signal processing on SINTEC ECG signal.
Figure 4.
Impact of signal processing on SINTEC ECG signal.
Figure 5.
Impact of signal processing on SINTEC PPG signal. In subfigure (A), the reduction of baseline wander is evident, showcasing the effectiveness of the applied filtering techniques. In subfigure (B), the LP Butterworth filter demonstrates a smoothing effect on the signal. In subfigure (B), the continuous component of the original signal has been added, facilitating a clearer demonstration of the effect of LP Butterworth filter.
Figure 6.
Key Measurements for Blood Pressure Estimation involve extracting PTT from the intervals between successive S-peaks and R-peaks timestamps, while HR is derived from the intervals between successive R-peaks timestamps.
Figure 6.
Key Measurements for Blood Pressure Estimation involve extracting PTT from the intervals between successive S-peaks and R-peaks timestamps, while HR is derived from the intervals between successive R-peaks timestamps.
Figure 7.
Predicted and actual values of SBP and DBP using the BP algorithm. The red and pink lines represent the predicted SBP and DBP, respectively, while the blue and green lines represent the actual SBP and DBP values.
Figure 7.
Predicted and actual values of SBP and DBP using the BP algorithm. The red and pink lines represent the predicted SBP and DBP, respectively, while the blue and green lines represent the actual SBP and DBP values.
Figure 8.
In the LMS adaptive scheme, the norm of the accelerometer signals functions as the target signal, while the noisy ECG or PPG is used as input. The resulting error output signal is then subtracted from the noisy ECG or PPG to obtain the filtered ECG or PPG.
Figure 8.
In the LMS adaptive scheme, the norm of the accelerometer signals functions as the target signal, while the noisy ECG or PPG is used as input. The resulting error output signal is then subtracted from the noisy ECG or PPG to obtain the filtered ECG or PPG.
Figure 9.
PTT and HR occurring within a timestamp epoch characterized by a reference accelerometer signal crossing a specific threshold are discarded (yellow epoch), while those in epochs with the reference signal within the acceptable range are retained (green epoch). This approach is employed as an out-of-range reference accelerometer signal may suggest potential susceptibility of measurements to MA.
Table 1.
Shimmer and SINTEC technical characteristics.
Table 1.
Shimmer and SINTEC technical characteristics.
| Shimmer |
SINTEC |
ECG: Shimmer3 EXG unit
PPG: Shimmer3 GRS+ unit, Optical pulse clip |
ECG: SINTEC MOR4
PPG: SINTEC MOR4 |
|
fsE Shimmer ECG: 504.12 Hz |
fsE SINTEC ECG: 128 Hz |
|
fsP Shimmer PPG: 504.12 Hz |
fsP SINTEC PPG: 32 Hz |
Sensor positioning Shimmer ECG: three electrodes, first derivation two positioned on
the right and left pectoralis, and one situated on
the lower abdomen on the right. |
Sensor positioning SINTEC ECG: first derivation, the sensor is placed on the upper abdomen. |
Sensor positioning Shimmer PPG:
the sensor is placed on the right finger. |
Sensor positioning SINTEC PPG: the sensor is placed
on the left wrist. |
Table 2.
Average MAE and SD results for BP algorithm utilizing the timestamp approach.
Table 2.
Average MAE and SD results for BP algorithm utilizing the timestamp approach.
| |
SBP |
DBP |
| Mean MAE and SD on the overall database |
4.2 ± 1.4 mmHg |
3.5 ± 1.2 mmHg |
Table 3.
Comparison of average MAE and SD results for SINTEC and Shimmer Signals in a Hospital setting.
Table 3.
Comparison of average MAE and SD results for SINTEC and Shimmer Signals in a Hospital setting.
| |
SBP |
DBP |
| SINTEC |
3.3 ± 1.2 mmHg |
2.5 ± 1.3 mmHg |
| Shimmer |
4.5 ± 1.5 mmHg |
3.7 ± 1.2 mmHg |
|
Disclaimer/Publisher’s Note: The statements, opinions and data contained in all publications are solely those of the individual author(s) and contributor(s) and not of MDPI and/or the editor(s). MDPI and/or the editor(s) disclaim responsibility for any injury to people or property resulting from any ideas, methods, instructions or products referred to in the content. |
© 2023 by the authors. Licensee MDPI, Basel, Switzerland. This article is an open access article distributed under the terms and conditions of the Creative Commons Attribution (CC BY) license (http://creativecommons.org/licenses/by/4.0/).


