Preprint
Article

Metabolite Biomarkers for Early Ischemic Hypoxic Encephalopathy: An Experimental Study Using the NeoBase 2 MSMS Kit in a Rat Model

Altmetrics

Downloads

100

Views

40

Comments

0

A peer-reviewed article of this preprint also exists.

Submitted:

04 December 2023

Posted:

05 December 2023

You are already at the latest version

Alerts
Abstract
Hypoxic-ischemic encephalopathy (HIE) is one of the most common causes of childhood disability. Hypothermic therapy is currently the only approved neuroprotective approach. However, early diagnosis of HIE can be challenging, especially in the first hours after birth when the decision to treat with hypothermic therapy is critical. Differentiating HIE from other neonatal conditions, such as sepsis, further complicates the diagnosis. This study investigated the utility of a metabolomic-based approach using the NeoBase 2 MSMS kit to diagnose HIE using dry blood stains in a Rice-Vannucci model of HIE in rats. We evaluated the diagnostic accuracy of this method between 3 and 6 hours after the onset of HIE, including in the context of systemic inflammation and concomitant hypothermic therapy. Discriminant analysis revealed several metabolite patterns associated with HIE. A logistic regression model using glycine levels achieved high diagnostic accuracy with areas under the curve (AUC) of 0.94 at 3 hours and 0.96 at 6 hours after the onset of HIE. In addition, orthogonal partial least squares discriminant analysis, which included five metabolites, achieved 100% sensitivity and 80% specificity within 3 hours of HIE. These results highlight the significant potential of the NeoBase 2 MSMS kit for the early diagnosis of HIE and could improve patient management and outcomes in this serious illness.
Keywords: 
Subject: Biology and Life Sciences  -   Neuroscience and Neurology

1. Introduction

Hypoxic-ischemic encephalopathy (HIE) is a pathology that affects the brain and typically manifests within the first hours of life. It is characterized by a complex spectrum of neurological disorders of varying severity due to insufficient oxygen supply and reduced blood flow to the brain during childbirth. The incidence of severe HIE in the neonatal population is estimated at 0.37 to 3 cases per 1000 live births. [1] HIE is particularly common in preterm infants with a gestational age of less than 28 weeks, with an incidence of 4 to 48 cases per 1000 pregnancies. It is worth noting that as gestational age decreases, the likelihood of HIE increases, indicating a relationship between prematurity and the development of this condition. [2,3]
Several factors influence the prognosis of HIE, including the degree, location, and extent of structural brain damage resulting from HIE. In general, the mortality rate associated with HIE is estimated to be between 9.1% and 9.9%, while in cases where the disease progresses to stage three, the mortality rate can increase significantly to 70-80%.[4] It is important to note that approximately 25% of children affected by HIE suffer severe long-term neurological impairments, including conditions such as cerebral palsy, seizures, mental retardation, cognitive impairment, and epilepsy. In addition, intellectual impairment and behavioral problems, characterized by an intelligence quotient (IQ) of 70 or less, are observed in a significant proportion of HIE cases, ranging from 50 to 80%.[5,6,7,8] These impairments can have an essential impact on the affected child’s cognitive development and overall quality of life. Therefore, accurate diagnosis, timely intervention, and appropriate treatment of HIE are crucial to minimize the risk of potential long-term adverse consequences of this condition.
In the pathogenesis of HIE, phases of primary and secondary damage to nervous tissue are distinguished. Primary damage occurs at the period of asphyxia, and it is characterized by irreversible death of brain cells, the extent of which depends on the severity and duration of hypoxia. Secondary damage is activated in the reoxygenation-reperfusion phase 2-12 hours after the primary damage. Secondary damage is caused by the activation of several pathogenetic mechanisms: glutamate and calcium stress, free radical damage, aseptic inflammatory processes, and activation of apoptosis, which leads to an increase in the volume of neural damage and worsens the prognosis for life and health.[9]
One of the promising approaches to reducing the adverse effects of central nervous system (CNS) injury is therapeutic hypothermia (TH), which is considered the most effective and safest neuroprotective method for infants who have suffered severe birth asphyxia. [10,11] It involves controlled chilling of the body to lower the core temperature to around 33-34 C for a specific time frame. Numerous experimental studies have shown that HT helps to reduce metabolic expenditures of the organism, secondary energy deficits in the cells, and the release of glutamate, also inhibiting free radical production and preventing inflammation and apoptosis.[12,13]
Early and accurate assessment of the severity of HIE remains one of the greatest challenges in neonatal care.[14,15] However, modern methods for assessing the risk of brain injury in neonates have limitations related to the first hours of life, and uncertainty about the severity of progressive brain injury and the potential neurological consequences remains at this early phase.[16] For an early differential diagnosis of HIE in newborns, approaches to analyze metabolic changes in the blood of newborns using new analytical methods, in particular chromatography-mass spectrometry, might be suitable. [17]This method allows the identification of hundreds of metabolites within a few hours, which fits into the time frame necessary to obtain analytical results and make decisions on treatment strategies. Clinical studies during the neonatal period are very scarce. Non-invasive samples (such as urine and stool) and minimally invasive samples (such as blood spots) are beneficial to study the dynamics of the molecular composition of biological fluids. Infants with congenital neonatal asphyxia typically do not urinate for a long time due to kidney damage. Therefore, the main focus of research is limited to circulating blood biomarkers.[18] A dried blood spot is the most promising and least invasive sample for the diagnosis of neonatal pathologies.[19] The analysis of amino acids and acylcarnitines in dried blood spots is a globally recognized approach for the screening of metabolic defects in newborns.[20]
Recent advances in metabolomics, proteomics and transcriptomics have focused the attention of researchers on the identification of comprehensive molecular signatures. These signatures may allow precisely separate the effects of HIE in the first six hours of an infant's life and other injuries commonly caused by perinatal asphyxia, such as renal and myocardial damage. Neonatal HIE is difficult to distinguish from sepsis or inborn errors of metabolism [18]. Sepsis may accompany HIE and alter the clinical signs. It is important to point out that incorrect diagnosis and, accordingly, the prescription of hypothermia can be harmful to patients with non-ischemic encephalopathies. [21] This fact points to the need to seek for markers of brain damage in neonates that are specifically related to the ischemic/hypoxic genesis of the damage. [22]
To simplify the multifactorial system in patients with HIE and to identify specific patterns of brain injury, proteomic and metabolomic analyzes are used in in vivo and in vitro models. Using an ischemia-hypoxia model (carotid artery ligation and exposure to a mixed gas of 92% N2 / 8% O2 for two hours) our recent study demonstrated the central role of glycerophospholipids, steroid biosynthesis and fatty acid metabolism in triggering systemic responses in 7-day-old rats [23]. Other authors have performed metabolomic studies of hypoxic-ischemic injury in neonatal pigs after hypoxia and 120 minutes of reoxygenation phase. In blood plasma, during hypoxia the content of metabolites indicating a transition to anaerobic metabolism, in particular cytidine and uridine derivatives, free fatty acids and choline, increased significantly.[24]
The persistent high morbidity and mortality in neonates with HIE underscores the urgent need for the introduction and implementation of improved diagnostic modalities. These advanced diagnostics are important not only to reliably confirm hypoxia/ischemia induced complications, but also to enable a rapid and prudent decision to initiate therapeutic hypothermia. In addition, such approaches have the potential to separate HIE and other clinical pathologies with phenotypically congruent symptoms, including but not limited to various inflammatory diseases. The integration of nuanced diagnostic measures is expected to improve the prognostic accuracy of HIE while streamlining the distinctive diagnostic processes to effectively distinguish HIE from a spectrum of alternative illnesses.
A routine neonatal screening platform using the non-derivatized MSMS kit NeoBase 2 (Perkin Elmer, Turku, Finland), which can detect 53 metabolites and more than 30 different metabolic diseases by tandem mass spectrometry (MSMS), was used.

2. Results

To search for HIE specific markers to brain damage and to determine metabolic changes in the blood during therapeutic hypothermia or systemic inflammation, three different model experiments were performed (Figure 1). The first goal was to evaluate the changes in the blood of 57 compounds of low molecular mass (14 amino acids, 36 carnitines, 2 nucleosides, succinylacetone and 4 lysophosphatidylcholines) over time: before HIE and 3 and 6 hours after HIE. In the second part, the specificity of potential markers of HIE related to acute inflammation (LPS-induced) was explored. A third set of experiments was performed to reveal the effects of hypothermia on the molecular profile of the blood. Quantitative FIA-MRM-MS analysis of 57 metabolites in DBS was performed as part of routine neonatal screening, which could make the results obtained in this study as close as possible to clinical practice.

2.1. Time-Related Changes in DBS after Hypoxia-Ischemia

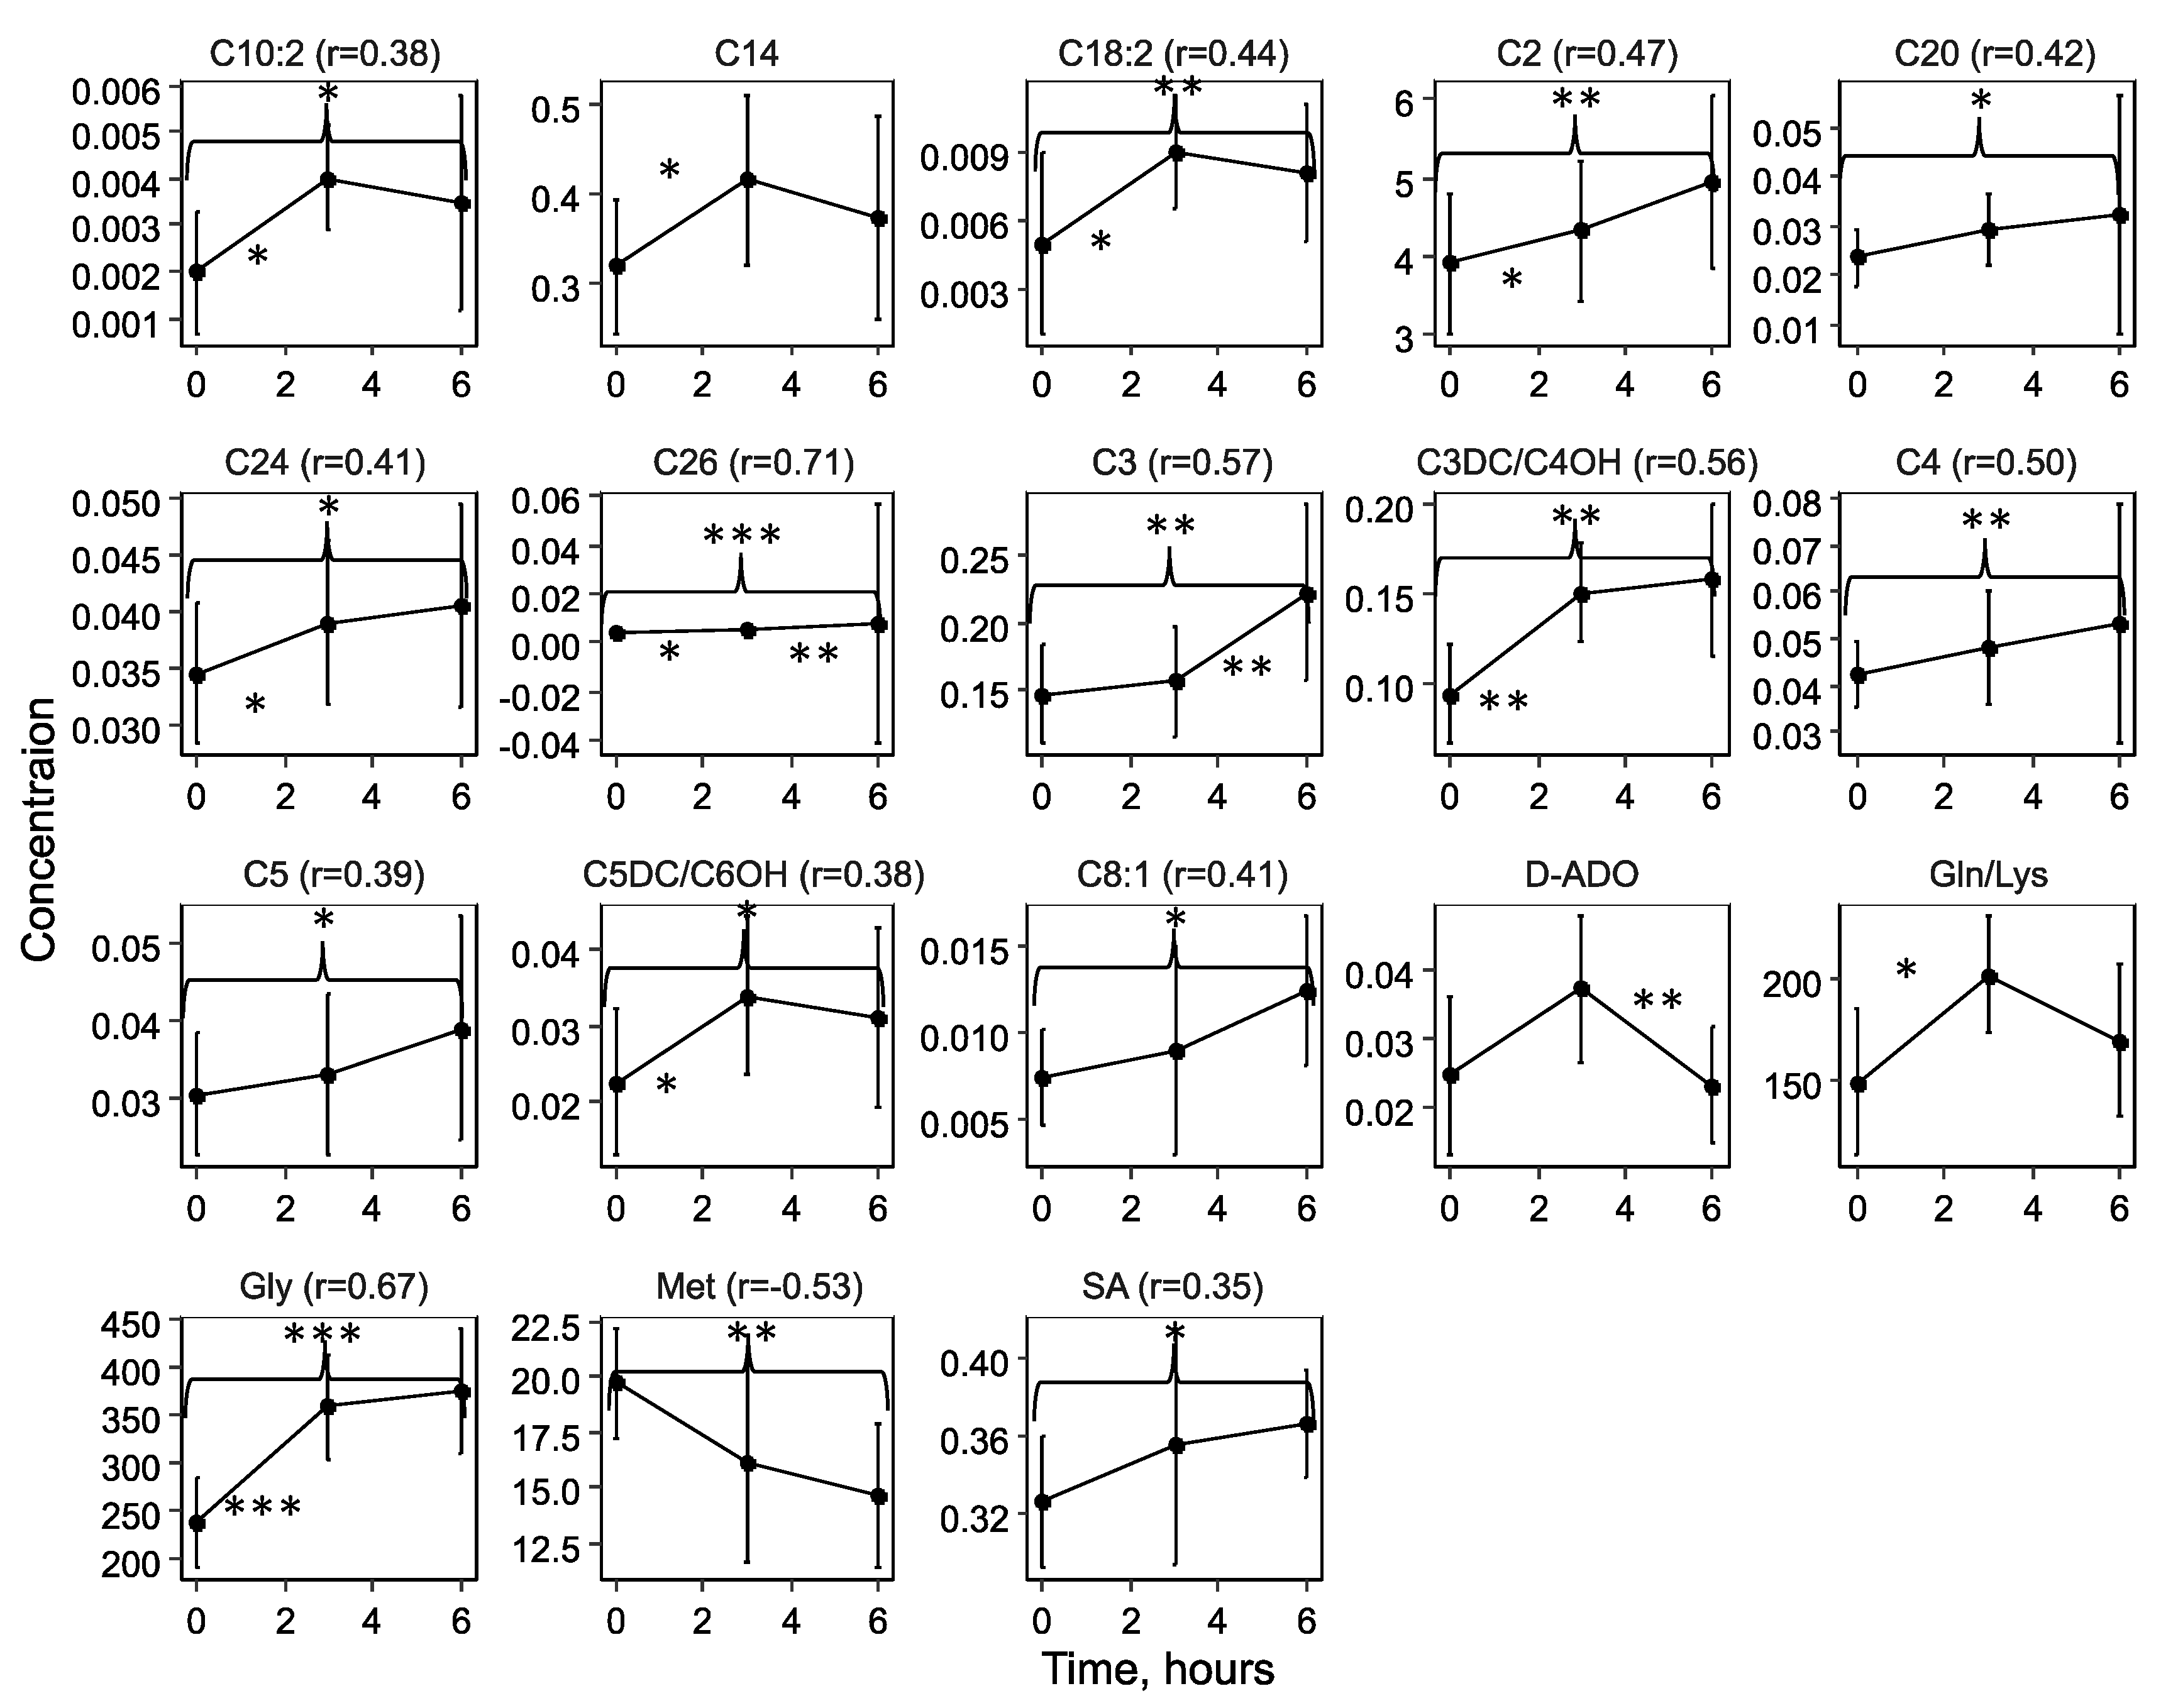
Three hours after hypoxia, a statistically significant increase in the levels of glycine, glutamine/lysine, and acylcarnitines C3DC\C4OH, C5DC\C6OH, C10:2, C26, C18:2, C14, C24 is observed. However, only the differences in glycine levels remained statistically significant after FDR correction (FDR =0.004) (Table S1 Supplementary S2). Six hours after the induced damage, changes accumulate and are primarily associated with an increase in glycine levels, succinylacetone, acylcarnitines C26, C3DC\C4OH, C3, C4, C18:2, C2, C5DC\C6OH, C24, C8:1, C20, C5, C10:2, and a decrease in methionine levels (Table S2 Supplementary S2). The levels of acylcarnitines C26 and C3 were significantly increased, while the level of deoxyadenosine decreased after 3 and 6 hours of hypoxia-ischemia. Figure 2 illustrates the metabolite levels in DBS, with statistically significant changes in at least one of the compared groups: control, 3 hours, and 6 hours after hypoxia-ischemia.
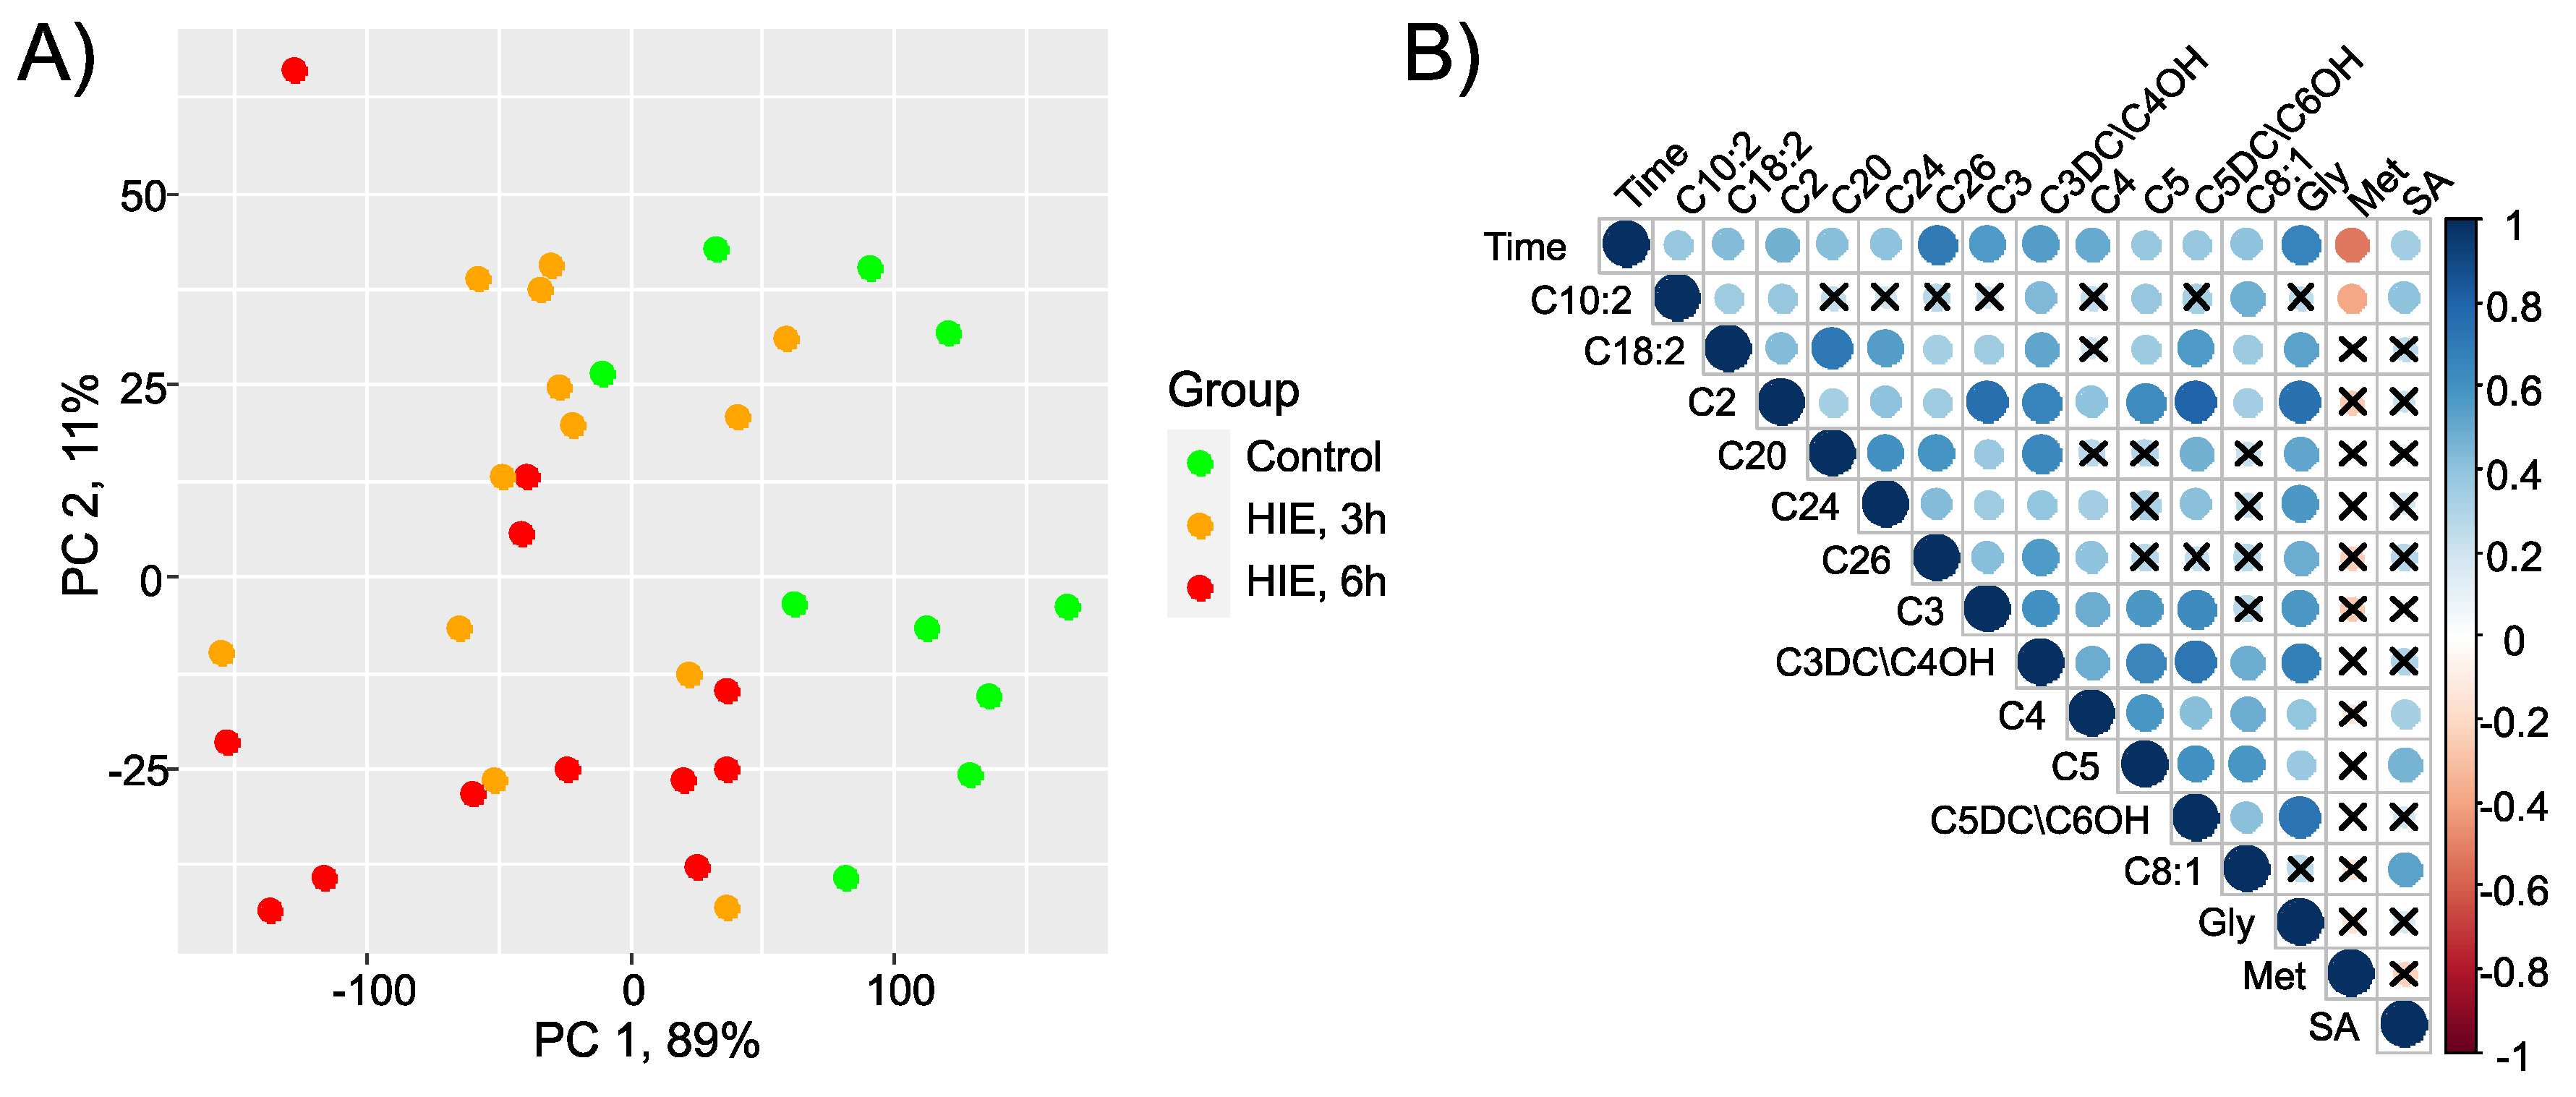
In the principal component space, samples from the control group and samples taken 6 hours after hypoxia are distinctly separated, while 3-hour samples occupy an intermediate position (Figure 3A). The levels of glycine, succinylacetone, and acylcarnitines C10:2, C18:2, C2, C20, C24, C26, C3, C3DC\C4OH, C4, C5, C5DC\C6OH, and C8:1 significantly increase over time after hypoxia, while the level of methionine decreases (Figure 3B).
According to the SMPDB library, three hours after ischemia/hypoxia, there was a statistically significant (p<0.05) enrichment in several pathways, including the ammonia cycle, beta-oxidation of long-chain fatty acids, alanine metabolism, and carnitine metabolism. Additionally, according to the KEGG library, pathways such as glyoxylate and dicarboxylate metabolism, aminoacyl-tRNA biosynthesis, glutathione metabolism, and porphyrin and chlorophyll metabolism were enriched (Table S3 Supplementary S2).
According to the SMPDB library, based on enriched statistically significant markers identified six hours after hypoxia/ischemia, pathways were determined to include branched-chain fatty acid oxidation, methionine metabolism, glycine and serine metabolism. According to the KEGG library, pathways such as aminoacyl-tRNA biosynthesis, glutathione metabolism, porphyrin and chlorophyll metabolism, glyoxylate and dicarboxylate metabolism, glycine, serine, and threonine metabolism, and cysteine and methionine metabolism were also identified as changed (Table S4 Supplementary S2).

2.2. The Influence of Accute Inflammation (LPS-Induced) and Hypoxia-Ischemia on DBS Metabolome

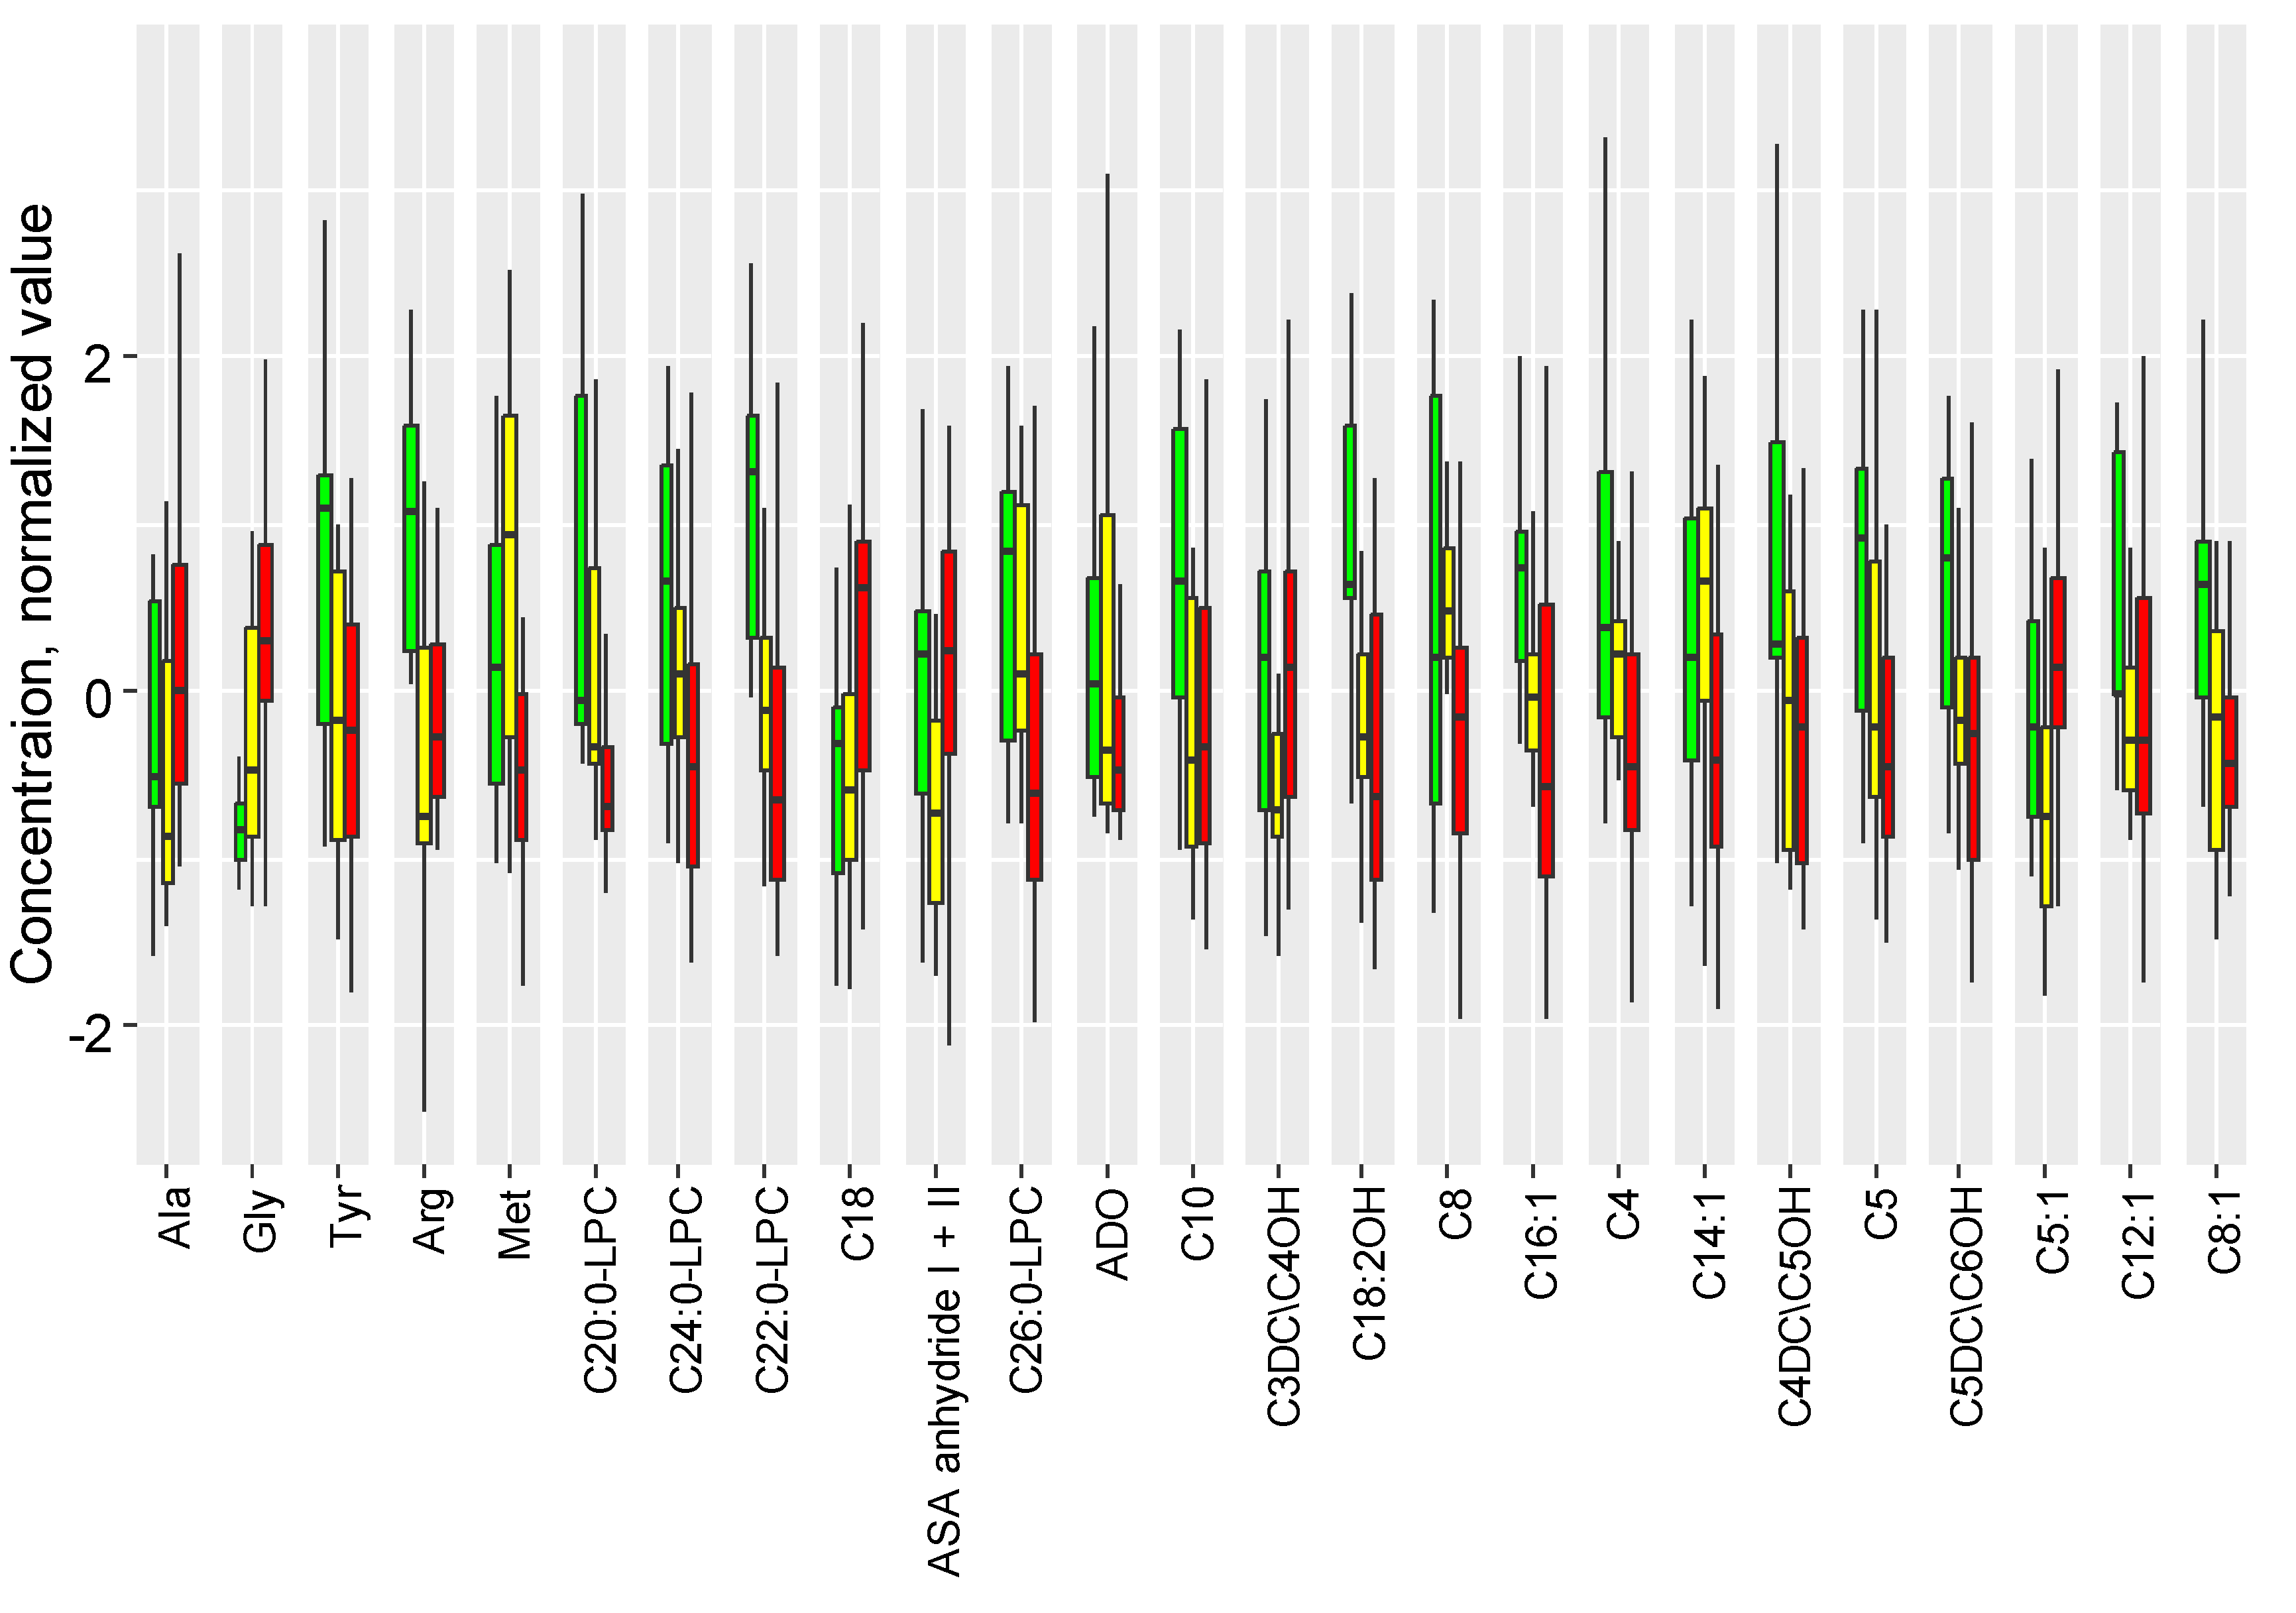
Figure 4 illustrates the levels of compounds demonstrating a statistically significant difference. With the exacerbation of the inflammatory process by ischemia/hypoxia, there is a profound increase in the levels of argininosuccinic acid anhydrides, glycine, alanine, acylcarnitines C5:1, C3DC\C4OH, C18, and a decrease in the levels of methionine, lyso-phosphatidylcholine C26:0, and acylcarnitines C8, C14:1.
In the principal component space, the control group stands out in a separate cluster (Figure S1 Supplementary S2). Two clusters of compounds can be identified, with differing connections between the inflammation group and the inflammation with ischemia/hypoxia group (Figure S2 Supplementary S2).
Thus, out of the 18 compounds identified as potential markers for hypoxic-ischemic injury (Figure 1), 12 (67%) cease to be specific in the context of the inflammatory process. Short-chain acylcarnitines C4, C5, C5DC/C6OH, and C8:1 show a statistically significant decrease in hypoxic-ischemic damage and a significant increase when inflammation is present. This bidirectional change suggests the utility of these metabolites in determining the inflammatory background. Glycine is significantly elevated both in hypoxia-ischemia and in inflammation with hypoxia-ischemia. Conversely, methionine decreases in hypoxia-ischemia, with or without an inflammatory process.
According to the SMPDB library, in inflammation coupled with hypoxia-ischemia, relative to inflammation alone, glycine and serine metabolism, alanine metabolism, glutathione metabolism, methionine metabolism, glutamate metabolism, glucose-alanine cycle, spermidine and spermine biosynthesis, and betaine metabolism were statistically significantly changed. For glycine and serine metabolism, alanine metabolism, glutathione metabolism, and methionine metabolism, as well as glutamate metabolism, the average probability of random enrichment is p<0.05 (Figure S3a Supplementary S2). According to the KEGG library, statistically significant over-representation is observed in pathways such as aminoacyl-tRNA biosynthesis, selenium compound metabolism, alanine, aspartate, and glutamate metabolism, glutathione metabolism, porphyrin and chlorophyll metabolism, glyoxylate and dicarboxylate metabolism, glycine, serine, and threonine metabolism, cysteine and methionine metabolism, and biosynthesis of primary bile acids. In this case, aminoacyl-tRNA biosynthesis and selenium compound metabolism have a probability of random enrichment less than 5% (p<0.05) (Figure S3b Supplementary S2).

2.3. Therapeutic Effect of Hypotermia in Hypoxic-Ischemic Injury

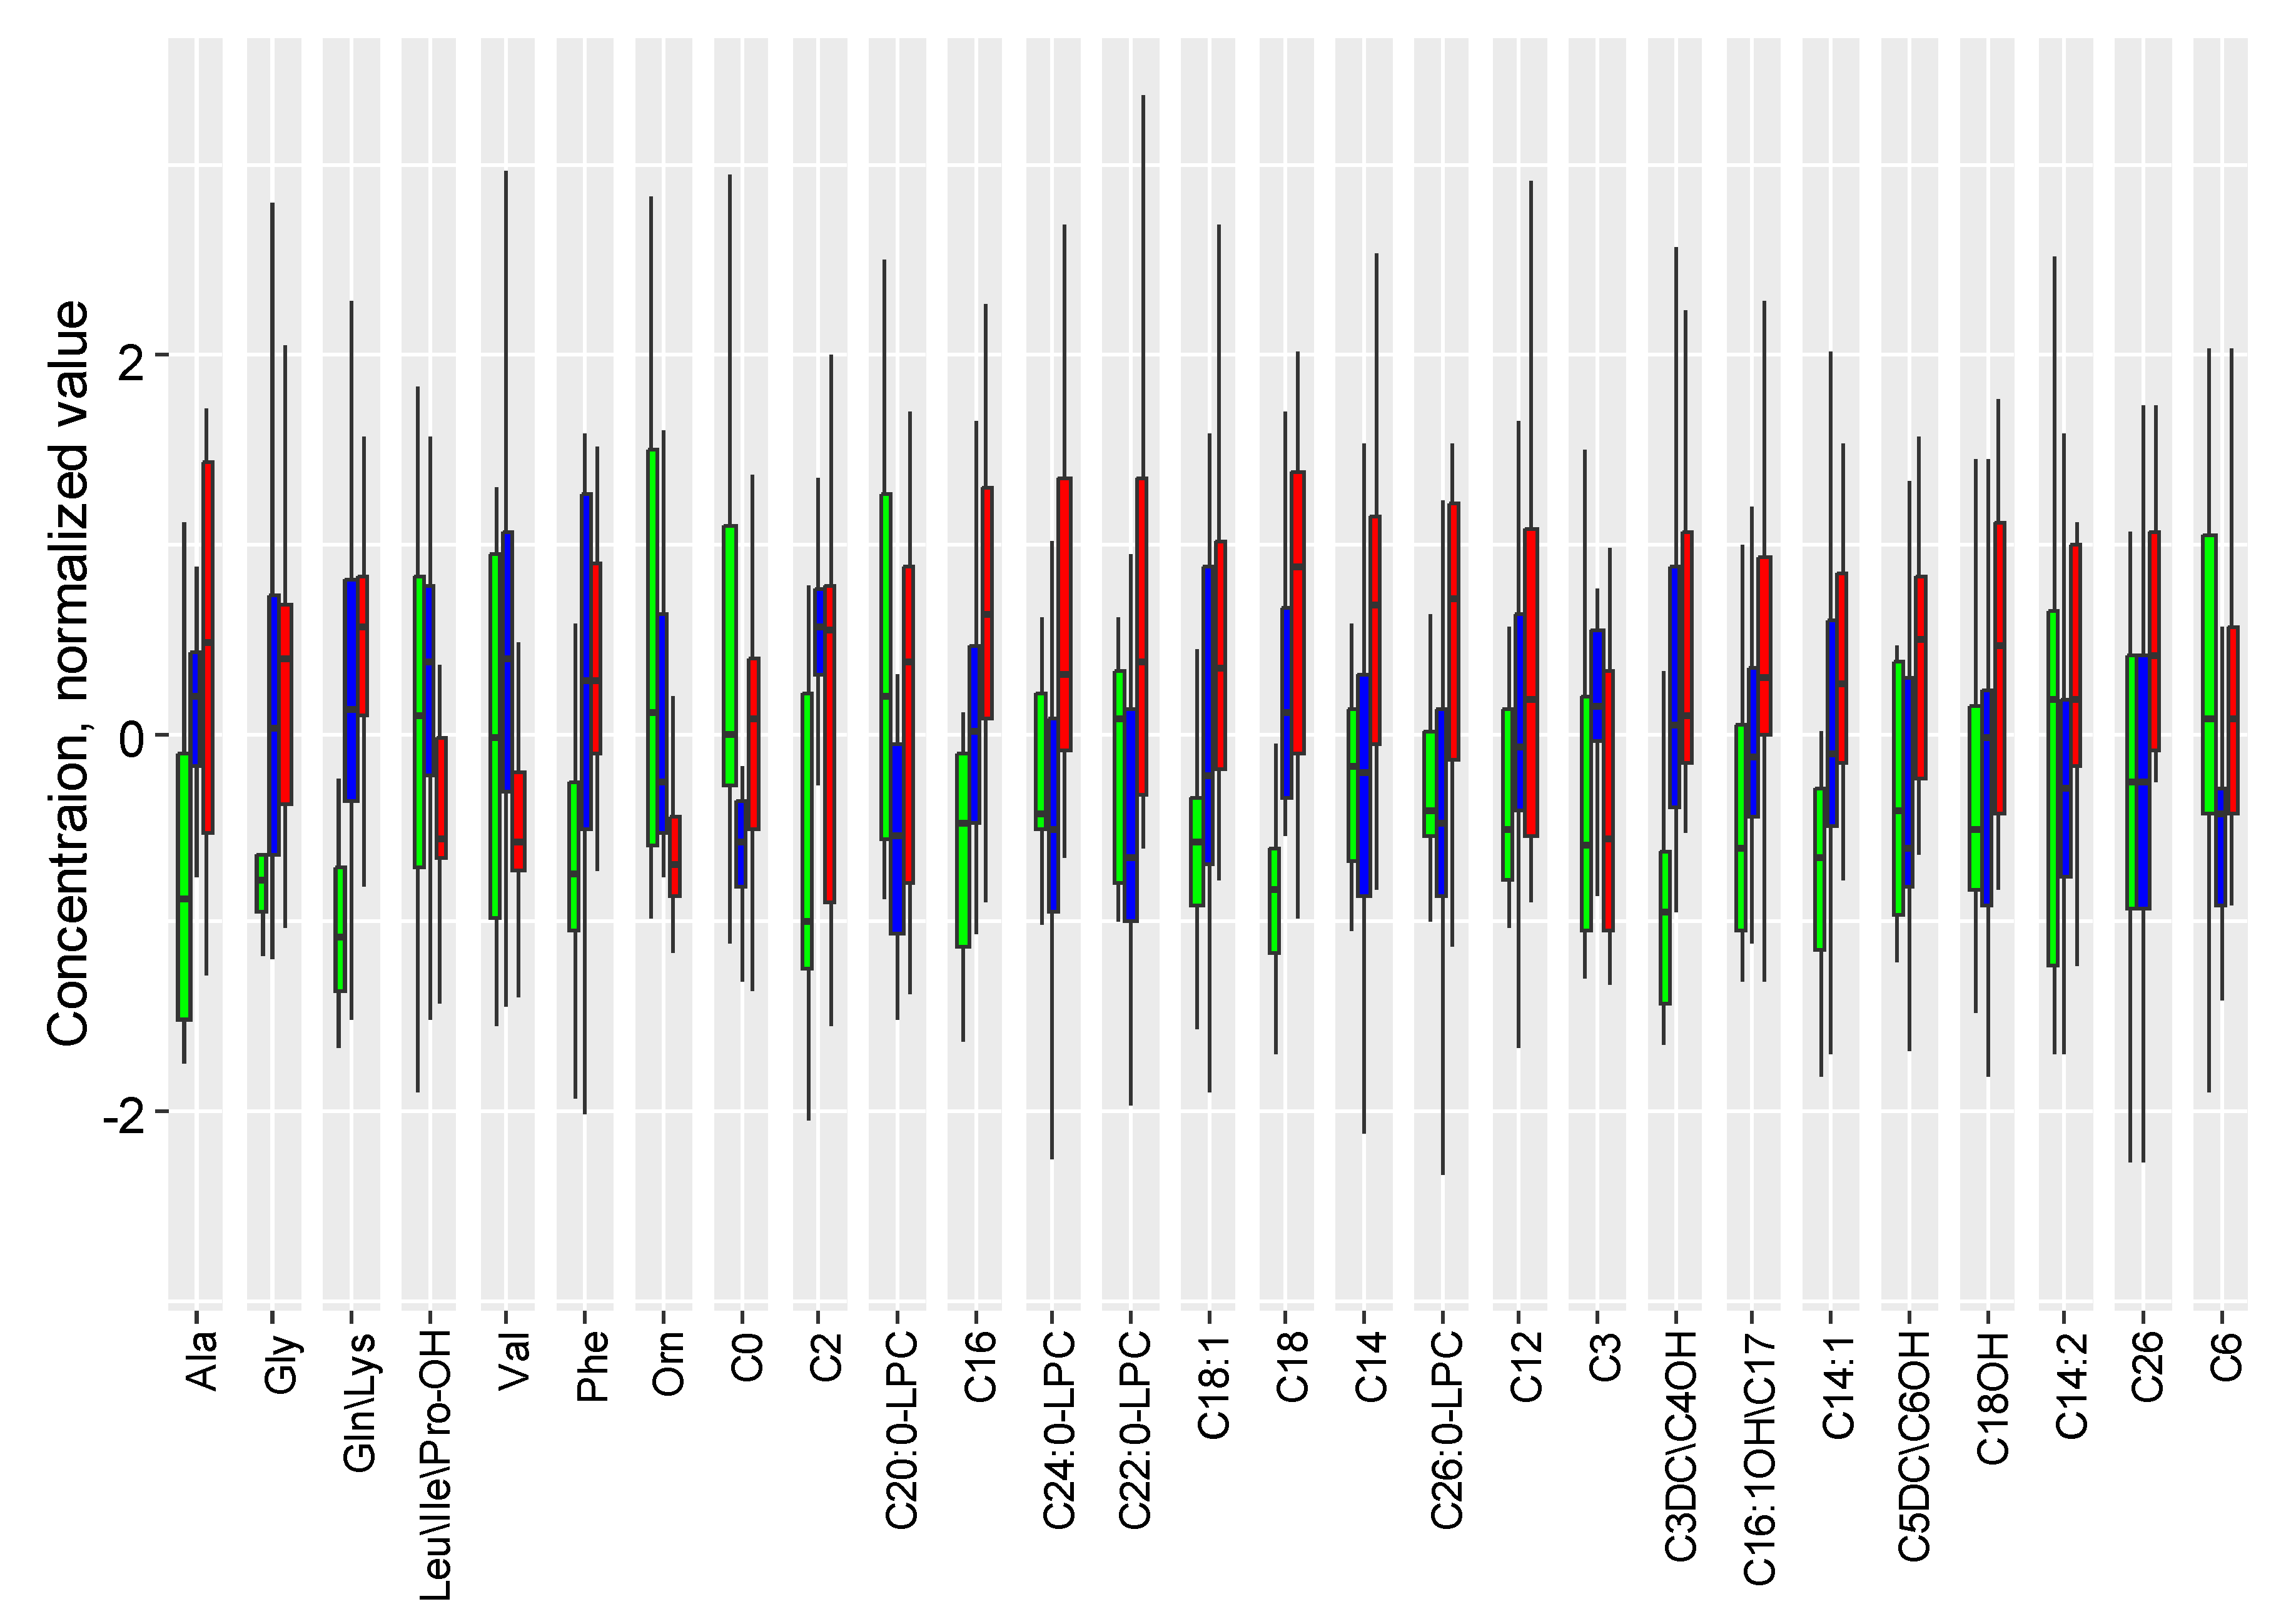
In the third set of experiments, one-third of the rats after hypoxia-ischemia were exposed to 6-hour hypothermia. During this, the DBS metabolome also underwent significant changes compared to normothermia and the control group (Figure 5). Under the hypothermic mode after hypoxia-ischemia, there is a statistically significant increase in the levels of ornithine, valine, leucine/isoleucine/hydroxyproline, and a statistically significant decrease in the levels of lyso-phosphatidylcholines C20:0, C22:0, C24:0, C26:0, and acylcarnitines C26, C5DC\C6OH, C6, C14:2 (Table S6 Supplementary S2). Similar to the hypoxic-ischemic injury amid the inflammatory process, the DBS metabolites are divided into two clusters, with connections differing between the normothermia group and the hypothermia group (Figure S4 Supplementary S2).
According to the KEGG library, under the hypothermic mode if compared to normothermia, there was a statistically significant enrichment in the pathways of valine, leucine, and isoleucine biosynthesis and degradation, aminoacyl-tRNA biosynthesis, arginine biosynthesis, pantothenate and CoA biosynthesis, arginine and proline metabolism, and glutathione metabolism. All pathways, except the last one, have a probability of random enrichment with p<0.05.
2.4 Development of the Diagnostic Model for HIE
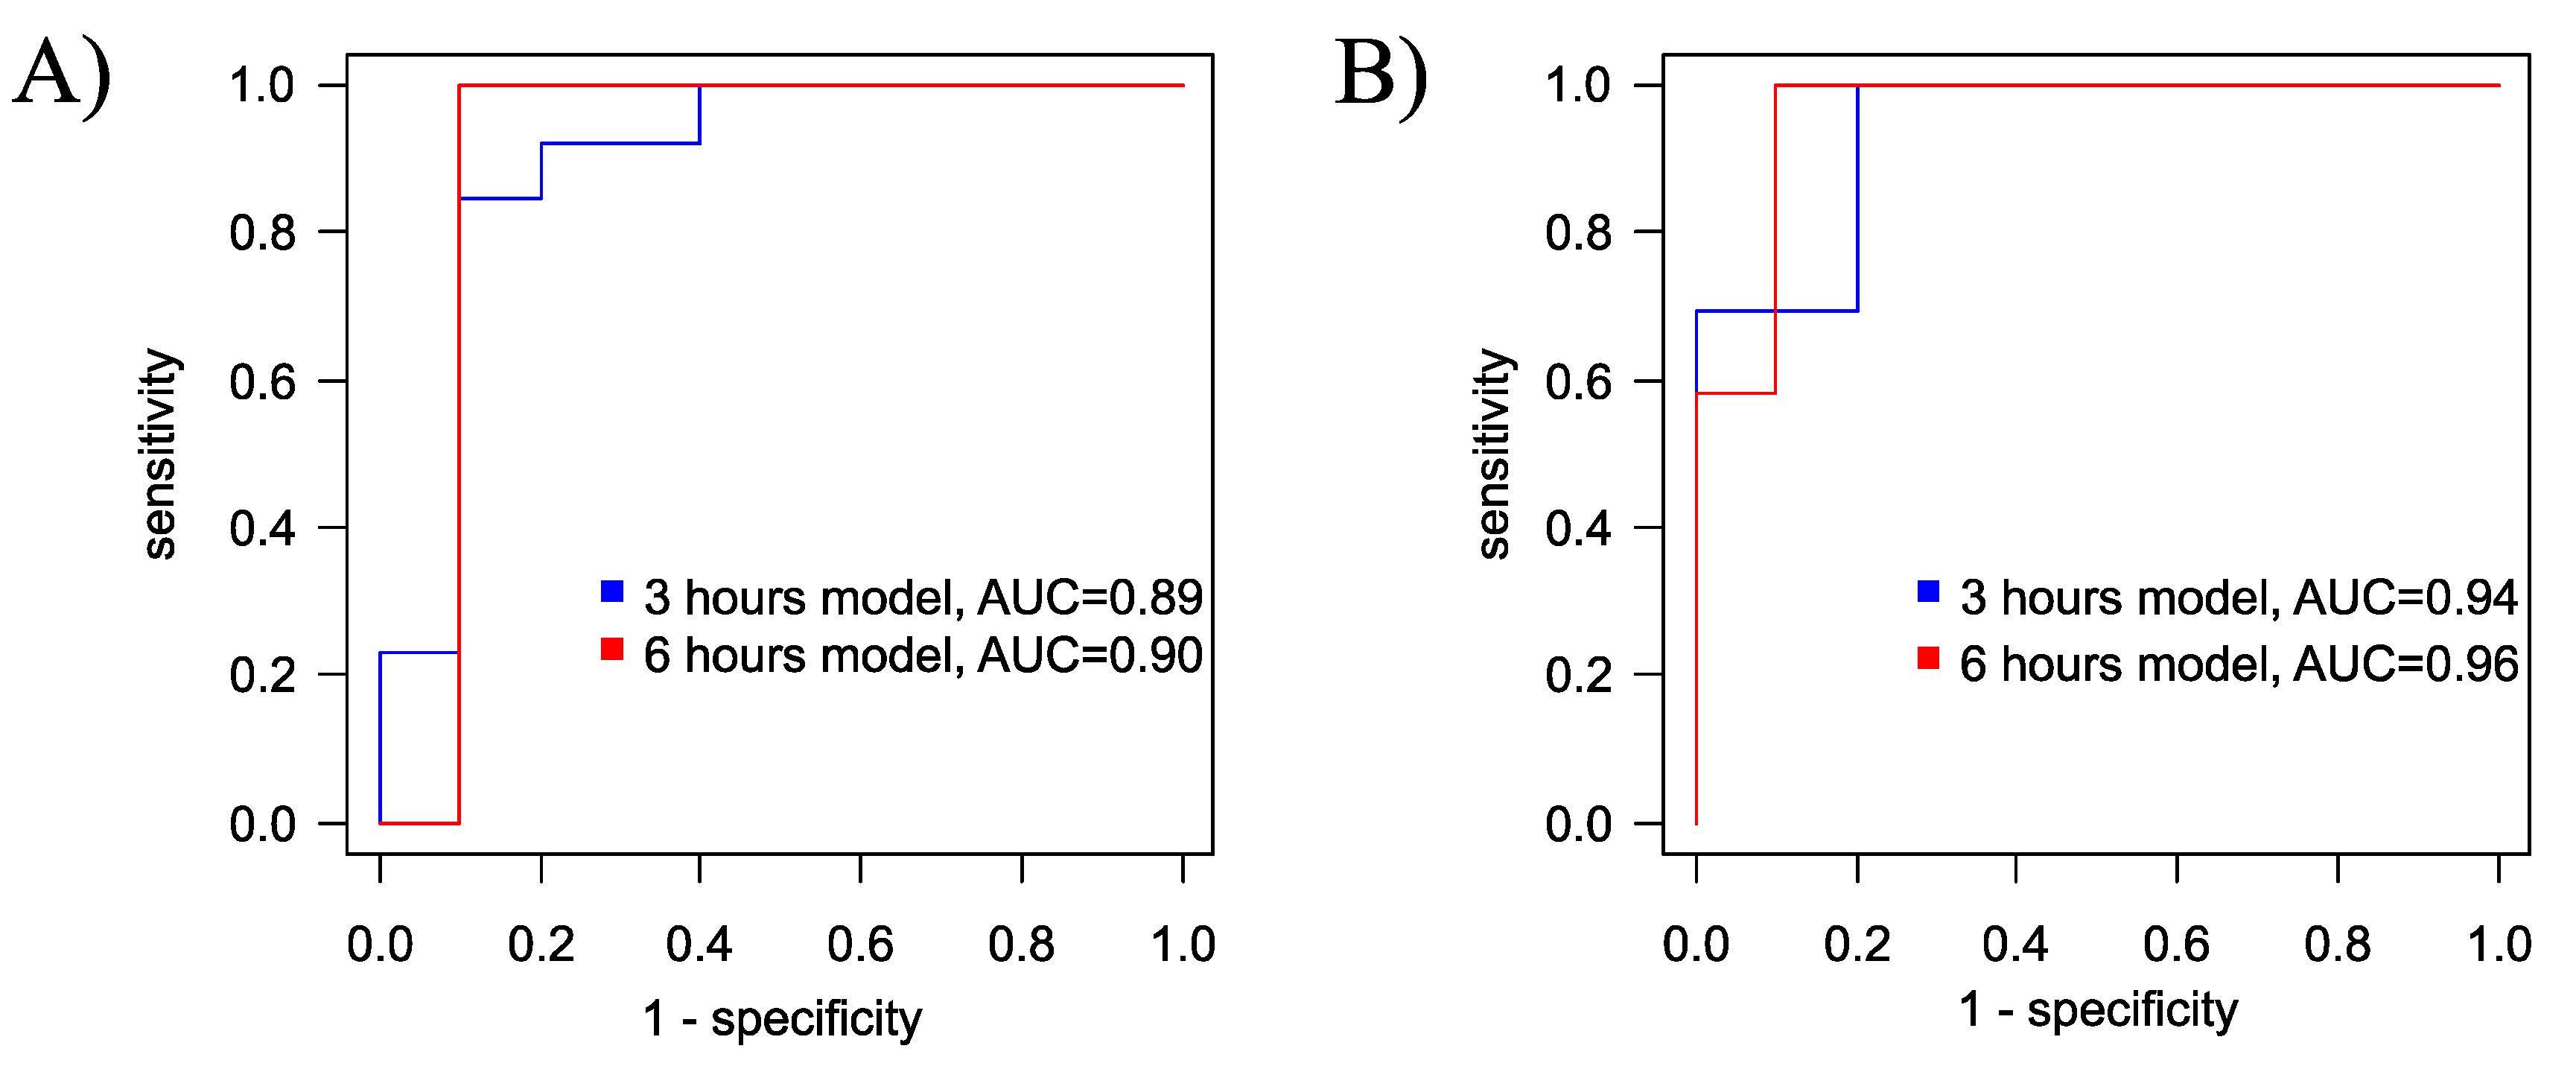
The logistic regression model for diagnosing hypoxia-ischemia after 3 hours of exposure has a sensitivity of 85% and specificity of 90% with a cutoff threshold of 0.57 (Figure 6A, Table S5 Supplementary S2). The model for diagnosing ischemia/hypoxia after 6 hours of exposure has a sensitivity of 100% and specificity of 90% with a cutoff threshold of 0.39 (Figure 6A, Table S6 Supplementary S2). For both models, glycine emerged as the only marker compound.
Additionally, for the diagnosis of hypoxia-ischemia based on the plasma profile 3 hours after the presumed event, an orthogonal partial least squares discriminant analysis (OPLS-DA) model with two orthogonal projections was constructed (Figure 7A). The proportion of described independent variables, X, was 56%, described dependent variables, Y, constituted 74%, and the proportion of predicted dependent variables Y was 63%. Based on cross-validation results, the model demonstrated a sensitivity of 100 % and specificity of 80% for the 3-hour timeframe, with a cutoff threshold of 0.38 (Figure 6B). Key markers for hypoxia (VIP>1) included glycine, alanine, glutamine/lysine, tyrosine and ornitine (Figures S5 and S6 Supplementary S2).
Six hours’ hypoxia-ischemia OPLS-DA diagnostic model with 4 orthogonal projections was constructed also (Figure 7B) with the following performance parameters: the proportion of described independent variables, X, was 68%, described dependent variables Y constituted 68%, and the proportion of predicted dependent variables Y was 57%. According to cross-validation results, the model demonstrated a sensitivity and specificity of 100% and 90%, respectively, with a cutoff threshold of 0.49 (Figure 6B). Key markers for hypoxia (VIP>1) included glycine, glutamate, leucine/isoleucine/hydroxyproline, citrulline, phenylalanine, glutamine/lysine and valine (Figures S7 and S8 Supplementary S7).
Both models exhibit good diagnostic potential, with the laster diagnostic model having higher specificity. For both models, key compounds include glycine and glutamine/lysine.
To assess the diagnostic accuracy of the developed models (OPLS and logistic regression) using metabolite levels in DBS after 6 hours of hypoxia-ischemia, the data obtained in the third experiment were utilized: a control group (n=13) and a normothermia hypoxia-ischemia group (n=14). Validation based on 100-times split cross-validation of samples from the first and the third sets of experiments demonstrated sensitivity 86% and specificity 88% for OPLS model and sensitivity 87% and specificity for logistic regression model.

3. Discussion

The diagnosis of HIE is a major challenge due to limitations in current clinical methodology and tools [16,25,26]. Although amplitude-integrated EEG and imaging devices such as MRI are common techniques for predicting long-term outcome and assessing the severity of brain injury, they often fall short in the critical first hours of life when rapid and accurate diagnosis is most needed to make a decision whether to initiate TH [14,15,27]. In addition, there are factors such as the need for continuous EEG monitoring to detect subclinical seizures that may go clinically unnoticed, and the possibility that neuroimaging may underestimate brain injury if performed too soon after the hypoxic event [28]. In addition, comorbidities, including perinatal sepsis and metabolic disorders, may interfere with the neuroprotective effect of TH and complicate the diagnostic process [29,30,31]. Although metabolic defects in inborn are rare, they may present symptoms like those under HIE [32,33].
In this complex diagnostic landscape, the analysis of metabolic markers proves to be a promising approach [34]. Metabolomics offers a nuanced view of the biochemical changes that occur because of HIE and can provide earlier, and more precise indications of damage compared to conventional imaging and neurophysiological studies [35,36]. This method is particularly valuable in distinguishing between HIE and other disorders with similar manifestations, such as inborn metabolic defects or genetic encephalopathies, which can mimic HIE symptoms [37]. Consideration of a detailed family history and targeted metabolic testing are critical to identifying these conditions, which require treatment approaches other than HIE, including specific treatments instead of therapeutic hypothermia. With advances in neonatal care research, the integration of metabolomic data into existing diagnostic tools holds the potential to increase the accuracy of HIE diagnoses and personalize interventions to improve outcomes for affected infants.
Although metabolomics is a promising approach for the diagnosis of HIE, it is important to note that many of the approaches being investigated in this area are still staying in experimental field and require further standardization before they can be used in clinical practice. However, there are approaches that are already being used in clinical practice, such as the NeoBase 2 MSMS kit, which is currently used in newborn screening [38]. It allows the simultaneous analysis of a comprehensive panel of metabolites involved in different metabolic pathways, such as amino acids, carnitines, nucleosides and lysophosphatidylcholines, a total of 57 metabolites. The main limitation of this set in the context of searching for HIE markers is of course the small number of metabolites compared to standard mass spectrometry. However, we assumed that this set of metabolites would be sufficient for the differential diagnosis of HIE. In particular, the applicability of this kit for the diagnosis of various pathological conditions in addition to conventional newborn screening has already been demonstrated [39,40,41]. Also, the NeoBase 2 MSMS kit takes advantage of the convenience and practicality of analyzing dried blood spots on paper, which are widely available and commonly used as a source of neonatal biological samples [42]. This eliminates the need for invasive procedures and simplifies sample collection, transportation and storage.
Research on HIE markers is constrained by strict ethical standards associated with neonatal studies and the low incidence rate of HIE, limiting the clinical research capacity to fully validate diagnostic tests. To overcome these hurdles, experimental animal models of HIE are invaluable as they provide the opportunity to study the pathogenetic mechanisms and markers of brain injury in a controlled environment. In our study, we used the Rice-Vannucci model, a widely recognized experimental model that closely mimics the pathophysiological changes observed in neonates with HIE [43]. We have also modeled one of the most common conditions of neonatal sepsis [44], which complicates the diagnosis of HIE and may also be a contraindication to hypothermic therapy when sepsis and HIE are combined. Additionally, we assessed how TH impacts the profile of markers, particularly focusing on prognostic implications.
In the all three experiments, we observed a statistically significant increase in the levels of the acylcarnitines mainly short-chain acylcarnitine. Acylcarnitines are formed by the esterification of carnitine with acyl groups, which is needed to transport fatty acids through the mitochondrial membrane for subsequent beta-oxidation yielding production of energy. During hypoxia-ischemia, energy production in the cells is disturbed, which leads to a change in metabolism and redirection of bioenergetics toward anaerobic glycolysis. This in turn affects the levels of various metabolites, including acylcarnitines. The accumulation of certain acylcarnitines may reflect a disturbance in mitochondrial function and energy metabolism. Clinical studies have demonstrated that changes in the acylcarnitine profile can serve as a biomarker for HIE. A study examining a cohort of 67 children diagnosed with HIE revealed that butyrylcarnitine (C4) could serve as a potential prognostic biomarker. The observed correlations between circulating C4 levels, neuron-specific enolase concentrations and MRI abnormalities suggest that this biomarker is useful for the prognostic assessment of HIE [45]. Analysis of umbilical cord blood showed elevated concentrations of long-chain acylcarnitines in two different groups of newborns: those who had clinical signs of hypoxia-ischemia but had a normal neurological examination, and those who were diagnosed with HIE [46]. Another study in which newborns were diagnosed with HIE revealed elevated levels of acylcarnitines, specifically palmitoylcarnitine (C16:0), stearoylcarnitine (C18:0) and oleoylcarnitine (C18:1), which were corelated with more acidic pH values in the umbilical artery and lower Apgar scores five minutes after delivery [47]. Dave M. and co-authors explored the tissue-specific origin of acylcarnitines using a mouse model of HIE and quantified these metabolites in skeletal muscle, brain and blood. They found that acylcarnitines C16:0 and C18:0 increase in plasma as well as in brain tissue 30 minutes after HIE and dissipate after 24 hours. On the other hand, all other acylcarnitines were elevated only in muscle and plasma. Authors made conclusions that plasma acylcarnitine profiles predominantly reflect muscle-derived changes rather than those occurring in the brain [48]. In our study, after applying the FDR correction, acylcarnitines were excluded as reliable biomarkers for the diagnosis of HIE, although they were initially statistically significant. Due to predominant skeletal muscle origin of acylcarnitines following systemic hypoxic/ischemic events, the early post-HIE elevation in their levels may be more indicative for the presence of systemic hypoxia rather than the index of extent the cerebral injury. Consequently, acylcarnitines could serve as markers of systemic hypoxia in neonates and indirectly point to possible injury to a brain, the organ most susceptible to oxygen deficiency. However, comprehensive, long-term, multi-center studies of changes in acylcarnitine levels in neonates with HIE are needed for definitive conclusions.
In modeling a systemic inflammatory process associated with HIE, our study found change levels of metabolites responsible for several dysfunctions, including decreased oxygenation, excitotoxicity, impaired glucose utilization, impaired fatty acid metabolism, impaired protein synthesis, deterioration of cell membrane integrity, mitochondrial dysfunction, and impaired energy production. We found a decrease in short-chain acylcarnitine levels during hypoxic-ischemic injury, followed by an increase associated with increase in inflammatory response, which could indicate carnitine deficiency. Carnitine deficiency is a contributing factor to the progression of inflammatory processes [49]. Although the analysis involving a panel of 57 metabolites provided insights into the pathophysiological processes, principal component analysis failed to distinguish between groups subjected to 24-hour LPS treatment and those modeled with HIE concurrent with systemic inflammation, as significant clustering was only observed within the control group. Further studies with a broader range of metabolites or alternative analytical methods would be required to refine the distinction between these conditions.
In the context of hypothermia after HIE, we observed a significant decrease in markers associated with HIE, such as acylcarnitines and the amino acids identified in the OPLS-DA diagnostic model. In addition, we observed significant changes in metabolic pathways responsible for ammonia detoxification, reduced lipid peroxidation activity and stabilization of cellular energy metabolism after TH. These results suggest a positive effect of TH on biochemical processes and recovery mechanisms after HIE, which is consistent with previous studies in this field. [50,51]. Furthermore, our results emphasize the sensitivity of the investigated markers to the extent of brain damage after HIE. Considering these results, we emphasize the potential utility of the NeoBase 2 MSMS kit for exploring neuroprotective strategies in animal models during the acute phase of the disease.
In this study, OPLS-DA and logistic regression models with high diagnostic accuracy were developed for timely diagnosis of HIE. Moreover, three- and six-hours’ models were similar in respect to included variables and performance. The models based on the DBS profile at six hours were validated using a new set of samples from experiment 3. Validation demonstrated sensitivity and specificity more than 86%. Interestingly, glycine was the only DBS compound included in logistic three- and six-hours’ regression models. Its VIP was the highest in both OPLS-DA models, which also included various amino acids. These compounds may be suggested as HIE markers in DBS. The main marker for HIE that we have identified is glycine, which is consistent with clinical data for newborns with HIE [52,53]. Also, an increase in glycine has been described for models of global brain ischemia [53,54,55] and for patients in the acute phase of stroke in both plasma and cerebrospinal fluid [56,57]. We suggest that the main source of glycine could be a product of NADH synthesis reaction from serine under hypoxic conditions [58]. NADH plays a vital role in the aerobic synthesis of ATP. Independently of the tricarboxylic acid cycle, serine catabolism within the mitochondria generates NADH through a folate-dependent mechanism. The enzyme serine hydroxymethyltransferase 2 catalyzes the conversion of serine to glycine, concurrently generating 5,10-methylene tetrahydrofolate (methylene-THF). Subsequently, methylene tetrahydrofolate dehydrogenase 2 oxidizes methylene-THF, with reduction of NAD+ and formation of 10-formyl-THF. It is also important to consider that hypoxic/ischemic conditions can disrupt neurotransmitter homeostasis, potentially leading to extracellular accumulation of neurotransmitters, including glycine, which can subsequently be released into the bloodstream [56]. This phenomenon has been observed particularly in ischemic stroke model, with the increase in glycine concentration correlating with the extent of injury [59].
In addition to glycine, the OPLS-DA diagnostic model also includes glutamate, leucine, isoleucine, hydroxyproline, citrulline, phenylalanine and the combined markers glutamine/lysine and valine as main markers of HIE. Glutamate in particular is known to be a key excitatory neurotransmitter in the brain and plays an important role in acute neurological conditions including HIE [60]. In neonatal HIE, there is a critical disturbance in the energy metabolism of brain cells. The interruption of oxygen and glucose supply impedes respiration and oxidative phosphorylation and leads to a failure of ATP-dependent ions pumping. This leads to a pathological reversal of the functions of the glutamate transporter functions, resulting in a significant efflux of glutamate into the extracellular space. The result is a chain reaction of excitotoxicity that exacerbates neuronal damage and is reflected in increased plasma glutamate concentrations [61]. In addition, hypoxia/ischemia leads to a metabolic shift toward anaerobic metabolic pathways, disabling the Krebs cycle and leading to an accumulation of cycle intermediates and byproducts of pyruvate metabolism, potentially increasing the concentrations of precursor amino acids identified in our study. The role of amino acids as biomarkers for early HIE has previously been demonstrated in both model experiments and clinical studies [17,46,62,63,64]. Furthermore, these amino acids could serve as alternative energy substrates for the neonatal brain and muscles under hypoxic conditions [65]. It is important to note that the enrichment of metabolic pathways that we identified 3 and 6 hours after HIE indicates the response of the brain and entire organism to hypoxic/ischemic damage, including a transition to anaerobic metabolism, compromised cellular energy production, perturbed glucose metabolism and protein biosynthesis, elevated oxidative stress, and disrupted reparation processes. The diagnostic biomarkers we have identified are intrinsically linked to these early pathophysiological events and are pathogenetically relevant. They denote the initiation of a patho-biochemical cascade that underlies the cerebral damage associated with HIE. Therefore, these markers can serve as critical indicators for the early detection of brain injury and may assist in guiding therapeutic interventions during the initial phase of HIE.

4. Materials and Methods

4.1 Animals

The animal protocols performed were reviewed and approved by the institutional animal ethics committee according to the guidelines of FELASA (Federation of European Laboratory Animal Science Associations). The experiments were performed with outbred white rats obtained from the animal facility of the A.N. Belozersky Institute of Physico-Chemical Biology. To ensure animal welfare, dams and their pups were housed in cages in a temperature-controlled environment with a temperature of 21±2°C. In addition, a light-dark cycle was established in which the light was switched on from 9:00 am to 9:00 pm. The dams had ad libitum access to food and water, and pups were examined daily for health status.

4.2. HIE Modeling

The study used the well-established Rice-Vannucci rat model to investigate hypoxic-ischemic brain injury (HIE). The experiments were conducted with seven-day-old postnatal rats of both sexes. The left carotid artery was then surgically isolated and obliterated with an electrocautery to deliberately restrict the blood supply to the brain. The rats were then exposed to a gas mixture of 8% oxygen and 92% nitrogen for a defined period of 2 hours in a multigas CO2 incubator (Binder, Tuttlingen, Germany) at a temperature of 37◦C, starting 1.5 hours after surgery, to induce hypoxia. The mortality rate after hypoxia-ischemia induction was in a range of 3–5%. The experiments were conducted to explore different impacts on rat pups with HIE, which were divided into experimental groups as follows.

4.2.1.HIE with Sampling at Different Times

Pups were randomly divided into the following experimental groups: intact rats (n = 10); animals with HIE whose blood was taken 3 hours after hypoxia (n = 13); animals with HIE whose blood was taken 6 hours after hypoxia (n = 12) (Figure 1A). Three and six hours after the hypoxic exposure, dry blood spots were obtained.

4.2.2. HIE Model with LPS-Induced Inflammation

In this experiment, 6-day-old rat pups were injected intraperitoneally with 4 mg/kg body weight of lipopolysaccharide (LPS) 24 hours before the induction of hypoxia and ischemia. The animals were divided into three experimental groups: intact rats (n = 11), rats injected with LPS without HIE (n = 11) and rats injected with LPS with HIE (n = 27) (Figure 1B). After 6 hours of hypoxic exposure, dry blood spots and blood plasma were collected for analysis.

4.2.3. Modeling of therapeutic hypothermia

Pups were randomly assigned to either normothermic or hypothermic recovery immediately after termination of hypoxia for a duration of 6 hours. Normothermic recovery was maintained at a temperature of 37°C, while hypothermic recovery was maintained at 30°C according to the previously described protocol (PMID: 25996893). Pups were placed in an open container in a water bath to achieve the desired temperatures. In this experimental set there were three groups of animals: intact rats (n = 13), rats with HIE and hypothermia (n = 16), and rats with HIE and normothermia (n = 14) (Figure 1C). As in the previous experiments, dry blood spots (DBS) were collected after 6 hours of hypoxic exposure for further analysis.

4.3. Dried Blood Spot metabolome analysis (FIA-MRM-MS)

The levels of 57 low-molecular-weight compounds, including 14 amino acids, 36 carnitines, 2 nucleosides, succinylacetone and 4 lysophosphatidylcholines (Table S7 Supplementary S2), were measured in DBS using the flow injection analysis tandem mass spectrometry (FIA-MS/MS) as a part of a routine newborn screening at the Clinical Diagnostic Laboratory of the National Medical Research Center for Obstetrics Gynecology and Perinatology named after Academician V.I. Kulakov of the Ministry of Healthcare of the Russian Federation. Experiments were performed on UHPLC QSight MD autosampler coupled to a QSight 225MD tandem mass spectrometer (MSMS) in a positive electrospray (ESI) mode using multiple reaction monitoring (MRM) for signal acquisition. The NeoBase 2 non-derivatized MSMS kit #3044-0010 (Perkin Elmer, Turku, Finland) was applied to extract and quantitatively analyze target compounds in DBS. The kit includes NeoBase 2 Internal Standards, Extraction Working Solution (EWS), NeoBase 2 Controls (Low and High), Neo MSMS Flow Solvent, NeoBase 2 Extraction Solution, NeoBase 2 Succinylacetone Assay Solution. NeoBase 2 assay was assessed based on the recommendations of the CLSI guidelines [66]. Several studies confirmed good analytical performance of Neobase 2 kit in terms of precision, accuracy, limit of detection (LOD), lower limit of quantification (LLOQ), linearity, recovery, and carryover [67,68,69,70].
All analytical steps were performed in accordance with the manufacturer’s guidelines. In brief, a 3.2 mm disc was automatically punched from the DBS of each sample into a 96-well plate using Panthera-Pancher 9 (Perkin Elmer, Turku, Finland). DBS spots were incubated in the shaker with 125 µl of the extraction working solution (EWS) including internal standards (IS) for 30 minutes +45 °C. Then 100 µl supernatant was transferred to another plate’s well for 60-minute incubation at room temperature. The 10 µL injection into the ion source was performed under the following conditions: capillary voltage 5.5 kV, source temperature 120°C, hot source induced desolvation (HSID) temperature 320°C, drying gas flow 80 L/hr, and nebulizer gas flow 120 L/hr. FIA-MRM-MS was performed at solvent flow rate 1 µL/sec with duration run 1.5 minutes and scanning rate 1.76 sec/scan. MRM parameters are listed in the Table S7 Supplementary S2. The low and high level controls (LC, HC) were run at the start and the end of in each plate. The mean measured QCs were within ± 3 SD of the values provided by the quality control certificate. Processing of the data and analytes concentration calculation was carried out by Simplicity 3Q MD 2.1 (Perkin Elmer, Turku, Finland) software.
Figure S9 Supplementary S2 presents an example of a typical flow injection chromatogram obtained for a LC sample provided by NeoBase™ 2 Non-derivatized MSMS kit on the QSight 225MD tandem mass spectrometer.

4.4. Statistical Methods

The groups were compared pairwise by the Mann-Whitney test, and p-values were corrected using the Benjamin-Hochberg method (false discovery rate, FDR). A p-value less than 0.05 was considered statistically significant. Compounds with statistically significant differences in levels were used for principal component analysis (PCA).
To investigate the correlation between the time elapsed since hypoxic-ischemic brain injury and the molecular composition of blood, a Spearman test was applied with criteria of significant P<0.05.
For each task, a pairwise comparative analysis of interactions between compounds within groups was performed: a correlation matrix and an adjacency change matrix were calculated for two groups. Based on the adjacency change matrix, a difference matrix was computed for hierarchical cluster analysis using the Ward’s method. The optimal number and composition of clusters were determined based on the maximum silhouette coefficient.
Pathway enrichment analysis was performed using the over-representation analysis in the MetabolanalystR package. A result with p<0.1 was considered statistically significant. If a marker set contained compounds with multiple identification variants, new variable sets were created for each identification variant, each containing one of the options. In this case, pathways were considered statistically significant if p was less than 0.1 for each marker set. Enrichment values and probability of observing were averaged across all marker sets, and the median value was calculated for the number of markers in each pathway.
For hypoxia diagnosis, classification models were built based on OPLS-DA. Sensitivity and specificity were determined based on leave-one-out cross-validation results.
For diagnostic models based on logistic regression, a new dataset was created, including metabolite concentrations, the product of concentrations for each pair of metabolites, and the squares of the concentration values for each metabolite. In the preliminary marker set, variables with a variable projection value greater than 1 in orthogonal projections analysis were selected. A stepwise variable selection was performed based on the Akaike information criterion to obtain the minimum criterion value at each stage, while observing a decrease in the criterion value. Subsequently, a stepwise exclusion of variables was carried out, with coefficients having a maximum probability of zero equality, until coefficients for variables had a probability of zero less than 0.05. The model's quality was evaluated based on leave-one-out cross-validation.
Additional validation of 6 h’ models (OPLS and logistic regression) was performed by 100-times cross-validation using train/test split (70/30) of first experiment samples (Figure 1A, control (n=10) and 6h after hypoxia-ischemia (n=12) groups) with addition of samples from the third experiment (Figure 1C, control (n=13) and normothermic hypoxia-ischemia (n=14) groups).

5. Conclusions

The diagnostic models which we developed using the NeoBase 2 MSMS kit demonstrates the ability to diagnose HIE as early as 3 hours after disease onset. The application of this approach to the analysis of dried blood spots from newborns offers a promising method for postnatal screening for HIE immediately after birth. The relatively short duration (approximately 3 hours) of the analysis, fits well with the critical time frame for initiating TH that can mitigate the long-term effects of HIE. Thus, the integration of the NeoBase 2 MSMS kit into early neonatal care protocols has the potential to significantly improve clinical outcomes through the timely diagnosis of HIE. Further research and validation through clinical trials are required to introduce these metabolic markers into clinical practice.

Supplementary Materials

The following supporting information can be downloaded at the website of this paper posted on Preprints.org.

Author Contributions

Conceptualization, D.S., O.I., and N.S.; methodology, C.E.; software, C.E. and E.P.; validation, Y.S. and E.P.; formal analysis, Y.S. and K.G.; investigation, V.C., Y.S., K.G., and C.E.; resources, D.S. and E.P.; data curation, K.G. and Y.S.; writing—original draft preparation, Y.S., C.E., K.G., A.S. and N.S.; writing—review and editing, O.I., E.P., G.S., D.Z. and D.S.; visualization, K.G., N.S., and C.E.; supervision, G.S., N.S. and D.S.; project administration, D.S. and O.I.; funding acquisition, D.S. All authors have read and agreed to the published version of the manuscript.

Funding

This research was funded by the Russian Science Foundation (№ 22-15-00454).

Institutional Review Board Statement

The study was approved by the local ethics committee of the A.N. Belozersky Institute of Physico-Chemical Biology, protocol number: 8/22.

Informed Consent Statement

Not applicable.

Data Availability Statement

Data are contained within the Supplementary Material.

Acknowledgments

Authors wish to thank the Clinical Diagnostic Laboratory of the National Medical Research Center for Obstetrics Gynecology and Perinatology Named after Academician V.I. Kulakov of the Ministry of Healthcare of the Russian Federation for providing HPLC-MS/MS equipment for sample analysis.

Conflicts of Interest

The authors declare no conflicts of interest.

References

  1. Kurinczuk, J.J.; White-Koning, M.; Badawi, N. Epidemiology of neonatal encephalopathy and hypoxic-ischaemic encephalopathy. Early Hum. Dev. 2010, 86, 329–338. [Google Scholar] [CrossRef] [PubMed]
  2. Manuck, T.; Rice, M.; Bailit, J.; Grobman, W.A.; Reddy, U.M.; Wapner, R.J.; et al. Preterm Neonatal Morbidity and Mortality by Gestational Age: A Contemporary Cohort. Am J Obs. Gynecol 2016, 215, 103.e1–103.e14. [Google Scholar] [CrossRef]
  3. Volpe, J.J. Neonatal encephalopathy: An inadequate term for hypoxic-ischemic encephalopathy. Ann. Neurol. 2012, 72, 156–166. [Google Scholar] [CrossRef] [PubMed]
  4. Pappas, A.; Korzeniewski, S.J. Long-Term Cognitive Outcomes of Birth Asphyxia and the Contribution of Identified Perinatal Asphyxia to Cerebral Palsy. Clin. Perinatol. 2016, 43, 559–572. [Google Scholar] [CrossRef] [PubMed]
  5. Rutherford, M.; Ramenghi, L.A.; Edwards, A.D.; Brocklehurst, P.; Halliday, H.; Levene, M.; Strohm, B.; Thoresen, M.; Whitelaw, A.; Azzopardi, D. Assessment of brain tissue injury after moderate hypothermia in neonates with hypoxic-ischaemic encephalopathy: a nested substudy of a randomised controlled trial. Lancet Neurol. 2010, 9, 39–45. [Google Scholar] [CrossRef] [PubMed]
  6. Shankaran, S.; McDonald, S.A.; Laptook, A.R.; Hintz, S.R.; Barnes, P.D.; Das, A.; Pappas, A.; Higgins, R.D. Neonatal Magnetic Resonance Imaging Pattern of Brain Injury as a Biomarker of Childhood Outcomes following a Trial of Hypothermia for Neonatal Hypoxic-Ischemic Encephalopathy. J. Pediatr. 2015, 167, 987–93.e3. [Google Scholar] [CrossRef] [PubMed]
  7. Shankaran, S.; Barnes, P.D.; Hintz, S.R.; Laptook, A.R.; Zaterka-Baxter, K.M.; McDonald, S.A.; Ehrenkranz, R.A.; Walsh, M.C.; Tyson, J.E.; Donovan, E.F.; et al. Brain injury following trial of hypothermia for neonatal hypoxic-ischaemic encephalopathy. Arch. Dis. Child. Fetal Neonatal Ed. 2012, 97. [Google Scholar] [CrossRef] [PubMed]
  8. Cheong, J.L.Y.; Coleman, L.; Hunt, R.W.; Lee, K.J.; Doyle, L.W.; Inder, T.E.; Jacobs, S.E. Prognostic utility of magnetic resonance imaging in neonatal hypoxic-ischemic encephalopathy: Substudy of a randomized trial. Arch. Pediatr. Adolesc. Med. 2012, 166, 634–640. [Google Scholar] [CrossRef] [PubMed]
  9. Wassink, G.; Gunn, E.R.; Drury, P.P.; Bennet, L.; Gunn, A.J. The mechanisms and treatment of asphyxial encephalopathy. Front. Neurosci. 2014, 8, 1–11. [Google Scholar] [CrossRef]
  10. Wang, L.; Cheng, G.; Zhou, W.; Sun, J.; Cao, Y.; Shao, X. [Meta-analysis of mild hypothermia for gestational age over 35-week newborns with hypoxic-ischemic encephalopathy]. Zhonghua Yi Xue Za Zhi 2012, 92, 1400–1404. [Google Scholar]
  11. Edwards, A.D.; Brocklehurst, P.; Gunn, A.J.; Halliday, H.; Juszczak, E.; Levene, M.; Strohm, B.; Thoresen, M.; Whitelaw, A.; Azzopardi, D. Neurological outcomes at 18 months of age after moderate hypothermia for perinatal hypoxic ischaemic encephalopathy: synthesis and meta-analysis of trial data. BMJ 2010, 340, c363. [Google Scholar] [CrossRef] [PubMed]
  12. Fukuda, H.; Tomimatsu, T.; Watanabe, N.; Wu Mu, J.; Kohzuki, M.; Endo, M.; Fujii, E.; Kanzaki, T.; Murata, Y. Post-ischemic hypothermia blocks caspase-3 activation in the newborn rat brain after hypoxia-ischemia. Brain Res. 2001, 910, 187–191. [Google Scholar] [CrossRef] [PubMed]
  13. Penman, M.; Shah, P. Time to adopt cooling for neonatal hypoxic-ischemic encephalopathy: Response to a previous commentary. Pediatrics 2008, 121, 616–618. [Google Scholar] [CrossRef] [PubMed]
  14. Nanavati, T.; Seemaladinne, N.; Regier, M.; Yossuck, P.; Pergami, P. Can We Predict Functional Outcome in Neonates with Hypoxic Ischemic Encephalopathy by the Combination of Neuroimaging and Electroencephalography? Pediatr. Neonatol. 2015, 56, 307–316. [Google Scholar] [CrossRef] [PubMed]
  15. Shellhaas, R.A.; Kushwaha, J.S.; Plegue, M.A.; Selewski, D.T.; Barks, J.D.E. An evaluation of cerebral and systemic predictors of 18-month outcomes for neonates with hypoxic ischemic encephalopathy. J. Child Neurol. 2015, 30, 1526–1531. [Google Scholar] [CrossRef] [PubMed]
  16. Rasmussen, L.A.; Cascio, M.A.; Ferrand, A.; Shevell, M.; Racine, E. The complexity of physicians’ understanding and management of prognostic uncertainty in neonatal hypoxic-ischemic encephalopathy. J. Perinatol. 2019, 39, 278–285. [Google Scholar] [CrossRef]
  17. Jia, Y.; Jia, X.; Xu, H.; Gao, L.; Wei, C.; Li, Y.; Liu, X.; Gao, X.; Wei, L. Blood Plasma Metabolic Profile of Newborns with Hypoxic-Ischaemic Encephalopathy by GC-MS. Biomed Res. Int. 2021, 2021, 6677271. [Google Scholar] [CrossRef]
  18. She, H.Q.; Sun, Y.F.; Chen, L.; Xiao, Q.X.; Luo, B.Y.; Zhou, H.S.; Zhou, D.; Chang, Q.Y.; Xiong, L.L. Current analysis of hypoxic-ischemic encephalopathy research issues and future treatment modalities. Front. Neurosci. 2023, 17, 1–17. [Google Scholar] [CrossRef] [PubMed]
  19. McCandless, S.E.; Wright, E.J. Mandatory newborn screening in the United States: History, current status, and existential challenges. Birth Defects Res. 2020, 112, 350–366. [Google Scholar] [CrossRef]
  20. Nordfalk, F.; Ekstrøm, C.T. Newborn dried blood spot samples in Denmark: the hidden figures of secondary use and research participation. Eur. J. Hum. Genet. 2019, 27, 203–210. [Google Scholar] [CrossRef]
  21. Tann, C.J.; Martinello, K.A.; Sadoo, S.; Lawn, J.E.; Seale, A.C.; Vega-Poblete, M.; Russell, N.J.; Baker, C.J.; Bartlett, L.; Cutland, C.; et al. Neonatal Encephalopathy with Group B Streptococcal Disease Worldwide: Systematic Review, Investigator Group Datasets, and Meta-analysis. Clin. Infect. Dis. 2017, 65, S173–S189. [Google Scholar] [CrossRef] [PubMed]
  22. Starodubtseva, N.L.; Eldarov, C.M.; Kirtbaya, A.R.; Balashova, E.N.; Gryzunova, A.S.; Ionov, O.V.; Zubkov, V.V.; Silachev, D.N. Recent Advances in Diagnostics of Neonatal Hypoxic Ischemic Encephalopathy. Bull. Russ. State Med. Univ. 2022, 5–16. [Google Scholar] [CrossRef]
  23. Shevtsova, Y.; Eldarov, C.; Starodubtseva, N.; Goryunov, K.; Chagovets, V.; Ionov, O.; Plotnikov, E.; Silachev, D. Identification of Metabolomic Signatures for Ischemic Hypoxic Encephalopathy Using a Neonatal Rat Model. Children 2023, 10, 1–16. [Google Scholar] [CrossRef] [PubMed]
  24. Kuligowski, J.; Solberg, R.; Sánchez-Illana, Á.; Pankratov, L.; Parra-Llorca, A.; Quintás, G.; Saugstad, O.D.; Vento, M. Plasma metabolite score correlates with Hypoxia time in a newly born piglet model for asphyxia. Redox Biol. 2017, 12, 1–7. [Google Scholar] [CrossRef] [PubMed]
  25. Natarajan, N.; Pardo, A.C. Challenges in neurologic prognostication after neonatal brain injury. Semin. Perinatol. 2017, 41, 117–123. [Google Scholar] [CrossRef] [PubMed]
  26. Mooney, C.; O’Boyle, D.; Finder, M.; Hallberg, B.; Walsh, B.H.; Henshall, D.C.; Boylan, G.B.; Murray, D.M. Predictive modelling of hypoxic ischaemic encephalopathy risk following perinatal asphyxia. Heliyon 2021, 7, e07411. [Google Scholar] [CrossRef] [PubMed]
  27. Polat, M.; Şimşek, A.; Tansuǧ, N.; Sezer, R.G.; Özkol, M.; Başpinar, P.; Tekgül, H. Prediction of neurodevelopmental outcome in term neonates with hypoxic-ischemic encephalopathy. Eur. J. Paediatr. Neurol. 2013, 17, 288–293. [Google Scholar] [CrossRef] [PubMed]
  28. Murray, D.M.; Boylan, G.B.; Ali, I.; Ryan, C.A.; Murphy, B.P.; Connolly, S. Defining the gap between electrographic seizure burden, clinical expression and staff recognition of neonatal seizures. Arch. Dis. Child. Fetal Neonatal Ed. 2008, 93, 187–192. [Google Scholar] [CrossRef] [PubMed]
  29. Basu, S.K.; Kaiser, J.R.; Guffey, D.; Minard, C.G.; Guillet, R.; Gunn, A.J. Hypoglycaemia and hyperglycaemia are associated with unfavourable outcome in infants with hypoxic ischaemic encephalopathy: A post hoc analysis of the CoolCap Study. Arch. Dis. Child. Fetal Neonatal Ed. 2016, 101, F149–F155. [Google Scholar] [CrossRef]
  30. Osredkar, D.; Thoresen, M.; Maes, E.; Flatebø, T.; Elstad, M.; Sabir, H. Hypothermia is not neuroprotective after infection-sensitized neonatal hypoxic-ischemic brain injury. Resuscitation 2014, 85, 567–572. [Google Scholar] [CrossRef]
  31. Falck, M.; Osredkar, D.; Maes, E.; Flatebø, T.; Wood, T.R.; Sabir, H.; Thoresen, M. Hypothermic Neuronal Rescue from Infection-Sensitised Hypoxic-Ischaemic Brain Injury Is Pathogen Dependent. Dev. Neurosci. 2017, 39, 238–247. [Google Scholar] [CrossRef] [PubMed]
  32. Uziel, G.; Ghezzi, D.; Zeviani, M. Infantile mitochondrial encephalopathy. Semin. Fetal Neonatal Med. 2011, 16, 205–215. [Google Scholar] [CrossRef] [PubMed]
  33. Saudubray, J.M.; Garcia-Cazorla, A. An overview of inborn errors of metabolism affecting the brain: From neurodevelopment to neurodegenerative disorders. Dialogues Clin. Neurosci. 2018, 20, 301–325. [Google Scholar] [CrossRef] [PubMed]
  34. Mussap, M.; Antonucci, R.; Noto, A.; Fanos, V. The role of metabolomics in neonatal and pediatric laboratory medicine. Clin. Chim. Acta 2013, 426, 127–138. [Google Scholar] [CrossRef] [PubMed]
  35. Bennet, L.; Booth, L.; Gunn, A.J. Potential biomarkers for hypoxic-ischemic encephalopathy. Semin. Fetal Neonatal Med. 2010, 15, 253–260. [Google Scholar] [CrossRef]
  36. Efstathiou, N.; Theodoridis, G.; Sarafidis, K. Understanding neonatal hypoxic-ischemic encephalopathy with metabolomics. Hippokratia 2017, 21, 115–123. [Google Scholar] [PubMed]
  37. Yoon, H.-R. Screening newborns for metabolic disorders based on targeted metabolomics using tandem mass spectrometry. Ann. Pediatr. Endocrinol. Metab. 2015, 20, 238. [Google Scholar] [CrossRef] [PubMed]
  38. Lee, J.H.; Song, J. Non-derivatizing Tandem Mass Spectrometry Assay for Expanded Newborn Screening and Cutoffs for Preterm Neonates. Ann. Lab. Med. 2023, 43, 133–134. [Google Scholar] [CrossRef] [PubMed]
  39. Ibarra-González, I.; Cruz-Bautista, I.; Bello-Chavolla, O.Y.; Vela-Amieva, M.; Pallares-Méndez, R.; Ruiz de Santiago Y Nevarez, D.; Salas-Tapia, M.F.; Rosas-Flota, X.; González-Acevedo, M.; Palacios-Peñaloza, A.; et al. Optimization of kidney dysfunction prediction in diabetic kidney disease using targeted metabolomics. Acta Diabetol. 2018, 55, 1151–1161. [Google Scholar] [CrossRef]
  40. De Fabritiis, S.; Valentinuzzi, S.; Piras, G.; Cicalini, I.; Pieragostino, D.; Pagotto, S.; Perconti, S.; Zucchelli, M.; Schena, A.; Taschin, E.; et al. Targeted metabolomics detects a putatively diagnostic signature in plasma and dried blood spots from head and neck paraganglioma patients. Oncogenesis 2023, 12. [Google Scholar] [CrossRef]
  41. Rossi, C.; Cicalini, I.; Cufaro, M.C.; Agnifili, L.; Mastropasqua, L.; Lanuti, P.; Marchisio, M.; De Laurenzi, V.; Del Boccio, P.; Pieragostino, D. Multi-omics approach for studying tears in treatment-naïve glaucoma patients. Int. J. Mol. Sci. 2019, 20, 4029. [Google Scholar] [CrossRef] [PubMed]
  42. Koulman, A.; Prentice, P.; Wong, M.C.Y.; Matthews, L.; Bond, N.J.; Eiden, M.; Griffin, J.L.; Dunger, D.B. The development and validation of a fast and robust dried blood spot based lipid profiling method to study infant metabolism. Metabolomics 2014, 10, 1018–1025. [Google Scholar] [CrossRef] [PubMed]
  43. Vannucci, S.J.; Back, S.A. The Vannucci Model of Hypoxic-Ischemic Injury in the Neonatal Rodent: 40 years Later. Dev. Neurosci. 2022, 44, 186–193. [Google Scholar] [CrossRef] [PubMed]
  44. Plotnikov, E.Y.; Brezgunova, A.A.; Pevzner, I.B.; Zorova, L.D.; Manskikh, V.N.; Popkov, V.A.; Silachev, D.N.; Zorov, D.B. Mechanisms of LPS-induced acute kidney injury in neonatal and adult rats. Antioxidants 2018, 7, 1–12. [Google Scholar] [CrossRef] [PubMed]
  45. López-Suárez, O.; Concheiro-Guisán, A.; Sánchez-Pintos, P.; Cocho, J.A.; Fernández Lorenzo, J.R.; Couce, M.L. Acylcarnitine profile in neonatal hypoxic-ischemic encephalopathy. Med. (United States) 2019, 98, e15221. [Google Scholar] [CrossRef] [PubMed]
  46. Walsh, B.H.; Broadhurst, D.I.; Mandal, R.; Wishart, D.S.; Boylan, G.B.; Kenny, L.C.; Murray, D.M. The Metabolomic Profile of Umbilical Cord Blood in Neonatal Hypoxic Ischaemic Encephalopathy. PLoS One 2012, 7, e50520. [Google Scholar] [CrossRef] [PubMed]
  47. Meyburg, J.; Schulze, A.; Kohlmueller, D.; Linderkamp, O.; Mayatepek, E. Postnatal changes in neonatal acylcarnitine profile. Pediatr. Res. 2001, 49, 125–129. [Google Scholar] [CrossRef] [PubMed]
  48. Dave, A.M.; Genaro-Mattos, T.C.; Korade, Z.; Peeples, E.S. Neonatal Hypoxic-Ischemic Brain Injury Alters Brain Acylcarnitine Levels in a Mouse Model. Metabolites 2022, 12, 467. [Google Scholar] [CrossRef]
  49. Famularo, G.; De Simone, C.; Trinchieri, V.; Mosca, L. Carnitines and its congeners: A metabolic pathway to the regulation of immune response and inflammation. Ann. N. Y. Acad. Sci. 2004, 1033, 132–138. [Google Scholar] [CrossRef]
  50. Wassink, G.; Davidson, J.O.; Dhillon, S.K.; Zhou, K.; Bennet, L.; Thoresen, M.; Gunn, A.J. Therapeutic Hypothermia in Neonatal Hypoxic-Ischemic Encephalopathy. Curr. Neurol. Neurosci. Rep. 2019, 19, 2. [Google Scholar] [CrossRef]
  51. Silveira, R.C.; Procianoy, R.S. Hipotermia terapêutica para recém-nascidos com encefalopatia hipóxico isquêmica. J. Pediatr. (Rio. J). 2015, 91, S78–S83. [Google Scholar] [CrossRef] [PubMed]
  52. Roldán, A.; Figueras-Aloy, J.; Deulofeu, R.; Jiménez, R. Glycine and other neurotransmitter amino acids in cerebrospinal fluid in perinatal asphyxia and neonatal hypoxic-ischaemic encephalopathy. Acta Paediatr. Int. J. Paediatr. 1999, 88, 1137–1141. [Google Scholar] [CrossRef] [PubMed]
  53. Fuchs, S.A.; Peeters-Scholte, C.M.P.C.D.; De Barse, M.M.J.; Roeleveld, M.W.; Klomp, L.W.J.; Berger, R.; De Koning, T.J. Increased concentrations of both NMDA receptor co-agonists d-serine and glycine in global ischemia: A potential novel treatment target for perinatal asphyxia. Amino Acids 2012, 43, 355–363. [Google Scholar] [CrossRef]
  54. Baker, A.J.; Zornow, M.H.; Grafe, M.R.; Scheller, M.S.; Skilling, S.R.; Smullin, D.H.; Larson, A.A. Hypothermia prevents ischemia-induced increases in hippocampal glycine concentrations in rabbits. Stroke 1991, 22, 666–673. [Google Scholar] [CrossRef] [PubMed]
  55. Phillis, J.W.; Walter, G.A. Effect of a brief hypoxic/hypotensive episode on the in vivo release of cerebral cortical γ-aminobutyric acid and glycine. Brain Res. 1989, 504, 121–123. [Google Scholar] [CrossRef] [PubMed]
  56. Castillo, J.; Dávalos, A.; Naveiro, J.; Noya, M. Neuroexcitatory amino acids and their relation to infarct size and neurological deficit in ischemic stroke. Stroke 1996, 27, 1060–1065. [Google Scholar] [CrossRef] [PubMed]
  57. Wang, H.; Ni, X.; Dong, W.; Qin, W.; Xu, L.; Jiang, Y. Accurately quantified plasma free glycine concentration as a biomarker in patients with acute ischemic stroke. Amino Acids 2023, 55, 385–402. [Google Scholar] [CrossRef] [PubMed]
  58. Yang, L.; Garcia Canaveras, J.C.; Chen, Z.; Wang, L.; Liang, L.; Jang, C.; Mayr, J.A.; Zhang, Z.; Ghergurovich, J.M.; Zhan, L.; et al. Serine Catabolism Feeds NADH when Respiration Is Impaired. Cell Metab. 2020, 31, 809–821.e6. [Google Scholar] [CrossRef]
  59. Oda, M.; Kure, S.; Sugawara, T.; Yamaguchi, S.; Kojima, K.; Shinka, T.; Sato, K.; Narisawa, A.; Aoki, Y.; Matsubara, Y.; et al. Direct correlation between ischemic injury and extracellular glycine concentration in mice with genetically altered activities of the glycine cleavage multienzyme system. Stroke 2007, 38, 2157–2164. [Google Scholar] [CrossRef]
  60. Caramelo, I.; Coelho, M.; Rosado, M.; Cardoso, C.M.P.; Dinis, A.; Duarte, C.B.; Grãos, M.; Manadas, B. Biomarkers of hypoxic–ischemic encephalopathy: a systematic review; Springer Nature Singapore, 2023; Vol. 19; ISBN 0123456789.
  61. Johnston, M. V Excitotoxicity in perinatal brain injury. Brain Pathol. 2005, 15, 234–240. [Google Scholar] [CrossRef]
  62. O’Boyle, D.S.; Dunn, W.B.; O’Neill, D.; Kirwan, J.A.; Broadhurst, D.I.; Hallberg, B.; Boylan, G.B.; Murray, D.M. Improvement in the Prediction of Neonatal Hypoxic-Ischemic Encephalopathy with the Integration of Umbilical Cord Metabolites and Current Clinical Makers. J. Pediatr. 2021, 229, 175–181.e1. [Google Scholar] [CrossRef]
  63. El-Farghali, O.G.; El-Chimi, M.S.; El-Abd, H.S.; El-Desouky, E. Amino acid and acylcarnitine profiles in perinatal asphyxia: a case-control study. J. Matern. Neonatal Med. 2018, 31, 1462–1469. [Google Scholar] [CrossRef]
  64. Reinke, S.N.; Walsh, B.H.; Boylan, G.B.; Sykes, B.D.; Kenny, L.C.; Murray, D.M.; Broadhurst, D.I. 1H NMR derived metabolomic profile of neonatal asphyxia in umbilical cord serum: Implications for hypoxic ischemic encephalopathy. J. Proteome Res. 2013, 12, 4230–4239. [Google Scholar] [CrossRef] [PubMed]
  65. Roberts, E.L. 2.1 The Support of Energy Metabolism in the Central Nervous System with Substrates Other than Glucose. In Handbook of Neurochemistry and Molecular Neurobiology: Brain Energetics. Integration of Molecular and Cellular Processes; Lajtha, A., Gibson, G.E., Dienel, G.A., Eds.; Springer US: Boston, MA, 2007; pp. 137–179. ISBN 978-0-387-30411-3. [Google Scholar]
  66. Zheng, Y.; Chen, Y.; Qiu, X.; Chen, W.; Lin, Q.; Zeng, Y.; Zhao, H.; Zhu, W. A verification of the application of the non-derivatized mass spectrometry method in newborns screening of metabolic disorders. Med. (United States) 2019, 98. [Google Scholar] [CrossRef]
  67. Lee, B.; Heo, W.Y.; Kim, J.A.; Lee, H.S.; Hwang, N.; Park, H.D.; Sung, S.I.; Chang, Y.S.; Park, W.S.; Lee, S.Y. Comprehensive Evaluation of the NeoBase 2 Non-derivatized MSMS Assay and Exploration of Analytes With Significantly Different Concentrations Between Term and Preterm Neonates. Ann. Lab. Med. 2023, 43, 153–166. [Google Scholar] [CrossRef] [PubMed]
  68. Hartog, N.; Hershfield, M.; Michniacki, T.; Moloney, S.; Holsworth, A.; Hurden, I.; Fredrickson, M.; Kleyn, M.; Walkovich, K.; Secord, E. Newborn tandem mass spectroscopy screening for adenosine deaminase deficiency. Ann. allergy, asthma Immunol. Off. Publ. Am. Coll. Allergy, Asthma, Immunol. 2022, 129, 776–783.e2. [Google Scholar] [CrossRef] [PubMed]
  69. Perko, D.; Groselj, U.; Cuk, V.; Iztok Remec, Z.; Zerjav Tansek, M.; Drole Torkar, A.; Krhin, B.; Bicek, A.; Oblak, A.; Battelino, T.; et al. Comparison of Tandem Mass Spectrometry and the Fluorometric Method—Parallel Phenylalanine Measurement on a Large Fresh Sample Series and Implications for Newborn Screening for Phenylketonuria. Int. J. Mol. Sci. 2023, 24. [Google Scholar] [CrossRef]
  70. Cicalini, I.; Valentinuzzi, S.; Pieragostino, D.; Consalvo, A.; Zucchelli, M.; Donzelli, S.; Ambrogi, D.; Brown, H.A.; Calton, L.J.; Stuppia, L.; et al. Analytical evaluation of the ideal strategy for high-throughput flow injection analysis by tandem mass spectrometry in routine newborn screening. Metabolites 2021, 11, 473. [Google Scholar] [CrossRef]
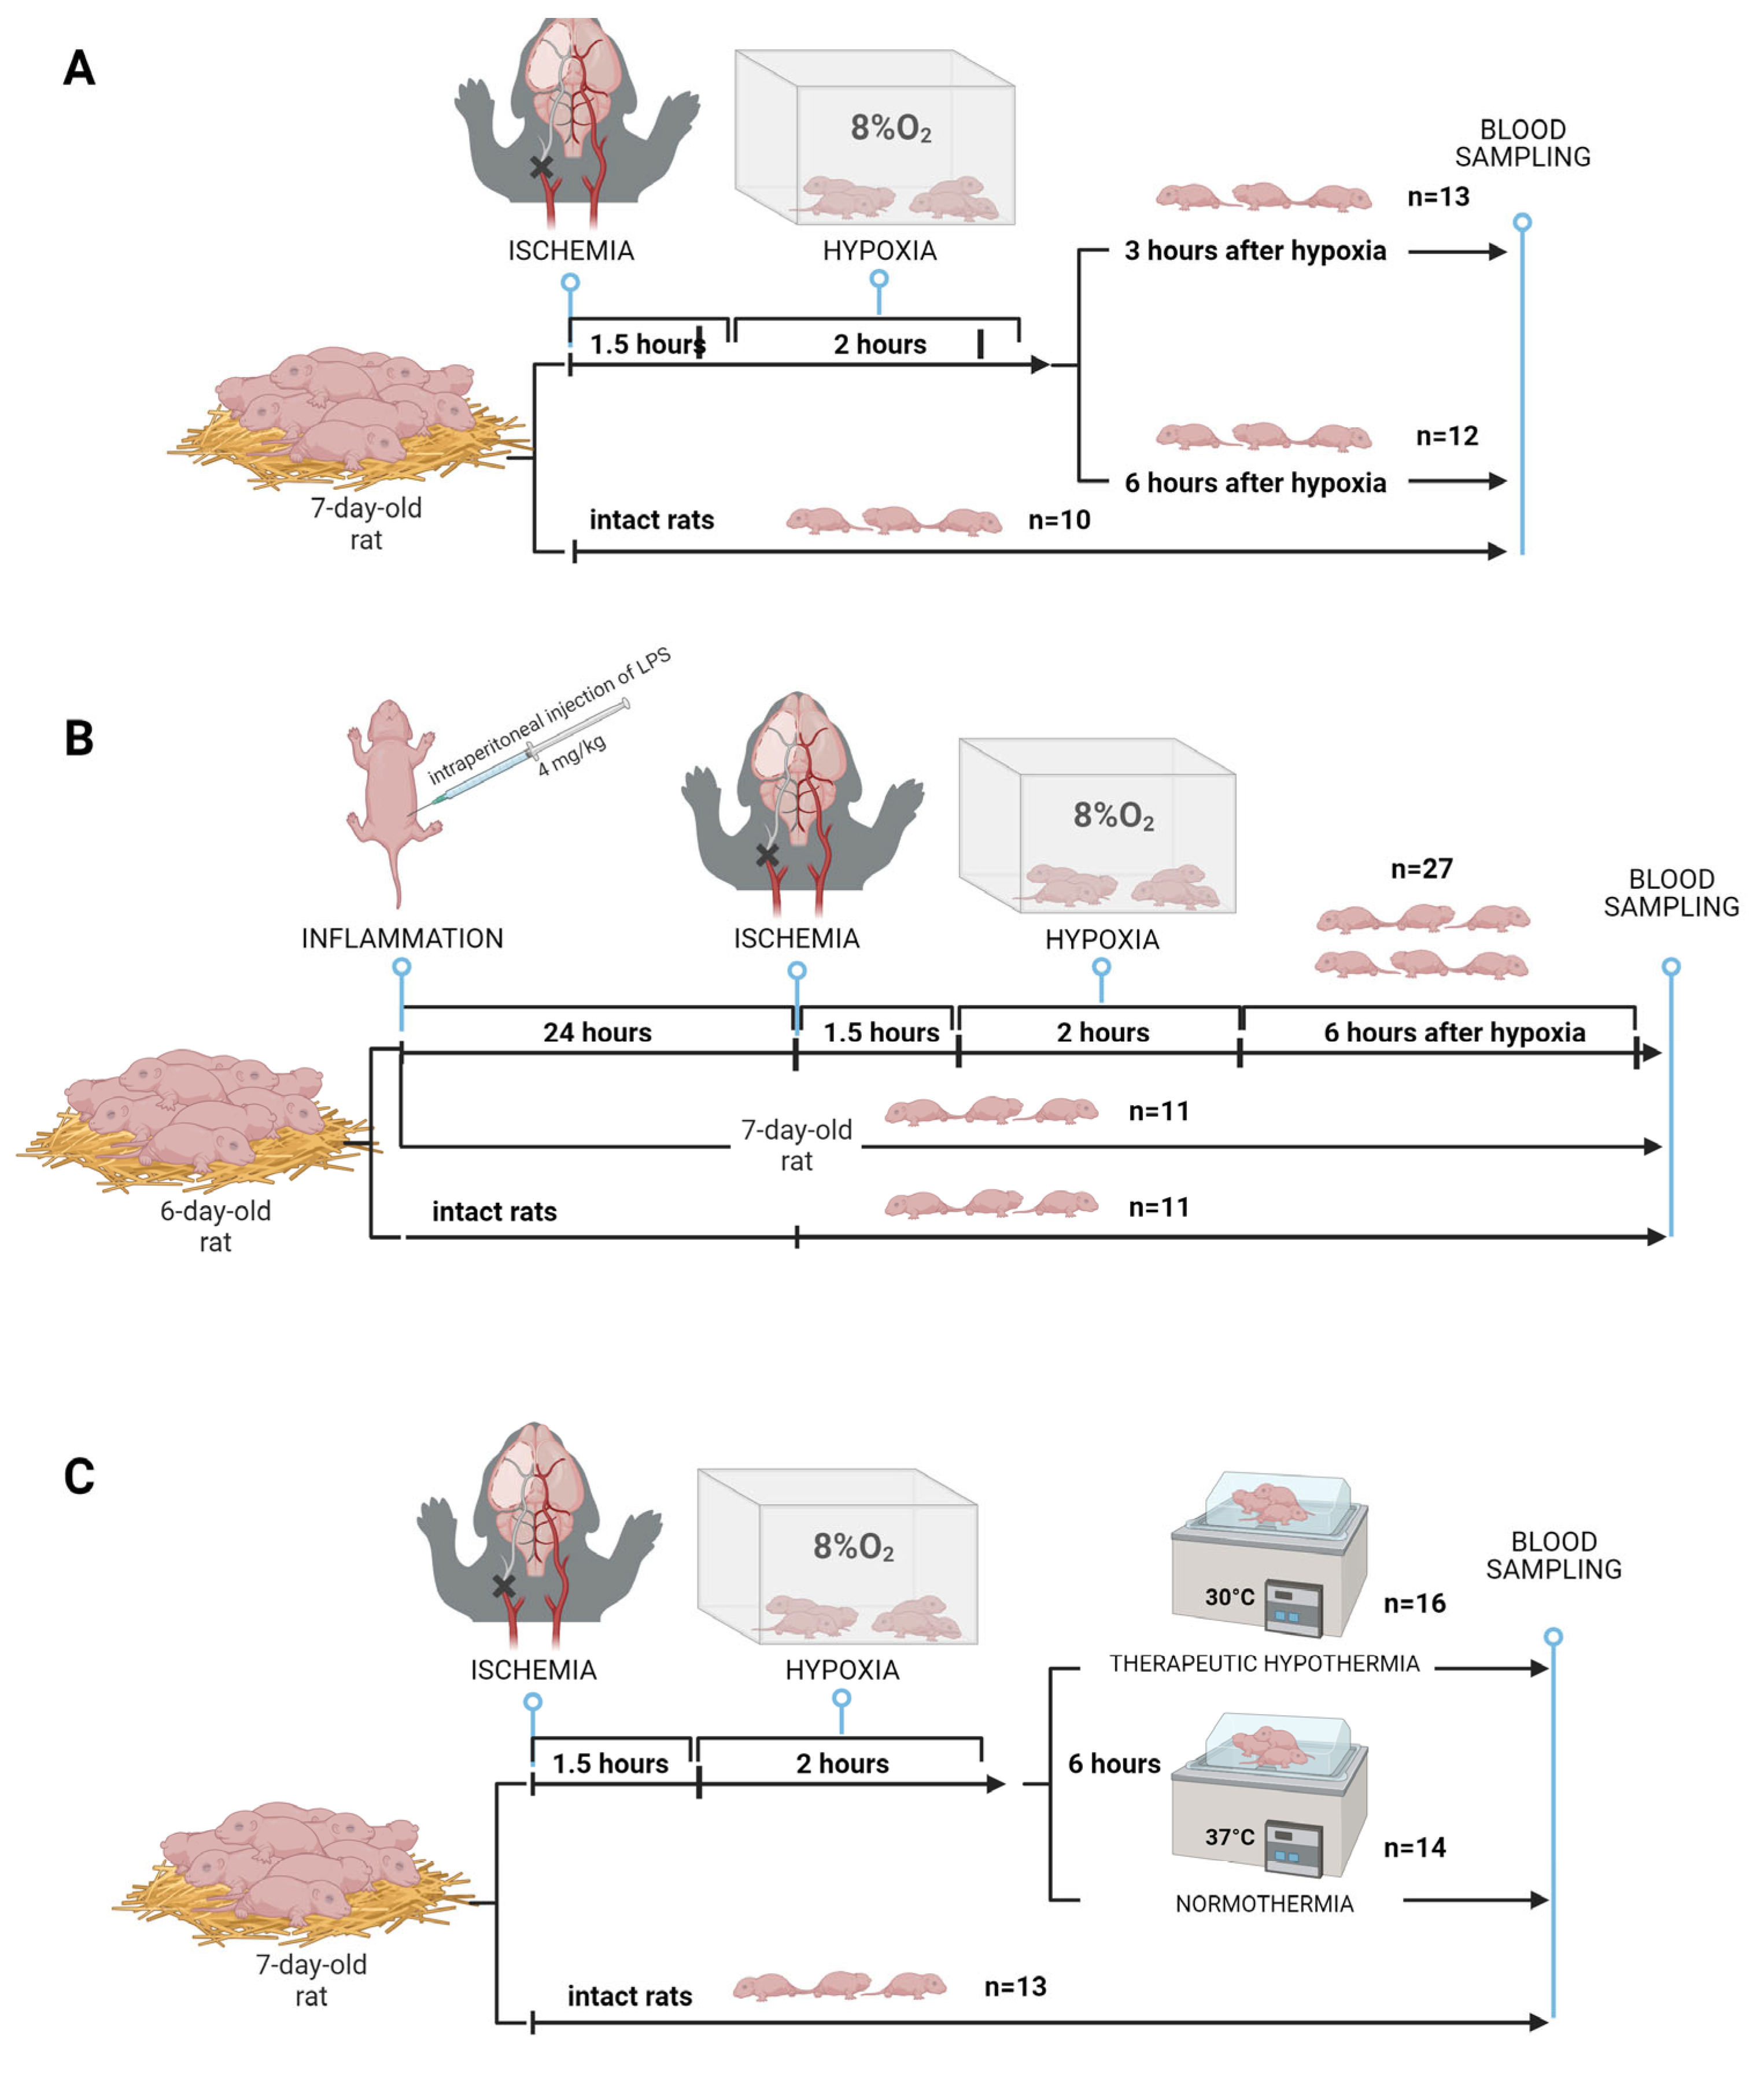
Figure 1. Study design: A, HIE with sampling at different times; B, HIE model with LPS-induced inflammation; C - modeling of therapeutic hypothermia.
Preprints 92256 g001
Figure 2. Statistically significant changes in DBS metablolites levels over time. * - p<0.05, ** - p<0.01, *** - p<0.001.
Preprints 92256 g002
Figure 3. The impact of time after hypoxic-ischemic exposure on the low-molecular-weight spectrum of DBS: A) Principal Component Analysis (PCA) space based on blood compounds, whose levels show statistically significant differences in pairwise group comparisons; B) Correlation diagram of statistically significant compounds associated with the time elapsed since HIE.
Preprints 92256 g003
Figure 4. Box plot of DBS metabolites, statistically significantly differing in pairwise comparisons between the LPS-induced inflammation (yellow), inflammation associated with HIE (red), and control (green) groups.
Preprints 92256 g004
Figure 5. Potential markers for pairwise comparison of control group, HIE with 6-hour TH, and HIE with 6-hour normothermic mode. Green color represents the control group; blue indicates the HIE + TH group; and red indicates the HIE normothermia group.
Preprints 92256 g005
Figure 6. A) Receiver operating characteristic (ROC) curves for logistic regression models: ROC curves obtained during cross-validation for logistic regression models diagnosing after 3 hours and 6 hours post-HIE. Both models utilize the concentration of glycine raised to the second power [Gly]² as a variable. B) Receiver operating characteristic (ROC) curves for orthogonal partial least squares (OPLS) models: ROC curves obtained during cross-validation for OPLS models diagnosing after 3 hours and 6 hours post-HIE.
Preprints 92256 g006
Figure 7. OPLS-DA scores plot for the diagnosis of hypoxia after A) 3 hours and B) 6 hours of exposure. The control group is indicated in green, and the group with hypoxic-ischemic injury is shown in red.
Preprints 92256 g007
Disclaimer/Publisher’s Note: The statements, opinions and data contained in all publications are solely those of the individual author(s) and contributor(s) and not of MDPI and/or the editor(s). MDPI and/or the editor(s) disclaim responsibility for any injury to people or property resulting from any ideas, methods, instructions or products referred to in the content.
Copyright: This open access article is published under a Creative Commons CC BY 4.0 license, which permit the free download, distribution, and reuse, provided that the author and preprint are cited in any reuse.
Prerpints.org logo

Preprints.org is a free preprint server supported by MDPI in Basel, Switzerland.

Subscribe

© 2024 MDPI (Basel, Switzerland) unless otherwise stated