Submitted:
05 December 2023
Posted:
06 December 2023
You are already at the latest version
Abstract
Keywords:
I. Introduction
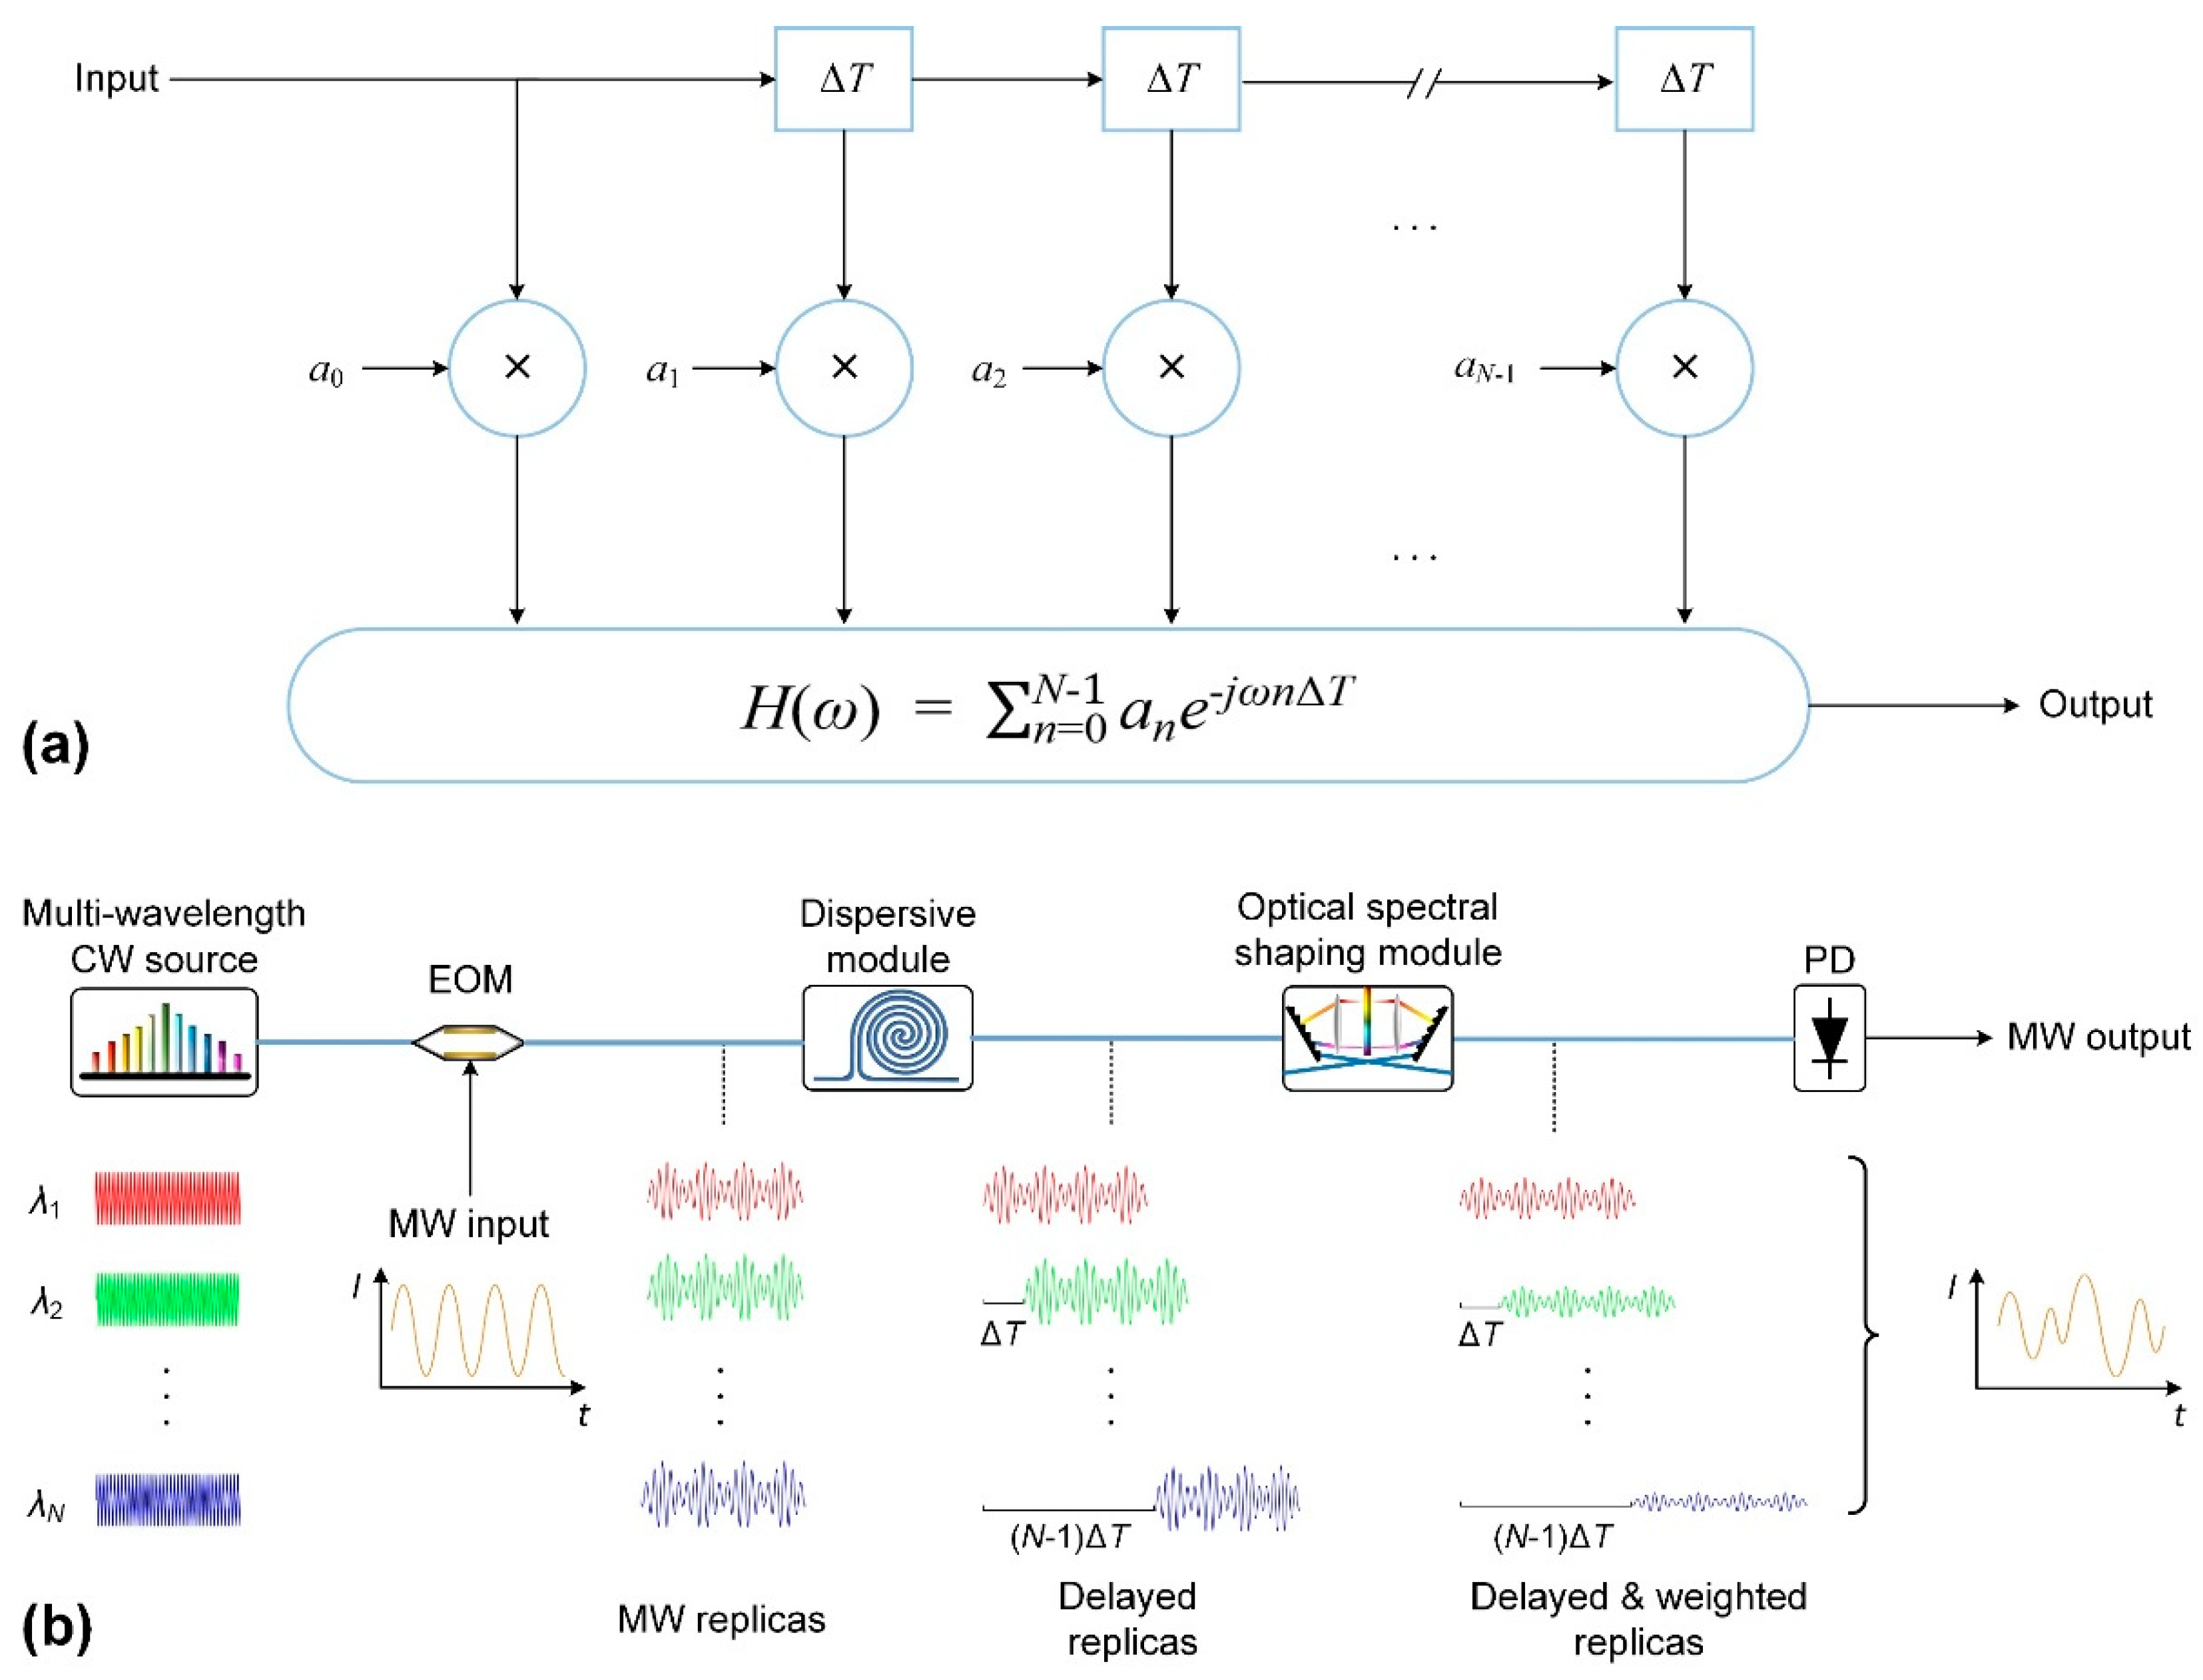
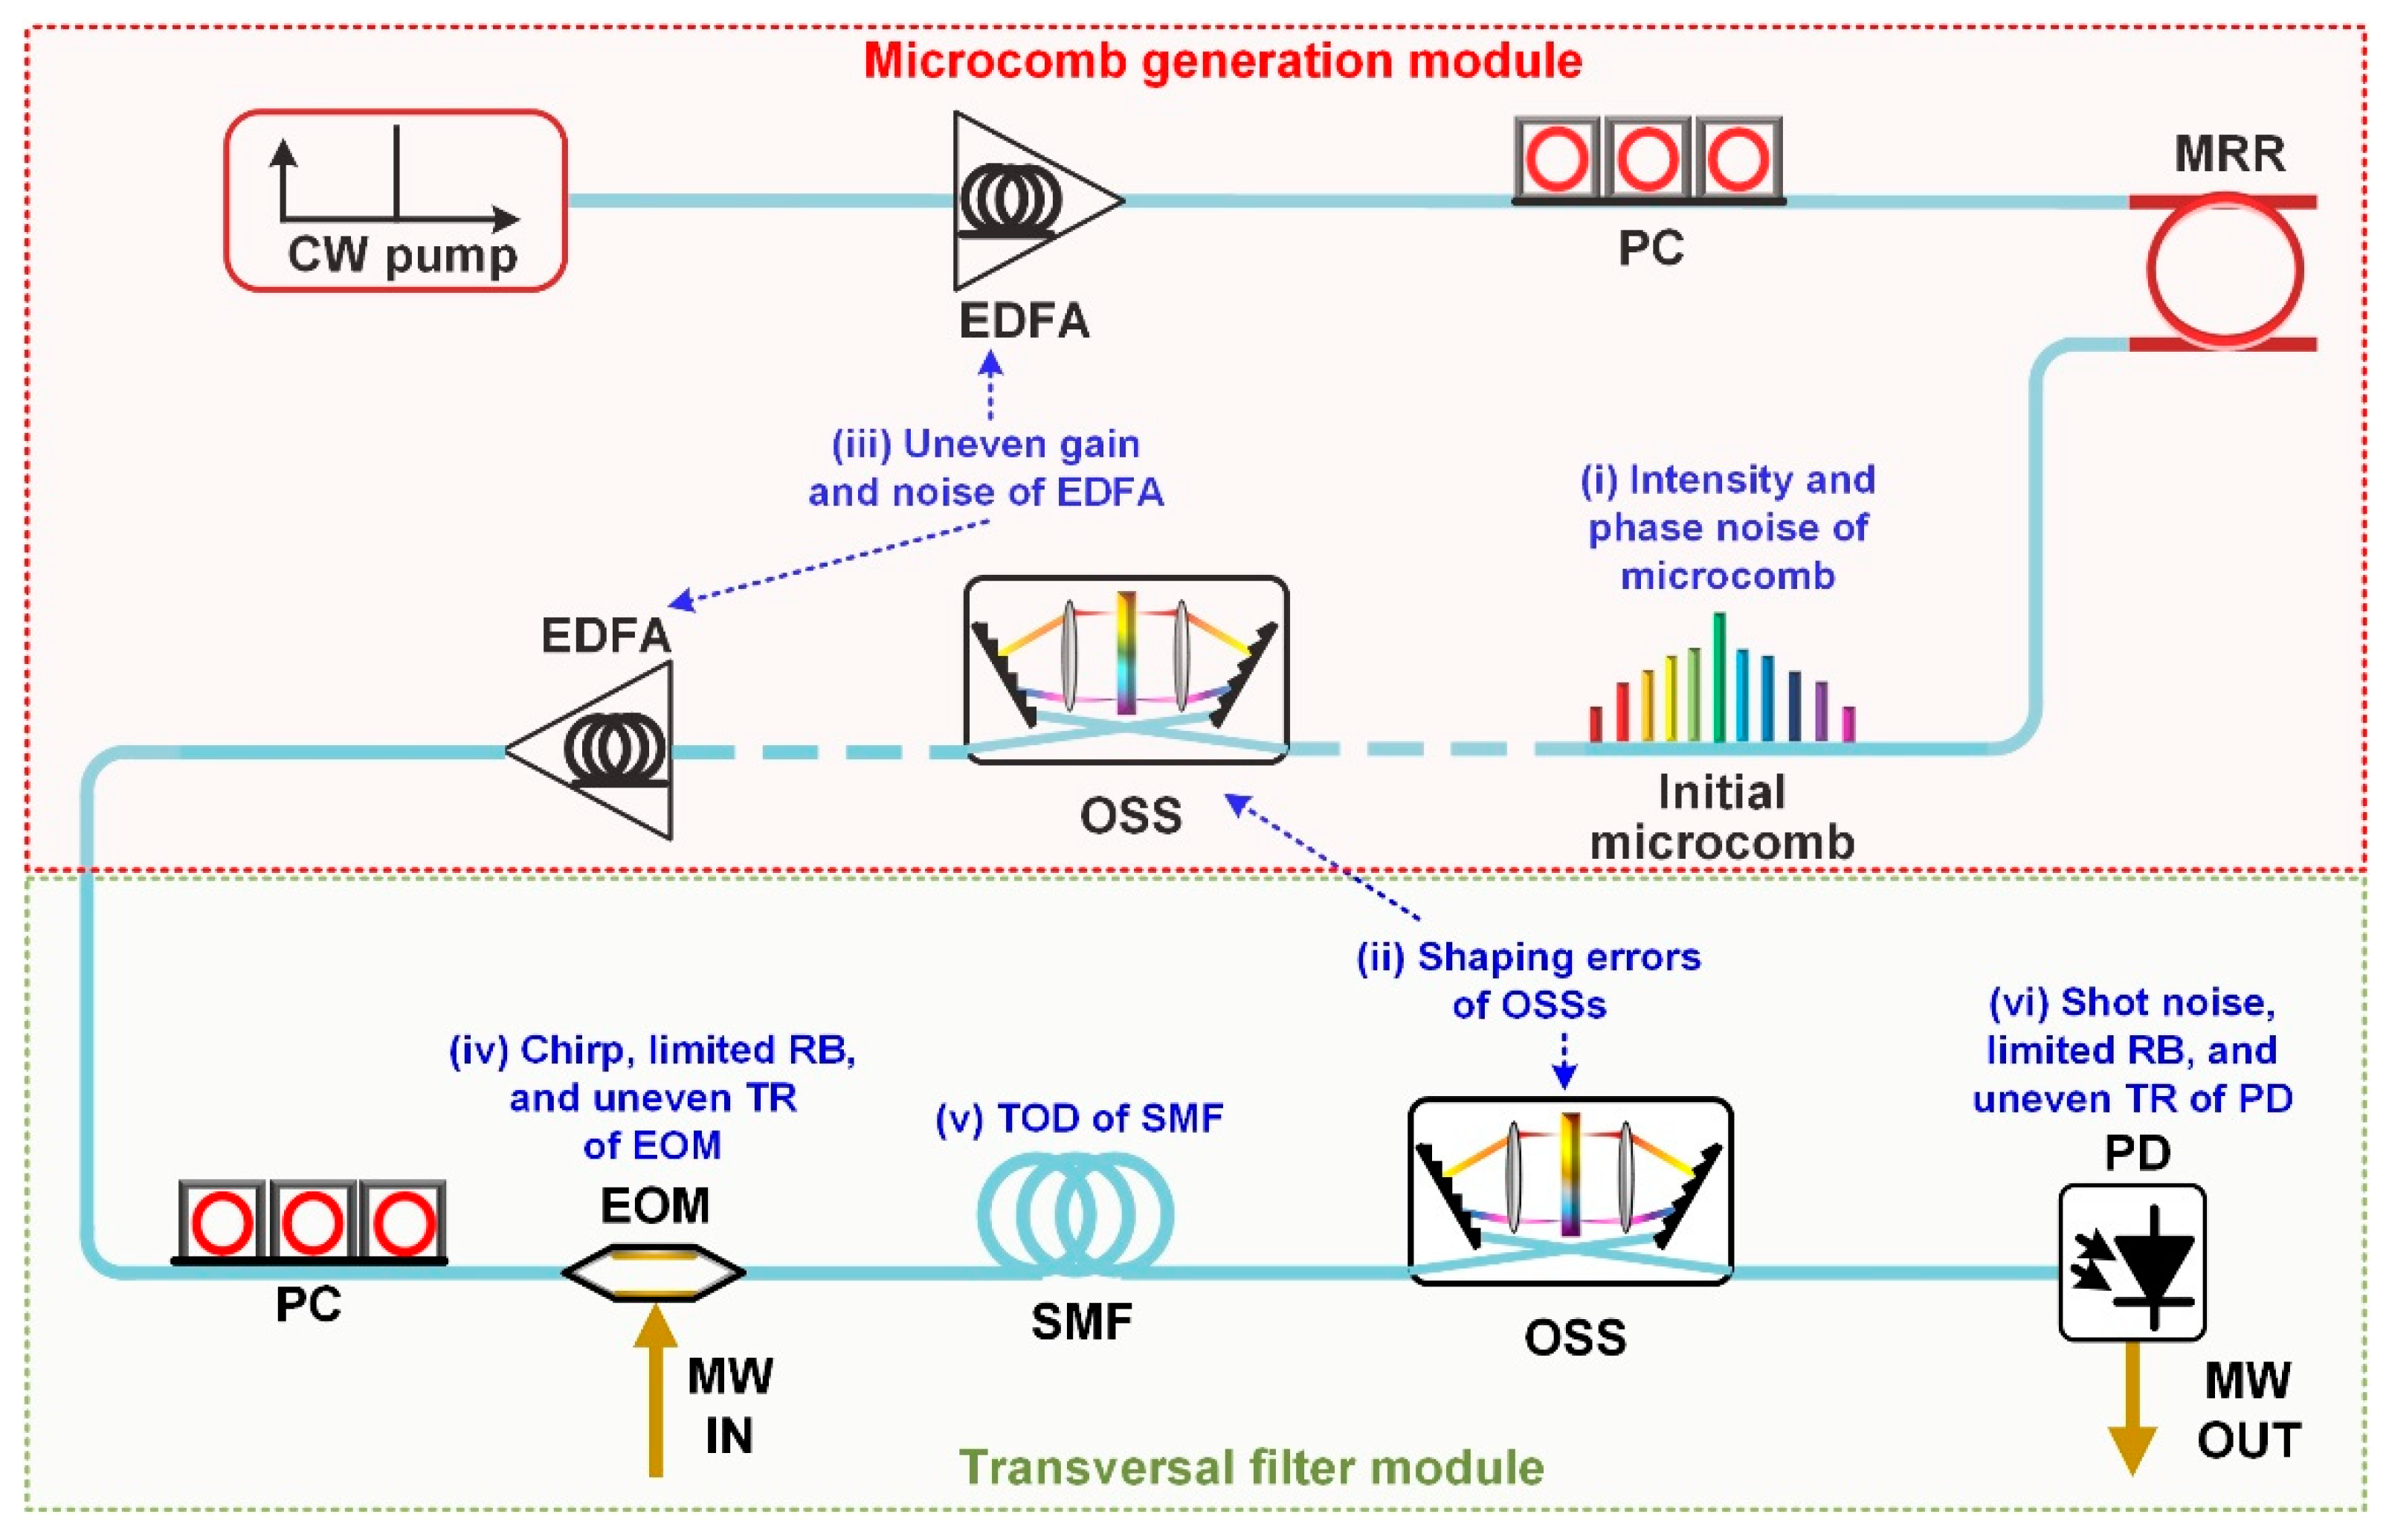
II. Microcomb-Based Microwave Photonic Transversal Filter Systems
III. Feedback Control Methods for Microcomb-Based Microwave Photonic Transversal Filter Systems
- A.
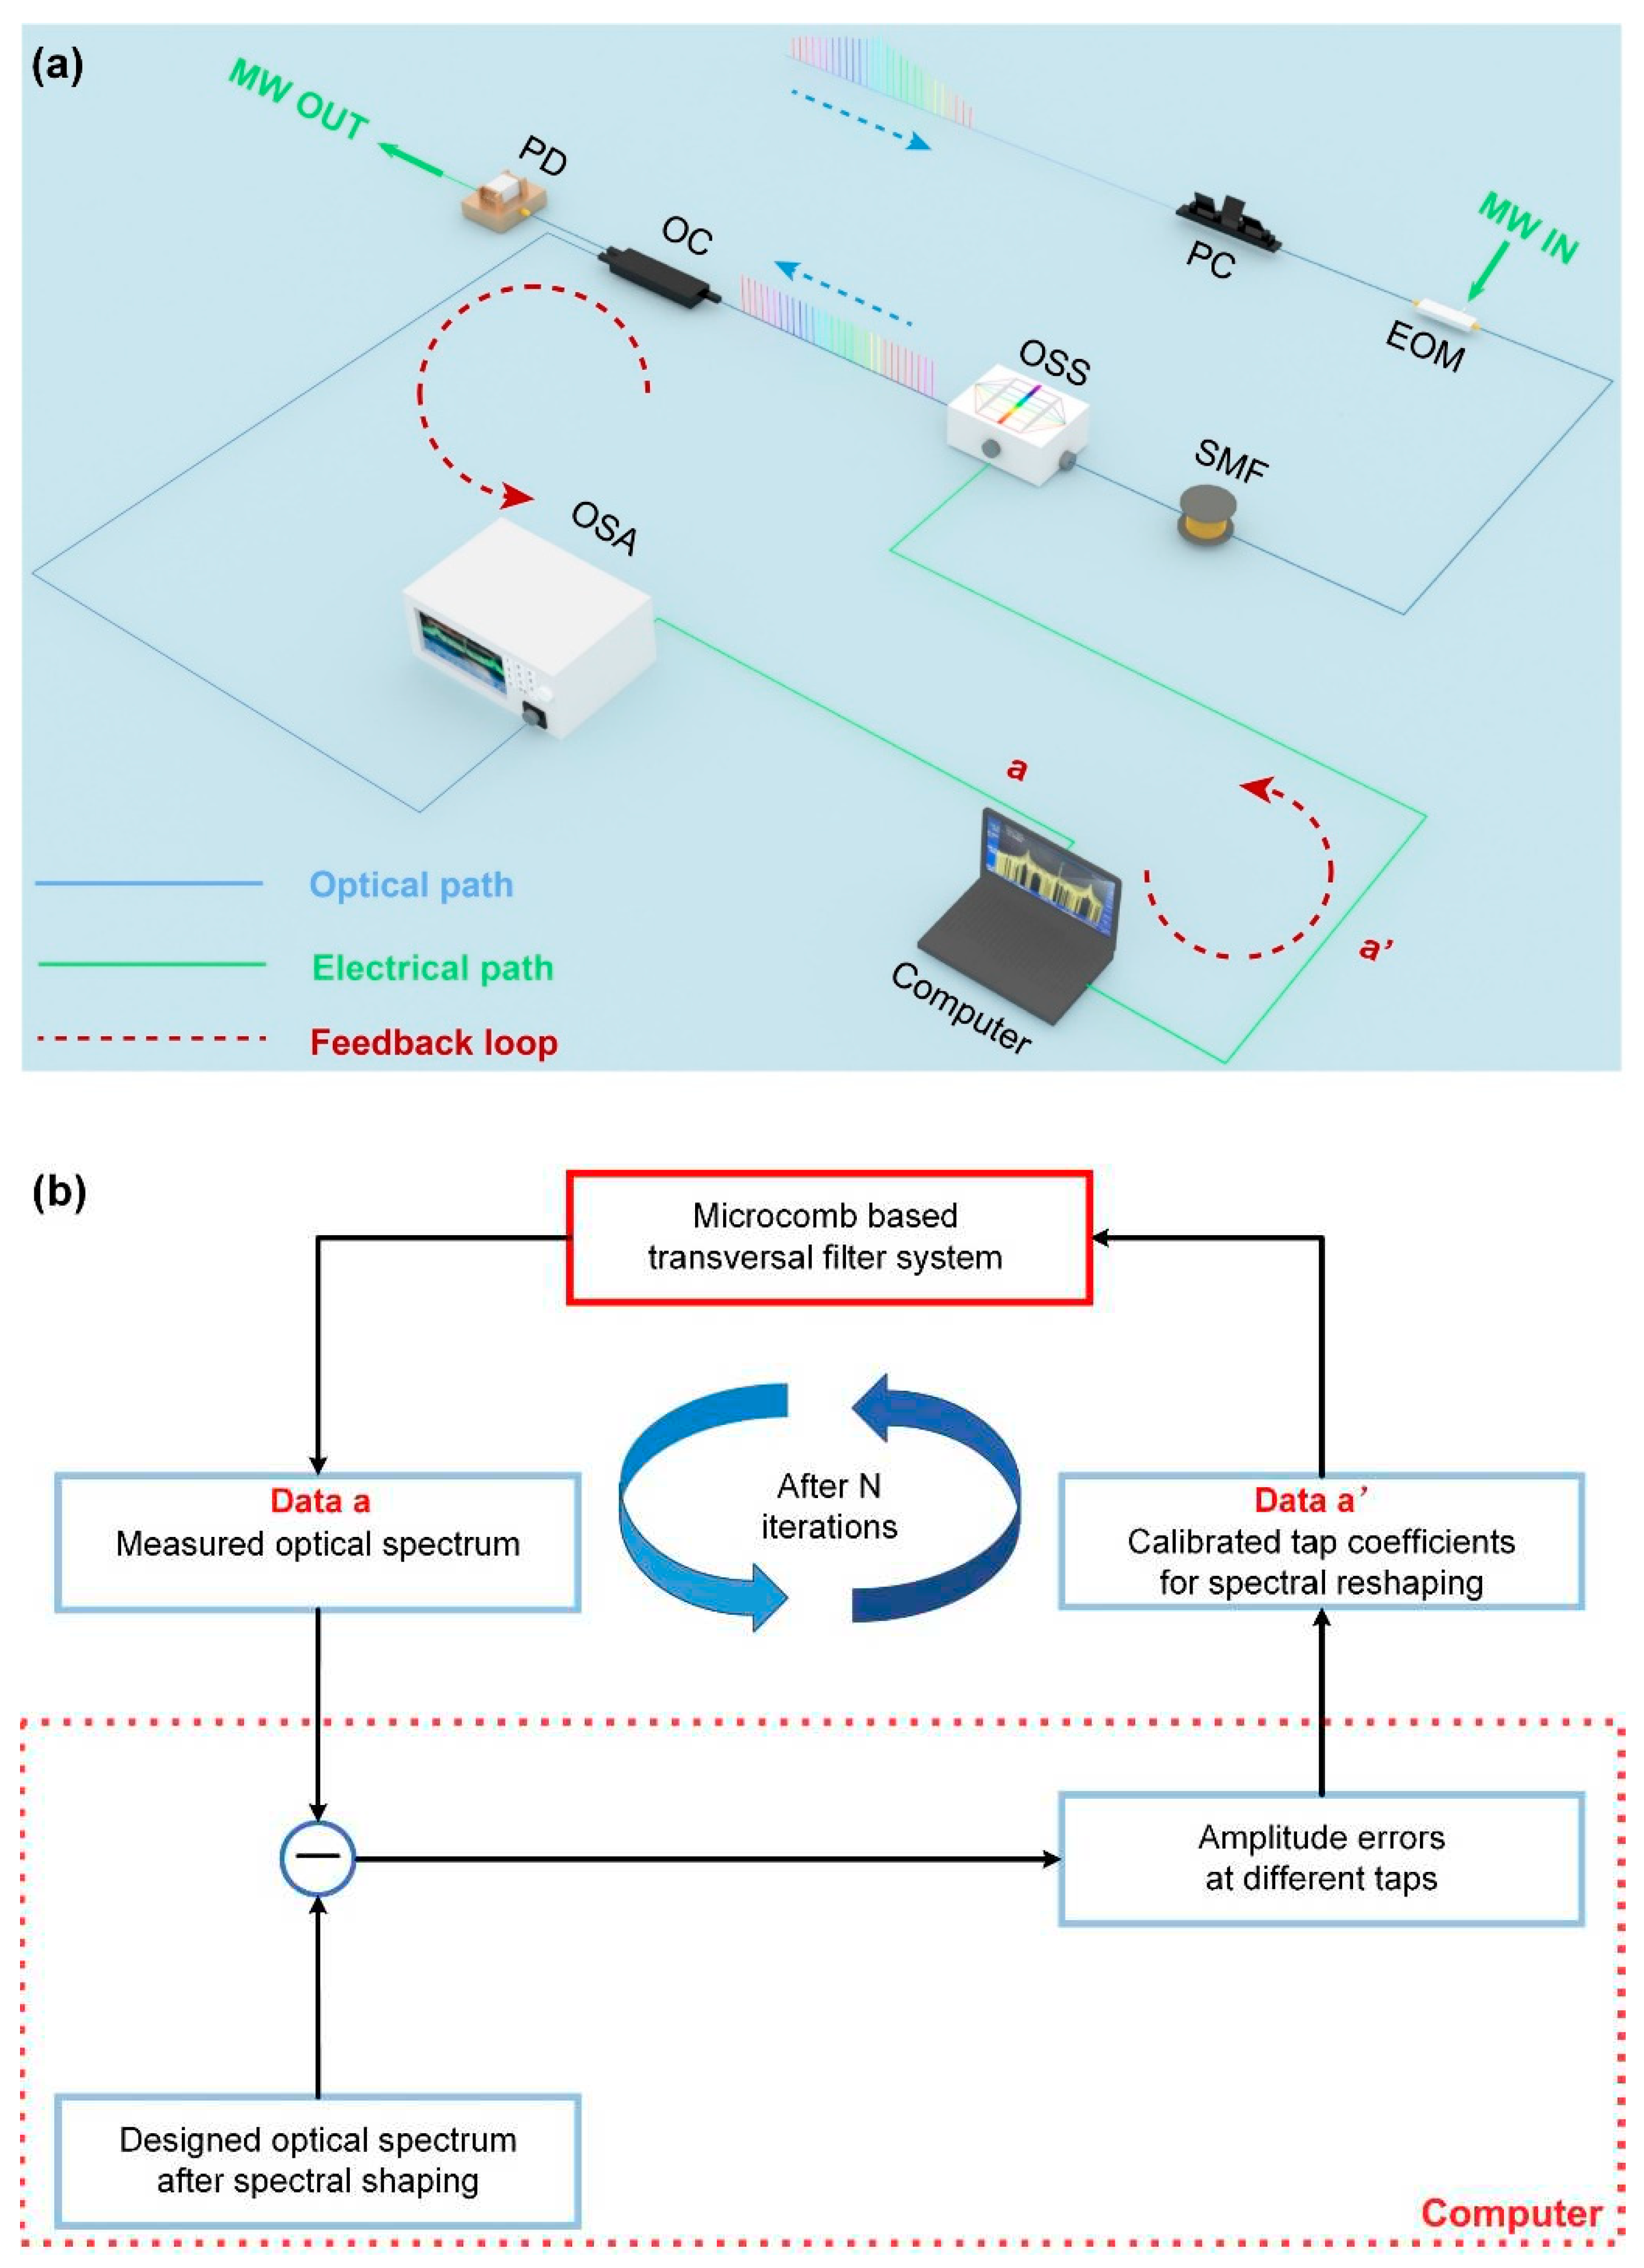
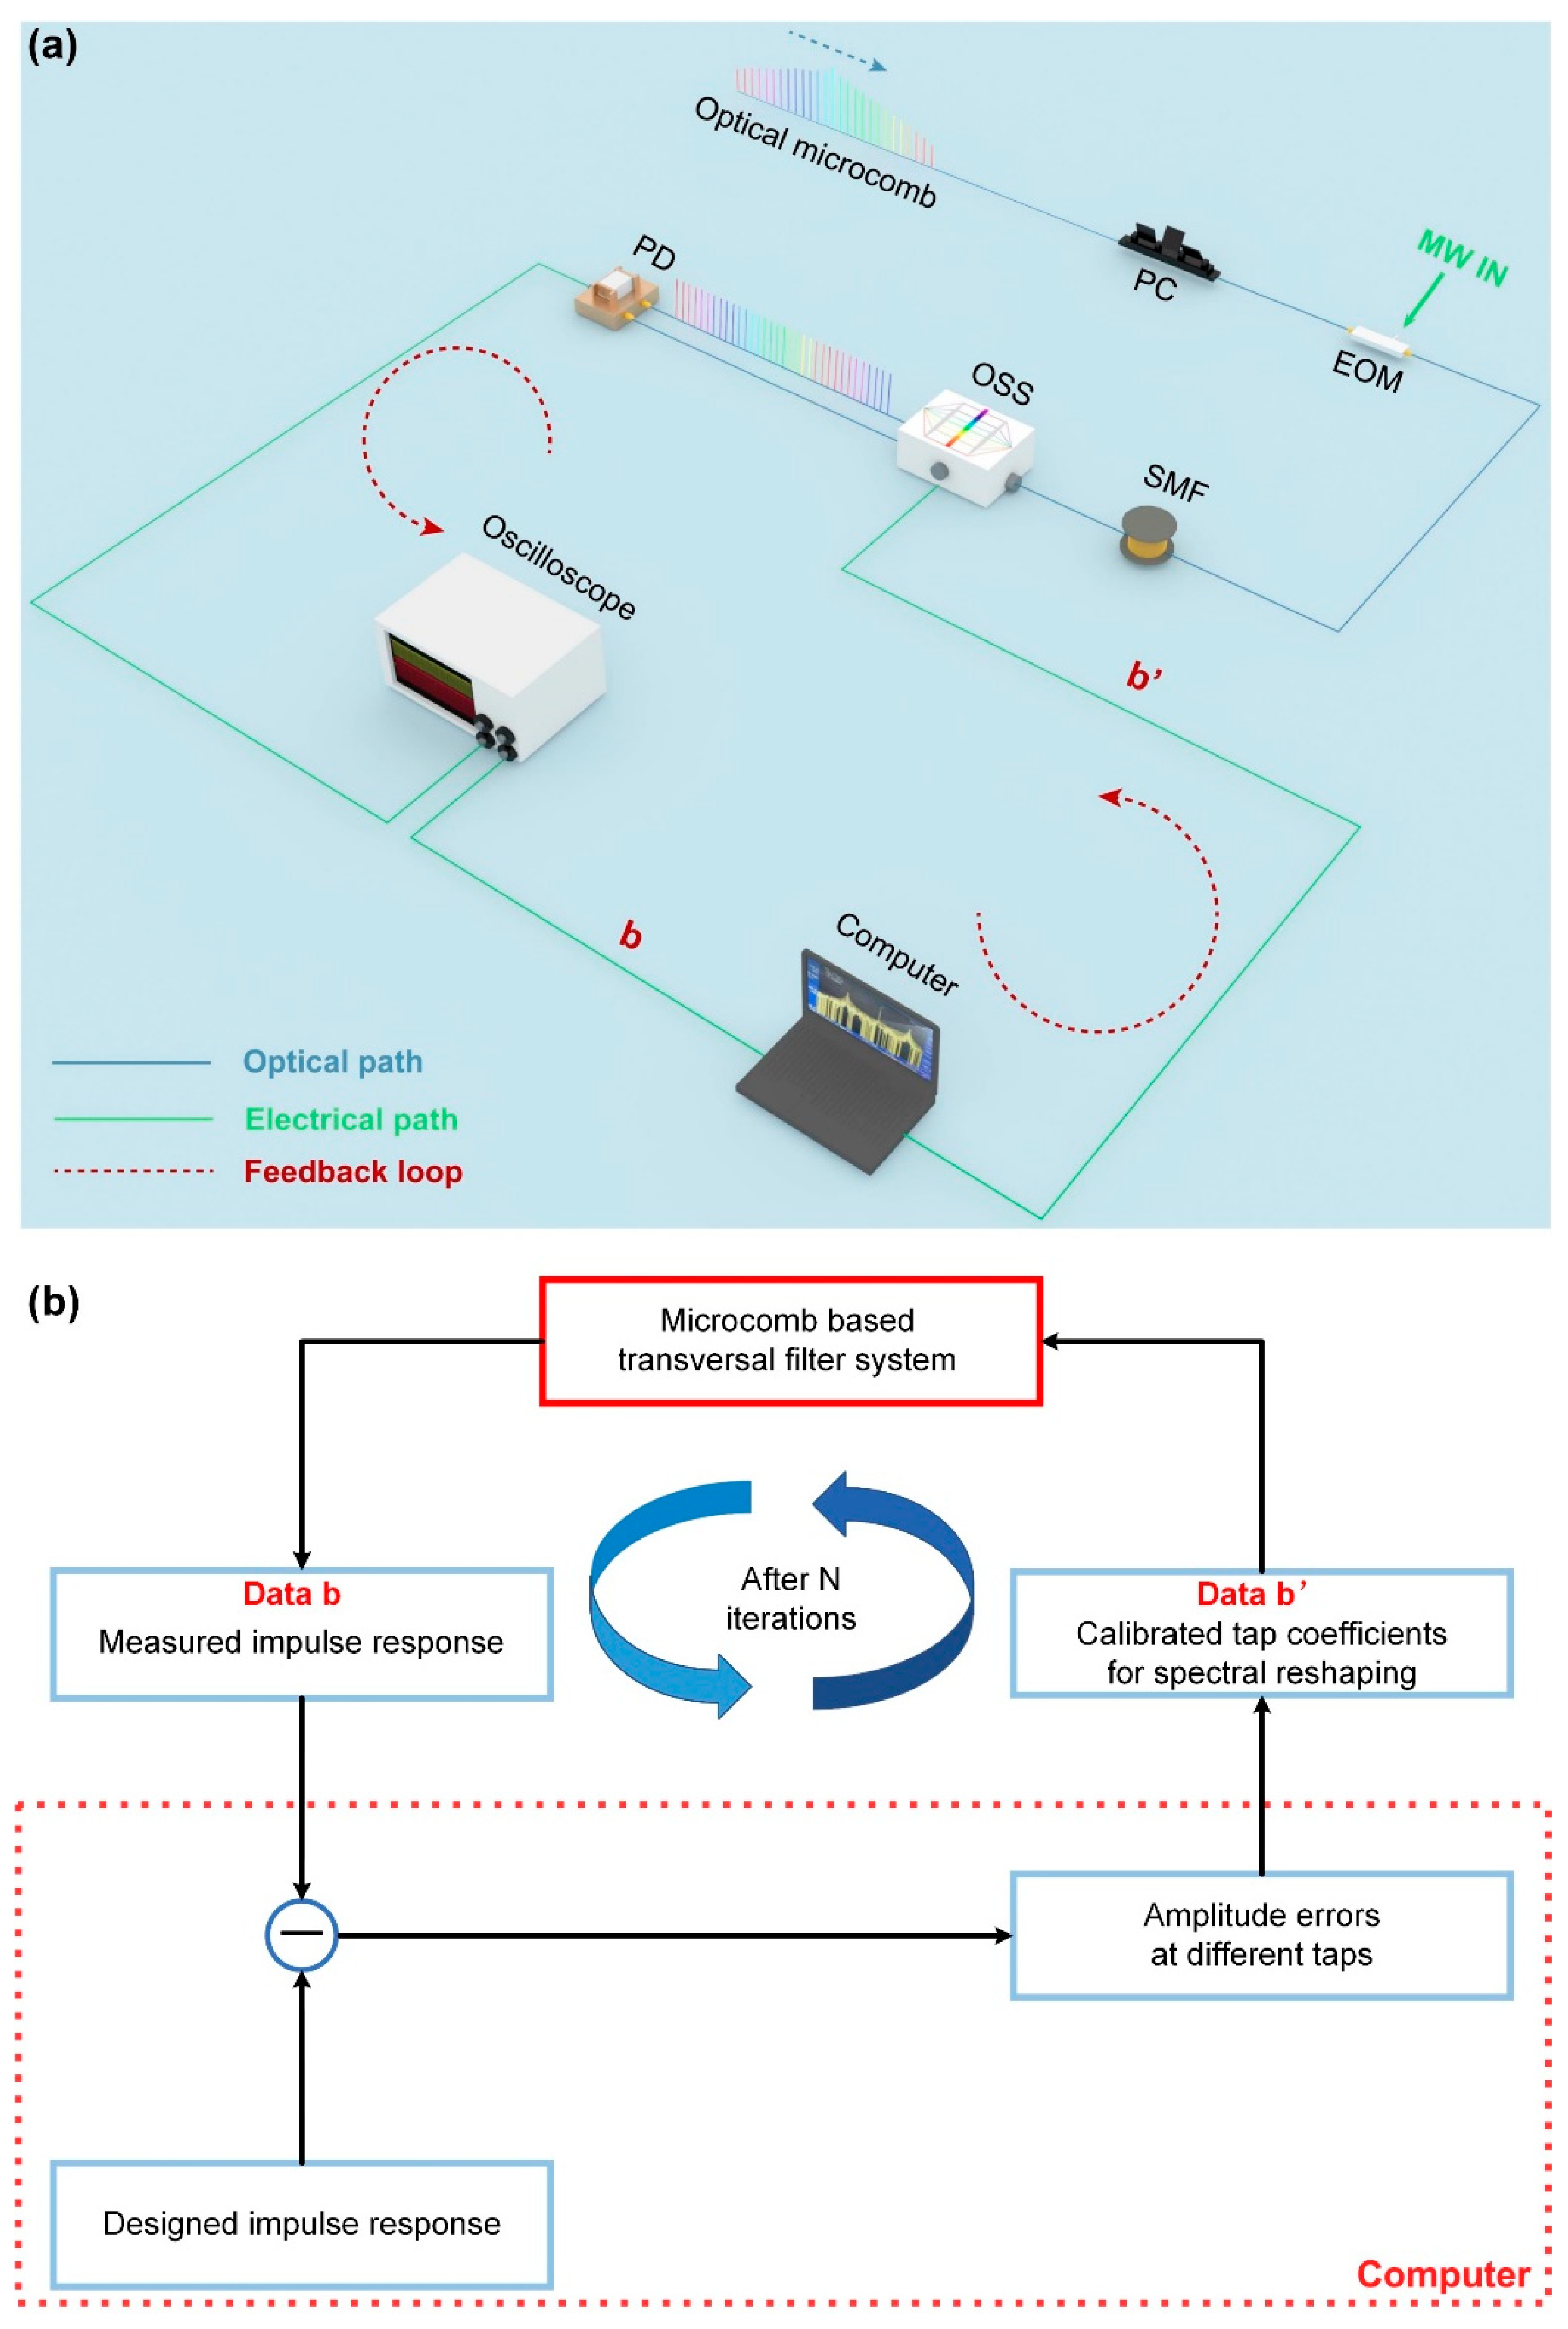
- >A. One-stage feedback control
- B. Two-stage feedback control
- C. Comparison of different feedback control methods
IV. Experiment Results and Performance Comparison
V. Discussion
VI. Concluson
References
- Xu, X.; Tan, M.; Corcoran, B.; Wu, J.; Boes, A.; Nguyen, T.G.; Chu, S.T.; Little, B.E.; Hicks, D.G.; Morandotti, R.; et al. 11 TOPS photonic convolutional accelerator for optical neural networks. Nature 2021, 589, 44–51. [Google Scholar] [CrossRef] [PubMed]
- Xu, X.; Tan, M.; Wu, J.; Boes, A.; Corcoran, B.; Nguyen, T.G.; Chu, S.T.; Little, B.E.; Morandotti, R.; Mitchell, A.; et al. Photonic RF and Microwave Integrator Based on a Transversal Filter With Soliton Crystal Microcombs. IEEE Trans. Circuits Syst. II: Express Briefs 2020, 67, 3582–3586. [Google Scholar] [CrossRef]
- Tan, M.; Xu, X.; Corcoran, B.; Wu, J.; Boes, A.; Nguyen, T.G.; Chu, S.T.; Little, B.E.; Morandotti, R.; Mitchell, A.; et al. RF and Microwave Fractional Differentiator Based on Photonics. IEEE Trans. Circuits Syst. II: Express Briefs 2020, 67, 2767–2771. [Google Scholar] [CrossRef]
- Xu, X.; Tan, M.; Corcoran, B.; Wu, J.; Nguyen, T.G.; Boes, A.; Chu, S.T.; Little, B.E.; Morandotti, R.; Mitchell, A.; Hicks, D.G.; Moss, D.J. Photonic Perceptron Based on a Kerr Microcomb for High-Speed, Scalable, Optical Neural Networks. Laser Photonics Rev. 2020, 14, 10. [Google Scholar] [CrossRef]
- Capmany, J.; Ortega, B.; Pastor, D.; Sales, S. Discrete-time optical Processing of microwave signals. J. Light. Technol. 2005, 23, 702–723. [Google Scholar] [CrossRef]
- Wu, J.; Xu, X.; Nguyen, T.G.; Chu, S.T.; Little, B.E.; Morandotti, R.; Mitchell, A.; Moss, D.J. RF Photonics: An Optical Microcombs’ Perspective. IEEE J. Sel. Top. Quantum Electron. 2018, 24, 1–20. [Google Scholar] [CrossRef]
- Hu, J.; He, J.; Liu, J.; Raja, A.S.; Karpov, M.; Lukashchuk, A.; Kippenberg, T.J.; Brès, C.-S. Reconfigurable radiofrequency filters based on versatile soliton microcombs. Nat. Commun. 2020, 11, 1–9. [Google Scholar] [CrossRef]
- Capmany, J.; Novak, D. Microwave photonics combines two worlds. Nat. Photon- 2007, 1, 319–330. [Google Scholar] [CrossRef]
- Marpaung, D.; Yao, J.; Capmany, J. Integrated microwave photonics. Nat. Photonics 2019, 13, 80–90. [Google Scholar] [CrossRef]
- Mansoori, S.; Mitchell, A. RF Transversal Filter Using an AOTF. IEEE Photon-Technol. Lett. 2004, 16, 879–881. [Google Scholar] [CrossRef]
- Zhang, J.; Yao, J. Photonic True-Time Delay Beamforming Using a Switch-Controlled Wavelength-Dependent Recirculating Loop. J. Light. Technol. 2016, 34, 3923–3929. [Google Scholar] [CrossRef]
- Zhang, L.; Li, M.; Shi, N.; Zhu, X.; Sun, S.; Tang, J.; Li, W.; Zhu, N. Photonic true time delay beamforming technique with ultra-fast beam scanning. Opt. Express 2017, 25, 14524–14532. [Google Scholar] [CrossRef] [PubMed]
- Yu, G.; Zhang, W.; Williams, J. High-performance microwave transversal filter using fiber Bragg grating arrays. IEEE Photon-Technol. Lett. 2000, 12, 1183–1185. [Google Scholar] [CrossRef]
- Hunter, D.; Minasian, R.; Krug, P. Tunable optical transversal filter based on chirped gratings. Electron. Lett. 1995, 31, 2205–2207. [Google Scholar] [CrossRef]
- Liu, Y.; Yao, J.; Yang, J. Wideband true-time-delay unit for phased array beamforming using discrete-chirped fiber grating prism. Opt. Commun. 2002, 207, 177–187. [Google Scholar] [CrossRef]
- Sun, Y.; Wu, J.; Tan, M.; Xu, X.; Li, Y.; Morandotti, R.; Mitchell, A.; Moss, D.J. Applications of optical microcombs. Adv. Opt. Photon- 2023, 15, 86–175. [Google Scholar] [CrossRef]
- Shu, H.; Chang, L.; Tao, Y.; Shen, B.; Xie, W.; Jin, M.; Netherton, A.; Tao, Z.; Zhang, X.; Chen, R.; et al. Microcomb-driven silicon photonic systems. Nature 2022, 605, 457–463. [Google Scholar] [CrossRef] [PubMed]
- Moss, D.; Morandotti, R.; Gaeta, A.L.; Lipson, M. New CMOS-compatible platforms based on silicon nitride and Hydex for nonlinear optics. Nat. Photonics 2013, 7, 597–607. [Google Scholar] [CrossRef]
- Pasquazi, A.; Peccianti, M.; Razzari, L.; Moss, D.J.; Coen, S.; Erkintalo, M.; Chembo, Y.K.; Hansson, T.; Wabnitz, S.; Del’haye, P.; et al. Micro-combs: A novel generation of optical sources. Phys. Rep. 2017, 729, 1–81. [Google Scholar] [CrossRef]
- Gaeta, A.L.; Lipson, M.; Kippenberg, T.J. Photonic-chip-based frequency combs. Nat. Photon- 2019, 13, 158–169. [Google Scholar] [CrossRef]
- Supradeepa, V.R.; Long, C.M.; Wu, R.; Ferdous, F.; Hamidi, E.; Leaird, D.E.; Weiner, A.M. Comb-based radiofrequency photonic filters with rapid tunability and high selectivity. Nat. Photon- 2012, 6, 186–194. [Google Scholar] [CrossRef]
- Hamidi, E.; Leaird, D.E.; Weiner, A.M. Tunable Programmable Microwave Photonic Filters Based on an Optical Frequency Comb. IEEE Trans. Microw. Theory Tech. 2010, 58, 3269–3278. [Google Scholar] [CrossRef]
- Metcalf, A.J.; Kim, H.J.; Leaird, D.E.; Villegas, J.A.J.; McKinzie, K.A.; Lal, V.; Hosseini, A.; Hoefler, G.E.; Kish, F.; Weiner, A.M. Integrated line-by-line optical pulse shaper for high-fidelity and rapidly reconfigurable RF-filtering. Opt. Express 2016, 24, 23925–23940. [Google Scholar] [CrossRef] [PubMed]
- Jones, D.J.; Diddams, S.A.; Ranka, J.K.; Stentz, A.; Windeler, R.S.; Hall, J.L.; Cundiff, S.T. Carrier-Envelope Phase Control of Femtosecond Mode-Locked Lasers and Direct Optical Frequency Synthesis. Science 2000, 288, 635–639. [Google Scholar] [CrossRef] [PubMed]
- Kim, J.; Song, Y. Ultralow-noise mode-locked fiber lasers and frequency combs: principles, status, and applications. Adv. Opt. Photonics 2016, 8, 465–540. [Google Scholar] [CrossRef]
- Xu, X.; Wu, J.; Shoeiby, M.; Nguyen, T.G.; Chu, S.T.; Little, B.E.; Morandotti, R.; Mitchell, A.; Moss, D.J. Reconfigurable broadband microwave photonic intensity differentiator based on an integrated optical frequency comb source. APL Photon- 2017, 2. [Google Scholar] [CrossRef]
- Nguyen, T.G.; Shoeiby, M.; Chu, S.T.; Little, B.E.; Morandotti, R.; Mitchell, A.; Moss, D.J. Integrated frequency comb source based Hilbert transformer for wideband microwave photonic phase analysis. Opt. Express 2015, 23, 22087–22097. [Google Scholar] [CrossRef] [PubMed]
- Tan, M.; Mitchell, A.; Moss, D.J.; Xu, X.; Corcoran, B.; Wu, J.; Boes, A.; Nguyen, T.G.; Chu, S.T.; Little, B.E.; et al. Microwave and RF Photonic Fractional Hilbert Transformer Based on a 50 GHz Kerr Micro-Comb. J. Light. Technol. 2019, 37, 6097–6104. [Google Scholar] [CrossRef]
- Tan, M.; Xu, X.; Boes, A.; Corcoran, B.; Wu, J.; Nguyen, T.G.; Chu, S.T.; Little, B.E.; Morandotti, R.; Mitchell, A.; et al. Photonic RF Arbitrary Waveform Generator Based on a Soliton Crystal Micro-Comb Source. J. Light. Technol. 2020, 38, 6221–6226. [Google Scholar] [CrossRef]
- Wang, B.; Yang, Z.; Sun, S.; Yi, X. Radio-frequency line-by-line Fourier synthesis based on optical soliton microcombs. Photon-Res. 2022, 10, 932–938. [Google Scholar] [CrossRef]
- Xu, X.; Tan, M.; Wu, J.; Nguyen, T.G.; Chu, S.T.; Little, B.E.; Morandotti, R.; Mitchell, A.; Moss, D.J. Advanced Adaptive Photonic RF Filters with 80 Taps Based on an Integrated Optical Micro-Comb Source. J. Light. Technol. 2019, 37, 1288–1295. [Google Scholar] [CrossRef]
- Tan, M.; Xu, X.; Boes, A.; Bill, C.; Thach, G.N.; Sai, T.C.; Brent, E.L.; Morandotti, R.; Jiayang, W.; Mitchell, A.; David, M. Photonic signal processor for real-time video image processing at 17 Tb/s based on a Kerr microcomb. Nat. Commun. Eng. 2023, 2. [Google Scholar]
- Feldmann, J.; Youngblood, N.; Karpov, M.; Gehring, H.; Li, X.; Stappers, M.; Le Gallo, M.; Fu, X.; Lukashchuk, A.; Raja, A.S.; et al. Parallel convolutional processing using an integrated photonic tensor core. Nature 2021, 589, 52–58. [Google Scholar] [CrossRef] [PubMed]
- Bai, B.; Yang, Q.; Shu, H.; Chang, L.; Yang, F.; Shen, B.; Tao, Z.; Wang, J.; Xu, S.; Xie, W.; et al. Microcomb-based integrated photonic processing unit. Nat. Commun. 2023, 14, 1–10. [Google Scholar] [CrossRef]
- Sun, Y.; Wu, J.; Li, Y.; Tan, M.; Xu, X.; Chu, S.T.; Little, B.E.; Morandotti, R.; Mitchell, A.; Moss, D.J. Quantifying the Accuracy of Microcomb-Based Photonic RF Transversal Signal Processors. IEEE J. Sel. Top. Quantum Electron. 2023, 29, 1–17. [Google Scholar] [CrossRef]
- Sun, Y.; Wu, J.; Li, Y.; Xu, X.; Ren, G.; Tan, M.; Chu, S.T.; Little, B.E.; Morandotti, R.; Mitchell, A.; Moss, D.J. Optimizing the performance of microcomb based microwave photonic transversal signal processors. J. Light. Technol. 2023, 41. [Google Scholar] [CrossRef]
- Li, Y.; Sun, Y.; Wu, J.; Ren, G.; Morandotti, R.; Tan, M.; Xu, X.; Mitchell, A.; Moss, D.J. Performance analysis of microwave photonic spectral filters based on optical microcombs. Optics and Lasers in Engineering, vol. in press, 2023.
- J. H. Cafarella, "Programmable Transversal Filters: Applications and Capabilities." pp. 31-42.
- Chandra, A.; Chattopadhyay, S. Design of hardware efficient FIR filter: A review of the state-of-the-art approaches. Eng. Sci. Technol. Int. J. 2016, 19, 212–226. [Google Scholar] [CrossRef]
- Dwivedi, A.K.; Ghosh, S.; Londhe, N.D. Review and Analysis of Evolutionary Optimization-Based Techniques for FIR Filter Design. Circuits, Syst. Signal Process. 2018, 37, 4409–4430. [Google Scholar] [CrossRef]
- Wu, J.Y.; Xu, X.Y.; Nguyen, T.G.; Chu, S.T.; Little, B.E.; Morandotti, R.; Mitchell, A.; Moss, D.J. RF Photonics: An Optical Microcombs' Perspective. Ieee J. Sel. Top. Quantum Electron. 2018, 24, 20. [Google Scholar] [CrossRef]
- Xu, X.; Tan, M.; Wu, J.; Morandotti, R.; Mitchell, A.; Moss, D.J. Microcomb-Based Photonic RF Signal Processing. IEEE Photon-Technol. Lett. 2019, 31, 1854–1857. [Google Scholar] [CrossRef]
- Miao, J.; Zhang, F. Recent progress on highly sensitive perovskite photodetectors. J. Mater. Chem. C 2019, 7, 1741–1791. [Google Scholar] [CrossRef]
- Razzari, L.; Duchesne, D.; Ferrera, M.; Morandotti, R.; Chu, S.; Little, B.E.; Moss, D.J. CMOS-compatible integrated optical hyper-parametric oscillator. Nat. Photon- 2009, 4, 41–45. [Google Scholar] [CrossRef]
- Corcoran, B.; Tan, M.; Xu, X.; Boes, A.; Wu, J.; Nguyen, T.G.; Chu, S.T.; Little, B.E.; Morandotti, R.; Mitchell, A.; et al. Ultra-dense optical data transmission over standard fibre with a single chip source. Nat. Commun. 2020, 11, 1–7. [Google Scholar] [CrossRef] [PubMed]
- Del, P.; Schliesser, A.; Arcizet, O.; Wilken, T.; Holzwarth, R.; Kippenberg, T.J. Optical frequency comb generation from a monolithic microresonator. Nature 2007, 450, 1214–1217. [Google Scholar]
- Herr, T.; Brasch, V.; Jost, J.D.; Wang, C.Y.; Kondratiev, N.M.; Gorodetsky, M.L.; Kippenberg, T.J. Temporal solitons in optical microresonators. Nat. Photon- 2013, 8, 145–152. [Google Scholar] [CrossRef]
- Karpov, M.; Guo, H.; Kordts, A.; Brasch, V.; Pfeiffer, M.H.P.; Zervas, M.; Geiselmann, M.; Kippenberg, T.J. Raman Self-Frequency Shift of Dissipative Kerr Solitons in an Optical Microresonator. Phys. Rev. Lett. 2016, 116, 103902–103902. [Google Scholar] [CrossRef] [PubMed]
- Gong, Z.; Bruch, A.; Shen, M.; Guo, X.; Jung, H.; Fan, L.; Liu, X.; Zhang, L.; Wang, J.; Li, J.; et al. High-fidelity cavity soliton generation in crystalline AlN micro-ring resonators. Opt. Lett. 2018, 43, 4366–4369. [Google Scholar] [CrossRef]
- Guo, H.; Karpov, M.; Lucas, E.; Kordts, A.; Pfeiffer, M.H.; Brasch, V.; Lihachev, G.; Lobanov, V.E.; Gorodetsky, M.L.; Kippenberg, T.J. Universal dynamics and deterministic switching of dissipative Kerr solitons in optical microresonators. Nat. Phys. 2017, 13, 94–102. [Google Scholar] [CrossRef]
- Strekalov, D.V.; Yu, N. Generation of optical combs in a whispering gallery mode resonator from a bichromatic pump. Phys. Rev. A 2009, 79, 041805. [Google Scholar] [CrossRef]
- Hansson, T.; Wabnitz, S. Bichromatically pumped microresonator frequency combs. Phys. Rev. A 2014, 90, 013811. [Google Scholar] [CrossRef]
- Wang, W.; Chu, S.T.; Little, B.E.; Pasquazi, A.; Wang, Y.; Wang, L.; Zhang, W.; Wang, L.; Hu, X.; Wang, G.; et al. Dual-pump Kerr Micro-cavity Optical Frequency Comb with varying FSR spacing. Sci. Rep. 2016, 6, 28501. [Google Scholar] [CrossRef] [PubMed]
- Del’haye, P.; Papp, S.B.; Diddams, S.A. Hybrid Electro-Optically Modulated Microcombs. Phys. Rev. Lett. 2012, 109, 263901. [Google Scholar] [CrossRef] [PubMed]
- Papp, S.B.; Del’haye, P.; Diddams, S.A. Parametric seeding of a microresonator optical frequency comb. Opt. Express 2013, 21, 17615–17624. [Google Scholar] [CrossRef]
- Papp, S.B.; Beha, K.; Del’haye, P.; Quinlan, F.; Lee, H.; Vahala, K.J.; Diddams, S.A. Microresonator frequency comb optical clock. Optica 2014, 1, 10–14. [Google Scholar] [CrossRef]
- Yi, X.; Yang, Q.-F.; Yang, K.Y.; Suh, M.-G.; Vahala, K. Soliton frequency comb at microwave rates in a high-Q silica microresonator. Optica 2015, 2. [Google Scholar] [CrossRef]
- Brasch, V.; Geiselmann, M.; Pfeiffer, M.H.P.; Kippenberg, T.J. Bringing short-lived dissipative Kerr soliton states in microresonators into a steady state. Opt. Express 2016, 24, 29312–29320. [Google Scholar] [CrossRef] [PubMed]
- Brasch, V.; Geiselmann, M.; Herr, T.; Lihachev, G.; Pfeiffer, M.H.P.; Gorodetsky, M.L.; Kippenberg, T.J. Photonic chip-based optical frequency comb using soliton Cherenkov radiation. Science 2016, 351, 357–360. [Google Scholar] [CrossRef] [PubMed]
- Del’haye, P.; Beha, K.; Papp, S.B.; Diddams, S.A. Self-Injection Locking and Phase-Locked States in Microresonator-Based Optical Frequency Combs. Phys. Rev. Lett. 2014, 112, 043905. [Google Scholar] [CrossRef]
- Liang, W.; Savchenkov, A.A.; Xie, Z.; McMillan, J.F.; Burkhart, J.; Ilchenko, V.S.; Wong, C.W.; Matsko, A.B.; Maleki, L. Miniature multioctave light source based on a monolithic microcavity. Optica 2015, 2. [Google Scholar] [CrossRef]
- Liang, W.; Eliyahu, D.; Ilchenko, V.S.; Savchenkov, A.A.; Matsko, A.B.; Seidel, D.; Maleki, L. High spectral purity Kerr frequency comb radio frequency photonic oscillator. Nat. Commun. 2015, 6, 7957. [Google Scholar] [CrossRef]
- Bao, H.; Cooper, A.; Rowley, M.; Di Lauro, L.; Gongora, J.S.T.; Chu, S.T.; Little, B.E.; Oppo, G.-L.; Morandotti, R.; Moss, D.J.; et al. Laser cavity-soliton microcombs. Nat. Photon- 2019, 13, 384–389. [Google Scholar] [CrossRef]
- Peccianti, M.; Pasquazi, A.; Park, Y.; Little, B.; Chu, S.; Moss, D.; Morandotti, R. Demonstration of a stable ultrafast laser based on a nonlinear microcavity. Nat. Commun. 2012, 3, 765. [Google Scholar] [CrossRef] [PubMed]
- Rowley, M.; Hanzard, P.-H.; Cutrona, A.; Bao, H.; Chu, S.T.; Little, B.E.; Morandotti, R.; Moss, D.J.; Oppo, G.-L.; Gongora, J.S.T.; et al. Self-emergence of robust solitons in a microcavity. Nature 2022, 608, 303–309. [Google Scholar] [CrossRef] [PubMed]
- Xue, X.; Xuan, Y.; Liu, Y.; Wang, P.-H.; Chen, S.; Wang, J.; Leaird, D.E.; Qi, M.; Weiner, A.M. Mode-locked dark pulse Kerr combs in normal-dispersion microresonators. Nat. Photonics 2015, 9, 594. [Google Scholar] [CrossRef]
- Xue, X.; Xuan, Y.; Wang, P.; Liu, Y.; Leaird, D.E.; Qi, M.; Weiner, A.M. Normal-dispersion microcombs enabled by controllable mode interactions. Laser Photon-Rev. 2015, 9, L23–L28. [Google Scholar] [CrossRef]
- Joshi, C.; Jang, J.K.; Luke, K.; Ji, X.; Miller, S.A.; Klenner, A.; Okawachi, Y.; Lipson, M.; Gaeta, A.L. Thermally controlled comb generation and soliton modelocking in microresonators. Opt. Lett. 2016, 41, 2565–2568. [Google Scholar] [CrossRef] [PubMed]
- Del'Haye, P.; Coillet, A.; Fortier, T.; Beha, K.; Cole, D.C.; Yang, K.Y.; Lee, H.; Vahala, K.J.; Papp, S.B.; Diddams, S.A. Phase-coherent microwave-to-optical link with a self-referenced microcomb. Nat. Photon- 2016, 10, 516–520. [Google Scholar] [CrossRef]
- Brasch, V.; Lucas, E.; Jost, J.D.; Geiselmann, M.; Kippenberg, T.J. Self-referenced photonic chip soliton Kerr frequency comb. Light. Sci. Appl. 2016, 6, e16202–e16202. [Google Scholar] [CrossRef] [PubMed]
- Liu, X.; Gong, Z.; Bruch, A.W.; Surya, J.B.; Lu, J.; Tang, H.X. Aluminum nitride nanophotonics for beyond-octave soliton microcomb generation and self-referencing. Nat. Commun. 2021, 12, 1–7. [Google Scholar] [CrossRef]
- Moille, G.; Chang, L.; Xie, W.; Rao, A.; Lu, X.; Davanço, M.; Bowers, J.E.; Srinivasan, K. Dissipative Kerr Solitons in a III-V Microresonator. Laser Photon-Rev. 2020, 14, 2000022. [Google Scholar] [CrossRef]
- Liu, J.; Tian, H.; Lucas, E.; Raja, A.S.; Lihachev, G.; Wang, R.N.; He, J.; Liu, T.; Anderson, M.H.; Weng, W.; Bhave, S.A.; Kippenberg, T.J. Monolithic piezoelectric control of soliton microcombs. Nature 2020, 583, 385–390. [Google Scholar] [CrossRef] [PubMed]
- Shen, B.; Chang, L.; Liu, J.; Wang, H.; Yang, Q.-F.; Xiang, C.; Wang, R.N.; He, J.; Liu, T.; Xie, W.; et al. Integrated turnkey soliton microcombs. Nature 2020, 582, 365–369. [Google Scholar] [CrossRef]
- Smith, G.; Novak, D.; Ahmed, Z. Overcoming chromatic-dispersion effects in fiber-wireless systems incorporating external modulators. IEEE Trans. Microw. Theory Tech. 1997, 45, 1410–1415. [Google Scholar] [CrossRef]
- Li, G. Recent advances in coherent optical communication. Adv. Opt. Photon- 2009, 1, 279–307. [Google Scholar] [CrossRef]
- Xu, X.; Ren, G.; Feleppa, T.; Liu, X.; Boes, A.; Mitchell, A.; Lowery, A.J. Self-calibrating programmable photonic integrated circuits. Nat. Photon- 2022, 16, 595–602. [Google Scholar] [CrossRef]
- Xu, X.; Ren, G.; Dubey, A.; Feleppa, T.; Liu, X.; Boes, A.; Mitchell, A.; Lowery, A.J. Phase retrieval of programmable photonic integrated circuits based on an on-chip fractional-delay reference path. Optica 2022, 9, 1401–1407. [Google Scholar] [CrossRef]
- Bai, B.; Yang, Q.; Shu, H.; Chang, L.; Yang, F.; Shen, B.; Tao, Z.; Wang, J.; Xu, S.; Xie, W.; et al. Microcomb-based integrated photonic processing unit. Nat. Commun. 2023, 14, 1–10. [Google Scholar] [CrossRef] [PubMed]
- Bao, C.; Xuan, Y.; Jaramillo-Villegas, J.A.; Leaird, D.E.; Qi, M.; Weiner, A.M. Direct soliton generation in microresonators. Opt. Lett. 2017, 42, 2519–2522. [Google Scholar] [CrossRef] [PubMed]
- Ferrera, M.; et al. CMOS compatible integrated all-optical RF spectrum analyzer. Opt. Express 2014, 22, 21488–21498. [Google Scholar] [CrossRef]
- Kues, M.; Reimer, C.; Wetzel, B.; Roztocki, P.; Little, B.E.; Chu, S.T.; Hansson, T.; Viktorov, E.A.; Moss, D.J.; Morandotti, R. Passively mode-locked laser with an ultra-narrow spectral width. Nat. Photon- 2017, 11, 159–162. [Google Scholar] [CrossRef]
- Razzari, L.; Duchesne, D.; Ferrera, M.; Morandotti, R.; Chu, S.; Little, B.E.; Moss, D.J. CMOS-compatible integrated optical hyper-parametric oscillator. Nat. Photon- 2009, 4, 41–45. [Google Scholar] [CrossRef]
- Ferrera, M.; Razzari, L.; Duchesne, D.; Morandotti, R.; Yang, Z.; Liscidini, M.; Sipe, J.E.; Chu, S.; Little, B.E.; Moss, D.J. Low-power continuous-wave nonlinear optics in doped silica glass integrated waveguide structures. Nat. Photon- 2008, 2, 737–740. [Google Scholar] [CrossRef]
- Ferrera, M.; et al. On-Chip ultra-fast 1st and 2nd order CMOS compatible all-optical integration. Opt. Express 2011, 19, 23153–23161. [Google Scholar] [CrossRef] [PubMed]
- Duchesne, D.; Peccianti, M.; Lamont, M.R.E.; Ferrera, M.; Razzari, L.; Légaré, F.; Morandotti, R.; Chu, S.; Little, B.E.; Moss, D.J. Supercontinuum generation in a high index doped silica glass spiral waveguide. Opt. Express 2010, 18, 923–930. [Google Scholar] [CrossRef] [PubMed]
- Bao, H.; Olivieri, L.; Rowley, M.; Chu, S.T.; Little, B.E.; Morandotti, R.; Moss, D.J.; Gongora, J.S.T.; Peccianti, M.; Pasquazi, A. Turing patterns in a fiber laser with a nested microresonator: Robust and controllable microcomb generation. Phys. Rev. Res. 2020, 2, 023395. [Google Scholar] [CrossRef]
- Ferrera, M.; Park, Y.; Razzari, L.; Little, B.E.; Chu, S.T.; Morandotti, R.; Moss, D.J.; Azaña, J. On-chip CMOS-compatible all-optical integrator. Nat. Commun. 2010, 1, 29–5. [Google Scholar] [CrossRef]
- Pasquazi, A.; et al. All-optical wavelength conversion in an integrated ring resonator. Opt. Express 2010, 18, 3858–3863. [Google Scholar] [CrossRef] [PubMed]
- Pasquazi, A.; Park, Y.; Azana, J.; et al. Efficient wavelength conversion and net parametric gain via Four Wave Mixing in a high index doped silica waveguide. Opt. Express 2010, 18, 7634–7641. [Google Scholar] [CrossRef]
- Peccianti, M.; Ferrera, M.; Razzari, L.; Morandotti, R.; Little, B.E.; Chu, S.T.; Moss, D.J. Subpicosecond optical pulse compression via an integrated nonlinear chirper. Opt. Express 2010, 18, 7625–7633. [Google Scholar] [CrossRef]
- Little, B.; Chu, S.; Absil, P.; Hryniewicz, J.; Johnson, F.; Seiferth, F.; Gill, D.; Van, V.; King, O.; Trakalo, M. Very High-Order Microring Resonator Filters for WDM Applications. IEEE Photon-Technol. Lett. 2004, 16, 2263–2265. [Google Scholar] [CrossRef]
- Ferrera, M.; et al. Low Power CW Parametric Mixing in a Low Dispersion High Index Doped Silica Glass Micro-Ring Resonator with Q-factor > 1 Million. Opt. Express 2009, 17, 14098–14103. [Google Scholar] [CrossRef] [PubMed]
- Peccianti, M.; et al. Demonstration of an ultrafast nonlinear microcavity modelocked laser. Nat. Commun. 2012, 3, 765. [Google Scholar] [CrossRef] [PubMed]
- Pasquazi, A.; et al. Self-locked optical parametric oscillation in a CMOS compatible microring resonator: a route to robust optical frequency comb generation on a chip. Opt. Express 2013, 21, 13333–13341. [Google Scholar] [CrossRef]
- Pasquazi, A.; et al. Stable, dual mode, high repetition rate mode-locked laser based on a microring resonator. Opt. Express 2012, 20, 27355–27362. [Google Scholar] [CrossRef] [PubMed]
- Pasquazi, A.; Peccianti, M.; Razzari, L.; Moss, D.J.; Coen, S.; Erkintalo, M.; Chembo, Y.K.; Hansson, T.; Wabnitz, S.; Del’haye, P.; et al. Micro-combs: A novel generation of optical sources. Phys. Rep. 2017, 729, 1–81. [Google Scholar] [CrossRef]
- Moss, D.; Morandotti, R.; Gaeta, A.L.; Lipson, M. New CMOS-compatible platforms based on silicon nitride and Hydex for nonlinear optics. Nat. Photonics 2013, 7, 597–607. [Google Scholar] [CrossRef]
- Bao, H.; Cooper, A.; Rowley, M.; Di Lauro, L.; Gongora, J.S.T.; Chu, S.T.; Little, B.E.; Oppo, G.-L.; Morandotti, R.; Moss, D.J. Laser cavity-soliton microcombs. Nat. Photon. 2019, 13, 384–389. [Google Scholar] [CrossRef]
- Cutrona, A.; Rowley, M.; Das, D.; Olivieri, L.; Peters, L.; Chu, S.T.; Little, B.E.; Morandotti, R.; Moss, D.J.; Gongora, J.S.T.; et al. High parametric efficiency in laser cavity-soliton microcombs. Opt. Express 2022, 30, 39816–39825. [Google Scholar] [CrossRef] [PubMed]
- Rowley, M.; Hanzard, P.; Cutrona, A.; Bao, H.; Chu, S.; Little, B.; Morandotti, R.; Moss, D.J.; Oppo, G.; Gongora, J.; Peccianti, M.; Pasquazi, A. Self-emergence of robust solitons in a micro-cavity. Nature 2022, 608, 303–309. [Google Scholar] [CrossRef]
- Cutrona, A.; Cecconi, V.; Hanzard, P.H.; Rowley, M.; Das, D.; Cooper, A.; Peters, L.; Olivieri, L.; Wetzel, B.; Morandotti, R.; et al. Nonlocal bonding of a soliton and a blue-detuned state in a microcomb laser. Commun. Phys. 2023, 6, 1–10. [Google Scholar] [CrossRef]
- Cutrona, A.; Rowley, M.; Bendahmane, A.; Cecconi, V.; Olivieri, L.; Little, B.E.; Chu, S.T.; Stivala, S.; Morandotti, R.; Moss, D.J.; Totero-Gongora, J.S.; Peccianti, M.; Pasquazi, A. Stability Properties of Laser Cavity-Solitons for Metrological Applications. Applied Physics Letters 2023, 122, 121104. [Google Scholar] [CrossRef]
- Xu, X.; Wu, J.; Shoeiby, M.; Nguyen, T.G.; Chu, S.T.; Little, B.E.; Morandotti, R.; Mitchell, A.; Moss, D.J. Reconfigurable broadband microwave photonic intensity differentiator based on an integrated optical frequency comb source. APL Photon- 2017, 2. [Google Scholar] [CrossRef]
- Xu, X.; Wu, J.; Nguyen, T.G.; Moein, T.; Chu, S.T.; Little, B.E.; Morandotti, R.; Mitchell, A.; Moss, D.J. Photonic microwave true time delays for phased array antennas using a 49 GHz FSR integrated optical micro-comb source [Invited]. Photon-Res. 2018, 6, B30–B36. [Google Scholar] [CrossRef]
- Xu, X.; Tan, M.; Wu, J.; Morandotti, R.; Mitchell, A.; Moss, D.J. Microcomb-Based Photonic RF Signal Processing. IEEE Photon-Technol. Lett. 2019, 31, 1854–1857. [Google Scholar] [CrossRef]
- Xu; et al. Advanced adaptive photonic RF filters with 80 taps based on an integrated optical micro-comb source. J. Light. Technol. 2019, 37, 1288–1295. [Google Scholar] [CrossRef]
- Xu, X.; et al. Photonic RF and microwave integrator with soliton crystal microcombs. IEEE Trans. Circuits Syst. II Express Briefs 2020, 67, 3582–3586. [Google Scholar]
- Xu, X.; Tan, M.; Wu, J.; Nguyen, T.G.; Chu, S.T.; Little, B.E.; Morandotti, R.; Mitchell, A.; Moss, D.J. High performance RF filters via bandwidth scaling with Kerr micro-combs. APL Photon- 2019, 4, 026102. [Google Scholar] [CrossRef]
- Tan, M.; Mitchell, A.; Moss, D.J.; Xu, X.; Corcoran, B.; Wu, J.; Boes, A.; Nguyen, T.G.; Chu, S.T.; Little, B.E.; et al. Microwave and RF Photonic Fractional Hilbert Transformer Based on a 50 GHz Kerr Micro-Comb. J. Light. Technol. 2019, 37, 6097–6104. [Google Scholar] [CrossRef]
- Tan, M.; Xu, X.; Corcoran, B.; Wu, J.; Boes, A.; Nguyen, T.G.; Chu, S.T.; Little, B.E.; Morandotti, R.; Mitchell, A.; et al. RF and Microwave Fractional Differentiator Based on Photonics. IEEE Trans. Circuits Syst. II: Express Briefs 2020, 67, 2767–2771. [Google Scholar] [CrossRef]
- Tan, M.; Xu, X.; Boes, A.; Corcoran, B.; Wu, J.; Nguyen, T.G.; Chu, S.T.; Little, B.E.; Morandotti, R.; Mitchell, A.; et al. Photonic RF Arbitrary Waveform Generator Based on a Soliton Crystal Micro-Comb Source. J. Light. Technol. 2020, 38, 6221–6226. [Google Scholar] [CrossRef]
- Tan, M.; Xu, X.; Wu, J.; Morandotti, R.; Mitchell, A.; Moss, D.J. RF and microwave photonic temporal signal processing with Kerr micro-combs. Adv. Physics: X 2020, 6. [Google Scholar] [CrossRef]
- Xu, X.; Wu, J.; Nguyen, T.G.; Shoeiby, M.; Chu, S.T.; Little, B.E.; Morandotti, R.; Mitchell, A.; Moss, D.J. Advanced RF and microwave functions based on an integrated optical frequency comb source. Opt. Express 2018, 26, 2569–2583. [Google Scholar] [CrossRef] [PubMed]
- Tan, M.; Xu, X.; Boes, A.; Corcoran, B.; Wu, J.; Nguyen, T.G.; Chu, S.T.; Little, B.E.; Lowery, A.J.; Morandotti, R.; et al. Highly Versatile Broadband RF Photonic Fractional Hilbert Transformer Based on a Kerr Soliton Crystal Microcomb. J. Light. Technol. 2021, 39, 7581–7587. [Google Scholar] [CrossRef]
- Nguyen, T.G.; Shoeiby, M.; Chu, S.T.; Little, B.E.; Morandotti, R.; Mitchell, A.; Moss, D.J. Integrated frequency comb source based Hilbert transformer for wideband microwave photonic phase analysis. Opt. Express 2015, 23, 22087–22097. [Google Scholar] [CrossRef] [PubMed]
- Xu, X.; Wu, J.; Nguyen, T.G.; Chu, S.T.; Little, B.E.; Morandotti, R.; Mitchell, A.; Moss, D.J. Broadband RF Channelizer Based on an Integrated Optical Frequency Kerr Comb Source. J. Light. Technol. 2018, 36, 4519–4526. [Google Scholar] [CrossRef]
- Xu, X.; Wu, J.; Jia, L.; Tan, M.; Nguyen, T.G.; Chu, S.T.; E Little, B.; Morandotti, R.; Mitchell, A.; Moss, D.J. Continuously tunable orthogonally polarized RF optical single sideband generator based on micro-ring resonators. J. Opt. 2018, 20, 115701. [Google Scholar] [CrossRef]
- Xu, X.; Wu, J.; Tan, M.; Nguyen, T.G.; Chu, S.T.; Little, B.E.; Morandotti, R.; Mitchell, A.; Moss, D.J. Orthogonally Polarized RF Optical Single Sideband Generation and Dual-Channel Equalization Based on an Integrated Microring Resonator. J. Light. Technol. 2018, 36, 4808–4818. [Google Scholar] [CrossRef]
- Xu, X.; Tan, M.; Wu, J.; Boes, A.; Corcoran, B.; Nguyen, T.G.; Chu, S.T.; Little, B.E.; Morandotti, R.; Mitchell, A.; et al. Photonic RF Phase-Encoded Signal Generation With a Microcomb Source. J. Light. Technol. 2020, 38, 1722–1727. [Google Scholar] [CrossRef]
- Xu, X.; Wu, J.; Tan, M.; Nguyen, T.G.; Chu, S.T.; Little, B.E.; Morandotti, R.; Mitchell, A.; Moss, D.J. Broadband Microwave Frequency Conversion Based on an Integrated Optical Micro-Comb Source. J. Light. Technol. 2019, 38, 332–338. [Google Scholar] [CrossRef]
- Tan, M.; Xu, X.; Wu, J.; Morandotti, R.; Mitchell, A.; Moss, D.J. Photonic RF and microwave filters based on 49 GHz and 200 GHz Kerr microcombs. Opt. Commun. 2020, 465, 125563. [Google Scholar] [CrossRef]
- Xu, X.; Tan, M.; Wu, J.; Boes, A.; Nguyen, T.G.; Chu, S.T.; Little, B.E.; Morandotti, R.; Mitchell, A.; Moss, D.J. Broadband Photonic RF Channelizer With 92 Channels Based on a Soliton Crystal Microcomb. J. Light. Technol. 2020, 38, 5116–5121. [Google Scholar] [CrossRef]
- Tan, M.; et al. Orthogonally polarized Photonic Radio Frequency single sideband generation with integrated micro-ring resonators. IOP J. Semicond. 2021, 42, 041305. [Google Scholar] [CrossRef]
- Tan, M.; Xu, X.; Wu, J.; Nguyen, T.G.; Chu, S.T.; Little, B.E.; Morandotti, R.; Mitchell, A.; Moss, D.J. Photonic radio frequency channelizers based on Kerr optical micro-combs. J. Semicond. 2021, 42. [Google Scholar] [CrossRef]
- Corcoran, B.; et al. Ultra-dense optical data transmission over standard fiber with a single chip source. Nat. Commun. 2020, 11, 2568. [Google Scholar] [CrossRef] [PubMed]
- Xu, X.; Tan, M.; Corcoran, B.; Wu, J.; Nguyen, T.G.; Boes, A.; Chu, S.T.; Little, B.E.; Morandotti, R.; Mitchell, A.; et al. Photonic Perceptron Based on a Kerr Microcomb for High-Speed, Scalable, Optical Neural Networks. Laser Photon-Rev. 2020, 14. [Google Scholar] [CrossRef]
- Xu, X.; Han, W.; Tan, M.; Sun, Y.; Li, Y.; Wu, J.; Morandotti, R.; Mitchell, A.; Xu, K.; Moss, D.J. Neuromorphic Computing Based on Wavelength-Division Multiplexing. IEEE J. Sel. Top. Quantum Electron. 2022, 29, 1–12. [Google Scholar] [CrossRef]
- Sun, Y.; Wu, J.; Tan, M.; Xu, X.; Li, Y.; Morandotti, R.; Mitchell, A.; Moss, D.J. Applications of optical microcombs. Adv. Opt. Photon- 2023, 15, 86–175. [Google Scholar] [CrossRef]
- Bai, Y.; Xu, X.; Tan, M.; Sun, Y.; Li, Y.; Wu, J.; Morandotti, R.; Mitchell, A.; Xu, K.; Moss, D.J. Photonic multiplexing techniques for neuromorphic computing. Nanophotonics 2022, 12, 795–817. [Google Scholar] [CrossRef]
- Prayoonyong, C.; Boes, A.; Xu, X.; Tan, M.; Chu, S.T.; Little, B.E.; Morandotti, R.; Mitchell, A.; Moss, D.J.; Corcoran, B. Frequency comb distillation for optical superchannel transmission. J. Light. Technol. 2021, 39, 1–1. [Google Scholar] [CrossRef]
- Tan, M.; Xu, X.; Wu, J.; Corcoran, B.; Boes, A.; Nguyen, T.G.; Chu, S.T.; E Little, B.; Morandotti, R.; Mitchell, A.; et al. Integral order photonic RF signal processors based on a soliton crystal micro-comb source. J. Opt. 2021, 23, 125701. [Google Scholar] [CrossRef]
- Sun, Y.; Wu, J.; Li, Y.; Xu, X.; Ren, G.; Tan, M.; Chu, S.T.; Little, B.E.; Morandotti, R.; Mitchell, A.; Moss, D.J. Performance analysis of microcomb-based microwave photonic transversal signal processors with experimental errors. J. Light. Technol. 2023, 41. [Google Scholar] [CrossRef]
- Tan, M.; Xu, X.; Boes, A.; Corcoran, B.; Nguyen, T.G.; Chu, S.T.; Little, B.E.; Morandotti, R.; Wu, J.; Mitchell, A.; Moss, D.J. Photonic signal processor for real-time video image processing at 17 Tb/s. Commun. Eng. 2023, 2. [Google Scholar] [CrossRef]
- Tan, M.; Xu, X.; Wu, J.; Morandotti, R.; Mitchell, A.; Moss, D.J. Photonic RF and microwave filters based on 49 GHz and 200 GHz Kerr microcombs. Opt. Commun. 2020, 465, 125563. [Google Scholar] [CrossRef]
- Sun, Y.; Wu, J.; Li, Y.; Tan, M.; Xu, X.; Chu, S.T.; Little, B.E.; Morandotti, R.; Mitchell, A.; Moss, D.J. Quantifying the Accuracy of Microcomb-Based Photonic RF Transversal Signal Processors. IEEE J. Sel. Top. Quantum Electron. 2023, 29, 1–17. [Google Scholar] [CrossRef]
- Zhang, Y.; Wu, J.; Yang, Y.; Qu, Y.; Jia, L.; El Dirani, H.; Kerdiles, S.; Sciancalepore, C.; Demongodin, P.; Grillet, C.; et al. Enhanced Supercontinuum Generation in Integrated Waveguides Incorporated with Graphene Oxide Films. Adv. Mater. Technol. 2023, 8. [Google Scholar] [CrossRef]
- Zhang, Y.; Wu, J.; Jia, L.; Qu, Y.; Yang, Y.; Jia, B.; Moss, D.J. Graphene Oxide for Nonlinear Integrated Photonics. Laser Photon-Rev. 2023, 17. [Google Scholar] [CrossRef]
- Wu, J.; Lin, H.; Moss, D.J.; Loh, K.P.; Jia, B. Graphene oxide for photonics, electronics and optoelectronics. Nat. Rev. Chem. 2023, 7, 162–183. [Google Scholar] [CrossRef] [PubMed]
- Qu, Y.; Yang, Y.; Wu, J.; Zhang, Y.; Jia, L.; El Dirani, H.; Crochemore, R.; Sciancalepore, C.; Demongodin, P.; Grillet, C.; et al. Photo-Thermal Tuning of Graphene Oxide Coated Integrated Optical Waveguides. Micromachines 2022, 13, 1194. [Google Scholar] [CrossRef]
- Zhang, Y.; Wu, J.; Yang, Y.; Qu, Y.; El Dirani, H.; Crochemore, R.; Sciancalepore, C.; Demongodin, P.; Grillet, C.; Monat, C.; et al. Enhanced self-phase modulation in silicon nitride waveguides integrated with 2D graphene oxide films. IEEE J. Sel. Top. Quantum Electron. 2022, PP, 1–1. [Google Scholar] [CrossRef]
- Zhang, Y.; Wu, J.; Yang, Y.; Qu, Y.; Jia, L.; Jia, B.; Moss, D.J. Enhanced Spectral Broadening of Femtosecond Optical Pulses in Silicon Nanowires Integrated with 2D Graphene Oxide Films. Micromachines 2022, 13, 756. [Google Scholar] [CrossRef]
- Jia, L.; Wu, J.; Zhang, Y.; Qu, Y.; Jia, B.; Chen, Z.; Moss, D.J. Fabrication Technologies for the On-Chip Integration of 2D Materials. Small Methods 2022, 6, 2101435. [Google Scholar] [CrossRef] [PubMed]
- Zhang, Y.; Wu, J.; Qu, Y.; Jia, L.; Jia, B.; Moss, D.J. Design and Optimization of Four-Wave Mixing in Microring Resonators Integrated With 2D Graphene Oxide Films. J. Light. Technol. 2021, 39, 6553–6562. [Google Scholar] [CrossRef]
- Zhang, Y.; Wu, J.; Qu, Y.; Jia, L.; Jia, B.; Moss, D.J. Optimizing the Kerr Nonlinear Optical Performance of Silicon Waveguides Integrated With 2D Graphene Oxide Films. J. Light. Technol. 2021, 39, 4671–4683. [Google Scholar] [CrossRef]
- Qu, Y.; Wu, J.; Zhang, Y.; Jia, L.; Liang, Y.; Jia, B.; Moss, D.J. Analysis of Four-Wave Mixing in Silicon Nitride Waveguides Integrated With 2D Layered Graphene Oxide Films. J. Light. Technol. 2021, 39, 2902–2910. [Google Scholar] [CrossRef]
- Wu, J.; Jia, L.; Zhang, Y.; Qu, Y.; Jia, B.; Moss, D.J. Graphene Oxide for Integrated Photonics and Flat Optics. Adv. Mater. 2020, 33, e2006415. [Google Scholar] [CrossRef]
- Y. Qu, J. Wu, Y. Zhang, L. Jia, Y. Yang, X. Xu, S. T. Chu, B. E. Little, R. Morandotti, B. Jia, and D. J. Moss, “Graphene oxide for enhanced optical nonlinear performance in CMOS compatible integrated devices”, Paper No. 11688-30, PW21O-OE109-36, 2D Photonic Materials and Devices IV, SPIE Photonics West, San Francisco CA March 6-11 (2021). [CrossRef]
- Qu, Y.; Wu, J.; Yang, Y.; Zhang, Y.; Liang, Y.; El Dirani, H.; Crochemore, R.; Demongodin, P.; Sciancalepore, C.; Grillet, C.; et al. Enhanced Four-Wave Mixing in Silicon Nitride Waveguides Integrated with 2D Layered Graphene Oxide Films. Adv. Opt. Mater. 2020, 8. [Google Scholar] [CrossRef]
- Zhang, Y.; Wu, J.; Yang, Y.; Qu, Y.; Jia, L.; Moein, T.; Jia, B.; Moss, D.J. Enhanced Kerr Nonlinearity and Nonlinear Figure of Merit in Silicon Nanowires Integrated with 2D Graphene Oxide Films. ACS Appl. Mater. Interfaces 2020, 12, 33094–33103. [Google Scholar] [CrossRef] [PubMed]
- Wu, J.; Yang, Y.; Qu, Y.; Jia, L.; Zhang, Y.; Xu, X.; Chu, S.T.; Little, B.E.; Morandotti, R.; Jia, B.; et al. 2D Layered Graphene Oxide Films Integrated with Micro-Ring Resonators for Enhanced Nonlinear Optics. Small 2020, 16, 1906563. [Google Scholar] [CrossRef] [PubMed]
- Jiayang Wu, Yunyi Yang, Yang Qu, Xingyuan Xu, Yao Liang, Sai T. Chu, Brent E. Little, Roberto Morandotti, Baohua Jia, and David J. Moss, “Graphene oxide waveguide polarizers and polarization selective micro-ring resonators”, Paper 11282-29, SPIE Photonics West, San Francisco, CA, 4 - 7 February (2020). [CrossRef]
- Wu, J.; Yang, Y.; Qu, Y.; Xu, X.; Liang, Y.; Chu, S.T.; Little, B.E.; Morandotti, R.; Jia, B.; Moss, D.J. Graphene Oxide Waveguide and Micro-Ring Resonator Polarizers. Laser Photon-Rev. 2019, 13, 1900056. [Google Scholar] [CrossRef]
- Yang, Y.; Wu, J.; Xu, X.; Liang, Y.; Chu, S.T.; Little, B.E.; Morandotti, R.; Jia, B.; Moss, D.J. Invited Article: Enhanced four-wave mixing in waveguides integrated with graphene oxide. APL Photon- 2018, 3, 120803. [Google Scholar] [CrossRef]
- Jia, L.; Wu, J.; Zhang, Y.; Qu, Y.; Jia, B.; Moss, D.J. Third-Order Optical Nonlinearities of 2D Materials at Telecommunications Wavelengths. Micromachines 2023, 14, 307. [Google Scholar] [CrossRef] [PubMed]
- Jia, L.; Cui, D.; Wu, J.; Feng, H.; Yang, Y.; Yang, T.; Qu, Y.; Du, Y.; Hao, W.; Jia, B.; et al. Highly nonlinear BiOBr nanoflakes for hybrid integrated photonics. APL Photon- 2019, 4, 090802. [Google Scholar] [CrossRef]
- Jia, L.; Wu, J.; Yang, T.; Jia, B.; Moss, D.J. Large Third-Order Optical Kerr Nonlinearity in Nanometer-Thick PdSe2 2D Dichalcogenide Films: Implications for Nonlinear Photonic Devices. ACS Appl. Nano Mater. 2020, 3, 6876–6883. [Google Scholar] [CrossRef]
- Ghahramani, E.D.; Moss, D.J.; Sipe, J.E. Full-band-structure calculation of first-, second-, and third-harmonic optical response coefficients of ZnSe, ZnTe, and CdTe. Phys. Rev. B 2011, 43, 9700. [Google Scholar] [CrossRef] [PubMed]
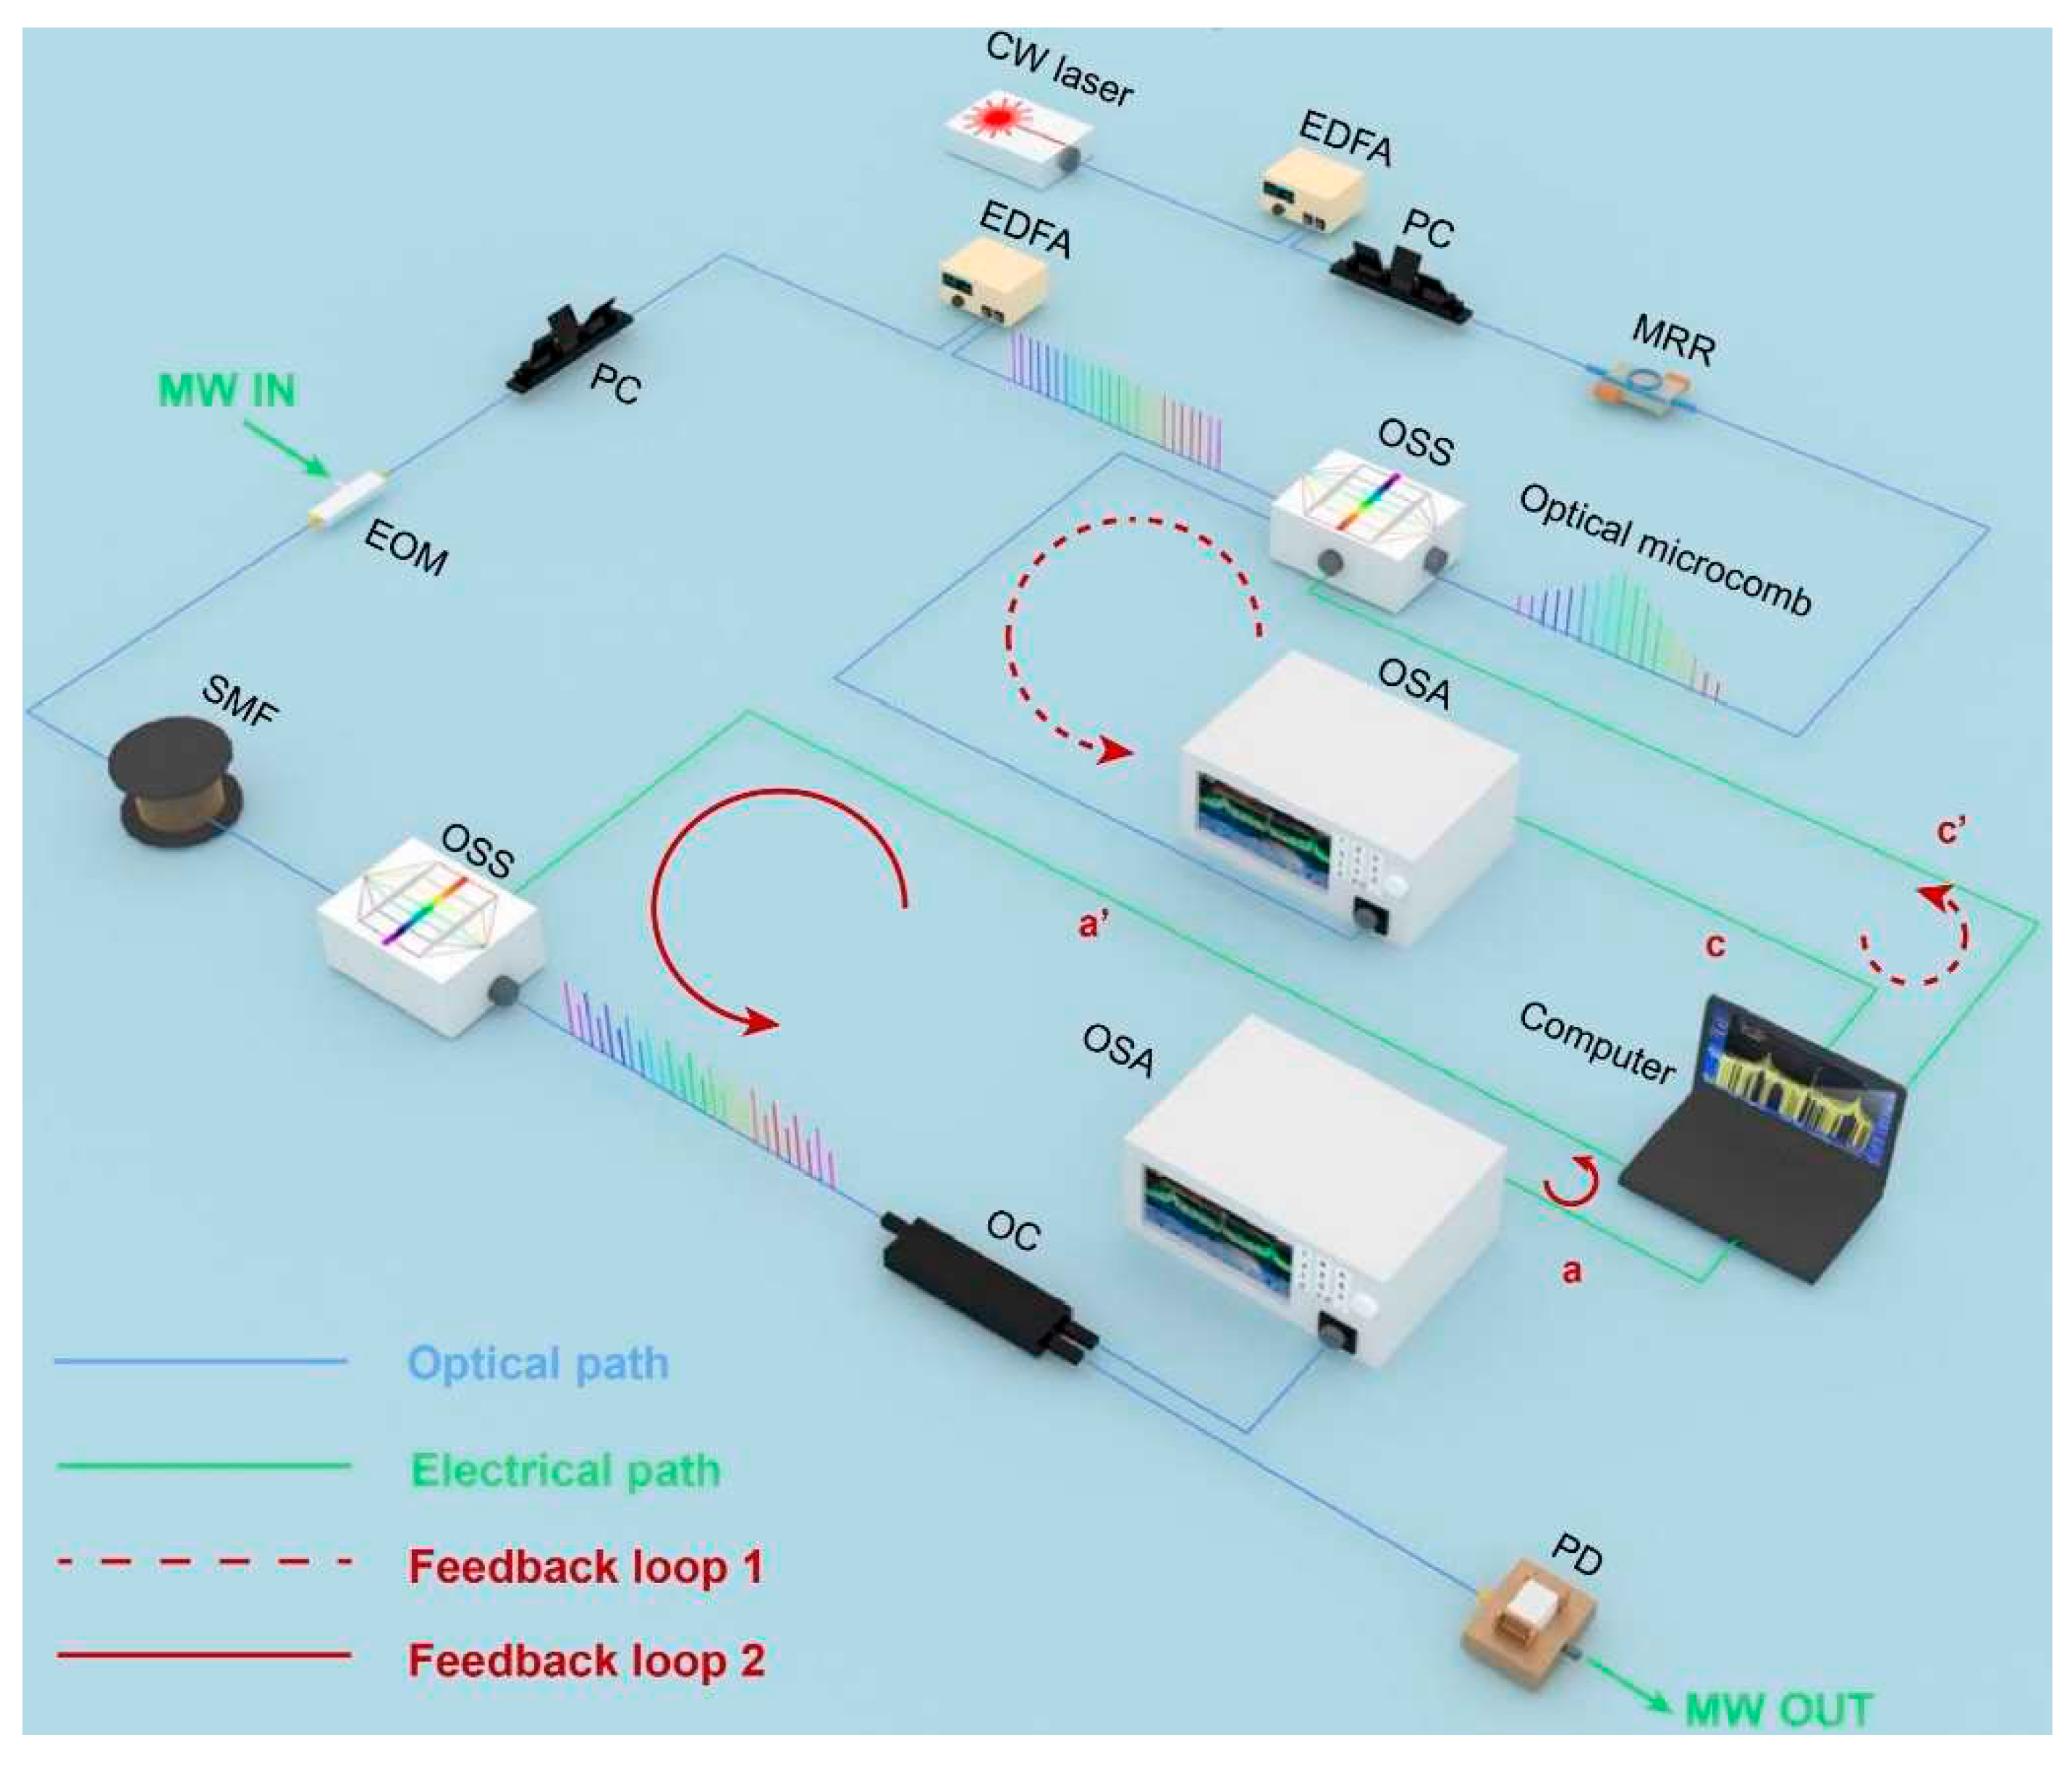
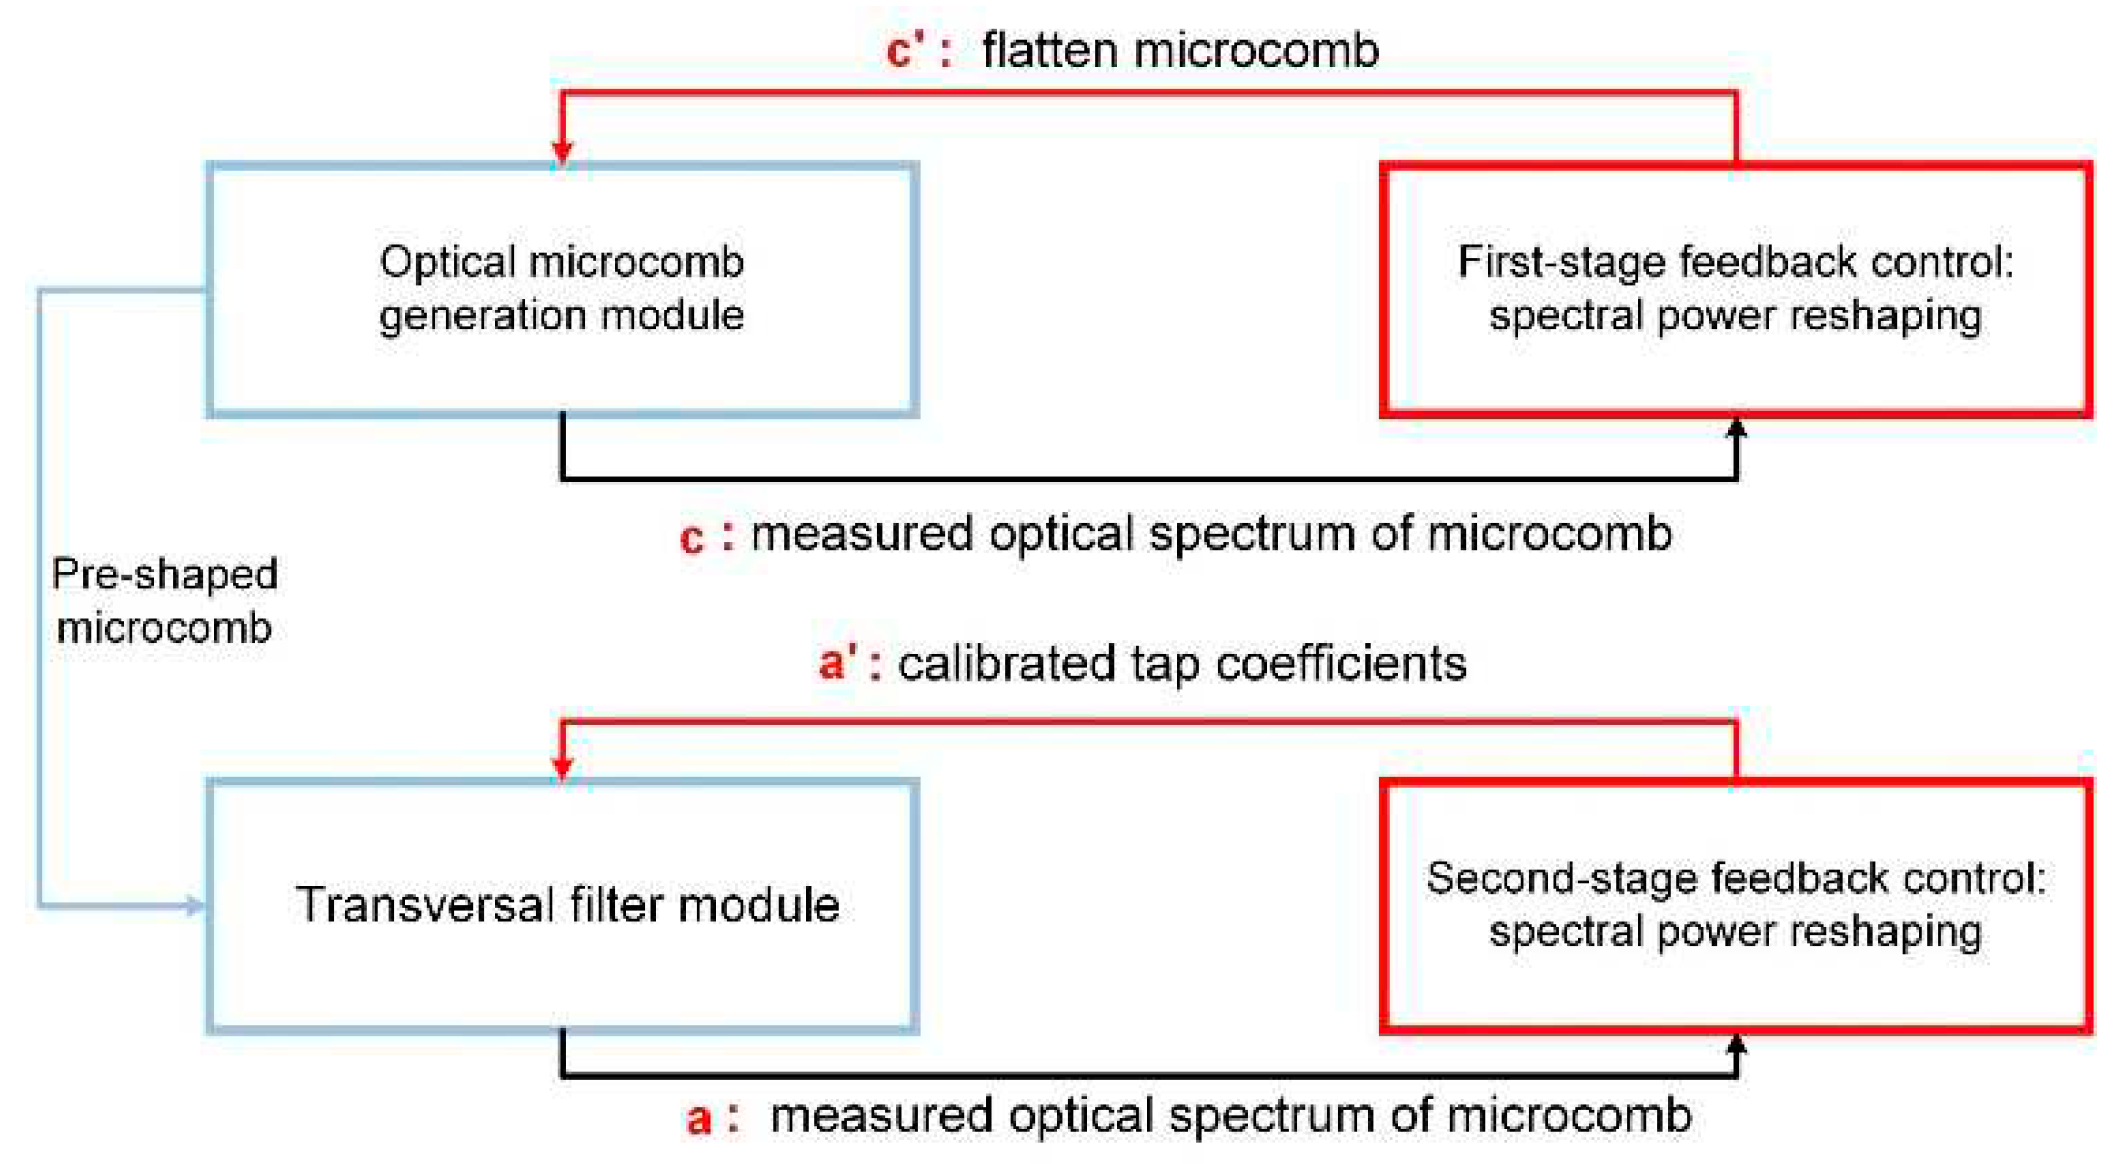
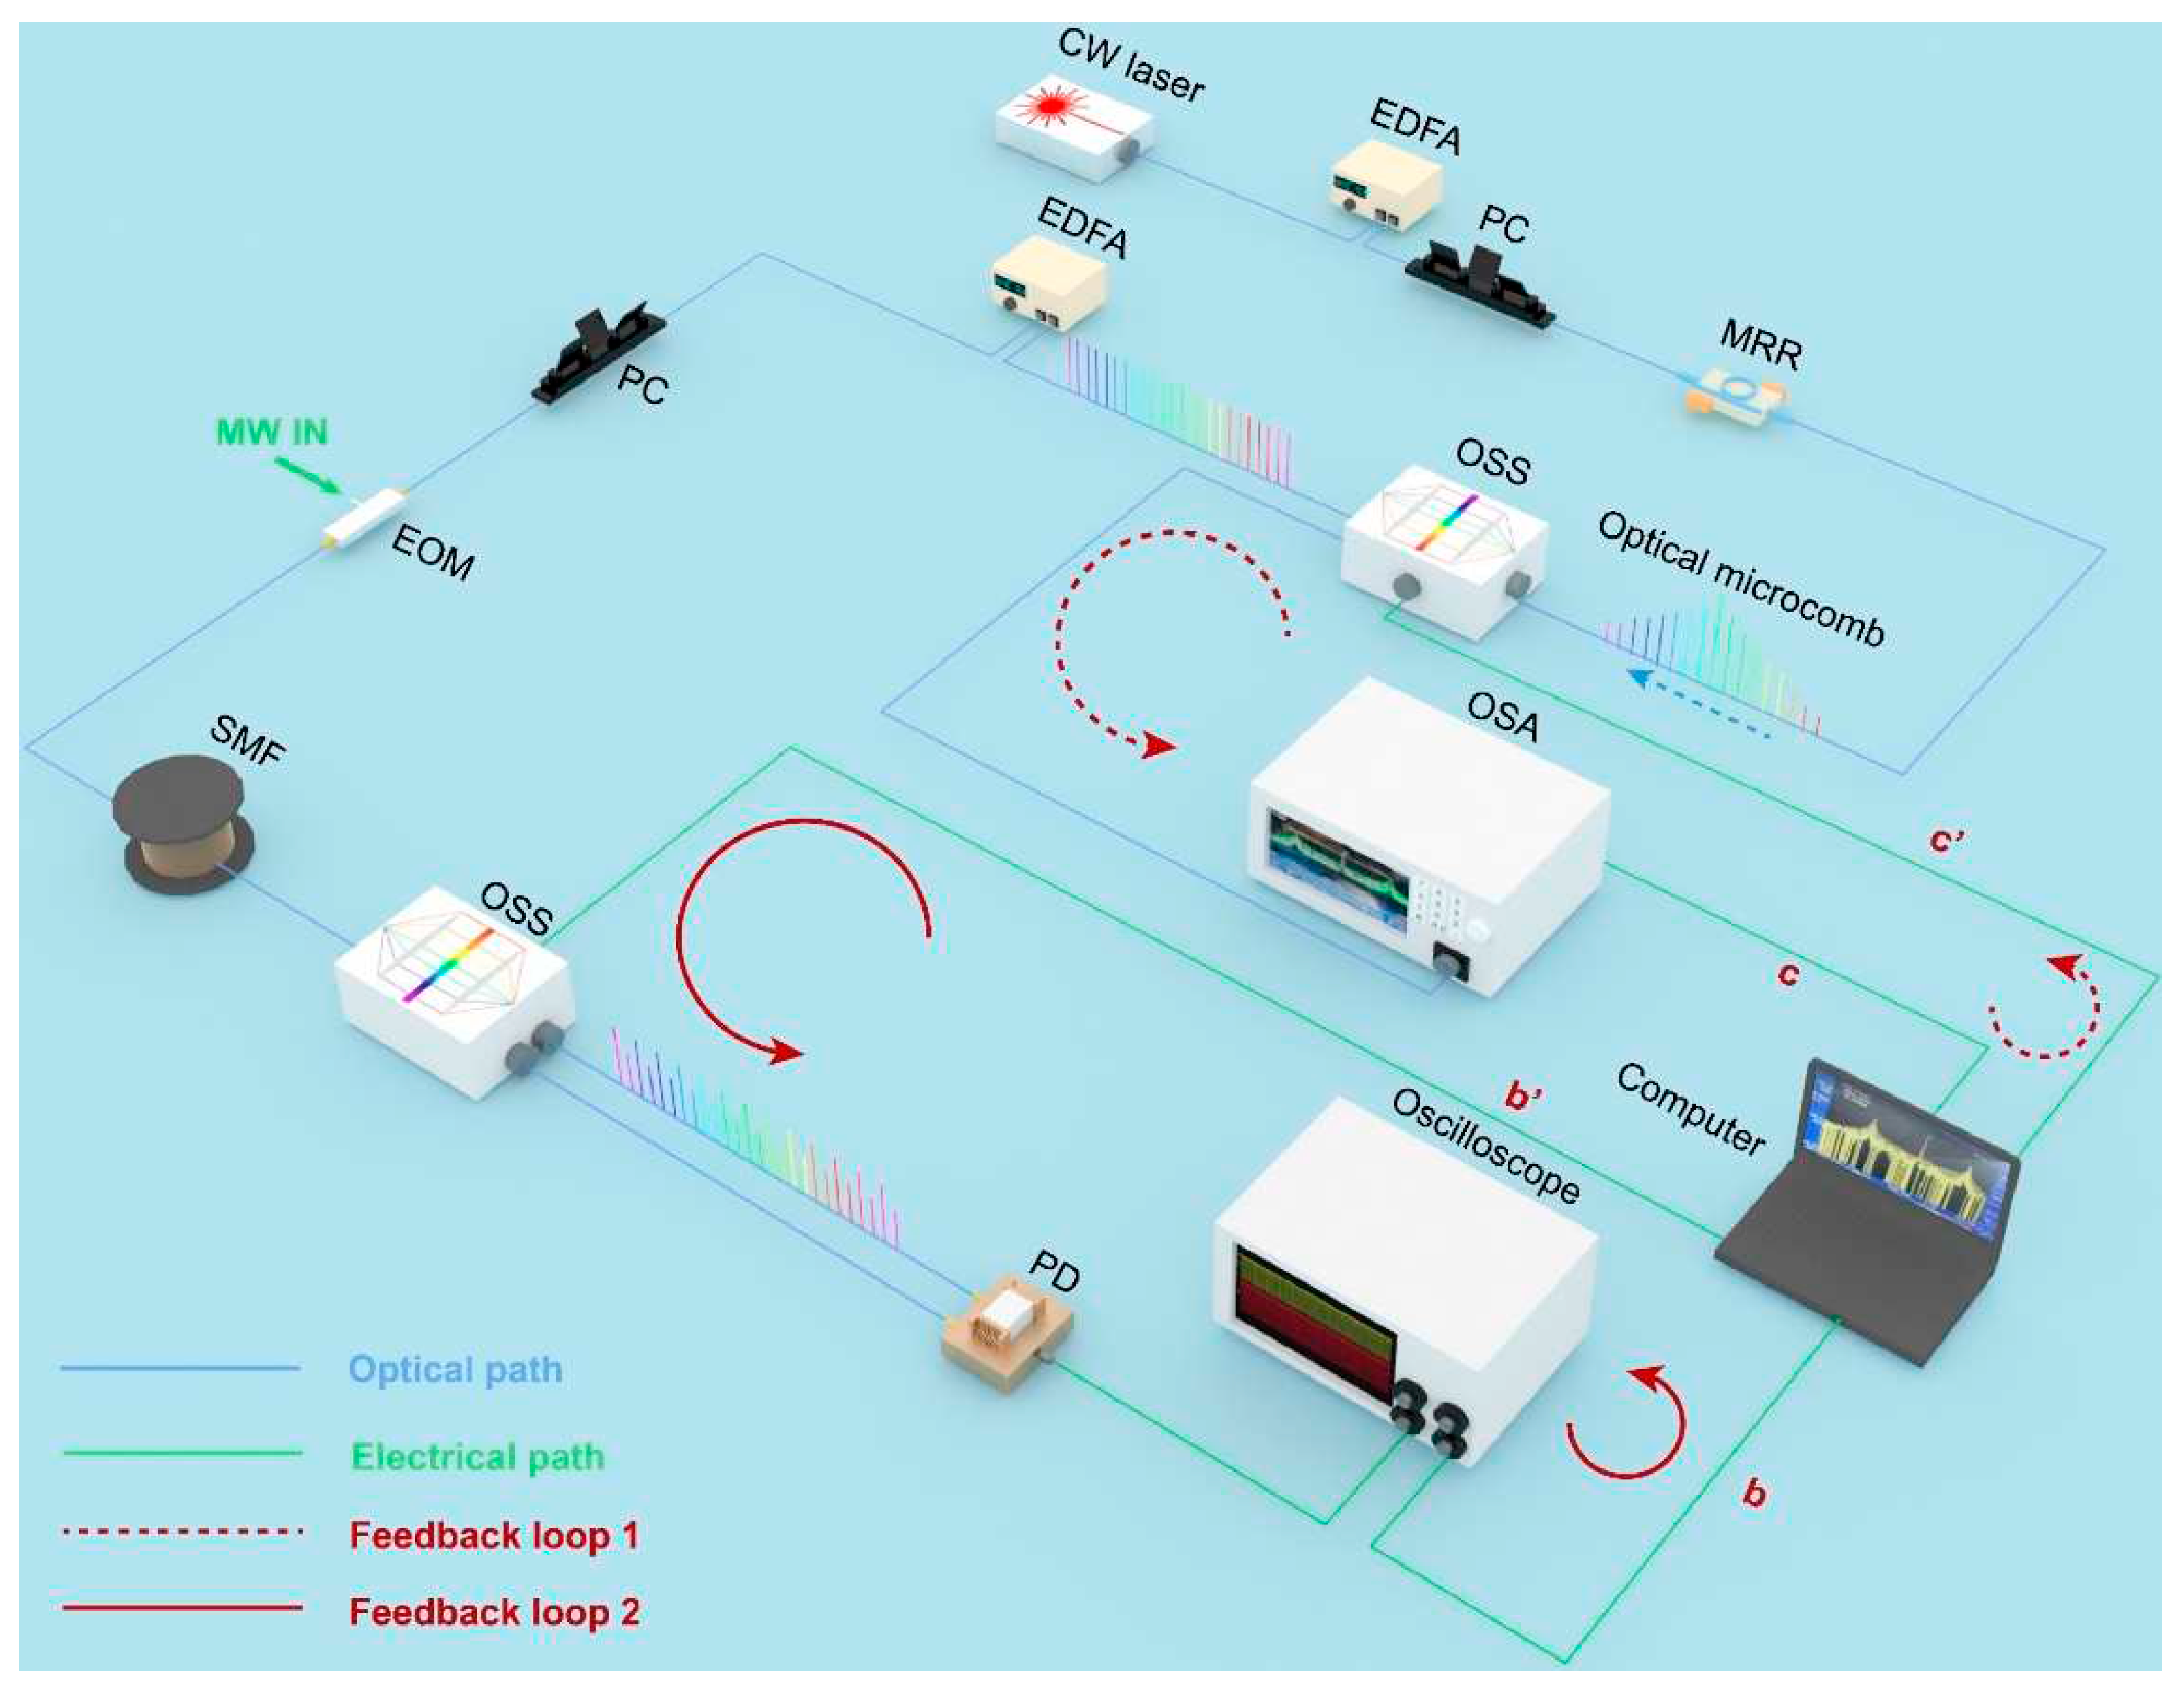
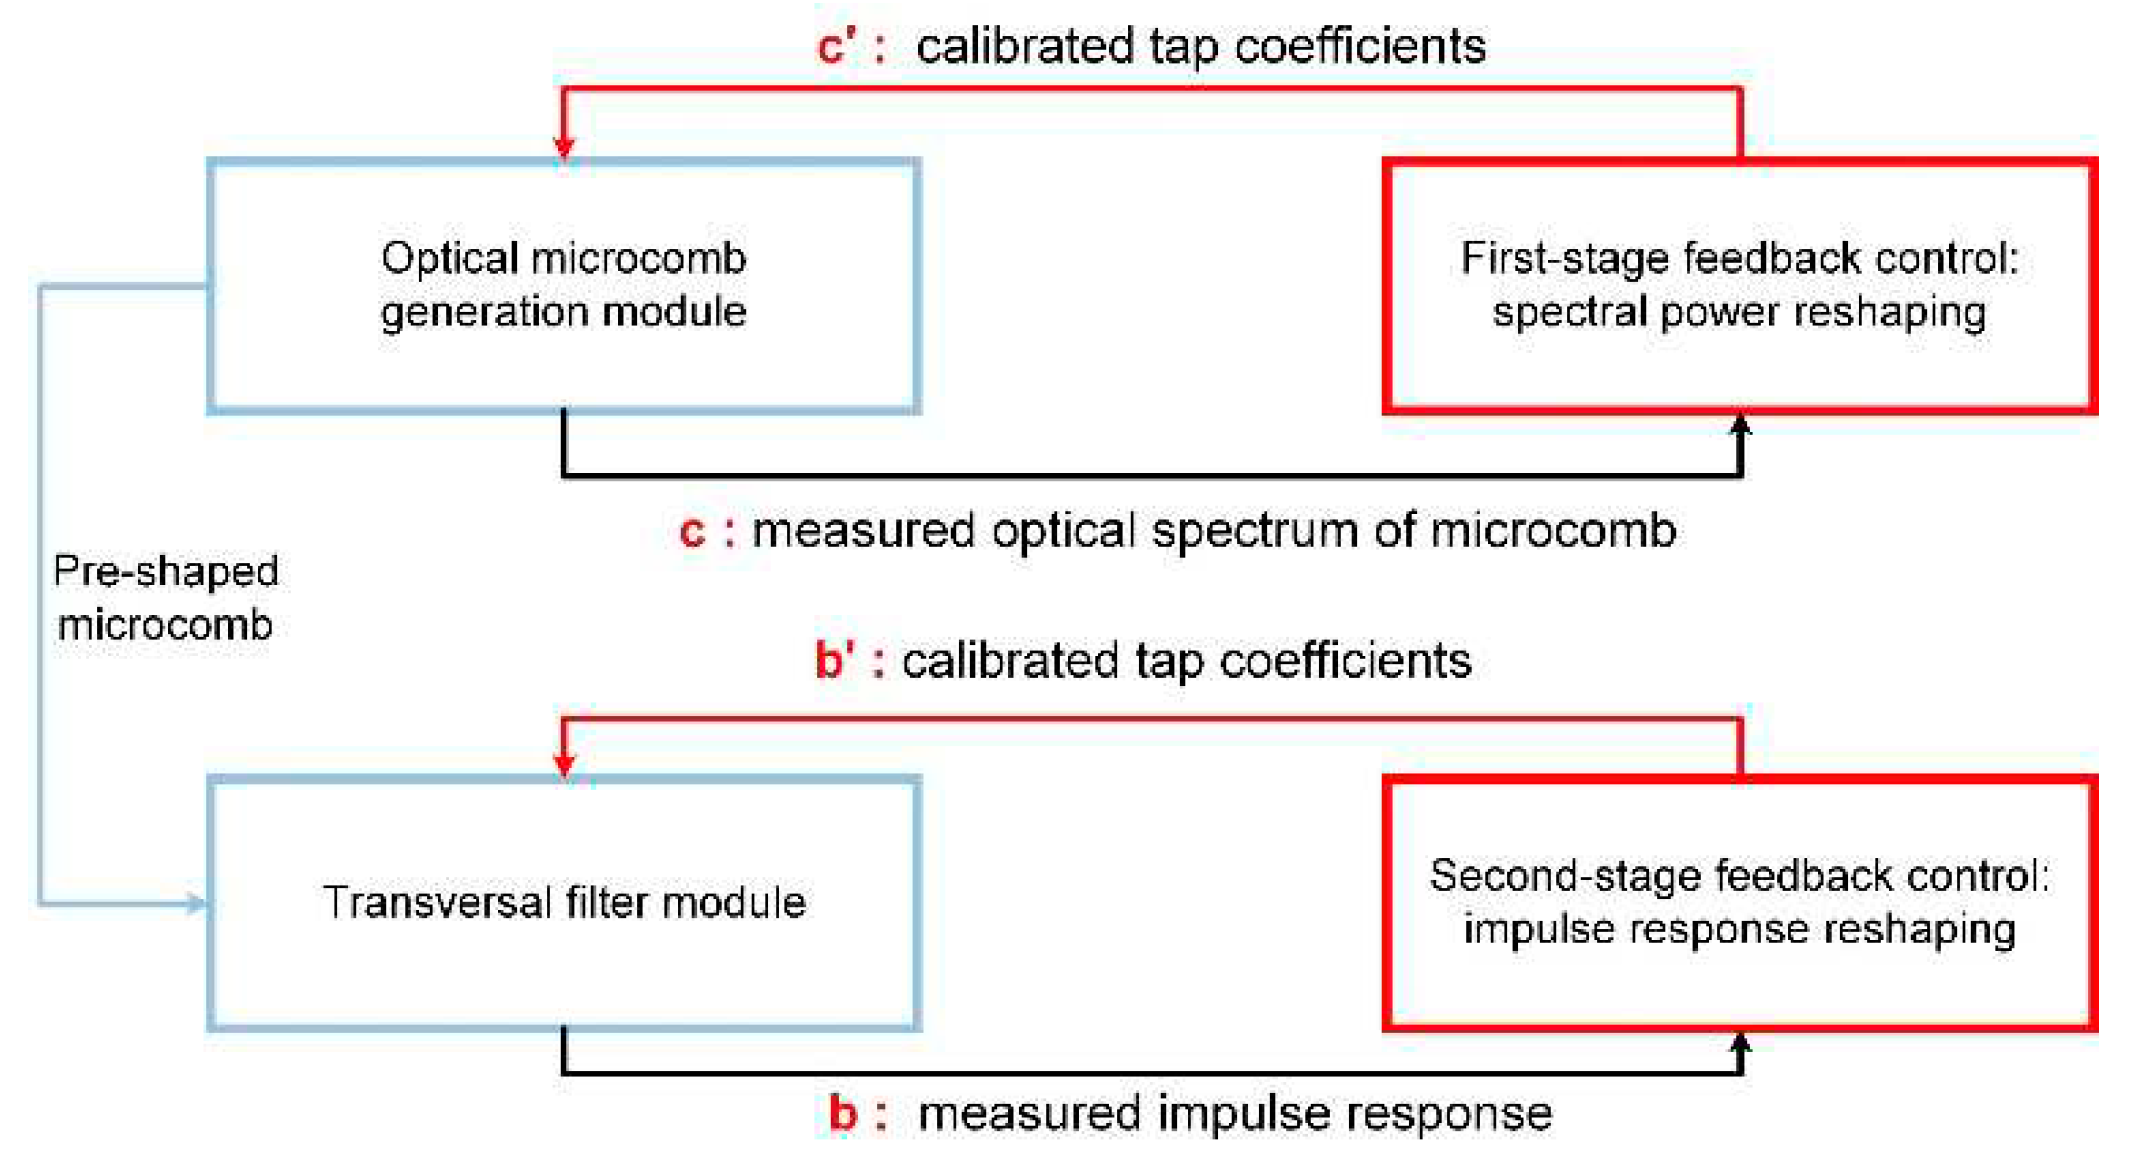
| Method | One-stage feedback control | Two-stage feedback control | ||
| Spectral power reshaping | Impulse response reshaping | Spectral power reshaping | Spectral power & impulse response reshaping | |
| No. of FCLs | 1 | 1 | 2 | 2 |
| No. of OSSs | 1 | 1 | 2 | 2 |
| Included components | microcomb, EOM, SMF, OSS |
microcomb, EOM, SMF, OSS, PD |
microcomb, EOM, SMF, OSSs | microcomb, EOM, SMF, OSSs, PD |
| Monitoring instruments | OSA, computer | OSC, computer | OSA, computer | OSA, OSC, computer |
| Variation range for tap coefficients | small | small | large | large |
| Complexity in achieving tap coefficients with different signs | high | low | high | low |
Disclaimer/Publisher’s Note: The statements, opinions and data contained in all publications are solely those of the individual author(s) and contributor(s) and not of MDPI and/or the editor(s). MDPI and/or the editor(s) disclaim responsibility for any injury to people or property resulting from any ideas, methods, instructions or products referred to in the content. |
© 2023 by the authors. Licensee MDPI, Basel, Switzerland. This article is an open access article distributed under the terms and conditions of the Creative Commons Attribution (CC BY) license (http://creativecommons.org/licenses/by/4.0/).


