Preprint
Review

Mapping and Assessing Coastal and Marine Cultural Ecosystem Services to Inform MSP Processes: A Quantitative Systematic Review

This version is not peer-reviewed.

Submitted:

05 December 2023

Posted:

13 December 2023

You are already at the latest version

A peer-reviewed article of this preprint also exists.

Abstract
Keywords: Ecosystem services; Cultural Ecosystem Services; marine/maritime spatial planning; mapping, assessment, tools, methods, PPGIS
Keywords: 
Subject: 
Social Sciences  -   Geography, Planning and Development

1. Introduction

Coastal and marine ecosystems are exposed to a growing number of human uses and pressures such as exploitation of marine resources, climate change impacts, several types of pollution, and urban expansion [1]. In the marine space, human activities have greatly expanded, and few areas have remained unaffected. Especially in the coastal zone, rivalry for space and resources is even higher, which rises the need for a more effective management of coastal ecosystems [2].
This management is relevant also to Maritime Spatial Planning (MSP), anticipated to encourage sustainable use of marine resources. By following its elemental principles, i.e to achieve balance between the activities of the potentially conflicting maritime industries, and to protect or restore the marine ecosystem, MSP should sustain and maintain, either directly or indirectly, the provision of the coastal/marine ecosystem services.
In institutional terms, the Maritime Spatial Planning Directive (MSPD), aiming to support allocation of the maritime activities in a non-conflicting and synergistic manner, and in harmonization with the marine ecosystem, encourages the sustainable use of marine resources and the conservation of the marine ecosystem and the services it provides. In this ecosystem approach, consideration of ecosystem services is regarded to be crucial. Ecosystem Services (ES) are important for MSP since they emphasize the connection between human and natural systems and the significance of ecosystems functions and processes for human prosperity [3]. Furthermore, assessing ES can be a useful approach to make visible the trade-offs between different sectors and activities – in ways of illustrating the gains and losses of different alternatives to society [4].
Mapping is a precondition for marine ecosystem services’ efficient assessment. This is necessary in order to prepare economically, environmentally, societally and culturally relevant plans for the exploitation of marine resources, i.e., MSPlans. Socio-cultural dimensions in MSP are gaining momentum worldwide and especially in the EU, since it is acknowledged that they are the “missing layer” of MSPlans [5]. Hence, the concept of CES is predominantly relevant to MSP, in that its focus is the socio-cultural benefits people derive from nature. Nevertheless, compared with the other three ecosystem service categories, CES are the most challenging as for their identification, mapping, assessment, and valuation. Another MSP related challenge is that the environmental state of the sea is essentially induced by transboundary pressures, and many complications need to be tackled in the framework of transboundary MSP [6]. Therefore, a common understanding of how ecosystem services can be used as a tool in MSP could be a starting point in addressing these challenges. For the Nordic countries, international cooperation is easier given the common challenges of the North and Baltic sea-basins and shared marine areas [4]. This is not, however, the case in the Mediterranean.
As a result, mapping and assessment of coastal and marine ES is growing to a very important matter for supporting decision-making on the sustainable management of coastal areas and it can be an essential contribution to MSP [7], including transboundary MSP. Several papers have proven the value of the ES concept for MSP [7,8,9,10,11].
Also, Drakou et al. {12} acknowledge the multi-functional role of ES as a tool to feed MSP with spatial data on marine ecosystems, as a method in the strategic environmental assessment (SEA), to assess the impact of marine uses on supply of ES and as a tool to assess the efficiency and the potential impact of policies imposed on the Natura 2000 and UNESCO sites; finally the ES concept is considered prominent for the overall implementation of MSP. Guerry et al. [11] argue that the ES framework should be used in MSP since it enables the explicit consideration of trade-offs in services and provides a quantitative method for comparing the value of MSP, versus sectoral or uncoordinated planning. To this end, a marine Integrated Valuation of Ecosystem Services and Tradeoffs (InVEST) was designed with the aim to assess the multiple services provided by marine ecosystems. In this sense, several relevant programs are included in the European MSP Platform; for example, the EMFF Project “Ecosystem Services in Marine Spatial Planning”, BalticAPP, RECOMPRA, MAREA [13].

2. Cultural Ecosystem services: are they significant to MSP ?

Cultural ecosystem services (CES) are formally defined as “the non-material benefits that humans obtain from ecosystems through spiritual enrichment, cognitive development, reflection, recreation, and aesthetic experiences” [14]. In practice, they may signify cultural diversity, cultural heritage values, including spiritual and religious values, social knowledge systems and learning values, social relations, inspiration, aesthetic values, regeneration and sense of place. Since the publication of the Millennium Ecosystem Assessment [14], the matter of CES has been the most challenging sort of ES [15], with many attempts to articulate relationships between culture and other services [16]. In another overview of ES, Costanza et al. [17] were observing that even though CES was the least matured category when the MA was launched, a voluminous number of papers on CES were published since. Besides, mapping and assessment of ecosystem services (ES), including CES, was one of the core actions (Action 5) of the EU Biodiversity Strategy 2020 [18], aiming at stopping biodiversity loss and the deprivation of ecosystem services in the EU by 2020.
However, to explicitly measure cultural ecosystem services (CES) is not an easy task. Research on ecosystem services [19] showed that despite the focus on the supporting, provisioning, and regulating ecosystem services and their assessment, the quantification of this intangible kind of ES is extremely limited. Kobryn et al. [8] identify a series of issues that hamper the development of indicators and a framework within which CES can find their place. According to the authors, these are mainly the difficulty in applying or using monetary value for CES, the complications in linking cultural benefits with a specific change in a social-ecological system, the fact that cultural benefits and values do not come exclusively from CES, and finally the confusion concerning the meaning of «services», «values», and «benefits» [20,21]. However, despite the above constraints in assessing CES and their value, it is argued [8] that CES cannot be left out of the decision-making processes since these intangible benefits are very frequently more essential to people than material profits [21].
For cultural services, a broad set of measures is being used; however, only 23% of the papers reviewed by Hernández-Morcillo et al. [22] used spatially explicit information. Indicators are essential as most CES and their values, are not directly perceptible in the landscape and their enclosure in analyses depends on the use of indicator measures. A relevant approach is participatory mapping, where the required data on values are fed by the empirical research, spatially [23,24].
Concerning the application of CES in MSP, it is essential to note that many similar challenges are pertaining. It is noteworthy that although the roots of ES can be found in economics and natural science, in recent years, a closer engagement with the social sciences is evident, with particular focus on “values” [25,26,27] emphasize the efficient incorporation of social data into decision-making processes and use the concept of “marine socio-ecological systems” and “integrated ecosystem assessment”. Their findings highlight the dilemma between the need to produce indicators to cope with complexity and the risk of valuing only what is quantifiable (also in terms of economic valuation). Mixed methods using quantitative and qualitative approaches are suggested as a solution to overcome this dilemma.
However, across diverse world studies, there persist several worries regarding the capacity of ES to effectively represent socio-cultural viewpoints. An example is the Intergovernmental Science-Policy Platform on Biodiversity and Ecosystem Services (IPBES), a joint global work by academia, civil society and governments, to assess and stimulate knowledge of biodiversity and ecosystems and their contribution to human societies in order to inform policy making [28]. The IPBES framework introduces the concept of “nature's contributions to people (NCP)”, which builds on the ecosystem service concept and recognizes also the key role that culture plays in defining the links between people and nature. The NCP raises, emphasizes, and makes operational the role of indigenous and local knowledge in understanding nature's contribution to people. However, the strong criticism towards this approach [29] proved that there are also opposing opinions and that this concept is rapidly changing.
Summing up, there are several examples of published work that explicitly connect CES and MSP, and a fast-growing body of work considers CES in coastal and marine areas. Examples can be detected in the work of Ruiz-Frau et al. [10], that believe that MSP should follow a holistic approach including ecological, economic, and social aspects. Cultural services were incorporated in the Invest framework and it was acknowledged that understanding and reporting on cultural values (such as existence, subsistence, and aesthetic values) are fundamentally important for coastal communities. InVEST was designed to provide results grounded in both local ecological knowledge and, also, reflect diverse values, conflicts, and aspirations.
In contrast, Gee et al. [30] focus on understanding the importance of culture and note that cultural values associated with the sea tend to be a neglected aspect in MSP. A simple CES approach is judged only as a starting point for thinking about how communities are connected to the sea. They initiate a method for developing ‘spatialized’ community-based narratives that can be used to identify ‘culturally significant areas’. (Halpern et al. 2012) [31], suggest that an ecosystem-based process as a priority of MSP, should be protective for critical ES; a key problem is how to measure and compare very different ES i.e cultural values versus tangible provisioning ES that are easily marketable. MSP is also seen as an important step in the implementation of comprehensive ecosystem-based management. Fletcher et al. and Potts et al. [32,33] consider CES in the context of marine protected areas (MPAs) and marine habitats. They point out the links with human activities such as sport, recreation and nature watching, but all highlight the scarcity of data available for making assessments. Specifically, Fletcher et al. [32] studied marine CES in the Black Sea and highlighted the lack of characterization or valuation of CES mainly because they are hard to identify. CES are often left out of assessments which runs the risk for the ES frameworks not to be utilized to their full potential. The research demonstrates the broad range of sociocultural considerations that are relevant to MSP, beyond leisure and recreational opportunities, especially the deep sense of connectivity with the sea [23], explore the importance of developing participatory mapping of ES to navigate coastal values and suggest that monetary and biophysical dimensions tend to dominate spatial planning. They use “social value mapping methods to explore associations of tangible and intangible values with places, stressing the significance of ecosystems to people. Their paper concludes that despite the attachment of strong and diverse values to nature by people, spatially identifying and quantifying the significance of places is only possible for certain values. They suggest the inclusion of a deliberative component in planning and decision-making as most effective and appropriate.
Apart from the literature that explicitly frames a socio-cultural approach in ES in the context of MSP, there is a growing body of literature dealing with the ES of marine and coastal spaces which might find application in MSP. CES are present to a lesser or greater extent, often mentioned in broader policy contexts. These approaches range from broad overview of the value of coastal ES [34,35] to more specific findings like the lack of social information in the context of coastal ES data [36] or the fact that coastal zone ES may be valued in economic terms with CES considered as significant places providing a lot of benefits [37]. Hattam et al. [2] examine ES broadly in the marine environment and then examine a case example of the Dogger Bank in more detail. Furthermore, Ranger et al. [38] provide a methodology for exploring deeply rooted cultural values through the “Community Voice Method (CVM)” in the framework of deliberative-democratic context for decision-making regarding MPAs. Baulcomb et al. [39] develop and test a pathway to the identification and non-market economic valuation of CES, considering culture as a generator of ES in a marine environment. Their approach is demonstrated through a case study in Turkey emphasizing advances in the food web of the Black Sea. In a recent article, Noor et al.[40], argue that it is essential to engage local stakeholders, especially among the youths, to explore governance complexities of MPAs and how to better understand CES. Kenter et al. [41] conducts a triple choice experiment with modelling of participatory systems, participatory mapping, and psychometric analyses in a coastal area in Scotland. Interestingly, the paper explicitly considers the role of shared values in decision-making. Finally, Bryce et al. [42] recognize the complications in assessing CES and suggest an original framework developed by the UK National Ecosystem Assessment (UKNEA) to evaluate the benefits produced by CES in 151 marine recreational sites in the UK.
Hence, there is sufficient evidence that CES are considered in various ways in the context of coastal and marine management. On the other hand, purely understood MSP seems to progressively acknowledge CES, highlighting their role in enriching human well-being and sustaining community resilience [43,44]. Incorporating CES into the planning process, most frequently through participatory methods, may promote sustainable management of the sea and the coasts.
Given the above hypothesis, the aim of this paper is to conduct an in-depth review of all recent endeavors that include methods, techniques and tools used for mapping and assessment of coastal and marine CES, to inform MSP processes.

3. Materials and Methods

Τhe systematic review followed in this paper, aims to determine the different methods, tools and techniques used for mapping and assessing coastal and marine CES. The scientific literature was retrieved from the bibliographic databases “Science direct” and “Scopus”. First, a search was performed for publications containing the following keywords in combination with ‘marine/maritime spatial planning’ OR ‘coastal planning’: "cultural ecosystem services", "cultural ecosystem values", "intangible benefits", "non-material benefits" (Table 1, Search 1). Then, a second search was performed (Table 1, Search 2) in order to detect any additional coastal or marine participatory mapping related papers. Last update of the search took place at 18/10/23.
The total number of articles obtained from the literature investigation was 139 (40 from Science Direct and 99 from Scopus, accordingly). After removing duplicates (n= 32) and not accessible ones (n = 3), followed a first screening of the articles to exclude publications:
  • written in a language other than English (n=3),
  • not related to CES (n=1),
  • theoretical articles - discussions and reviews, etc. (n=18),
  • not focused on the coastal zone or on the marine environment (n=15)
In a second screening of the articles, those that did not apply mapping or spatial analysis of CES (n = 22), were excluded as well.
The remaining 45 articles, included in this review, were classified according to the criteria presented in Table 2. First, the temporal and spatial distribution of the papers (When and Where) was determined. Afterwards, questions of Who and What (focus of papers) were answered. The focus of the papers can be either ecosystems, or marine/maritime Spatial Planning, or simply cultural ecosystem services (CES).
Follows the classification of the mapping approaches, based on the ones presented by Brander et al., Santos-Martín F. et al.and Vihervaara et al. [45,46,47,48]. The following Table 3 summarizes these different methods.
Next, each mapping approach was divided to further sub-categories of methods (see Table 2, Mapping approach & methods). Mixed PPGIS approaches were differentiated from other types of mixed approaches to give a picture of the established work. The classification was strictly focused on methods used for CES mapping and assessment. The methods used for mapping of other categories of ES were not considered, except in the cases that there was an aggregation of results (e.g., hot spots and cold spots of cultural and biophysical ES) [49]
Furthermore, a classification of valuation methods followed in three general categories: Monetary, Non-Monetary, Combination of both, as well as to further sub-categories of methods based on the categorization of evaluation methods presented by Cheng et al [50] (see Table 2, Valuation type & methods).
Then, in order to present the various methods, techniques, models and tools applied and relate them with the relevant software, they were all classified in four main categories of Desk analysis:
1) Spatial analysis (GIS) which refers to any technique and tool applied in a GIS environment;
2) Statistical analysis which signifies any statistical method applied in a statistical software;
3) Modelling for ES, meaning software tools developed specifically for ES assessment, such as the InVEST1 (Integrated Valuation of Ecosystem Services and Tradeoffs). InVEST is a set of free, open-source software models that “enables decision-makers to quantify the importance of natural capital, to assess the trade-offs associated with alternative choices, and to integrate conservation and human development”. SolVES (Social Values for Ecosystem Services), is “a fully open-source, GIS-based tool designed to aid in the creation of quantitative, spatially explicit models of the nonmonetary values attributed to CES, specifically to facilitate their incorporation into larger ecosystem service assessments” [51]; and
4) other type of analysis which refers to any other method, technique or tool applied that does not fall into the previous categories. Participatory techniques, tools and software regarding decision-making techniques and web-based surveys for data collection were collected separately.
Ultimately, bringing into focus the subject of PPGIS/webGIS, we identified and discussed relevant EU-funded projects. The projects were retrieved from CORDIS (2) (Community Research and Development Information Service) which is the European Commission's primary source of results from the projects funded by the EU's framework programs for research and innovation, from the FP1 to the “Horizon Europe”. We used various terms, which may be directly or indirectly related to cultural ES (Table 1, Search 3), such as “ecosystem services", "cultural ecosystem values", "landscape values", etc.
We performed a broad search, for projects related to one of these terms, along with various terms for participatory mapping or marine spatial planning. Followed a screening of the reports of all the projects listed, with the aim to exclude those not directly (focused on ES) or indirectly related to CES (focused on another framework e.g., landscape values) and to existing PPGIS/webGIS platforms. Finally, a last search was performed (Table 1, Search 4) in “Science direct” and “Scopus” to detect any additional webGIS studies. This last search resulted in only one publication that was already included in previous searches.

3. Results

3.1. Spatial and temporal distribution of the papers

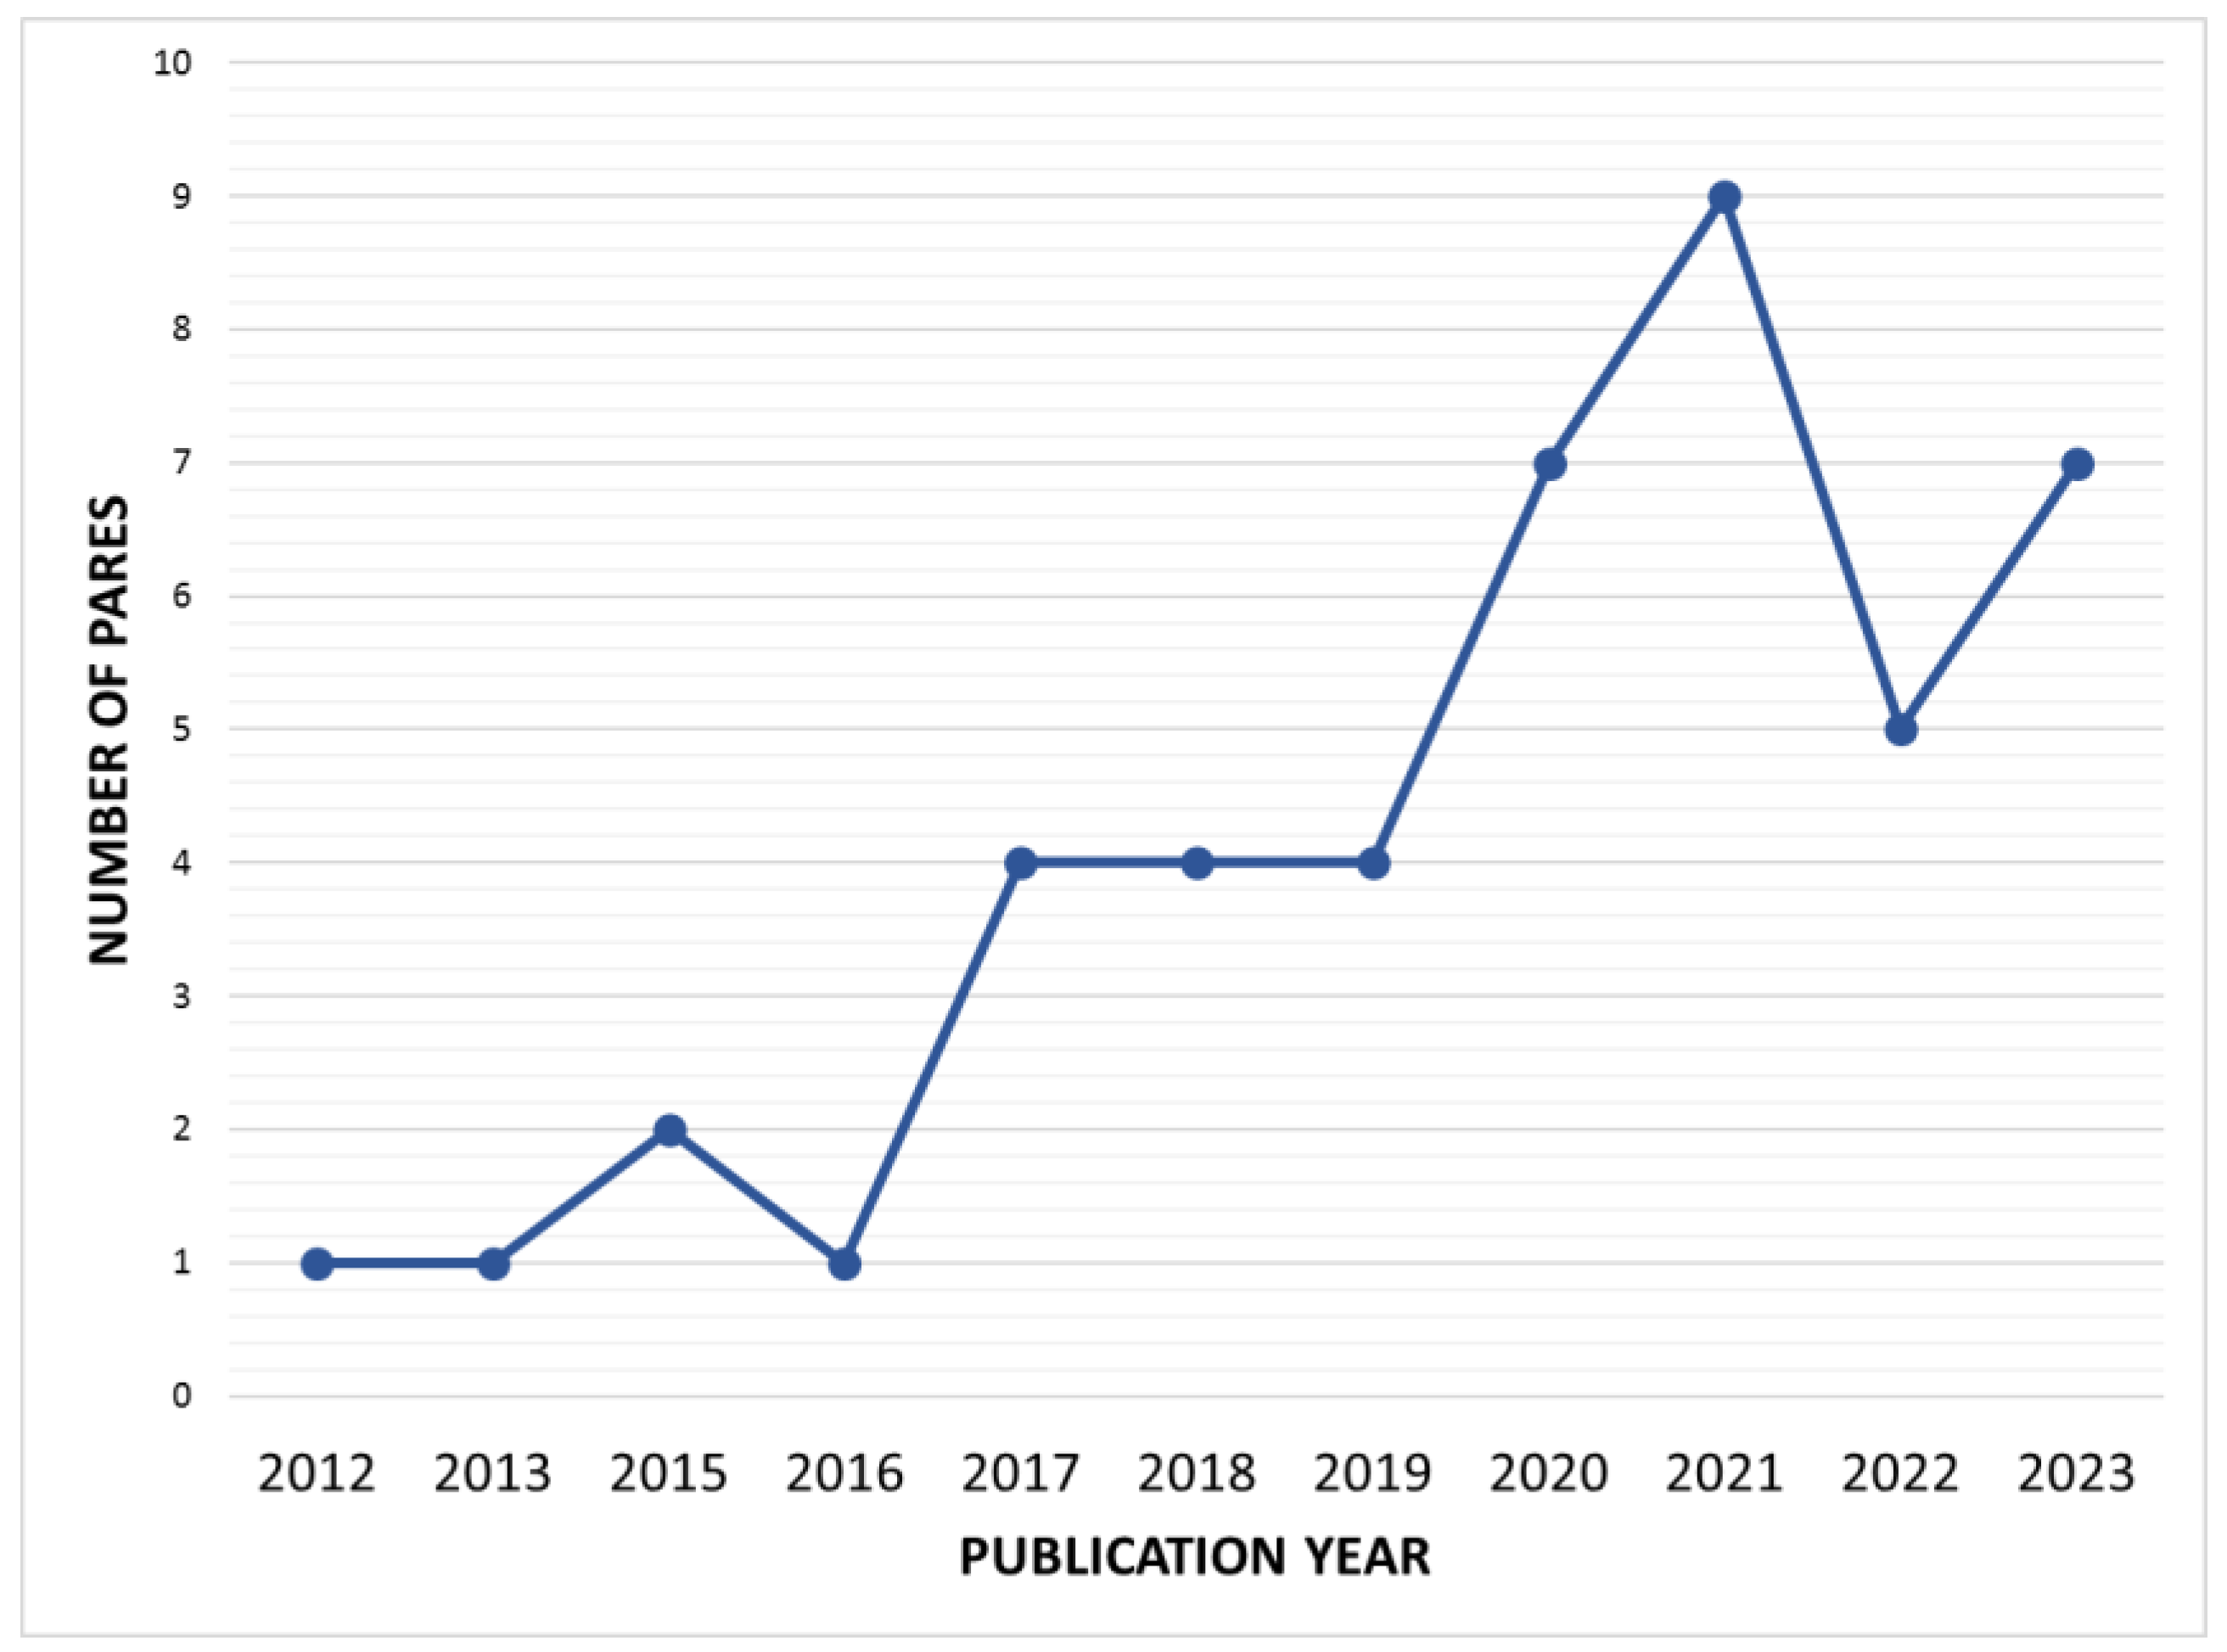
More than 89% of the articles (Figure 1) were published between 2017 and 2023. There was a rabid rise in the number of publications in 2020 and then a rapid drop, from 20% in 2021 to 11% in 2022. Articles were published in a range of scientific journals among which almost 62% were the following: “Ocean and Coastal Management” (22%), “Ecosystem Services” (16%), “Marine Policy” (9%), “Journal of Environmental Management” (9%) and “Ecological Indicators” (7%). 73% of the articles were authored by the scientific community, while 27% resulted from the collaboration between academics and government/ authorities, or/and other organizations (e.g., NGOs, private companies) [9,52,53]
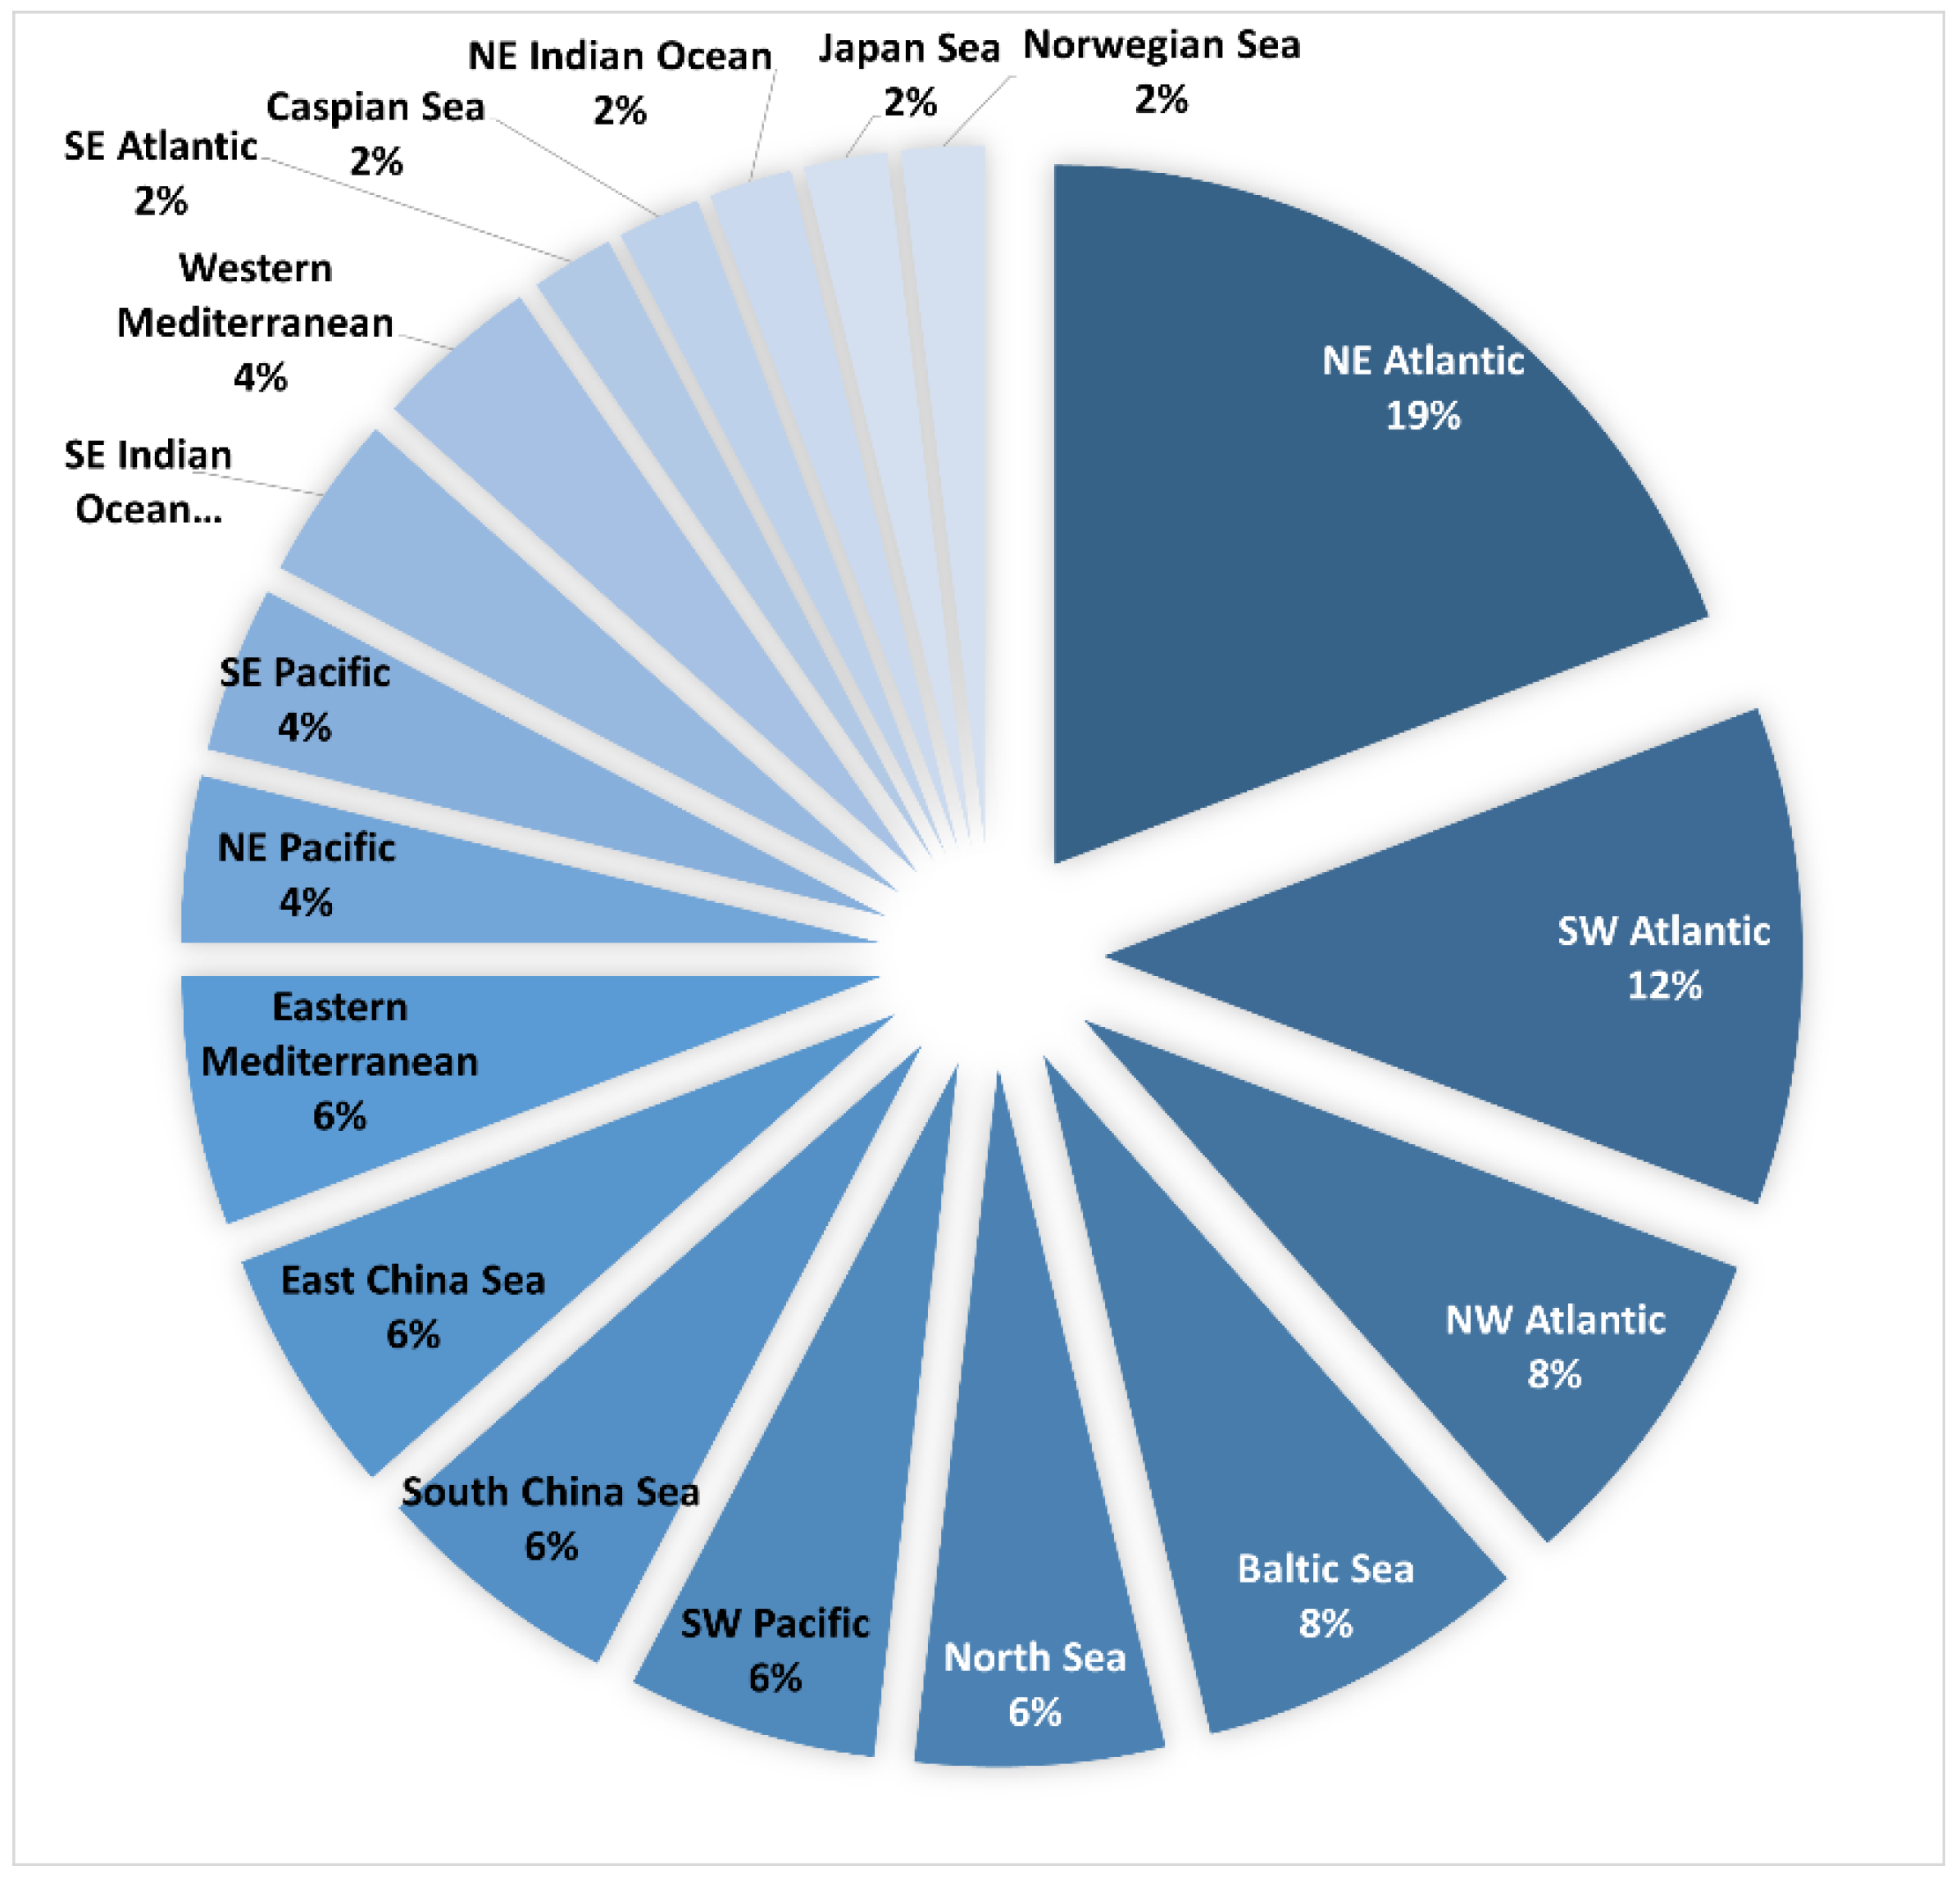
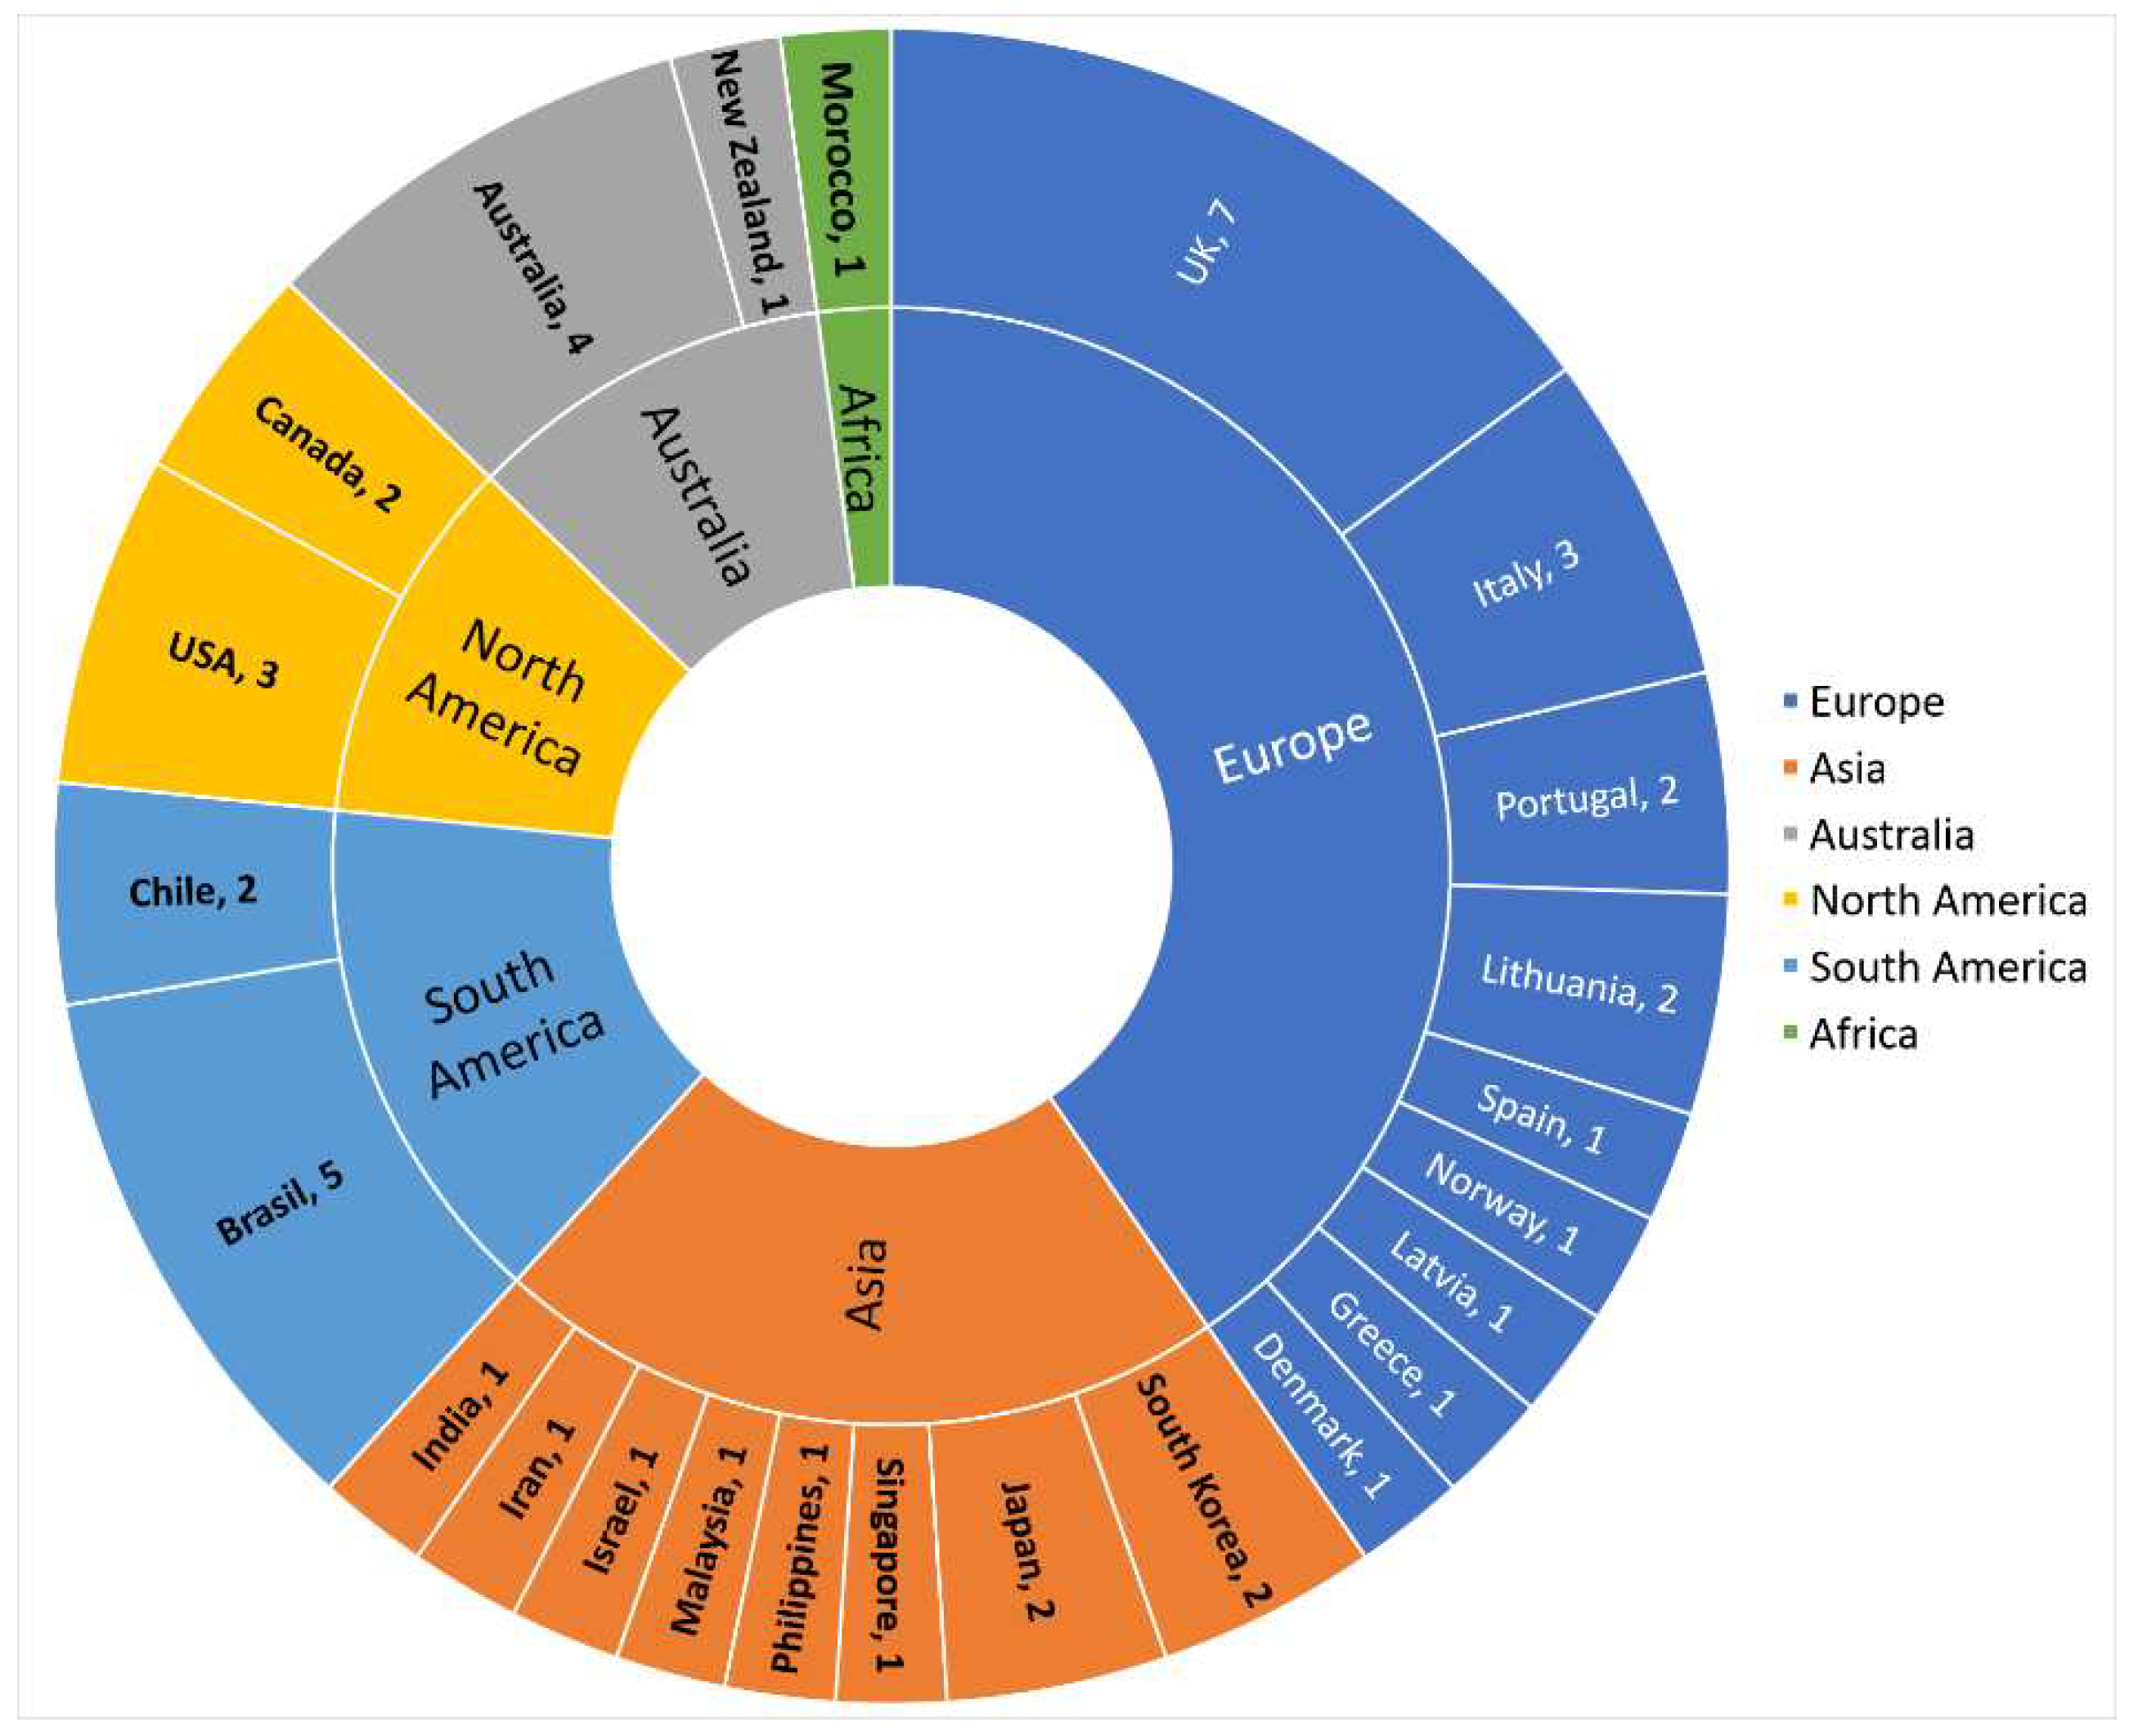
The spatial distribution of the papers is presented in Figure 2 and Figure 3. As seen in the graph, more than 46% were located, in NE Atlantic (19%), SW Atlantic (12%), NW Atlantic (8%) and Baltic Sea (8%). 40% of the papers were in Europe, 75% of which were placed, in United Kingdom (37%), Italy (16%), Lithuania (11%) and Portugal (11%). Another, 21% of the papers were placed in Asia, 15% in South America (mostly in Brazil), 11% in North America, 11% in Australia and 2% in Africa (Morocco). Most of the papers (72%) have either local (38%) or regional (33%) scope and only 18% a national scope (located mainly in Europe and in Asia). There were cases of sea-basin centered papers (4%), in North Sea [54] and in the Atlantic Ocean [55], while another 6% (in equal percentages) applied coastal zone [56] or comparative [57] or multi-scale analysis [58].

3.2. Focus of the papers

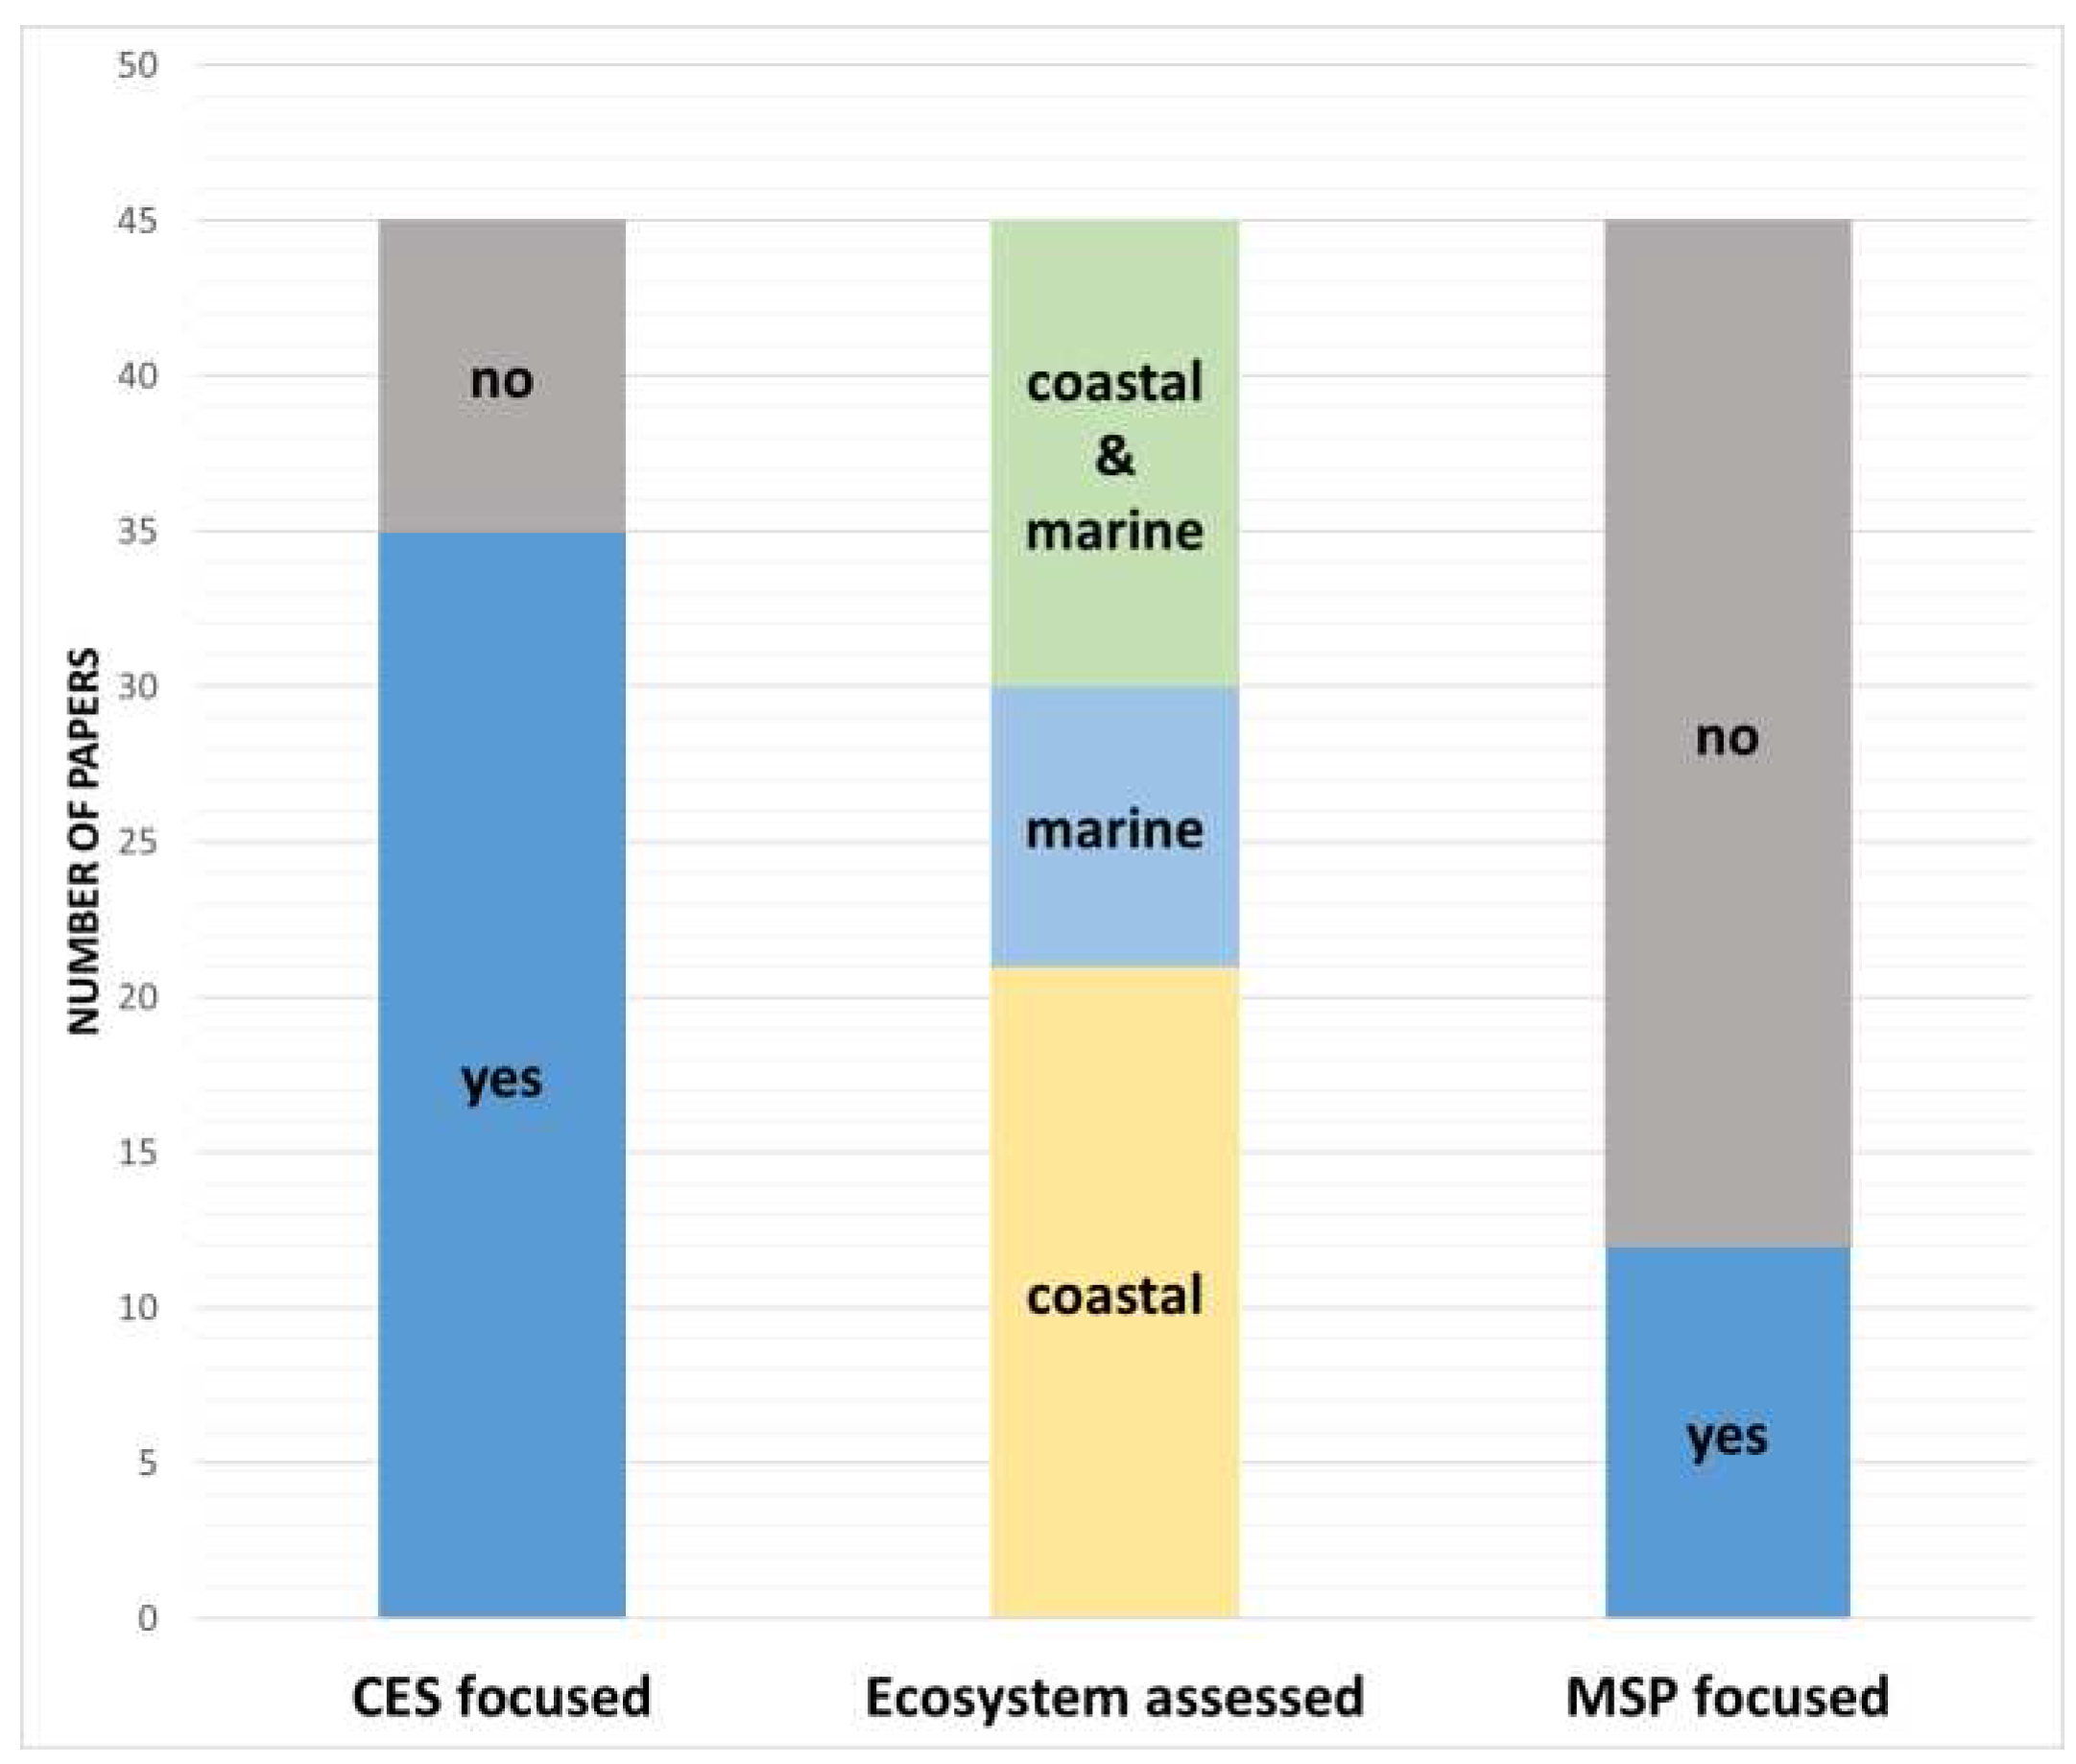
As expected, due to the focus of the search, 78% of the articles are explicitly emphasizing CES, while the other 22% assesses CES along with other categories of ES [55,59,60,61]. The ecosystems assessed, were: 47% purely coastal [62], 33% coastal and marine [43,63] and 20% purely marine ones [64,65,66], (Figure 4).
A high percentage of the papers (>73%) examined, have other focus than the one of MSP, such as “natural resources management”, “management of MPAs”, “vulnerability and risk assessment” or “ecosystem services” in general. [58,59,67,68].
Almost, 27% of the papers were explicitly focusing on MSP [23,43,69,70] in relation to specific fields like “incorporation of socio-cultural values and CES in MSP”, “recreation opportunities”, “tourism”, “marine biodiversity” “MPAs management”, “preservation of marine ES” etc.

3.3. Type of engaged stakeholders

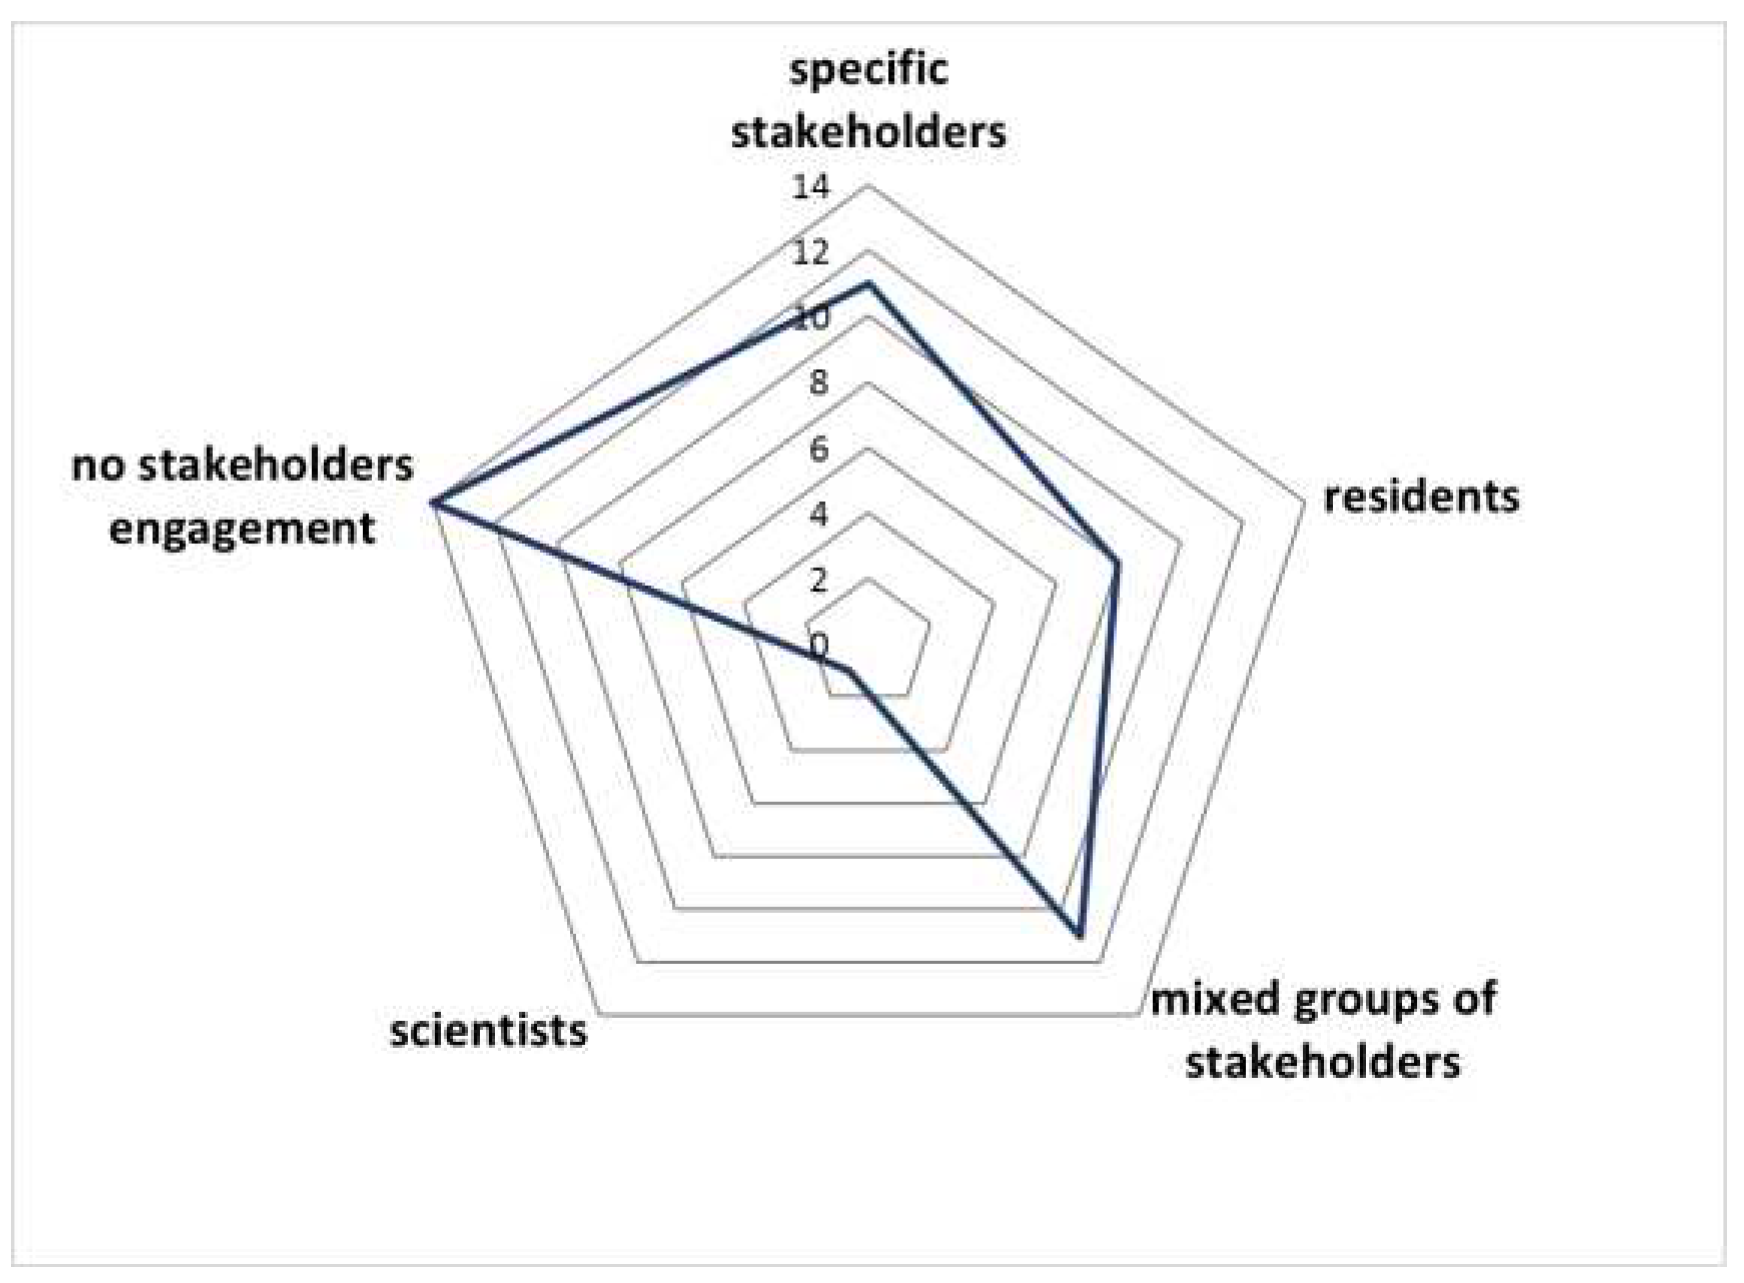
As displayed in Figure 5 below, a high percentage of the papers (69%) involved stakeholders in the assessment of CES, including 18% of residents [71], 24% of specific stakeholders, mainly recreational groups, residents and tourists [72,73], and 2% were scientists [9]. Finally, almost one quarter (24%) of the publications involved mixed groups of stakeholders, a variety of different stakeholders [8,23,69,70] including Aboriginal Traditional Owners residents, user groups and professionals, federal state and local government or different groups of marine-related professionals..

3.4. Mapping approaches

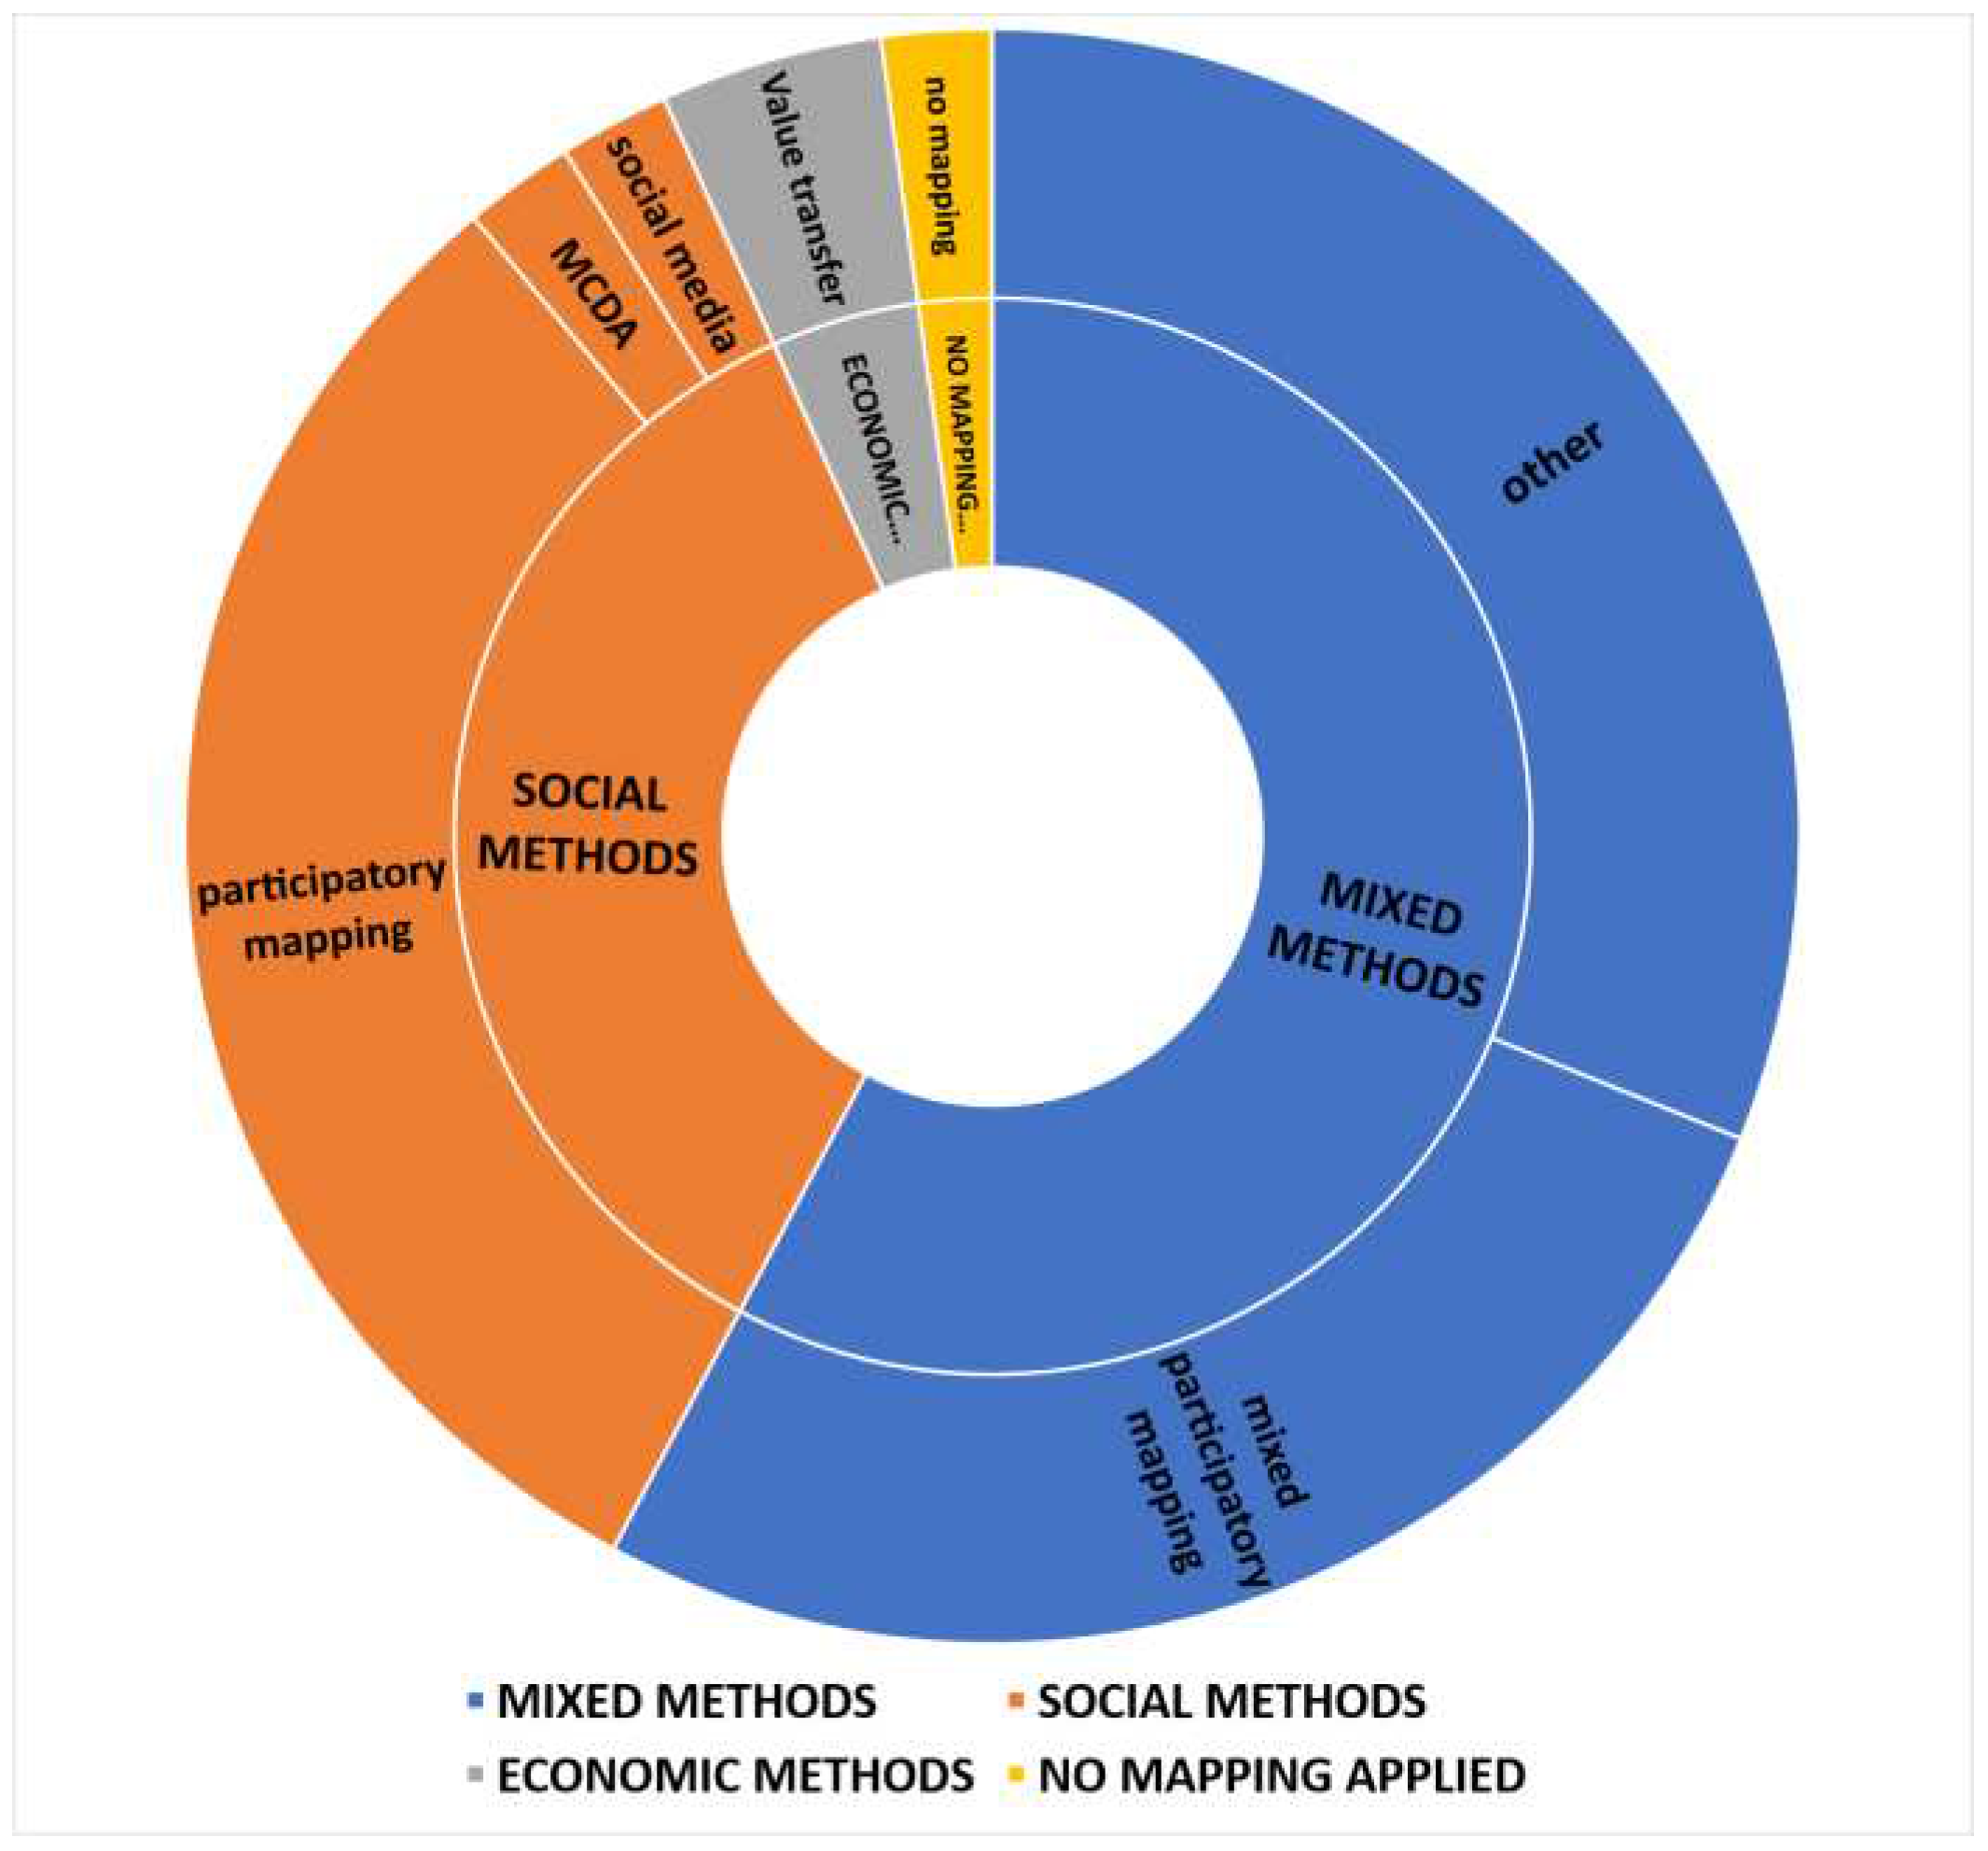
In the following Figure 6 are displayed the percentages for each mapping approach/method used. As already stated, the papers were classified following the key mapping approaches (Social Methods, Economic Methods and Mixed Methods) and then, to further sub-categories per approach. There were no cases with strictly biophysical mapping, which was expected due to the focus of this review (CES mapping and assessment).
Figure 6. The percentages of papers per general mapping approach/method, divided in: 1) Mixed methods (blue color), 2) Social methods (orange color), (MCDA: Multi-Criteria Decision Analysis), 3) Economic methods (grey color), 4) no mapping applied (light orange color).
Preprints 92346 g006
As observed in the above figure, almost 36% of the papers applied social methods (orange color): 31% were participatory mapping approaches and 4% used social media analysis [68] and Multicriteria criteria analysis (MCA) [7] to map and assess CES. Only, a relatively low percentage (4%) of the papers applied strictly Economic methods (grey color) [55,74] while 58% of the papers were Mixed mapping approaches (blue color): 27% was mixed participatory mapping and 31% other types of mixed mapping (e.g., InVEST, composite indicators). Finally, almost 2% of the papers (light orange color) do not apply mapping at all [75].
It should be noted that they were cases of papers that even if they did not explicitly mention participatory mapping [10,67], were classified as such. In one case, respondents were asked to select cells on the map of areas they had visited the most and activity distribution was mapped while in another the most visited diving sites were identified and mapped through questionnaires (without including a map).

3.4.1. Use of paricipatory GIS

In most papers using PGIS, participants identified either predefined ES directly [8,63] or labeled these areas through attributing codes of values [58]. There were also papers where the locations were predefined [53].
Among other, participants were asked to identify places of value [58], their favorite places [63], areas of ES provision [76], tangible and intangible ecosystem benefits and services and areas associated with bequest values [60], interesting special features or features that should be conserved [25], threats [76] or areas that are threatened [23] or to map activities they had performed [77].
Additionally, in some papers, participants assigned a relative value (e.g., level of attachment, level of importance) in the identified spatial features, by different means, such us: 1) the use of a scale by drawing with different colors of markers or by placing different colors of stickers on the map [49,63,78] ; or 2) by the distribution of tokens or points [23,52,65,76]; or even 3) by directly ranking the spatial features (areas of value) from most to least important [53,73].
Finally, in some cases participants, indirectly assigned a specific value in these areas by rating the intensity of each activity performed [77] or by indicating the number of activities usually performed [62].
As a result, we came across various maps: hotspot maps [63] or hot and cold spot maps [49,52]), heat maps (density maps) [73], point distribution maps [8,57,79] cluster maps [73], or maps of ES bundles [60]. For example, Blake et al. [63] mapped hotspots of attachment for each value and hotspots of total combined attachment in Falkland Islands. Klain & Chan [23], made the distinction between areas important for monetary reasons (economic activities), areas important for non-monetary reasons (tangible and intangible non-monetary benefits) and areas that are threatened. They produced hotspot maps of value by number of interviewees, by quantile and of absolute aggregated value in the Regional District of Mount Waddington.
Smart et al. [49] mapped, among others, hotspots and coldspots of cultural and bio-physical ES overlap and cultural ES and pressures overlap, on Johns Island in coastal South Carolina. Similarly, Tajima et al. [73] mapped the density of CES for residents and tourists. There were also cases that mapped the distribution of values, associated with: the distance from the coast [8] or with development/access and natural areas [57] as well as a case of multiscale mapping in the Wadden Sea coastal area [54].
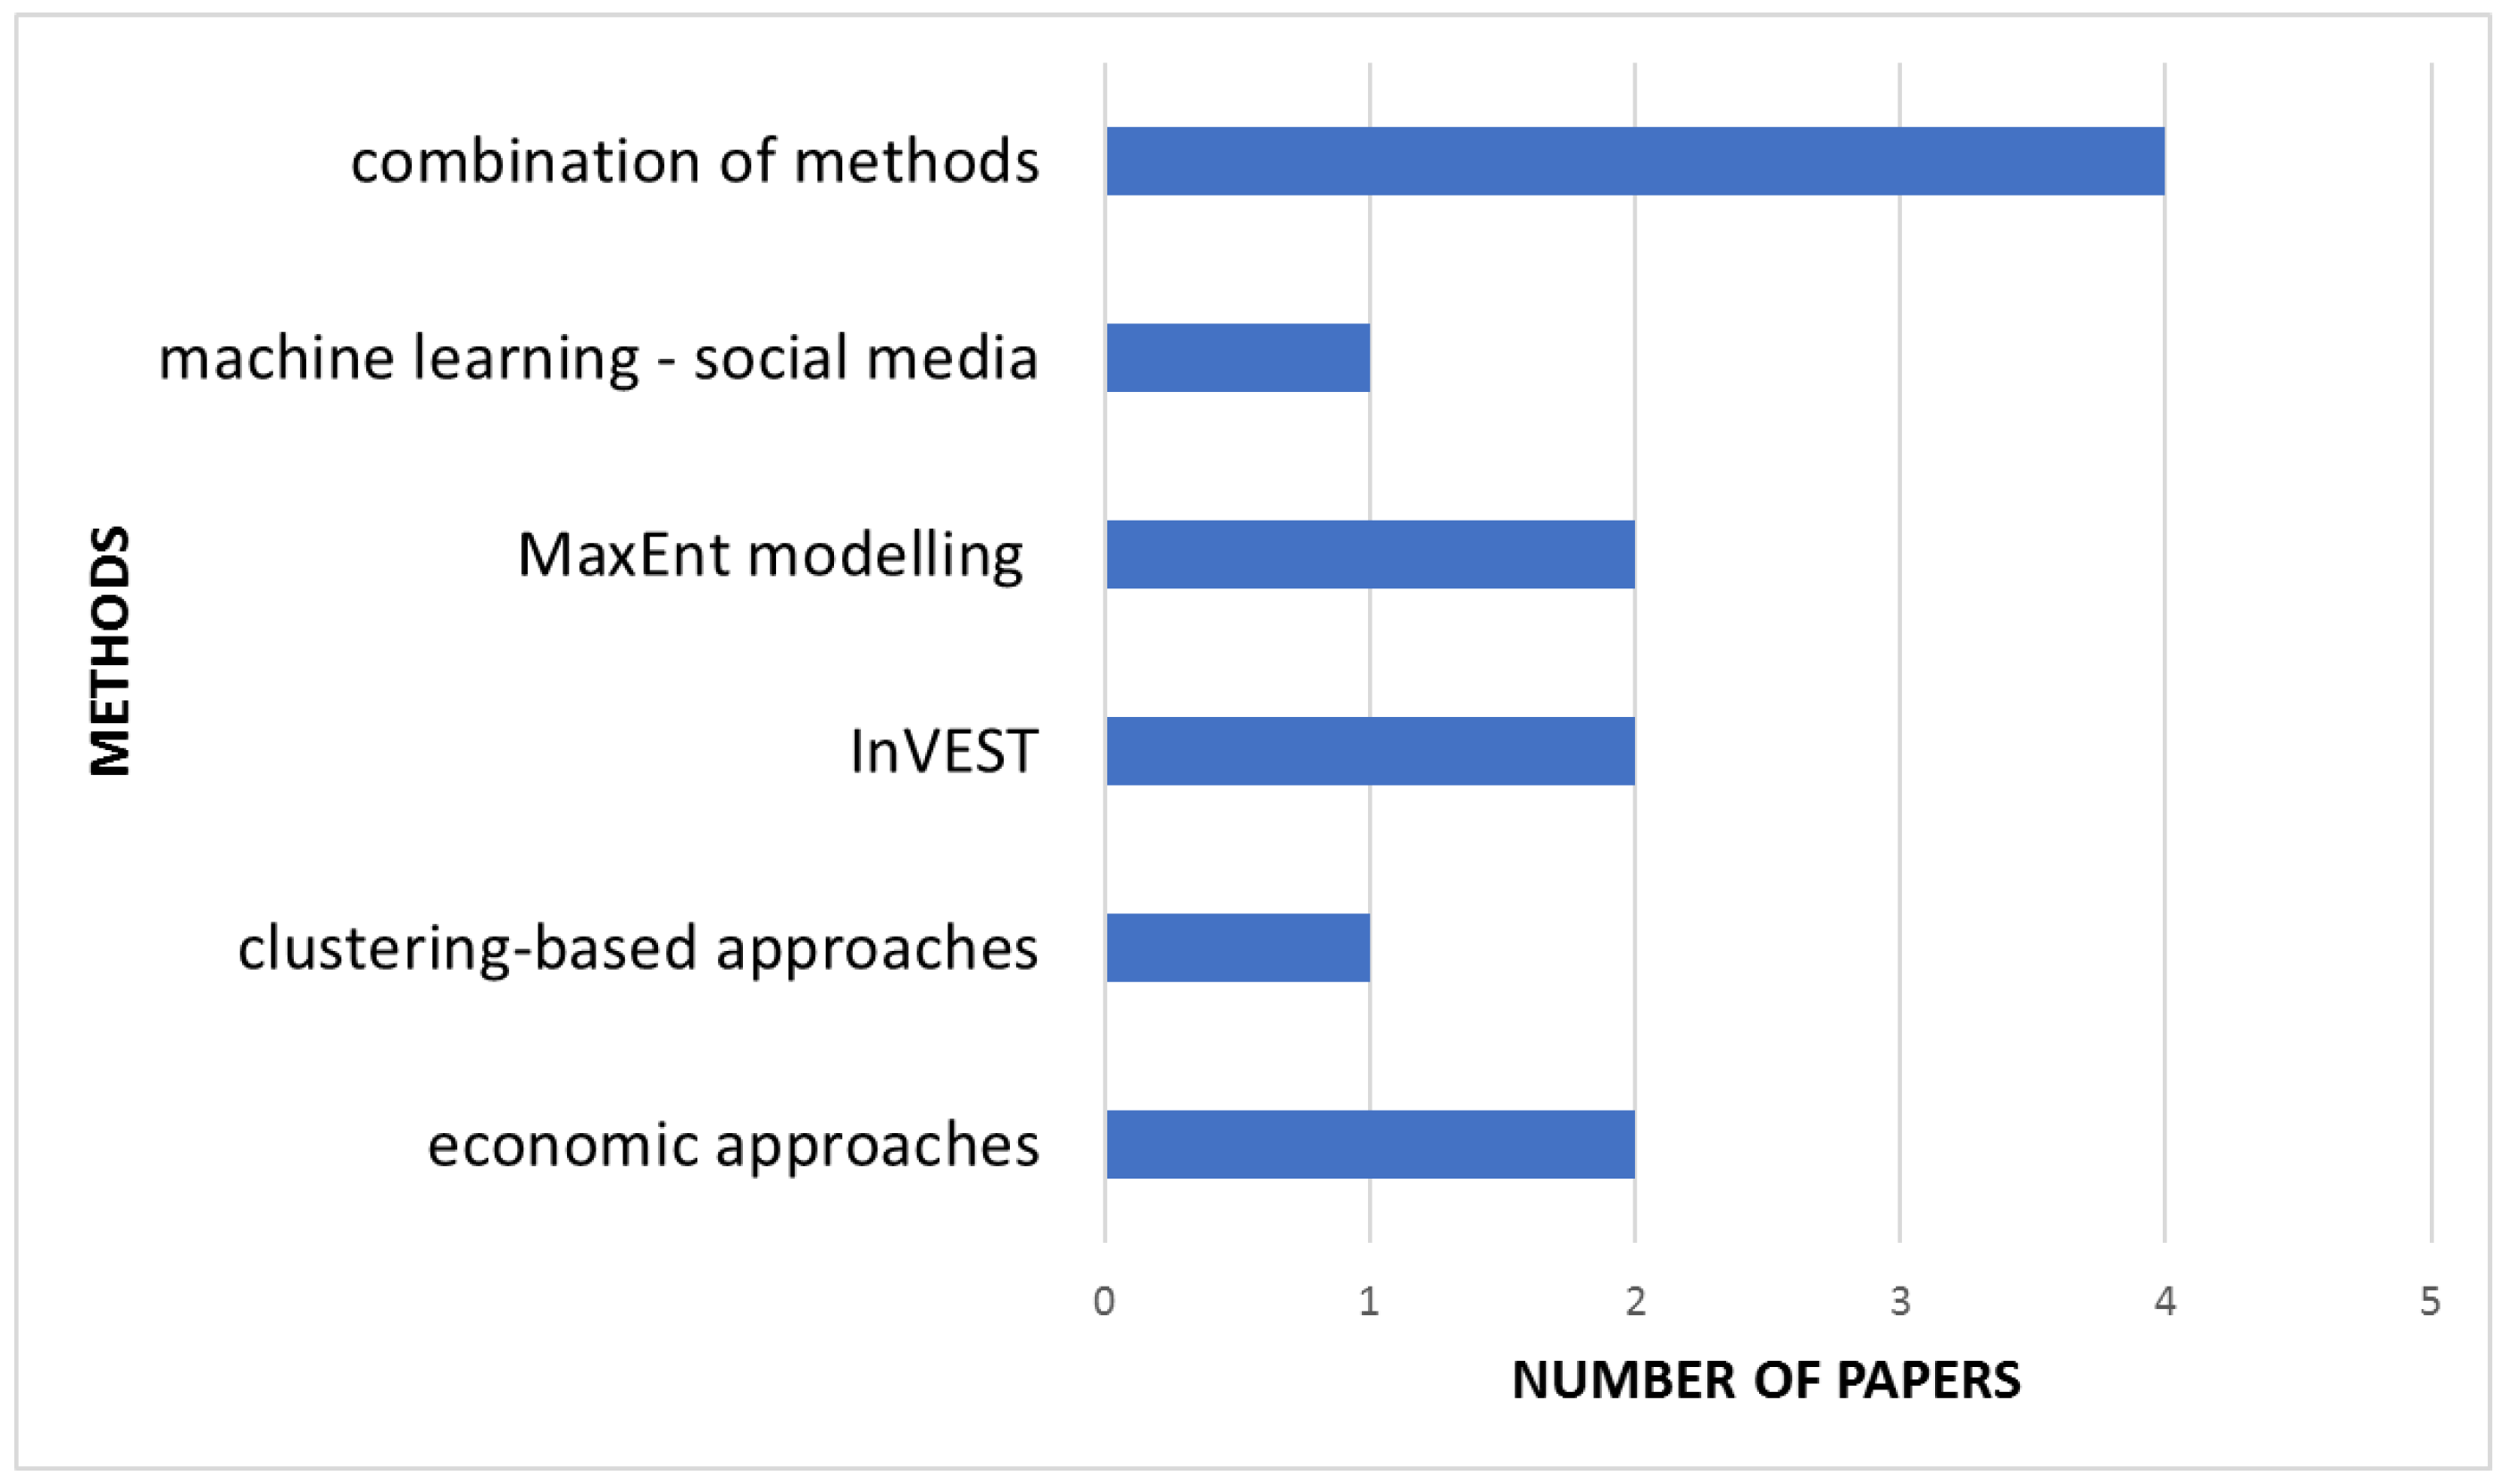
As already mentioned, there were also several papers that combined participatory mapping with other types of mapping methods (Figure 7). 15% of these papers combined it with economic procedures to assess the spatial distribution of recreational uses (e.g., diving, kayaking) and the economic value of marine biodiversity [10] or of specific marine habitats [67]. 15% of the papers combined participatory mapping with InVEST modeling to map the cumulative risk per type of habitat from activities undertaken by direct users in Brazil [66,77]. Another, 15% joined it with maximum entropy models, for instance: [52] used this to map social value distributions for multiple user groups in a coastal national park, in North Carolina. Daymond et al. [70] tried to determine if the PGIS and flicker data identified similar social and environmental drivers of the social values and produced similar predictions. Moreover, 16% of the papers (in equal percentages) combined participatory mapping with other methods, i.e: Blake et al. [71] applied hierarchical cluster analysis based on a dissimilarity matrix to spatially group the participants based on the CES location, in Falkland Islands. Depietri et al. [80] performed content analysis of photographs with machine learning techniques, within the framework of social media-based analysis and compared the results with those of PPGIS to assess CES in green and blue open spaces in a coastal city, in Israel. Finally, most of the papers (36%) combined participatory mapping with the applications of more than one method (combination of methods), i.e : Dasgupta et al. [53], applied the Inverse Distance Weighting (IDW) method to interpolate the values for the unmeasured locations, as well as used Local Mo-ran’s I statistics and hotspot analysis, to map hotspots of non-material values in the Indian Sundarban delta. Besides, Inácio et al. [62], applied a composite (GIS) indicator to map coastal recreation CES supply, while ES flow and demand was assessed through participatory mapping procedure. In the coastal region of Lithuania statistical models were used to map hot and cold spots of CES supply and demand. Finally, Smart et al [49], used PGIS along different types of modelling to quantify impacts of the ‘coastal squeeze’ on ES.
Figure 7. Number of papers per category of mixed participatory mapping approach
Preprints 92346 g007

3.4.2. Other types of mapping approaches

Regarding, other types of mapping approaches, a few papers (4%) applied other so-cial methods (than PGIS) to map and assess CES, i.e: Retka et al.[68] applied social-media analysis to map the density of photographs depicting engagements with different CES, whilst Ruskule et al.[7] applied multi-criteria analysis to examine the suitability of the coastal areas for marine tourism and leisure activities in Latvia. There were also a few strictly economic applications (4%), that applied Global ecosystem service value (ESV) functions to examine ES values for three different years in relation to changes in land use, income and population [55] or Value transfer to assess the feasibility of carbon and ES payments [74], so as to reduce livestock grazing pressure on saltmarshes, using market carbon prices and social costs of carbon.
Moreover, a high proportion of the papers (31%) were mixed mapping approaches (other than mixed PGIS), for instance: A number of papers used social media analysis coupled with maximum entropy modeling [81,82] or with machine learning (for the analysis of photographic dataset) and cluster analysis techniques [83], such as those of Richards & Friess [81] that mapped the probability of occurrence of different types of CES in urban mangrove sites in Singapore. Santos Vieira et al. [83] investigated whether the level of protection (“Strictly protected”, “Sustainable use” and “Unprotected”) was associated with affluence of CES in coastal areas of Brazil. Piñeiro-Corbeira et al. [64], applied Permutational Multivariate Analysis of Variance (PERMANOVA) to test for the influence of several attributes on the responses provided by the users in order to assess ecosystem and seascape services (from a user ’s perspective) and to map underwater trails for snorkeling, in Cíes Archipelago, in Spain. Other papers applied composite (GIS) indicators for the assessment of CES that integrated biophysical, social and managerial aspects [9,43,84].
Furthermore, several papers used InVEST models to map and assess CES [56,59,85]. For instance, Mouttaki et al. [56] mapped the spatial-temporal distribution of CES in Dakhla Bay, Southern Morocco whilst Chung et al. [59] assessed the spatial distributions of habitat risks and ES and explored the trade-offs among them in coastal areas of South Korea. Moreover, Fisher et al. [85] compared social media (photograph visits, tweet visits) and telecommunication data (mobile visits) with traditional survey-based measures of visitation rates so as to assess people’s preferences for cultural and natural landscapes. Finally, one paper applied GIS modelling procedures to assess the exposure of Marine ES to threat, under different pressures, in the small Lithuanian sea space [61].

3.5. Valuation Methods Applied

Figure 8 presents the different types of valuation methods per category (monetary, non-monetary, combination of both). A high percentage of the papers (87%) applied non-monetary methods (blue color): 33% used participatory mapping in combination with questionnaires [8,52,62] or personal interviews [23,63,71]. Another 13% applied social media-based analysis, either by applying the InVEST Recreation model, that uses social media data to assess recreation [56,58] or by categorizing and analyzing social media data (mainly photographs) directly, to assess different categories of CES [81,82]. In some cases, social media data was used to assess CES (through the InVEST recreation model) as part of an integrated ES assessment [61] or in the context of a composite indicator [43]. Moreover, 2% of the papers used questionnaires to evaluate CES [64], while another 2% applied document methods [59]. The ‘document method’ estimates CES values from certain individuals or groups by analyzing texts, images, or other forms of materials [50].
Furthermore, 36% of the papers applied multiple non-monetary methods [7,60,69,86]. Half of these papers applied social media based analysis in combination with other revealed preference methods (document methods, observation in the field), [56,58,85,61,68] or in some cases with stated preference methods (e.g., expert based methods, participatory mapping) [9,70,80] There are, though, a few papers (~11%) that applied a variety of methods, such as participatory mapping, personal interviews, participant observation, informal discussions with local community, scenario simulation, as well as included deliberative components (e.g., focus groups/workshops) [49,60,77,86,87].
Another, 5% of the papers applied monetary valuation (orange color) and specifically, the Benefits/Value transfer method [55,74]. Finally, 9% of the papers applied a combi-nation of monetary and non-monetary methods (grey color), for instance: Spanou et al. [75] combined well-being indicators and Hedonic pricing to examine potential trade-offs between CES and marine activities, while Kenter [25] joined contingent valuation, participatory mapping and deliberative assessment to explore contrasts between individual willingness to pay and shared values expressed as group-deliberated fair prices in the Firth of Forth estuary, in Scotland. There were, also market valuation approaches that used participatory mapping to map activities distribution [10,67].

3.6. Techniques, tools and software used

3.6.1. Per category of Desk analysis

As already stated, techniques, tools and software are presented per category of analysis: Spatial analysis, Statistical analysis, Modelling for Ecosystem Services and other types of analysis (Table A1, Appendix A).
Over 89% of the papers applied Spatial analysis, either by applying basic GIS tool and techniques to map and assess CES (e.g., map algebra, overlay techniques, buffer analysis, Euclidean distance, Kernel density analysis, zonal statistics) [9,52,62,63] or more advanced type of spatial analysis, for example: viewshed analysis techniques [9,61] a variety of tools to examine spatial autocorrelation of values, such as Local Moran’s I statistics [53] and Global Moran’s I statistics [78] and semivariograms [23], cluster analysis tools to visualize clusters of high values of ES [62,78], interpolation methods to create a continues surface of values [53,84] land-use and land cover classification methods [62,84], multi-scale spatial analysis techniques [88], as well as other [84].
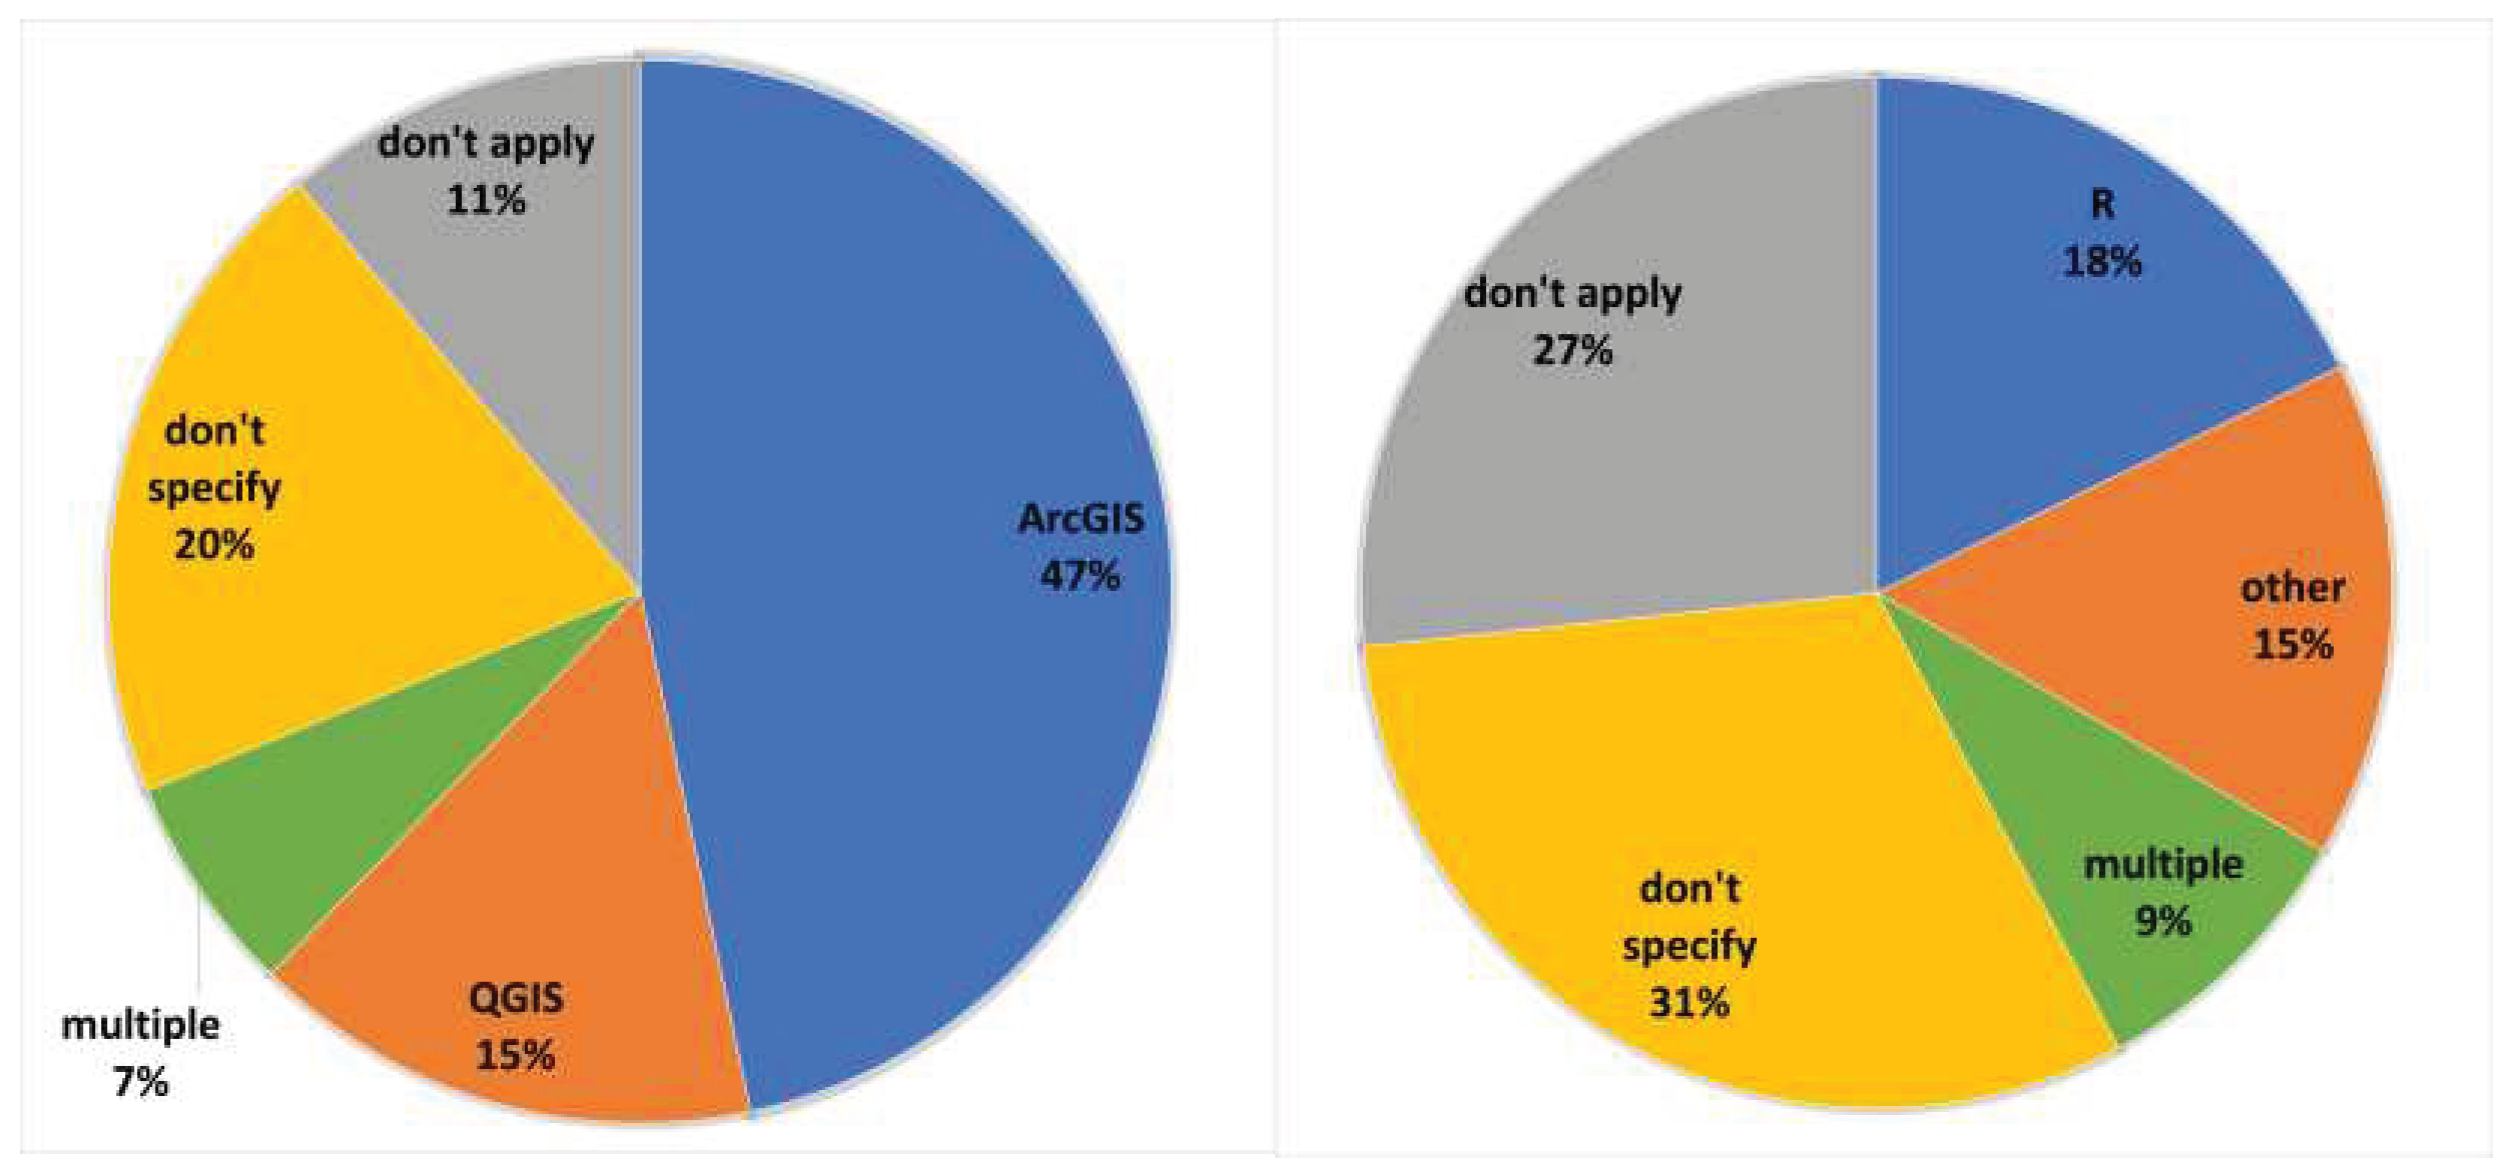
47% of these papers used ArcGIS (Figure 9), 16% the open source software QGIS, 7% multiple software and 20% didn’t specify which software they used, while 11% didn’t apply spatial analysis [86] or applied through InVEST software [58].
A high percentage of papers (73%) used statistical analysis to assess ES by applying a variety of methods (Table 3, Statistical Analysis), as follows:
Chi-square tests to check if the proportion of photographs ( coming from the social media) and user counts for specific CES, varied significantly between categories or between different sites, in social media analysis [68,81] or to examine the distribution of values in relation to different factors (e.g by coastal and non-coastal areas, by type of marine protected area, by access, by population density) [8,57,73]. In some cases, the chi-square independence analysis test was applied along with proportional analysis, that tests dependence [8,57].
Pearson correlation analysis to verify the accuracy of spatial assessment by comparing the results with existing datasets [56,59,85] or to examine for possible relationships between different coastal activities and the reasons that undermine them [72] or to evaluate spatial association between different CES [68].
The non-parametric Spearman's rank correlation coefficient to examine the correlation between different pairs of values (e.g., non-monetary – monetary, non-monetary-threats) [23] and between different CES and CES components (e.g., naturalness, tree density, silent areas, religious sites, accommodation) [62].
Finally, Canonical Correlation Analysis was used to investigate whether coastal activities (e.g., fishing) were correlated with stressors (e.g., overcrowded spaces) [72].
Moreover, in order to compare the distribution across groups a variety of methods applied, such as: Krus-kal-Wallis test, to examine influence of a hub on the likelihood of a location being valued depending on its distance to the nearest hub [63], or to compare the mean ranks of scores for different aspects (e.g., ES) of different livelihood groups [86], or to analyze the difference in the total number of CES locations between groups and to examine the effect of the number of tourist visits on the number of CES points [73]. Krus-kal-Wallis test was also used in combination with other tests (Dunn’s posteriori tests, Steel–Dwass test), [86]. one-way ANOVA, to examine potential differences in the level of habitat risks and the provision of four services between conservation-dominated and reclamation dominated-counties, as well as to examine if several factors—including demographic, socioeconomic, and biophysical determinants are different between groups [59]or to identify the environmental drivers (e.g., distance to nearest road, settlement or airfield for access; distance to the nearest patch of invasive species; and mean slope) that drive the location of CES between different groups [71]. Analysis of similarities –ANOSIM to compare the presence/absence of biotopes between those cells used/not used by divers [10] and Permutational Multivariate Analysis of Variance (PERMANOVA) to test for the influence of several attributes on the responses provided by the users [64].
Furthermore, among other methods applied, were identified:
Linear regression to understand the relationship between socio-demographic variables and perception of non-material values others used [53],
  • Multinomial regression to identify the demographic identity of each group, as well as the environmental drivers that drive the location of CES for each of the groups [71]
  • Multivariate linear regression to assess tourists’ preferences for cultural and natural landscapes (e.g., natural features, land-cover and land-use types, accessibility, and amenities for tourists) using multiple sources of UGC [85]
  • Hierarchical cluster analysis to identify spatial groups of participants based on the dissimilarity matrix [71] or to group similar types of photographs by using the photographs’ keywords [83] and
  • k-means cluster analysis of the Flickr users to better contextualize the types and association of CES engagement at the user level [68].
  • Principal Component Analysis (PCA) to compare the results of different methods [80].
  • other methods for the analyses of survey data, for examining discrete choices and for text analysis of social media data (e.g., multiple group method, mixed logit models; Bigram Language Model) [25,75,82]
18% of the papers used R, (Figure 10), 16% other statistical software (e.g., SPSS, Statistica, SAS,) and some more specialized (e.g., NLOGIT, PRIMER) and 9% used multiple software. There were also papers (31%) that didn’t specify which software was used or that didn’t apply statistical analysis (27%).
Figures 9–10. Percentages of papers per type of GIS and Statistical software
Preprints 92346 g009
Besides, 24% of the papers used tools and software specifically developed for ES assessment (Modelling for ES), see also Table A1 in the Appendix. The majority of those papers (82%) used InVEST for mapping and assessing ES [56,59,61]. Among the models applied, were included recreation and overlap analysis model in the cases of CES, various other models for the assessment of non-cultural categories of ES (e.g., carbon storage and sequestration, crop production) [49,59], as well as for habitat risk assessment [59,77].
A few papers also applied InVEST linear regression analysis (included in the Recreation model) to estimate the impact of potential landscape features (e.g., protected areas, beaches, campsites, roads, attraction sites) in the distribution of visitors [56,58]. As already mentioned, there were also cases of papers (18%) that applied SoLVES (Social Values for Ecosystem Services) combined with maximum entropy modelling (MaxEnt) [52,82]. Finally, 20 % applied other types of analysis that included :
machine learning to automatically assign tags to photographs in social media analysis applications [80,83];
macro-ecological modelling (MaxEnt) to model spatial distribution of different CES in social-media analysis [81];
other types of modelling (e.g., location-based pressure model, future dynamic land change model) to assess CES along with other ES [49,61];
Finally, there was a unique paper that applied habitat mapping using a variety of softwares for image and video processing (e.g., photoQuad software) [66].

3.6.2. Participatory techniques tools and software

Almost, 9% of the papers applied decision making techniques and software, such as Spatial Multi-criteria Decision Analysis Methods (MCDA) [70], as well as other methods to support decision making (Analytic Hierarchy Process -AHP, Analytic Network Process -ANP method, Strategic Options Development Analysis -SODA approach) [9,69] (Table 4).
Moreover, almost 35% of the participatory mapping applications used web-based surveys for data collection. The majority of these studies used the Google Maps platform [8,52,57]. Among the other technologies used, were: Scribble Maps [80], ESRI ’s Survey123 for ArcGIS platform [62], Greenmapper survey tool [54] and SeaSketch [65], a web-based tool for participatory marine spatial planning (Table 4).

4. Discussion

Nowadays, there is an increasing research interest in CES. In the context of MSP, though, even if there have been some direct attempts to reflect on CES, the majority of the reports are those that consider CES in the context of marine and coastal environments for an efficient marine management (ecosystem-based management, MPAs etc.), rather than specifically for achieving an integrated Maritime Spatial Planning (MSP) [7,8,61,63,70]
The majority of the papers were authored by the scientific and research community and concerning the geographic distribution, a high percentage is observed in the Atlantic Ocean and especially in its North East part (mostly in UK), while other sea-basins, such as the Mediterranean Sea, remain under-studied; most of the Mediterranean case studies were performed in Italy, Greece and Israel [43,67,69,79,80,89,90].
In 2016, it was reported by [91] that most of the publications were identified in Europe, and specifically in the UK. In our times (seven years later), though, a relatively high number of publications were also found in other continents, such as in Asia, a few in America (Brazil), as well as in Africa (Morocco). Most of these papers are of regional or local scope, while applications at national scale are mostly located in UK, Europe, Latvia and Lithuania as well as in Asia and another in Brazil [10,59,61,62,75,81,83]. In addition, there was a lack of sea-basin centered studies and coastal zone applications. It should be noted, that in this case the publications were categorized based on administrative levels.
Furthermore, one third of the articles focused on coastal and marine ecosystems and one fifth specifically on the marine environment. Also, a few papers assessed usage of CES (mostly recreational activity) in relation to specific coastal and marine habitats (e.g., mangroves, reefs) [66,67,81].
Besides, a high number of publications (69%) involved stakeholders and almost one fourth of the papers involved highly diverse groups of stakeholders (mixed groups) [8,69,70,80]. It becomes evident that stakeholders’ involvement is an important component of an effective mapping and assessment of CES, especially during the MSP process [92] and that isolation of user groups fails to address potential conflicts and may misdirect planning and development.
It is impressive that almost half of the research used Mixed mapping approaches, such as applications of participatory mapping or social media analysis (coupled with other types of mapping) [10,82] InVEST modelling [59] composite indicators [9,43], modelling procedures [61], as well as combinations of the above [49,61,62,85].
A high percentage (>50%) of these approaches were participatory mapping applications. In total, more than 55% of the papers applied participatory mapping to assess CES. This is also confirmed by Nahuelhual et al. [93] stating that the preferred mapping approaches were either social value mapping or indicators based on touristic preference. Besides, the coupling of participatory mapping with other methods served as a means, for:
evaluating differences between user groups in the spatial distribution of CES values and the environmental drivers that influence it [52,71].
assessing clustering of ES values in relation to land use and land cover categories [53,78]
assessing the economic value of recreational uses [10,67].
comparing the results of different methods [70,80].
mapping different aspects of ES (supply, demand, flow) [62]
assessing risk from undertaken activities [49,66,77] or threats from specific pressures.
Moreover, Social mapping approaches, followed with participatory mapping have also been applied on most occasions (~89%), while strictly economic approaches concerned a few cases of benefit transfer valuation [55,74].
Τhe integration of socio-cultural values into management and the assessment of CES, not in monetary terms but on their importance to the communities has grown to major issue. Nevertheless, several factors should be considered for influencing participatory mapping outcomes, such as: social value concept and typology, spatial scale, familiarity with the study area, stakeholders background, the elicitation questions, and others [94,95].
Moreover, social media analysis is the next method in line for mapping and assessing CES, either by applying InVEST recreation model or by analyzing social-media data directly in a GIS. According to [81], such data could become an important tool in CES assessment as they can deliver a good overview of the cultural uses of a site. Moreover, the type, volume and scale of information on CES that could be derived from social media data greatly extents from that of traditional survey methods [68]. Nevertheless, the results of social media analysis may not be representative of all social groups [96]. Moreover, the use of benefit indicators (e.g., visitation data) to map CES supply could lead in misleading during planning [43]. As Richards & Friess [81] point out, social media data may not be viable in remote areas. It could be used, though as a proxy to map the density of infrastructures regarding recreation [97]. Overall, social media data, and in general benefit indicators [10], are more suitable measures for CES demand [85].
Regarding valuation, a relatively low percentage of papers (~11%) applied a series of non-monetary methods, as well as deliberative components [49,60,77,86]; According to Klain and Chan [23], especially in the case of many intangible values (such as, spiritual, education, sense of place), which are underrepresented spatially and quantitatively, the uses of deliberative methods is necessary for their proper inclusion into planning. Additionally, in a deliberative process people may come to express shared values, instead of individual values [94].
The discussion over shared values is important, especially where there is evidence of potential synergies or conflicts [91]. According to [94], the combination of different social valuation methods could provide different insights by addressing different aspects of socio-cultural values. Nevertheless, participatory mapping in a deliberative context could influence the map outcomes [95], thus needing experienced facilitators [94].
In contrast, monetary valuation papers were value transfer applications [55,74]. Primary monetary valuation studies mostly applied at the local scale, while the information for decision-making is mostly needed in national and regional scale. Value transfers provide the means to obtain this information [96]. However, there are some methodological challenges regarding Value transfer to be considered [98]. Furthermore, a few papers combined monetary and non-monetary methods [10,25,67,75] two of which have been based on Market price valuation of recreation and tourism [10,67]. As Jobstvogt et al. [99] argue, market price valuation cannot account for several use values that they provide considerable wellbeing, while stated preference methods (such as, contingent valuation) can elicit use, as well as non-use values. Kenter [25] assessed shared values of ecosystem services by combining deliberative monetary valuation, systems modelling and participatory mapping. His results suggested that many of these place-based CES would have been underestimated by monetary valuation alone, and that deliberation process could have an impact on value formation. As Scholte et al. [94] stated “the integration of monetary valuations and ecological assessments with socio-cultural valuations does not only entail adding the different parts, but also entails capturing the interactions between them”.
Furthermore, a multitude of techniques and tools were used for the mapping and assessment of CES, as well as a variety of software, especially statistical. Most of these techniques and tools were related to spatial and statistical analysis. A notable number of publications [8,10,53,56,57,58,62,63,68,73,81,85] applied statistical analysis with main goal the examination of the distribution of values in relation to various factors such as: environmental factors (distance to protected areas and ecosystems, naturalness, presence/absence of biotopes, etc.), socio-economic factors (land-cover and land-use types, distance to hubs, access, population density etc.), as well as demographic factors (age, gender, employment, education, etc.) [53,63]. According to Scholte et al. [94] information about the relationship of social values with spatial characteristics can better inform spatial planning. Based on the results of Kobryn et al. [8], the location of values is greatly influenced by aspects of policy and planning, such as access, population density and tenure. According to them, places where diverse values are encountered have greater potential for conflict and a deliberative approach is necessary especially in the zone of 2 km distance from the coast [8].
Finally, it seems there is a gap in PPGIS/WebGIS application concerning the assessment of coastal and marine Ecosystem Services. On a European level, the PERICLES project focused on better understanding tangible and intangible coastal and maritime heritage, including cultural, industrial and natural heritage [100]. There is also the example of the WebGIS based project for the Falkland Islands, which provided spatial data on the social values of CES [63,101]. The availability of efficient decision-support tools to enhance stakeholders’ engagement is a precondition of a successful MSP. Participatory internet-based tools could assist the representation of many different views and their inclusion in planning and management [102].
This review is certainly presenting some limitations. First, publications that did not refer to the MSP related terms (such as “marine spatial planning”, “coastal planning” etc. were excluded from the search. Nevertheless, the overall results on the preferred mapping approaches regarding CES, agree with those of Nahuelhual et al. (2020) [93]. Second, the review also focused on publications dealing with the spatial dimension of CES, with an extra focus on participatory mapping approaches. As a result, the percentages presented on stakeholders’ involvement and on other evaluation methods used, i.e the number of papers that included deverbative components or applied monetary methods, may be, in some cases under or overestimated.

5. Conclusions

The current review drew, an, as far as possible, extensive, and in-depth scanning of the methods, techniques, tools, and software used for mapping and assessing cultural ecosystem services (CES) and provided a detailed presentation of the work established so far. The purpose of this review is to provide guidance to future research on CES in coastal and marine areas and more specifically to inform MSP processes.
In the MSP process, people and stakeholders are often called to value particular locations e.g for recreation access or “culturally significant areas”, and this review provided sufficient evidence on how this can be done in an extremely localized and concrete manner. This means that the concept of CES may interestingly be an important “place-based” approach which is also an MSP principle. In this sense, the assessment of CES may result as an expression of cultural landscapes produced from the interaction between humans and nature. The CES concept can equally support the Ecosystem Approach principle, fully integrated in MSP -also though the Maritime Spatial Planning Directive (MSPD). Hence, mapping, and valuing CES is also important when planning at the lower scales (local, regional), so as to take into account how people value the landscapes and seascapes. This local knowledge should be integrated in MSP and can define its efficiency. The very particular nature of CES also implies that much of their value may be under-estimated by monetary methods, and probably also by instrumental non-monetary approaches. That’s why it is important to collect and analyze practical experiences of their mapping and assessment, and the current review has shed light to this necessary evidence.

Author Contributions

Conceptualization, S.K. and D.K.; methodology, S.K, D.K and M.B ; software, M.B.; validation, S.K., D.K. and M.B.; formal analysis, S.K, D.K and M.B; investigation, S.K. and M.B; resources, S.K., D.K. and M.B.; data curation, M.B.; writing—original draft preparation, S.K, M.B and D.K; writing—review and editing, S.K, D.K and M.B ; visualization, M.B.; supervision, S.K. and D.K; project administration, S.K. and D.K; funding acquisition, S.K. All authors have read and agreed to the published version of the manuscript.

Funding

This research is based on the project entitled “Developing an observation network for MCH/UCH in Greece” (HER-SEA) funded by the Hellenic Foundation for Research and Innovation, grant number A.Π. 44180/13.02.2022.

Conflicts of Interest

The authors declare no conflict of interest.

Appendix A

Table A1. Methods, techniques, models, and tools per type of analysis.
Type of Desk analysis Methods, Techniques, Models, Tools Software and tools used
Spatial Analysis (GIS) Basic techniques and tools (kernel density tool, point density tool, line density tool; zonal statistics; buffer technique; intersect; spatial join; map algebra; ′′XY to Line ” tool; extract multivalues to points tool; bootstrap sampling technique; minimum Euclidean distance; cost distance; Calculate Distance Band from Neighbor Count), viewshed analysis, classification methods (supervised maximum likelihood method), interpolation methods [Inverse Distance Weighting (IDW), Kriging method], spatial autocorrelation [semivariograms, Global Moran’s I tool, Incremental Spatial Autocorrelation tool], cluster analysis [Cluster and Outlier Analysis (Anselin Local Moran’s I), Getis–Ord (Gi*], Multiscale Geographically Weighted Regression (MGWR) (1), radiometric calibration and atmospheric correction of images (2), NDVI (Normalized Difference Vegetation Index) (2) ArcGIS, QGIS, Python (1) (Python spatial analysis library – PySAL), ENVI (2)
Statistical Analysis chi-square test; proportional analysis; Kruskal-Wallis test, Dunn test; Steel–Dwass test; one-way ANOVA; Analysis of similarities – ANOSIM(1), analysis of similarity percentages (SIMPER)(1); Permutational Multivariate Analysis of Variance (PERMANOVA)(1), multinomial regression, multivariate linear regression, Pearson’s correlation, Spearman correlation analysis, Canonical Correlation Analysis, hierarchical cluster analysis – elbow method, k-means cluster analysis, Principal Component Analysis (PCA), Correspondence analysis (CA), Confirmatory factor analysis (CFA) – multiple group method, mixed logit models (2) Fleiss’ kappa; minimum/maximum method normalization method; Shapiro–Wilk test; t-test; z-test; Wald test; Wilcoxon’s rank-sum test; multicollinearity tests; Bigram Language Model; meta-regression functions; multiple hedonic pricing OLS regressions Microsoft Excel, R, SPSS, Statistica, SAS studio, JMP Pro, PRIMER(1), NLOGIT(2)
Modelling for Ecosystem Services overlap analysis model, recreation model, Habitat Risk Assessment (HRA) model, habitat quality model, coastal vulnerability model, coastal protection; carbon storage and sequestration, crop production InVEST (Integrated Valuation of Ecosystem Services and Tradeoffs), SoLVES (Social Values for Ecosystem Services)
Other machine learning to automatically assign (1),(2), macro-ecological modelling (3), location-based pressure model(4), future dynamic land change model (5), Sea level rise inundation pressure – spatial model from the National Oceanic and Atmospheric Administra tion’s (NOAA), image processing (6), MaxN routine (7) Cloud computing platform Clarifai (1), Google Cloud Vision API (2), MaxEnt (3), python – Tools4MSP (4), FUTure Urban-Regional Environment Simulation (FUTURES)(5), photoQuad software (6), EventMeasure (SeaGIS) software (7)
Table A2. European funded PPGIS/WebGIS platforms related to CES, built by EU funded projects.
Title, Acronym, duration and Lead partner of the project Focus Innovation
Acheivement
References
HERitage in CULtural landscapES
HERCULES, 2013-2016 Humboldt University in Berlin
Focused on preserving cultural landscapes through the empowerment of public and private actors.(such as, PPGIS and crowdsourcing technologies) for the assessment of cultural landscapes in different spatial scales (local, national, pan-European), as well as in eight cases studies of different countries (Estonia, Greece, Switzerland, France, Spain, UK, Netherlands, and Sweden. Use of innovating technologies and tools. Through the Knowledge Hub platform communication amongst stakeholders and the general public was achieved. [103,104].
Claudia, B. et al. D3.1 List and Documentation of Case Study Landscapes Selected for HERCULES. WP3 Landscape-Scale Case Studies (Short-Term History).; 2014;
Trommler, K.; Plieninger, T. Sustainable Futures for Europe’s Heritage in Cultural Landscapes: Tools for Understanding, Managing, and Protecting Landscape Functions and Values.; MID-TERM ASSESSMENT REPORT; HERCULES, FP7, Collaborative Project: Berlin / Copenhagen, 2015;
LIFE-IP 4 Natura Project

Integrated actions for the conservation and management of Natura 2000 sites, species, habitats and ecosystems,

2018-2025
Provided a web-based PPGIS, developed by Greek academia, government and NGOs. PPGIS/webGIS which presents ES provided by Greek ecosystems (such as timber production, climate regulation, tourism and recreation) and is available for governmental, professional and public use. [105].
Mallinis, G.; Chalkidou, S.; Roustanis, T.; Kokkoris, I.P.; Chrysafis, I.; Karolos, I.-A.; Vagiona, D.; Kavvadia, A.; Dimopoulos, P.; Mitsopoulos, I. A National Scale Web Mapping Platform for Mainstreaming Ecosystem Services in Greece. Ecological Informatics 2023, 78, 102349. https://doi.org/10.1016/j.ecoinf.2023.102349.
Mare Nostrum

funded by the EC under the ENPI CBCMED Programme
A cross-border project exploring new ways of protecting the Mediterranean coastline A web-based PPGIS was developed in order to collect local knowledge and draw eco-heritage trails in the Grand Harbour of Malta [106]
Pellach, C.; Carmon, D.; Teschner, N.; Boral, R. Legal-Institutional Instruments for Integrated Coastal Zone Management (ICZM) in the Mediterranean. Final Report, 2016, MARE NOSTRUM PROJECT; Https://Curs.Net.Technion.Ac.Il/Files/2018/11/Mare-Nostrum-Final-Report.Pdf.
Horizon 2020 REINVENT
Re-inventory-ing Heritage: Exploring the potential of PPGIS to capture heritage values and dissonance, 2016-2018
(Under a Marie Sklodowska-Curie grant agreement for the research of the public participation in cultural heritage management )
Addressed challenges related to the management of cultural heritage in Europe in a cross-border context, using as case study the city of Derry~Londonderry, in North West Ireland. Through MyValuedPlaces (a web-based pilot survey) communities’ values are captured (such as, recreation, spiritual, therapeutic) at multiple scales. The project developed “the first cross-border cultural heritage Atlas” [107,108].
McClelland, A. Spaces for Public Participation: valuing the cross-border landscape in North West Ireland’. Irish Geography 2019, 52(2), 193-211. https://doi.org/10.2014/igj.v52i2.1401.
McClelland, A. Towards a Cross-Border Cultural Heritage Atlas for the North West: Data Availability, Webhosting and Guiding Principles for the GIS Mapping of Heritage Inventory and Other Datasets.; 1; National Institute for Regional and Spatial Analysis (NIRSA), Maynooth University Social Science Institute (MUSSI), 2016;
PERICLES project
Preserving and sustainably governing cultural heritage and landscapes in European coastal and maritime regions, 2018-2021
Funded by Horizon 2020.
PERICLES promoted sustainable, participatory governance of maritime cultural heritage in European coastal and maritime regions through an interdisciplinary and geo-graphically wide-ranging approach. The project developed an online mapping platform called “MapYourHeritage” for the collection of data on tangible and intangible cultural heritage on eight European regions (e.g., Aegean Sea, Brittany, Denmark). The aim of the portal was to provide an opportunity for the public to engage with coastal and marine cultural heritage. [100].
Kenter, J.; Cambridge, H. Interactive Online CH Mapping Portal. PrEseRvIng and Sustainably Governing Cultural Heritage and Landscapes in European Coastal and Maritime regionS, PERICLES_D3.1_v2.0 Dissemination Level: PU, 2019.;
Source : CORDIS database and Google. The majority of the projects assessed CES as a subset of other conceptual frameworks (e.g., cultural landscape). Additionally, only two of the projects were focusing on the coastal or marine environment and, on ICZM or MSP.
Table A3. Summary guide of the European funded PPGIS/WebGIS platforms related to CES.
PPGIS/
WebGIS platforms
Project
Acromym
General Framework Participatory mapping - CES mapped. ES focused Participatory mapping Focus on Coastal or Marine enviroment ICZM/ MSP Source
Knowledge Hub HERCULES cultural landscape – ecosystem services outdoor activities, social interactions, aesthetic values, beautiful landscape or landmark, inspirational, spiritual or religious place, feeling or value, appreciation of a specific place as such, independently of any benefit to humans yes no no CORDIS database
ppGIS/webGIS LIFE-IP 4 NATURA LIFE-IP 4 NATURA Ecosystem Services cultural heritage, enviromental education and research, recreation and tourism in nature, aesthetics, spiritual and religious importance yes no no Google
Grand
Harbour Charter
Mare Nostrum project cultural & ecological values eco-heritage trails no yes yes Google
MapYourHeritage PERICLES maritime cultural
heritage
cultural, industrial and natural heritage no yes yes CORDIS database
REINVENT Project Mapping Viewer REINVENT cultural heritage -
landscape values
aesthetic, economic, recreational, therapeutic, social, biological diversity, life sustaining, spiritual, intrinsic, wilderness, social, heritage yes no no CORDIS database

References

  1. Cabral, H.; Fonseca, V.; Sousa, T.; Costa Leal, M. Synergistic Effects of Climate Change and Marine Pollution: An Overlooked Interaction in Coastal and Estuarine Areas. Int. J. Environ. Res. Public Health 2019, 16, 2737. [Google Scholar] [CrossRef] [PubMed]
  2. Hattam, C.; Atkins, J.P.; Beaumont, N.; Bӧrger, T.; Böhnke-Henrichs, A.; Burdon, D.; De Groot, R.; Hoefnagel, E.; Nunes, P.A.L.D.; Piwowarczyk, J.; et al. Marine ecosystem services: Linking indicators to their classification. Ecol. Indic. 2015, 49, 61–75. [Google Scholar] [CrossRef]
  3. Sousa, L.P.; Alves, F.L. A model to integrate ecosystem services into spatial planning: Ria de Aveiro coastal lagoon study. Ocean. Coast. Manag. 2020, 195, 105280. [Google Scholar] [CrossRef]
  4. Ivarsson, M.; Magnussen, K.; Heiskanen, A.-S.; Navrud, S.; Viitasalo, M. Ecosystem services in MSP, Ecosystem services approach as a common Nordic understanding for MSP; Nordic Council of Ministers: Copenhagen K, Denmark, 2017; p. 536. [Google Scholar]
  5. Pennino, M.G.; Brodie, S.; Frainer, A.; Lopes, P.F.M.; Lopez, J.; Ortega-Cisneros, K.; Selim, S.; Vaidianu, N. The Missing Layers: Integrating Sociocultural Values Into Marine Spatial Planning. Front. Mar. Sci. 2021, 8, 633198. [Google Scholar] [CrossRef]
  6. Papageorgiou, M.; Kyvelou, S. Aspects of marine spatial planning and governance: adapting to the transboundary nature and the special conditions of the sea. Eur. J. Environ. Sci. 2018, 8, 31–37. [Google Scholar] [CrossRef]
  7. Ruskule, A.; Klepers, A.; Veidemane, K. Mapping and assessment of cultural ecosystem services of Latvian coastal areas. One Ecosyst. 2018, 3, e25499. [Google Scholar] [CrossRef]
  8. Kobryn, H.T.; Brown, G.; Munro, J.; Moore, S.A. Cultural ecosystem values of the Kimberley coastline: An empirical analysis with implications for coastal and marine policy. Ocean. Coast. Manag. 2018, 162, 71–84. [Google Scholar] [CrossRef]
  9. Nahuelhual, L.; Vergara, X.; Kusch, A.; Campos, G.; Droguett, D. Mapping ecosystem services for marine spatial planning: Recreation opportunities in Sub-Antarctic Chile. Mar. Policy 2017, 81, 211–218. [Google Scholar] [CrossRef]
  10. Ruiz-Frau, A.; Hinz, H.; Edwards-Jones, G.; Kaiser, M.J. Spatially explicit economic assessment of cultural ecosystem services: Non-extractive recreational uses of the coastal environment related to marine biodiversity. Mar. Policy 2013, 38, 90–98. [Google Scholar] [CrossRef]
  11. Guerry, A.D.; Ruckelshaus, M.H.; Arkema, K.K.; Bernhardt, J.R.; Guannel, G.; Kim, C.K.; Marsik, M.; et al. Modeling Benefits from Nature: Using Ecosystem Services to Inform Coastal and Marine Spatial Planning. Int. J. Biodivers. Sci. 2012, 8, 107–121. [Google Scholar] [CrossRef]
  12. Drakou, E.G.; Kermagoret, C.; Liquete, C.; Ruiz-Frau, A.; Burkhard, K.; Lillebø, A.I.; van Oudenhoven, A.P.E.; Ballé-Béganton, J.; Rodrigues, J.G.; Nieminen, E.; et al. Marine and coastal ecosystem services on the science–policy–practice nexus: challenges and opportunities from 11 European case studies. Int. J. Biodivers. Sci. Ecosyst. Serv. Manag. 2017, 13, 51–67. [Google Scholar] [CrossRef]
  13. European MSP Platform. Available online: www.msp-platform.eu (accessed on 26 November 2023).
  14. Millennium Ecosystem Assessment. Ecosystems and Human Well-being: Synthesis; Island Press: Washington, DC, USA, 2015. [Google Scholar]
  15. Satz, D.; Gould, R.K.; Chan, K.M.A.; Guerry, A.; Norton, B.; Satterfield, T.; Halpern, B.S.; Levine, J.; Woodside, U.; Hannahs, N.; et al. The Challenges of Incorporating Cultural Ecosystem Services into Environmental Assessment. Ambio 2013, 42, 675–684. [Google Scholar] [CrossRef] [PubMed]
  16. Fish, R.; Church, A.; Willis, C.; Winter, M.; Tratalos, J.A.; Haines-Young, R.; Potschin, M. Making space for cultural ecosystem services: Insights from a study of the UK nature improvement initiative. Ecosyst. Serv. 2016, 21, 329–343. [Google Scholar] [CrossRef]
  17. Costanza, R.; De Groot, R.; Braat, L.; Kubiszewski, I.; Fioramonti, L.; Sutton, P.; Farber, S.; Grasso, M. Twenty years of ecosystem services: How far have we come and how far do we still need to go? Ecosyst. Serv. 2017, 28, 1–16. [Google Scholar] [CrossRef]
  18. EU Biodiversity Strategy 2020. EUR-lex. Available online: https://eur-lex.europa.eu/EN/legal-content/summary/biodiversity-strategy-for-2020.html (accessed on 26 November 2023).
  19. Schaich, H.; Bieling, C.; Plieninger, T. Linking Ecosystem Services with Cultural Landscape Research. GAIA-Ecol. Perspect. Sci. Soc. 2010, 19, 269–277. [Google Scholar] [CrossRef]
  20. Chan, K.M.A.; Satterfield, T.; Goldstein, J. Rethinking ecosystem services to better address and navigate cultural values. Ecol. Econ. 2012, 74, 8–18. [Google Scholar] [CrossRef]
  21. Chan, K.M.A.; Guerry, A.D.; Balvanera, P.; Klain, S.; Satterfield, T.; Basurto, X.; Bostrom, A.; Chuenpagdee, R.; Gould, R.; Halpern, B.S.; et al. Where are Cultural and Social in Ecosystem Services? A Framework for Constructive Engagement. BioScience 2012, 62, 744–756. [Google Scholar] [CrossRef]
  22. Hernández-Morcillo, M.; Plieninger, T.; Bieling, C. An empirical review of cultural ecosystem service indicators. Ecol. Indic. 2013, 29, 434–444. [Google Scholar] [CrossRef]
  23. Klain, S.C.; Chan, K.M.A. Navigating coastal values: Participatory mapping of ecosystem services for spatial planning. Ecol. Econ. 2012, 82, 104–113. [Google Scholar] [CrossRef]
  24. Brown, G.; Fagerholm, N. Empirical PPGIS/PGIS mapping of ecosystem services: A review and evaluation. Ecosyst. Serv. 2015, 13, 119–133. [Google Scholar] [CrossRef]
  25. Kenter, J.O. Integrating Deliberative Monetary Valuation, Systems Modelling and Participatory Mapping to Assess Shared Values of Ecosystem Services. Ecosyst. Serv. 2016, 21, 291–307. [Google Scholar] [CrossRef]
  26. Cooper, N.; Brady, E.; Steen, H.; Bryce, R. Aesthetic and spiritual values of ecosystems: Recognising the ontological and axiological plurality of cultural ecosystem ‘services’. Ecosyst. Serv. 2016, 21, 218–229. [Google Scholar] [CrossRef]
  27. Murray, G.; D’anna, L.; MacDonald, P. Measuring what we value: The utility of mixed methods approaches for incorporating values into marine social-ecological system management. Mar. Policy 2016, 73, 61–68. [Google Scholar] [CrossRef]
  28. Díaz, S.; Pascual, U.; Stenseke, M.; Martín-López, B.; Watson, R.T.; Molnár, Z.; Hill, R.; Chan, K.M.A.; Baste, I.A.; Brauman, K.A.; et al. Assessing nature's contributions to people. Science 2018, 359, 270–272. [Google Scholar] [CrossRef] [PubMed]
  29. Braat, L.C. Five reasons why the Science publication “Assessing nature’s contributions to people” (Diaz et al. 2018) would not have been accepted in Ecosystem Services. Ecosyst. Serv. 2018, 30, A1–A2. [Google Scholar] [CrossRef]
  30. Gee, K.; Kannen, A.; Adlam, R.; Brooks, C.; Chapman, M.; Cormier, R.; Fischer, C.; Fletcher, S.; Gubbins, M.; Shucksmith, R.; et al. Identifying culturally significant areas for marine spatial planning. Ocean. Coast. Manag. 2017, 136, 139–147. [Google Scholar] [CrossRef]
  31. Halpern, B.S.; Diamond, J.; Gaines, S.; Gelcich, S.; Gleason, M.; Jennings, S.; Lester, S.; Mace, A.; McCook, L.; McLeod, K.; et al. Near-term priorities for the science, policy and practice of Coastal and Marine Spatial Planning (CMSP). Mar. Policy 2012, 36, 198–205. [Google Scholar] [CrossRef]
  32. Fletcher, R.; Baulcomb, C.; Hall, C.; Hussain, S. Revealing Marine Cultural Ecosystem Services in the Black Sea. Mar. Policy 2014, 50, 151–61. [Google Scholar] [CrossRef]
  33. Potts, T.; Burdon, D.; Jackson, E.; Atkins, J.; Saunders, J.; Hastings, E.; Langmead, O. Do marine protected areas deliver flows of ecosystem services to support human welfare? Mar. Policy 2014, 44, 139–148. [Google Scholar] [CrossRef]
  34. Turner, R.K.; Schaafsma, M. Coastal Zones Ecosystem Services. Valuat. Ecosyst. Serv. 2015, 9, 59–75. [Google Scholar] [CrossRef]
  35. Barbier, E.B.; Hacker, S.D.; Kennedy, C.; Koch, E.W.; Stier, A.C.; Silliman, B.R. The value of estuarine and coastal ecosystem services. Ecol. Monogr. 2011, 81, 169–193. [Google Scholar] [CrossRef]
  36. Barbier, E.B.; Hacker, S.D.; Kennedy, C.; Koch, E.W.; Stier, A.C.; Silliman, B.R. The value of estuarine and coastal ecosystem services. Ecol. Monogr. 2011, 81, 169–193. [Google Scholar] [CrossRef]
  37. Luisetti, T.; Turner, R.; Jickells, T.; Andrews, J.; Elliott, M.; Schaafsma, M.; Beaumont, N.; Malcolm, S.; Burdon, D.; Adams, C.; et al. Coastal Zone Ecosystem Services: From science to values and decision making—a case study. Sci. Total Environ. 2014, 493, 682–693. [Google Scholar] [CrossRef] [PubMed]
  38. Ranger, S.; Kenter, J.; Bryce, R.; Cumming, G.; Dapling, T.; Lawes, E.; Richardson, P. Forming shared values in conservation management: An interpretive-deliberative-democratic approach to including community voices. Ecosyst. Serv. 2016, 21, 344–357. [Google Scholar] [CrossRef]
  39. Baulcomb, C.; Fletcher, R.; Lewis, A.; Akoglu, E.; Robinson, L.; von Almen, A.; Hussain, S.; Glenk, K. A pathway to identifying and valuing cultural ecosystem services: An application to marine food webs. Ecosyst. Serv. 2015, 11, 128–139. [Google Scholar] [CrossRef]
  40. Noor, M.I.M.; Alagappar, P.N.; Then, A.Y.-H.; Justine, E.V.; Lim, V.-C.; Goh, H.C. Perspectives of youths on cultural ecosystem services provided by Tun Mustapha Park, Malaysia through a participatory approach. Environ. Educ. Res. 2023, 29, 63–80. [Google Scholar] [CrossRef]
  41. Kenter, J.O.; Bryce, R.; Christie, M.; Cooper, N.; Hockley, N.; Irvine, K.N.; Fazey, I.; O’brien, L.; Orchard-Webb, J.; Ravenscroft, N.; et al. Shared values and deliberative valuation: Future directions. Ecosyst. Serv. 2016, 21, 358–371. [Google Scholar] [CrossRef]
  42. Bryce, R.; Irvine, K.N.; Church, A.; Fish, R.; Ranger, S.; Kenter, J.O. Subjective well-being indicators for large-scale assessment of cultural ecosystem services. Ecosyst. Serv. 2016, 21, 258–269. [Google Scholar] [CrossRef]
  43. Banela, M.; Kitsiou, D. Mapping cultural ecosystem services: A case study in Lesvos Island, Greece. Ocean. Coast. Manag. 2023, 246, 106883. [Google Scholar] [CrossRef]
  44. Barianaki, E.A.; Kyvelou, S.S.; Ierapetritis, D.G. How to Incorporate Cultural Values and Heritage in Maritime Spatial Planning (MSP): A Systematic Review. Preprints 2023, 2023111761. [Google Scholar] [CrossRef]
  45. Brander, L.M.; van Beukering, P.; Balzan, M.; Broekx, S.; Liekens, I.; Marta-Pedroso, C.; Szkop, Z.; Vause, J.; Maes, J.; Santos-Martin, F. Report on Economic Mapping and Assessment Methods for Ecosystem Services. Deliverable D3.2 EU Horizon 2020 ESMERALDA Project, Grant Agreement No. 642007. 2018. [Google Scholar]
  46. Santos-Martín, F.; Plieninger, T.; Torralba, M.; Fagerholm, N.; Vejre, H.; Luque, S.; Weibel, B.; Rabe, S.-E.; Balzan, M.; Czúcz, B. Report on Social Mapping and Assessment methods Deliverable D3.1EU Horizon 2020 ESMERALDA Project, Grant agreement No. 642007. 2018. [Google Scholar]
  47. Santos-Martin, F.; Brander, L.; van Beukering, P.; Vihervaara, P.; Potschin-Young, M.; Liekens, I. Guidance report on a multi-tiered flexible methodology for integrating social, economic and biophysical methods. Deliverable D3.4. EU Horizon 2020 ESMERALDA Project, Grant agreement No. 642007. 2018. [Google Scholar]
  48. Vihervaara, P.; Mononen, L.; Nedkov, S.; Viinikka, A. Biophysical Mapping and Assessment Methods for Ecosystem Services. Deliverable D3.3 EU Horizon 2020 ESMERALDA Project, Grant Agreement No. 642007. 2018. [Google Scholar]
  49. Smart, L.S.; Vukomanovic, J.; Sills, E.O.; Sanchez, G. Cultural Ecosystem Services Caught in a ‘Coastal Squeeze’ between Sea Level Rise and Urban Expansion. Glob. Environ. Chang. 2021, 66, 102209. [Google Scholar] [CrossRef]
  50. Cheng, X.; Van Damme, S.; Li, L.; Uyttenhove, P. Evaluation of Cultural Ecosystem Services: A Review of Methods. Ecosyst. Serv. 2019, 37, 100925. [Google Scholar] [CrossRef]
  51. Sherrouse, B.C.; Semmens, D.J.; Ancona, Z.H. Social Values for Ecosystem Services (SolVES): Open-Source Spatial Modeling of Cultural Services. Environ. Model. Softw. 2022, 148, 105259. [Google Scholar] [CrossRef]
  52. Ancona, Z.H.; Bagstad, K.J.; Le, L.; Semmens, D.J.; Sherrouse, B.C.; Murray, G.; Cook, P.S.; DiDonato, E. Spatial Social Value Distributions for Multiple User Groups in a Coastal National Park. Ocean. Coast. Manag. 2022, 222, 106126. [Google Scholar] [CrossRef]
  53. Dasgupta, R.; Hashimoto, S.; Basu, M.; Okuro, T.; Johnson, B.A.; Kumar, P.; Dhyani, S. Spatial Characterization of Non-Material Values across Multiple Coastal Production Landscapes in the Indian Sundarban Delta. Sustain. Sci. 2022, 17, 725–738. [Google Scholar] [CrossRef]
  54. Sijtsma, F.J.; Mehnen, N.; Angelstam, P.; Muñoz-Rojas, J. Multi-Scale Mapping of Cultural Ecosystem Services in a Socio-Ecological Landscape: A Case Study of the International Wadden Sea Region. Landsc. Ecol. 2019, 34, 1751–1768. [Google Scholar] [CrossRef]
  55. Filho, L.M.; Roebeling, P.; Villasante, S.; Bastos, M.I. Ecosystem Services Values and Changes across the Atlantic Coastal Zone: Considerations and Implications. Mar. Policy 2022, 145, 105265. [Google Scholar] [CrossRef]
  56. Mouttaki, I.; Khomalli, Y.; Maanan, M.; Bagdanavičiūtė, I.; Rhinane, H.; Kuriqi, A.; Pham, Q.B.; Maanan, M. A New Approach to Mapping Cultural Ecosystem Services. Environments 2021, 8, 56. [Google Scholar] [CrossRef]
  57. Brown, G.; Hausner, V.H. An Empirical Analysis of Cultural Ecosystem Values in Coastal Landscapes. Ocean. Coast. Manag. 2017, 142, 49–60. [Google Scholar] [CrossRef]
  58. Cunha, J.; Elliott, M.; Ramos, S. Linking Modelling and Empirical Data to Assess Recreation Services Provided by Coastal Habitats: The Case of NW Portugal. Ocean. Coast. Manag. 2018, 162, 60–70. [Google Scholar] [CrossRef]
  59. Chung, M.G.; Kang, H.; Choi, S.-U. Assessment of Coastal Ecosystem Services for Conservation Strategies in South Korea. PLoS ONE 2015, 10, e0133856. [Google Scholar] [CrossRef]
  60. Chakraborty, S.; Gasparatos, A. Community Values and Traditional Knowledge for Coastal Ecosystem Services Management in the “Satoumi” Seascape of Himeshima Island, Japan. Ecosyst. Serv. 2019, 37, 100940. [Google Scholar] [CrossRef]
  61. Depellegrin, D.; Menegon, S.; Gusatu, L.; Roy, S.; Misiunė, I. Assessing Marine Ecosystem Services Richness and Exposure to Anthropogenic Threats in Small Sea Areas: A Case Study for the Lithuanian Sea Space. Ecol. Indic. 2020, 108, 105730. [Google Scholar] [CrossRef]
  62. Inácio, M.; Gomes, E.; Bogdzevič, K.; Kalinauskas, M.; Zhao, W.; Pereira, P. Mapping and Assessing Coastal Recreation Cultural Ecosystem Services Supply, Flow, and Demand in Lithuania. J. Environ. Manag. 2022, 323, 116175. [Google Scholar] [CrossRef]
  63. Blake, D.; Augé, A.A.; Sherren, K. Participatory Mapping to Elicit Cultural Coastal Values for Marine Spatial Planning in a Remote Archipelago. Ocean. Coast. Manag. 2017, 148, 195–203. [Google Scholar] [CrossRef]
  64. Piñeiro-Corbeira, C.; Barreiro, R.; Olmedo, M.; De la Cruz-Modino, R. Recreational Snorkeling Activities to Enhance Seascape Enjoyment and Environmental Education in the Islas Atlánticas de Galicia National Park (Spain). J. Environ. Manag. 2020, 272, 111065. [Google Scholar] [CrossRef]
  65. Seijo, C.; Calado, H.; McClintock, W.; Gil, A.; Fonseca, C. Mapping Recreational Ecosystem Services from Stakeholders’ Perspective in the Azores. One Ecosyst. 2021, 6, e65751. [Google Scholar] [CrossRef]
  66. Niz, W.C.; Laurino, I.R.A.; Freitas, D.M.D.; Rolim, F.A.; Motta, F.S.; Pereira-Filho, G.H. Modeling Risks in Marine Protected Areas: Mapping of Habitats, Biodiversity, and Cultural Ecosystem Services in the Southernmost Atlantic Coral Reef. J. Environ. Manag. 2023, 345, 118855. [Google Scholar] [CrossRef]
  67. Chimienti, G.; Stithou, M.; Mura, I.D.; Mastrototaro, F.; D’Onghia, G.; Tursi, A.; Izzi, C.; Fraschetti, S. An Explorative Assessment of the Importance of Mediterranean Coralligenous Habitat to Local Economy: The Case of Recreational Diving. J. Environ. Account. Manag. 2017, 5, 315–325. [Google Scholar] [CrossRef]
  68. Retka, J.; Jepson, P.; Ladle, R.J.; Malhado, A.C.M.; Vieira, F.A.S.; Normande, I.C.; Souza, C.N.; Bragagnolo, C.; Correia, R.A. Assessing Cultural Ecosystem Services of a Large Marine Protected Area through Social Media Photographs. Ocean. Coast. Manag. 2019, 176, 40–48. [Google Scholar] [CrossRef]
  69. Cerreta, M.; Clemente, M.; Ettorre, B.; Poli, G. A Multidimensional Approach for Cultural Ecosystem Services (CES) Assessment: The Cilento Coast Case Study (Italy). In Proceedings of the Computational Science and Its Applications – ICCSA 2021, 21st International Conference, Proceedings, Part VII. Cagliari, Italy, 13–16 September 2021; pp. 490–503. [Google Scholar]
  70. Daymond, T.; Andrew, M.E.; Kobryn, H.T. Crowdsourcing Social Values Data: Flickr and Public Participation GIS Provide Different Perspectives of Ecosystem Services in a Remote Coastal Region. Ecosyst. Serv. 2023, 64, 101566. [Google Scholar] [CrossRef]
  71. Blake, D.; Carver, S.; Ziv, G. Demographic, Natural and Anthropogenic Drivers for Coastal Cultural Ecosystem Services in the Falkland Islands. Ecol. Indic. 2021, 130, 108087. [Google Scholar] [CrossRef]
  72. Ocelli Pinheiro, R.; Triest, L.; Lopes, P.F.M. Cultural Ecosystem Services: Linking Landscape and Social Attributes to Ecotourism in Protected Areas. Ecosyst. Serv. 2021, 50, 101340. [Google Scholar] [CrossRef]
  73. Tajima, Y.; Hashimoto, S.; Dasgupta, R.; Takahashi, Y. Spatial Characterization of Cultural Ecosystem Services in the Ishigaki Island of Japan: A Comparison between Residents and Tourists. Ecosyst. Serv. 2023, 60, 101520. [Google Scholar] [CrossRef]
  74. Muenzel, D.; Martino, S. Assessing the Feasibility of Carbon Payments and Payments for Ecosystem Services to Reduce Livestock Grazing Pressure on Saltmarshes. J. Environ. Manag. 2018, 225, 46–61. [Google Scholar] [CrossRef]
  75. Spanou, E.; Kenter, J.O.; Graziano, M. The Effects of Aquaculture and Marine Conservation on Cultural Ecosystem Services: An Integrated Hedonic – Eudaemonic Approach. Ecol. Econ. 2020, 176, 106757. [Google Scholar] [CrossRef]
  76. Gajardo, L.J.; Sumeldan, J.; Sajorne, R.; Madarcos, J.R.; Goh, H.C.; Culhane, F.; Langmead, O.; Creencia, L. Cultural Values of Ecosystem Services from Coastal Marine Areas: Case of Taytay Bay, Palawan, Philippines. Environ. Sci. Policy 2023, 142, 12–20. [Google Scholar] [CrossRef]
  77. Herbst, D.F.; Gerhardinger, L.C.; Vila-Nova, D.A.; de Carvalho, F.G.; Hanazaki, N. Integrated and Deliberative Multidimensional Assessment of a Subtropical Coastal-Marine Ecosystem (Babitonga Bay, Brazil). Ocean. Coast. Manag. 2020, 196, 105279. [Google Scholar] [CrossRef]
  78. Martin, C.L.; Momtaz, S.; Gaston, T.; Moltschaniwskyj, N.A. Mapping the Intangibles: Cultural Ecosystem Services Derived from Lake Macquarie Estuary, New South Wales, Australia. Estuar. Coast. Shelf Sci. 2020, 243, 106885. [Google Scholar] [CrossRef]
  79. Lai, S.; Motroni, S.; Santona, L.; Schirru, M. One Place, Different Communities’ Perceptions. In Mapping Cultural Ecosystem Services in the Asinara National Park (Italy). In Proceedings of the Computational Science and Its Applications – ICCSA 2021, Lecture Notes in Computer Science. Cagliari, Italy, 13–16 September 2021; Springer: Cham, Switzerland, 2021; Volume 12955. [Google Scholar]
  80. Depietri, Y.; Ghermandi, A.; Campisi-Pinto, S.; Orenstein, D.E. Public Participation GIS versus Geolocated Social Media Data to Assess Urban Cultural Ecosystem Services: Instances of Complementarity. Ecosyst. Serv. 2021, 50, 101277. [Google Scholar] [CrossRef]
  81. Richards, D.R.; Friess, D.A. A Rapid Indicator of Cultural Ecosystem Service Usage at a Fine Spatial Scale: Content Analysis of Social Media Photographs. Ecol. Indic. 2015, 53, 187–195. [Google Scholar] [CrossRef]
  82. Zhao, Q.; Chen, Y.; Gone, K.P.; Wells, E.; Margeson, K.; Sherren, K. Modelling Cultural Ecosystem Services in Agricultural Dykelands and Tidal Wetlands to Inform Coastal Infrastructure Decisions: A Social Media Data Approach. Mar. Policy 2023, 150, 105533. [Google Scholar] [CrossRef]
  83. Santos Vieira, F.A.; Vinhas Santos, D.T.; Bragagnolo, C.; Campos-Silva, J.V.; Henriques Correia, R.A.; Jepson, P.; Mendes Malhado, A.C.; Ladle, R.J. Social Media Data Reveals Multiple Cultural Services along the 8.500 Km of Brazilian Coastline. Ocean. Coast. Manag. 2021, 214, 105918. [Google Scholar] [CrossRef]
  84. Ghasemi, M.; Charrahy, Z.; González-García, A. Mapping Cultural Ecosystem Services Provision: An Integrated Model of Recreation and Ecotourism Opportunities. Land Use Policy 2023, 131, 106732. [Google Scholar] [CrossRef]
  85. Fisher, D.M.; Wood, S.A.; Roh, Y.-H.; Kim, C.-K. The Geographic Spread and Preferences of Tourists Revealed by User-Generated Information on Jeju Island, South Korea. Land 2019, 8, 73. [Google Scholar] [CrossRef]
  86. Elwell, T.L.; López-Carr, D.; Gelcich, S.; Gaines, S.D. The Importance of Cultural Ecosystem Services in Natural Resource-Dependent Communities: Implications for Management. Ecosyst. Serv. 2020, 44, 101123. [Google Scholar] [CrossRef]
  87. Anbleyth-Evans, J.; Lacy, S.N.; Aguirre-Muñoz, C.; Tredinnick-Rowe, J. Port Dumping and Participation in England: Developing an Ecosystem Approach through Local Ecological Knowledge. Ocean. Coast. Manag. 2020, 192, 105195. [Google Scholar] [CrossRef]
  88. Chang, P.; Olafsson, A.S. The Scale Effects of Landscape Variables on Landscape Experiences: A Multi-Scale Spatial Analysis of Social Media Data in an Urban Nature Park Context. Landsc. Ecol. 2022, 37, 1271–1291. [Google Scholar] [CrossRef]
  89. Maniatakou, S.; Berg, H.; Maneas, G.; Daw, T.M. Unravelling Diverse Values of Ecosystem Services: A Socio-Cultural Valuation Using Q Methodology in Messenia, Greece. Sustainability 2020, 12, 10320. [Google Scholar] [CrossRef]
  90. Vlami, V.; Kokkoris, I.P.; Zogaris, S.; Kehayias, G.; Dimopoulos, P. Cultural Ecosystem Services in the Natura 2000 Network: Introducing Proxy Indicators and Conflict Risk in Greece. Land 2021, 10, 4. [Google Scholar] [CrossRef]
  91. Martin, C.L.; Momtaz, S.; Gaston, T.; Moltschaniwskyj, N.A. A Systematic Quantitative Review of Coastal and Marine Cultural Ecosystem Services: Current Status and Future Research. Mar. Policy 2016, 74, 25–32. [Google Scholar] [CrossRef]
  92. Węsławski, J.M.; Andrulewicz, E.; Boström, C.; Horbowy, J.; Linkowski, T.; Mattila, J.; Olenin, S.; Piwowarczyk, J.; Skóra, K. Ecosystem goods, services and management. In Biological Oceanography of the Baltic Sea; Snoeijs-Leijonmalm, P., Schubert, H., Radziejewska, T., Eds.; Springer: Dordrecht, The Netherlands, 2017. [Google Scholar] [CrossRef]
  93. Nahuelhual, L.; Vergara, X.; Bozzeda, F.; Campos, G.; Subida, M.D.; Outeiro, L.; Villasante, S.; Fernández, M. Exploring Gaps in Mapping Marine Ecosystem Services: A Benchmark Analysis. Ocean. Coast. Manag. 2020, 192, 105193. [Google Scholar] [CrossRef]
  94. Scholte, S.S.K.; Van Teeffelen, A.J.A.; Verburg, P.H. Integrating Socio-Cultural Perspectives into Ecosystem Service Valuation: A Review of Concepts and Methods. Ecol. Econ. 2015, 114, 67–78. [Google Scholar] [CrossRef]
  95. Nahuelhual, L.; Benra Ochoa, F.; Rojas, F.; Díaz, G.I.; Carmona, A. Mapping Social Values of Ecosystem Services: What Is behind the Map? Ecol. Soc. 2016, 21, art24. [Google Scholar] [CrossRef]
  96. Burkhard, B.; Maes, J. Mapping Ecosystem Services; Pensoft Publishers: Sofia, Bulgaria, 2017. [Google Scholar]
  97. Paracchini, M.L.; Zulian, G.; Kopperoinen, L.; Maes, J.; Schägner, J.P.; Termansen, M.; Zandersen, M.; Perez-Soba, M.; Scholefield, P.A.; Bidoglio, G. Mapping Cultural Ecosystem Services: A Framework to Assess the Potential for Outdoor Recreation across the EU. Ecol. Indic. 2014, 45, 371–385. [Google Scholar] [CrossRef]
  98. Pinke, Z.; Vári, Á.; Kovács, E.T. Value Transfer in Economic Valuation of Ecosystem Services – Some Methodological Challenges. Ecosyst. Serv. 2022, 56, 101443. [Google Scholar] [CrossRef]
  99. Jobstvogt, N.; Watson, V.; Kenter, J.O. Looking below the Surface: The Cultural Ecosystem Service Values of UK Marine Protected Areas (MPAs). Ecosyst. Serv. 2014, 10, 97–110. [Google Scholar] [CrossRef]
  100. Kenter, J.; Cambridge, H. Interactive Online CH Mapping Portal. PrEseRvIng and Sustainably Governing Cultural Heritage and Landscapes in European Coastal and Maritime regionS, PERICLES_D3.1_v2.0 Dissemination Level: PU, 2019.
  101. Golding, N.; Black, B. Final Report from the DPLUS065 Mapping Falklands and South Georgia Coastal Margins for Spatial Planning Project, 2020. SAERI. 102p. Available online: https://Www.Darwininitiative.Org.Uk/Documents/DPLUS027/23882/DPLUS027%20FR%20-%20edited.Pdf (accessed on 10 November 2023).
  102. Patera, A.; Pataki, Z.; Kitsiou, D. Development of a webGIS Application to Assess Conflicting Activities in the Framework of Marine Spatial Planning. JMSE 2022, 10, 389. [Google Scholar] [CrossRef]
  103. Claudia, B.; Bürgi, M.; Le Du-Blayo, L.; Martín, M.; Girod, G.; von Hackwitz, K.; Howard, P.; Karro, K.; Kizos, T.; de Kleijn, M. D3.1 List and Documentation of Case Study Landscapes Selected for HERCULES. WP3 Landscape-Scale Case Studies (Short-Term History). 2014. [Google Scholar]
  104. Trommler, K.; Plieninger, T. Sustainable futures for Europe’s heritage in cultural landscapes: Tools for Understanding, Managing, and Protecting Landscape Functions and Values; mid-term assessment report; Hercules, FP7, Collaborative Project: Berlin/Copenhagen. 2015. [Google Scholar]
  105. Mallinis, G.; Chalkidou, S.; Roustanis, T.; Kokkoris, I.P.; Chrysafis, I.; Karolos, I.-A.; Vagiona, D.; Kavvadia, A.; Dimopoulos, P.; Mitsopoulos, I. A National Scale Web Mapping Platform for Mainstreaming Ecosystem Services in Greece. Ecol. Inform. 2023, 78, 102349. [Google Scholar] [CrossRef]
  106. Pellach, C.; Carmon, D.; Teschner, N.; Boral, R. Legal-Institutional Instruments for Integrated Coastal Zone Management (ICZM) in the Mediterranean. Final Report, 2016, MARE NOSTRUM PROJECT. Available online: Https://Curs.Net.Technion.Ac.Il/Files/2018/11/Mare-Nostrum-Final-Report.Pdf.
  107. McClellandb, A. owards a Cross-Border Cultural Heritage Atlas for the North West: Data Availability, Webhosting and Guiding Principles for the GIS Mapping of Heritage Inventory and Other Datasets.; 1; National Institute for Regional and Spatial Analysis (NIRSA), Maynooth University Social Science Institute (MUSSI). 2016. [Google Scholar]
  108. McClelland, A. Spaces for Public Participation: valuing the cross-border landscape in North West Ireland’. Ir. Geogr. 2019, 52, 193–211. [Google Scholar] [CrossRef]
1
2
Figure 1. Temporal distribution of the examined papers.
Preprints 92346 g001
Figure 2. Spatial distribution of the papers per sea-basin/ocean-sea
Preprints 92346 g002
Figure 3. Spatial distribution of the papers, per country and continent.
Preprints 92346 g003
Figure 4. Focus of papers
Preprints 92346 g004
Figure 5. The number of papers per category of stakeholders engaged in the participatory assessment process
Preprints 92346 g005
Figure 8. The percentages of papers per general valuation approach/method, divided in: 1) Non-monetary (blue color), 2) Monetary (orange color), 3) Combination of both (grey color).
Preprints 92346 g008
Table 1. Search queries.
Search 1 Find Articles with these terms: "marine spatial planning" OR "maritime spatial planning" OR "marine planning" OR "coastal planning"
AND Search in Title, Abstract, Keywords for: "cultural ecosystem services" OR "cultural ecosystem values" OR "intangible benefits" OR "non-material benefits"
Search 2 Search in Title, Abstract, Keywords for: ("cultural ecosystem services" OR "cultural ecosystem values" OR "intangible benefits" OR "non-material benefits") AND (marine OR coastal) AND (“participatory mapping” OR “Participatory GIS” OR PGIS OR “Public Participation GIS” OR PPGIS)
Search 3 Projects, Report Summaries: (“ecosystem services” OR “cultural ecosystem services” OR “cultural eco-system values” OR “cultural values” OR “landscape values” OR “intangible benefits” OR “non-material benefits” OR “natural heritage” OR “eco-heritage”) AND (“participatory mapping” OR “Participatory GIS” OR PGIS OR “Public Participation GIS” OR PPGIS OR “marine spatial planning” OR MSP)
Search 4 Find Articles with these terms: ("cultural ecosystem services" OR "cultural ecosystem values" OR "intangible benefits" OR "non-material benefits") AND (marine OR coastal)
AND Search in Title, Abstract, Keywords for: "ecosystem services" AND (webGIS OR "web-GIS")
Table 2. Method of analysis.
Criteria Categories
Year of publication without time frame
Who scientific community, government/ regional/local authorities,other
Ocean/sea NW Atlantic, West Mediterranean, etc.
Continent/country Asia/China, Europe/UK, Australia/New Zealand, North America/USA, etc.
Scale of paper basin-centered, national, regional (region of country, county of region, etc.), local (1 or more municipalities), coastal zone (landwards and seawards), multi-scale, comparative papers
Ecosystem assessed coastal, marine, coastal and marine
MSP focused yes, no
CES focused Yes, no
Stakeholders category residents, specific stakeholders, scientists, mixed groups of stakeholders, no stakeholder’s engagement
Mapping approaches & methods (focused on CES) Social methods (participatory mapping, social media-based, etc.), Economic methods (hedonic pricing, value transfer, etc.), Mixed methods (mixed participatory mapping, other)
Valuation types & methods Monetary (hedonic pricing, travel cost, deliberative valuation, etc.), Non-monetary (participatory mapping, personal interviews, questionnaires, etc.), Combination of both
Table 3. Classification and description of the mapping approaches.
Type of method
Biophysical methods They include direct (e.g., remote sensing and earth observation) or indirect measurement (remote sensing and earth observation derives, use of statistical data, spatial proxy methods) and modelling (e.g., macro-ecological models, statistical models, conceptual models).
Social methods They measure individual and collective preferences for mapping and assessing ES (e.g., official statistics, personal interviews, participatory mapping, focus groups)
Economic methods It is a group of methods that have been developed for estimating the economic value of ES (e.g., hedonic pricing, market value, value transfer);
Mixed methods They refer to mapping approaches that link or integrate methods and information from different disciplines (biophysical, social, economic)
Table 4. Participatory methods, techniques and tools, software.
Participatory Methods, Techniques, Tools Software used
Decision making Spatial Multi-Criteria Decision Analysis - SMCDA [GeoTOPSIS] (1), Analytic Hierarchy Process (AHP) (2), Analytic Network Process (ANP) method (3), Strategic Options Development Analysis (SODA) approach (4), QGIS (1), IDRISI SELVA (2), Super Decisions software (3), Decision Explorer software (4)
Web-based surveys Google Maps platform, Scribble Maps, ESRI ’s Survey123, Greenmapper survey tool, SeaSketch
Disclaimer/Publisher’s Note: The statements, opinions and data contained in all publications are solely those of the individual author(s) and contributor(s) and not of MDPI and/or the editor(s). MDPI and/or the editor(s) disclaim responsibility for any injury to people or property resulting from any ideas, methods, instructions or products referred to in the content.
Copyright: This open access article is published under a Creative Commons CC BY 4.0 license, which permit the free download, distribution, and reuse, provided that the author and preprint are cited in any reuse.
Alerts
Prerpints.org logo

Preprints.org is a free preprint server supported by MDPI in Basel, Switzerland.

Subscribe

© 2025 MDPI (Basel, Switzerland) unless otherwise stated