Submitted:
05 December 2023
Posted:
06 December 2023
You are already at the latest version
Abstract
Keywords:
1. Introduction
2. Materials and methods
2.1. Sample collection
2.2. Bacterial growth studies
2.3. pH measurement
2.4. Metagenomics analysis of raw milk
2.4.1. Raw milk DNA extraction and processing
2.4.2. Library construction and sequencing
2.4.3. Data analysis
2.5. Metabolomics analysis of raw milk
2.5.1. Metabolite extraction
2.5.2. LC-MS/MS analysis
2.5.2.1. Chromatographic separation
2.5.2.2. Mass spectrometry acquisition
2.5.3. Data pre-processing
2.6. Statistical analysis
3. Results
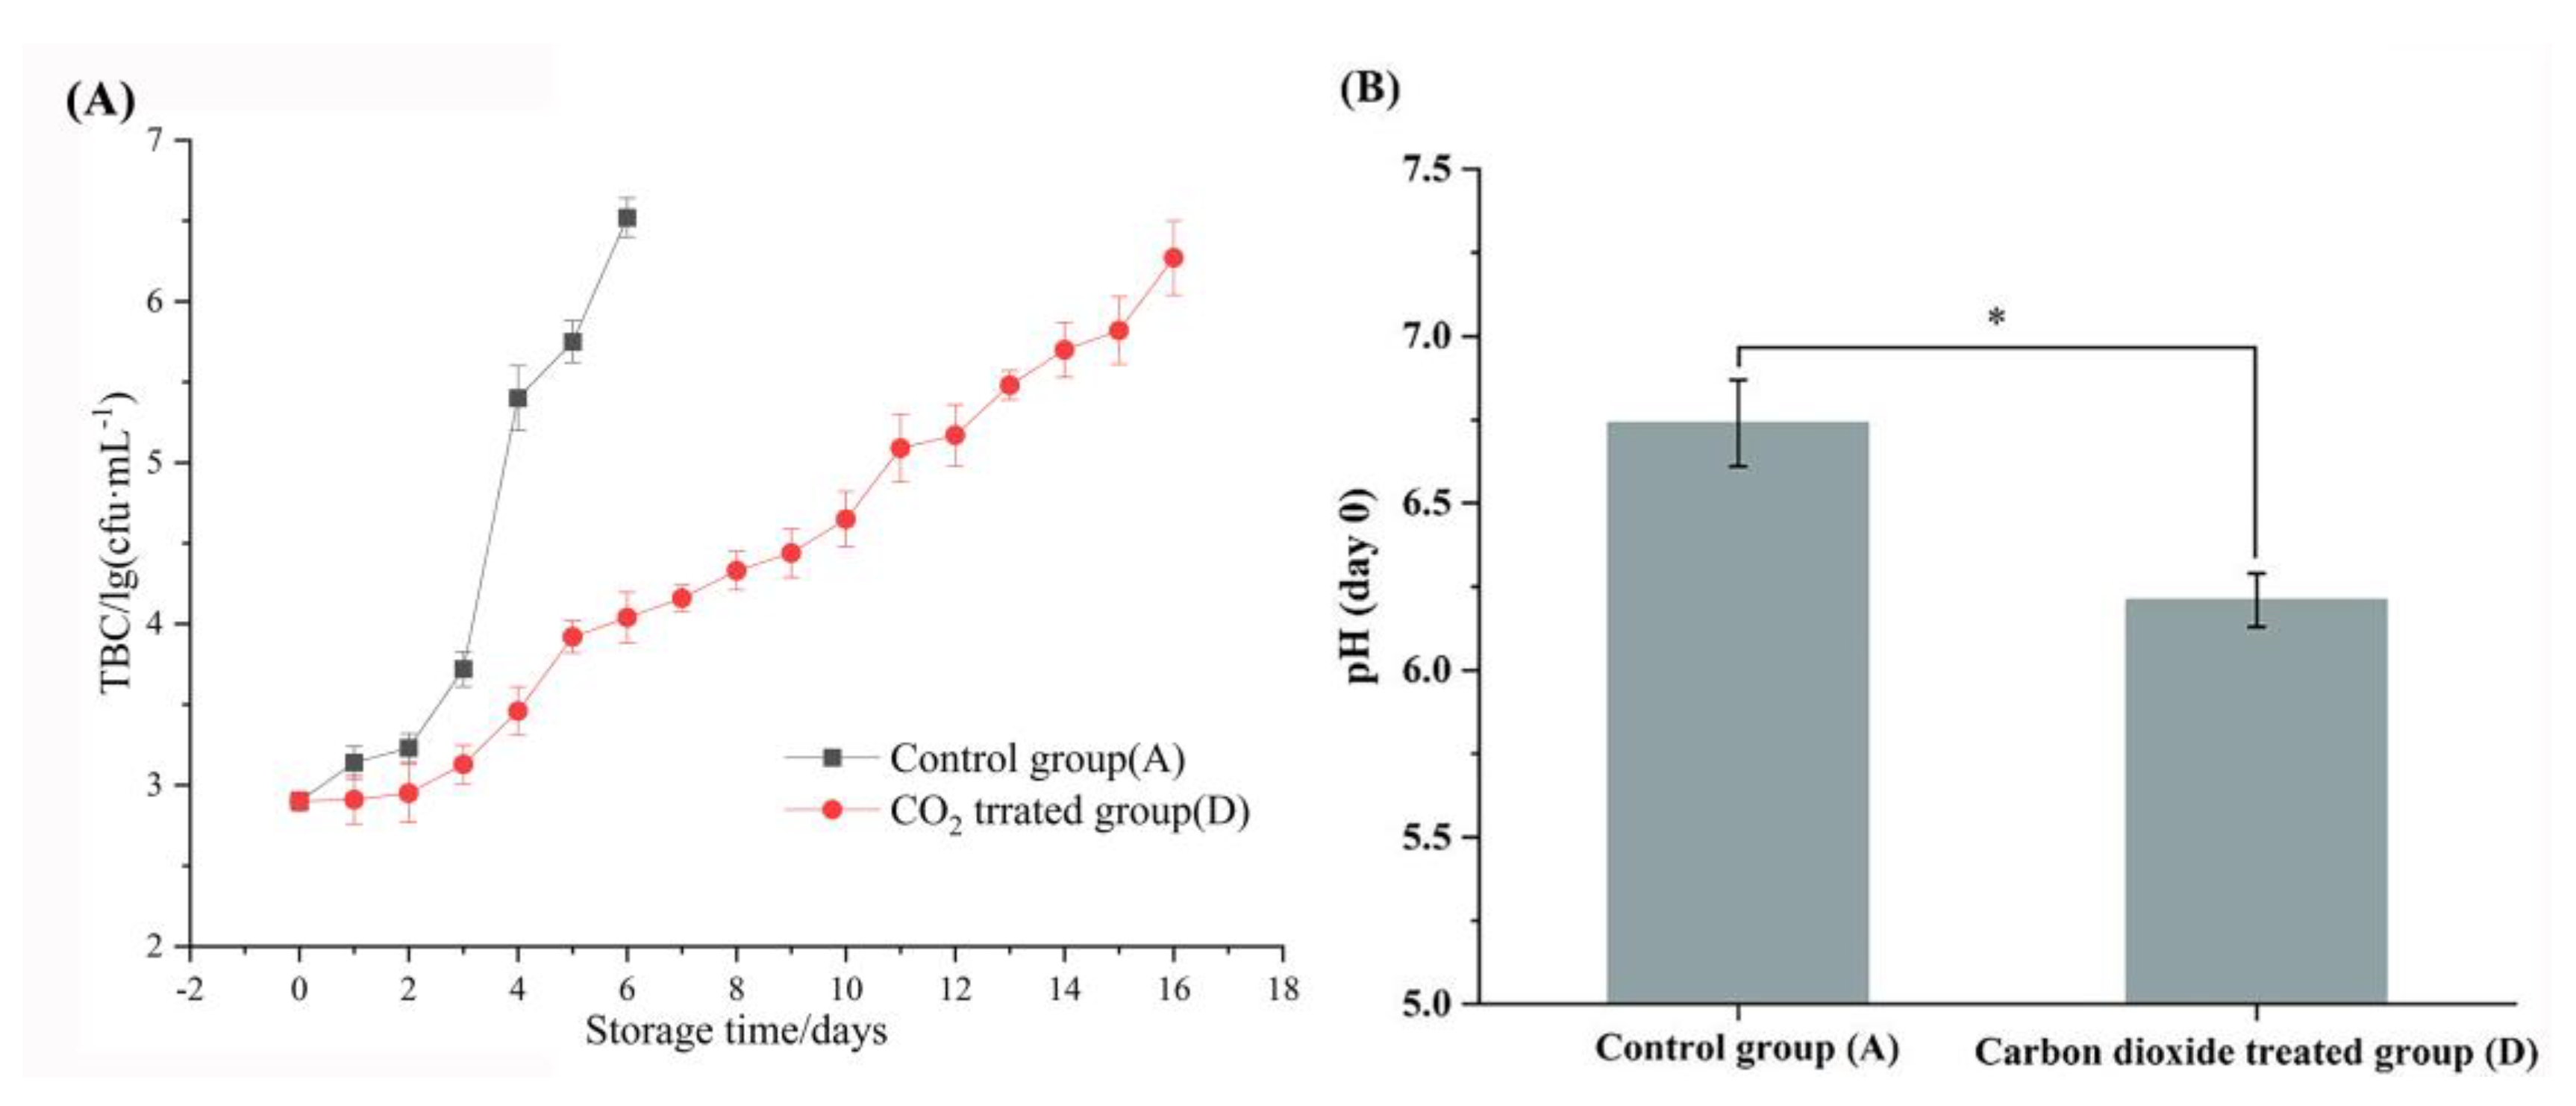
3.1. Physicochemical characteristics of raw milk
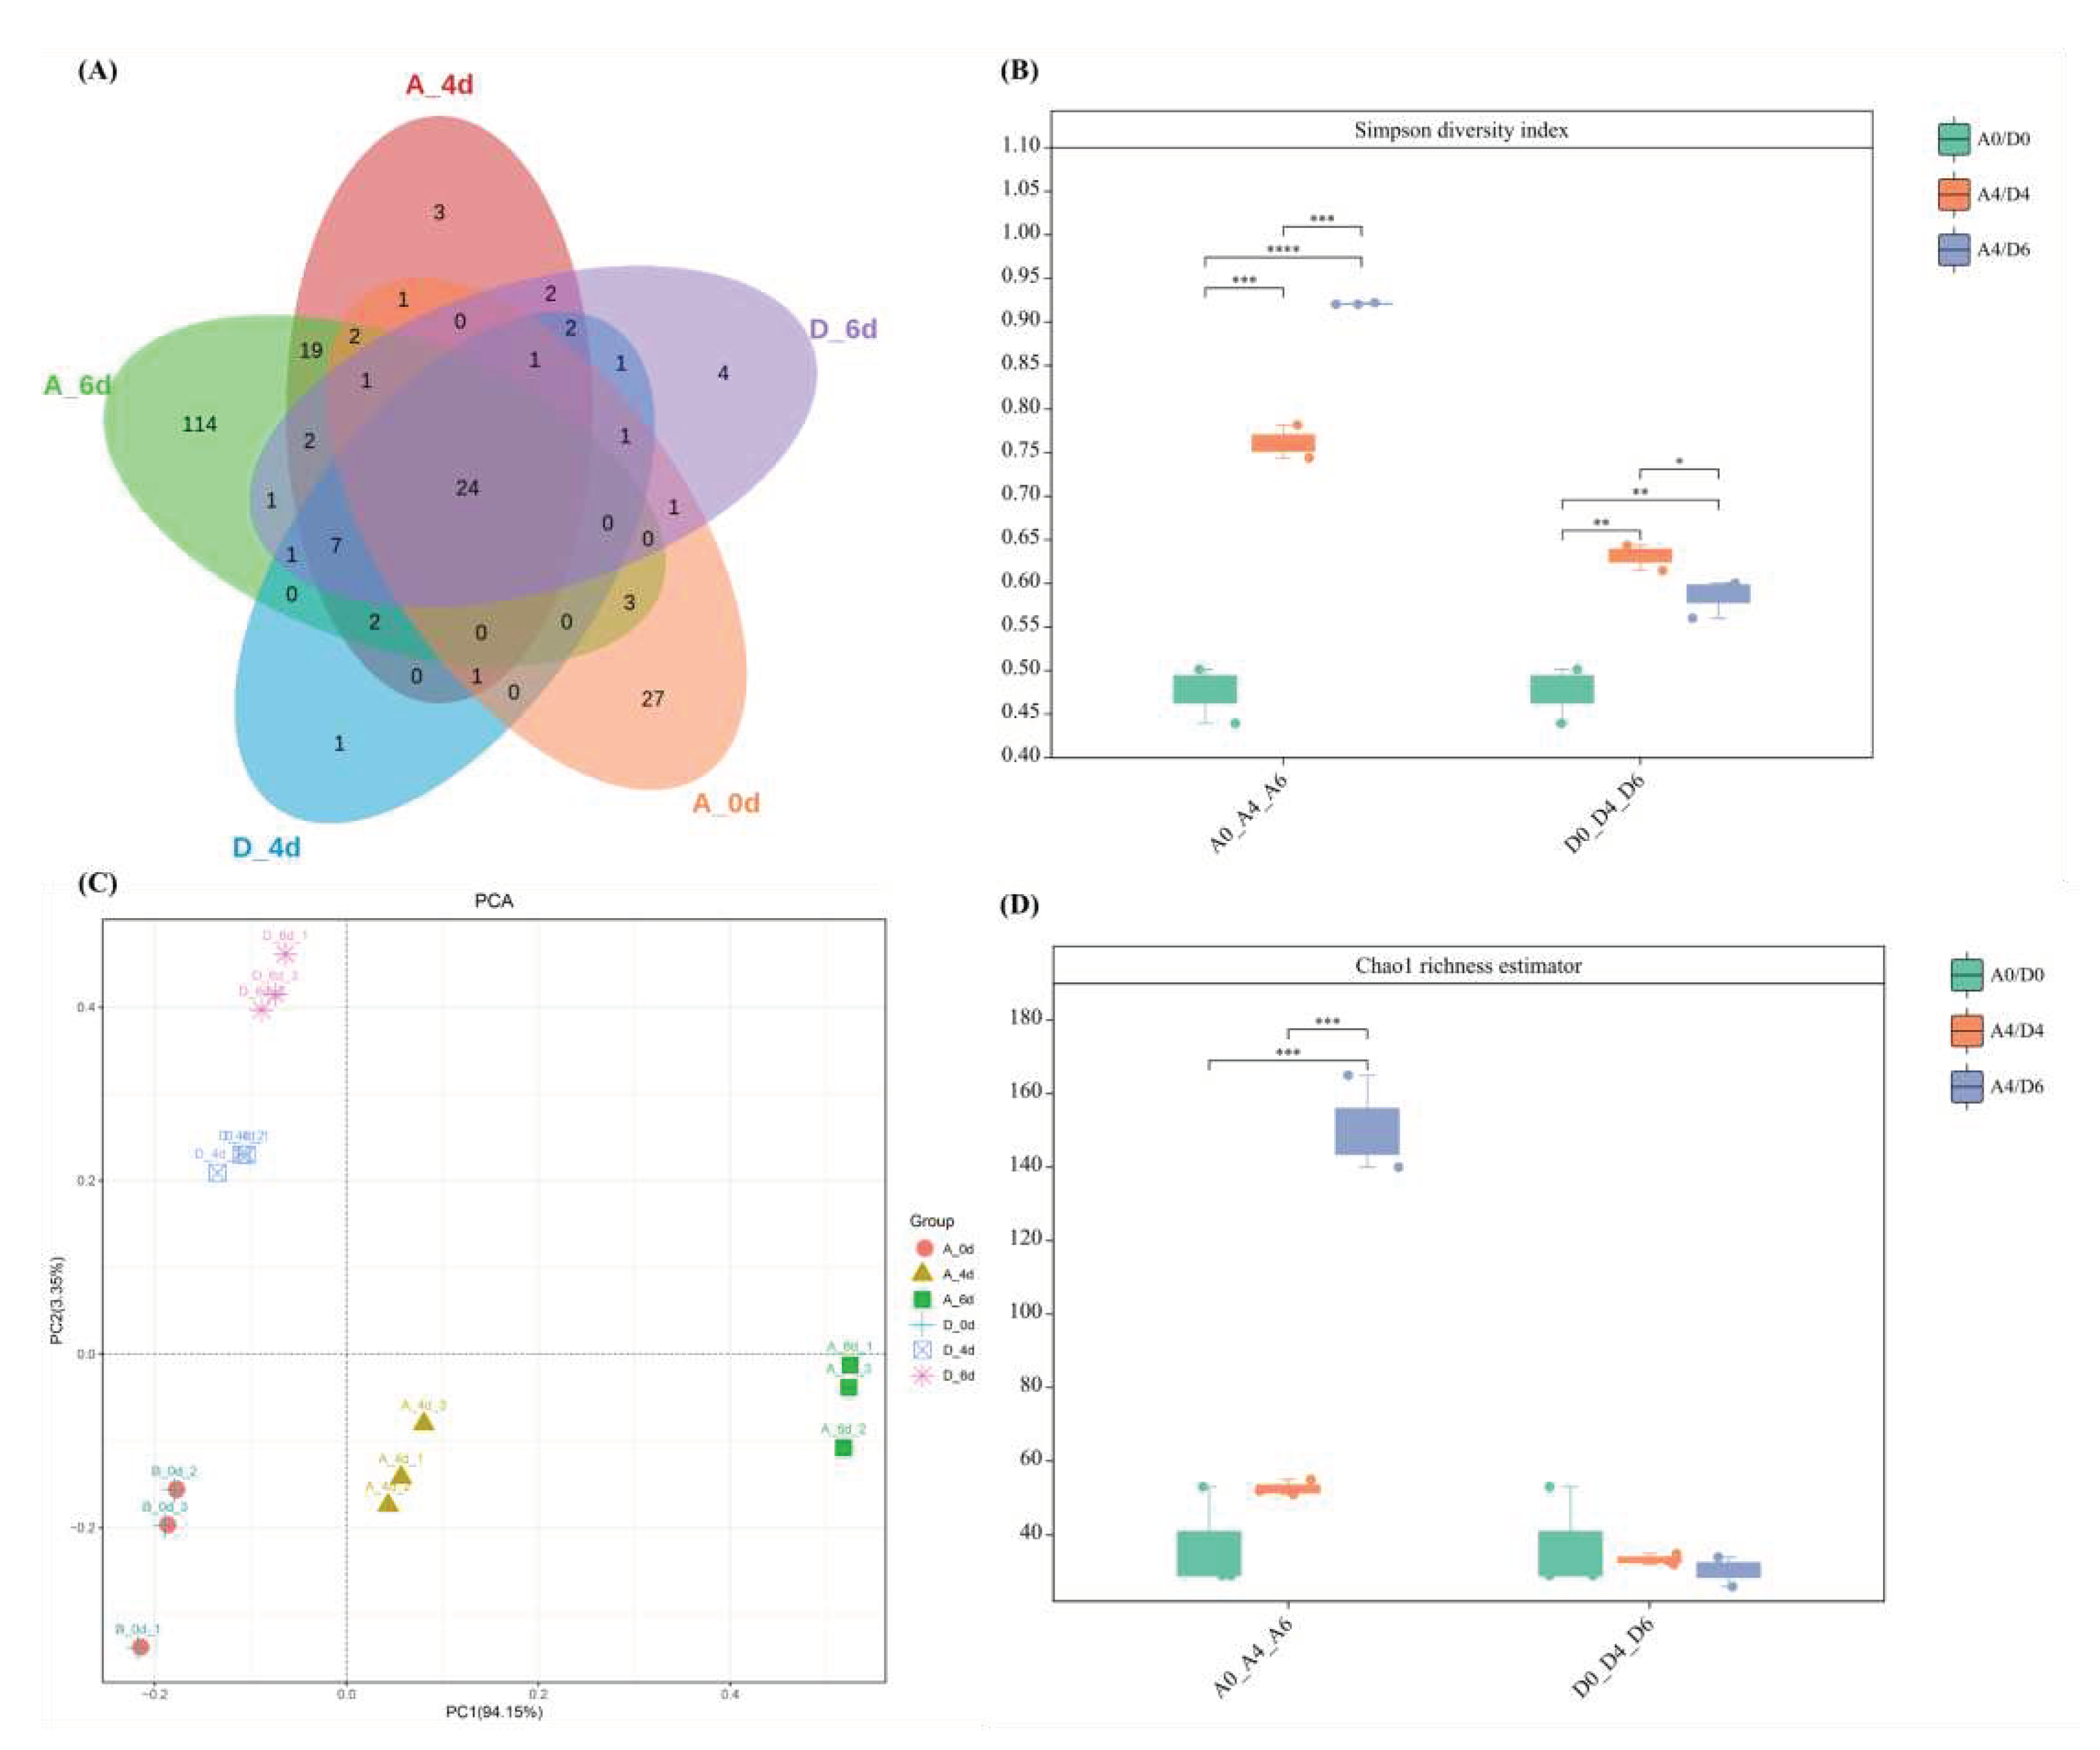
3.2. Microbial diversity of raw milk
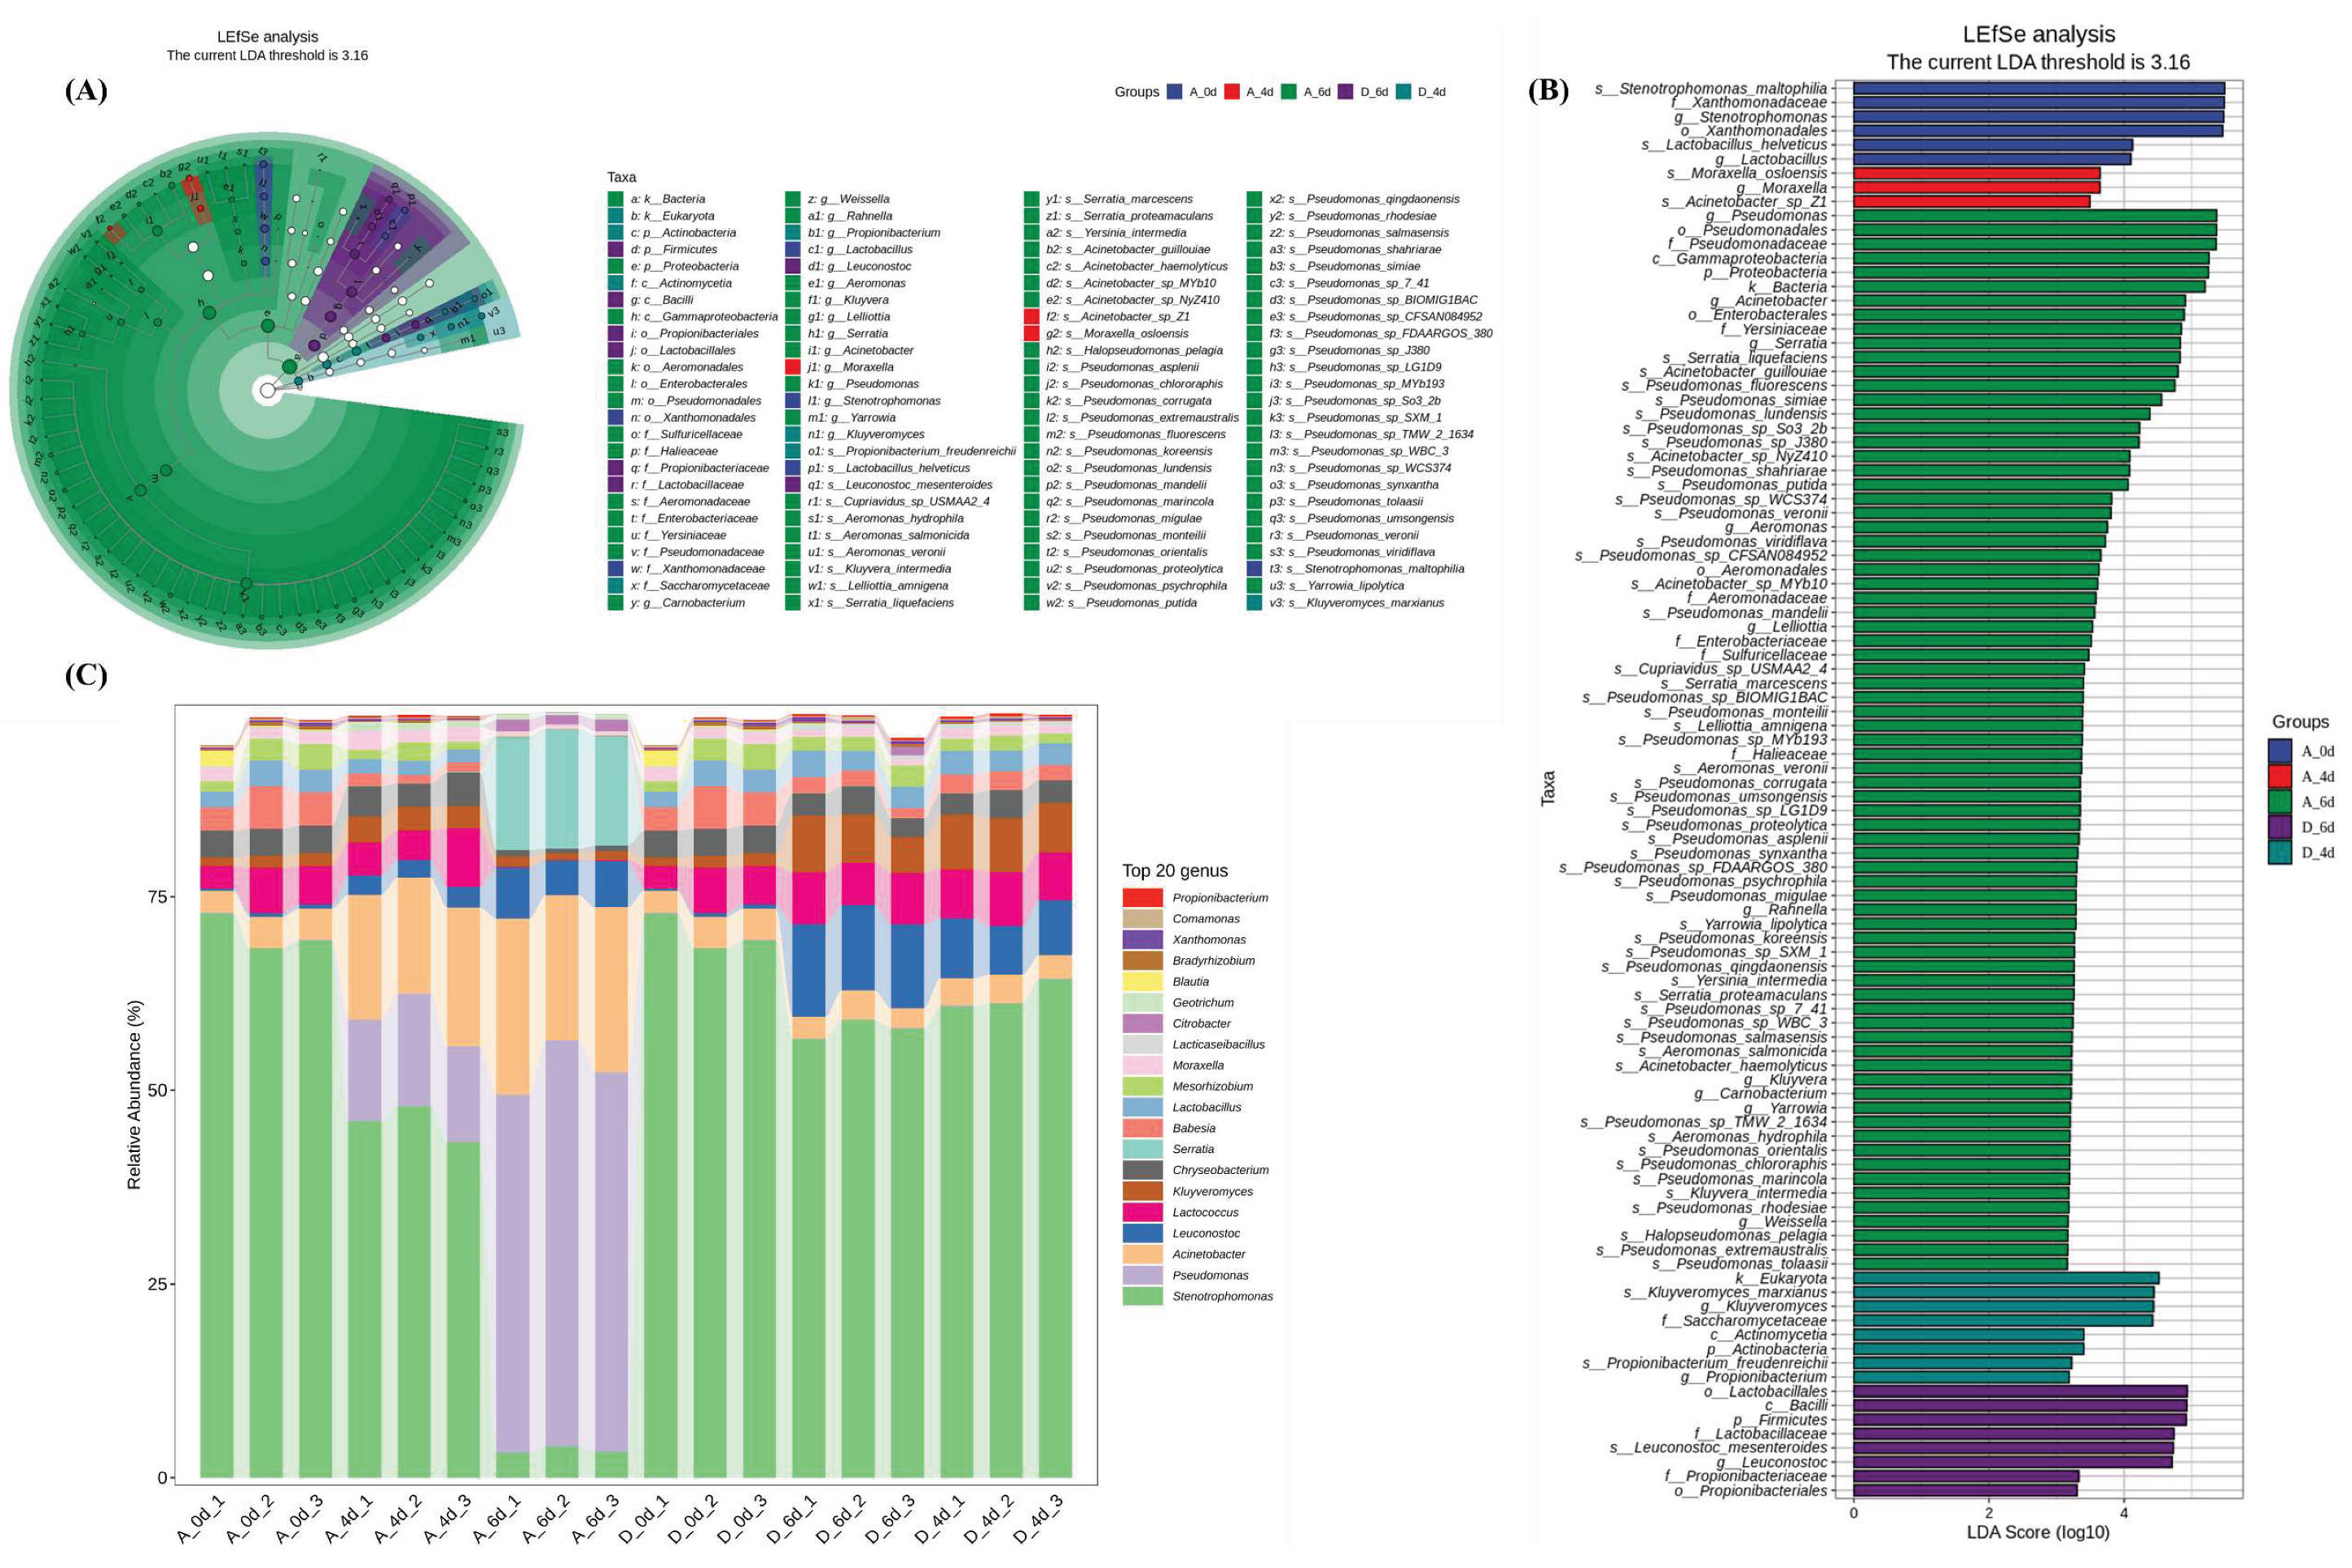
3.3. Microbiological composition of raw milk
3.4. Metabolites
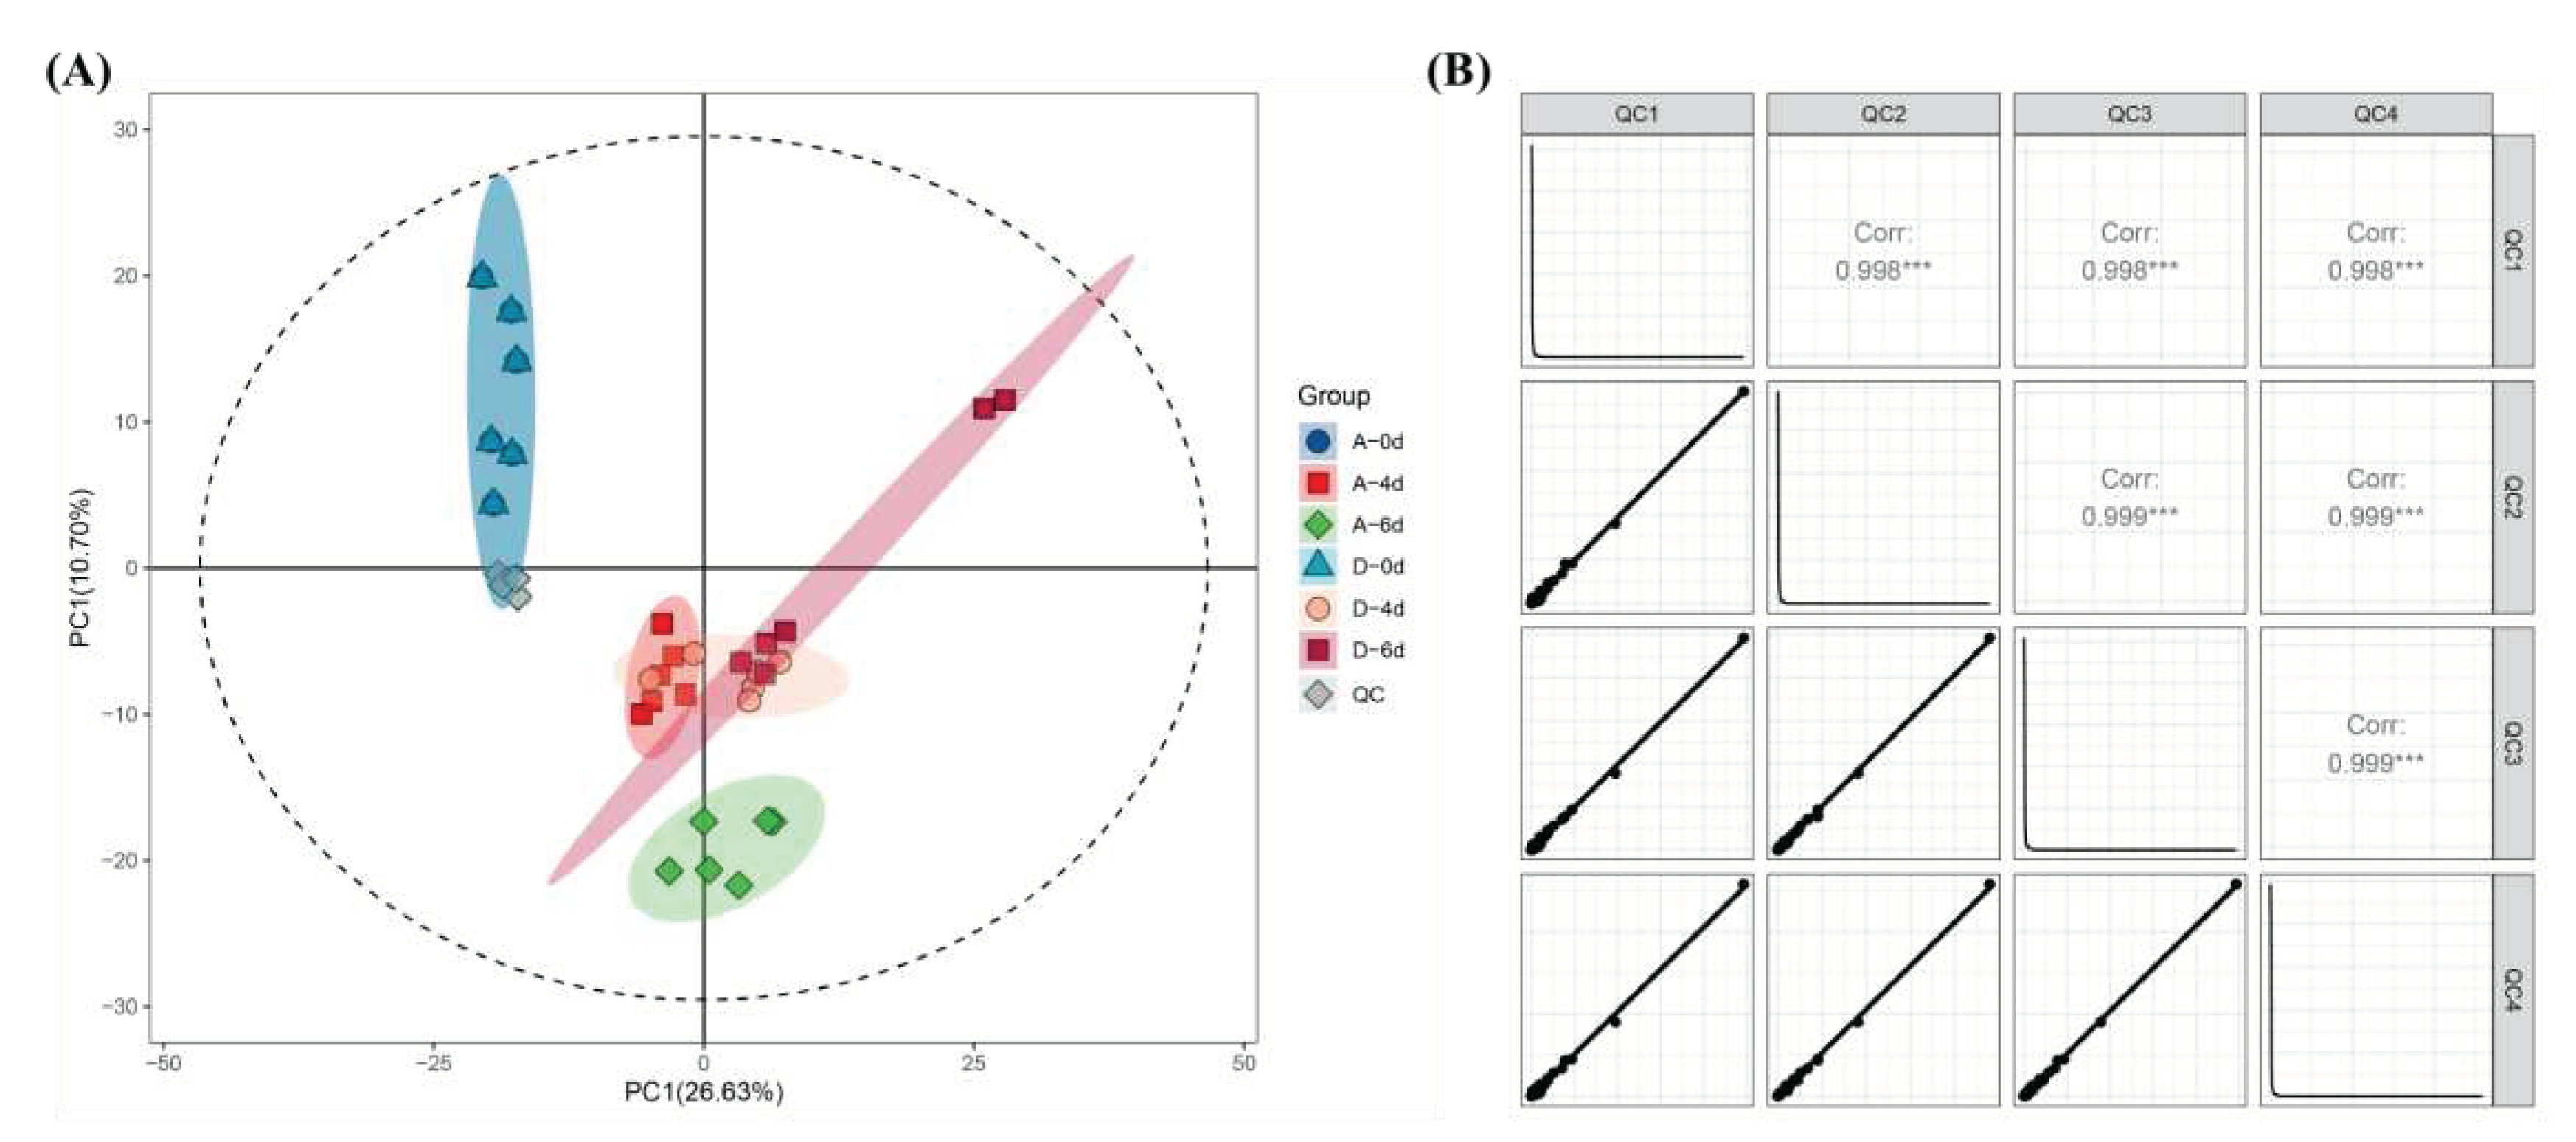
3.4.1. Data quality control
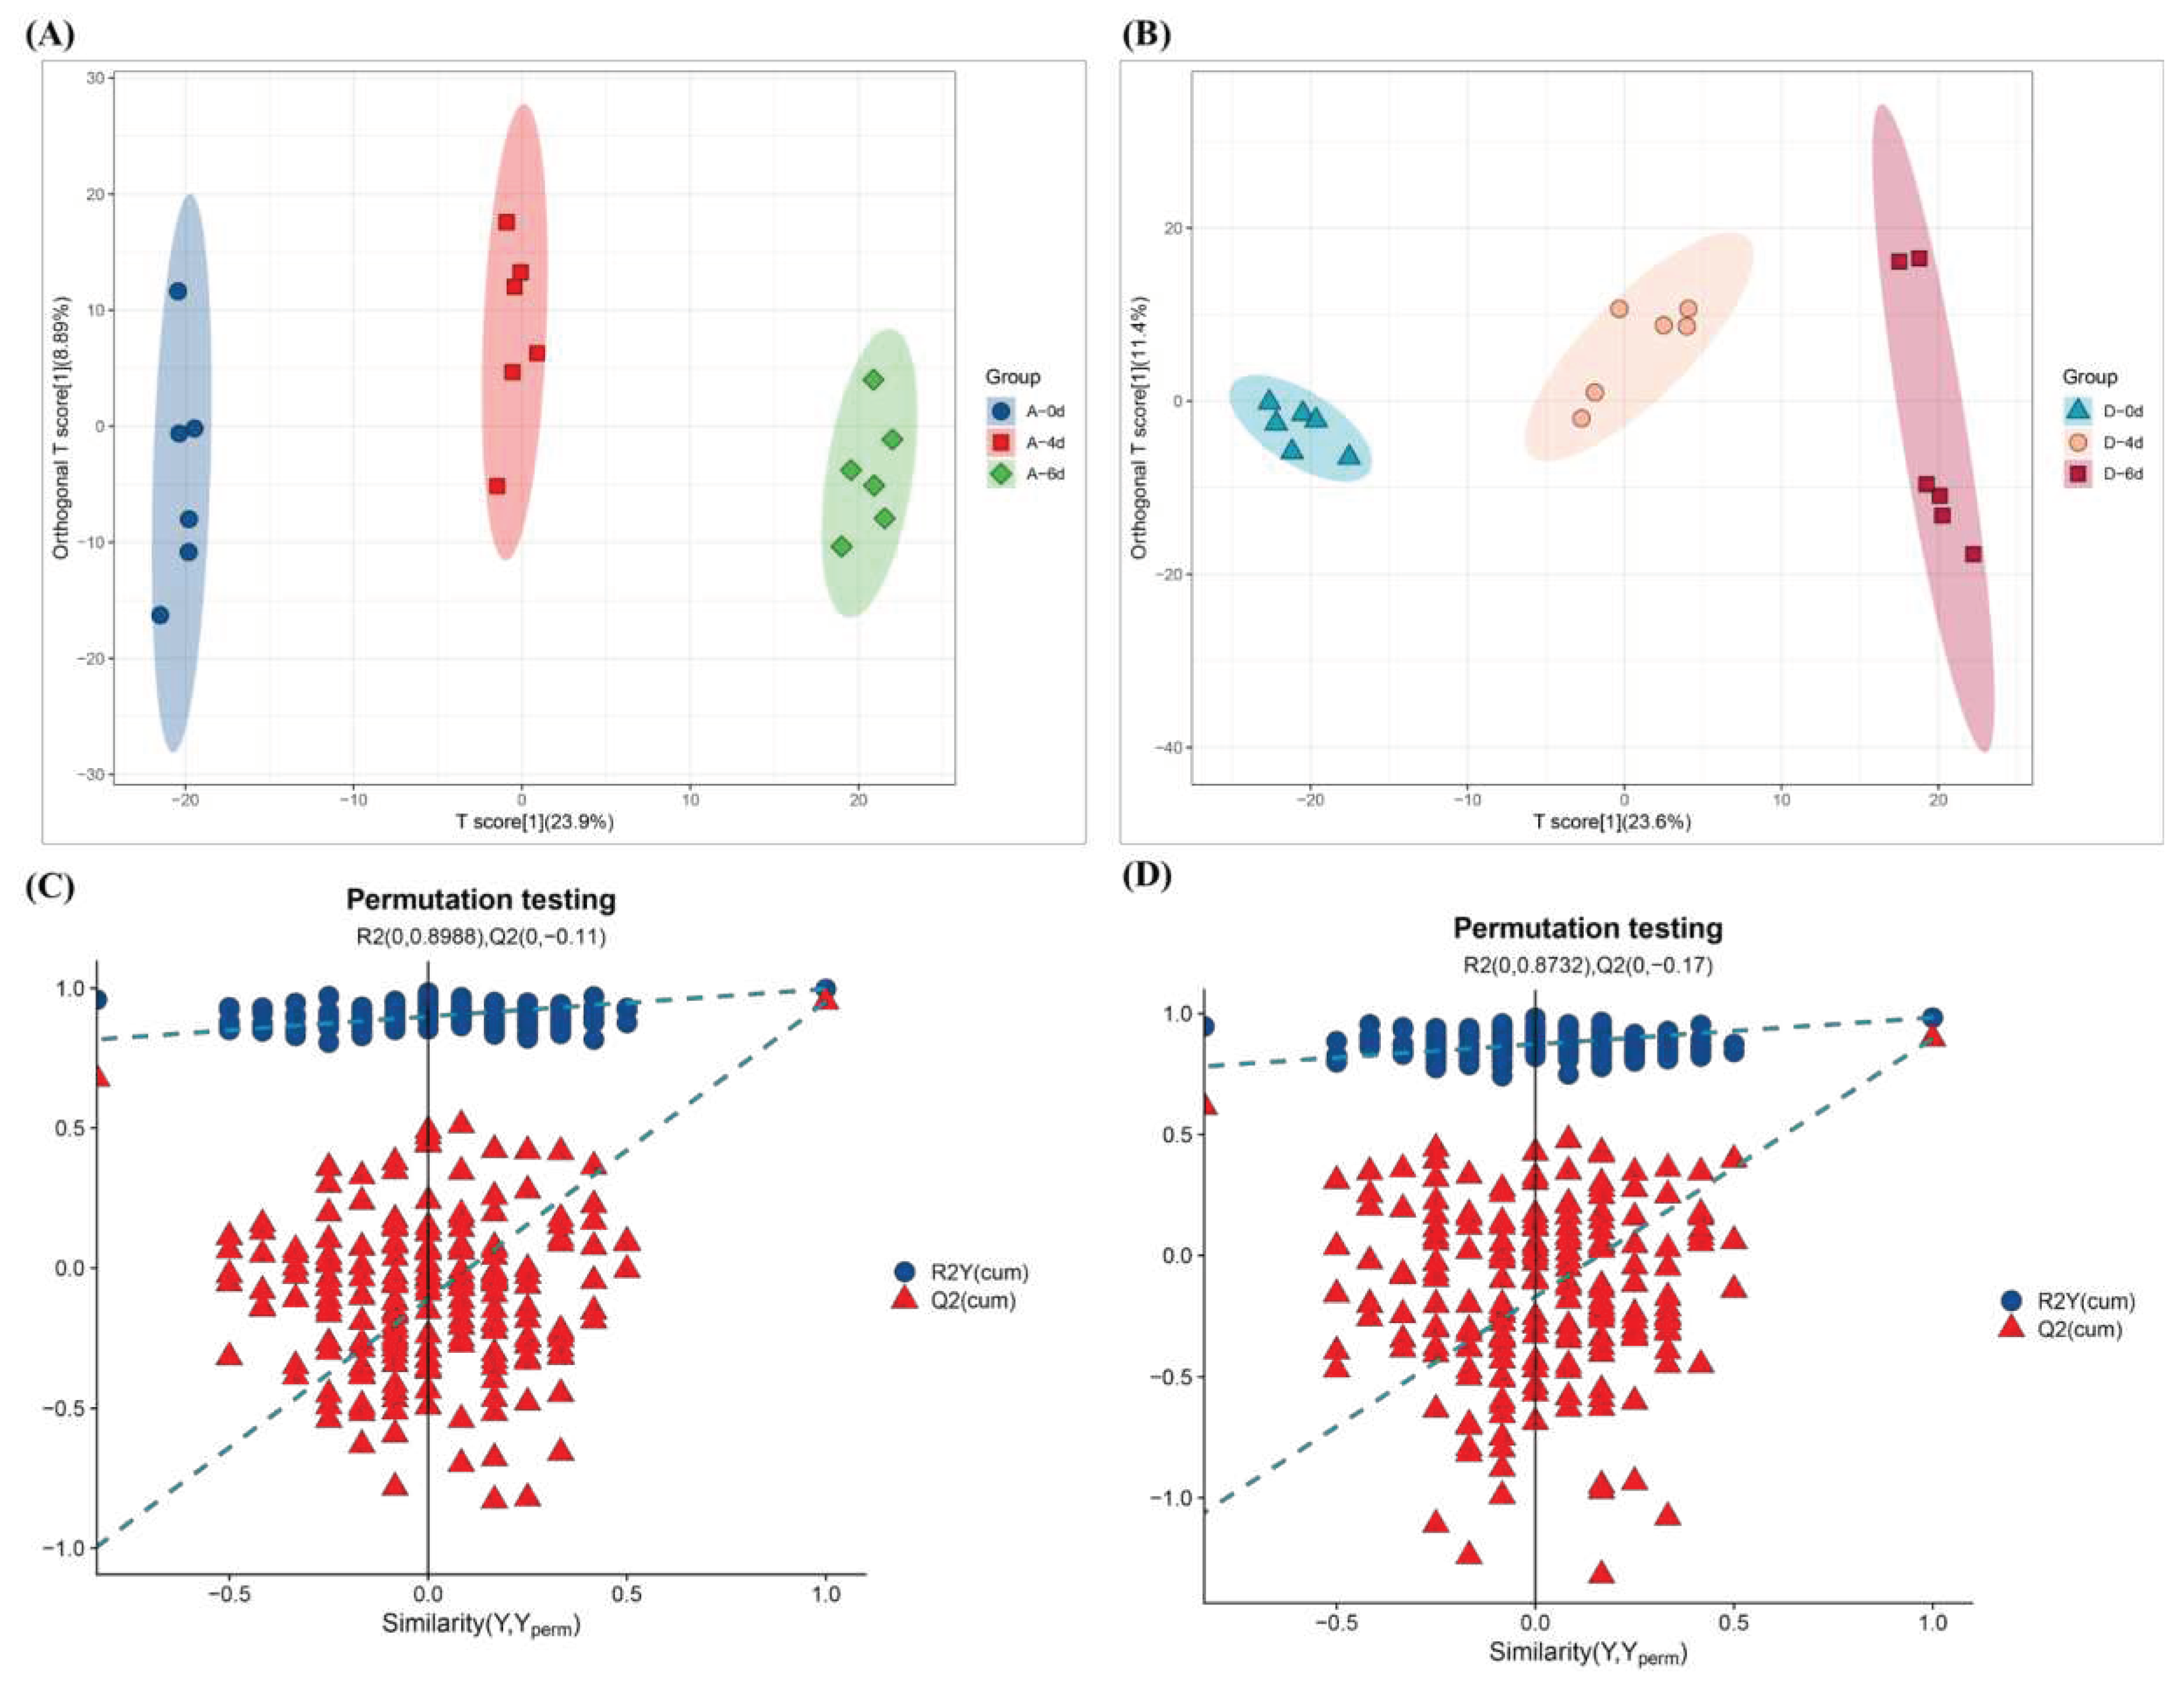
3.4.2. Overview of differences between samples
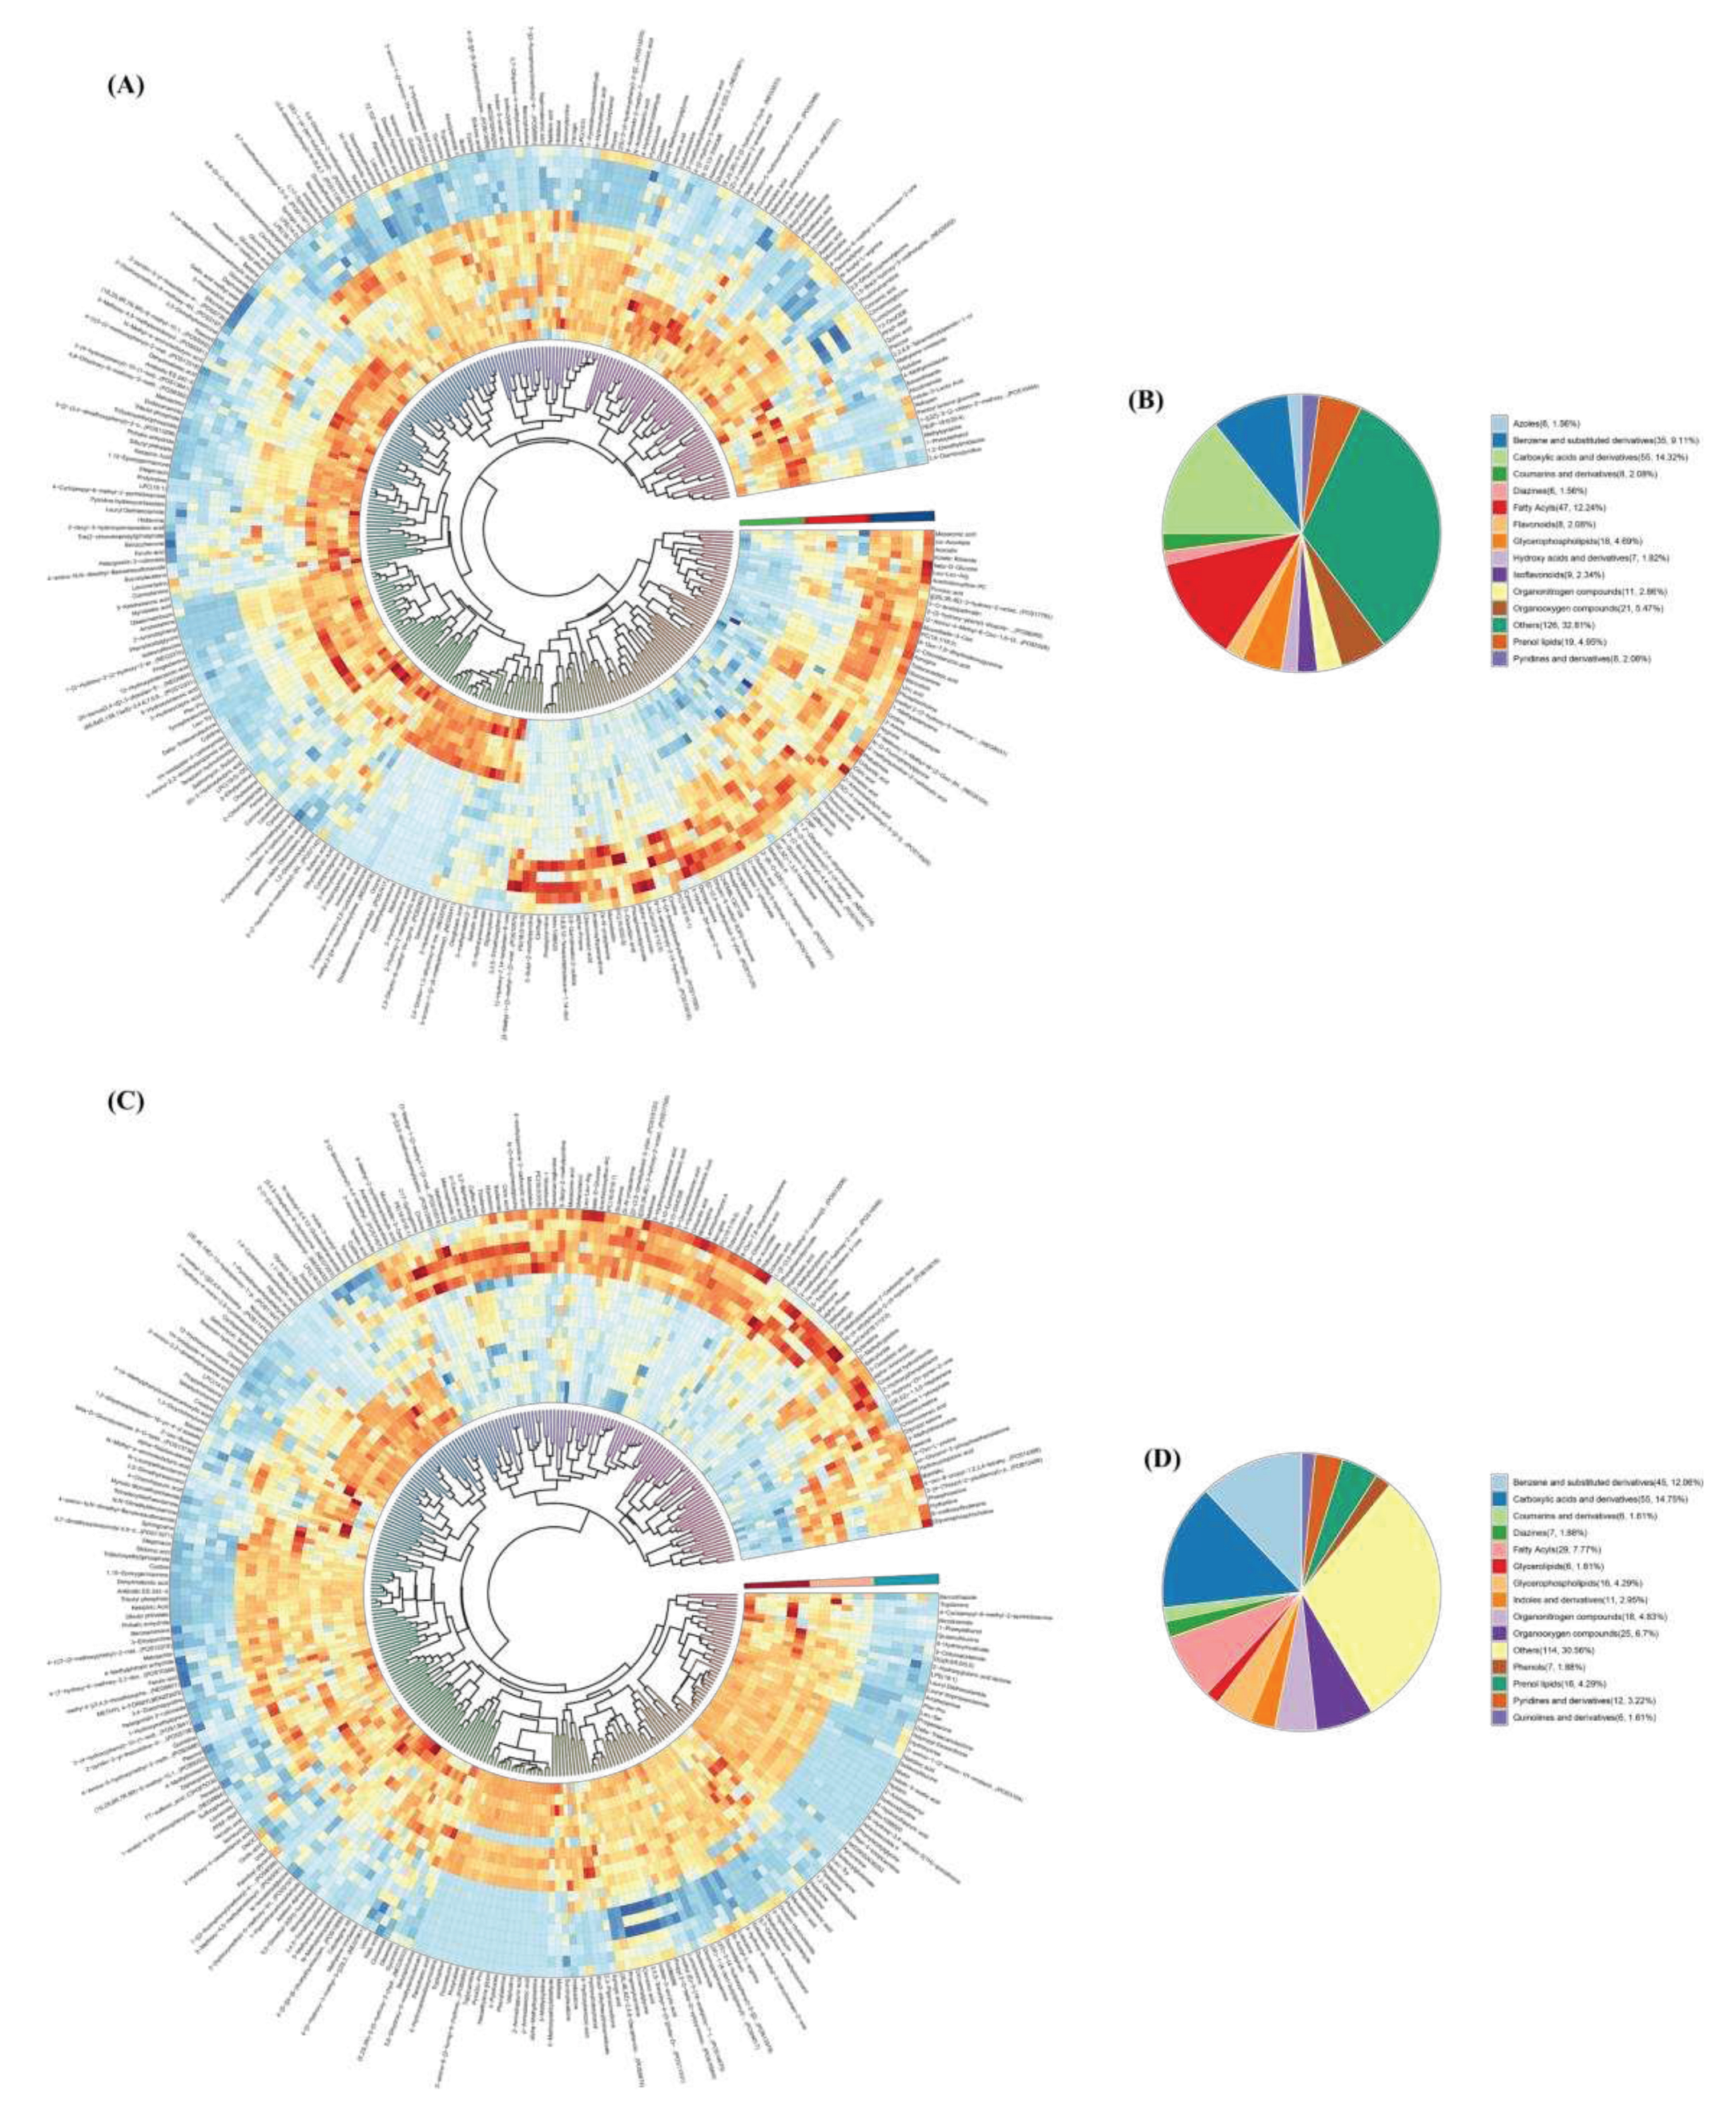
3.4.3. Differential metabolites (DMs)
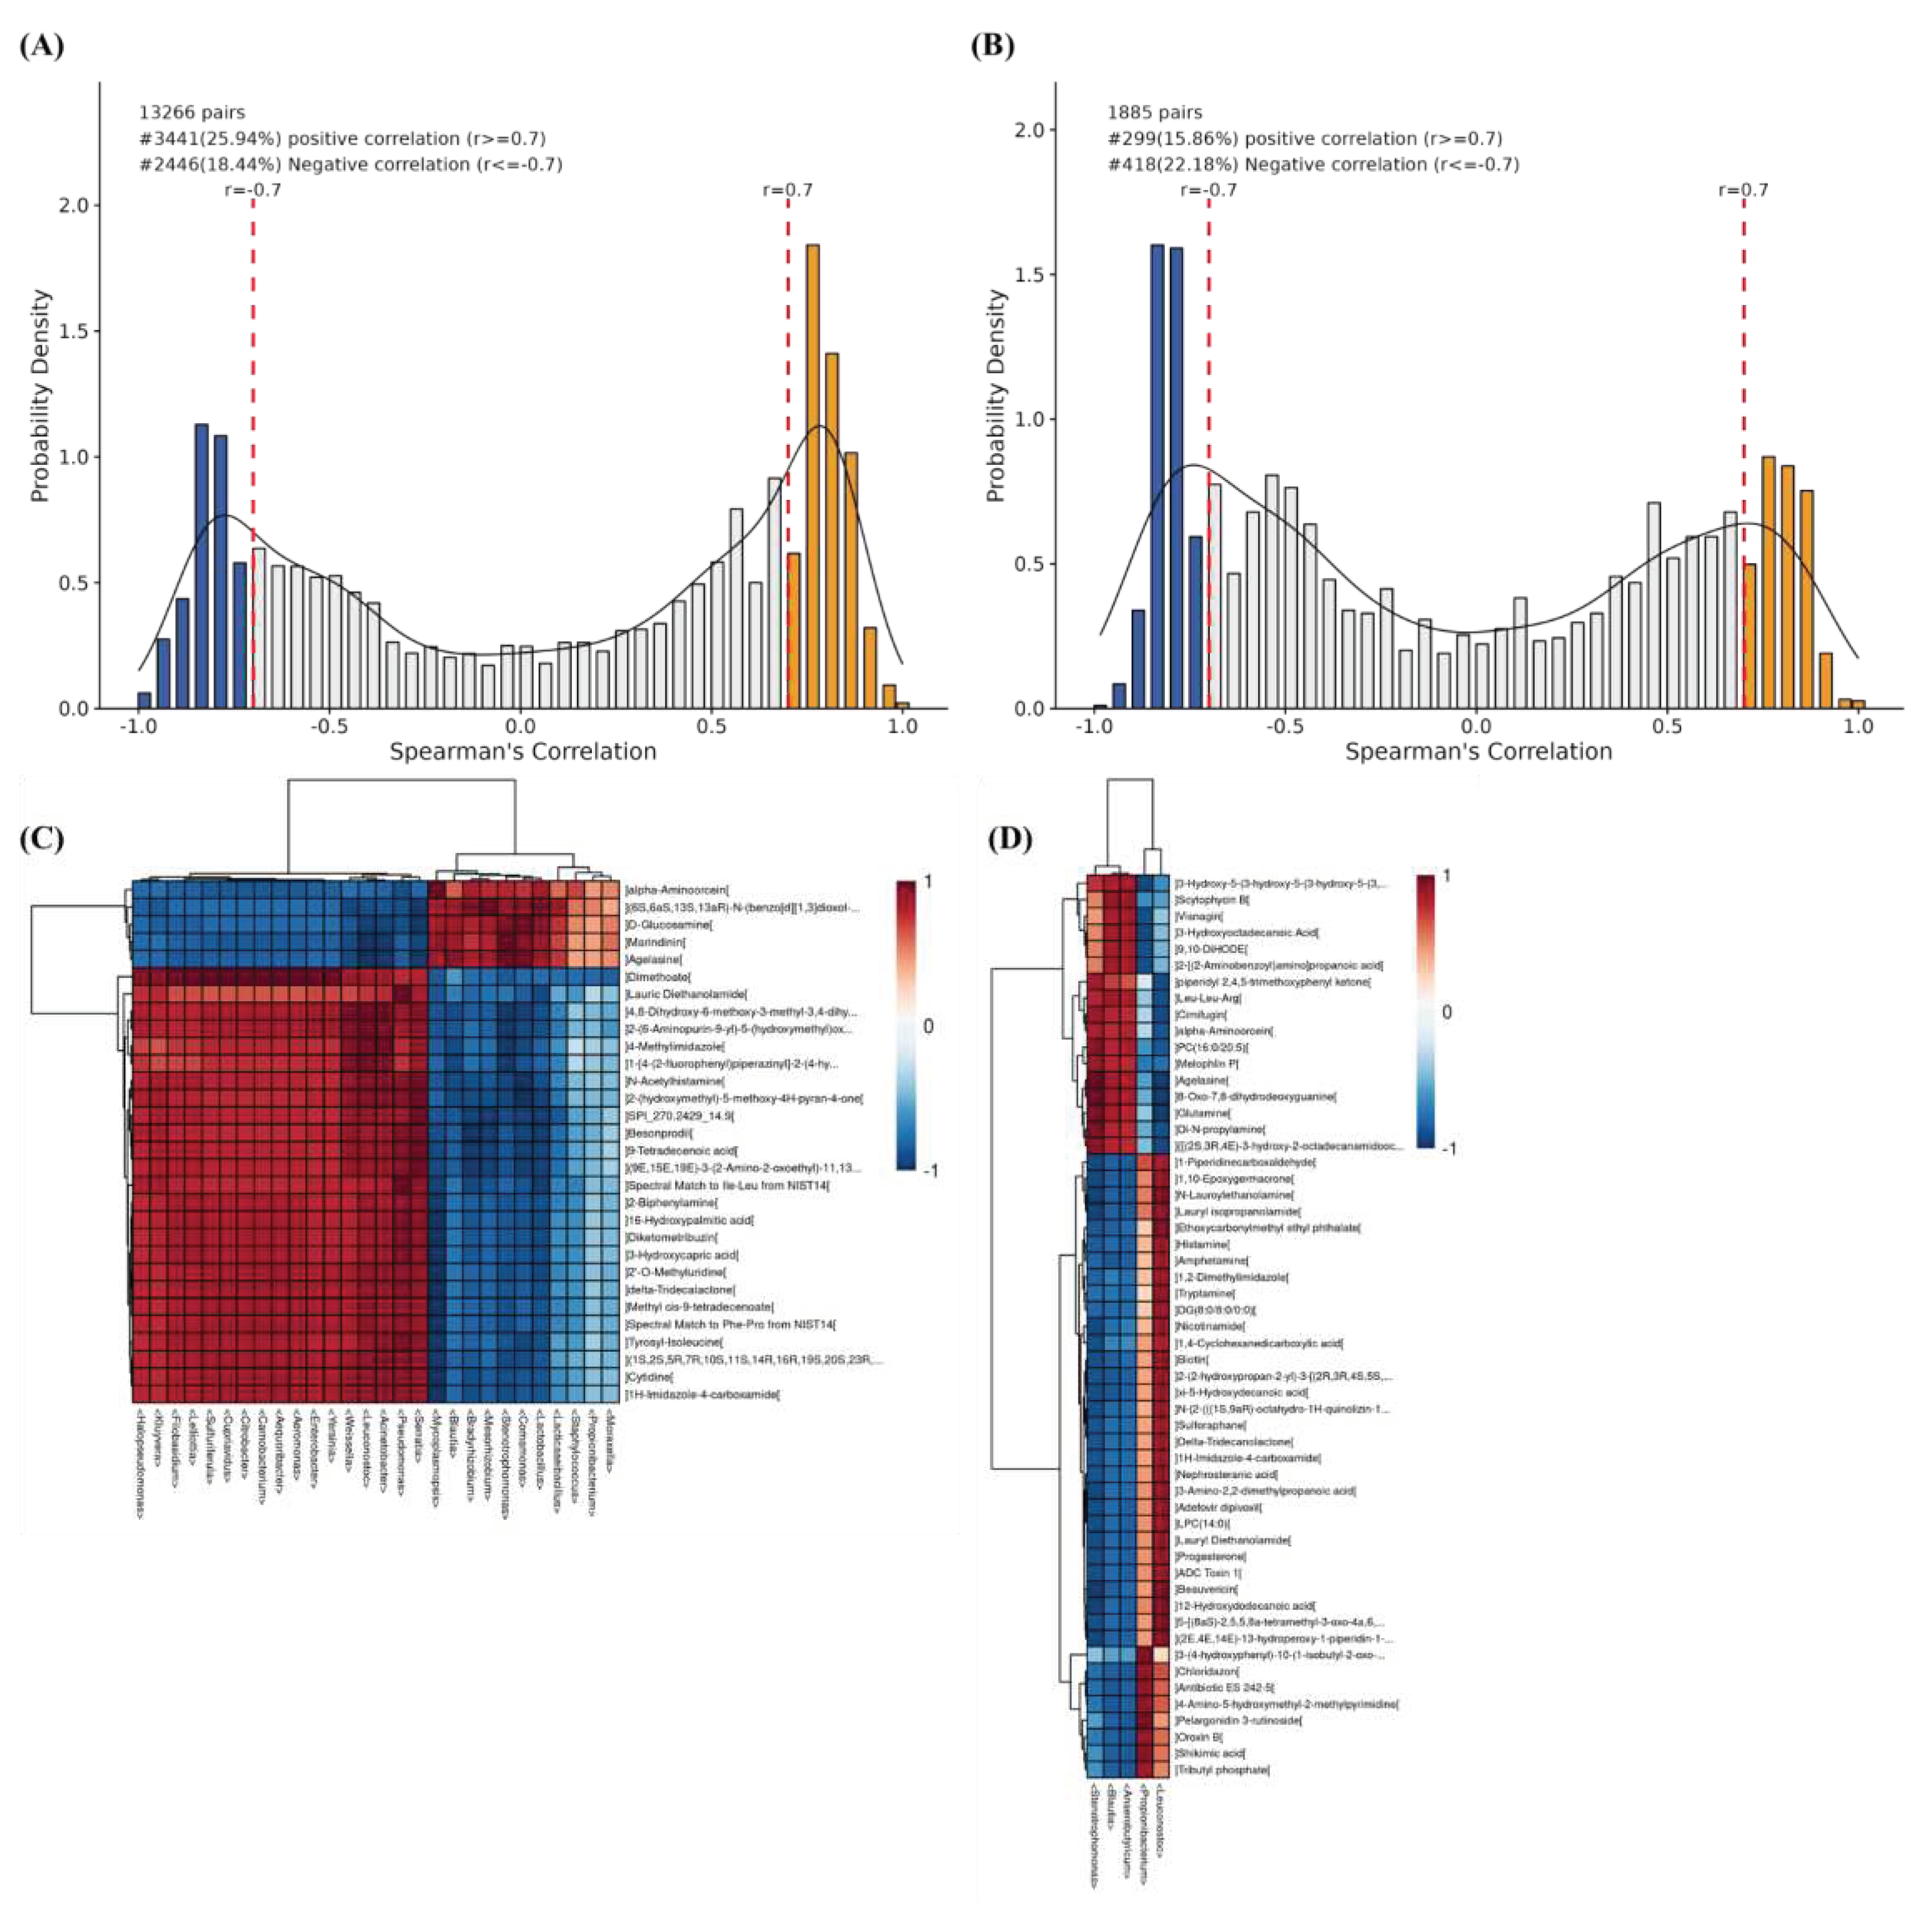
3.5. Combined microbiomics and metabolomics analysis
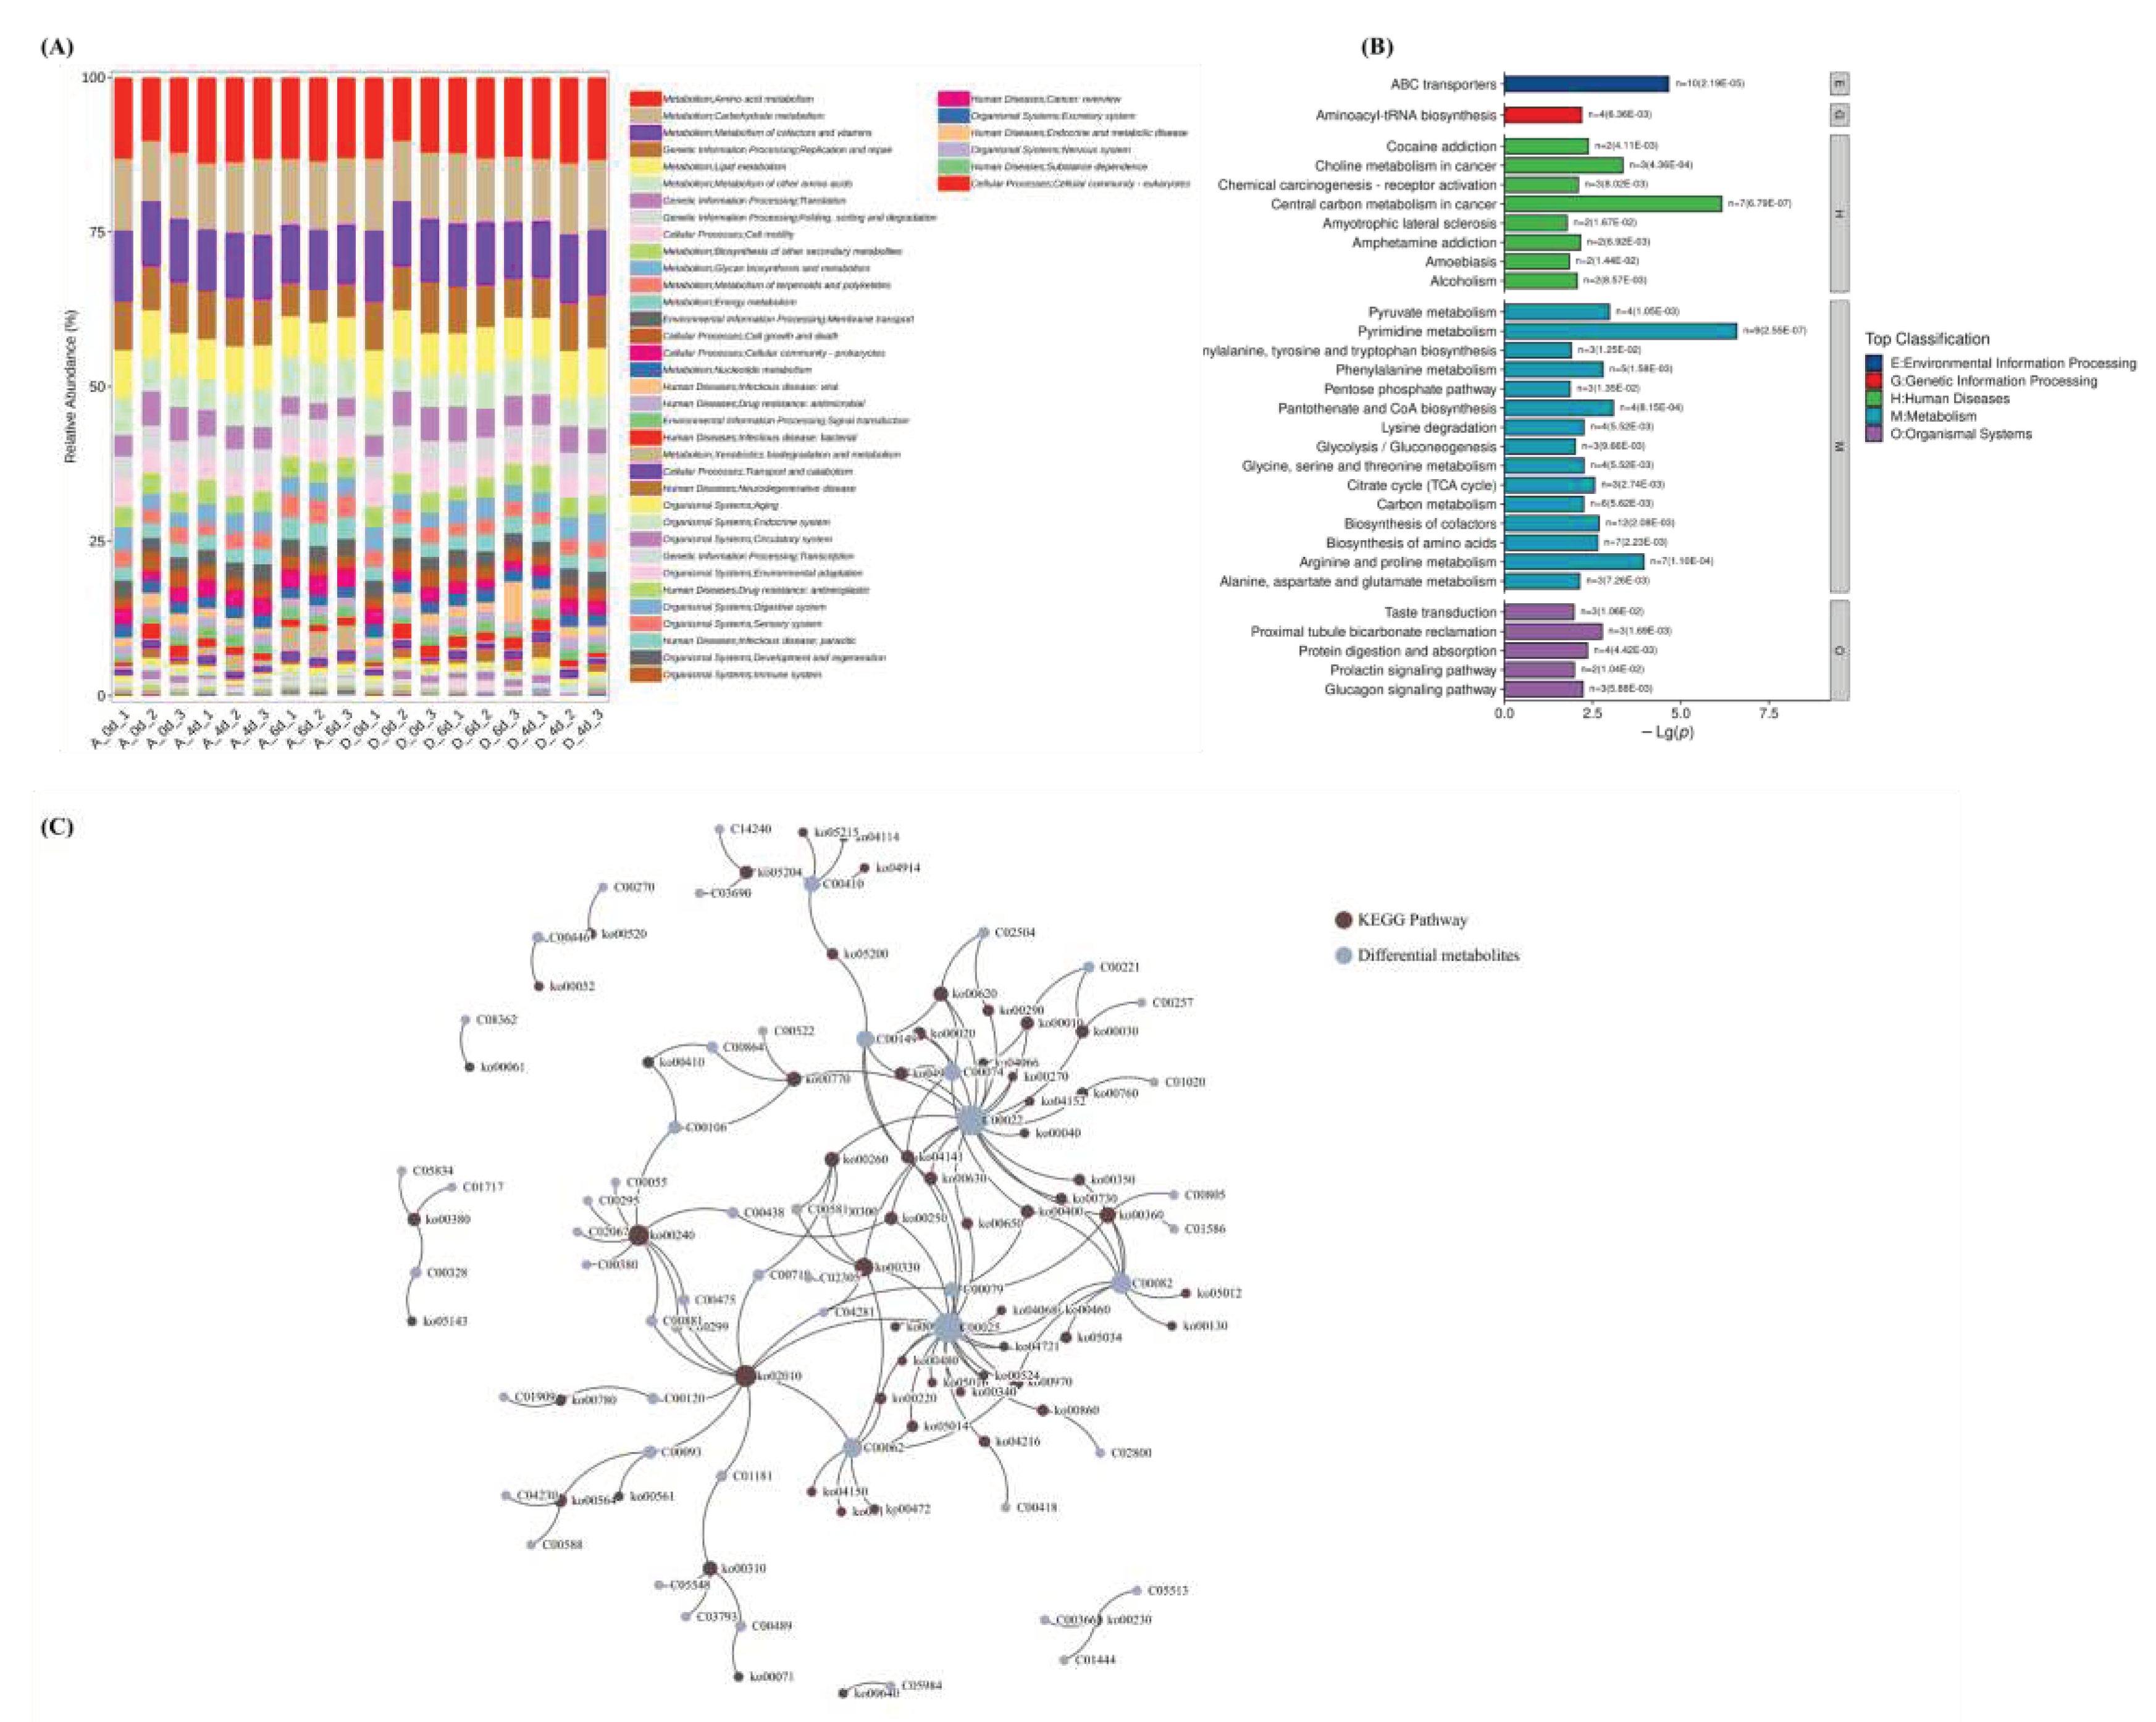
3.6. Metabolic pathway of microbiomics and metabolomics
4. Discussion
5. Conclusions
Supplementary Materials
Author Contributions
Funding
Data Availability Statement
Acknowledgments
Conflicts of Interest
References
- Ndahetuye, J.B.; Artursson, K.; Bage, R.; Ingabire, A.; Karege, C.; Djangwani, J.; Nyman, A.; Ongol, M.P.; Tukei, M.; Persson, Y. MILK Symposium review: Microbiological quality and safe of milk from farm to milk collection centers in Rwanda. J. Dairy Sci. 2020, 103, 9730–9739. [Google Scholar] [CrossRef] [PubMed]
- Mense, L.; Roessler, S.; Hanusch, R.; Rossberg, C.; Ruediger, M. Bacterial contamination of mechanically extracted breast milk. Am. J. Perinatol. 2014, 31, 293–298. [Google Scholar] [CrossRef]
- Pistocchini, E.; Stella, S.; Belli, P.; Cantafora, A.F.A.; Turini, J.; Zecchini, M.; Crimella, C. Dairy production in periurban area of Niamey: milk quality and microbial contamination. Trop. Anim. Health Prod. 2009, 41, 145–147. [Google Scholar] [CrossRef] [PubMed]
- Kuhn, E.; Meunier-Goddik, L.; Waite-Cusic, J.G. Effect of leaving milk trucks empty and idle for 6 h between raw milk loads. J. Dairy Sci. 2018, 101, 1767–1776. [Google Scholar] [CrossRef]
- Peeler, J.T.; Bunning, V.K. Hazard Assessment of Listeria monocytogenes in the Processing of Bovine Milk. J. Food Prot. 1994, 57, 689–697. [Google Scholar] [CrossRef]
- Sharma, N.; Singh, N.K.; Bhadwal, M.S. Relationship of somatic cell count and mastitis: An Overview. Asian Australas. J. Anim. Sci. 2011, 24, 429–438. [Google Scholar] [CrossRef]
- Liang, L.; Wang, P.; Zhao, X.; He, L.; Qu, T.; Chen, Y. Single-molecule real-time sequencing reveals differences in bacterial diversity in raw milk in different regions and seasons in China. J. Dairy Sci. 2022, 105, 5669–5684. [Google Scholar] [CrossRef]
- Viazis, S.; Farkas, B.E.; Allen, J.C. Effects of high-pressure processing on immunoglobulin A and lysozyme activity in human milk. J. Hum. Lact. 2007, 23, 253–261. [Google Scholar] [CrossRef]
- Sriraksha, M.S.; Ayenampudi, S.B.; Noor, M.; Raghavendra, S.N.; Chakka, A.K. Cold plasma technology: An insight on its disinfection efficiency of various food systems. Food Sci. Technol. Int. 2023, 29, 428–441. [Google Scholar]
- Masotti, F.; Cattaneo, S.; Stuknyte, M.; De Noni, I. Current insights into non-thermal preservation technologies alternative to conventional high-temperature short-time pasteurization of drinking milk. Crit. Rev. Food Sci. Nutr. 2023, 63, 5643–5660. [Google Scholar] [CrossRef]
- Li, P.; Mei, J.; Xie, J. The regulation of carbon dioxide on food microorganisms: A review. Food Res. Int. 2023, 172, 113170. [Google Scholar] [CrossRef]
- Singh, P.; Wani, A.A.; Karim, A.A.; Langowski, H. The use of carbon dioxide in the processing and packaging of milk and dairy products: A review. Int. J. Dairy Technol. 2012, 65, 161–177. [Google Scholar] [CrossRef]
- Dixon, N.M.; Kell, D.B. The inhibition by CO2 of the growth and metabolism of micro-organisms. The Journal of Applied Bacteriology. 1989, 67, 109–136. [Google Scholar] [CrossRef]
- Fang, Y.; Franke, C.; Manthei, A.; McMullen, L.; Temelli, F.; Gänzle, M.G. Effects of high-pressure carbon dioxide on microbial quality and germination of cereal grains and beans. The Journal of Supercritical Fluids. 2021, 175, 105272. [Google Scholar] [CrossRef]
- Yang, J.; Yang, X.; Liang, R.; Zhu, L.; Mao, Y.; Dong, P.; Hopkins, D.L.; Luo, X.; Zhang, Y. The response of bacterial communities to carbon dioxide in high-oxygen modified atmosphere packaged beef steaks during chilled storage. Food Res. Int. 2022, 151, 110872. [Google Scholar] [CrossRef]
- Kosasih, L.; Bhandari, B.; Prakash, S.; Bansal, N.; Gaiani, C. Physical and functional properties of whole milk powders prepared from concentrate partially acidified with CO2 at two temperatures. Int. Dairy J. 2016, 56, 4–12. [Google Scholar] [CrossRef]
- Lo, R.; Turner, M.S.; Weeks, M.; Bansal, N. Culture-independent bacterial community profiling of carbon dioxide treated raw milk. Int. J. Food Microbiol. 2016, 233, 81–89. [Google Scholar] [CrossRef]
- Apostolakos, I.; Skarlatoudi, T.; Vatavali, K.; Giannouli, A.; Bosnea, L.; Mataragas, M. Genomic and phenotypic characterization of mastitis-causing Staphylococci and probiotic lactic acid bacteria isolated from raw sheep and rsquo’s Milk. In International Journal of Molecular Sciences, 2023; Vol. 24.
- D'Incecco, P.; Limbo, S.; Hogenboom, J.A.; Pellegrino, L. Novel technologies for extending the shelf life of drinking milk: Concepts, research trends and current applications. Lwt-Food Sci. Technol. 2021, 148.
- DERTLI, E.; SERT, D.; AKIN, N. The effects of carbon dioxide addition to cheese milk on the microbiological properties of Turkish White brined cheese. Int. J. Dairy Technol. 2012, 65, 387–392. [Google Scholar] [CrossRef]
- Couvert, O.; Koullen, L.; Lochardet, A.; Huchet, V.; Thevenot, J.; Le Marc, Y. Effects of carbon dioxide and oxygen on the growth rate of various food spoilage bacteria. Food Microbiol. 2023, 114, 104289. [Google Scholar] [CrossRef]
- Lemos, Á.T.; Casal, S.; Barba, F.J.; Phimolsiripol, Y.; Delgadillo, I.; Saraiva, J.A. Preservation of high pressure pasteurised milk by hyperbaric storage at room temperature versus refrigeration on inoculated microorganisms, fatty acids, volatile compounds and lipid oxidation. Food Chem. 2022, 387, 132887. [Google Scholar] [CrossRef]
- Hotchkiss, J.H.; Werner, B.G.; Lee, E.Y.C. Addition of carbon dioxide to dairy products to improve quality: A comprehensive review. Compr. Rev. Food. Sci. Food Saf. 2006, 5, 158–168. [Google Scholar] [CrossRef]
- Lei, Y.; Zhang, Y.; Cheng, Y.; Huang, J.; Huang, M. Monitoring and identification of spoilage-related microorganisms in braised chicken with modified atmosphere packaging during refrigerated storage. Food Sci. Human Wellness. 2023, 12, 28–34. [Google Scholar] [CrossRef]
- Wang, Z.; Sun, Y.; Wu, Y.; Chen, R.; Xu, Y.; Cai, Y.; Chu, M.; Dou, X.; Zhang, Y.; Qin, Y.; et al. Metabonomic analysis of human and 12 kinds of livestock mature milk. Food Chemistry: X. 2023, 17, 100581. [Google Scholar] [CrossRef] [PubMed]
- Le, T.T.; Ziemba, A.; Urasaki, Y.; Hayes, E.; Brotman, S.; Pizzorno, G. Disruption of uridine homeostasis links liver pyrimidine metabolism to lipid accumulation[S]. J. Lipid Res. 2013, 54, 1044–1057. [Google Scholar] [CrossRef] [PubMed]
- Stretton, S.; Goodman, A.E. Carbon dioxide as a regulator of gene expression in microorganisms. Antonie Van Leeuwenhoek. 1998, 73, 79–85. [Google Scholar] [CrossRef] [PubMed]
- Wu, Z.; Heng, J.; Tian, M.; Song, H.; Chen, F.; Guan, W.; Zhang, S. Amino acid transportation, sensing and signal transduction in the mammary gland: key molecular signalling pathways in the regulation of milk synthesis. Nutr. Res. Rev. 2020, 33, 287–297. [Google Scholar] [CrossRef] [PubMed]
- Peng, C.; Andersen, B.; Arshid, S.; Larsen, M.R.; Albergaria, H.; Lametsch, R.; Arneborg, N. Proteomics insights into the responses of Saccharomyces cerevisiae during mixed-culture alcoholic fermentation with Lachancea thermotolerans. Fems Microbiol. Ecol. 2019, 95. [Google Scholar] [CrossRef] [PubMed]
- Li, M.; Li, W.; Kong, F.; Kang, S.; Liang, X.; Han, H.; Wu, J.; Zheng, Y.; Li, Q.; Yue, X.; et al. Metabolomics methods to analyze full spectrum of amino acids in different domains of bovine colostrum and mature milk. Eur. Food Res. Technol. 2020, 246, 213–224. [Google Scholar] [CrossRef]
- Leandro, J.; Houten, S.M. The lysine degradation pathway: Subcellular compartmentalization and enzyme deficiencies. Mol. Genet. Metab. 2020, 131, 14–22. [Google Scholar] [CrossRef]
| No. | ID | ID | Description | Count | KEGG ID | Top Class |
|---|---|---|---|---|---|---|
| 1 | ko02010 | bta02010 | ABC transporters | 10 | C00719/C00062/C00025/C00120/C00093/C00299/C00475/C00881/C00079/C01181 | Metabolism |
| 2 | ko00240 | bta00240 | Pyrimidine metabolism | 9 | C00055/C00380/C00299/C00475/C00881/C00106/C00438/C02067/C00295 | Environmental Information Processing |
| 3 | ko00330 | bta00330 | Arginine and proline metabolism | 7 | C00062/C00581/C02305/C00025/C04281/C00022/C00300 | Metabolism |
| 4 | ko00360 | bta00360 | Phenylalanine metabolism | 5 | C00082/C01586/C00805/C00079/C00022 | Metabolism |
| 5 | ko00770 | bta00770 | Pantothenate and CoA biosynthesis | 4 | C00864/C00522/C00106/C00022 | Metabolism |
| 6 | ko00620 | bta00620 | Pyruvate metabolism | 4 | C02504/C00074/C00149/C00022 | Metabolism |
| 7 | ko00260 | bta00260 | Glycine, serine and threonine metabolism | 4 | C00719/C00581/C00022/C00300 | Organismal Systems |
| 8 | ko00310 | bta00310 | Lysine degradation | 4 | C03793/C00489/C01181/C05548 | Metabolism |
| 9 | ko00970 | bta00970 | Aminoacyl-tRNA biosynthesis | 4 | C00062/C00025/C00082/C00079 | Human Diseases |
| 10 | ko04141 | bta04964 | Proximal tubule bicarbonate reclamation | 3 | C00074/C00025/C00149 | Metabolism |
| 11 | ko00020 | bta00020 | Citrate cycle (TCA cycle) | 3 | C00074/C00149/C00022 | Metabolism |
| 12 | ko04922 | bta04922 | Glucagon signaling pathway | 3 | C00074/C00149/C00022 | Organismal Systems |
| 13 | ko00250 | bta00250 | Alanine, aspartate and glutamate metabolism | 3 | C00025/C00438/C00022 | Genetic Information Processing |
| 14 | ko05204 | bta05207 | Chemical carcinogenesis - receptor activation | 3 | C14240/C03690/C00410 | Metabolism |
| 15 | ko00010 | bta00010 | Glycolysis / Gluconeogenesis | 3 | C00074/C00221/C00022 | Human Diseases |
| 16 | ko00400 | bta00400 | Phenylalanine, tyrosine and tryptophan biosynthesis | 3 | C00074/C00082/C00079 | Human Diseases |
| 17 | ko00030 | bta00030 | Pentose phosphate pathway | 3 | C00257/C00221/C00022 | Metabolism |
| 18 | ko00564 | bta00564 | Glycerophospholipid metabolism | 3 | C00588/C00093/C04230 | Metabolism |
| 19 | ko00630 | bta00630 | Glyoxylate and dicarboxylate metabolism | 3 | C00025/C00149/C00022 | Metabolism |
| 20 | ko00380 | bta00380 | Tryptophan metabolism | 3 | C01717/C05834/C00328 | Human Diseases |
| 21 | ko00230 | bta00230 | Purine metabolism | 3 | C00366/C01444/C05513 | Metabolism |
| 22 | ko00460 | bta05030 | Cocaine addiction | 2 | C00025/C00082 | Metabolism |
| 23 | ko05034 | bta05034 | Alcoholism | 2 | C00025/C00082 | Metabolism |
| 24 | ko05014 | bta05014 | Amyotrophic lateral sclerosis | 2 | C00062/C00025 | Environmental Information Processing |
| 25 | ko00220 | bta00220 | Arginine biosynthesis | 2 | C00062/C00025 | Cellular Processes |
| 26 | ko00290 | bta00290 | Valine, leucine and isoleucine biosynthesis | 2 | C02504/C00022 | Organismal Systems |
| 27 | ko00780 | bta00780 | Biotin metabolism | 2 | C00120/C01909 | Metabolism |
| 28 | ko04216 | bta04216 | Ferroptosis | 2 | C00025/C00418 | Metabolism |
| 29 | ko05200 | bta05200 | Pathways in cancer | 2 | C00410/C00149 | Cellular Processes |
| 30 | ko00730 | bta00730 | Thiamine metabolism | 2 | C00082/C00022 | Environmental Information Processing |
| 31 | ko00410 | bta00410 | beta-Alanine metabolism | 2 | C00864/C00106 | Human Diseases |
| 32 | ko00650 | bta00650 | Butanoate metabolism | 2 | C00025/C00022 | Metabolism |
| 33 | ko00760 | bta00760 | Nicotinate and nicotinamide metabolism | 2 | C01020/C00022 | Metabolism |
| 34 | ko00350 | bta00350 | Tyrosine metabolism | 2 | C00082/C00022 | Human Diseases |
| 35 | ko00520 | bta00520 | Amino sugar and nucleotide sugar metabolism | 2 | C00270/C00446 | Human Diseases |
| 36 | ko00860 | bta00860 | Porphyrin and chlorophyll metabolism | 2 | C00025/C02800 | Human Diseases |
| 37 | ko04150 | bta04150 | mTOR signaling pathway | 1 | C00062 | Metabolism |
| 38 | ko04114 | bta04114 | Oocyte meiosis | 1 | C00410 | Metabolism |
| 39 | ko04914 | bta04914 | Progesterone-mediated oocyte maturation | 1 | C00410 | Metabolism |
| 40 | ko04068 | bta04068 | FoxO signaling pathway | 1 | C00025 | Human Diseases |
| 41 | ko05142 | bta05142 | Chagas disease | 1 | C00062 | Metabolism |
| 42 | ko05016 | bta05016 | Huntington disease | 1 | C00025 | Organismal Systems |
| 43 | ko05143 | bta05143 | African trypanosomiasis | 1 | C00328 | Metabolism |
| 44 | ko00472 | bta00472 | D-Arginine and D-ornithine metabolism | 1 | C00062 | Environmental Information Processing |
| 45 | ko05215 | bta05215 | Prostate cancer | 1 | C00410 | Metabolism |
| 46 | ko04721 | bta04721 | Synaptic vesicle cycle | 1 | C00025 | Environmental Information Processing |
| 47 | ko04066 | bta04066 | HIF-1 signaling pathway | 1 | C00022 | Metabolism |
| 48 | ko00910 | bta00910 | Nitrogen metabolism | 1 | C00025 | Human Diseases |
| 49 | ko04152 | bta04152 | AMPK signaling pathway | 1 | C00022 | Metabolism |
| 50 | ko05012 | bta05012 | Parkinson disease | 1 | C00082 | Metabolism |
| 51 | ko00480 | bta00480 | Glutathione metabolism | 1 | C00025 | Metabolism |
| 52 | ko00561 | bta00561 | Glycerolipid metabolism | 1 | C00093 | Metabolism |
| 53 | ko00640 | bta00640 | Propanoate metabolism | 1 | C05984 | Metabolism |
| 54 | ko00052 | bta00052 | Galactose metabolism | 1 | C00446 | Metabolism |
| 55 | ko00340 | bta00340 | Histidine metabolism | 1 | C00025 | Metabolism |
| 56 | ko00071 | bta00071 | Fatty acid degradation | 1 | C00489 | Environmental Information Processing |
| 57 | ko00524 | bta04080 | Neuroactive ligand-receptor interaction | 1 | C00025 | Metabolism |
| 58 | ko00061 | bta00061 | Fatty acid biosynthesis | 1 | C08362 | Metabolism |
| 59 | ko00040 | bta00040 | Pentose and glucuronate interconversions | 1 | C00022 | Metabolism |
| 60 | ko00270 | bta00270 | Cysteine and methionine metabolism | 1 | C00022 | Metabolism |
| 61 | ko00130 | bta00130 | Ubiquinone and other terpenoid-quinone biosynthesis | 1 | C00082 | Metabolism |
Disclaimer/Publisher’s Note: The statements, opinions and data contained in all publications are solely those of the individual author(s) and contributor(s) and not of MDPI and/or the editor(s). MDPI and/or the editor(s) disclaim responsibility for any injury to people or property resulting from any ideas, methods, instructions or products referred to in the content. |
© 2023 by the authors. Licensee MDPI, Basel, Switzerland. This article is an open access article distributed under the terms and conditions of the Creative Commons Attribution (CC BY) license (http://creativecommons.org/licenses/by/4.0/).


