Submitted:
06 December 2023
Posted:
06 December 2023
You are already at the latest version
Abstract
Keywords:
Introduction
Obtaining Gene Expression Data
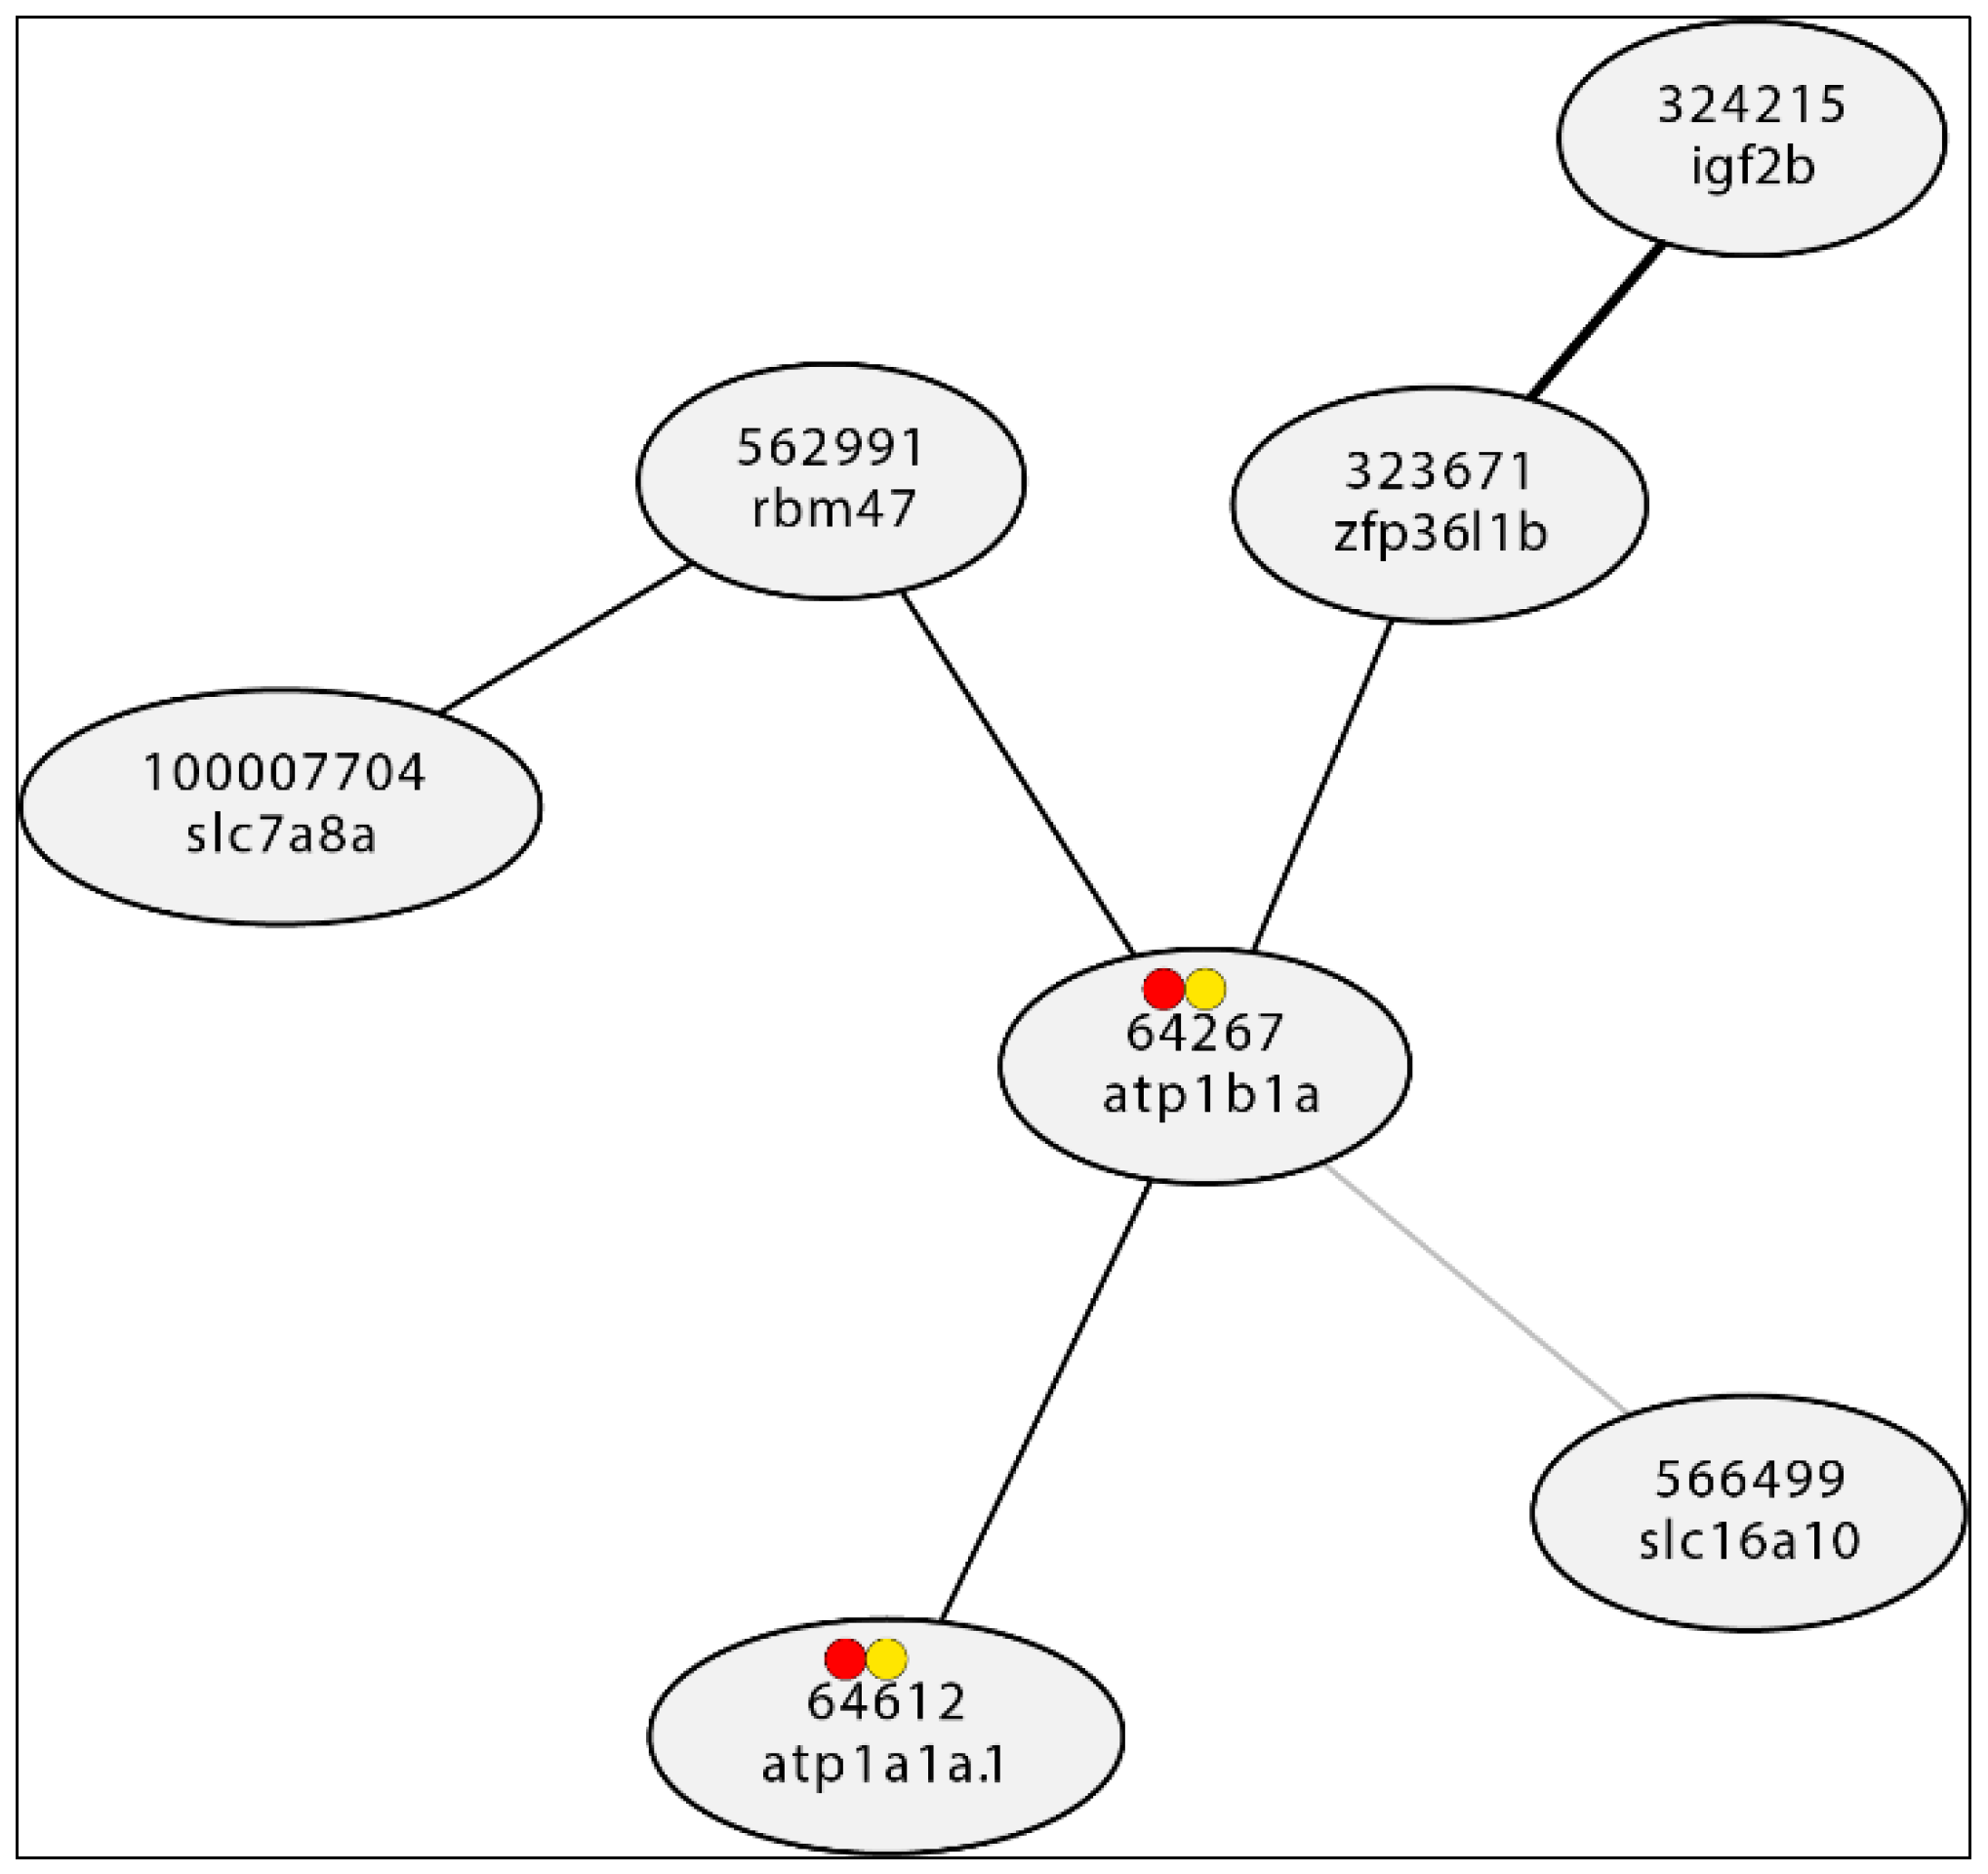
Co-Expression Databases for Information
- Identification of illness genes: Co-expression databases can be used to find genes that are probably implicated in a given disease.
- Drug target identification: Genes that may be prospective drug targets can be found using co-expression databases.
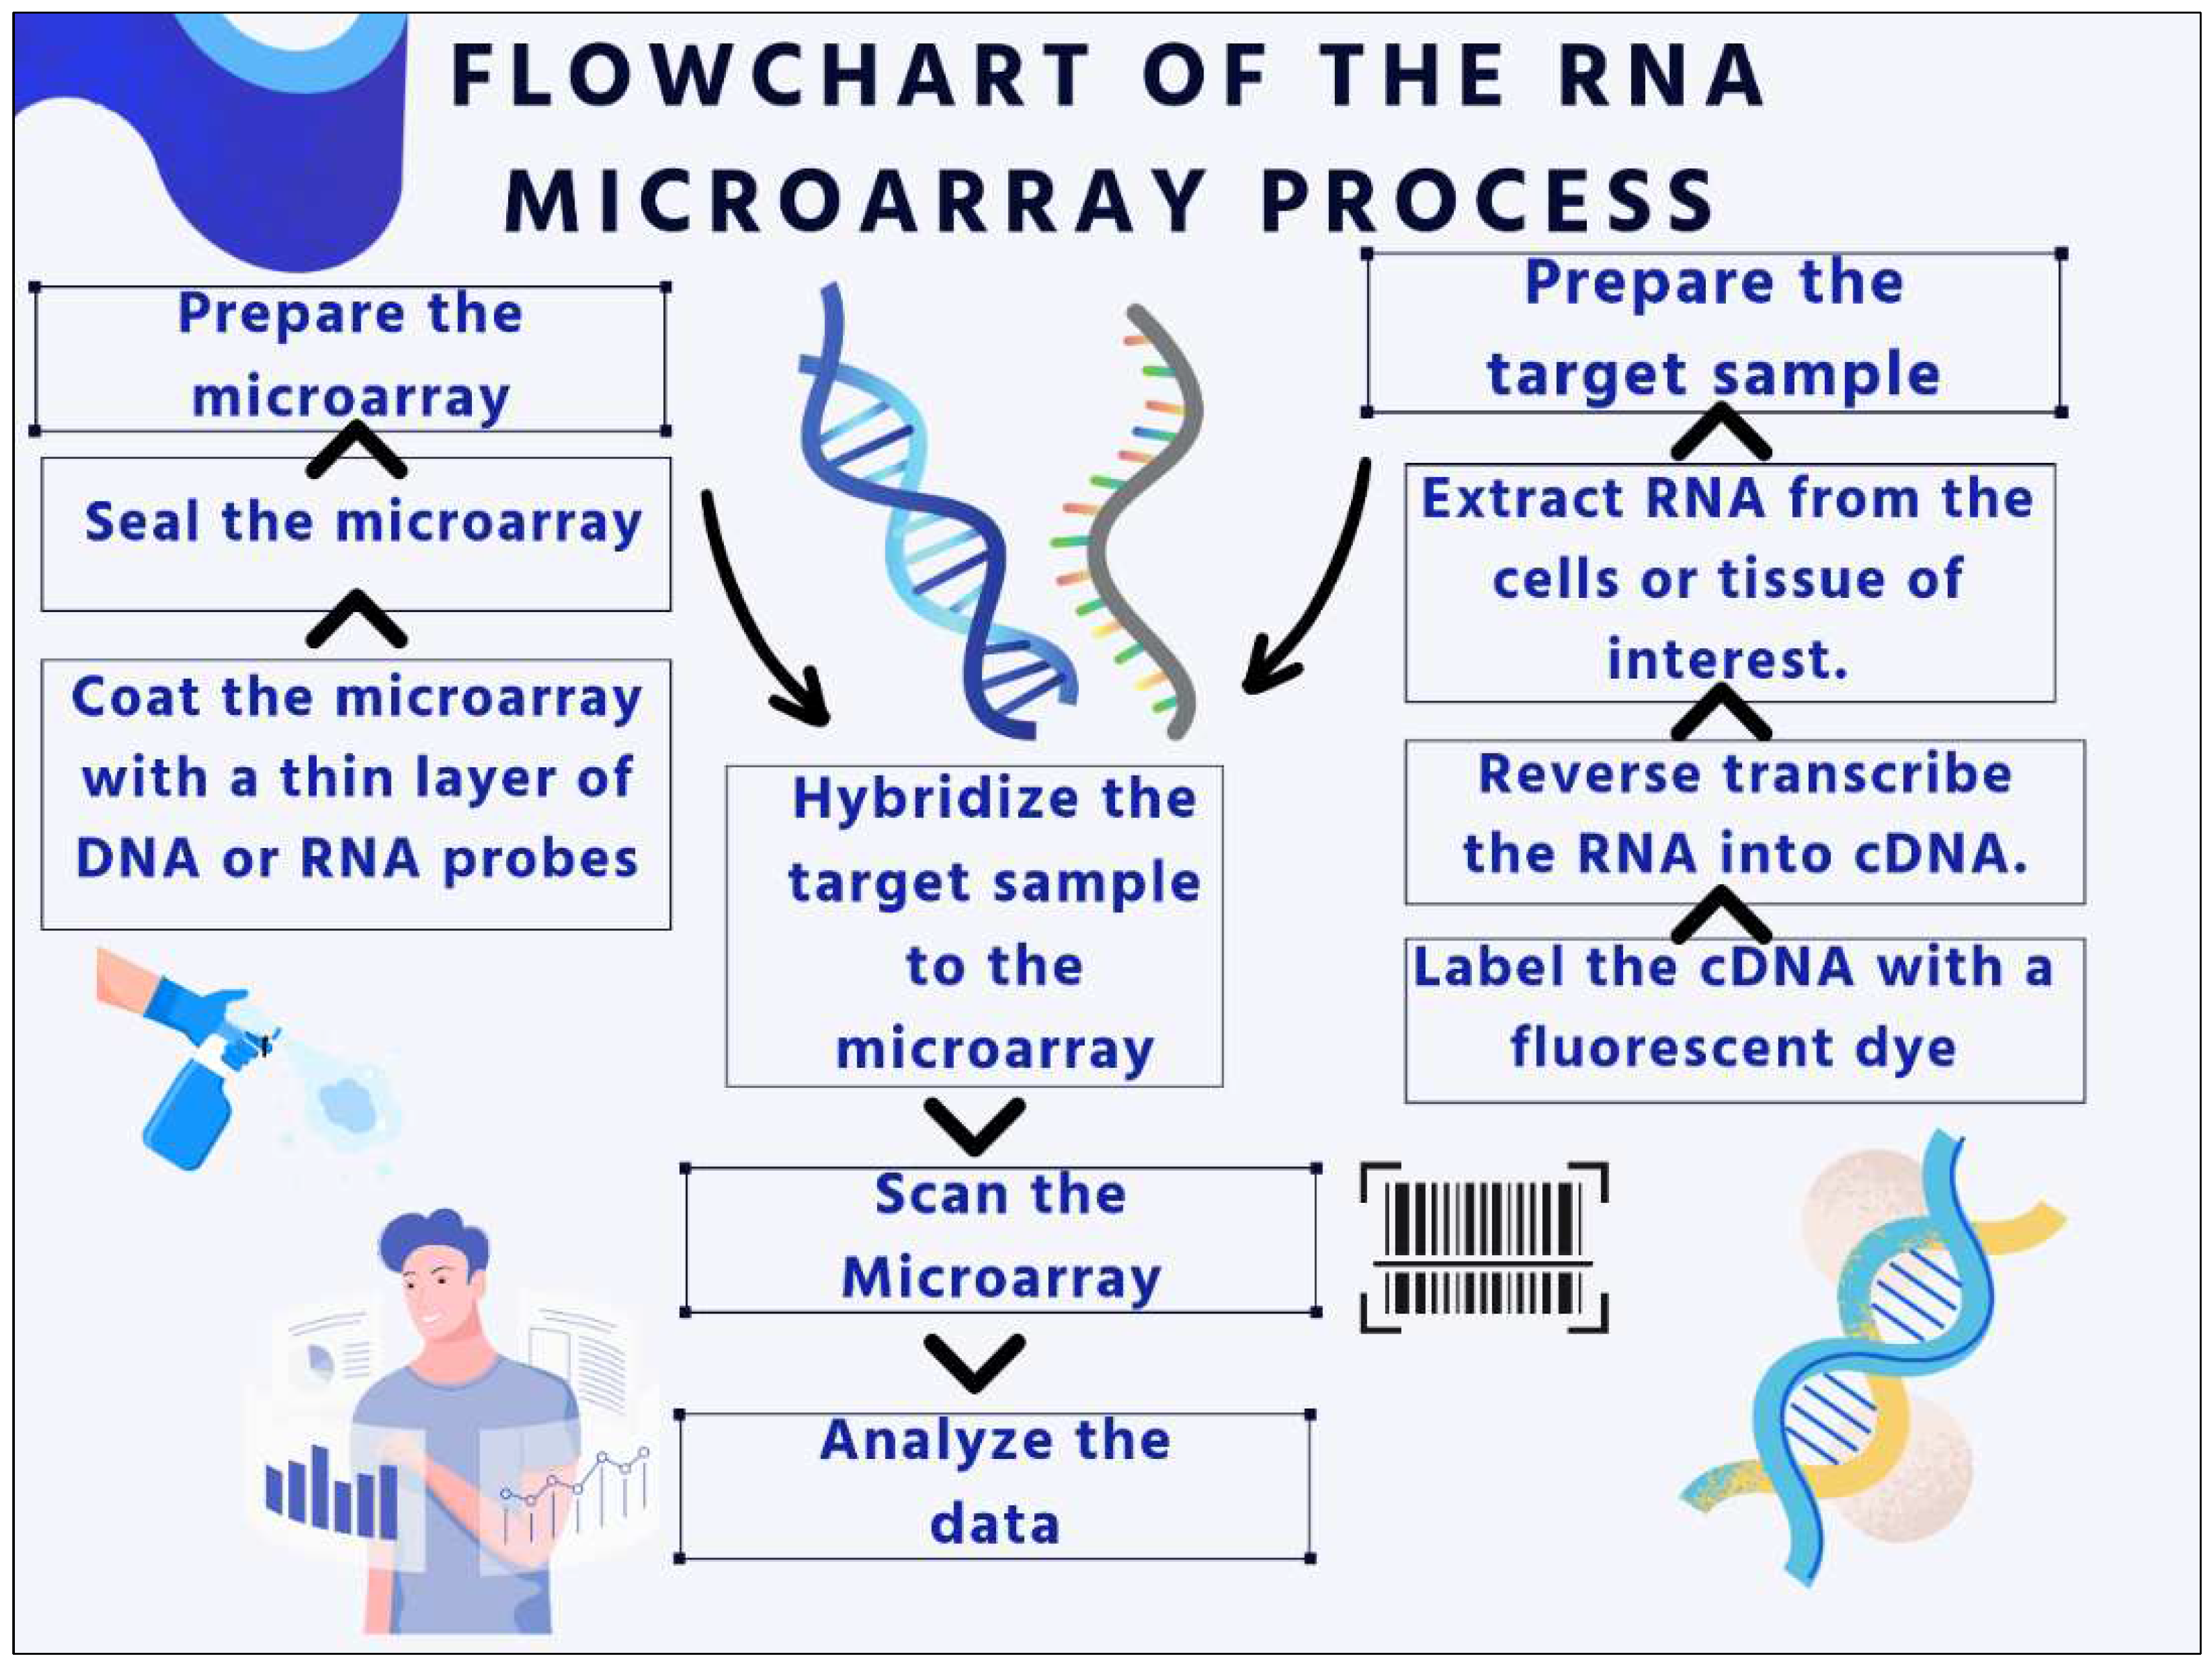
DNA or RNA Microarray
- A thin layer of DNA or RNA probes is placed on top of the microarray.
- A fluorescent dye has been used to label the target sample.
- The microarray is hybridized with the target sample.
- To find the labeled target molecules' fluorescence, a laser is used to scan the microarray.
- The degree of expression of each gene or DNA region is determined by measuring the fluorescence intensity at each site.

- In a single experiment, thousands of genes' levels of expression are measured by a process called gene expression profiling. This can be used to investigate how various therapies affect gene expression or to find genes that are expressed differently in various cell types or tissues.
- Genotype analysis entails detecting whether a certain DNA mutation is present or absent. This can be used to determine who is at risk for contracting particular diseases or to diagnose hereditary diseases.
- In comparative genomic hybridization, the DNA composition of two or more samples is compared. Chromosome abnormalities, such as deletions or duplications, can be found with this method.
Network Analysis of Genetic Data

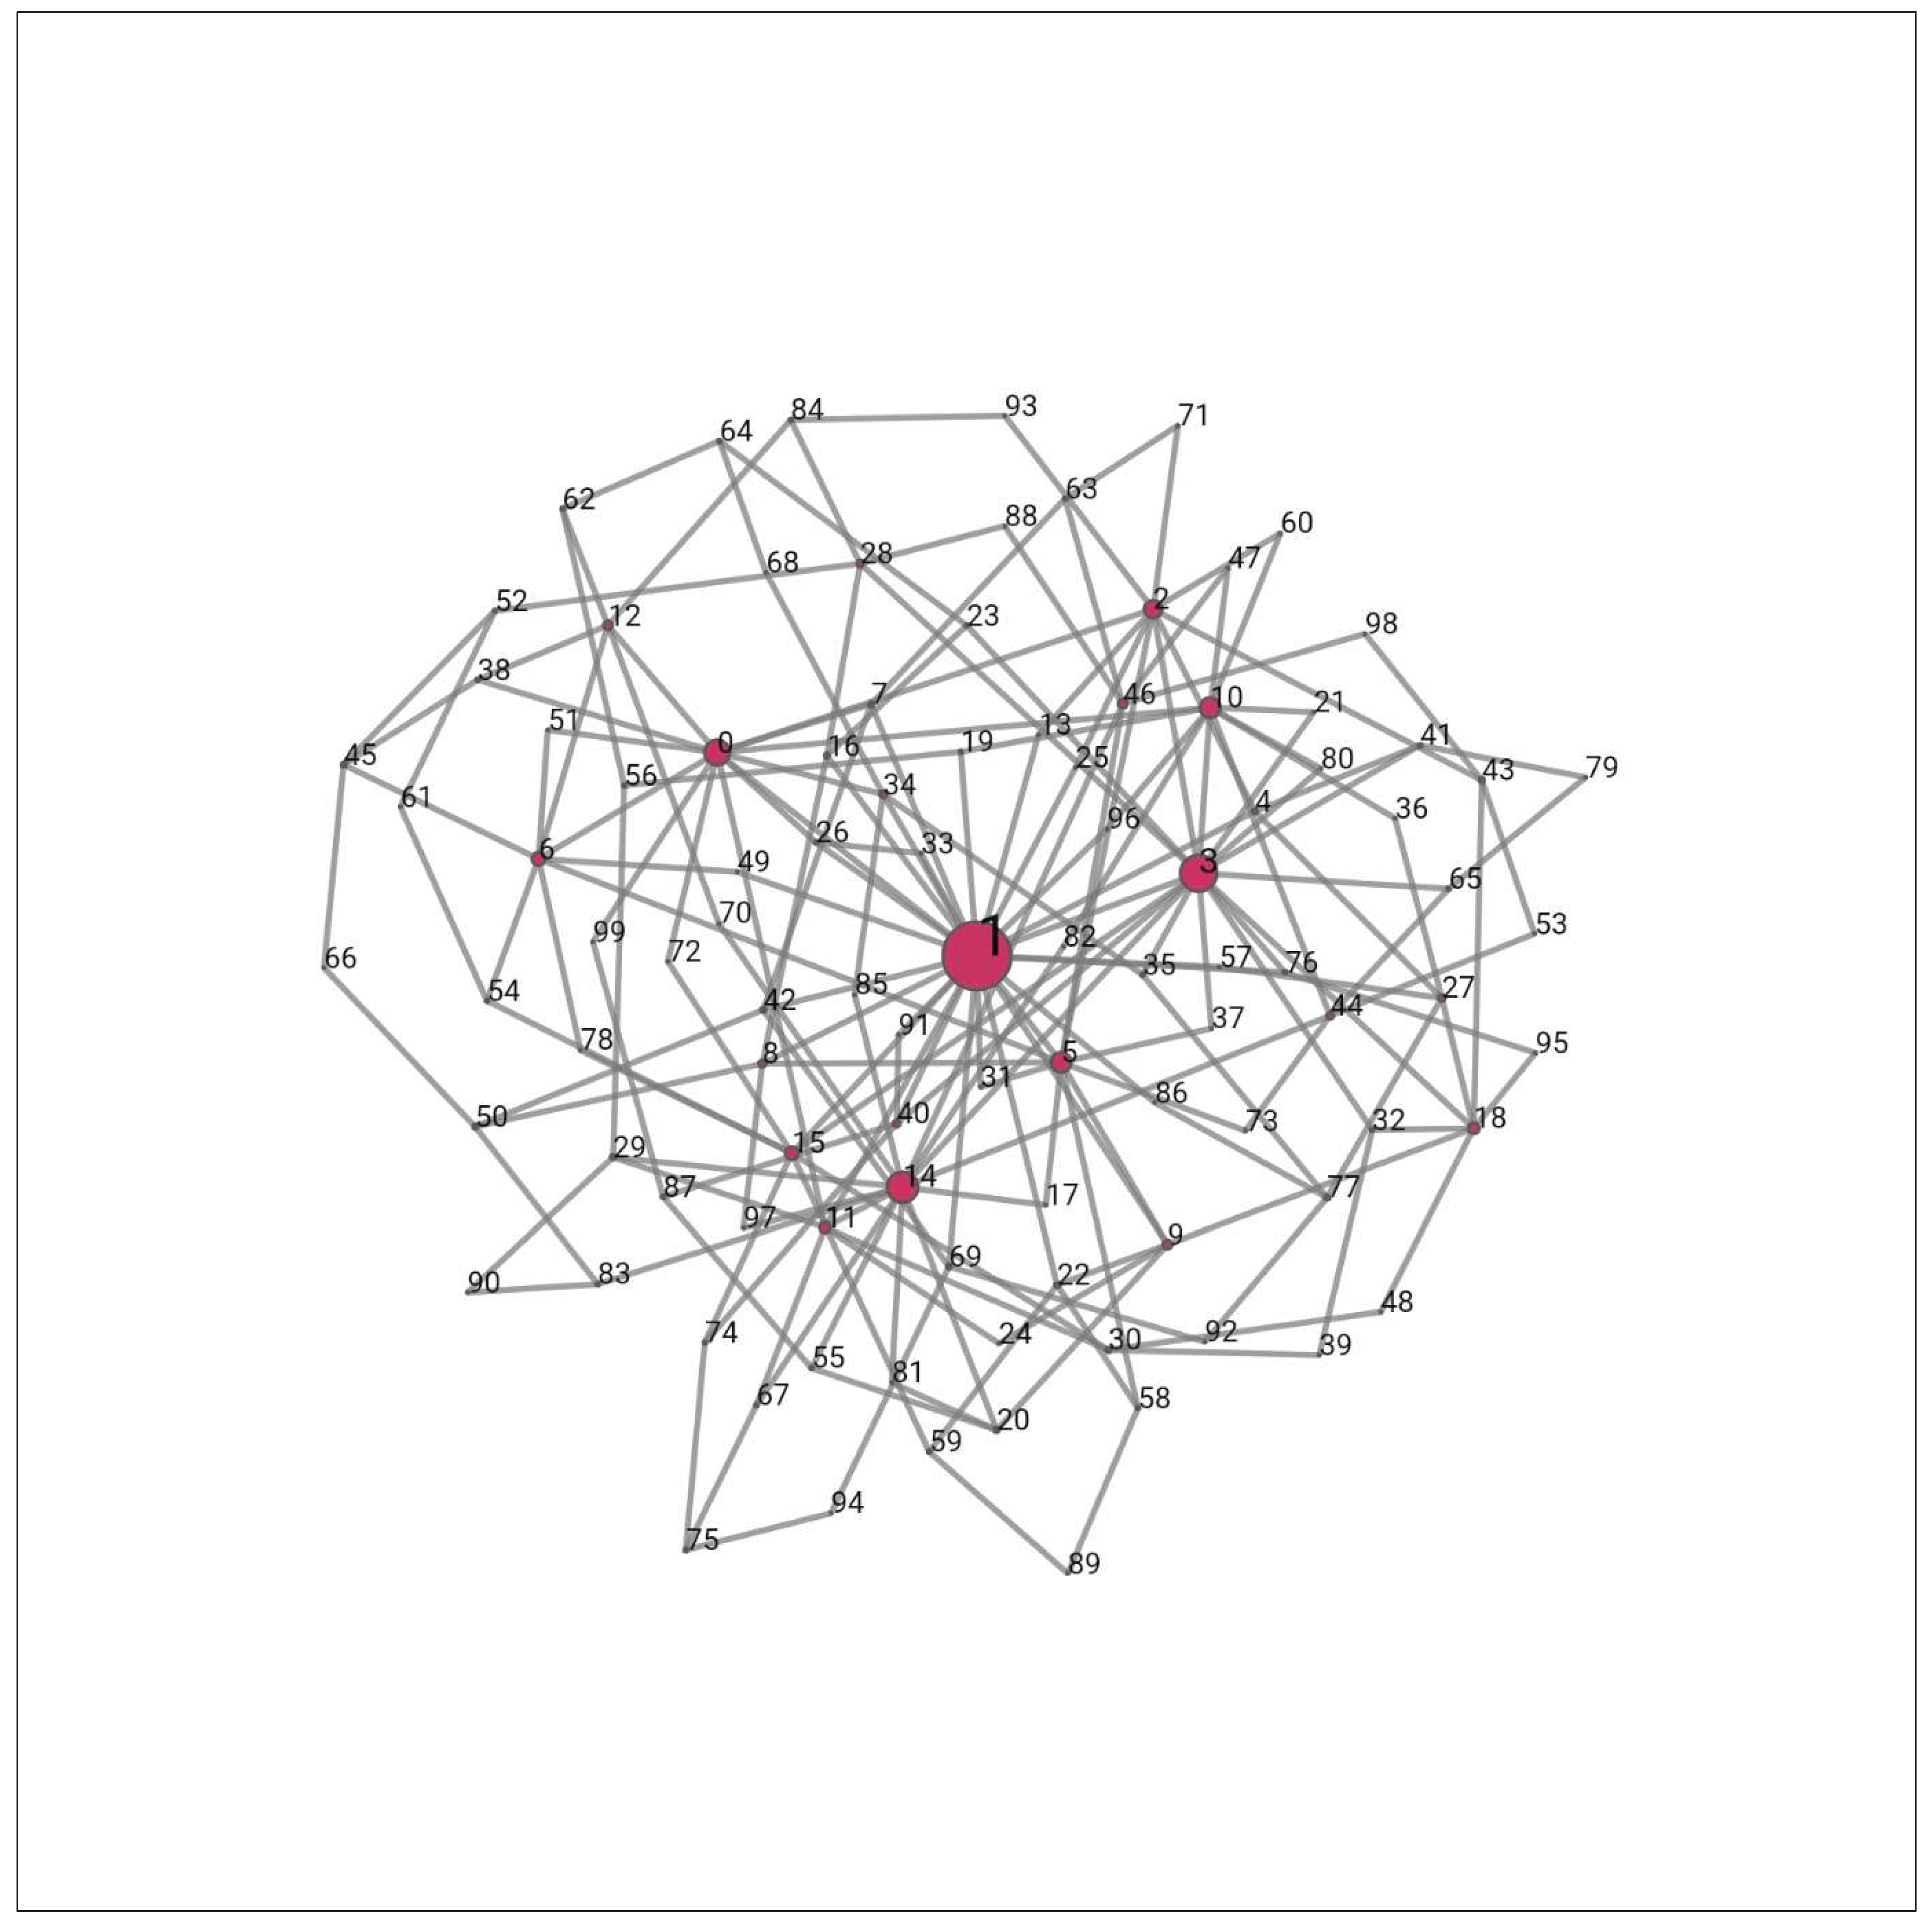
Scale-Free Gene Interaction Network

Formation of Scale-Free Networks
- Hubs: Compared to other nodes in the network, hubs have a disproportionately large number of connections. In other words, they are nodes with lots of connections. Hubs are essential for preserving connectivity and the network's general structure in scale-free networks. They serve as hubs for the network's many nodes, facilitating communication and information exchange. Network connectivity may be adversely affected by the removal or disruption of hubs, leaving them open to deliberate attacks or malfunctions (Sato et al., 2012).
- In gene interaction networks, the edges stand in for interactions or connections between the genes' nodes, which represent genes. Protein-protein interactions are an example of a physical interaction. Regulatory interactions include gene regulation and signaling cascades.
- 2
- Preferential attachment: Preferential attachment is a process that accounts for the expansion of scale-free networks. According to this, new nodes joining a network are more likely to connect to nodes that are already connected to many other nodes. In other words, nodes with more connections and a higher degree are more likely to draw in new connections. The rich-get-richer phenomena, whereby well-connected nodes tend to assemble even more connections over time, is caused by this preferred attachment mechanism. As a result, a power-law degree distribution is formed, with most nodes having just a small number of connections and a select few nodes (hubs) having a huge number of connections(Sato et al., 2011).
- Preferential attachment has been noted in a number of real-world networks, including citation networks, social networks, the World Wide Web, and biological networks. It aids in the development of scale-free networks and provides an explanation for the establishment of hub-like nodes (Rajamani & Iyer, 2023b). Preferential attachment is a notion that has been extensively researched in the field of network science. It has implications for network resilience, information diffusion, and network growth.
- 3
- Power-law degree distribution: A certain structural feature of a complex network known as a power-law degree distribution is present in scale-free networks. The degree distribution of a network, in computing terminology, is the distribution of the number of connections (edges) that each node in the network possesses.
Conclusion
References
- Aslak, U., & Maier, B. (2019). Netwulf: Interactive visualization of networks in Python. Journal of Open Source Software, 4(42), 1425. [CrossRef]
- Edwards, D. (2007). Plant bioinformatics : methods and protocols. Humana Press.
- Nacu, S., Critchley-Thorne, R., Lee, P., & Holmes, S. (2007). Gene expression network analysis and applications to immunology. Bioinformatics, 23(7), 850–858. [CrossRef]
- Rajamani, S. K., & Iyer, R. S. (2023a). Machine Learning-Based Mobile Applications Using Python and Scikit-Learn. Advances in Wireless Technologies and Telecommunication Book Series, 282–306. [CrossRef]
- Santhosh Kumar Rajamani & Radha Srinivasan Iyer. (2023b). Declining Freshwater Species Biodiversity. In N. K. Chourasia & K. Chahal (Eds.), Perspectives on Global Biodiversity Scenarios and Environmental Services in the 21st Century (pp. 22–56). IGI Global. [CrossRef]
- Rajamani, S. K., & Iyer, R. S. (2023c). Methods of Complex Network Analysis to Screen for Cyberbullying (pp. 218–242). CRC Press. [CrossRef]
- RiceFREND. (n.d.). Ricefrend.dna.affrc.go.jp. Retrieved July 8, 2023, from https://ricefrend.dna.affrc.go.jp/.
- Sato, Y. S., Antonio, B. A., Nobukazu Namiki, Hinako Takehisa, Minami, H., Kaori Kamatsuki, Sugimoto, K., Shimizu, Y., Hirohiko Hirochika, & Yoshiaki Nagamura. (2011). RiceXPro: a platform for monitoring gene expression in japonica rice grown under natural field conditions. 39(Database), D1141–D1148. [CrossRef]
- Sato, Y. S., Hinako Takehisa, Kaori Kamatsuki, Minami, H., Nobukazu Namiki, Hiroshi Ikawa, Hajime Ohyanagi, Sugimoto, K., Antonio, B. A., & Yoshiaki Nagamura. (2012). RiceXPro Version 3.0: expanding the informatics resource for rice transcriptome. 41(D1), D1206–D1213. [CrossRef]
- Sato, Y., Namiki, N., Takehisa, H., Kamatsuki, K., Minami, H., Ikawa, H., Ohyanagi, H., Sugimoto, K., Itoh, J.-I., Antonio, B. A., & Nagamura, Y. (2012). RiceFREND: a platform for retrieving coexpressed gene networks in rice. Nucleic Acids Research, 41, D1. [CrossRef]
- Zhang, B., & Horvath, S. (2005). A General Framework for Weighted Gene Co-Expression Network Analysis. Statistical Applications in Genetics and Molecular Biology, 4(1). [CrossRef]
- Zimmermann, P., Hennig, L., & Gruissem, W. (2005). Gene-expression analysis and network discovery using Genevestigator. Trends in Plant Science, 10(9), 407–409. [CrossRef]
Disclaimer/Publisher’s Note: The statements, opinions and data contained in all publications are solely those of the individual author(s) and contributor(s) and not of MDPI and/or the editor(s). MDPI and/or the editor(s) disclaim responsibility for any injury to people or property resulting from any ideas, methods, instructions or products referred to in the content. |
© 2023 by the authors. Licensee MDPI, Basel, Switzerland. This article is an open access article distributed under the terms and conditions of the Creative Commons Attribution (CC BY) license (http://creativecommons.org/licenses/by/4.0/).


