Submitted:
06 December 2023
Posted:
07 December 2023
You are already at the latest version
Abstract
Keywords:
1. Introduction
2. Materials and Methods
2.1. Bladder Cancer Samples from Datasets
2.2. Clinical Specimens
2.3. In Situ Hybridization (ISH) Assay
2.4. Cell Culture
2.5. Construction of SCARNA12 Knockdown Cell Line Using CRISPR/Cas9 Gene-Editing Technology
2.6. RNA Extraction and Quantitative Real-Time Polymerase Chain Reaction (qRT-PCR)
2.7. Cell Viability Assay
2.8. Colony Formation Assay
2.9. Wound-healing Assay
2.10. Transwell Assay
2.11. Cell Cycle Analysis
2.12. Cell Apoptosis Assay
2.13. Nude Mice Experiments
2.14. Chromatin Isolation by RNA Purification (ChIRP) Experiment
2.15. Functional Analysis of SCARNA12 in BLCA
2.16. Transcription factor prediction
2.17. Single-Cell Isolation and Metal-Isotope-Labeled-Antibodies
2.18. Single-Cell Mass Cytometry (CyTOF) and Data Analysis
2.19. Statistical Analysis
3. Results
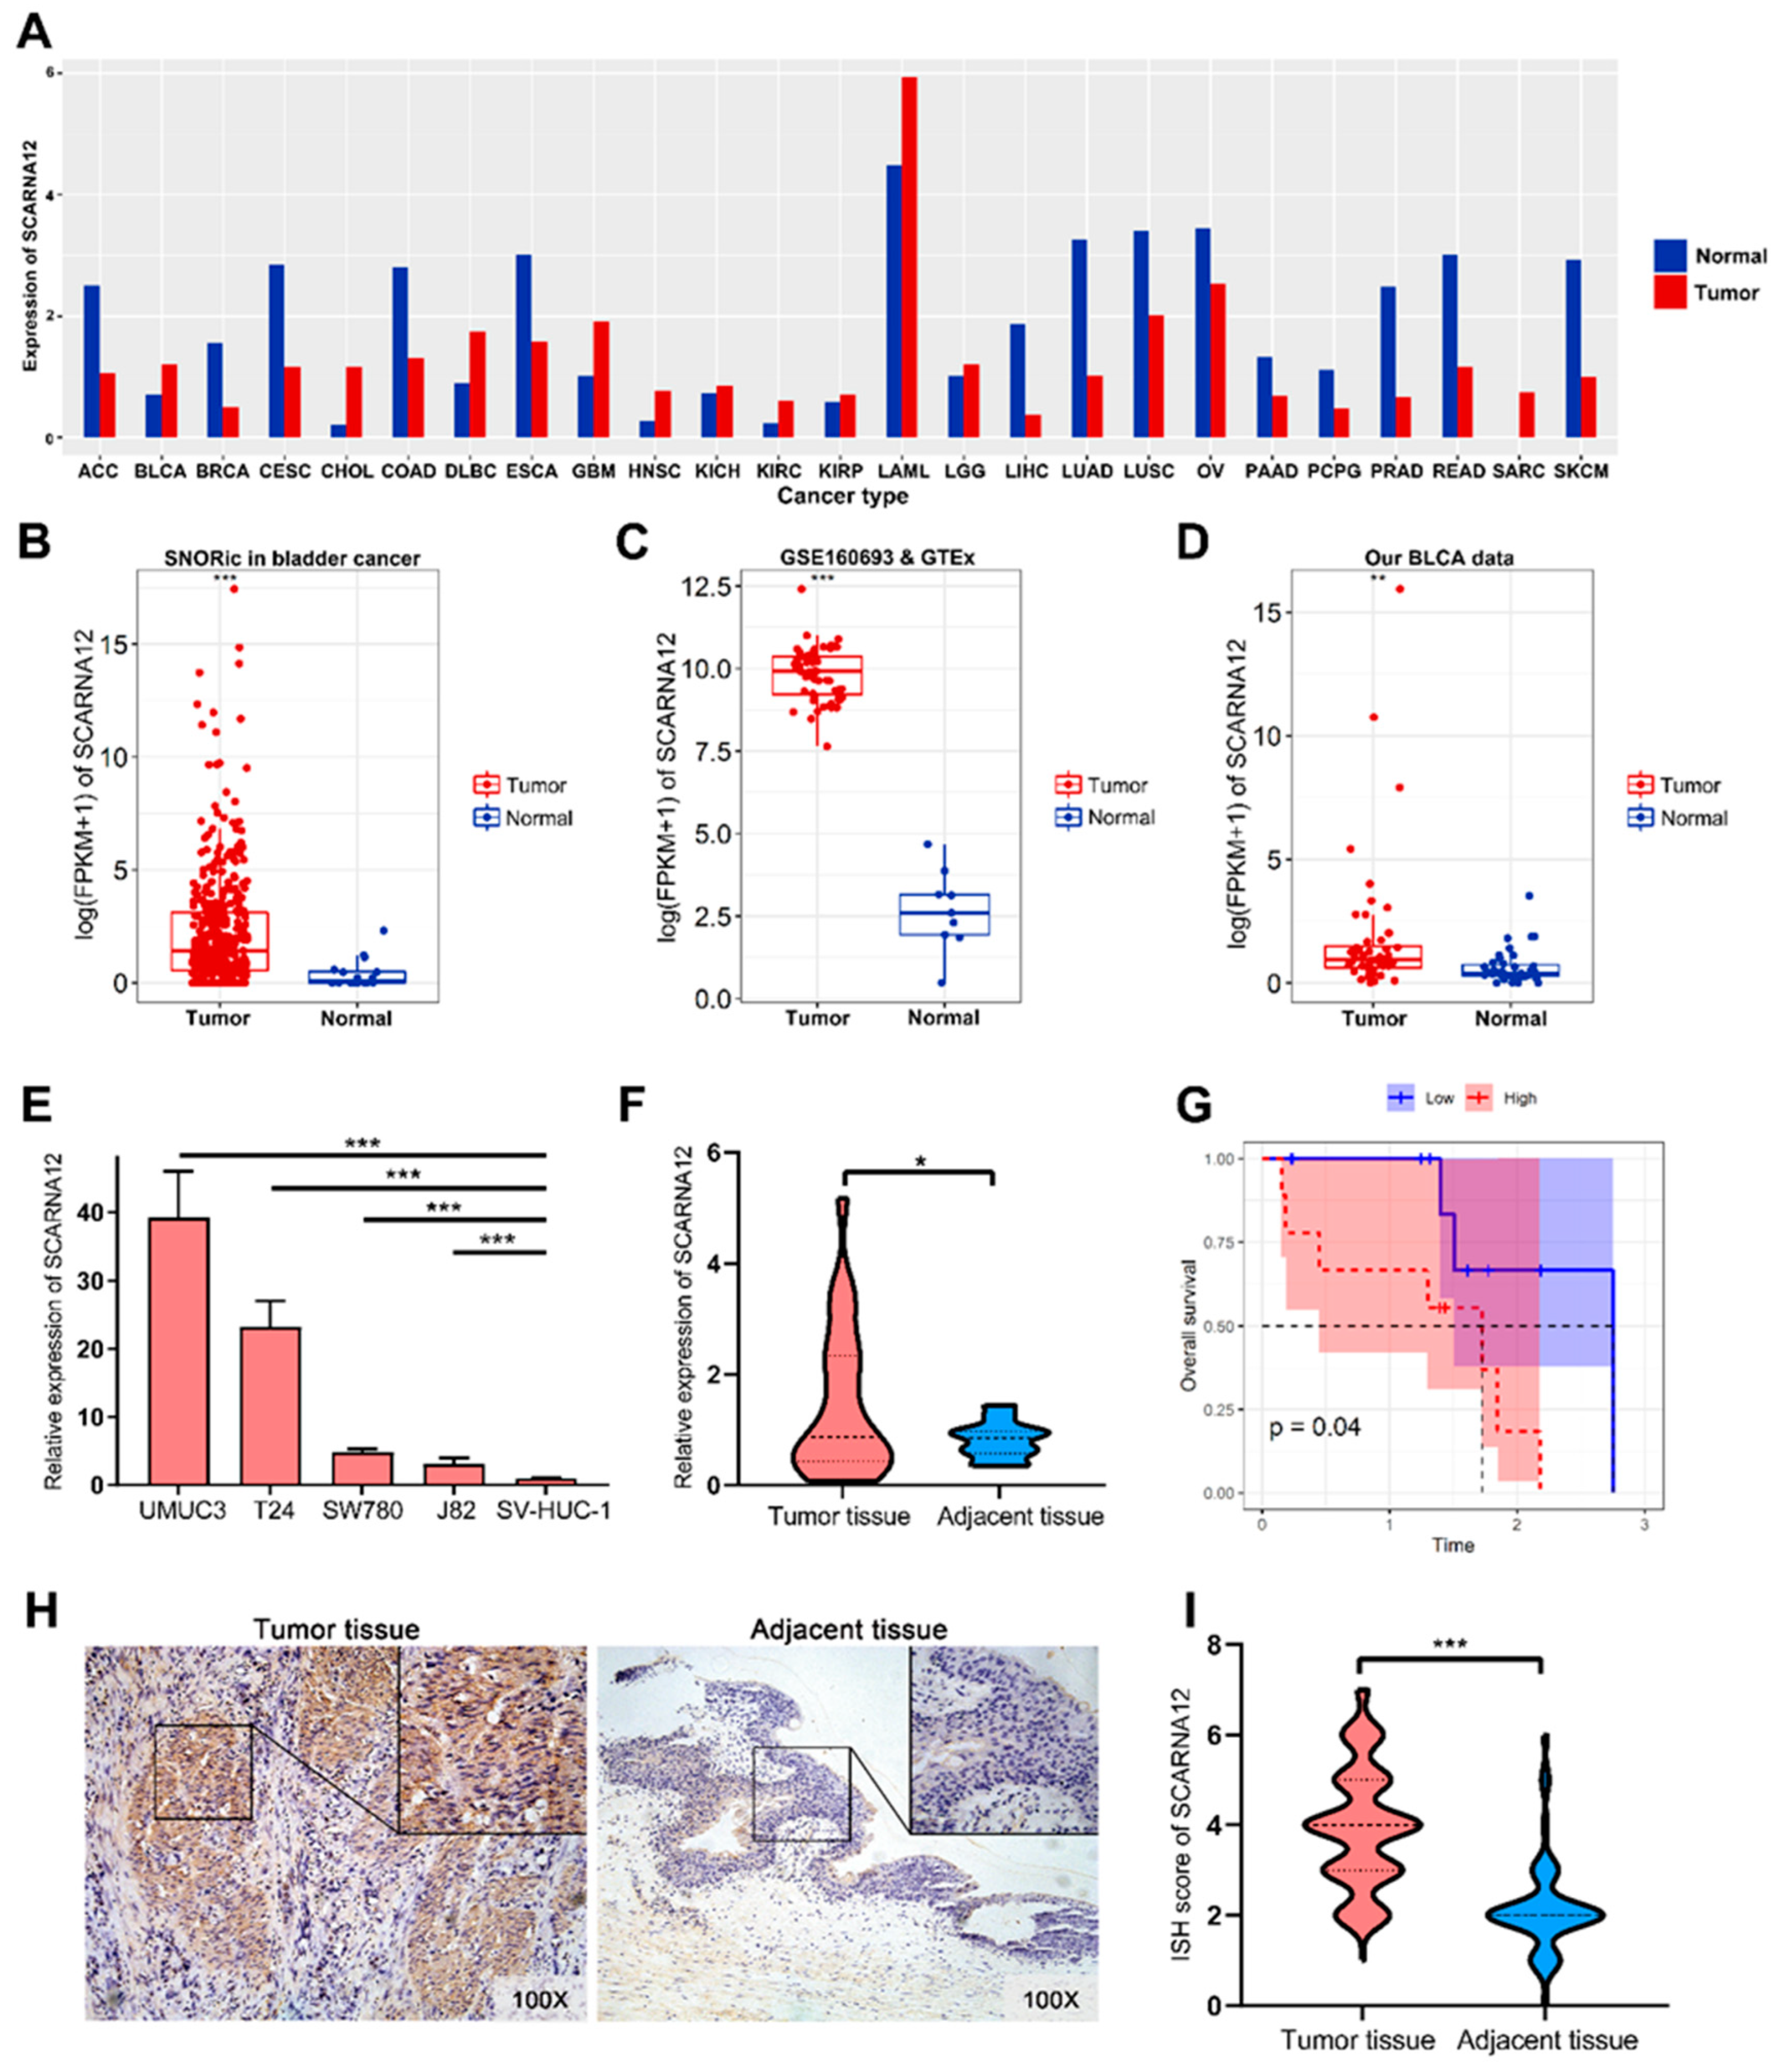
3.1. SCARNA12 is Highly Expressed in BLCA Tissues and Cell Lines
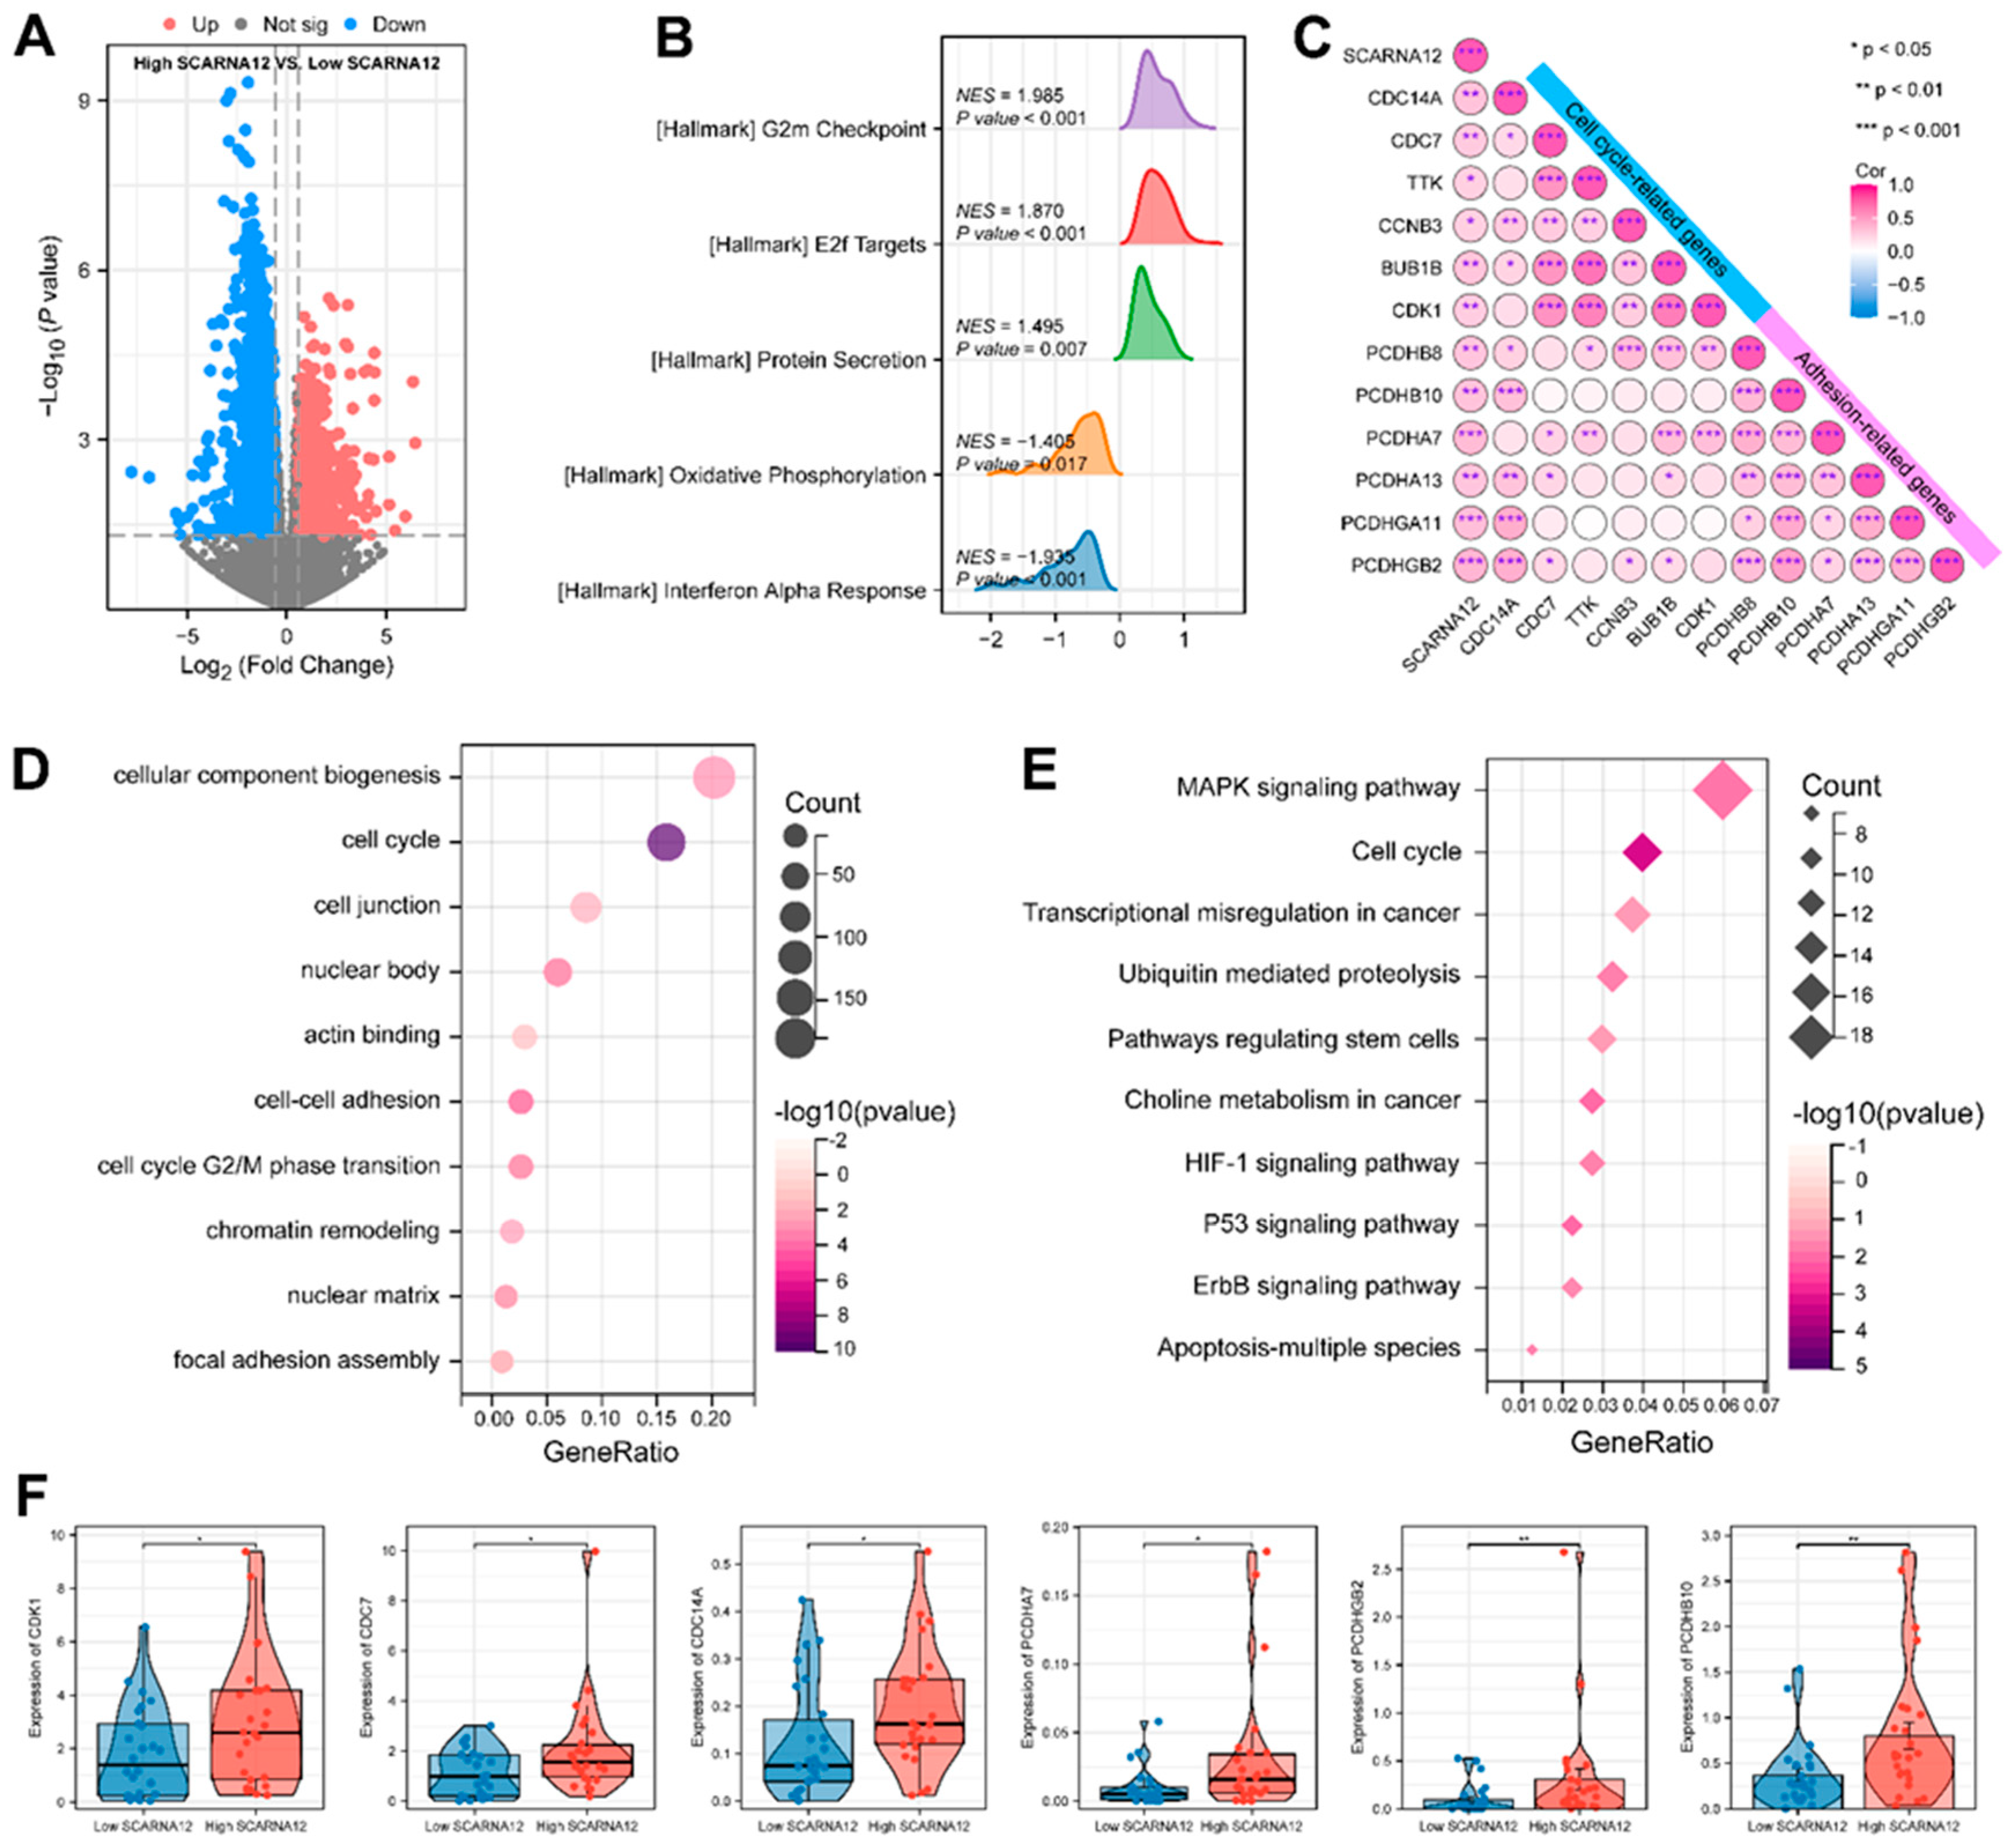
3.2. SCARNA12 is implicated with ECM Signaling and Cell Cycle Regulation
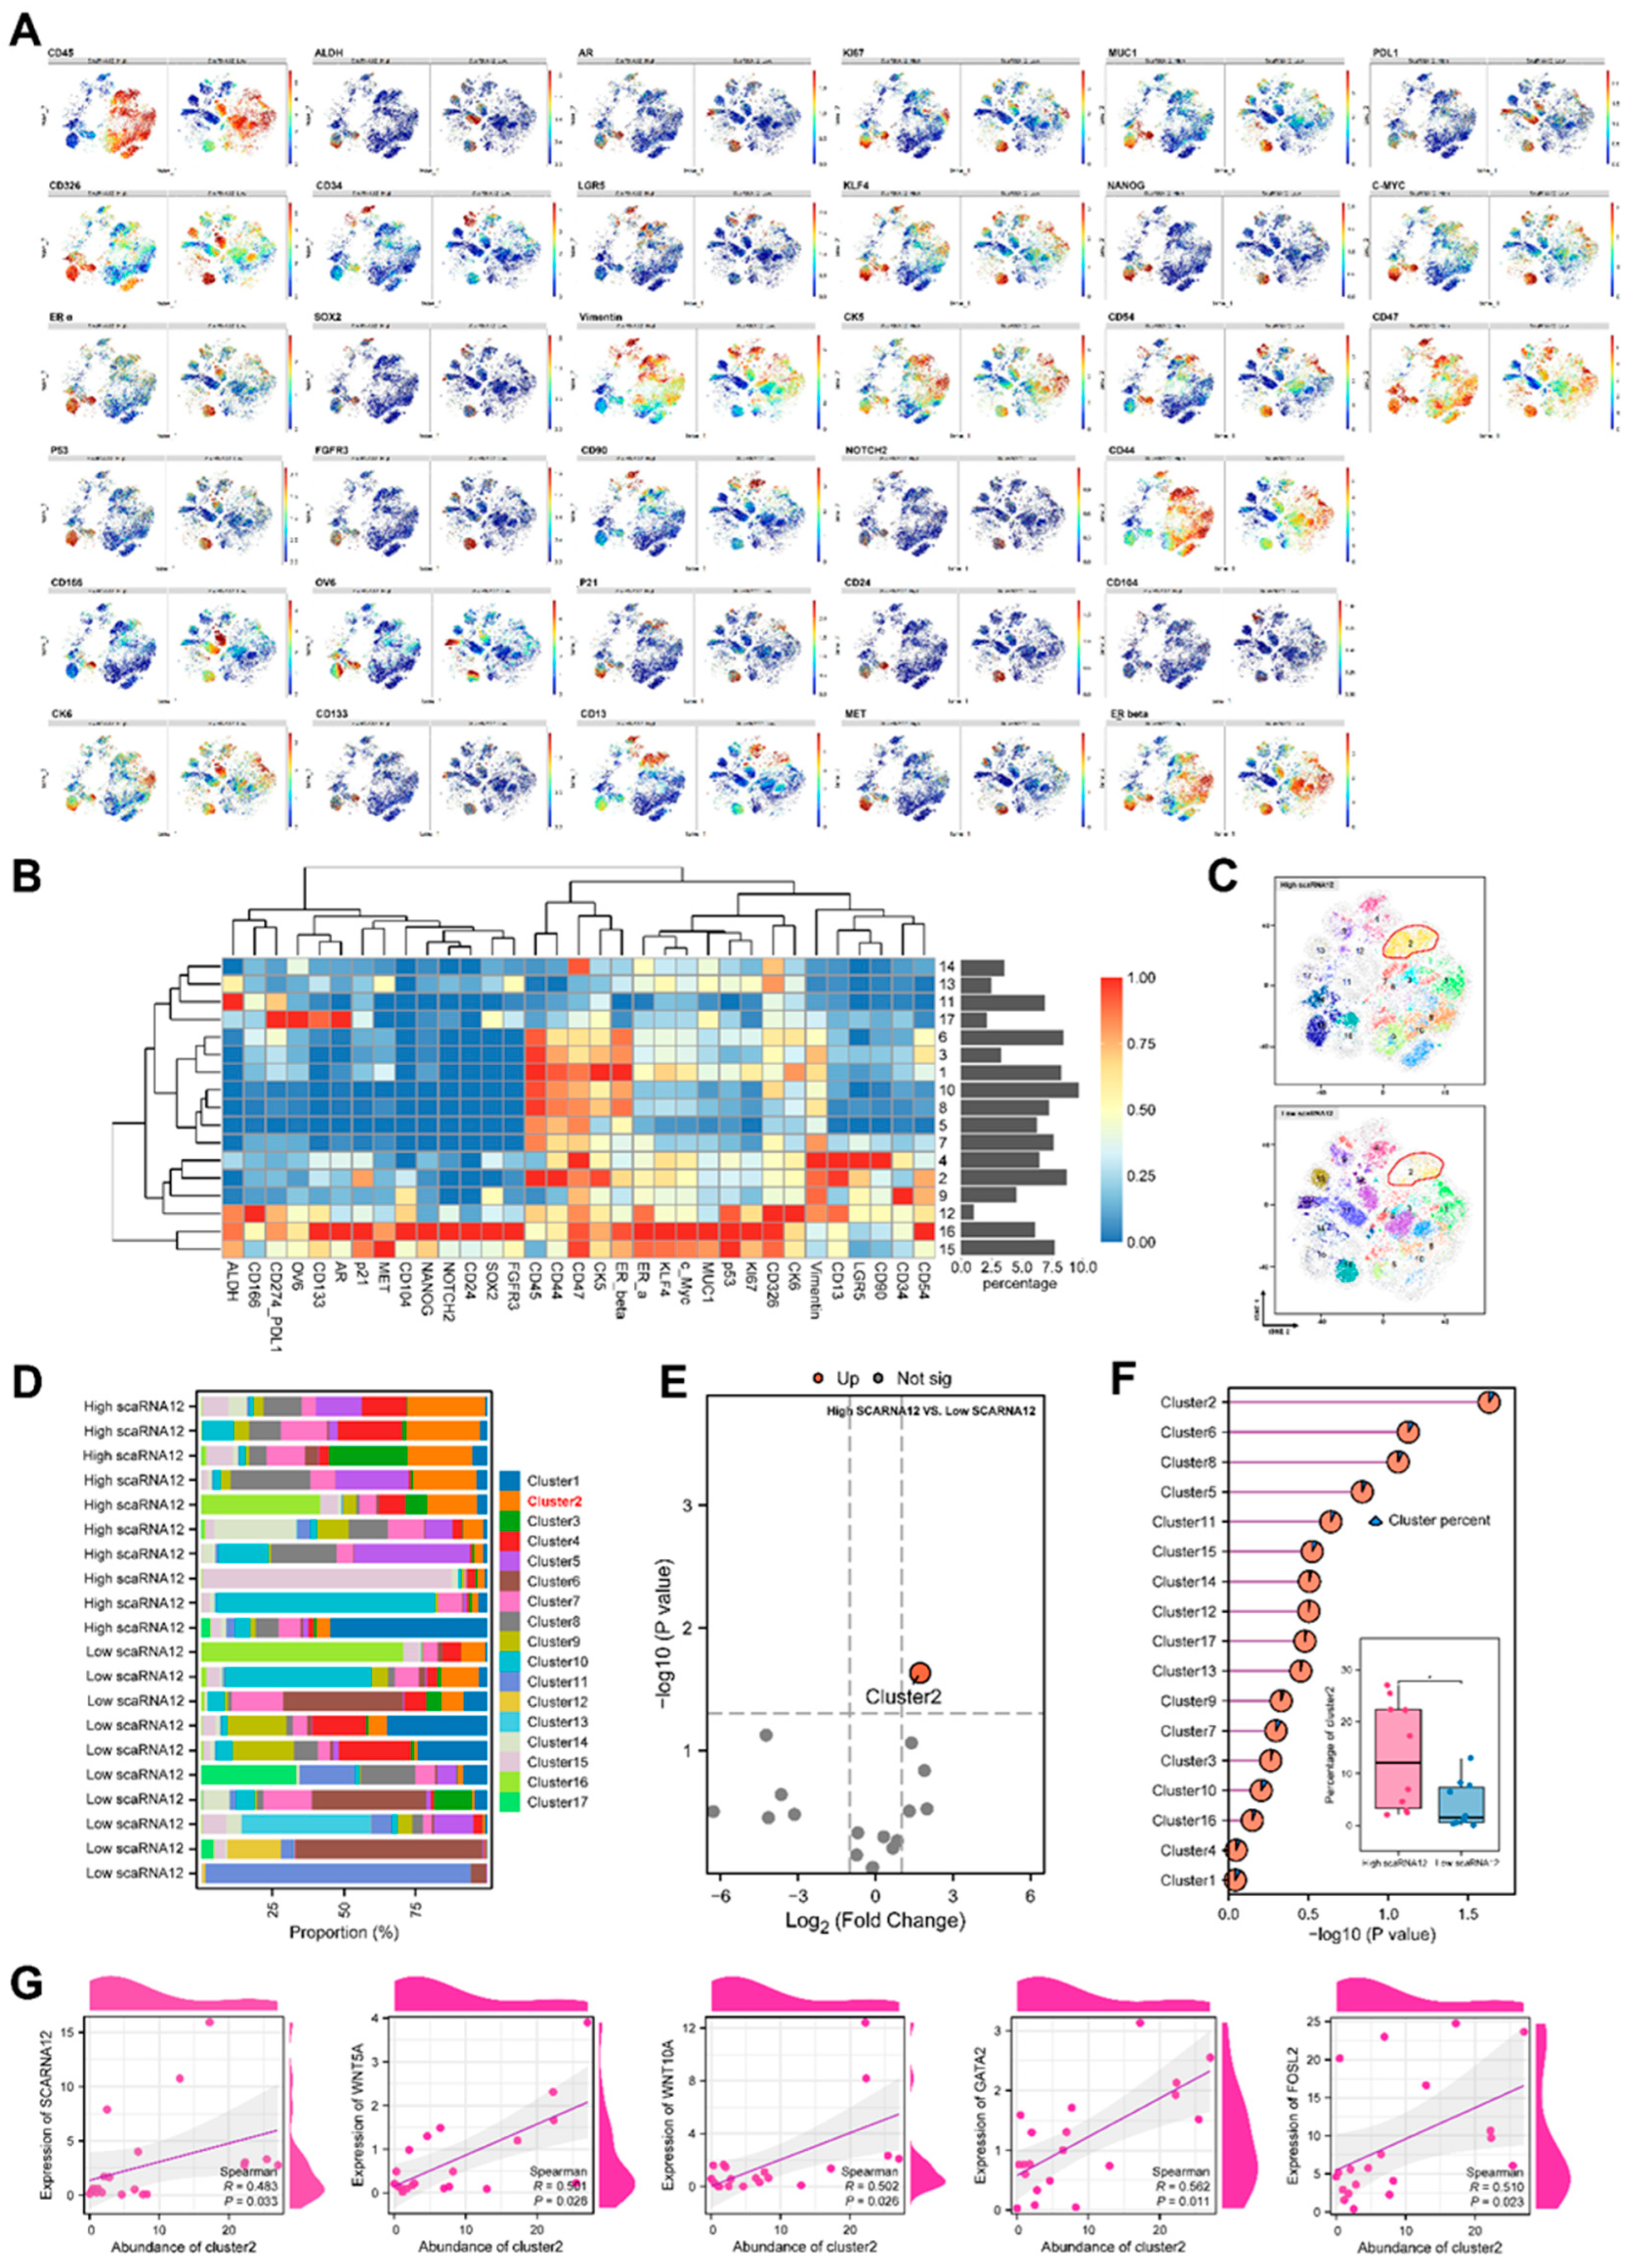
3.3. An ECM-related Cell Cluster is Enriched in BLCA with High Expression of SCARNA12 Based on CyTOF Data
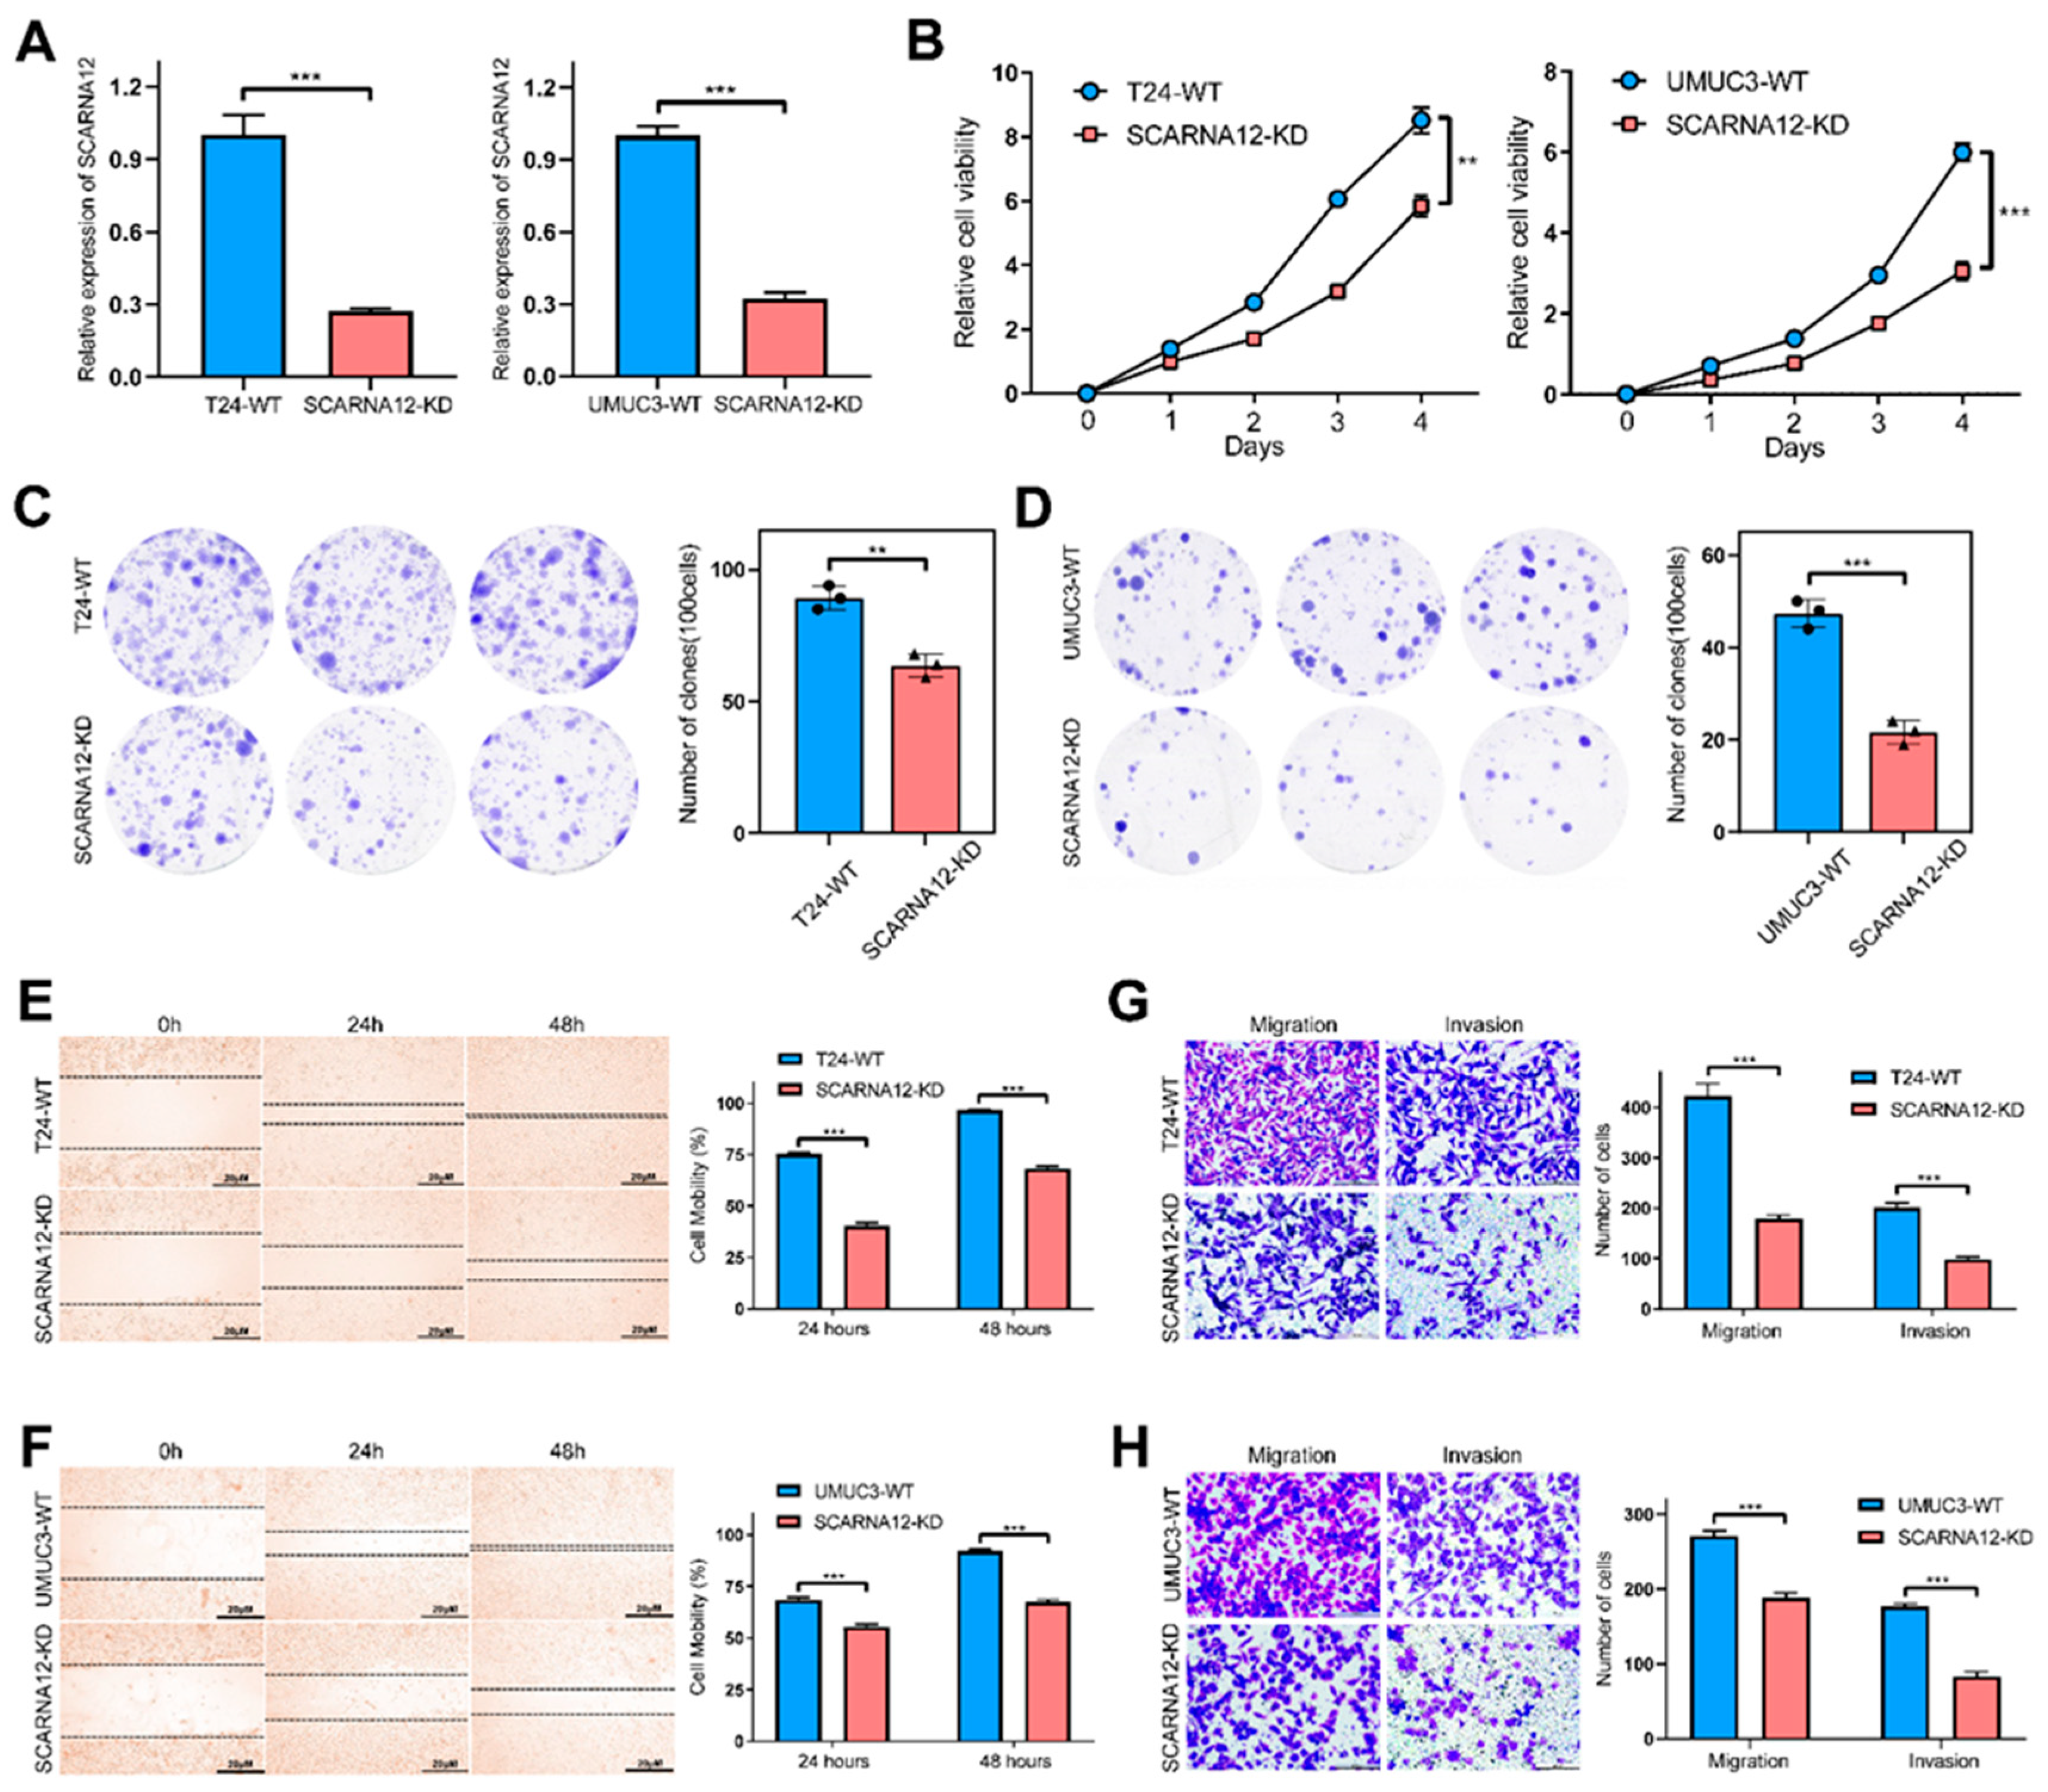
3.4. Knockdown of SCARNA12 Alters Biological Capabilities in BLCA Cell line
3.5. Functional Enrichment Analysis of Target Genes Associated with SCARNA12
3.6. Transcription Factor H2AFZ Cooperates with SCARNA12 to Regulate ECM Signaling
4. Discussion
5. Conclusions
Supplementary Materials
Author Contributions
Data Availability Statement
Acknowledgments
Conflicts of Interest
References
- Siegel, R.L., K.D. Miller, and A. Jemal, Cancer statistics, 2019. CA Cancer J Clin, 2019. 69(1): p. 7-34. [CrossRef]
- Tran, L., et al., Advances in bladder cancer biology and therapy. Nat Rev Cancer, 2021. 21(2): p. 104-121. [CrossRef]
- Cumberbatch, M.G.K., et al., Epidemiology of Bladder Cancer: A Systematic Review and Contemporary Update of Risk Factors in 2018. Eur Urol, 2018. 74(6): p. 784-795. [CrossRef]
- Lee, H.W., et al., E-cigarette smoke damages DNA and reduces repair activity in mouse lung, heart, and bladder as well as in human lung and bladder cells. Proc Natl Acad Sci U S A, 2018. 115(7): p. E1560-E1569. [CrossRef]
- Mahran, A., et al., Bladder irrigation after transurethral resection of superficial bladder cancer: a systematic review of the literature. Can J Urol, 2018. 25(6): p. 9579-9584.
- Li, M., et al., LncRNA-SNHG15 enhances cell proliferation in colorectal cancer by inhibiting miR-338-3p. Cancer Med, 2019. 8(5): p. 2404-2413. [CrossRef]
- Grzechnik, P., et al., Nuclear fate of yeast snoRNA is determined by co-transcriptional Rnt1 cleavage. Nat Commun, 2018. 9(1): p. 1783. [CrossRef]
- Andrey G. Balakin, L.S., and Maurille J. Fournier, The RNA World of the Nucleolus: Two Major Families of Small RNAs Defined by Different Box Elements with Related Functions. Cell, 1996. Vol. 86, 823–834, . [CrossRef]
- Darzacq, X., Jady,B.E., Verheggen,C., Kiss,A.M., Bertrand,E. and Kiss,T, Cajal body-specific small nuclear RNAs: a novel class of 20-O-methylation and pseudouridylation guide RNAs. EMBO Journal, 2002. Vol. 21, 2746–2756. [CrossRef]
- Jady, B.E.a.K., T, A small nucleolar guide RNA functions both in 2'-O-ribose methylation and pseudouridylation of the U5 spliceosomal RNA. EMBO Journal, 2001. Vol. 20 No. 3 pp. 541-551. [CrossRef]
- Scott, M.S. and M. Ono, From snoRNA to miRNA: Dual function regulatory non-coding RNAs. Biochimie, 2011. 93(11): p. 1987-92. [CrossRef]
- Weinstein, L.B.a.S., J.A, Guided tours: from precursor snoRNA to functional snoRNP. Curr. Opin. Cell Biol, 1999. 11, 378-384. [CrossRef]
- Ismael, H., S. Altmeyer, and H. Stahl, Regulation of the U3-, U8-, and U13snoRNA Expression by the DEAD Box Proteins Ddx5/Ddx17 with Consequences for Cell Proliferation and Survival. Noncoding RNA, 2016. 2(4). [CrossRef]
- McMahon, M., et al., A single H/ACA small nucleolar RNA mediates tumor suppression downstream of oncogenic RAS. Elife, 2019. 8. [CrossRef]
- Rimer, J.M., et al., Long-range function of secreted small nucleolar RNAs that direct 2'-O-methylation. J Biol Chem, 2018. 293(34): p. 13284-13296. [CrossRef]
- Warner, W.A., et al., Expression profiling of snoRNAs in normal hematopoiesis and AML. Blood Adv, 2018. 2(2): p. 151-163. [CrossRef]
- Schubert, T., et al., Df31 protein and snoRNAs maintain accessible higher-order structures of chromatin. Mol Cell, 2012. 48(3): p. 434-44. [CrossRef]
- Cui, L., et al., Small Nucleolar Noncoding RNA SNORA23, Up-Regulated in Human Pancreatic Ductal Adenocarcinoma, Regulates Expression of Spectrin Repeat-Containing Nuclear Envelope 2 to Promote Growth and Metastasis of Xenograft Tumors in Mice. Gastroenterology, 2017. 153(1): p. 292-306 e2. [CrossRef]
- Kaiissar Mannoor, J.S., Jipei Liao, Zhenqiu Liu and Feng Jiang, Small nucleolar RNA signatures of lung tumor-initiating cells. Molecular Cancer, 2014. 13:104. [CrossRef]
- Li, C., et al., A ROR1-HER3-lncRNA signalling axis modulates the Hippo-YAP pathway to regulate bone metastasis. Nat Cell Biol, 2017. 19(2): p. 106-119. [CrossRef]
- Lin, A., et al., The LINK-A lncRNA activates normoxic HIF1alpha signalling in triple-negative breast cancer. Nat Cell Biol, 2016. 18(2): p. 213-24. [CrossRef]
- Gong, J., et al., A Pan-cancer Analysis of the Expression and Clinical Relevance of Small Nucleolar RNAs in Human Cancer. Cell Rep, 2017. 21(7): p. 1968-1981. [CrossRef]
- Wang, Z., et al., BART: a transcription factor prediction tool with query gene sets or epigenomic profiles. Bioinformatics (Oxford, England), 2018. 34(16): p. 2867-2869. [CrossRef]
- Bodenmiller, B., et al., Multiplexed mass cytometry profiling of cellular states perturbed by small-molecule regulators. Nat Biotechnol, 2012. 30(9): p. 858-67. [CrossRef]
- Ornatsky, O.I., et al., Development of analytical methods for multiplex bio-assay with inductively coupled plasma mass spectrometry. J Anal At Spectrom, 2008. 23(4): p. 463-469. [CrossRef]
- Finck, R., et al., Normalization of mass cytometry data with bead standards. Cytometry A, 2013. 83(5): p. 483-94. [CrossRef]
- Sean C. Bendall, E.F.S., Peng Qiu, El-ad D. Amir, Peter O. Krutzik, Rachel Finck, Robert V. Bruggner, Rachel Melamed, Angelica Trejo, Olga I. Ornatsky, Robert S. Balderas, Sylvia K. Plevritis, Karen Sachs, Dana Pe’er, Scott D. Tanner, Garry P. Nolan, Single-cell mass cytometry of differential immune and drug responses across a human hematopoietic continuum. Science, 2011. 332(6030): p. 687-696. [CrossRef]
- Levine, J.H., et al., Data-Driven Phenotypic Dissection of AML Reveals Progenitor-like Cells that Correlate with Prognosis. Cell, 2015. 162(1): p. 184-97. [CrossRef]
- Wang, Q., et al., Cajal bodies are linked to genome conformation. Nature Communications, 2016. 7: p. 10966. [CrossRef]
- Xie, J., et al., Sno/scaRNAbase: a curated database for small nucleolar RNAs and cajal body-specific RNAs. Nucleic Acids Res, 2007. 35(Database issue): p. D183-7. [CrossRef]
- Logan, M.K., M.F. Burke, and M.D. Hebert, Altered dynamics of scaRNA2 and scaRNA9 in response to stress correlates with disrupted nuclear organization. Biol Open, 2018. 7(9). [CrossRef]
- Beneventi, G., et al., The small Cajal body-specific RNA 15 (SCARNA15) directs p53 and redox homeostasis via selective splicing in cancer cells. NAR Cancer, 2021. 3(3): p. zcab026. [CrossRef]
- Mannoor, K., J. Liao, and F. Jiang, Small nucleolar RNAs in cancer. Biochim Biophys Acta, 2012. 1826(1): p. 121-8. [CrossRef]
- Nagasawa, C., et al., The Role of scaRNAs in Adjusting Alternative mRNA Splicing in Heart Development. J Cardiovasc Dev Dis, 2018. 5(2). [CrossRef]
- Ronchetti, D., Mosca,L., Cutrona,G., Tuana,G., Gentile,M., and S. Fabris, Agnelli,L., Ciceri,G., Matis,S., Massucco,C. et al, Small nucleolar RNAs as new biomarkers in chronic lymphocytic leukemia. BMC Med. Genomics, 2013. 6, 27. [CrossRef]
- Ronchetti, D., et al., The expression pattern of small nucleolar and small Cajal body-specific RNAs characterizes distinct molecular subtypes of multiple myeloma. Blood Cancer J, 2012. 2: p. e96. [CrossRef]
- Liu, Q.W., Y. He, and W.W. Xu, Molecular functions and therapeutic applications of exosomal noncoding RNAs in cancer. Exp Mol Med, 2022. 54(3): p. 216-225. [CrossRef]
- Lan, T., et al., LncRNA SNHG10 Facilitates Hepatocarcinogenesis and Metastasis by Modulating Its Homolog SCARNA13 via a Positive Feedback Loop. Cancer Res, 2019. 79(13): p. 3220-3234. [CrossRef]
- Ren, B., et al., E2F integrates cell cycle progression with DNA repair, replication, and G(2)/M checkpoints. Genes Dev, 2002. 16(2): p. 245-56. [CrossRef]
- Pancho, A., et al., Protocadherins at the Crossroad of Signaling Pathways. Front Mol Neurosci, 2020. 13: p. 117. [CrossRef]
- Xie, B., et al., Cyclin B1/CDK1-regulated mitochondrial bioenergetics in cell cycle progression and tumor resistance. Cancer Lett, 2019. 443: p. 56-66. [CrossRef]
- Yang, J. and R.A. Weinberg, Epithelial-mesenchymal transition: at the crossroads of development and tumor metastasis. Dev Cell, 2008. 14(6): p. 818-29. [CrossRef]
- Goo, Y.A., et al., Stromal mesenchyme cell genes of the human prostate and bladder. BMC Urol, 2005. 5: p. 17. [CrossRef]
- Liu, A.Y., et al., Bladder expression of CD cell surface antigens and cell-type-specific transcriptomes. Cell Tissue Res, 2012. 348(3): p. 589-600. [CrossRef]
- Sottnik, J.L., et al., Androgen Receptor Regulates CD44 Expression in Bladder Cancer. Cancer Res, 2021. 81(11): p. 2833-2846. [CrossRef]
- Keith Syson Chan, I.E., Mark Chao, David Wong, Laurie Ailles, Max Diehn, Harcharan Gill, Joseph Presti Jr, Howard Y Chang, Matt van de Rijn, Linda Shortliffe, Irving L Weissman, Identification, molecular characterization, clinical prognosis, and therapeutic targeting of human bladder tumor-initiating cells. Proc Natl Acad Sci U S A, 2009. 106(33): p. 14016-14021. [CrossRef]
- Kiss, B., et al., CD47-Targeted Near-Infrared Photoimmunotherapy for Human Bladder Cancer. Clin Cancer Res, 2019. 25(12): p. 3561-3571. [CrossRef]
- Ying Pan, J.-P.V., Kathleen E Mach, Robert V Rouse, Jen-Jane Liu, Debashis Sahoo, Timothy C Chang, Thomas J Metzner, Lei Kang, Matt van de Rijn, Eila C Skinner, Sanjiv S Gambhir, Irving L Weissman, Joseph C Liao, Endoscopic molecular imaging of human bladder cancer using a CD47 antibody. Sci Transl Med, 2004. 6(260): p. 260ra148. [CrossRef]
- Ma, Z., et al., Interferon-dependent SLC14A1(+) cancer-associated fibroblasts promote cancer stemness via WNT5A in bladder cancer. Cancer Cell, 2022. 40(12): p. 1550-1565.e7. [CrossRef]
- Huang, T.S., et al., Functional network reconstruction reveals somatic stemness genetic maps and dedifferentiation-like transcriptome reprogramming induced by GATA2. Stem Cells, 2008. 26(5): p. 1186-201. [CrossRef]
- Wan, X., et al., FOSL2 promotes VEGF-independent angiogenesis by transcriptionnally activating Wnt5a in breast cancer-associated fibroblasts. Theranostics, 2021. 11(10): p. 4975-4991. [CrossRef]
- Cox, T.R. and J.T. Erler, Remodeling and homeostasis of the extracellular matrix: implications for fibrotic diseases and cancer. Dis Model Mech, 2011. 4(2): p. 165-78. [CrossRef]
- Friedl, P. and K. Wolf, Tube travel: the role of proteases in individual and collective cancer cell invasion. Cancer Res, 2008. 68(18): p. 7247-9. [CrossRef]
- Ricard-Blum, S., The collagen family. Cold Spring Harb Perspect Biol, 2011. 3(1): p. a004978. [CrossRef]
- Gritsenko, P.G., O. Ilina, and P. Friedl, Interstitial guidance of cancer invasion. J Pathol, 2012. 226(2): p. 185-99. [CrossRef]
- Sullivan, W.J., et al., Extracellular Matrix Remodeling Regulates Glucose Metabolism through TXNIP Destabilization. Cell, 2018. 175(1). [CrossRef]
- Bhattacharjee, S., et al., Tumor restriction by type I collagen opposes tumor-promoting effects of cancer-associated fibroblasts. J Clin Invest, 2021. 131(11). [CrossRef]
- Piao, X.M., et al., Collagen type VI-α1 and 2 repress the proliferation, migration and invasion of bladder cancer cells. Int J Oncol, 2021. 59(1). [CrossRef]
- Kreienbaum, C., L.W. Paasche, and S.B. Hake, H2A.Z's 'social' network: functional partners of an enigmatic histone variant. Trends In Biochemical Sciences, 2022. 47(11): p. 909-920. [CrossRef]
- Domaschenz, R., et al., The Histone Variant H2A.Z Is a Master Regulator of the Epithelial-Mesenchymal Transition. Cell Rep, 2017. 21(4): p. 943-952. [CrossRef]
- Peixoto, P., et al., EMT is associated with an epigenetic signature of ECM remodeling genes. Cell Death Dis, 2019. 10(3): p. 205. [CrossRef]
Disclaimer/Publisher’s Note: The statements, opinions and data contained in all publications are solely those of the individual author(s) and contributor(s) and not of MDPI and/or the editor(s). MDPI and/or the editor(s) disclaim responsibility for any injury to people or property resulting from any ideas, methods, instructions or products referred to in the content. |
© 2023 by the authors. Licensee MDPI, Basel, Switzerland. This article is an open access article distributed under the terms and conditions of the Creative Commons Attribution (CC BY) license (http://creativecommons.org/licenses/by/4.0/).


