Submitted:
05 December 2023
Posted:
07 December 2023
You are already at the latest version
Abstract
Keywords:
1. Introduction
2. Results and Discussion
2.1. Structura, morphological and textural properties
2.1.1. X-Ray Diffraction
2.1.2. TEM investigation
2.1.3. SEM analysis
2.1.4. N2 physisorption
2.1.5. Raman spectroscopy
2.2. Composition and reduction of photocatalysts
2.2.1. XPS spectroscopy
2.2.2. H2-Thermoprogrammed reduction
2.3. Optical properties
2.3.1. UV-Vis spectroscopy
2.3.2. Photoluminescence spectroscopy
2.4. Photocatalytic activity
2.4.1. Photocatalytic degradation of cefuroxime
2.4.2. Scavenger experiments
3. Conclusions
4. Materials and Methods
4.1. Materials
4.1.1. Chemicals
4.1.2. Sample Preparation
4.2. Methods of Characterization
Supplementary Materials
Author Contributions
Funding
Institutional Review Board Statement
Informed Consent Statement
Data Availability Statement
Conflicts of Interest
References
- Hu, G.; Yang, J.; Duan, X.; Farnood, R.; Yang, C.; Yang, J.; Liu, W.; Liu, Q. Recent developments and challenges in zeolite-based composite photocatalysts for environmental applications. Chem. Eng.J. 2021, 417, 129209. [Google Scholar] [CrossRef]
- Umejuru, E.Ch.; Mashifana, T.; Kandjou, V.; Amani-Beni, M.; Sadeghifar, H.; Fayazi, M.; Karimi-Maleh, H.; Thandiwe Sithole, N. Application of zeolite based nanocomposites for wastewater remediation: Evaluating newer and environmentally benign approaches. Environ. Res. 2023, 231, 116073. [Google Scholar] [CrossRef] [PubMed]
- Camposeco, R.; Castillo, S.; Hinojosa-Reyes, M.; Mejía-Centeno, I.; Zanella, R. Effect of incorporating vanadium oxide to TiO2, Zeolite-ZM5, SBA and P25 supports on the photocatalytic activity under visible light. J. Photochem. Photobiol. A 2018, 367, 178–187. [Google Scholar] [CrossRef]
- Kamegawa, T.; Kido, R.; Yamahana, D.; Yamashita, H. Design of TiO2-zeolite composites with enhanced photocatalytic performances under irradiation of UV and visible light. Microporous and Mesoporous Mater. 2013, 165, 142–147. [Google Scholar] [CrossRef]
- Badvi, K.; Javanbakht, V. Enhanced photocatalytic degradation of dye contaminants with TiO2 immobilized on ZSM-5 zeolite modified with nickel nanoparticles. J. Clean. Prod. 2021, 280, 124518. [Google Scholar] [CrossRef]
- Farhadi, N.; Tabatabaie, T.; Ramavandi, B.; Amiri, F. Ibuprofen elimination from water and wastewater using sonication/ ultraviolet/hydrogen peroxide/zeolite-titanate photocatalyst system. Environ. Res. 2021, 198, 111260. [Google Scholar] [CrossRef]
- Setthaya, N.; Chindaprasirt, P.; Yin, S.; Pimraksa, K. TiO2-zeolite photocatalysts made of metakaolin and rice husk ash for removal of methylene blue dye. Powder Technol. 2017, 313, 417–426. [Google Scholar] [CrossRef]
- Petcu, G.; Anghel, E.M.; Buixaderas, E.; Atkinson, I.; Somacescu, S.; Baran, A.; Culita, D.C.; Trica, B.; Bradu, C.; Ciobanu, M.; et al. Au/Ti Synergistically Modified Supports Based on SiO2 with Different Pore Geometries and Architectures. Catalysts 2022, 12, 1129. [Google Scholar] [CrossRef]
- Petcu, G.; Papa, F.; Anghel, E.M.; Atkinson, I.; Preda, S.; Somacescu, S.; Culita, D.C.; Baran, A.; Ciobanu, E.M.; Jecu, L.M.; et al. Effects of Aluminosilicate Gel Treatment and TiO2 Loading on Photocatalytic Properties of Au–TiO2/Zeolite Y. Gels 2023, 9, 503. [Google Scholar] [CrossRef]
- Zhao, X.; Chen, W.; Li, G.; Feng, G.; Li, S.; Dong, X.; Song, Y.; Yu, X.; Chen, X.; Wei, W.; Sun, Y. Gas-phase CO2 photoreduction via iron/ZSM-5 composites. Appl. Catal. A Gen. 2020, 595, 117503. [Google Scholar] [CrossRef]
- John, K.I.; Adeleye, A.T.; Adeniyi, A.G.; Sani, L.A.; Abesa, S.; Orege, I.J.; Adenle, A.A.; Elawad, M.; Omorogie, M.O. Screening of Zeolites series: H-β/H-MOR/H-ZSM-5 as potential templates for photocatalyst heterostructure composites through photocatalytic degradation of tetracycline. J. Mol. Struct. 2023, 1277, 134852. [Google Scholar] [CrossRef]
- Du, T.; Cui, M.; Chao, Y.; Xiao, Y.; Ren, Z.; An, Y.; Meng, C. Preparation and photocatalytic properties of highly dispersed samarium vanadate nanoparticles supported on H-mordenite composites by template-free method. J. Photochem. Photobiol A 2022, 433, 114207. [Google Scholar] [CrossRef]
- Alvarez-Aguiñaga, E.A.; Elizalde-González, M.P.; Sergio, A.; Sabinas-Hernández, S.A. Unpredicted photocatalytic activity of clinoptilolite–mordenite natural zeolite. RSC Adv. 2020, 10, 39251–39260. [Google Scholar] [CrossRef]
- Jansson, I.; Suarez, S.; Garcia-Garcia, F.J.; Sanchez, B. Zeolite-TiO2 hybrid composites for pollutant degradation in gas phase. Appl. Catal. B Environ. 2015, 178, 100–107. [Google Scholar] [CrossRef]
- Li, F.; Jiang, Y.; Yu, L.; Yang, Z.; Hou, T.; Sun, S. Surface effect of natural zeolite (clinoptilolite) on the photocatalytic activity of TiO2. Appl. Surf. Sci. 2005, 252, 1410–1416. [Google Scholar] [CrossRef]
- Tao, P.; Wang, X.; Zhao, Q.; Guo, H.; Liu, L.; Qi, X.; Cui, W. Framework Ti-rich titanium silicalite-1 zeolite nanoplates for enhanced photocatalytic H2 production from CH3OH. Appl. Catal. B Environ. 2023, 325, 122392. [Google Scholar] [CrossRef]
- Bai, R.; Song, Y.; Tian, G.; Wang, F.; Corma, A.; Yu, J. Titanium-rich TS-1 zeolite for highly efficient oxidative desulfurization. Green Energy Environ. 2023, 8, 163–172. [Google Scholar] [CrossRef]
- Soekiman, C.N.; Miyake, K.; Hayashi, Y.; Zhu, Y.; Ota, M.; Al-Jabri, H.; Inoue, R.; Y. Hirota, Y.; Uchida, Y.; Tanaka, S.; Kong, C.Y.; Nishiyama, N. Synthesis of titanium silicalite-1 (TS-1) zeolite with high content of Ti by a dry gel conversion method using amorphous TiO2-SiO2 composite with highly dispersed Ti species. Mater. Today Chem. 2020, 16, 100209. [Google Scholar] [CrossRef]
- Petcu, G.; Anghel, E.M.; Somacescu, S.; Preda, S.; Culita, D.C.; Mocanu, S.; Ciobanu, M.; Parvulescu, V. Hierarchical Zeolite Y Containing Ti and Fe Oxides as Photocatalysts for Degradation of Amoxicillin. J. Nanosci. Nanotechnol. 2020, 20, 1158–1169. [Google Scholar] [CrossRef]
- Petcu, G.; Dobrescu, G.; Atkinson, I.; Ciobanu, M.; Blin, J.-L.; Parvulescu, V. Evolution of Morphology, Fractal Dimensions, and Structure of (Titanium) Aluminosilicate Gel during Synthesis of Zeolites Y and Ti-Y. Fractal Fract. 2022, 6, 663. [Google Scholar] [CrossRef]
- Zhao, Z.; Wang, N.; Zhang, H.; Shang, R.; Xing, J.; Zhang, D.; Li, J. Fabrication of ZSM-5 zeolite supported TiO2-NiO heterojunction photocatalyst and research on its photocatalytic performance. J. Solid State Chem. 2022, 309, 122895. [Google Scholar] [CrossRef]
- Badvi, K.; Javanbakht, V. Enhanced photocatalytic degradation of dye contaminants with TiO2 immobilized on ZSM-5 zeolite modified with nickel nanoparticles. J. Clean. Prod. 2021, 280, 124518. [Google Scholar] [CrossRef]
- Wang, C.; Shi, H.; Li, Y. Synthesis and characteristics of natural zeolite supported Fe3+-TiO2 Photocatalysts. Appl. Surf. Sci. 2011, 257, 6873–6877. [Google Scholar] [CrossRef]
- Magdziarz, A.; Colmenares, J.C.; Chernyayeva, O.; Łomot, D.; Sobczak, K. Sonication and light irradiation as green energy sources simultaneously implemented in the synthesis of Pd-Fe- and Pt-Fe-doped TiO2-based photocatalysts. J. Mol. Catal. A: Chem. 2016, 425, 1–9. [Google Scholar] [CrossRef]
- Alizadeh, T.; Kadkhodayan, H. Construction of Zeolite/Fe2ZnTiO6/graphene oxide multifunctional nanocomposite with high efficiency for photocatalytic removal of inorganic pollutants under visible irradiation. J. Phys. Chem. Solids 2022, 171, 110997. [Google Scholar] [CrossRef]
- Castaneda-Juarez, M.; Martinez-Miranda, V.; Almazan-Sanchez, P.T.; Linares-Hernandez, I.; Santoyo-Tepole, F.; Vazquez-Mejia, G. Synthesis of TiO2 catalysts doped with Cu, Fe, and Fe/Cu supported on clinoptilolite zeolite by an electrochemical-thermal method for the degradation of diclofenac by heterogeneous photocatalysis. J. Photochem. Photobiol., A 2019, 380, 111834. [Google Scholar] [CrossRef]
- Wang, C.; Shi, H.; Li, Y. Synthesis and characterization of natural zeolite supported Cr-doped TiO2 photocatalysts. Appl. Surf. Sci. 2012, 258, 4328–4333. [Google Scholar] [CrossRef]
- Torkian, N.; Bahrami, A.; Hosseini-Abari, A.; Momeni, M.M.; Abdolkarimi-Mahabadi, M.; Bayat, A.; Hajipour, P.; Rourani, H.A.; Abbasi, M. S.; Torkian, S.; Wen, Y.; Mehr, Y.M.; Hojjati-Najafabadi, A. Synthesis and characterization of Ag-ion-exchanged zeolite/TiO2 nanocomposites for antibacterial applications and photocatalytic degradation of antibiotics. Environ. Res. 2022, 207, 112157. [Google Scholar] [CrossRef]
- Kohsuke Mori, K.; Miura, Y.; Sayoko Shironita, S.; Yamashita, H. New Route for the Preparation of Pd and PdAu Nanoparticles Using Photoexcited Ti-Containing Zeolite as an Efficient Support Material and Investigation of Their Catalytic Properties. Langmuir 2009, 25, 11180–11187. [Google Scholar] [CrossRef]
- Petcu, G.; Papa, F.; Atkinson, I.; Baran, A.; Apostol, N.G.; Petrescu, S.; Richaudeau, L.; Blin, J.-L.; Parvulescu, V. Co- and Ni-Doped TiO2 Nanoparticles Supported on Zeolite Y with Photocatalytic Properties. Nanomaterials 2023, 13, 2200. [Google Scholar] [CrossRef]
- Qin, Z.; Wang, B.; Asano, N.; Wang, L.; Zhou, Y.; Liu, X.; Shen, B.; Mintova, S.; Asahina, S.; Valtchev, V. Towards a comprehensive understanding of mesoporosity in zeolite Y at the single particle level. Inorg. Chem. Front. 2022, 9, 2365–2373. [Google Scholar] [CrossRef]
- Thommes, M.; Kaneko, K.; Neimark, A.V.; Olivier, J.P.; Rodriguez-Reinoso, F.; Rouquerol, J.; Sing, K.S.W. Physisorption of Gases, with Special Reference to the Evaluation of Surface Area and Pore Size Distribution (IUPAC Technical Report). Pure Appl. Chem. 2015, 87, 1051–1069. [Google Scholar] [CrossRef]
- Hess, C. New advances in using Raman spectroscopy for the characterization of catalysts and catalytic reactions. Chem. Soc. Rev. 2021, 50, 3519. [Google Scholar] [CrossRef]
- Yu, Y.; Xiong, G.; Li, C.; Xiao, F.S. Characterization of aluminosilicate zeolites by UV Raman spectroscopy. Micropor. Mesopor. Mater. 2001, 46, 23–34. [Google Scholar] [CrossRef]
- Ilieva, L.; Petrova, P.; Venezia, A.M.; Anghel, E.M.; State, R.; Avdeev, G.; Tabakova, T. Mechanochemically Prepared Co3O4-CeO2 Catalysts for Complete Benzene Oxidation. Catalysts 2021, 11, 1316. [Google Scholar] [CrossRef]
- Wang, W.; Liu, Y.; Xua, C.; Zheng, C.; Wang, G. Synthesis of NiO nanorods by a novel simple precursor thermal decomposition approach. Chem. Phys. Lett. 2002, 362, 119–122. [Google Scholar] [CrossRef]
- Mendoza-Castro, M.J.; De Oliveira-Jardim, E.; Ramírez-Marquez, N.-T.; Trujillo, C.-A.; Linares, N.; García-Martínez, J. Hierarchical Catalysts Prepared by Interzeolite Transformation. J. Am. Chem. Soc. 2022, 144, 5163–5171. [Google Scholar] [CrossRef]
- Zhang, J.; Xu, Q.; Li, M.; Feng, Z.; Li, C. UV Raman Spectroscopic Study on TiO2. II. Effect of Nanoparticle Size on the Outer/Inner Phase Transformations. J. Phys. Chem. C 2009, 113, 1698–1704. [Google Scholar] [CrossRef]
- Bian, K.; Zhang, A.; Yang, H.; Fan, B.; Xu, S.; Guo, X.; Song, C. Synthesis and Characterization of Fe-Substituted ZSM-5 Zeolite and Its Catalytic Performance for Alkylation of Benzene with Dilute Ethylene. Ind. Eng. Chem. Res. 2020, 59, 22413–22421. [Google Scholar] [CrossRef]
- Fan, F.; Feng, Z.; Li, C. UV Raman spectroscopic study on the synthesis mechanism and assembly of molecular sieves. Chem. Soc. Rev. 2010, 39, 4794–4801. [Google Scholar] [CrossRef]
- Rana, B.S.; Singh, B.; Kumar, R.; Verma, D.; Bhunia, M.K.; Bhaumik, A.; Sinha, A.K. Hierarchical mesoporous Fe/ZSM-5 with tunable porosity for selective hydroxylation of benzene to phenol. J. Mater. Chem. 2010, 20, 8575–8581. [Google Scholar] [CrossRef]
- Available online: https://www.thermofisher.com/ro/en/home/materials-science/learning-center/periodic-table/transition-metal/iron.html.
- Available online: https://www.thermofisher.com/ro/en/home/materials-science/learning-center/periodic-table/transition-metal/cobalt.html.
- Available online: https://www.thermofisher.com/ro/en/home/materials-science/learning-center/periodic-table/transition-metal/nickel.html.
- Available online: https://www.thermofisher.com/ro/en/home/materials-science/learning-center/periodic-table/transition-metal/titanium.html.
- Czuma, N.; Zarębska, K.; Motak, M.; Gálvez, M.E.; Da Costa, P. Ni/zeolite X derived from fly ash as catalysts for CO2 methanation. Fuel 2020, 267, 11713. [Google Scholar] [CrossRef]
- Alalga, L.; Benamar, A.; Trari, M. Hydrogen production via methane decomposition over nickel supported on synthesized ZSM-5/MCM41 zeolite composite material. Int. J. Hydrog. Energy. 2021, 46, 28501–28512. [Google Scholar] [CrossRef]
- Ren, T.; Shiyao, W.; Chen-shuai, L.; Xu, W.; Xia, A.; Xian-mei, X. Synthesis of the hierarchical Fe-substituted porous HBeta zeolite and the exploration of its catalytic performance. J. Fuel Chem. Technol. 2019, 47, 1476–1485. [Google Scholar]
- Zhang, T.; Qiu, Y.; Liu, G.; Chen, J.; Peng, Y.; Liu, B.; Li, J. Nature of active Fe species and reaction mechanism over high-efficiency Fe/CHA catalysts in catalytic decomposition of N2O. J. Catal. 2020, 392, 322–335. [Google Scholar] [CrossRef]
- Xin-yu, P.; Li-jun, L.; Bo-xiong, S.; Yao, B.; Li-chao, S. Insight into the catalytic oxidation of toluene over M/ZSM-5 (M=Cu, Mn, Fe, Ce, Ti) catalysts. J. Fuel Chem. Technol. 2023, 51, 841−851. [Google Scholar]
- Lebedeva, O.E.; Wolfgang M., H. Sachtler, W. M.H. Enhanced Reduction of Fe2O3 Caused by Migration of TM Ions out of Zeolite Channels. J. Catal. 2000, 191, 364–372. [Google Scholar] [CrossRef]
- Rabee, A.I.M.; Gaid, C.B.A.; Mekhemer, G.A.H.; Zaki, M.I. Combined TPR, XRD, and FTIR studies on the reduction behavior of Co3O4. Mater. Chem. Phys. 2022, 289, 126367. [Google Scholar] [CrossRef]
- Xue, C.; Xue-feng, W.; Xun, W.; Cun-bao, D.; Min-min, C. Effect of highly dispersed Co3O4 on the catalytic performance of LaCoO3 perovskite in the combustion of lean methane. J. Fuel Chem. Technol. 2023, 51, 367–375. [Google Scholar]
- Wang, Y.; Wang, H.; Shao, Y.; Li, T.; Tatsumi, T.; Wang, J.-G. Direct Synthesis of Ti-Containing CFI-Type Extra-Large-Pore Zeolites in the Presence of Fluorides. Catalysts 2019, 9, 257. [Google Scholar] [CrossRef]
- Tang, B.; Dai, W.; Sun, X.; Guan, N.; Li, L.; Hunger, M. A procedure for the preparation of Ti-Beta zeolitesfor catalytic epoxidation with hydrogen peroxide. Green Chem. 2014, 16, 2281. [Google Scholar] [CrossRef]
- Saramok, M.; Szymaszek, A.; Inger, M.; Antoniak-Jurak, K.; Samojeden, B.; Motak, M. Modified Zeolite Catalyst for a NOx Selective Catalytic Reduction Process in Nitric Acid Plants. Catalysts 2021, 11, 450. [Google Scholar] [CrossRef]
- Bhargava, R.; Khana, S.; Ahmad, N.; Ansari, M.M.N. Investigation of Structural, Optical and Electrical Properties of Co3O4 Nanoparticles. 2nd Int. Conf. Condens. Matter Appl. Phys. (ICC 2017) AIP Conf. Proc. 1953, 030034-1–030034-4. [Google Scholar] [CrossRef]
- Emayavaramban, P.; Babu, S. Ganesh; Karvembu, R.; Dharmaraj, N. Nickel Oxide Doped Hydroxyapatite for Catalytic Oxidation of Alcohols to Carbonyl Compounds at Room Temperature. Adv. Sci. Eng. Med. 2014, 6, 659–666(8). [Google Scholar] [CrossRef]
- Gingasu, D.; Oprea, O.; Marinescu, G.; Calderon Moreno, J.M.; Culita, D.C.; Preda, S.; Surdu, V.-A. Structural, Morphological, and Optical Properties of Single and Mixed Ni-Co Aluminates Nanoparticles. Inorganics 2023, 11, 371. [Google Scholar] [CrossRef]
- Mannaa, M.A.; Qasim, K.F.; Alshorifi, F.T.; El-Bahy, S.M.; Salama, R.S. Role of NiO Nanoparticles in Enhancing Structure Properties of TiO2 and Its Applications in Photodegradation and Hydrogen Evolution. ACS Omega 2021, 6, 30386–30400. [Google Scholar] [CrossRef]
- Jiang, D.; Otitoju, T.A.; Ouyang, Y.; Shoparwe, N.F.; Wang, S.; Zhang, A.; Li, S. A Review on Metal Ions Modified TiO2 for Photocatalytic Degradation of Organic Pollutants. Catalysts 2021, 11, 1039. [Google Scholar] [CrossRef]
- Saha, A.; Moya, A.; Kahnt, A.; Iglesias, D.; Marchesan, S.; Wannemacher, R.; Prato, M.; Vilatela, J.J.; Guldi, D.M. Interfacial charge transfer in functionalized multiwalled carbon nanotube@TiO2 nanofibres. Nanoscale 2017, 8(00), 1–3. [Google Scholar]
- Negoescu, D.; Atkinson, I.; Gherendi, M.; Culita, D.C.; Baran, A.; Petrescu, S.; Trica, B.; Ionescu, R.; Pelinescu, D.; Bratan, V.; Parvulescu, V. Brij 58–activated carbon assisted synthesis of Ag/Ag2O/TiO2-AC photocatalysts for efficient organic pollutants degradation. J. Alloys Comp. 2023, 931, 167528. [Google Scholar] [CrossRef]
- Hassan, S. M.; Ahmed, A. I.; Mannaa, M. A. Surface Acidity, Catalytic and Photocatalytic Activities of New Type H3PW12O40/Sn-TiO2 Nanoparticles. Colloid. Surface. Physicochem. Eng. Aspect. 2019, 577, 147–157. [Google Scholar] [CrossRef]
- Li, D.; Cheng, X.; Yu, X.; Xing, Z. Preparation and Characterization of TiO2-Based Nanosheets for Photocatalytic Degradation of Acetylsalicylic Acid: Influence of Calcination Temperature. Chem. Eng. J. 2015, 279, 994–1003. [Google Scholar] [CrossRef]
- Zhou, M.; Yu, J.; Liu, S.; Zhai, P.; Jiang, L. Effects of Calcination Temperatures on Photocatalytic Activity of SnO2/TiO2 Composite Films Prepared by an EPD Method. J. Hazard. Mater. 2008, 154, 1141–1148. [Google Scholar] [CrossRef]
- Liqiang, J.; Yichun, Q.; Baiqi, W.; Shudan, L.; Baojiang, J.; Libin, Y.; Wei, F.; Honggang, F.; Jiazhong, S. Review of photoluminescence performance of nano-sized semiconductor materials and its relationships with photocatalytic activity. Sol. Energy Mater Sol. Cells 2006, 90, 1773–1787. [Google Scholar] [CrossRef]
- Liang, W.; Xu, G.; Fu, Y. Selective photocatalytic oxidation of furfural to C4 compounds with metal-TS-1 zeolite. Appl. Catal. B 2024, 340, 123220. [Google Scholar] [CrossRef]
- Saeed, M.; Usman, M.; Ibrahim, M.; Haq, A.; Khan, I.; Ijaz, H.; Akram, F. Enhanced photo catalytic degradation of methyl orange using p–n Co3O4-TiO2 heterojunction as catalyst. Int. J. Chem. React. Eng. 2020, 18, 20200004. [Google Scholar] [CrossRef]
- Lizeth Katherine, T.N.; Vendula, B.; Jaroslav, K.; Jaroslav, C. Structure and Photocatalytic Properties of Ni-, Co-, Cu-, and Fe-Doped TiO2 Aerogels. Gel 2023, 9, 357. [Google Scholar] [CrossRef]
- Din, S.T.U.; Xie, W.-F.; Yang, W. Synthesis of Co3O4 Nanoparticles-Decorated Bi12O17Cl2 Hierarchical Microspheres for Enhanced Photocatalytic Degradation of RhB and BPA. Int. J. Mol. Sci. 2022, 23, 15028. [Google Scholar] [CrossRef] [PubMed]
- Tang, J; Fu, M.; Mao, Y.; Yang, S.; Lin, W.; Yu, Y.; Song, S. Decorating {0 0 1} TiO2 nanosheets on hydrophobic NaY zeolite: An efficient deactivation-resistant photocatalyst for gaseous toluene removal. Chem. Eng. J. 2023, 472, 144883. [Google Scholar] [CrossRef]
- Teodorescu, C.M.; Esteva, J.M.; Karnatak, R.C.; El Afif, A. Nucl. Instrum. Meth. Phys. Res. A 1994, 345, 141–147. [CrossRef]
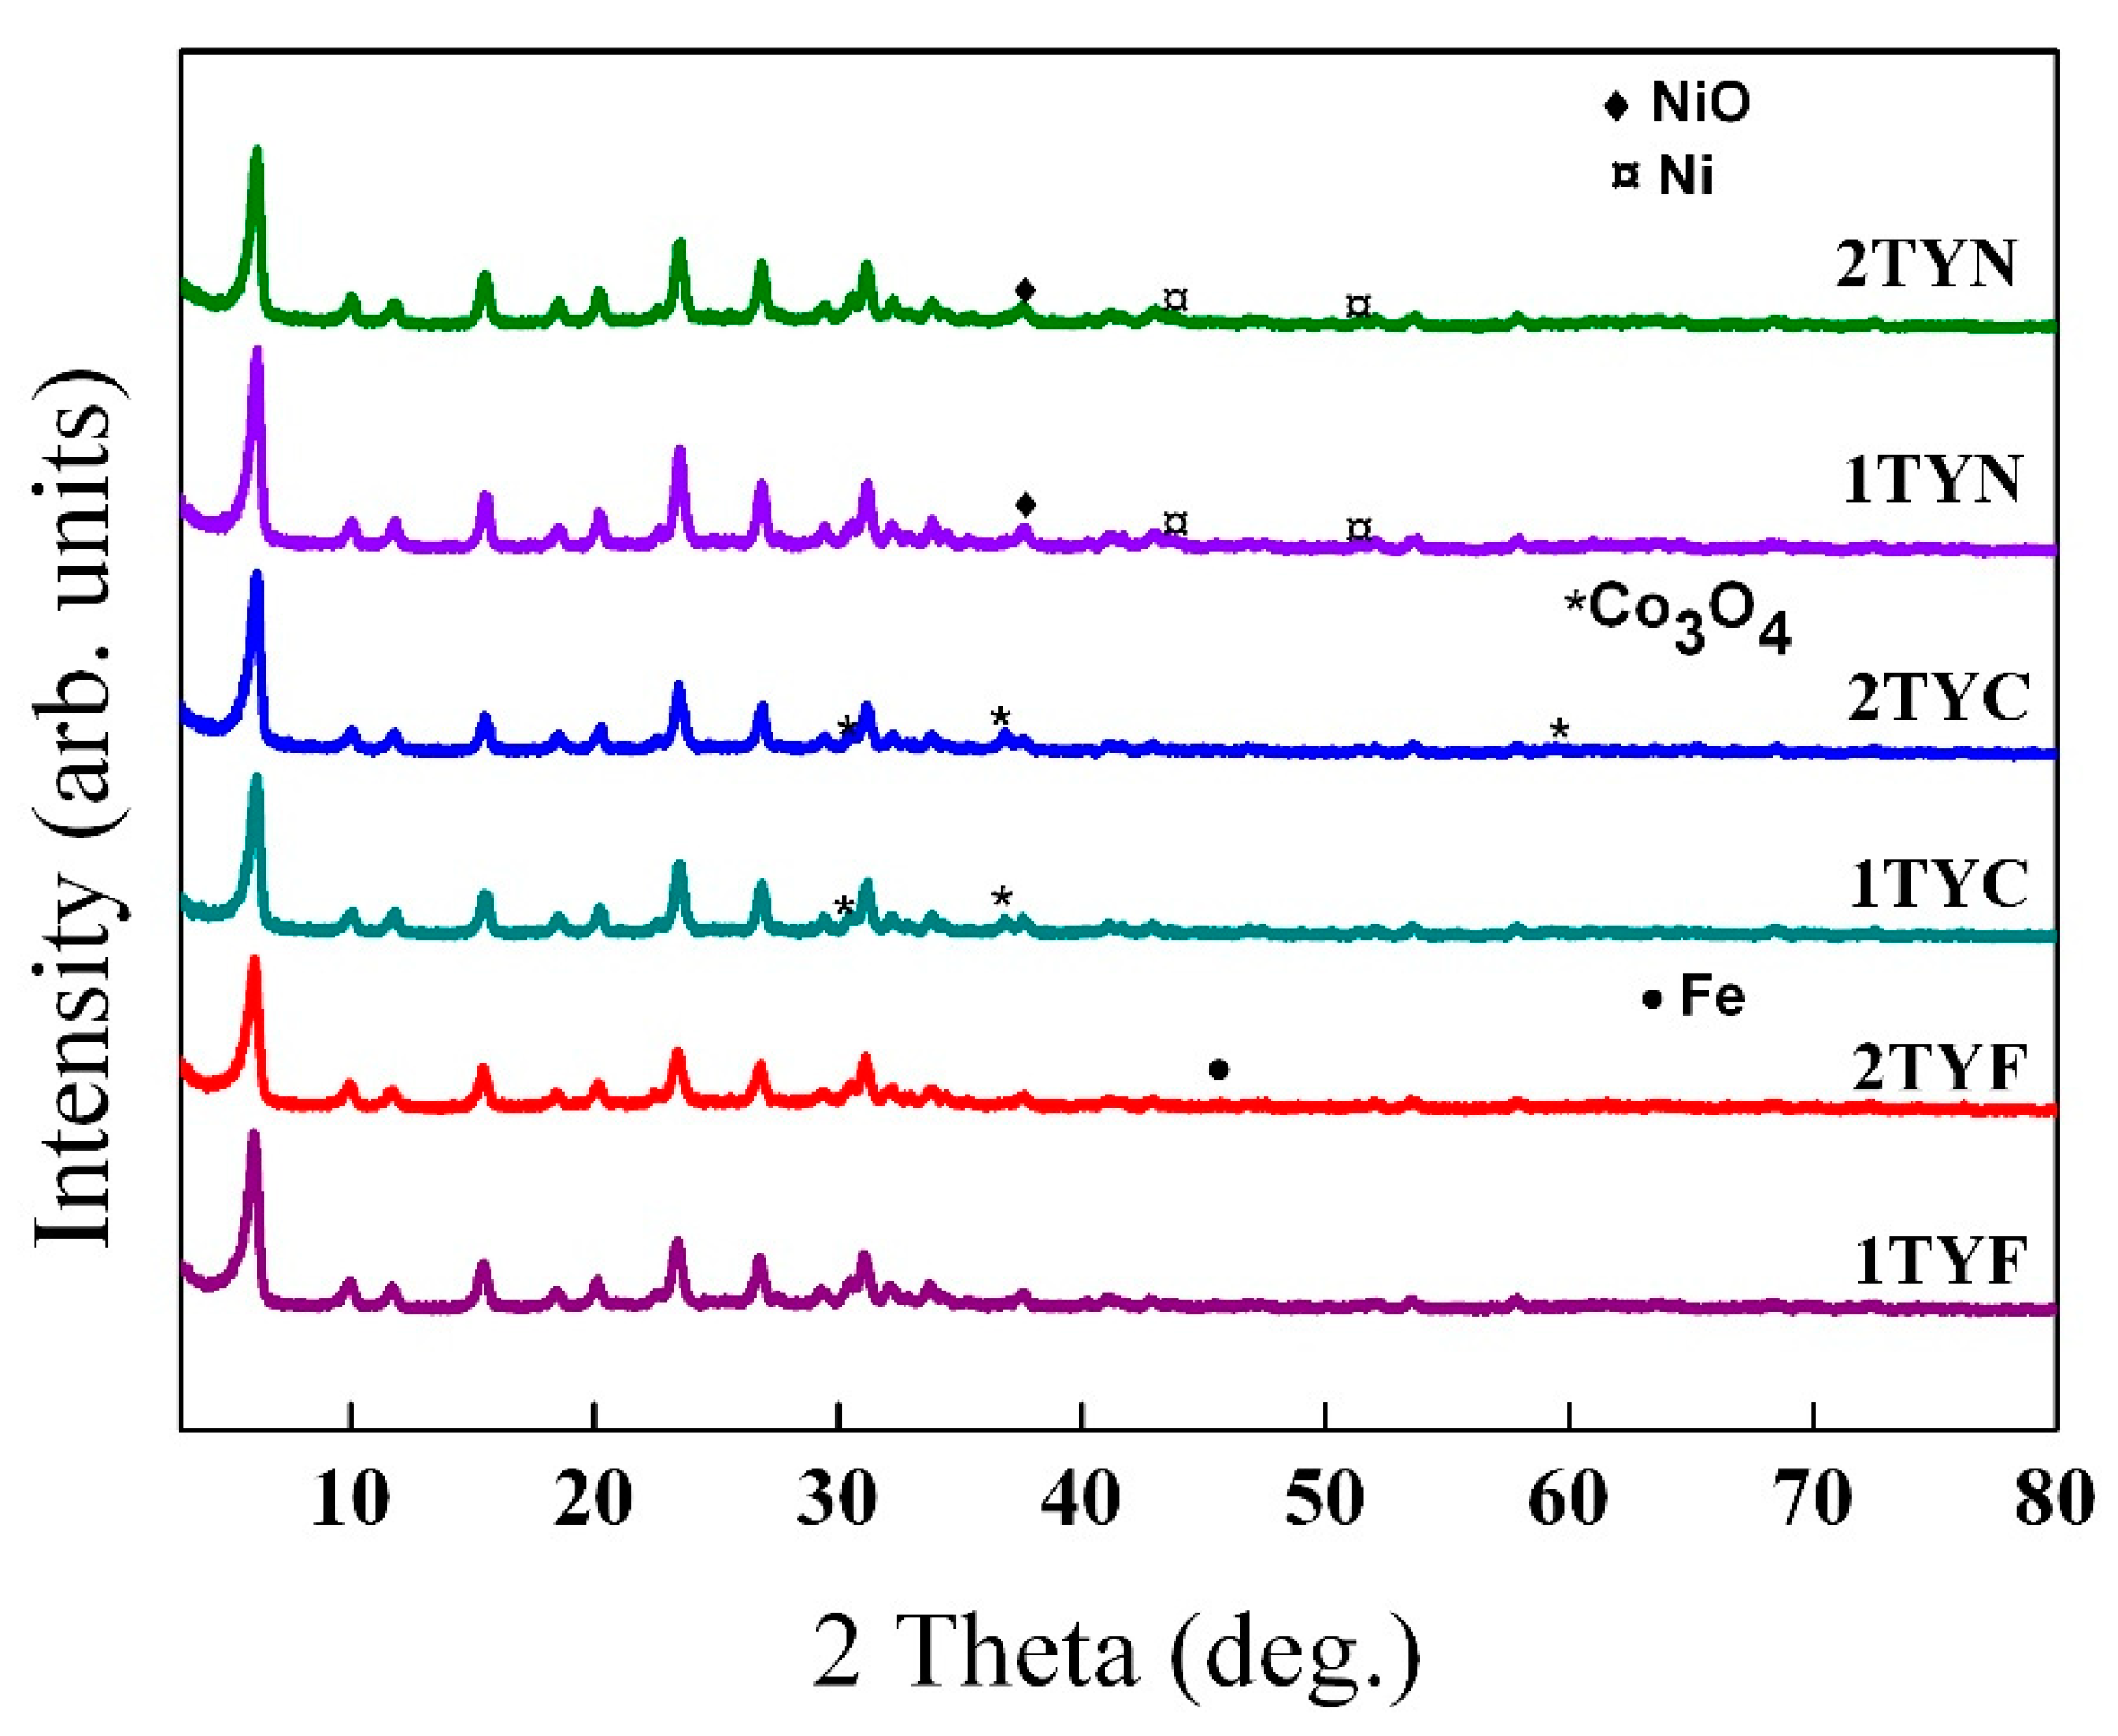
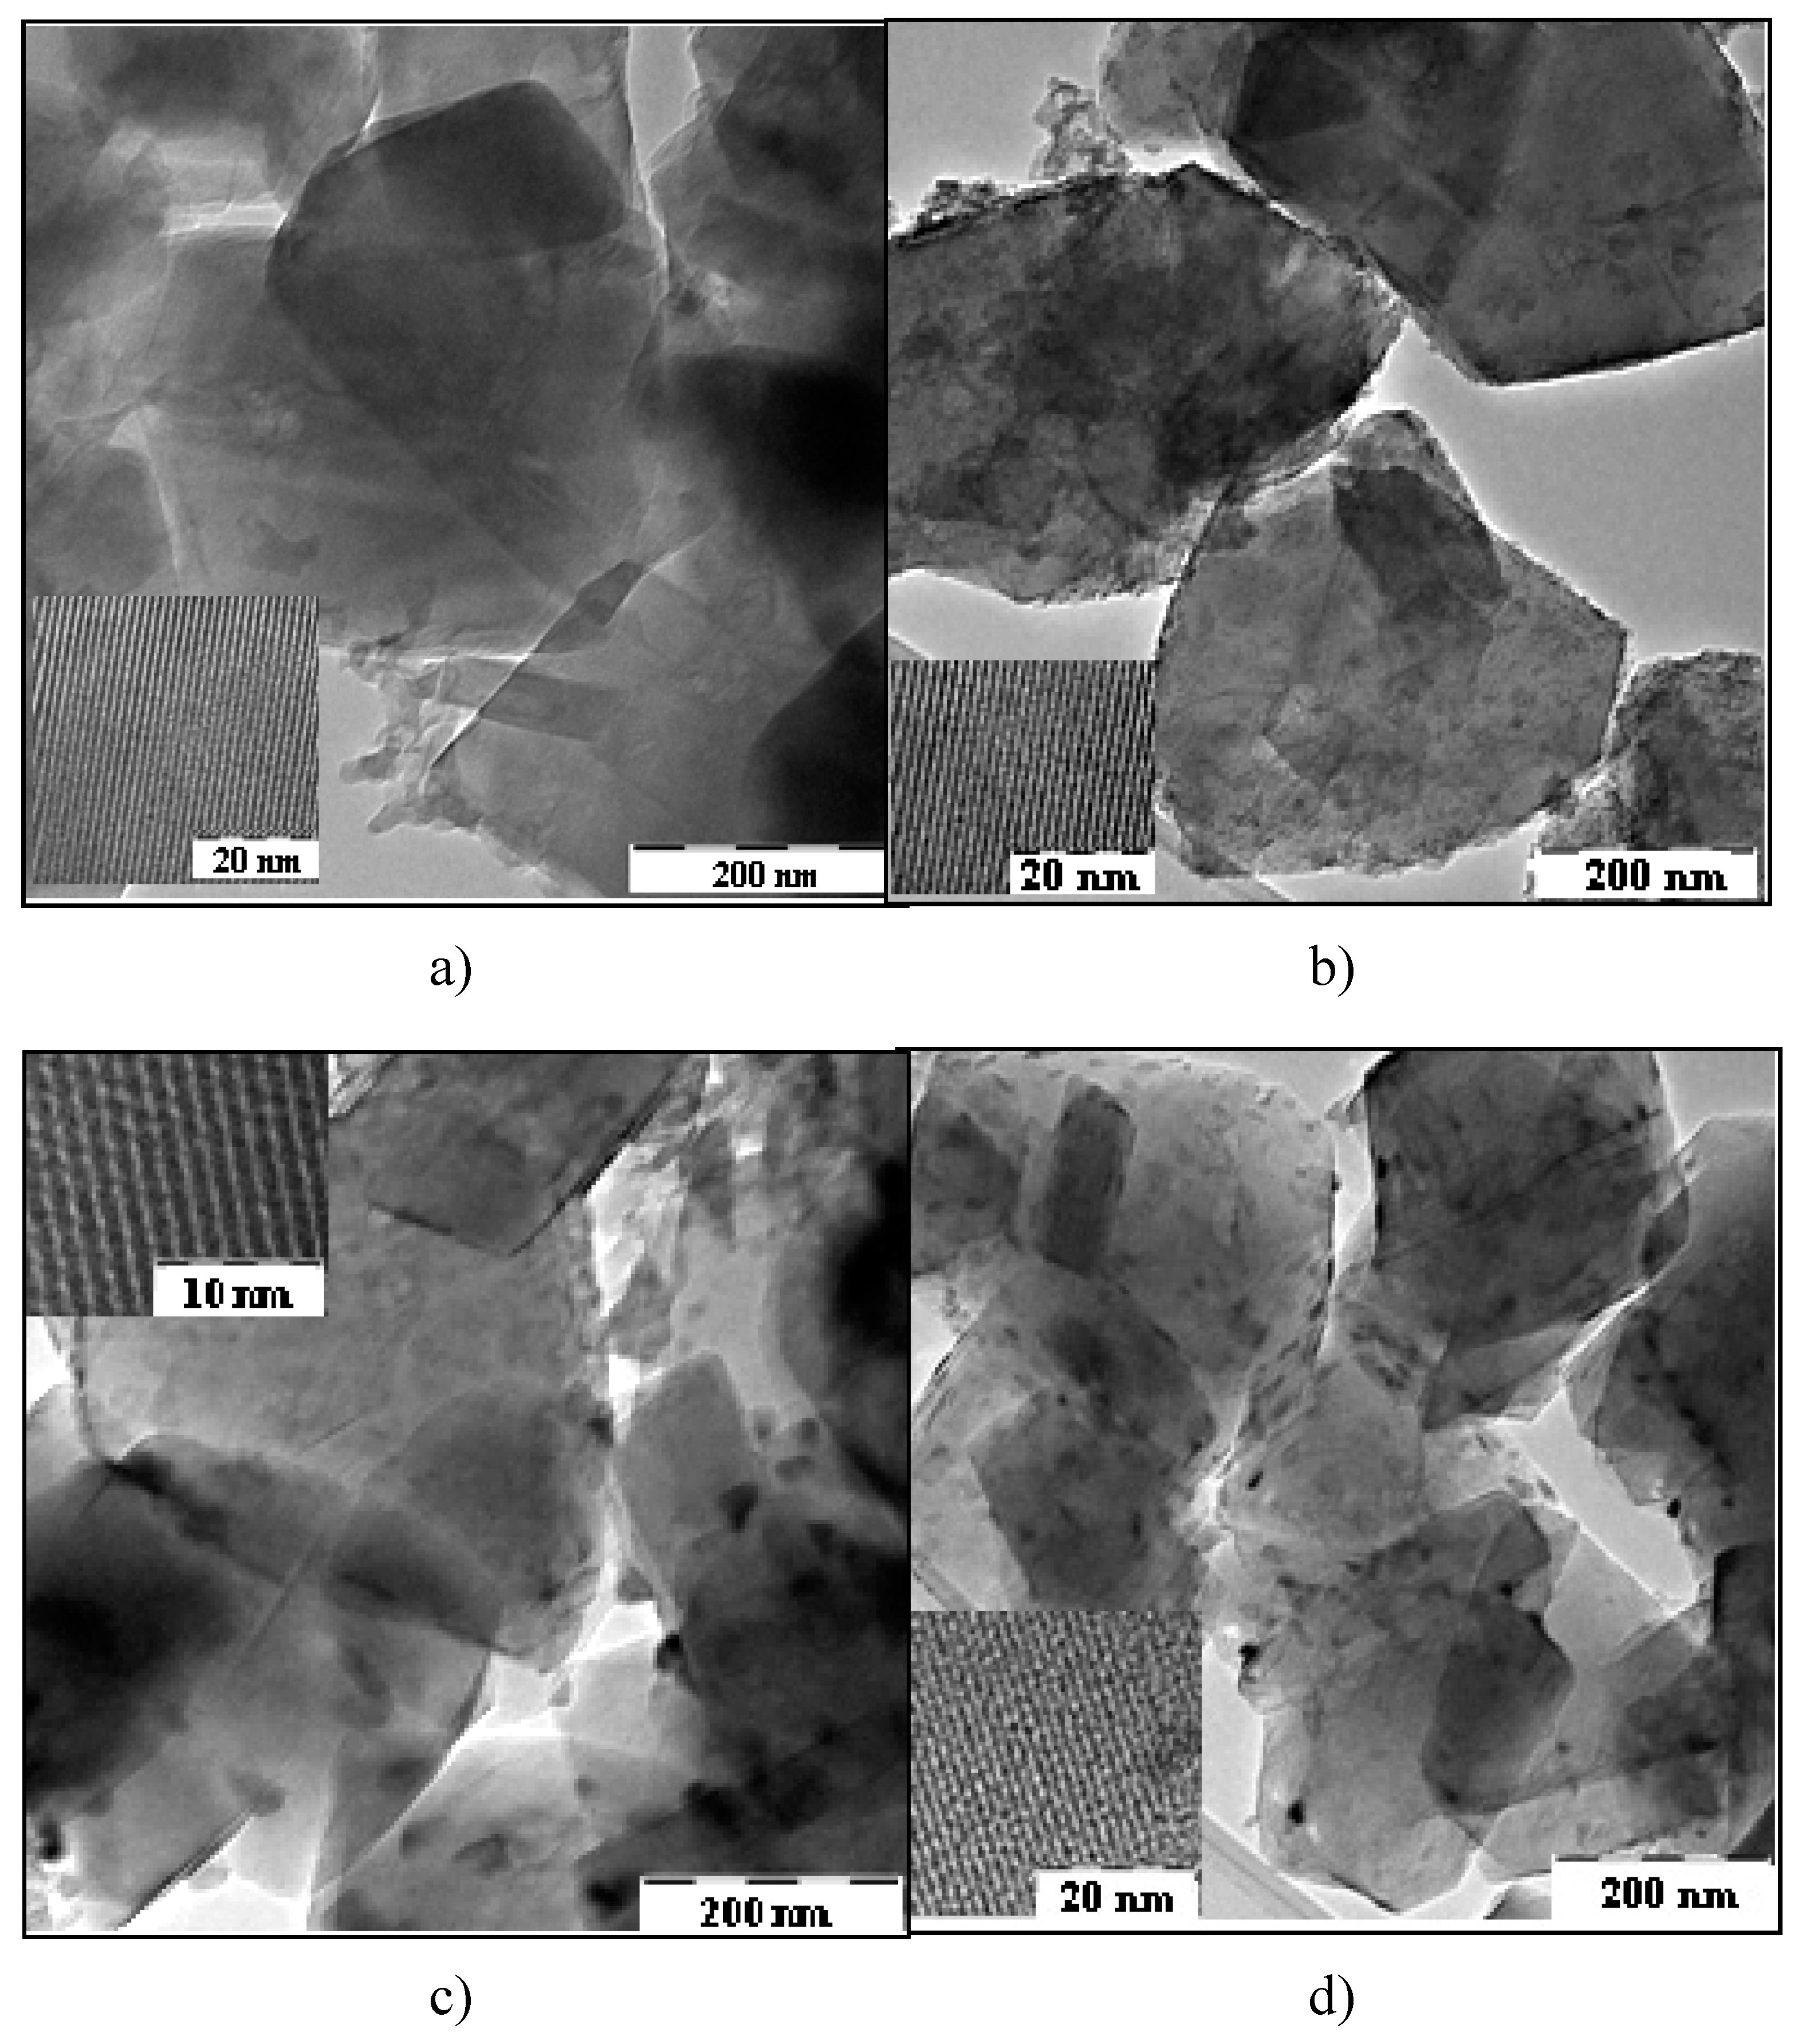
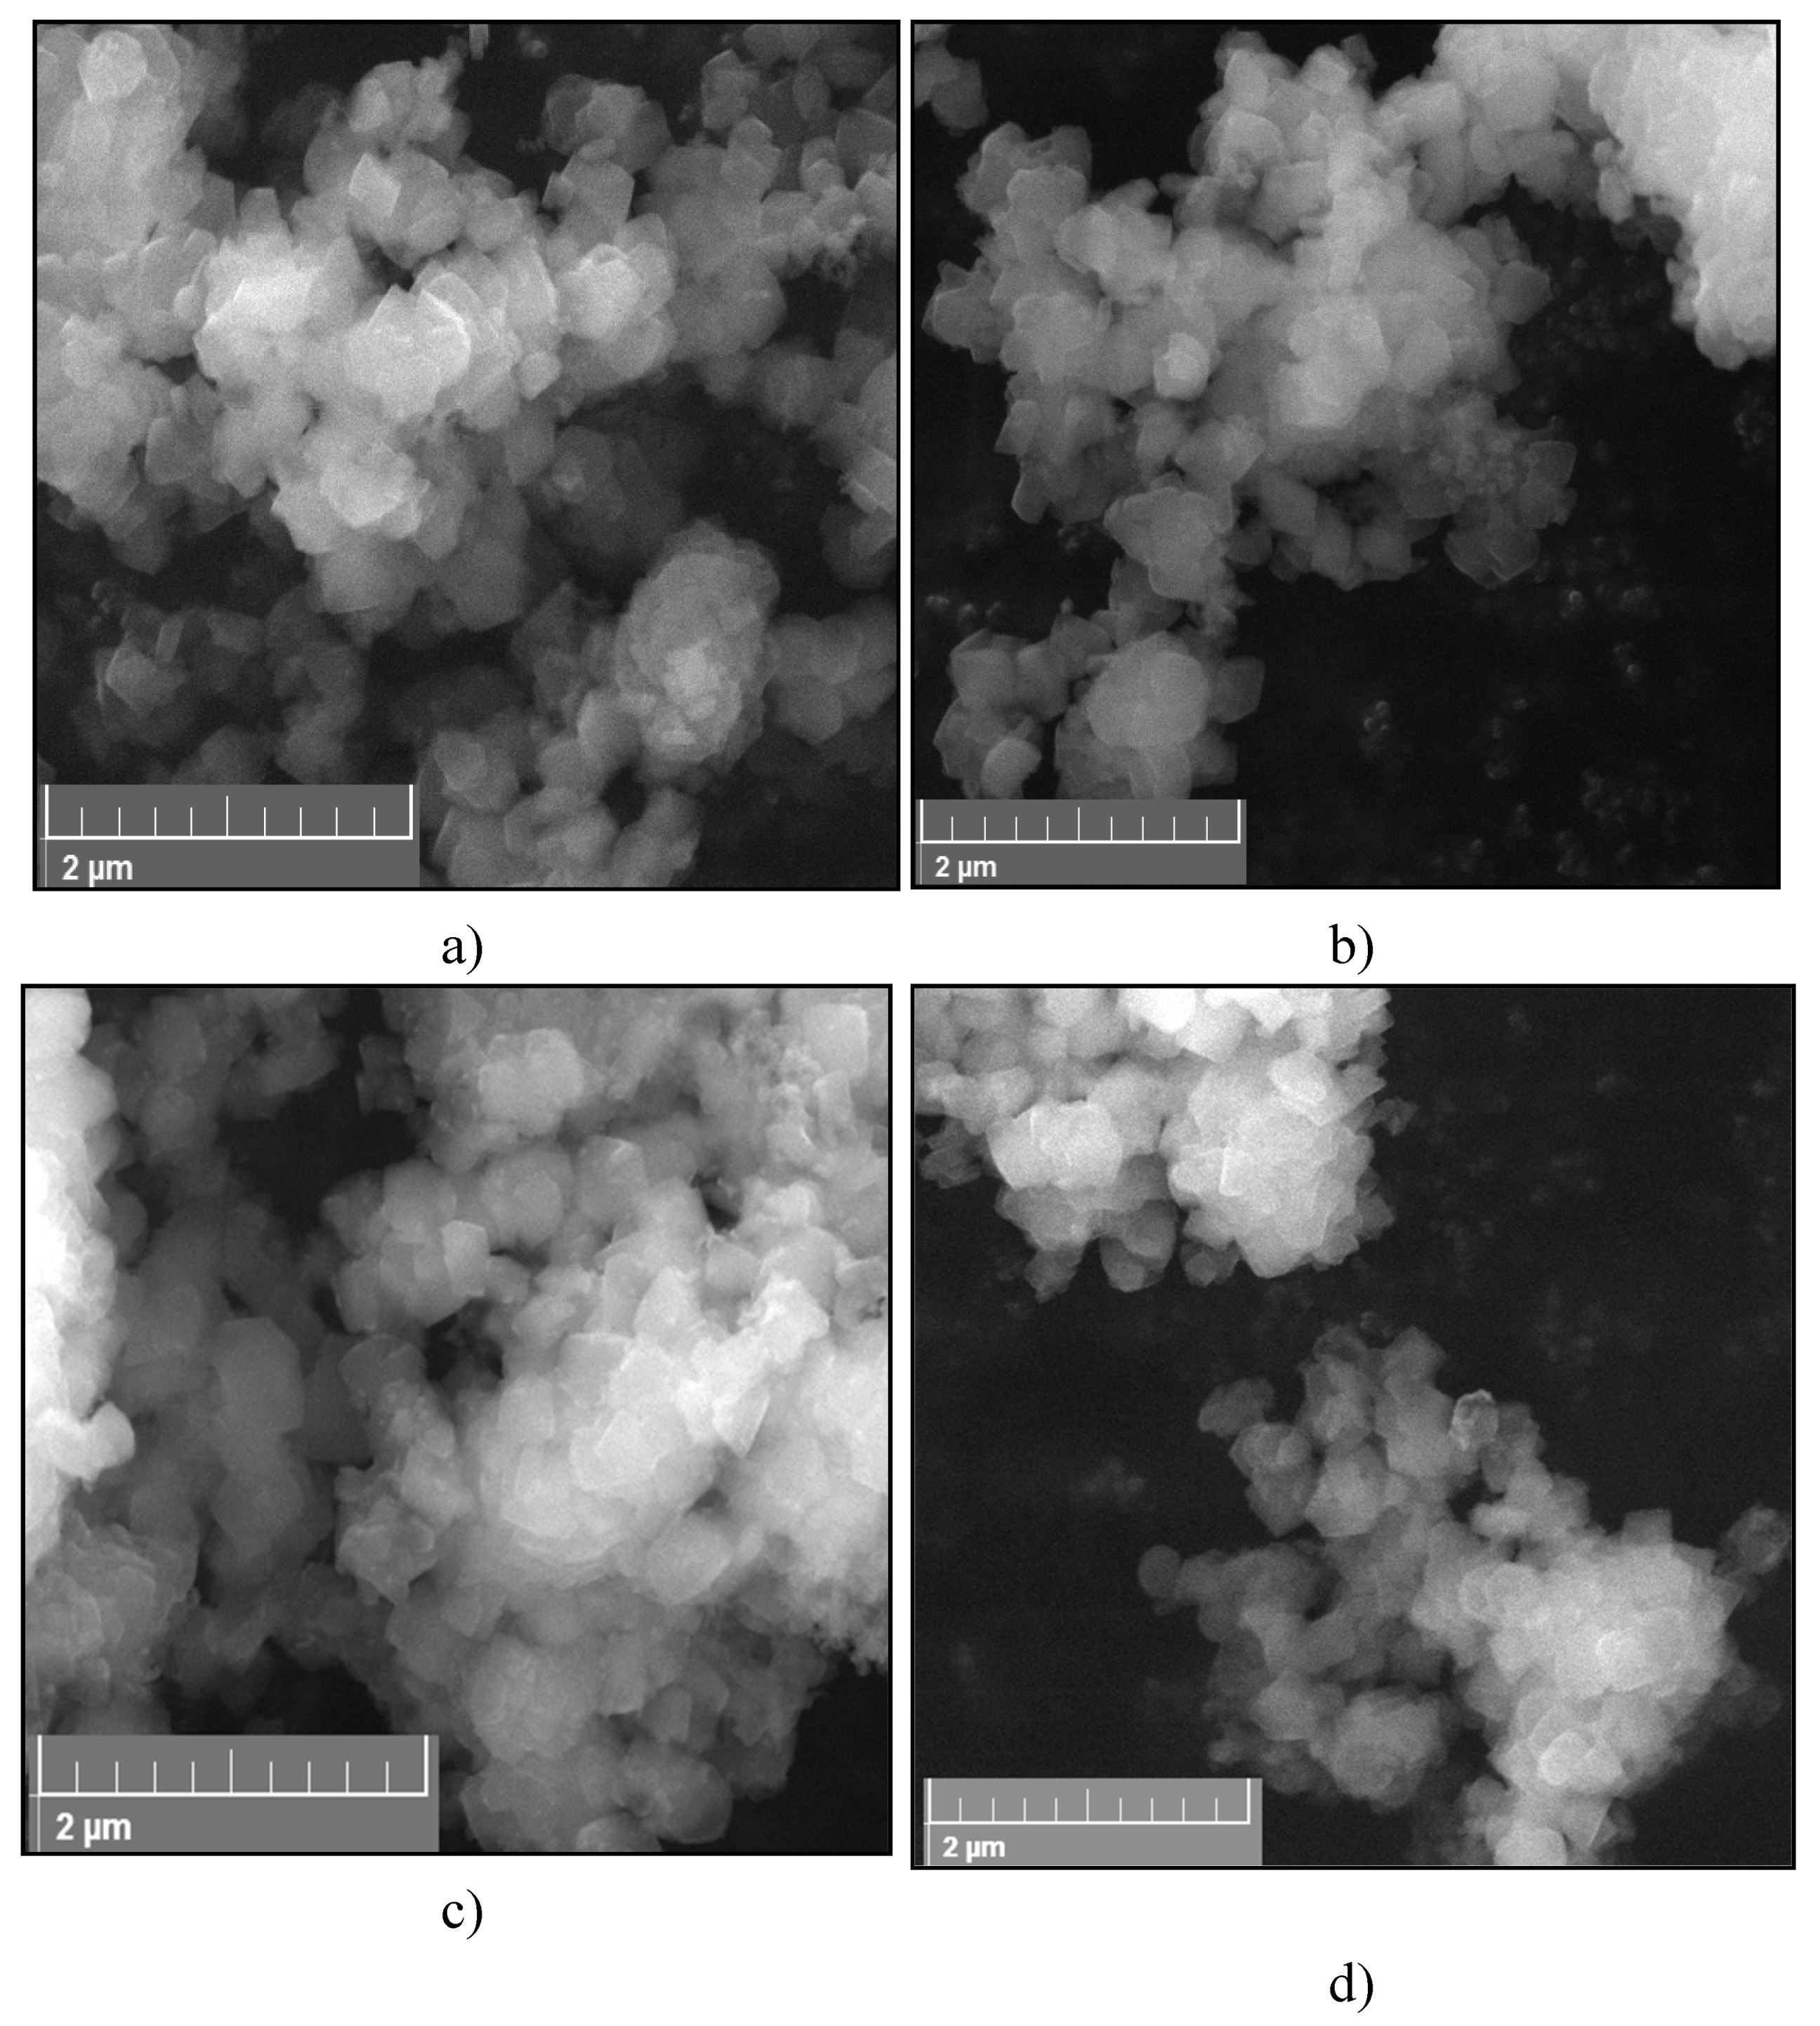
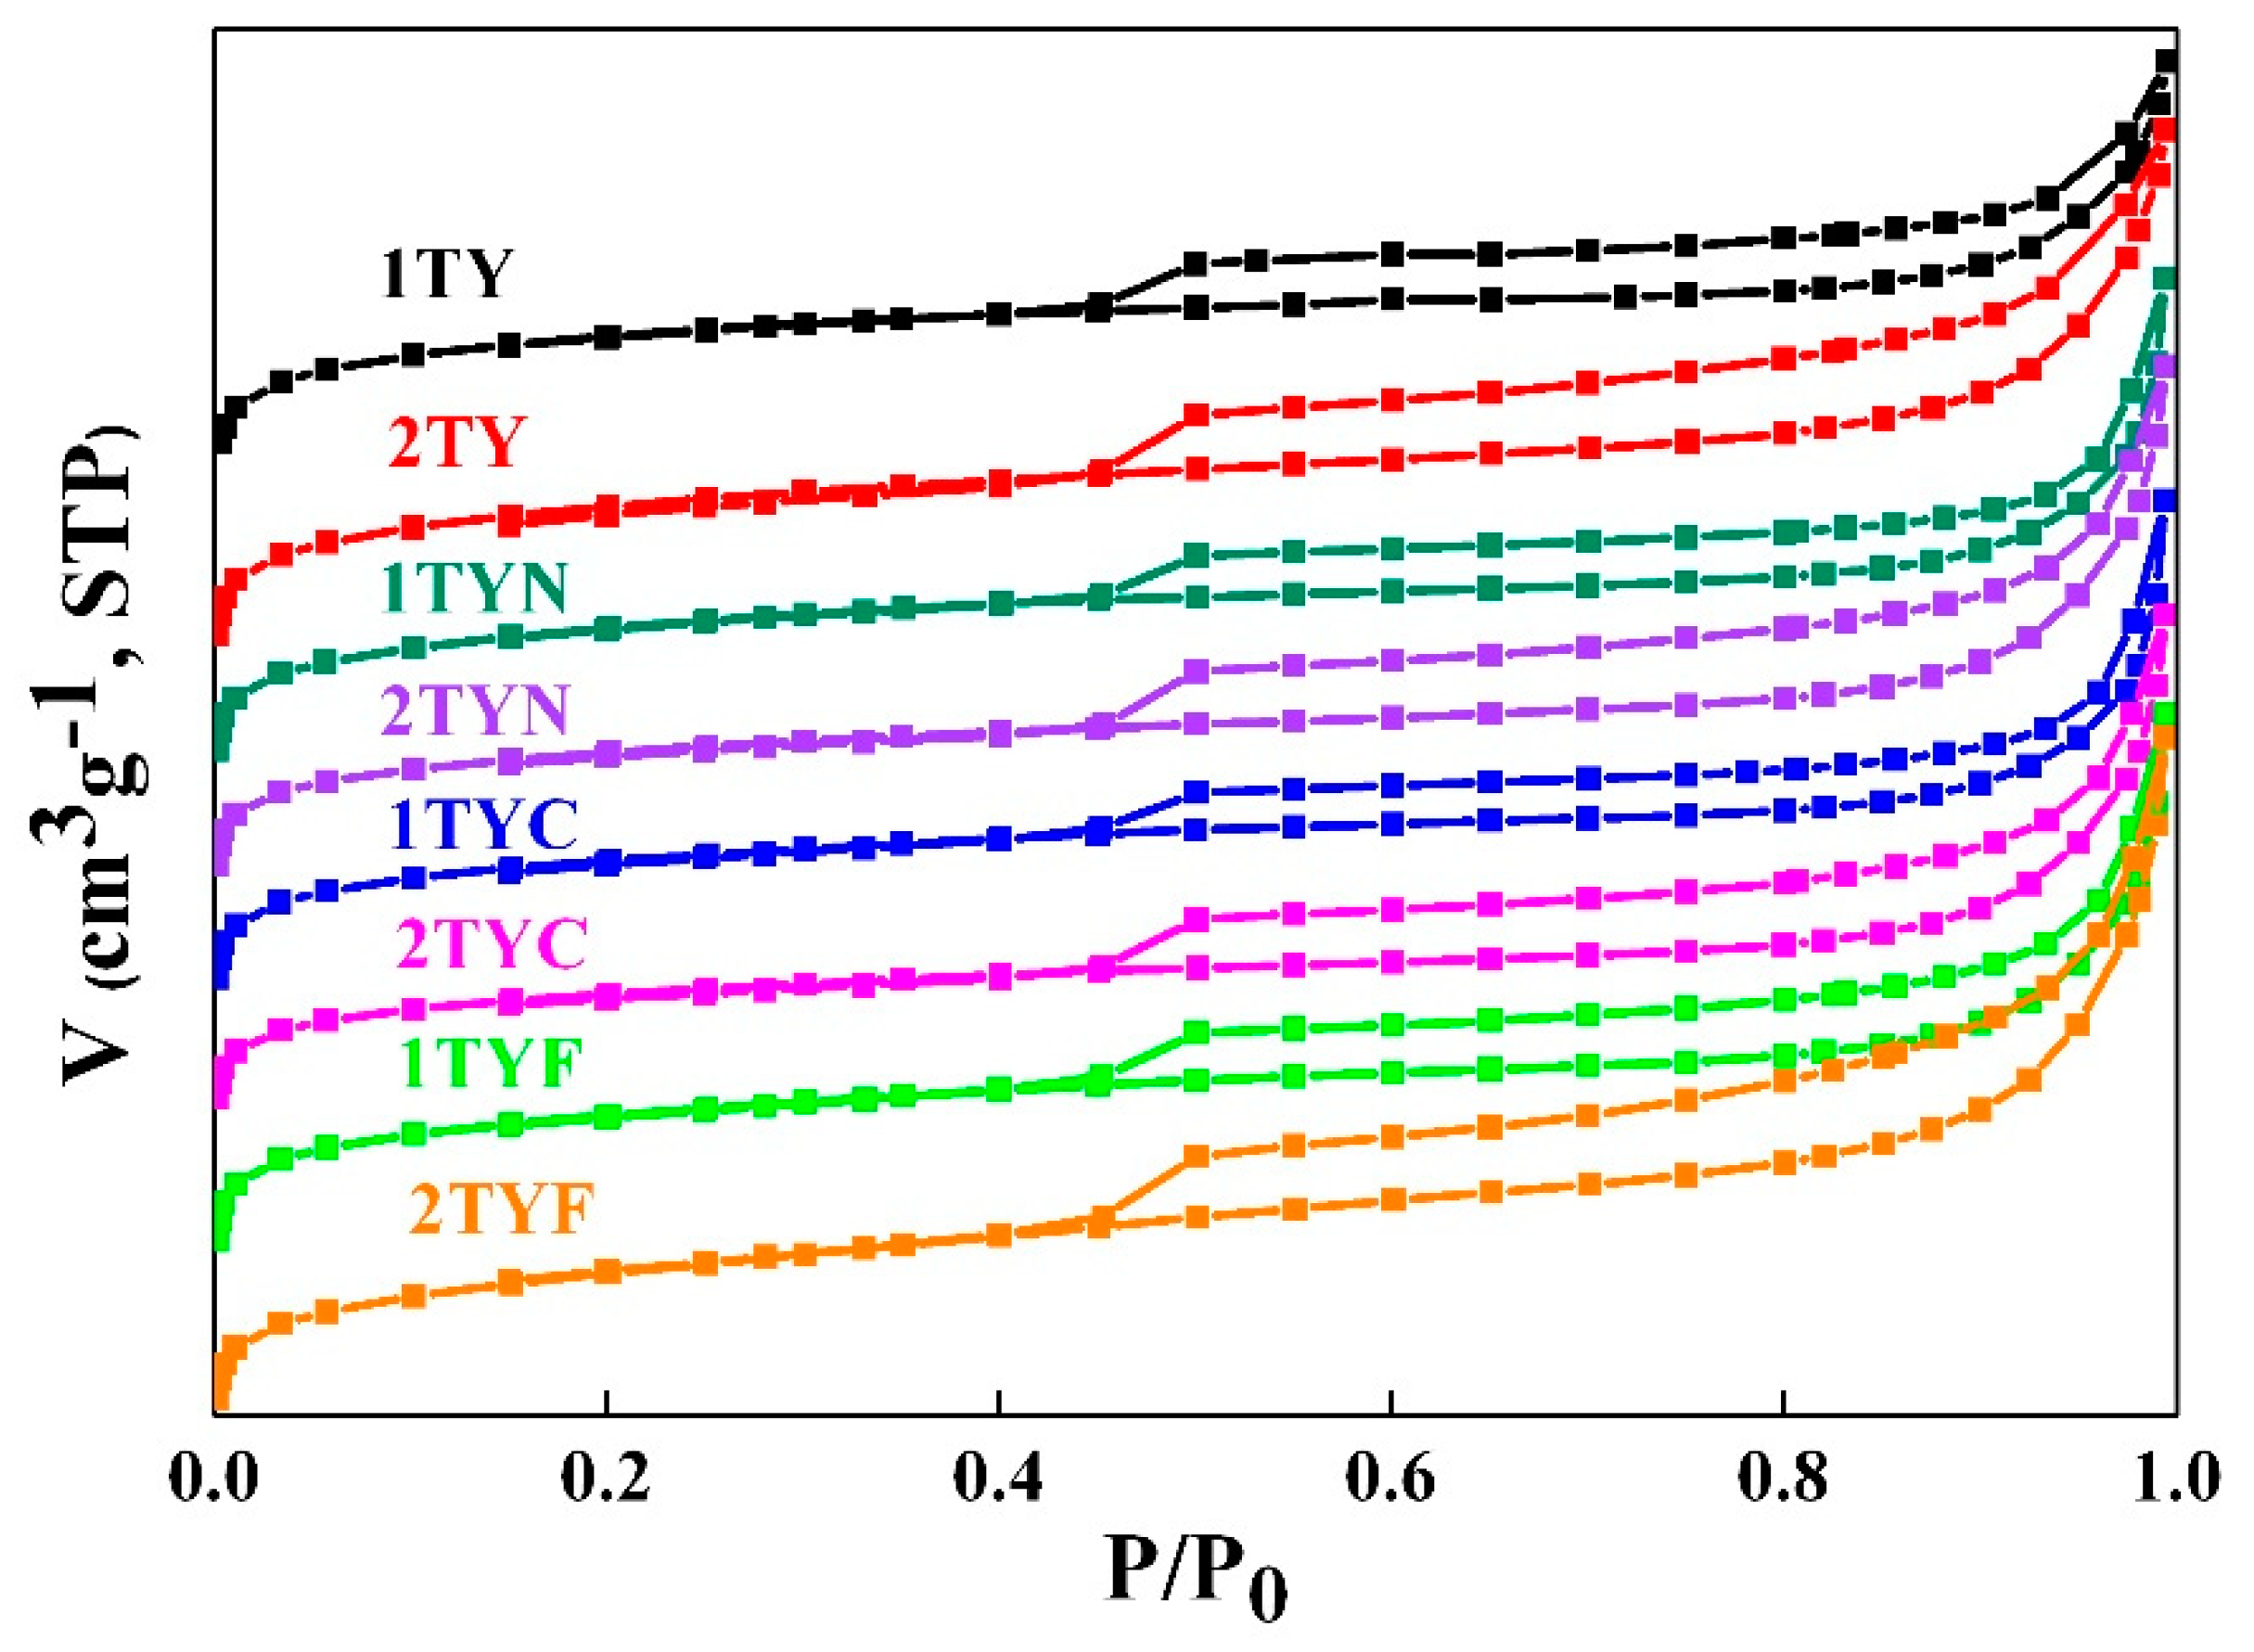

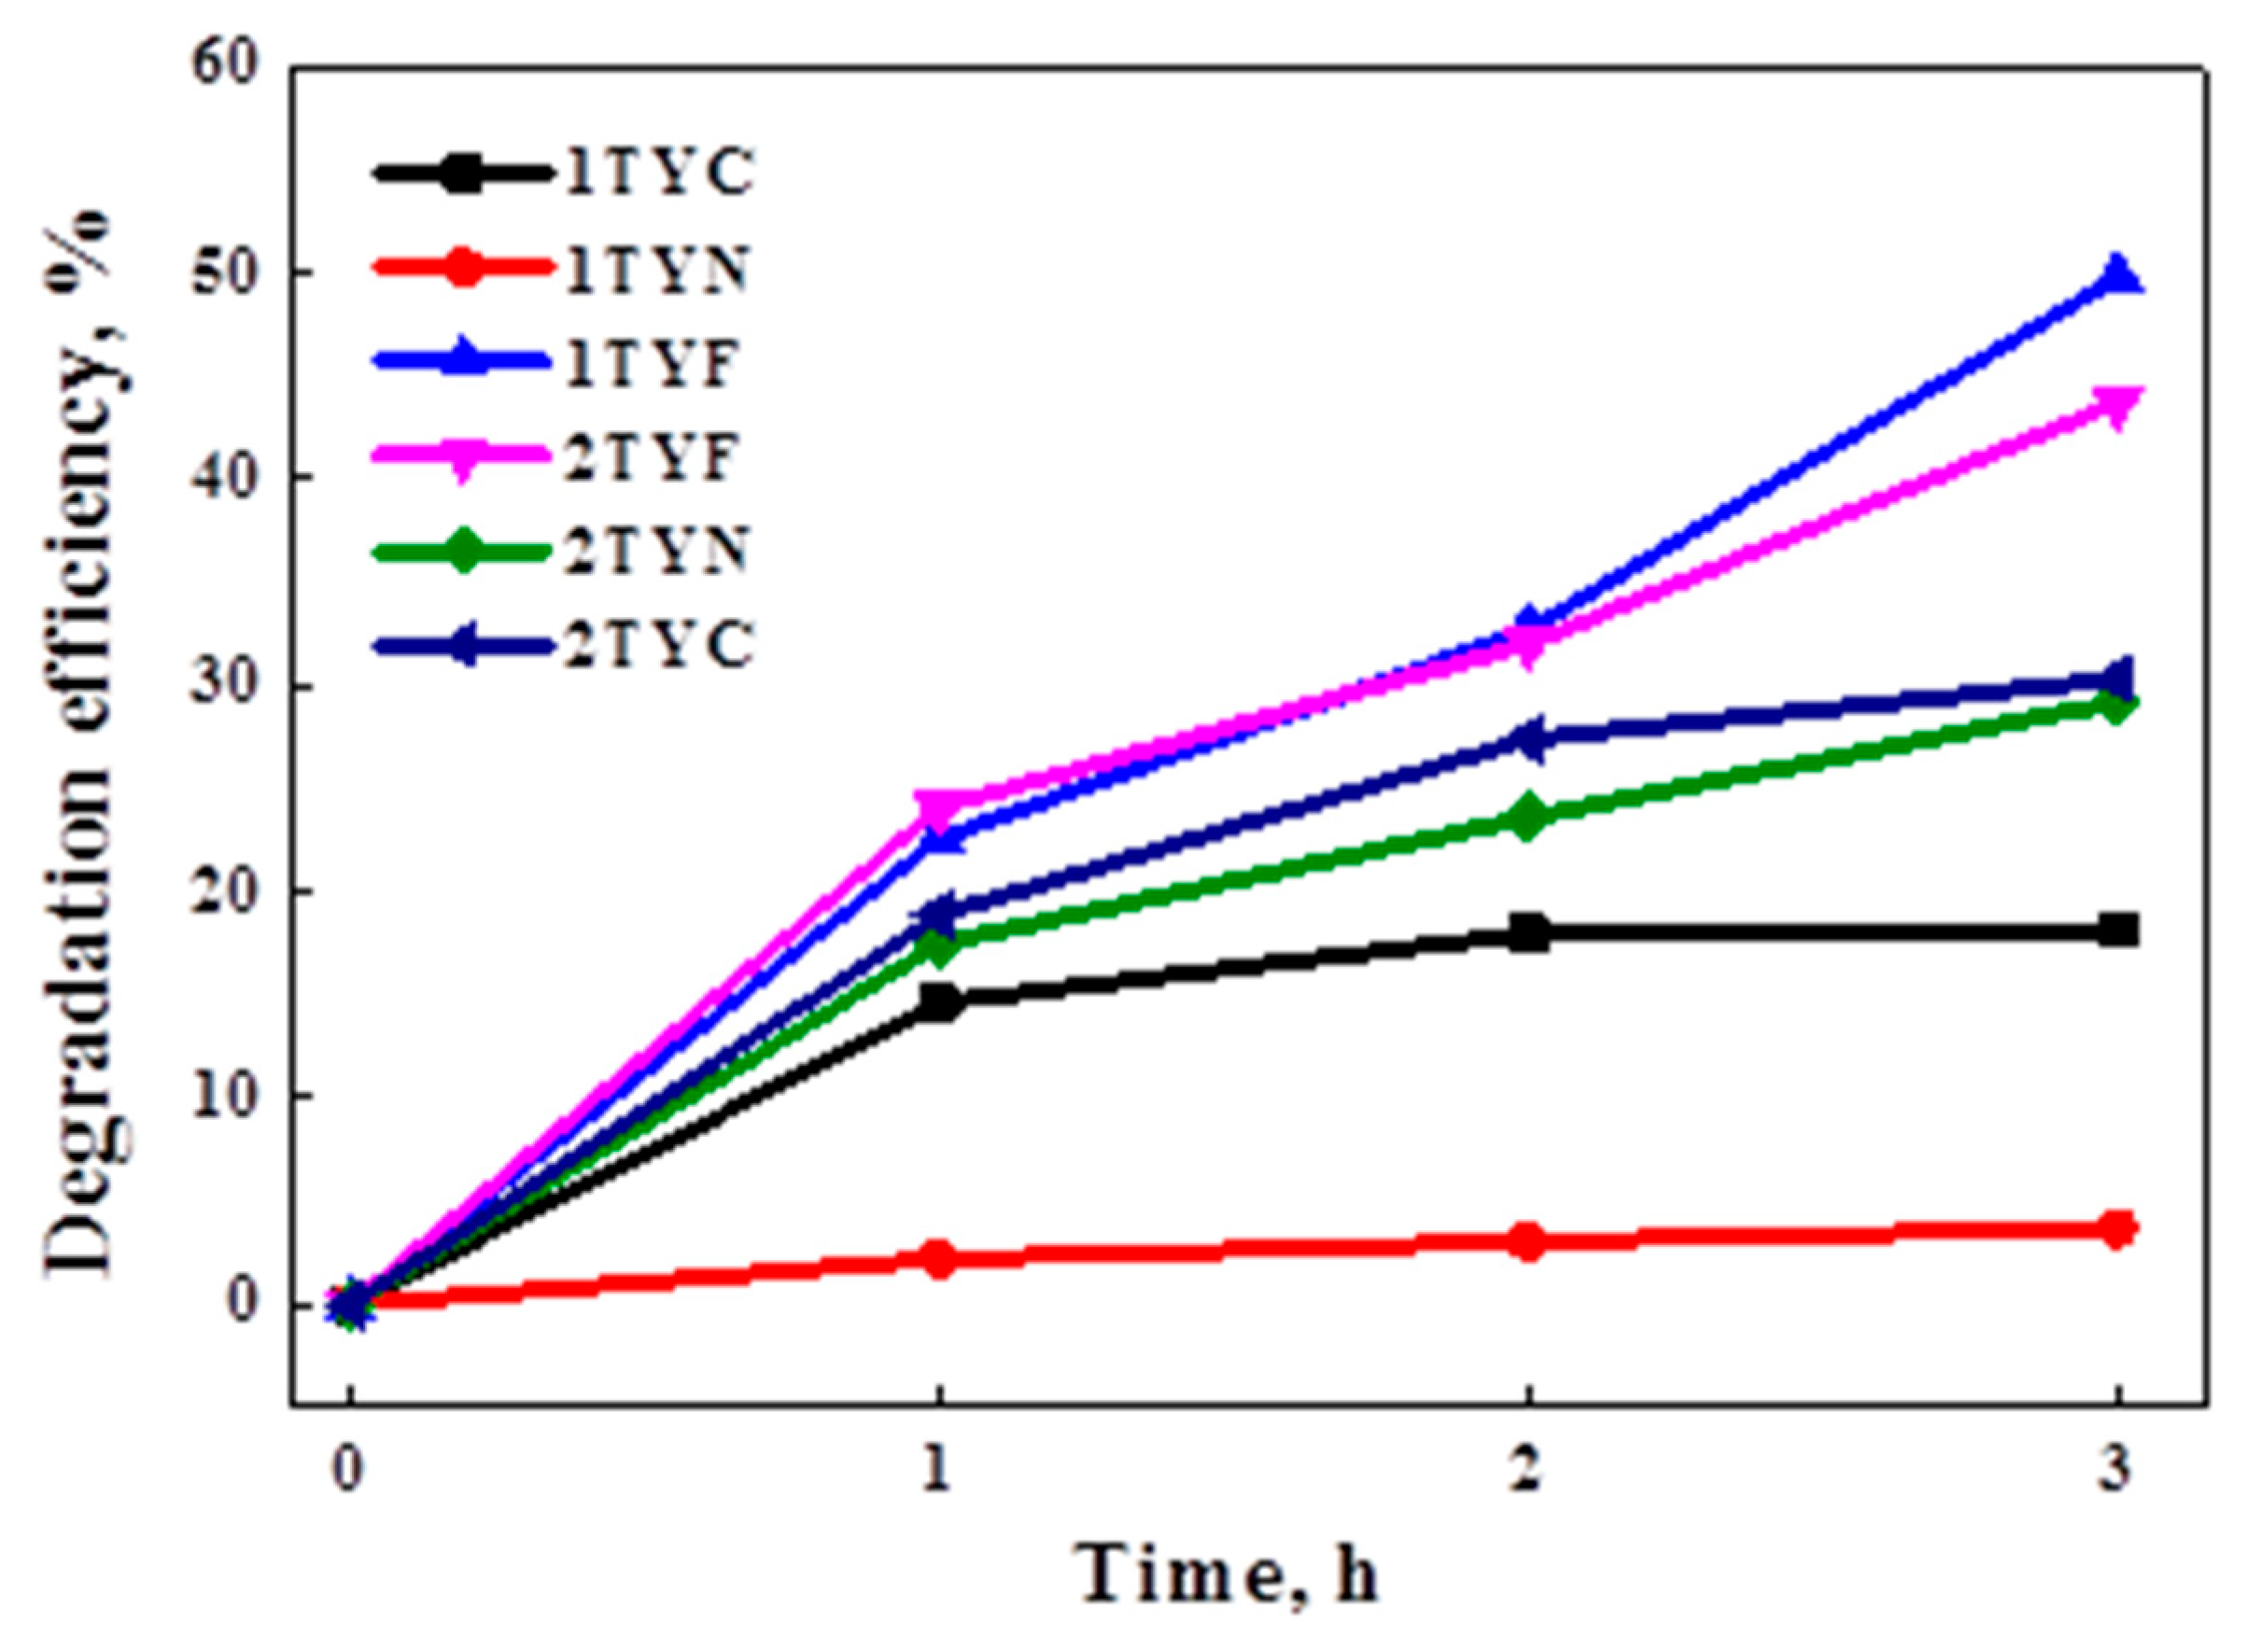
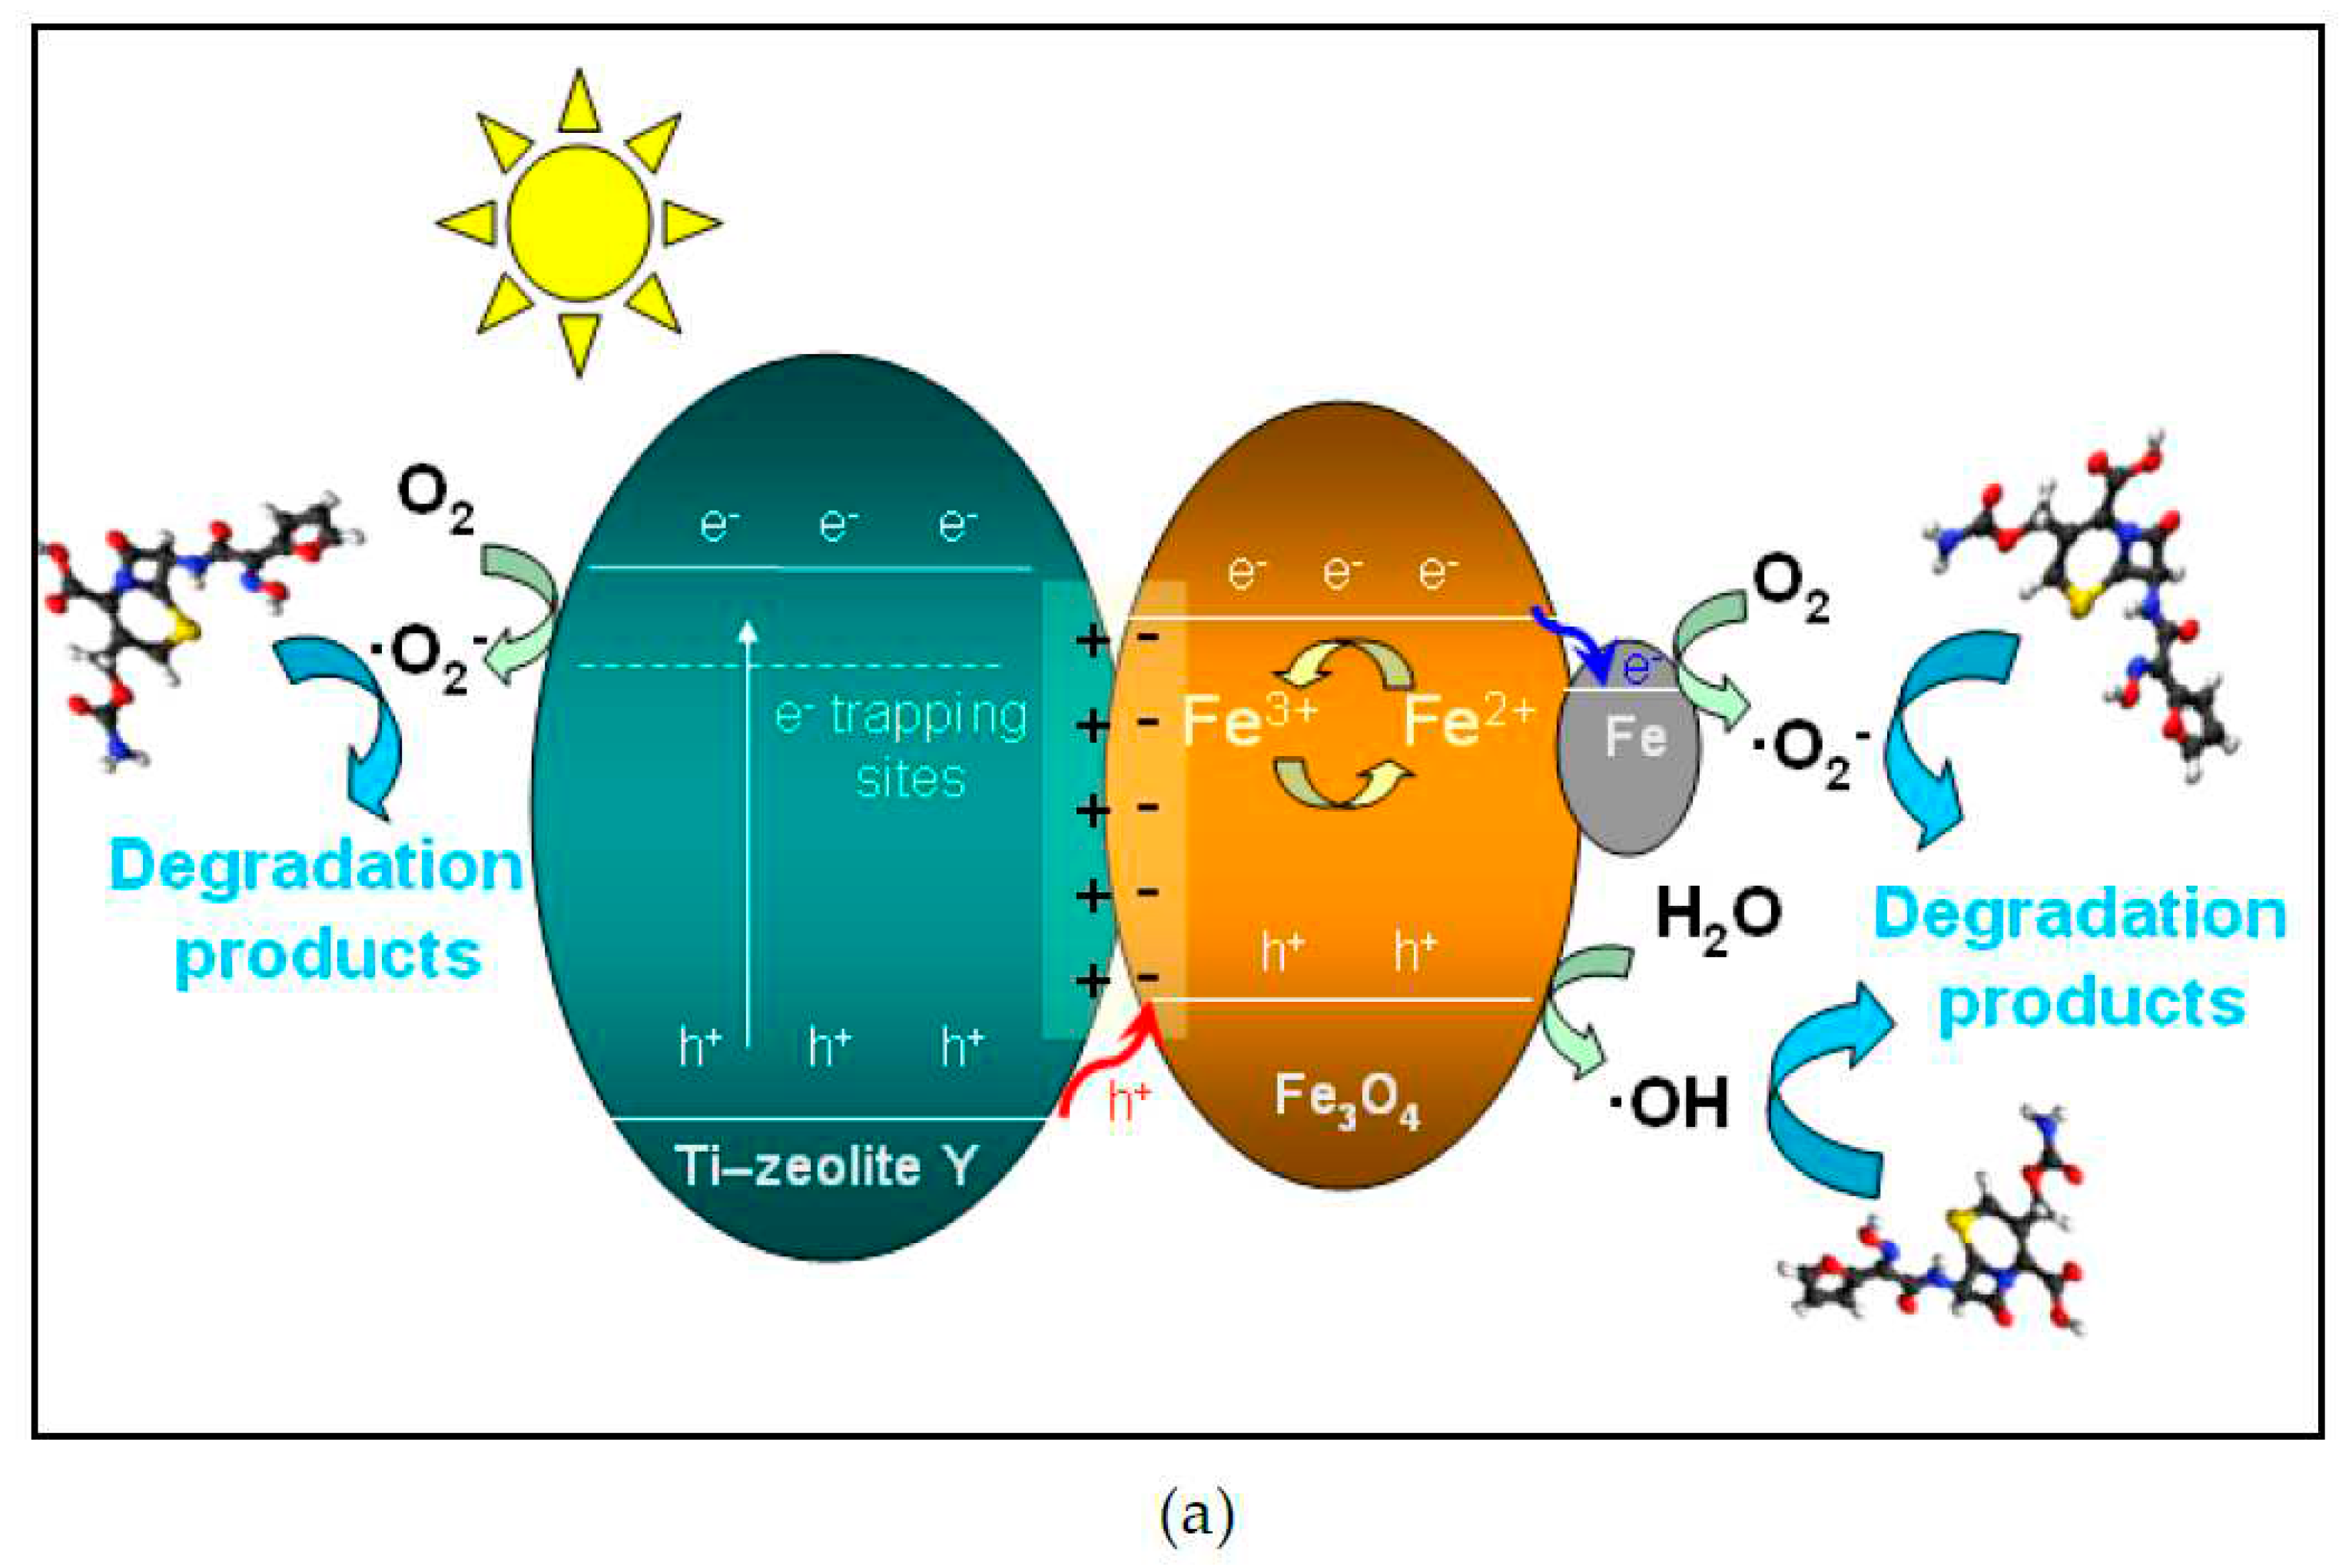
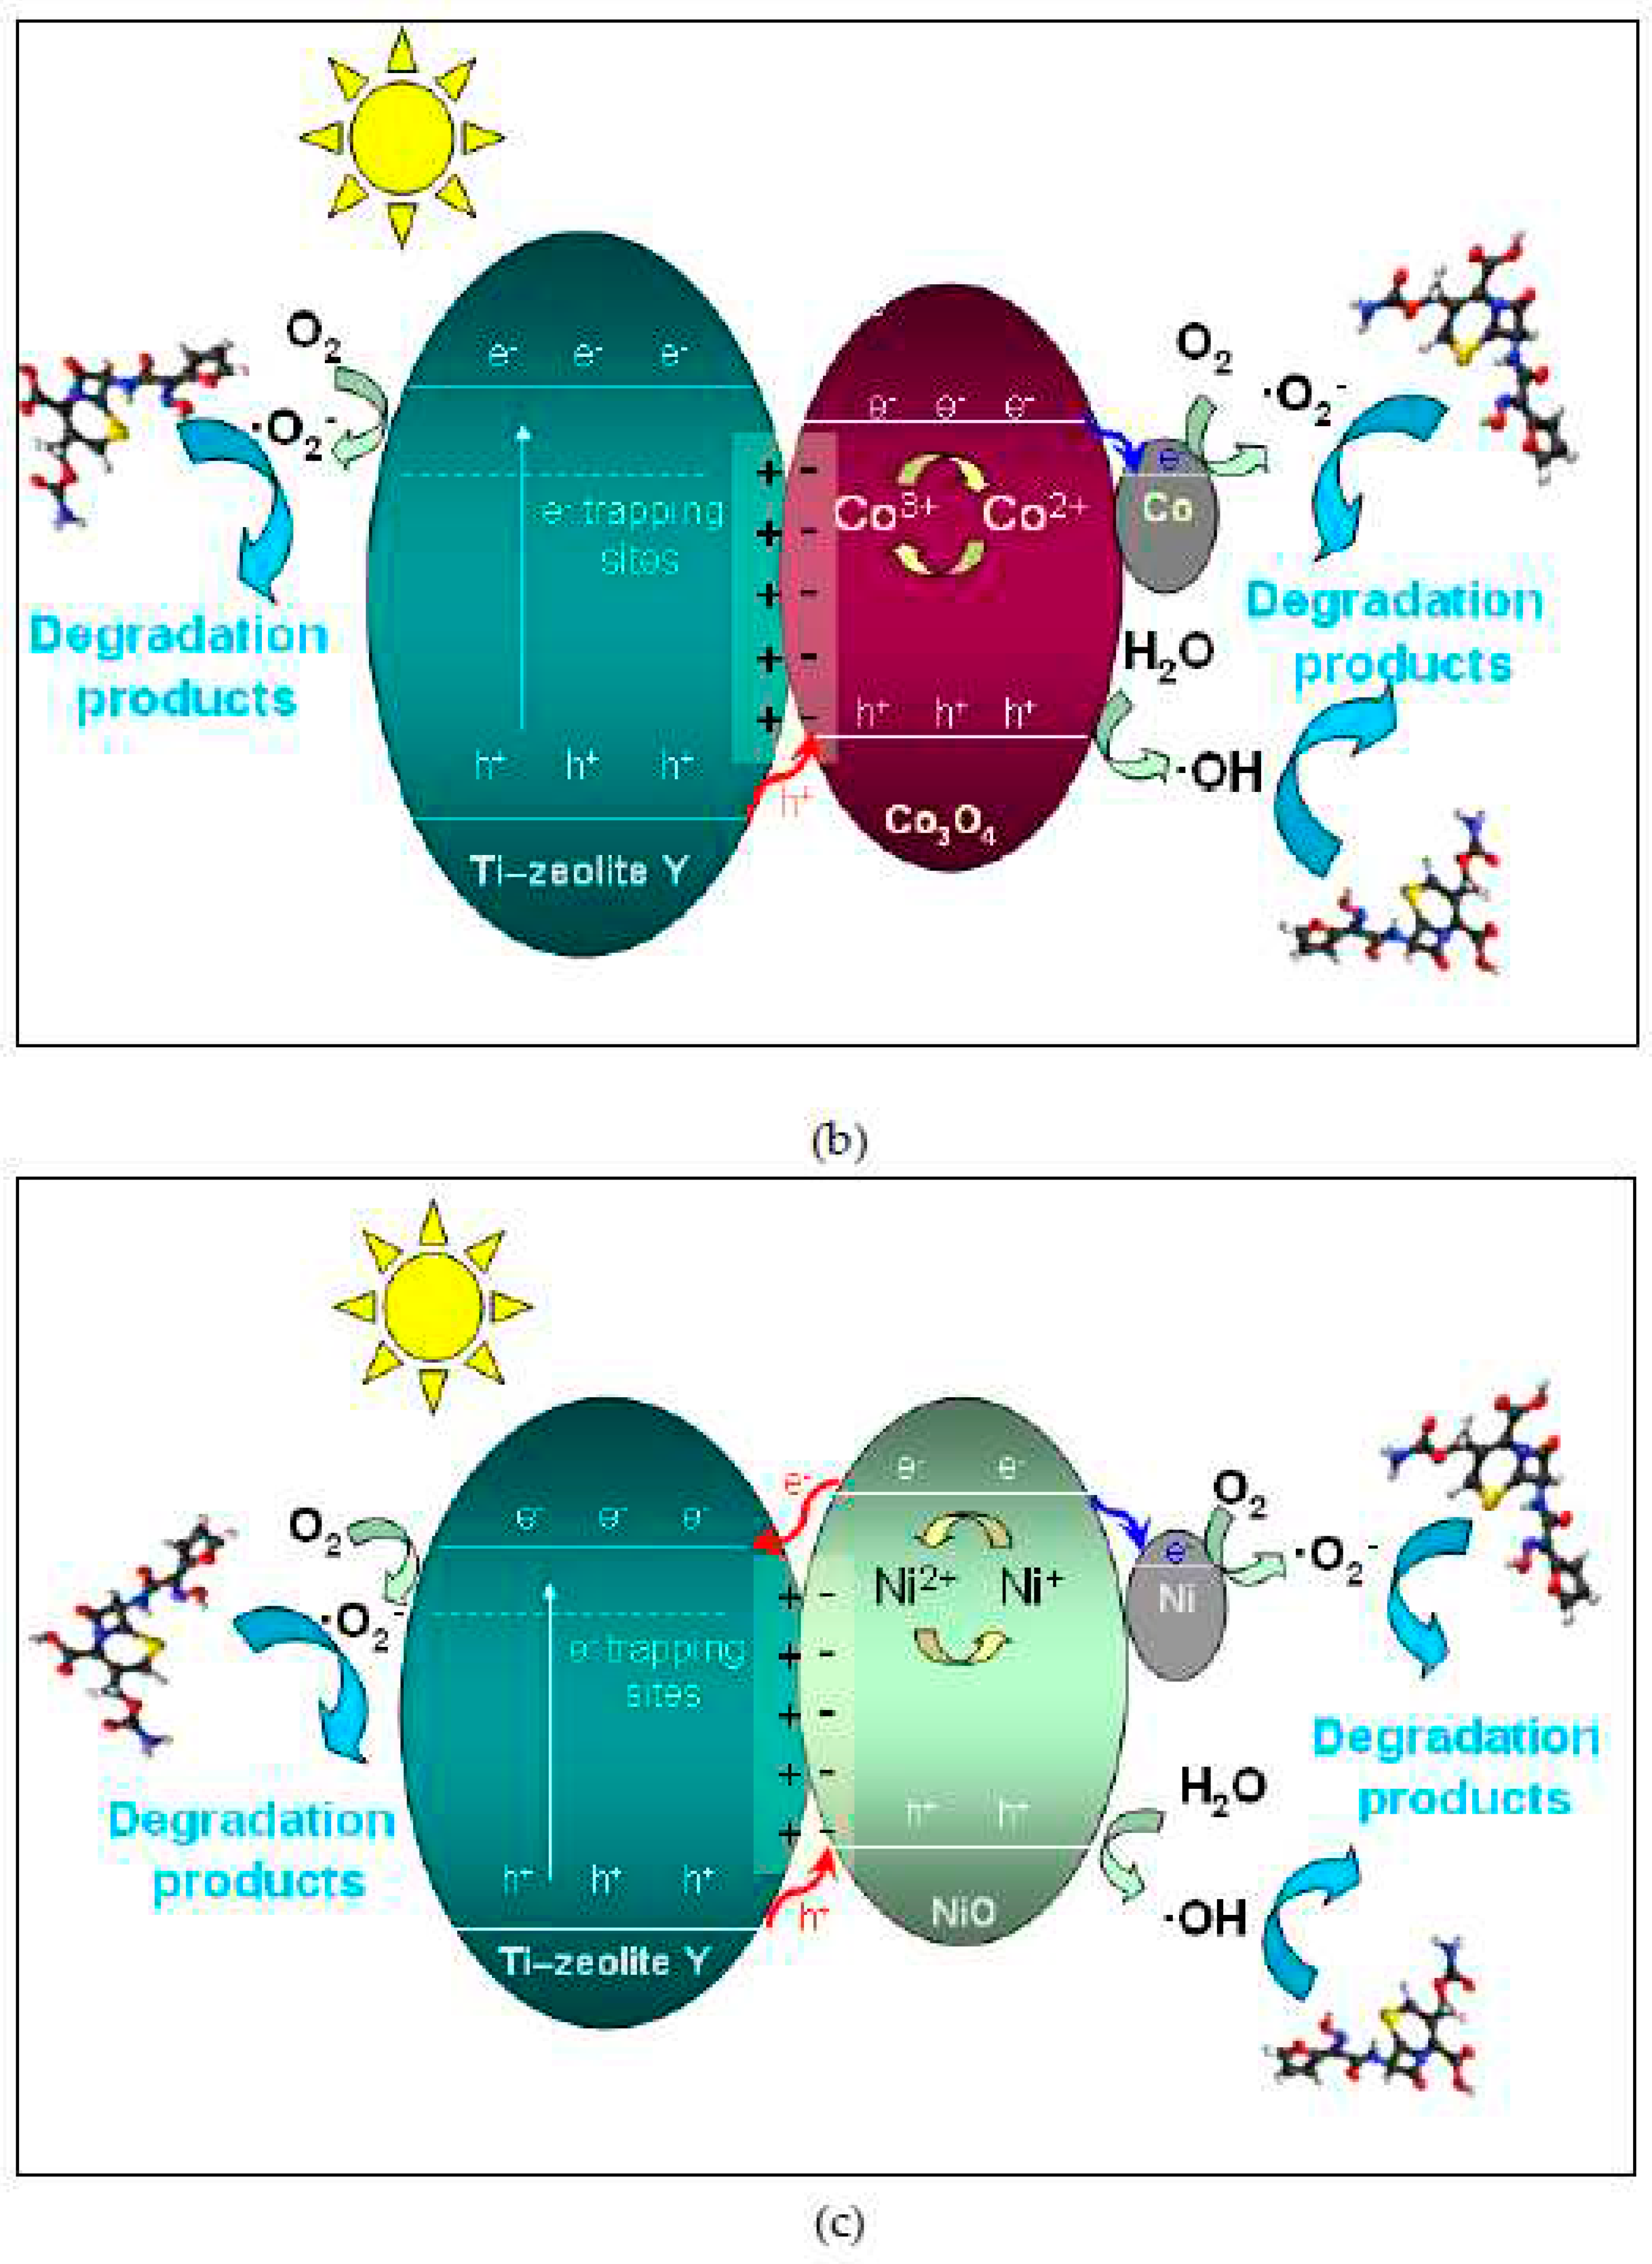
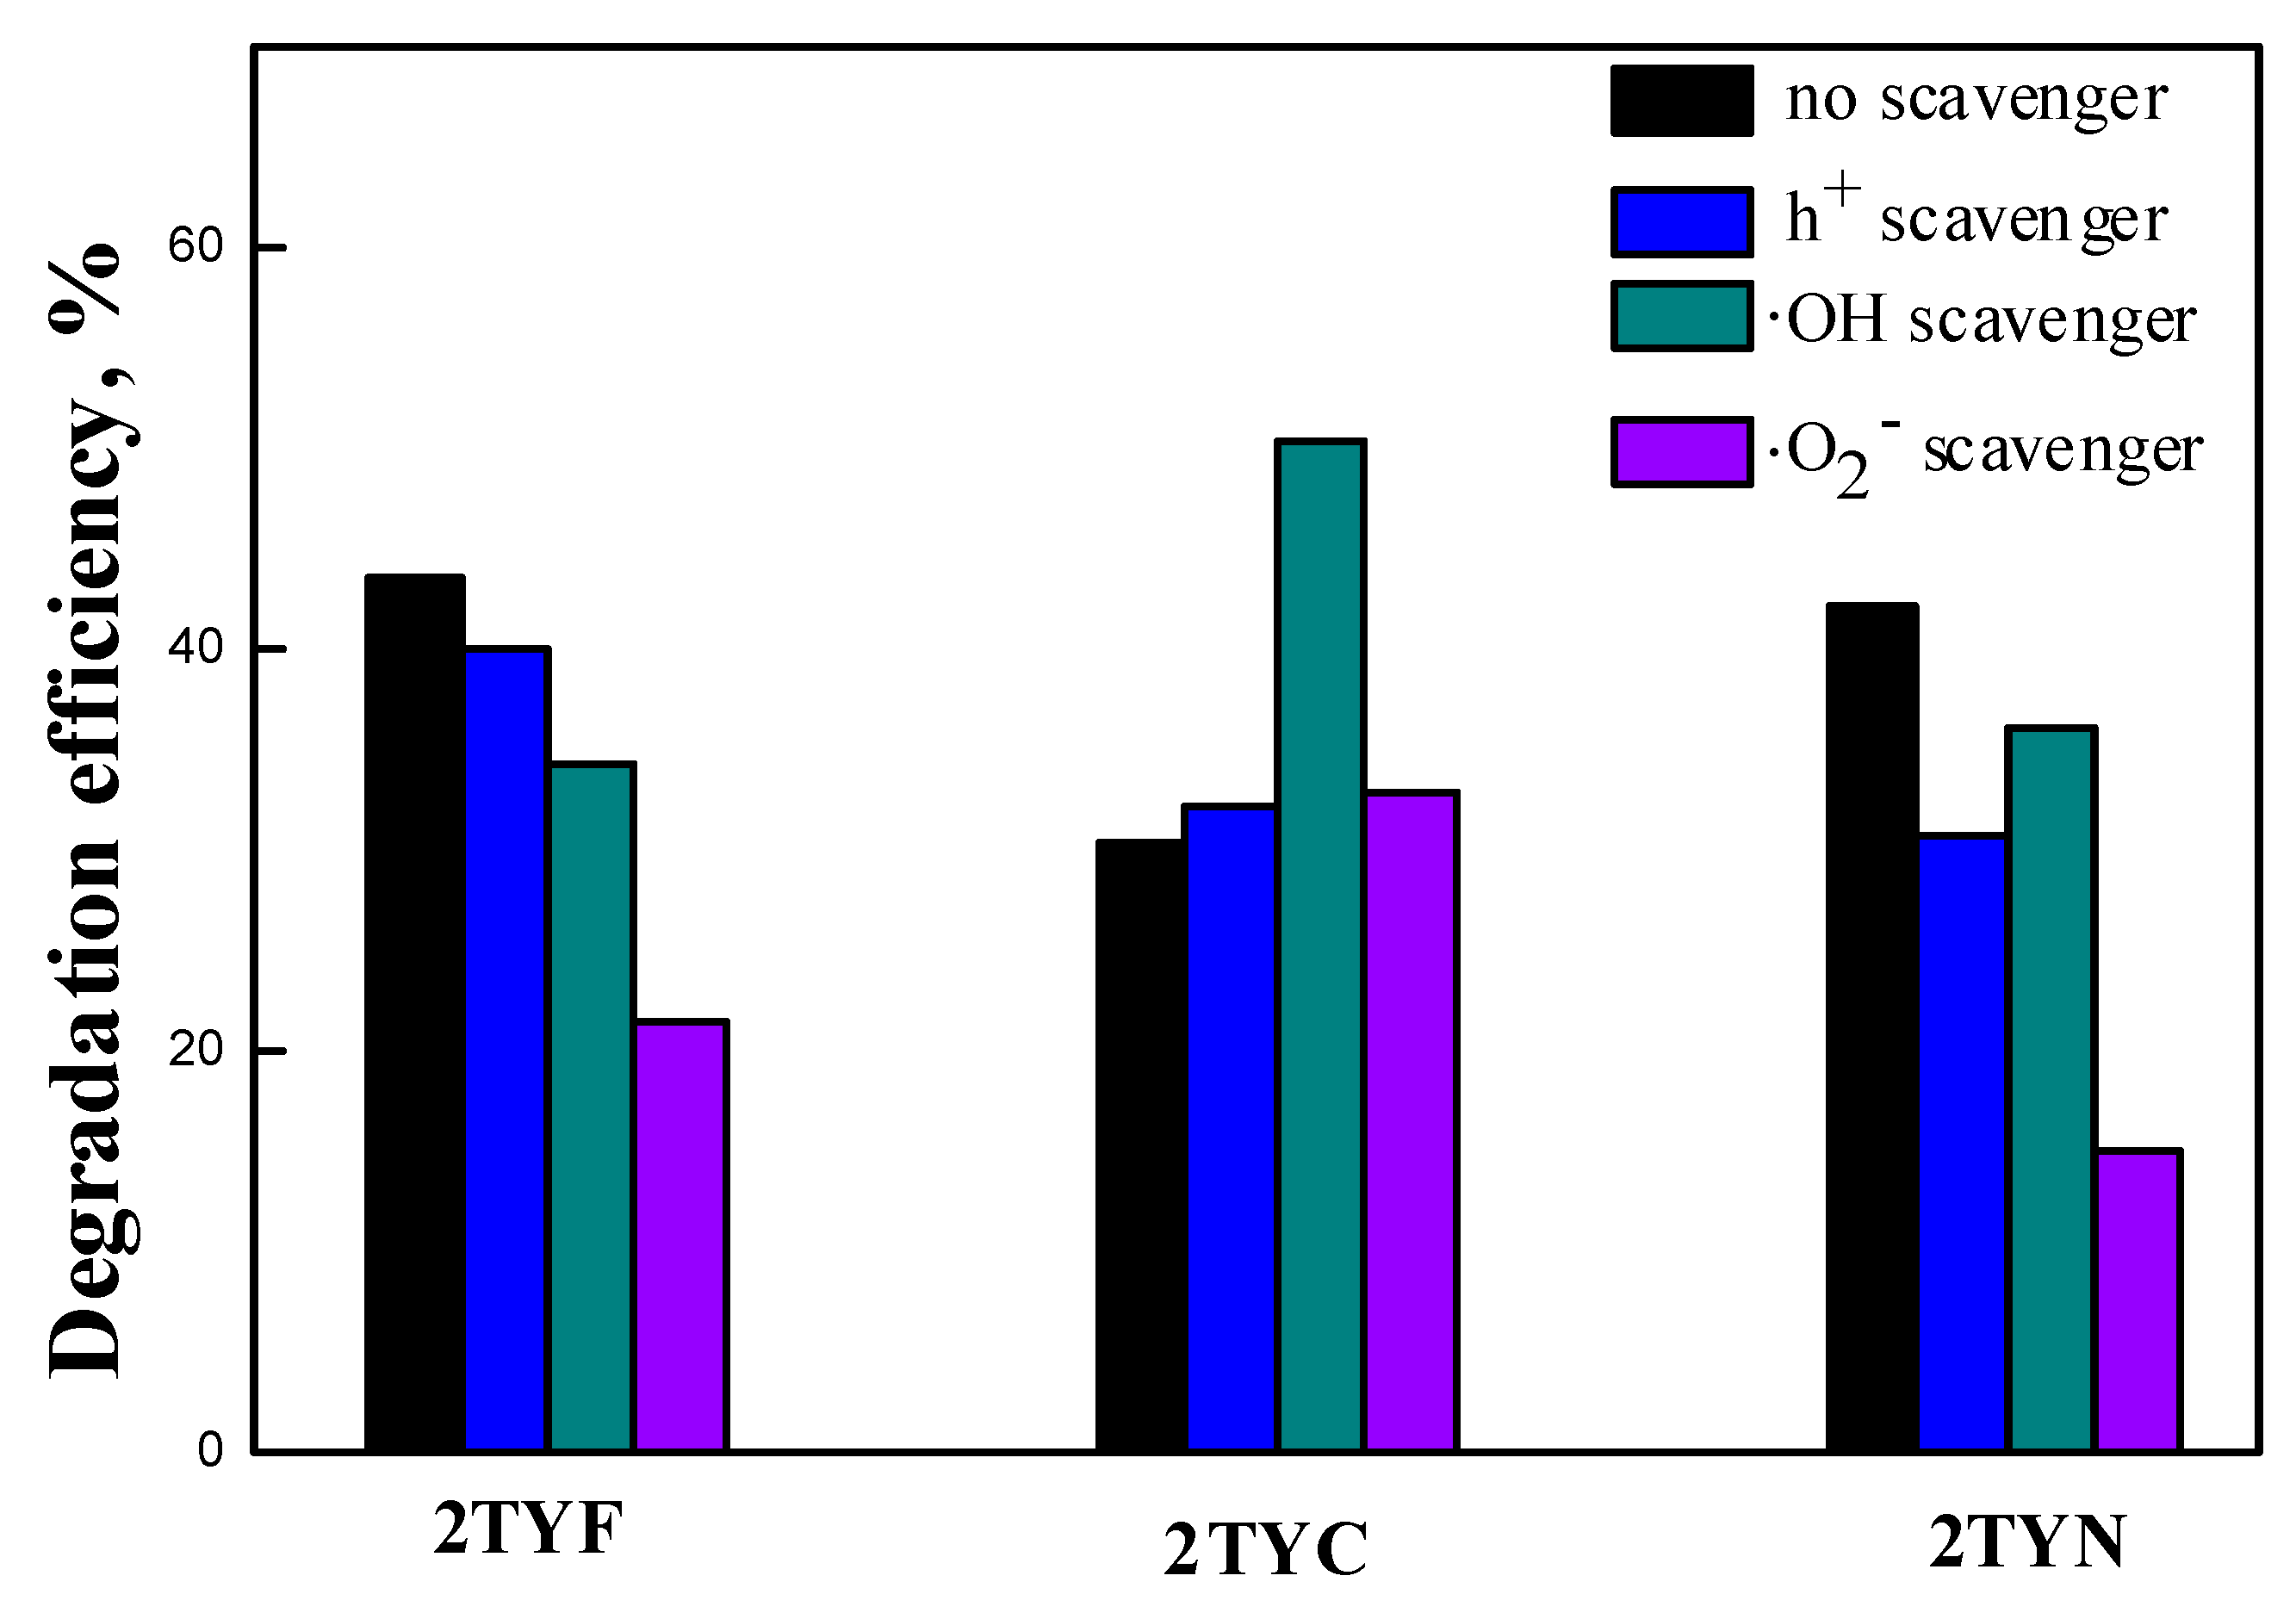
| Sample | BET surface area (m2/g) | Micropore area (m2/g) |
Mesopore area (m2/g) | Total pore volume (cm3/g) | Micropore volume (cm3/g) |
| 1TY | 649 | 585 | 64 | 0.316 | 0.221 |
| 2TY | 591 | 521 | 70 | 0.320 | 0197 |
| 1TYC | 588 | 532 | 56 | 0.314 | 0.201 |
| 2TYC | 481 | 433 | 48 | 0.278 | 0.163 |
| 1TYF | 573 | 510 | 63 | 0.319 | 0.193 |
| 2TYF | 489 | 409 | 80 | 0.322 | 0.156 |
| 1TYN | 551 | 484 | 67 | 0.298 | 0.183 |
| 2TYN | 517 | 461 | 56 | 0.293 | 0.174 |
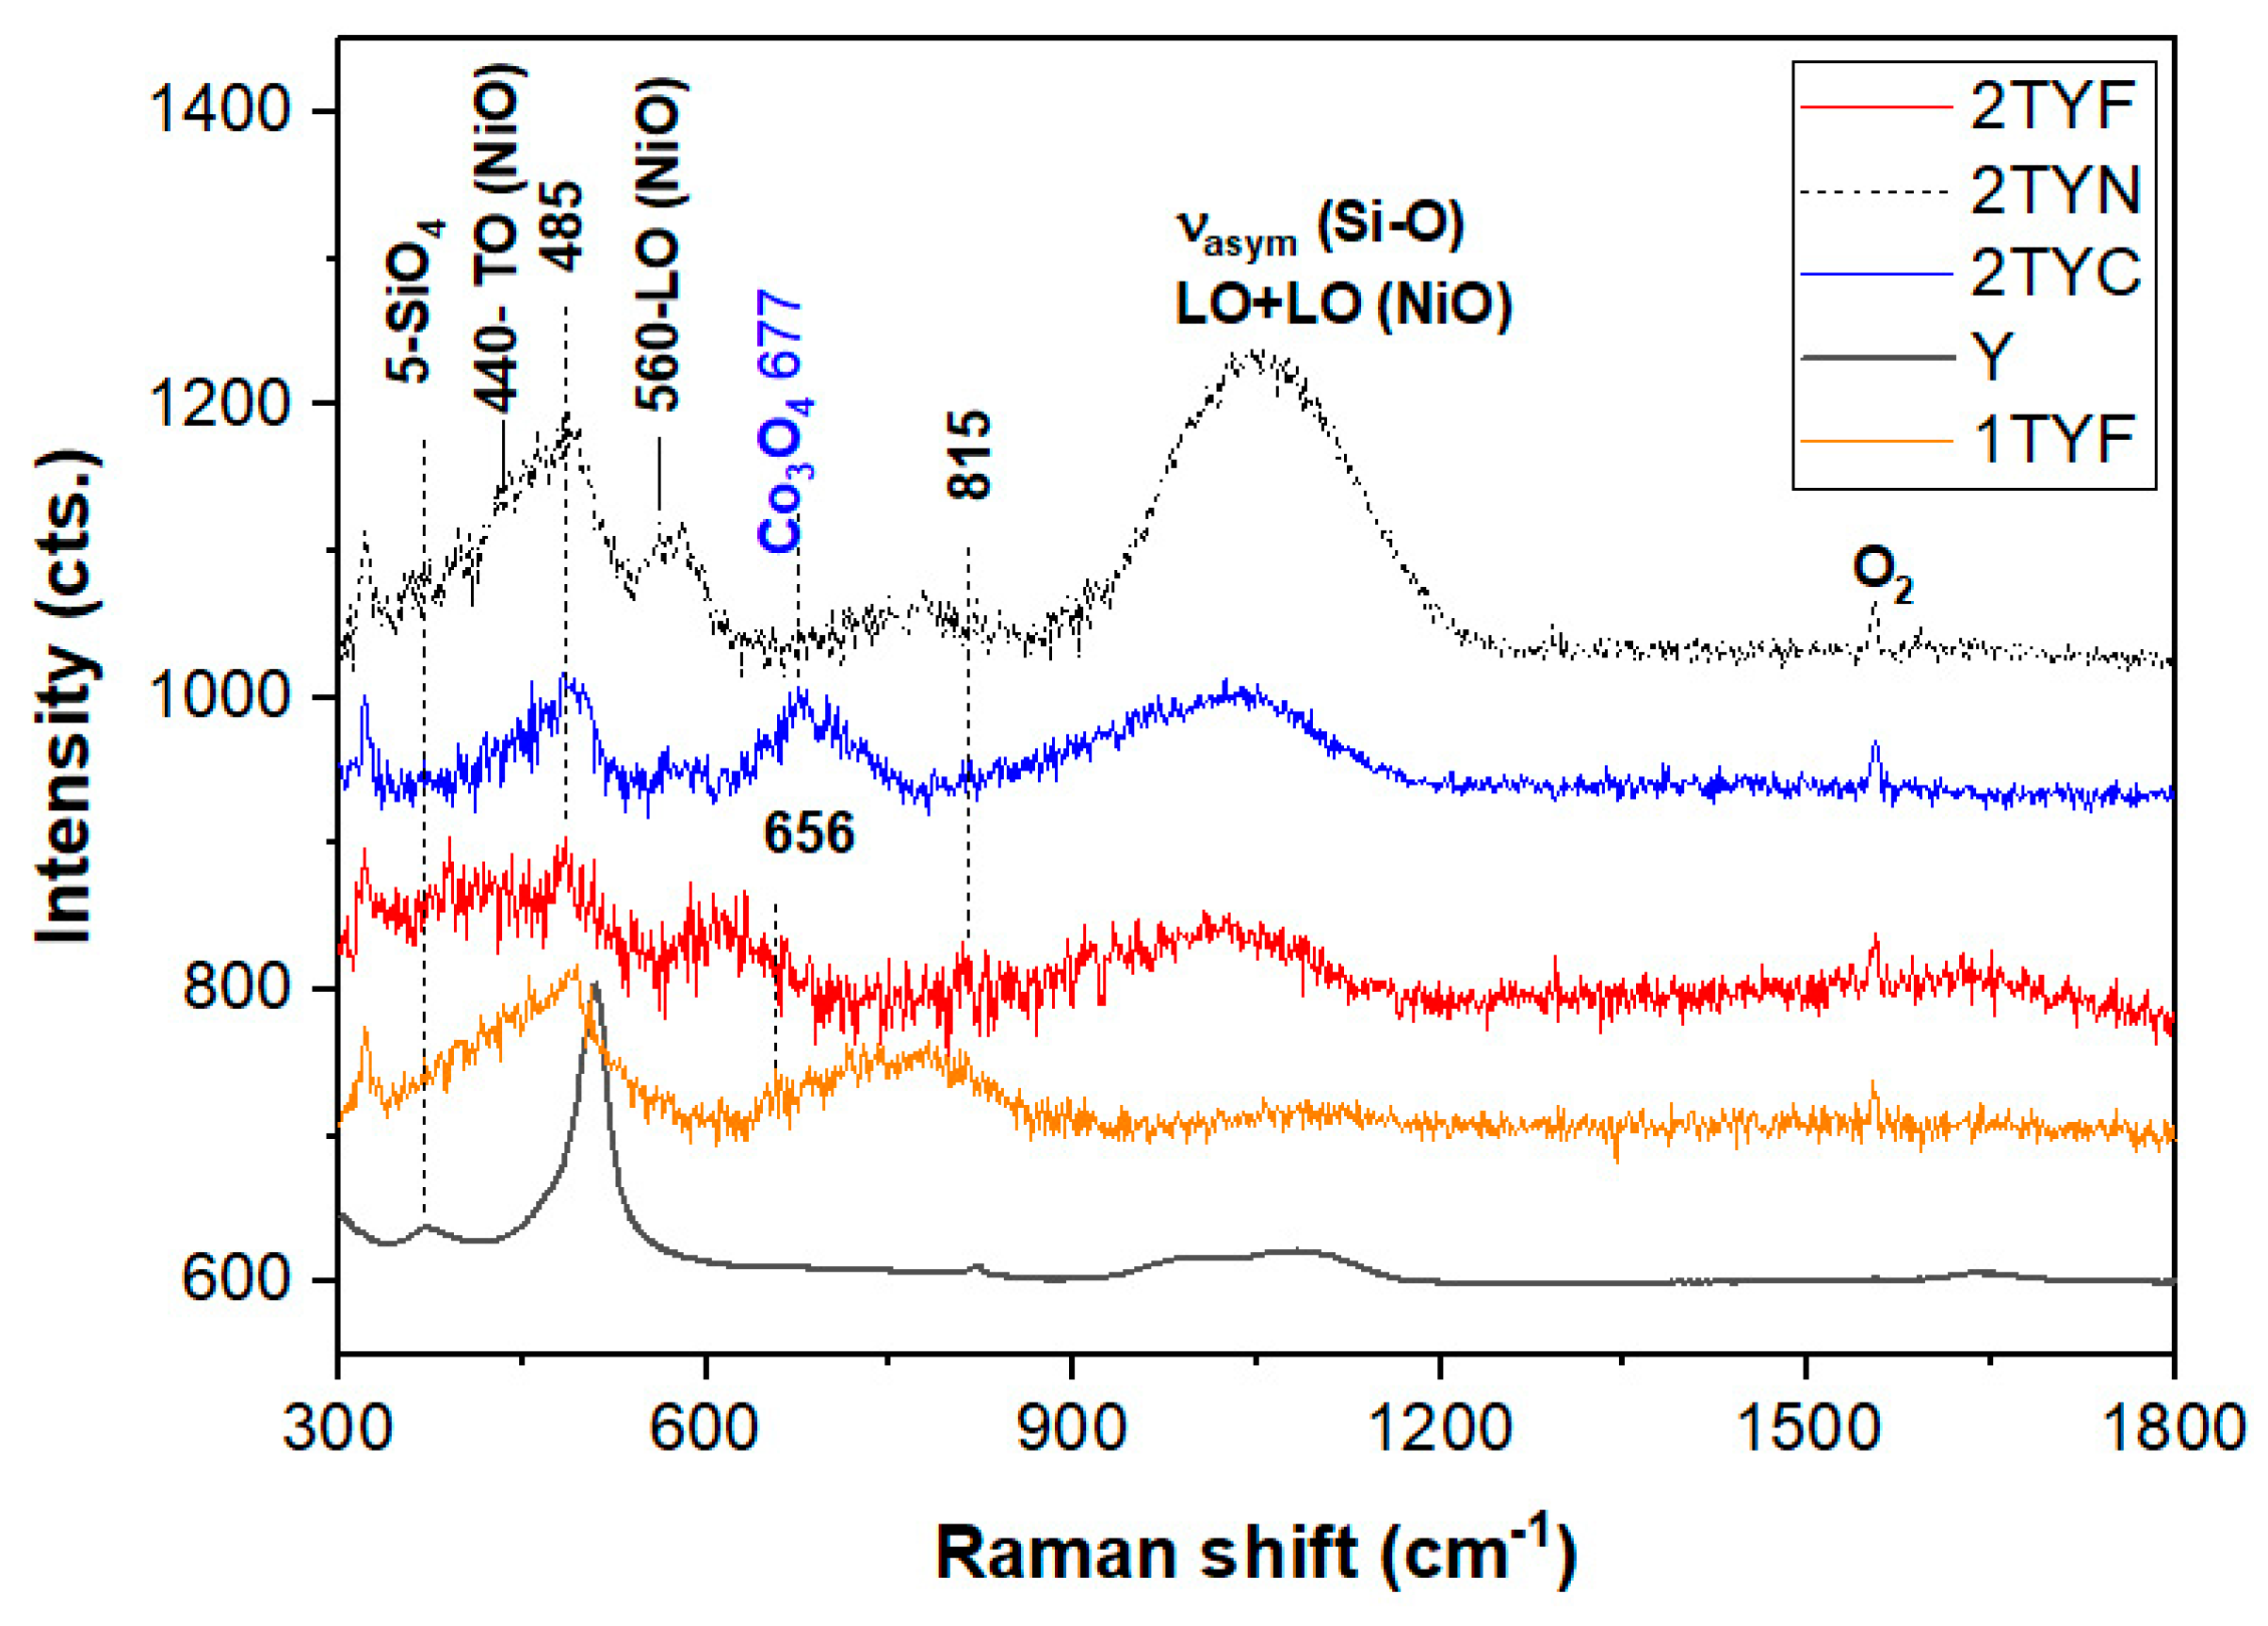
| Y | 2TYN | 2TYC | 2TYF | Assignment | Reference |
|---|---|---|---|---|---|
| 372 | 396 | 391 | Bending mode of double 6-membered SiO2 rings and Eg of Fe2O3 (412 cm-1) | [34,40] | |
| 440 | 455 | TO modes NiO, Eg of Co3O4 (470 cm−1) and n-membered SiO4 rings (n≤6) | [35,37] | ||
| 506 | 485 | 495 | 485 | Breathing of the 4-membered SiO2 rings (4R, 508 cm-1) in 6-membered double rings (D6R, 490 cm-1) and Co3O4 | [35,37] |
| 560 | LO modes of NiO | [36] | |||
| 577 | Al-O-Si stretching in connection with ring structures | [40] | |||
| 611 | Eg modes of Fe2O3 | [41] | |||
| 652 | Symmetric Fe-O breathing A1g modes | [39] | |||
| 677 | A1g of CoO6 (675 cm−1) | [35] | |||
| 705 | |||||
| 740 | 2TO modes of NiO | [36] | |||
| 776 | O-O stretching of adsorbed O22− | [35] | |||
| 1006 | Asymmetric T-O stretch (T=Al and Si) | [34] | |||
| 1054 | 1032 | 1027 | Asymmetric T-O stretch (T=Al, Ti and Fe) and two-phonon modes of CoO | [35,37] | |
| 1081 | Asymmetric T-O stretch (T=Al and Si) | [34] |
| Sample | Absorption peak position | Assignment | Ref. |
|
1TY 2TY |
210 nm | framework Ti species (Ti4+O2− → Ti3+O− charge transfer) | [54] |
| 250 nm | extra-framework Ti species | ||
| 330 nm | anatase traces | ||
|
1TYF 2TYF |
260 nm | charge transfer of oxygen to Fe3+ cations in octahedral coordination |
[56] |
| 350 nm | extra-framework FeOx oligomers | ||
| 480 nm | oxygen-to-metal charge transfer transitions that involve octahedral Fe3+ species | ||
| 1TYC 2TYC |
440 nm | O2- → Co2+ charge transfer transition | [30,57] |
| 710 nm | O2- → Co3+ charge transfer transition | ||
| 1TYN 2TYN |
420 nm | 3A2g→ 3T1g (P) charge transfer transition | [60] |
| 690 nm | 3A2g→ 3T1g (F) charge transfer transition |
| Sample | 1TYF | 1TYN | 1TYC | 2TYF | 2TYN | 2TYC |
| Eg (eV) | 1.23 | 2.74 | 1.30 | 1.42 | 2.92 | 1.26 |
Disclaimer/Publisher’s Note: The statements, opinions and data contained in all publications are solely those of the individual author(s) and contributor(s) and not of MDPI and/or the editor(s). MDPI and/or the editor(s) disclaim responsibility for any injury to people or property resulting from any ideas, methods, instructions or products referred to in the content. |
© 2023 by the authors. Licensee MDPI, Basel, Switzerland. This article is an open access article distributed under the terms and conditions of the Creative Commons Attribution (CC BY) license (http://creativecommons.org/licenses/by/4.0/).


