Submitted:
06 December 2023
Posted:
07 December 2023
You are already at the latest version
Abstract
Keywords:
1. Introduction
2. Materials and Methods
2.1. Study area and sites
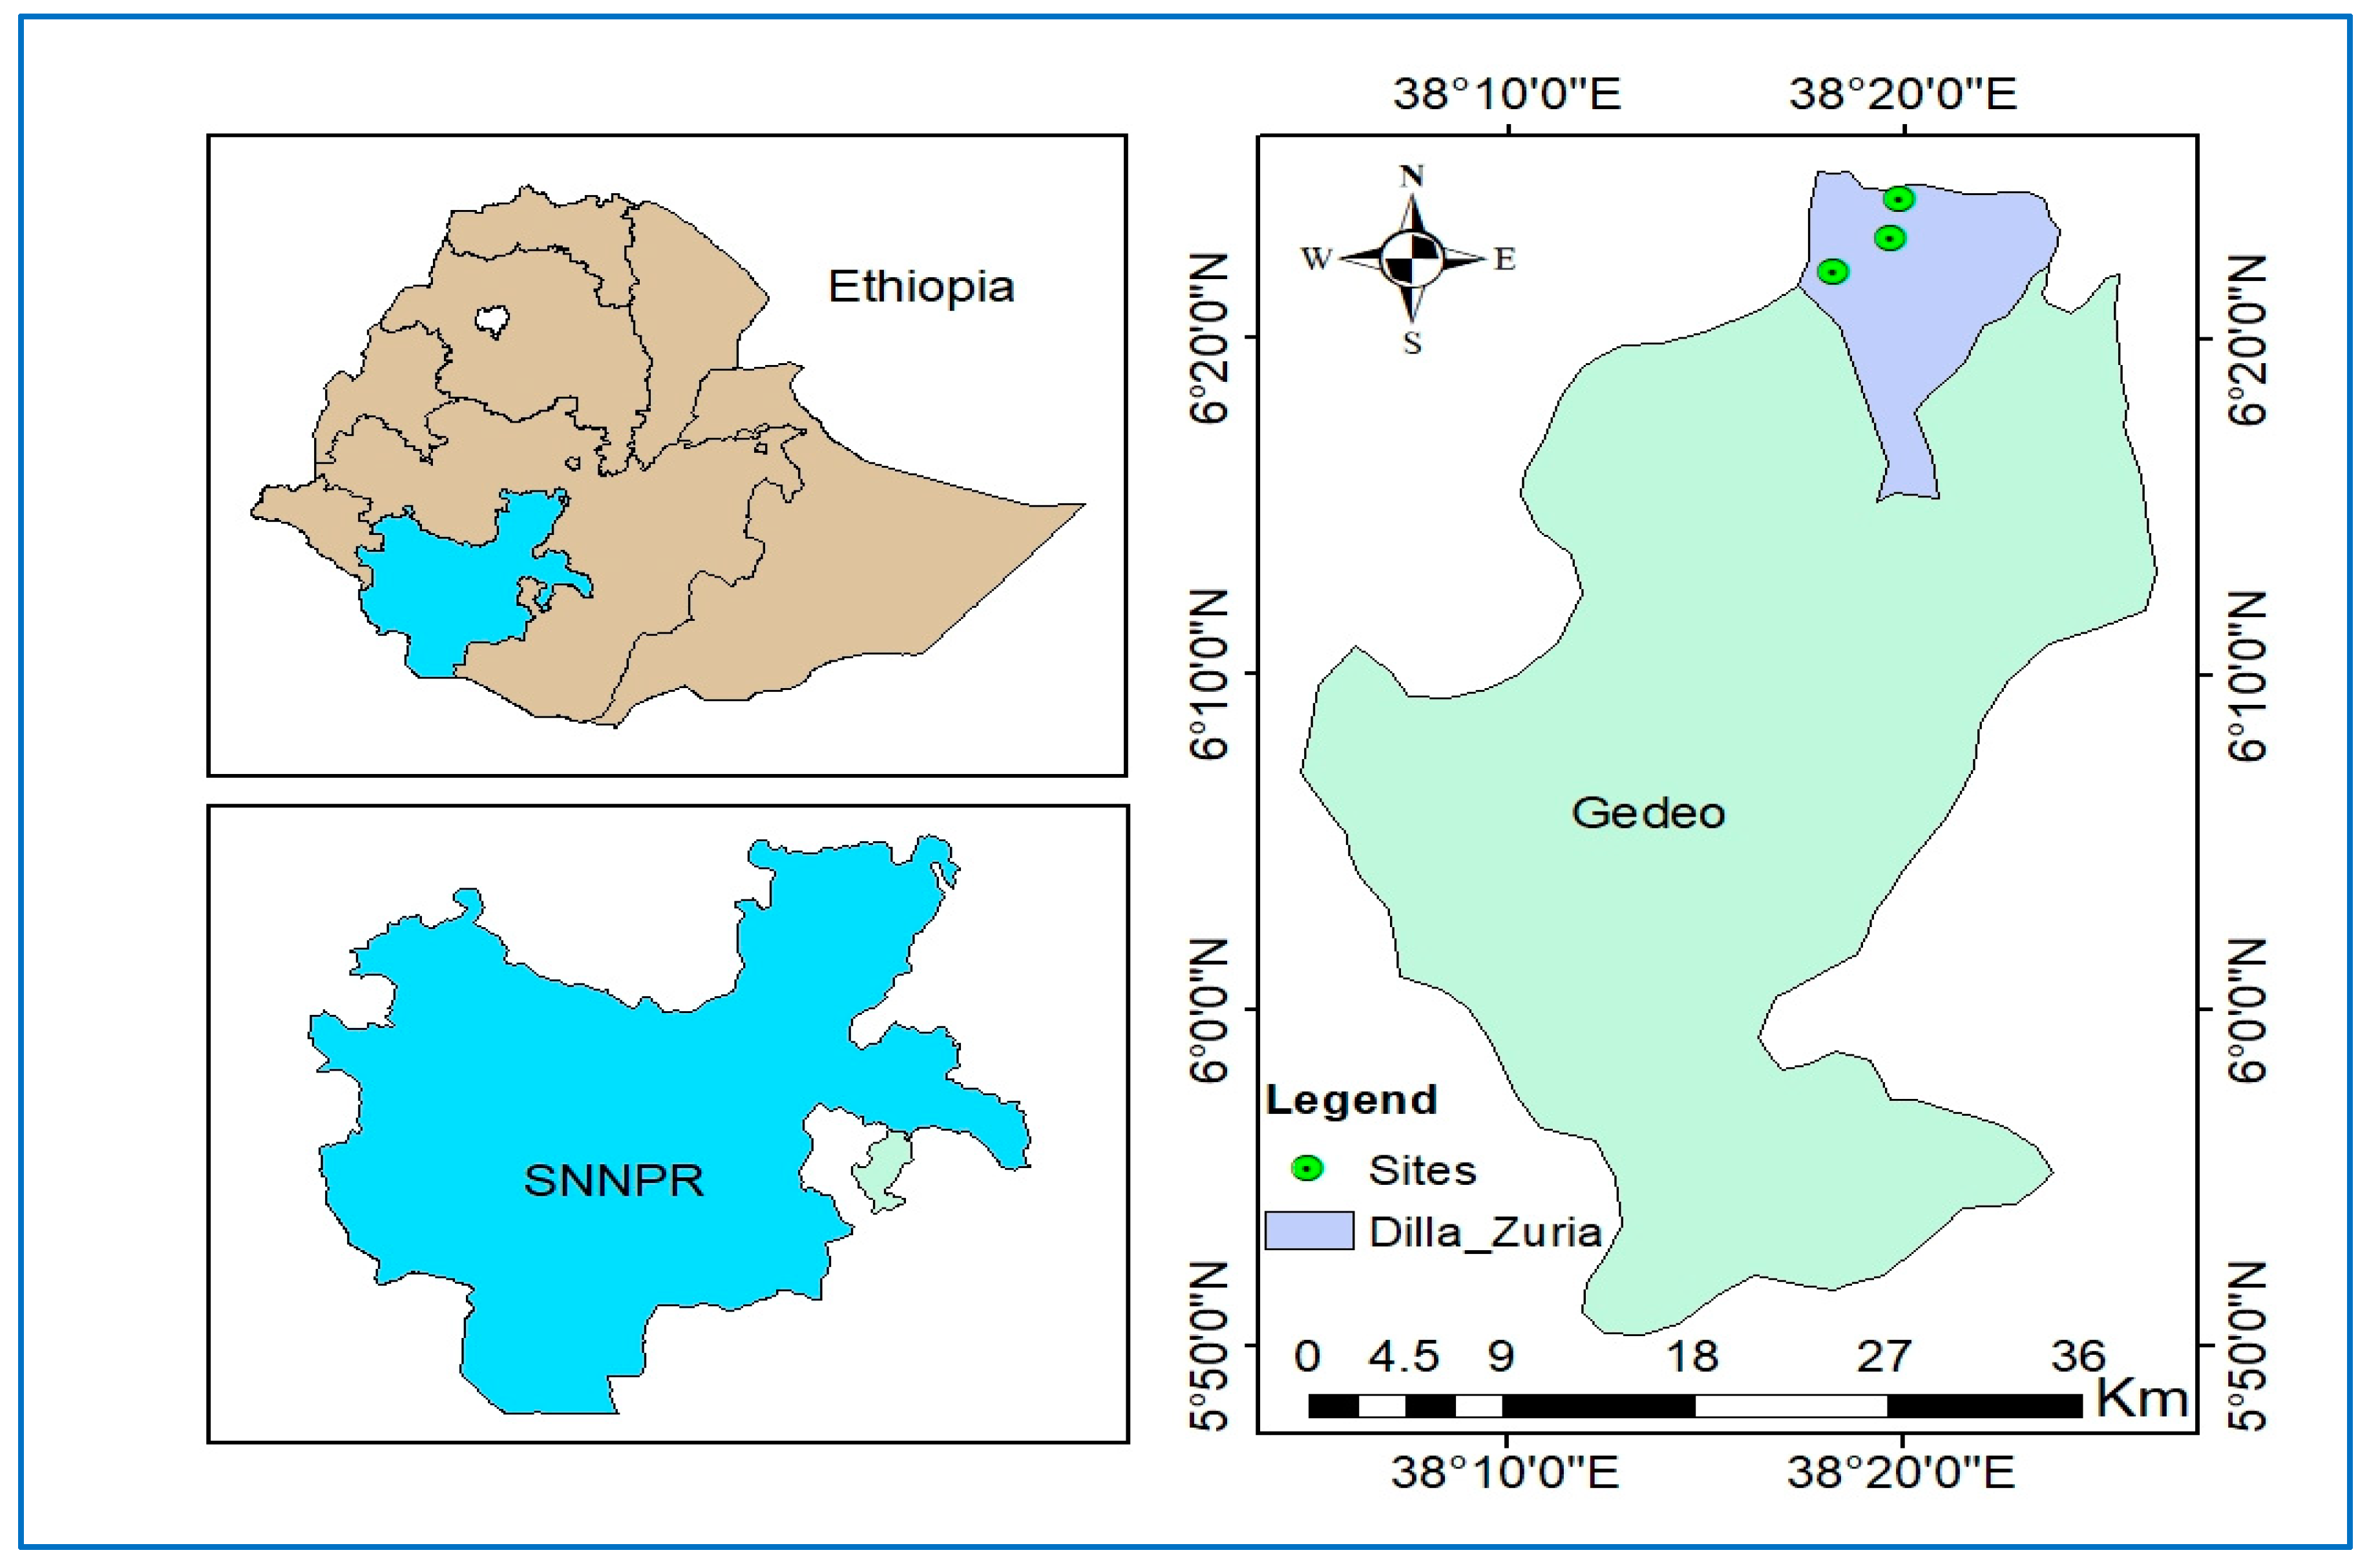
2.1.1. Three indigenous agroforestry systems as focus of the study
- Enset based agroforestry
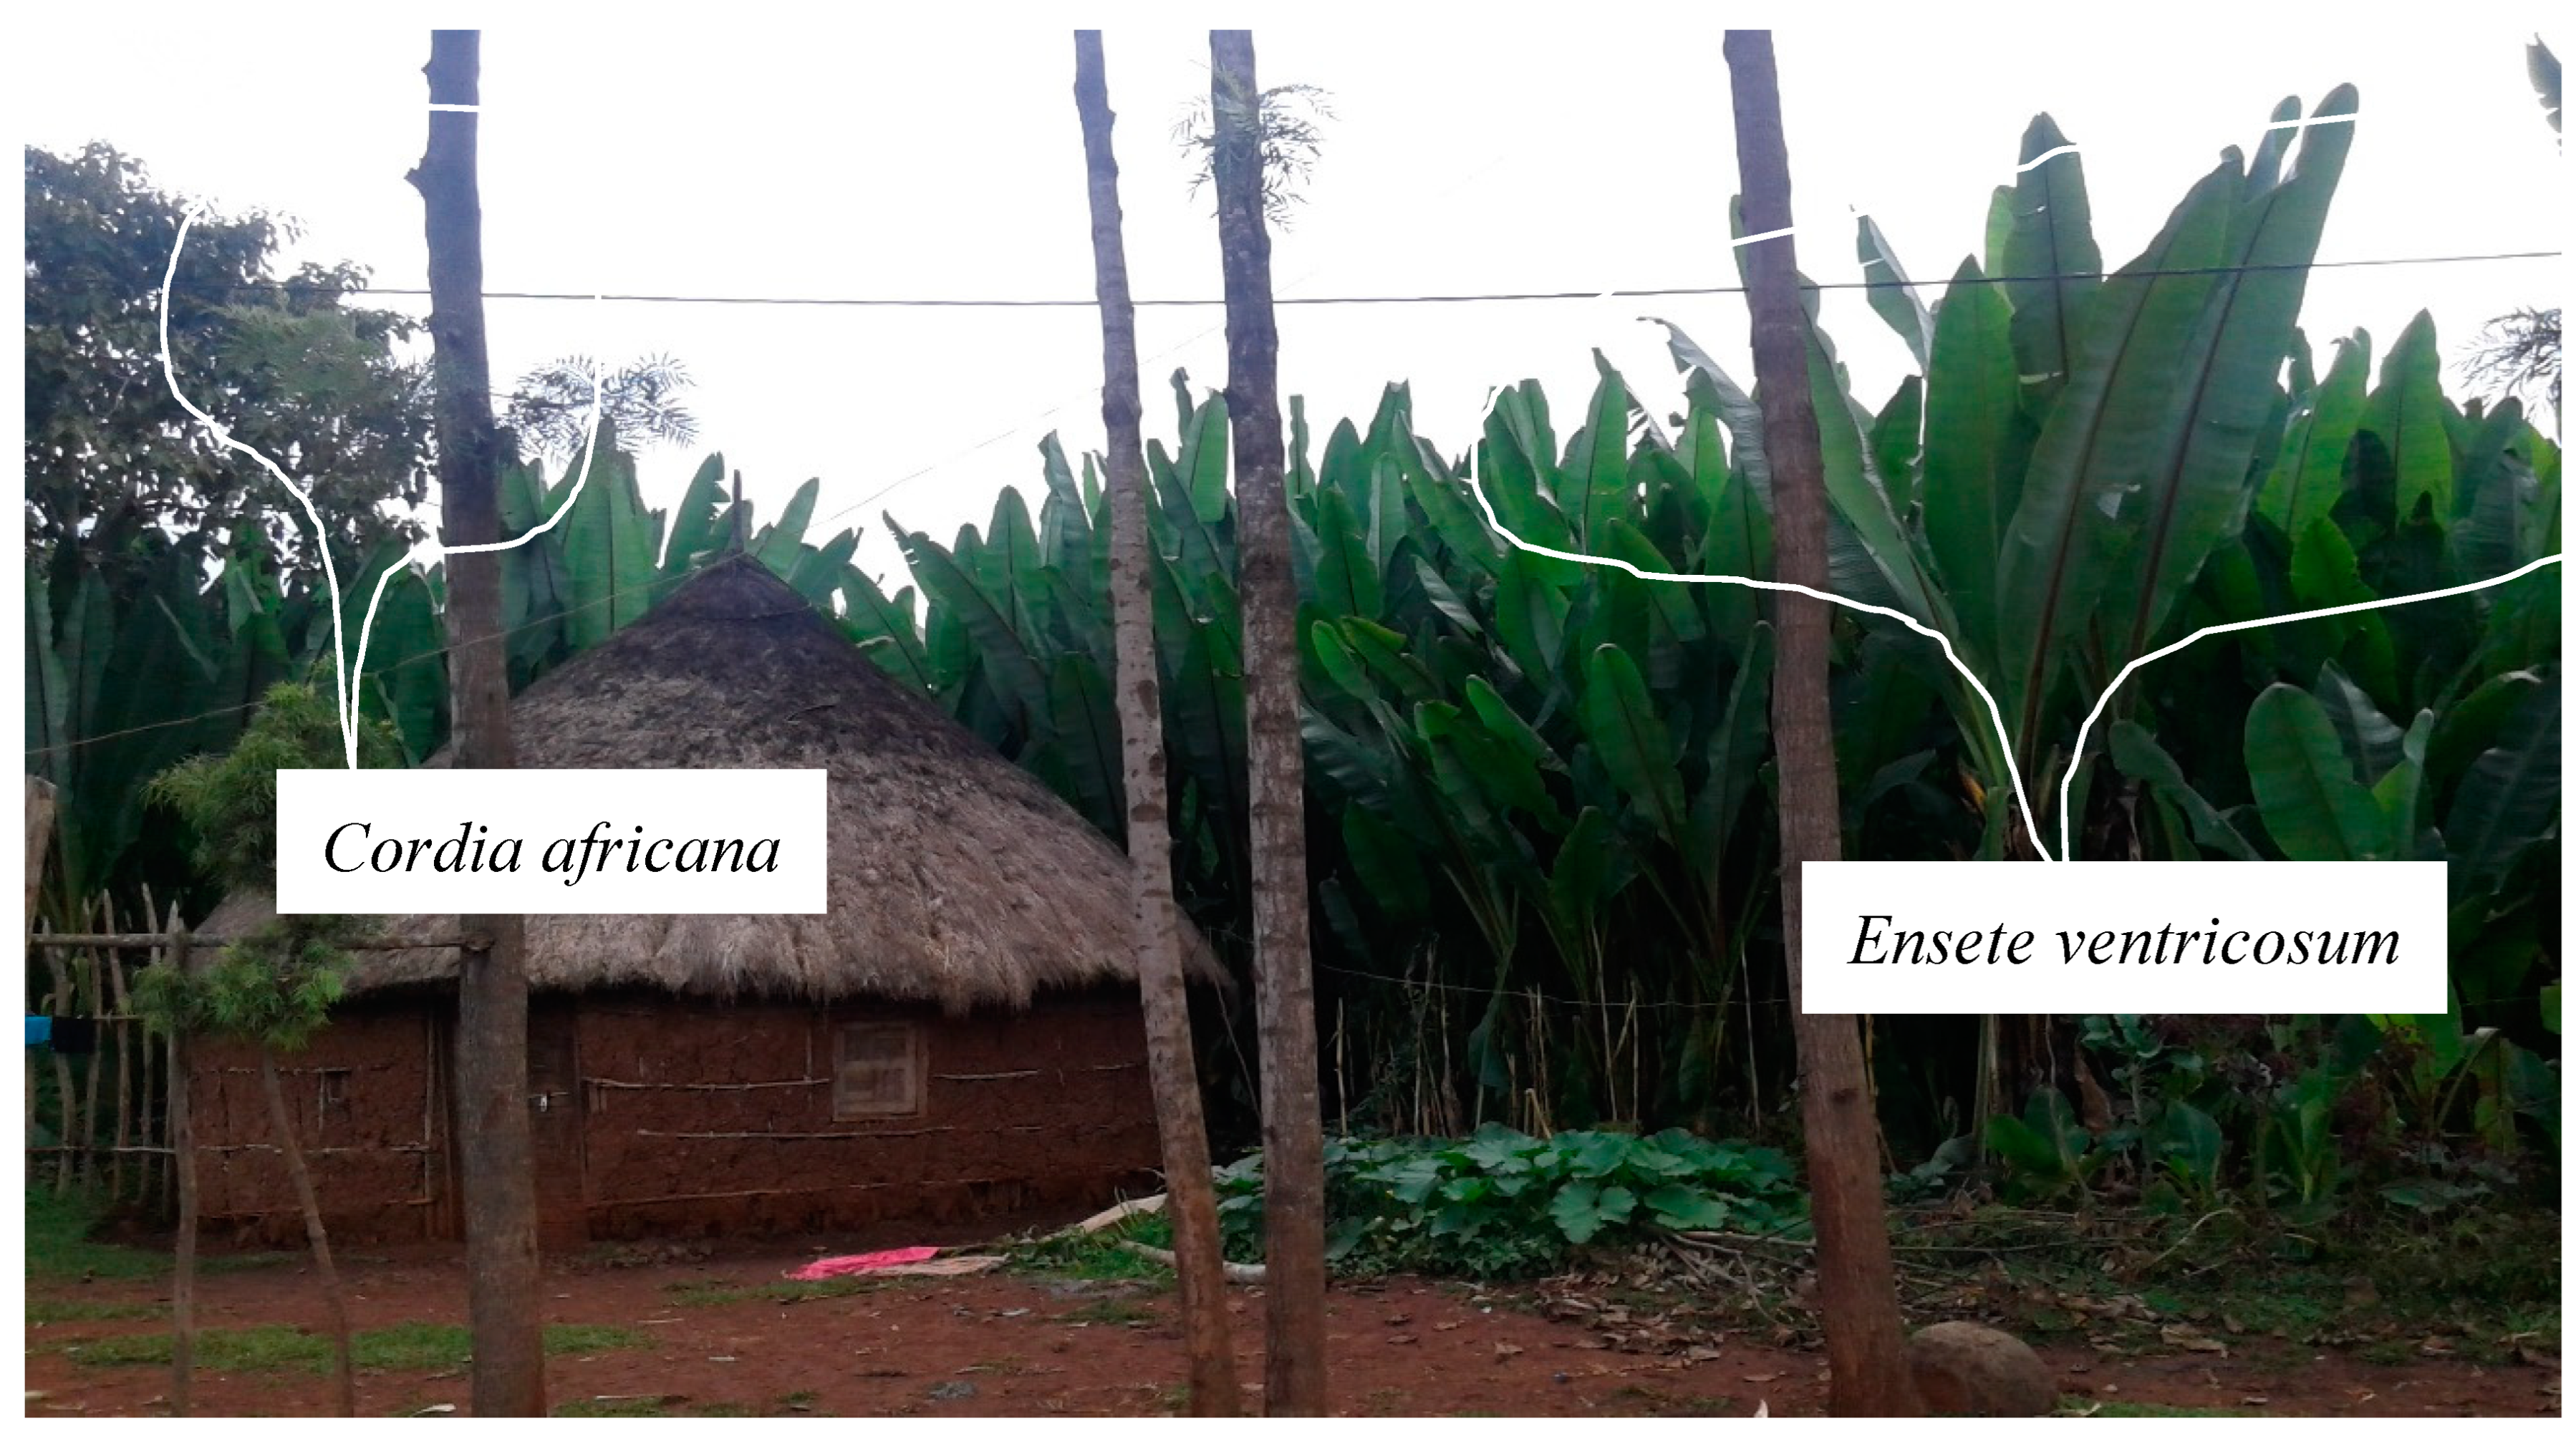
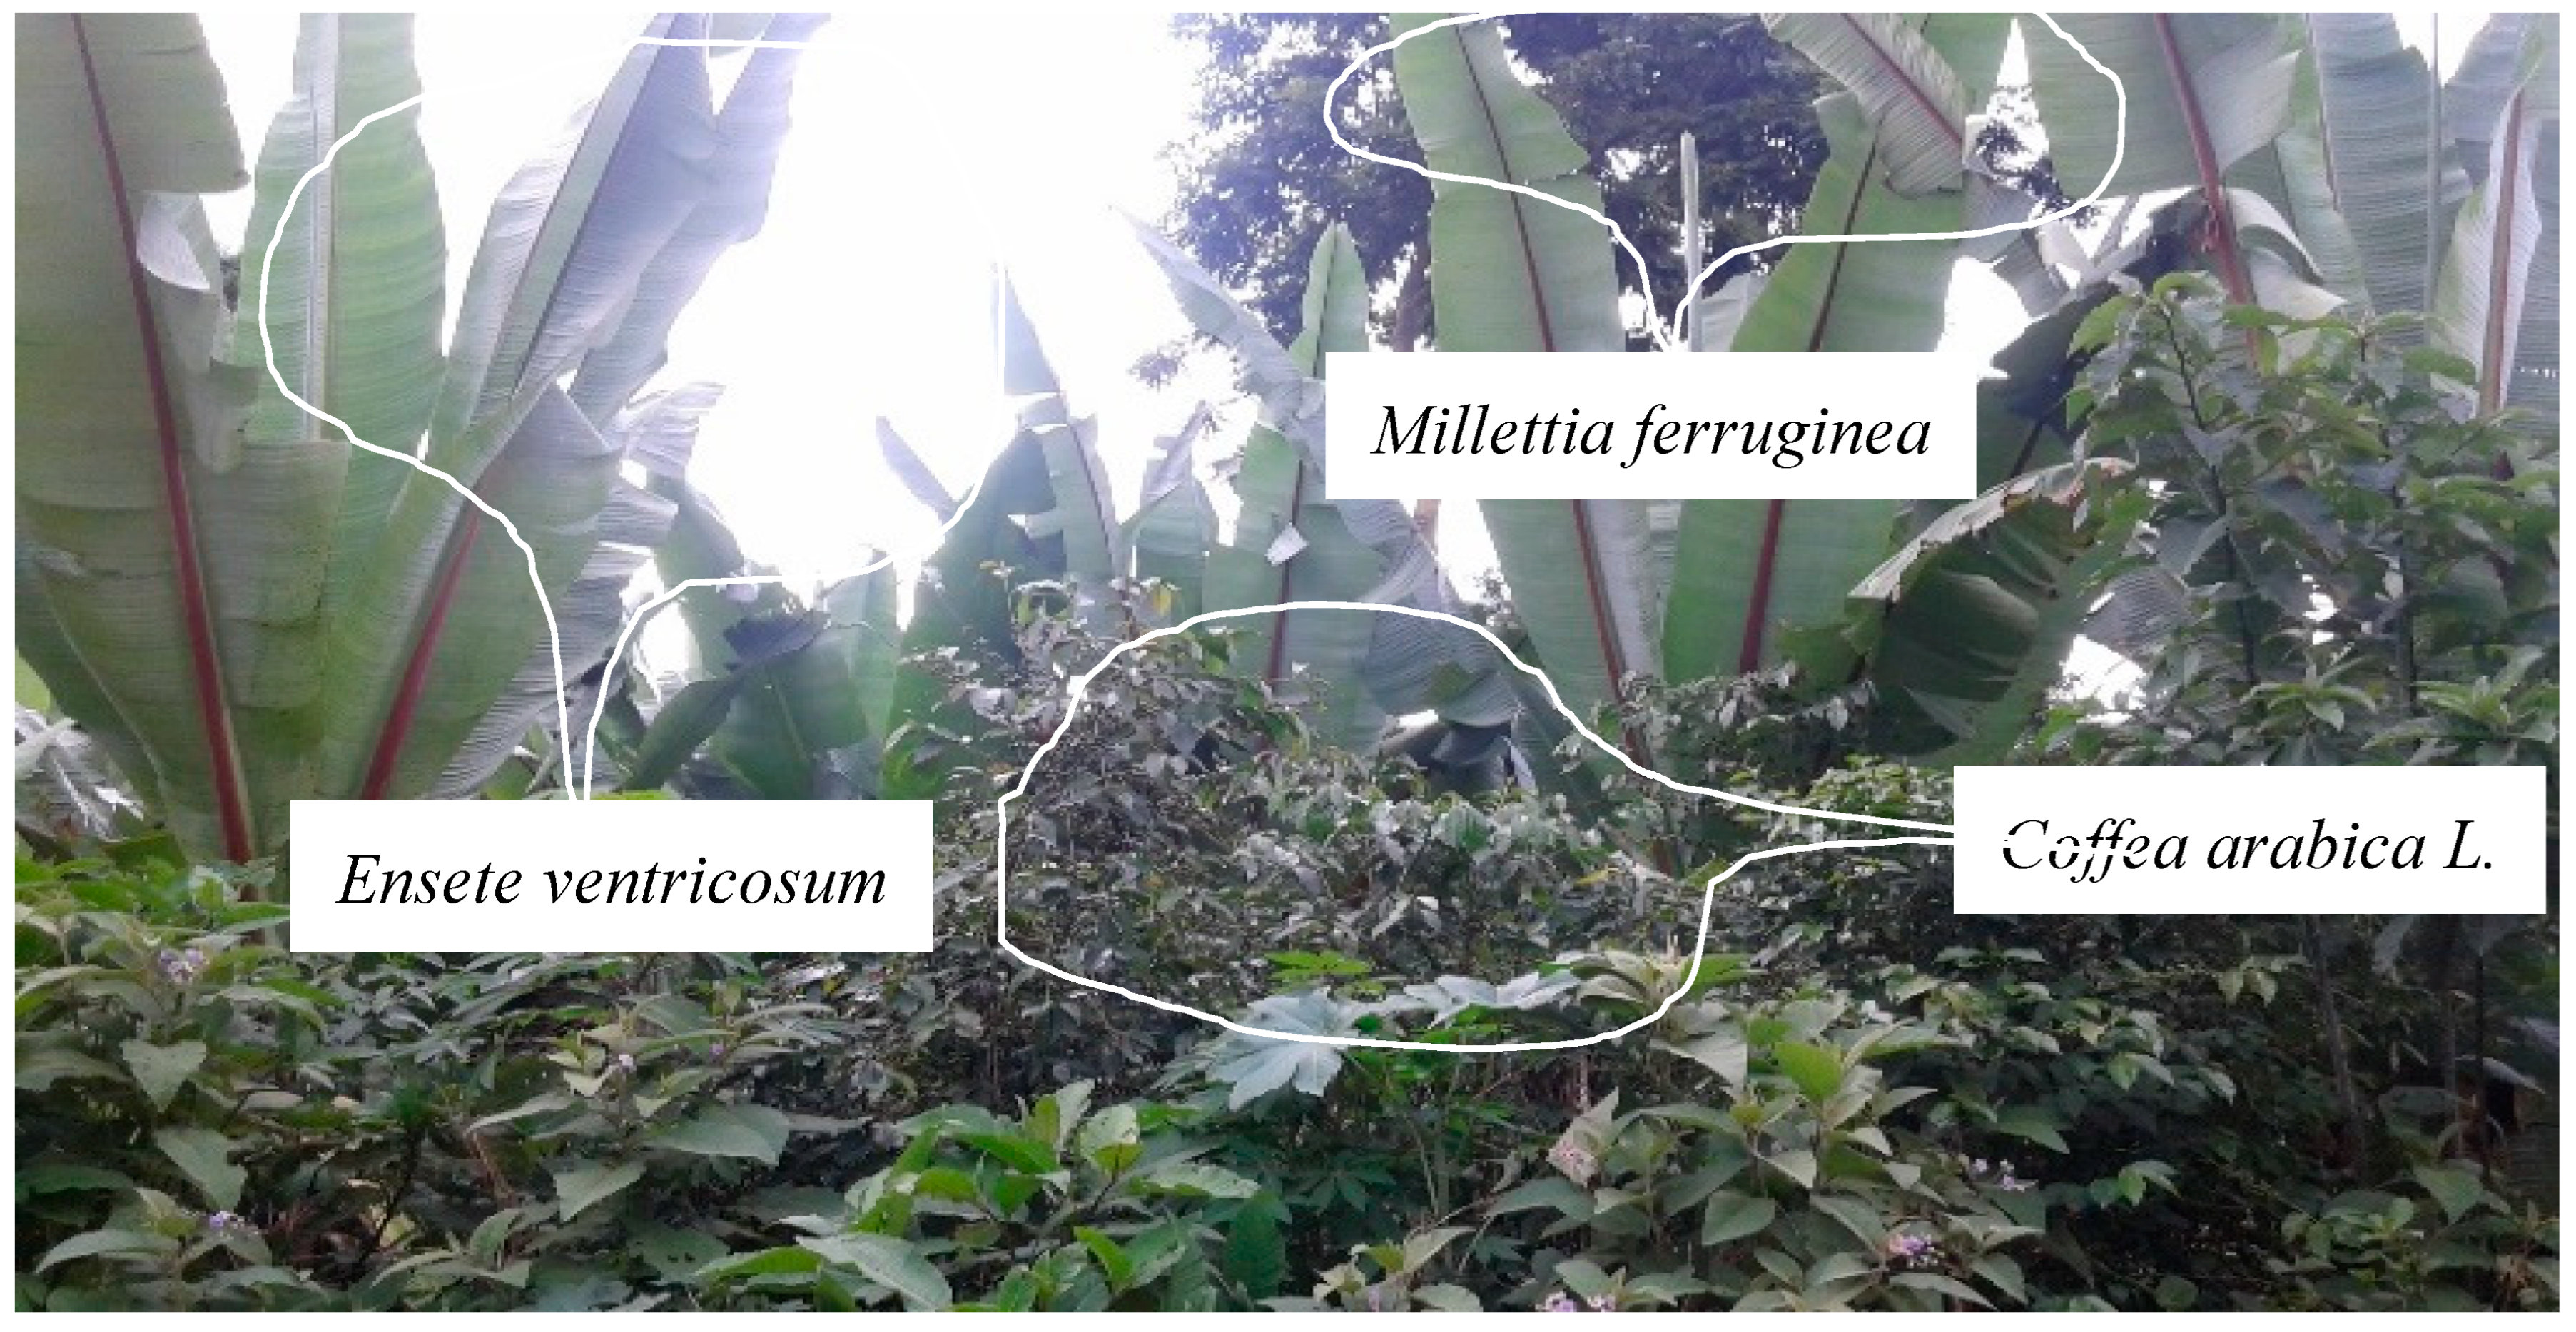
- Coffee–enset based agroforestry (C–E based AF)
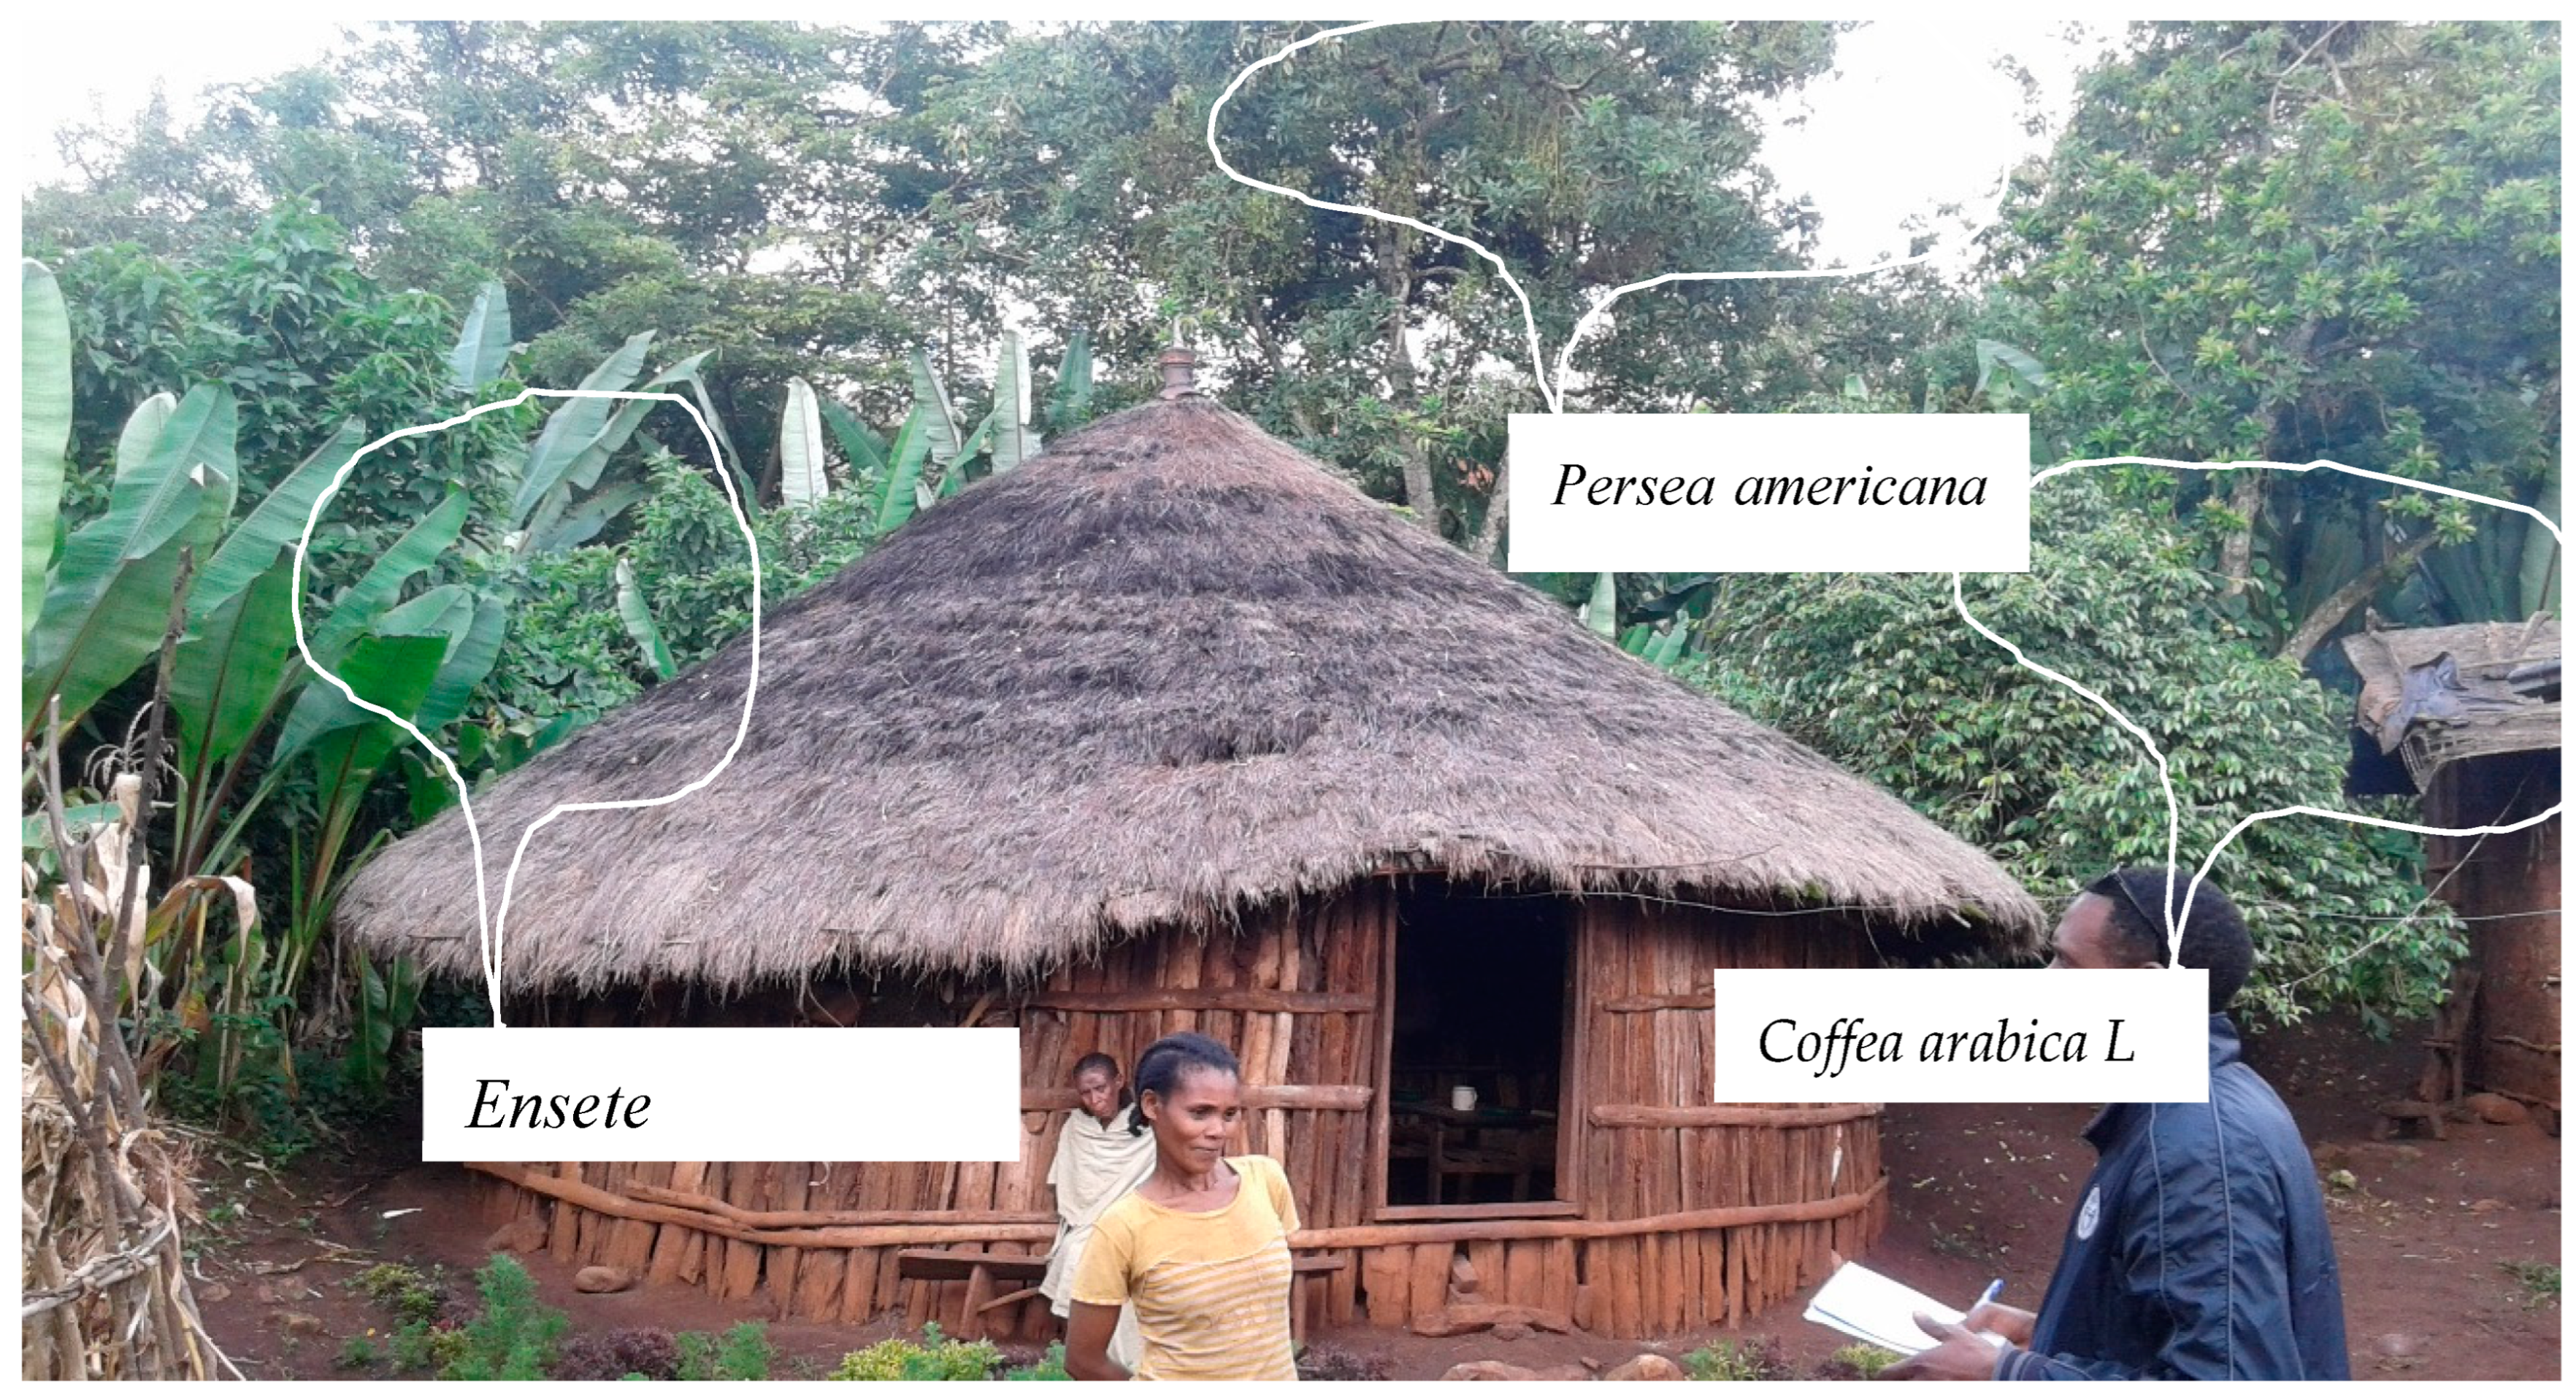
- Coffee–fruit tree –Enset based agroforestry(C–Ft–E based AF)
2.2. Methods
2.2.1. Sampling design and data collection
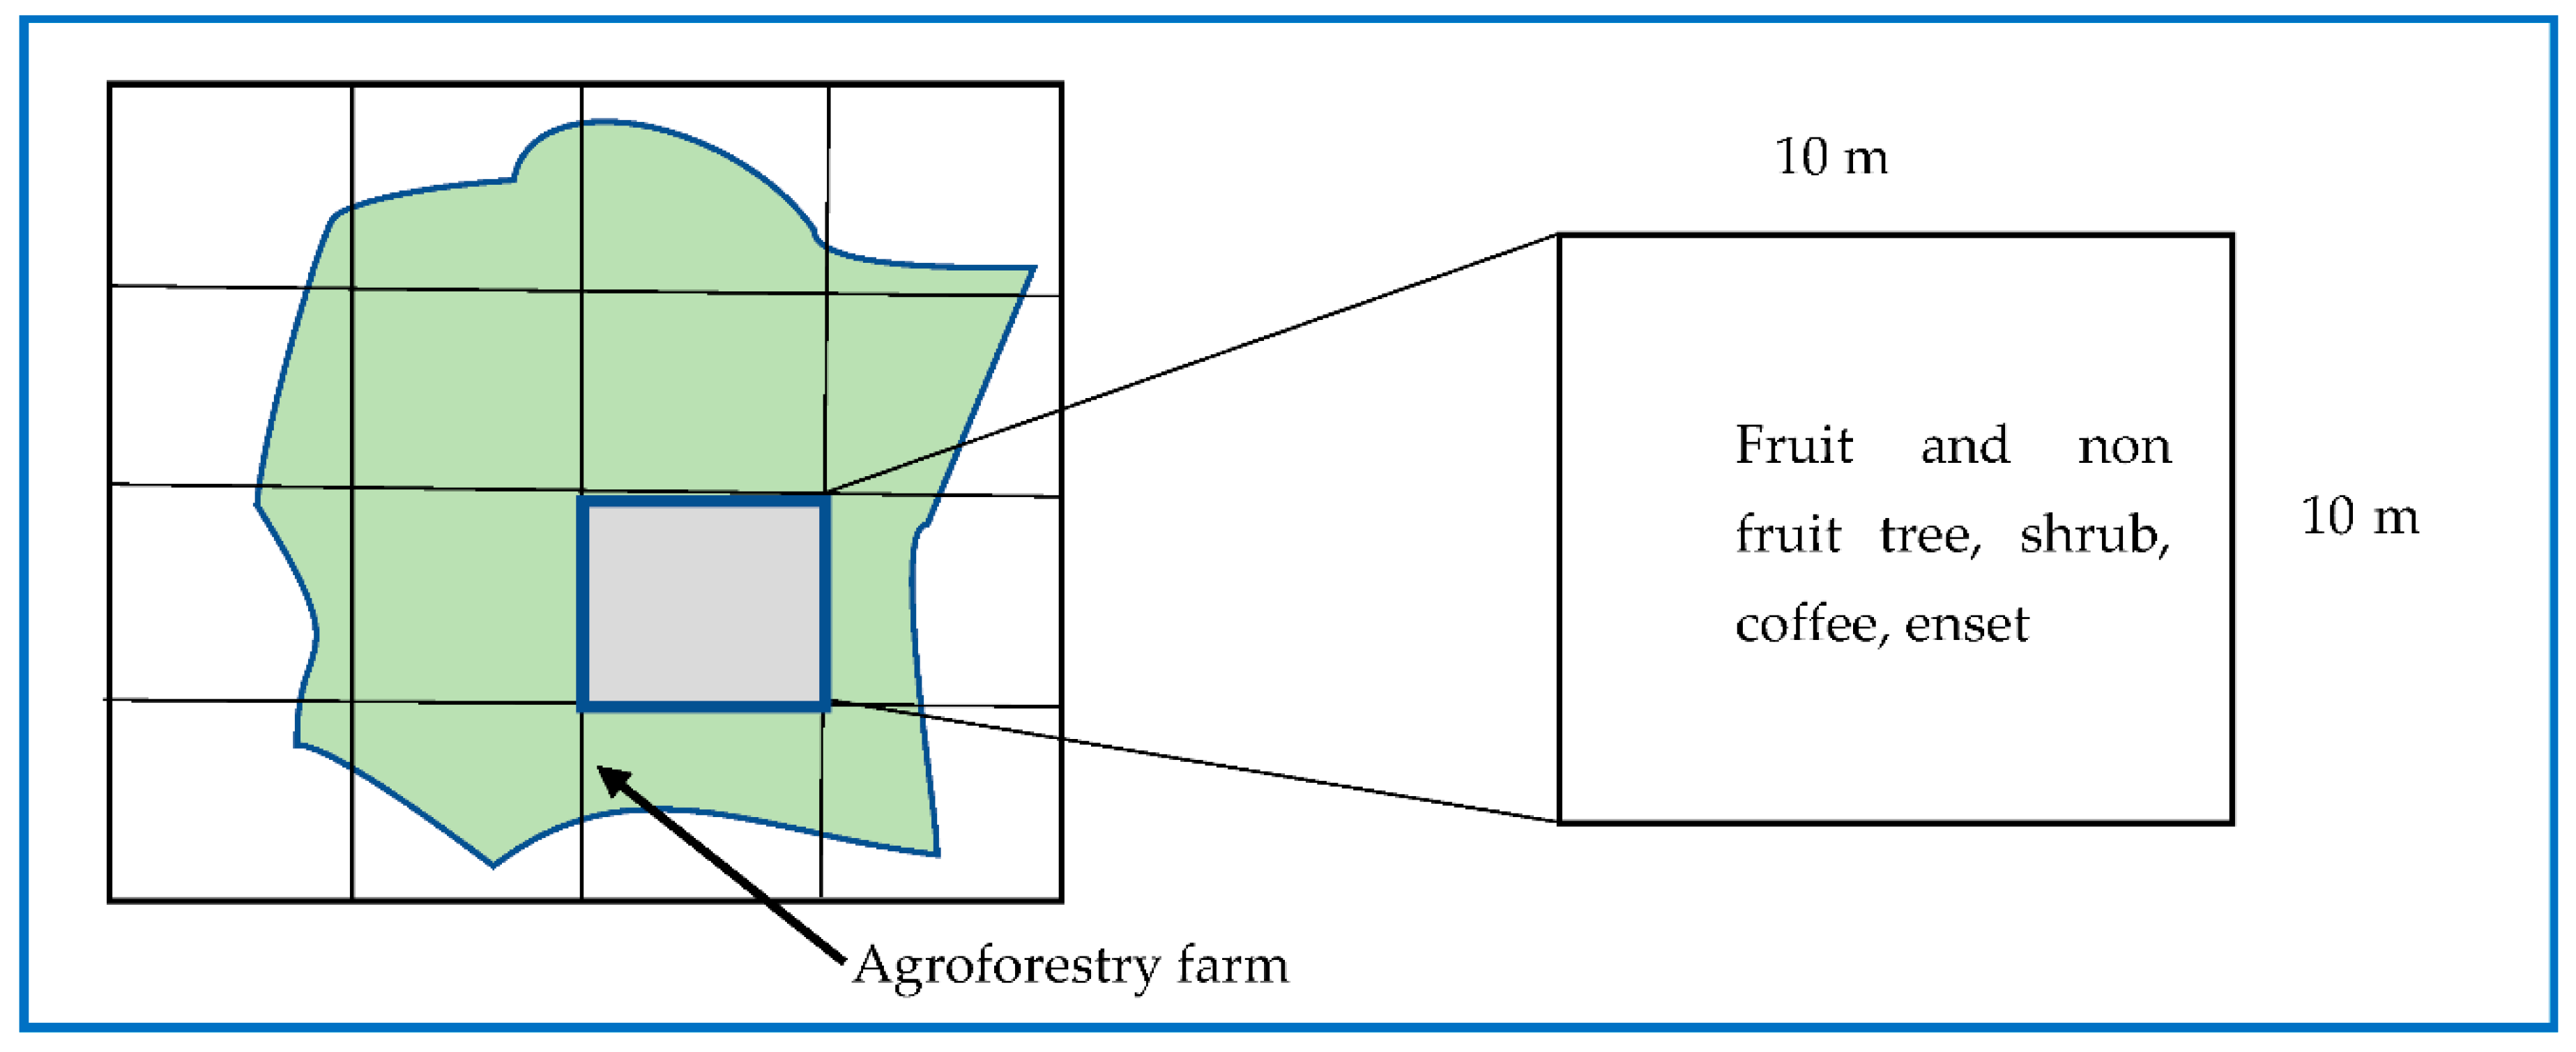
2.2.1. Sampling design and data collection
2.3. Data analysis
2.3.1. Stand characteristics of plant species and diversity analysis
2.3.2. Analysis of species conservation concern
3. Results and Discussion
3.1. Plant diversity and conservation in indigenous agroforestry systems
3.1.1. Perennial plant species composition
3.1.2. Plant species endemism and conservation concern
3.1.3. Plant species frequency and important value index
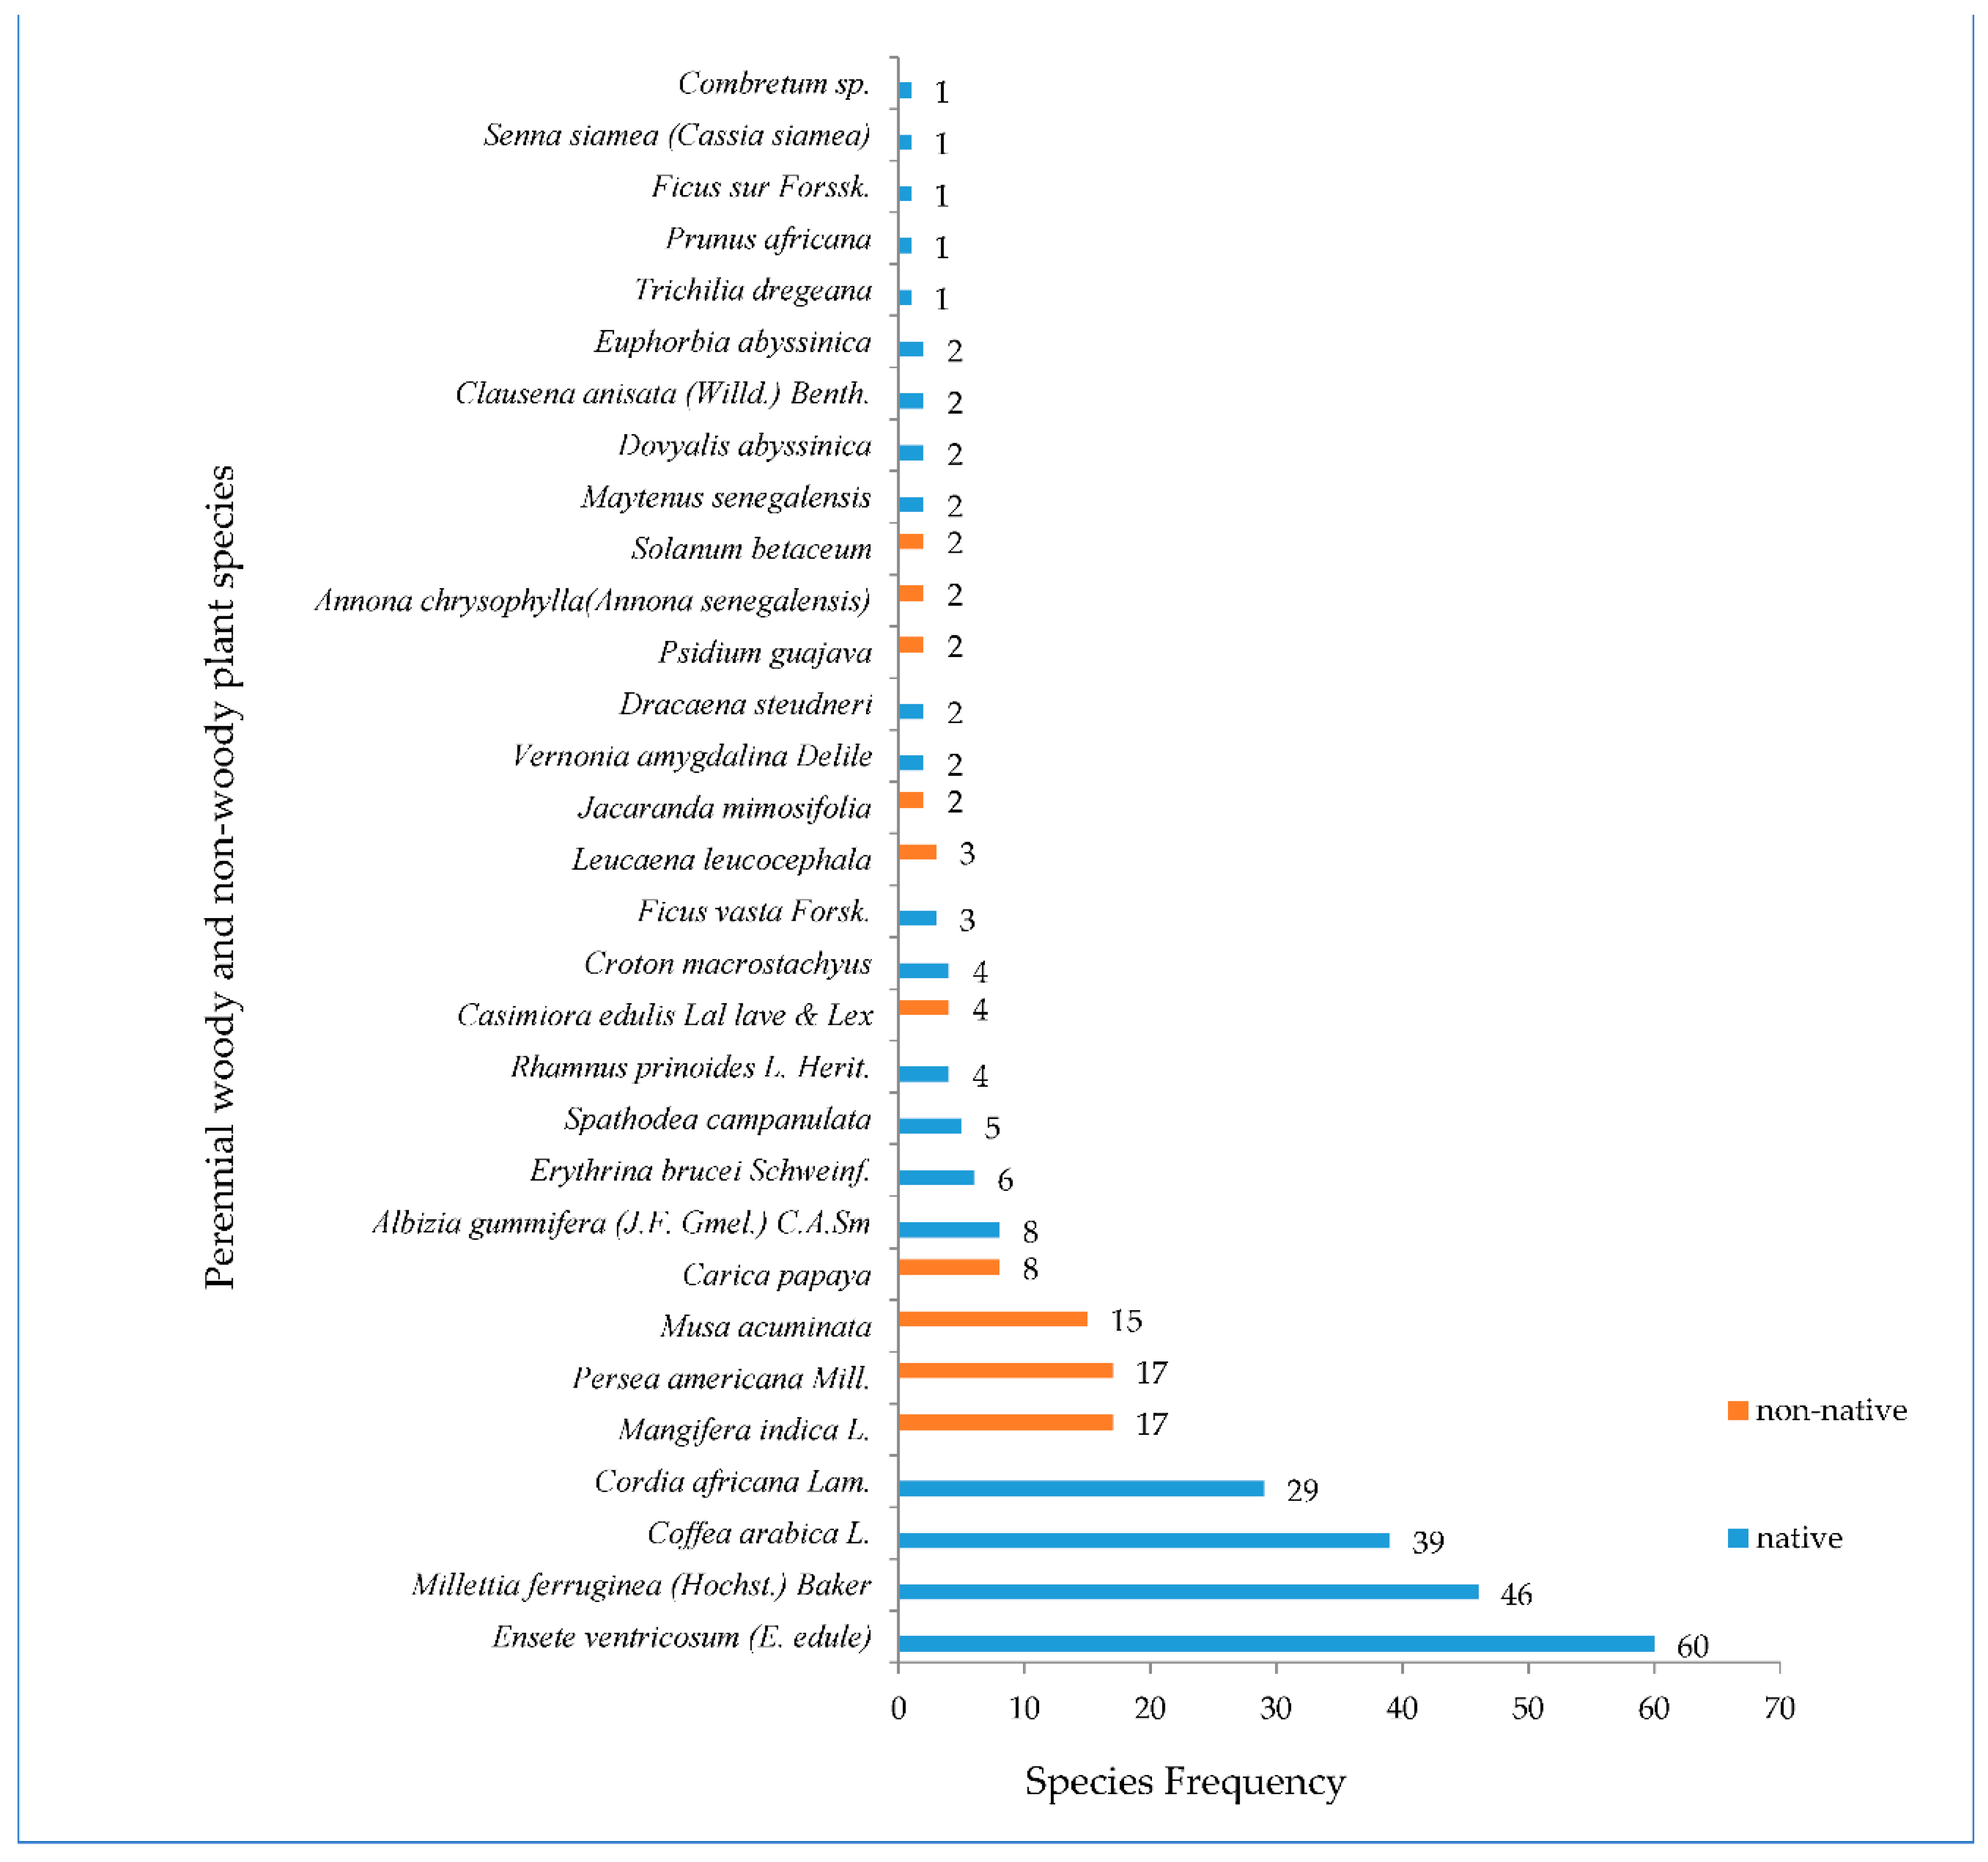
| Agroforestry system | Species Scientific name | Important value index (IVI %) |
|
Enset based AF system |
Ensete ventricosum (Welw. Cheesman) | 204.6 |
| Millettia ferruginea (Hochst.) Baker | 40.9 | |
| Cordia africana Lam. | 22.2 | |
| Erythrina brucei Schweinf. | 6.1 | |
| Croton macrostachyus | 4.0 | |
|
C-E based AF system |
Ensete ventricosum (Welw. Cheesman) | 159.2 |
| Coffea arabica L. | 56.3 | |
| Millettia ferruginea (Hochst.) Baker | 23.9 | |
| Cordia africana Lam. | 21.3 | |
| Albizia gummifera (J.F. Gmel.) C.A.Sm | 6.7 | |
|
C-Ft-E based AF system |
Ensete ventricosum (Welw. Cheesman) | 103.4 |
| Coffea arabica L. | 46.7 | |
| Musa acuminata | 42.3 | |
| Mangifera indica L. | 24.1 | |
| Persea americana Mill. | 21.6 |
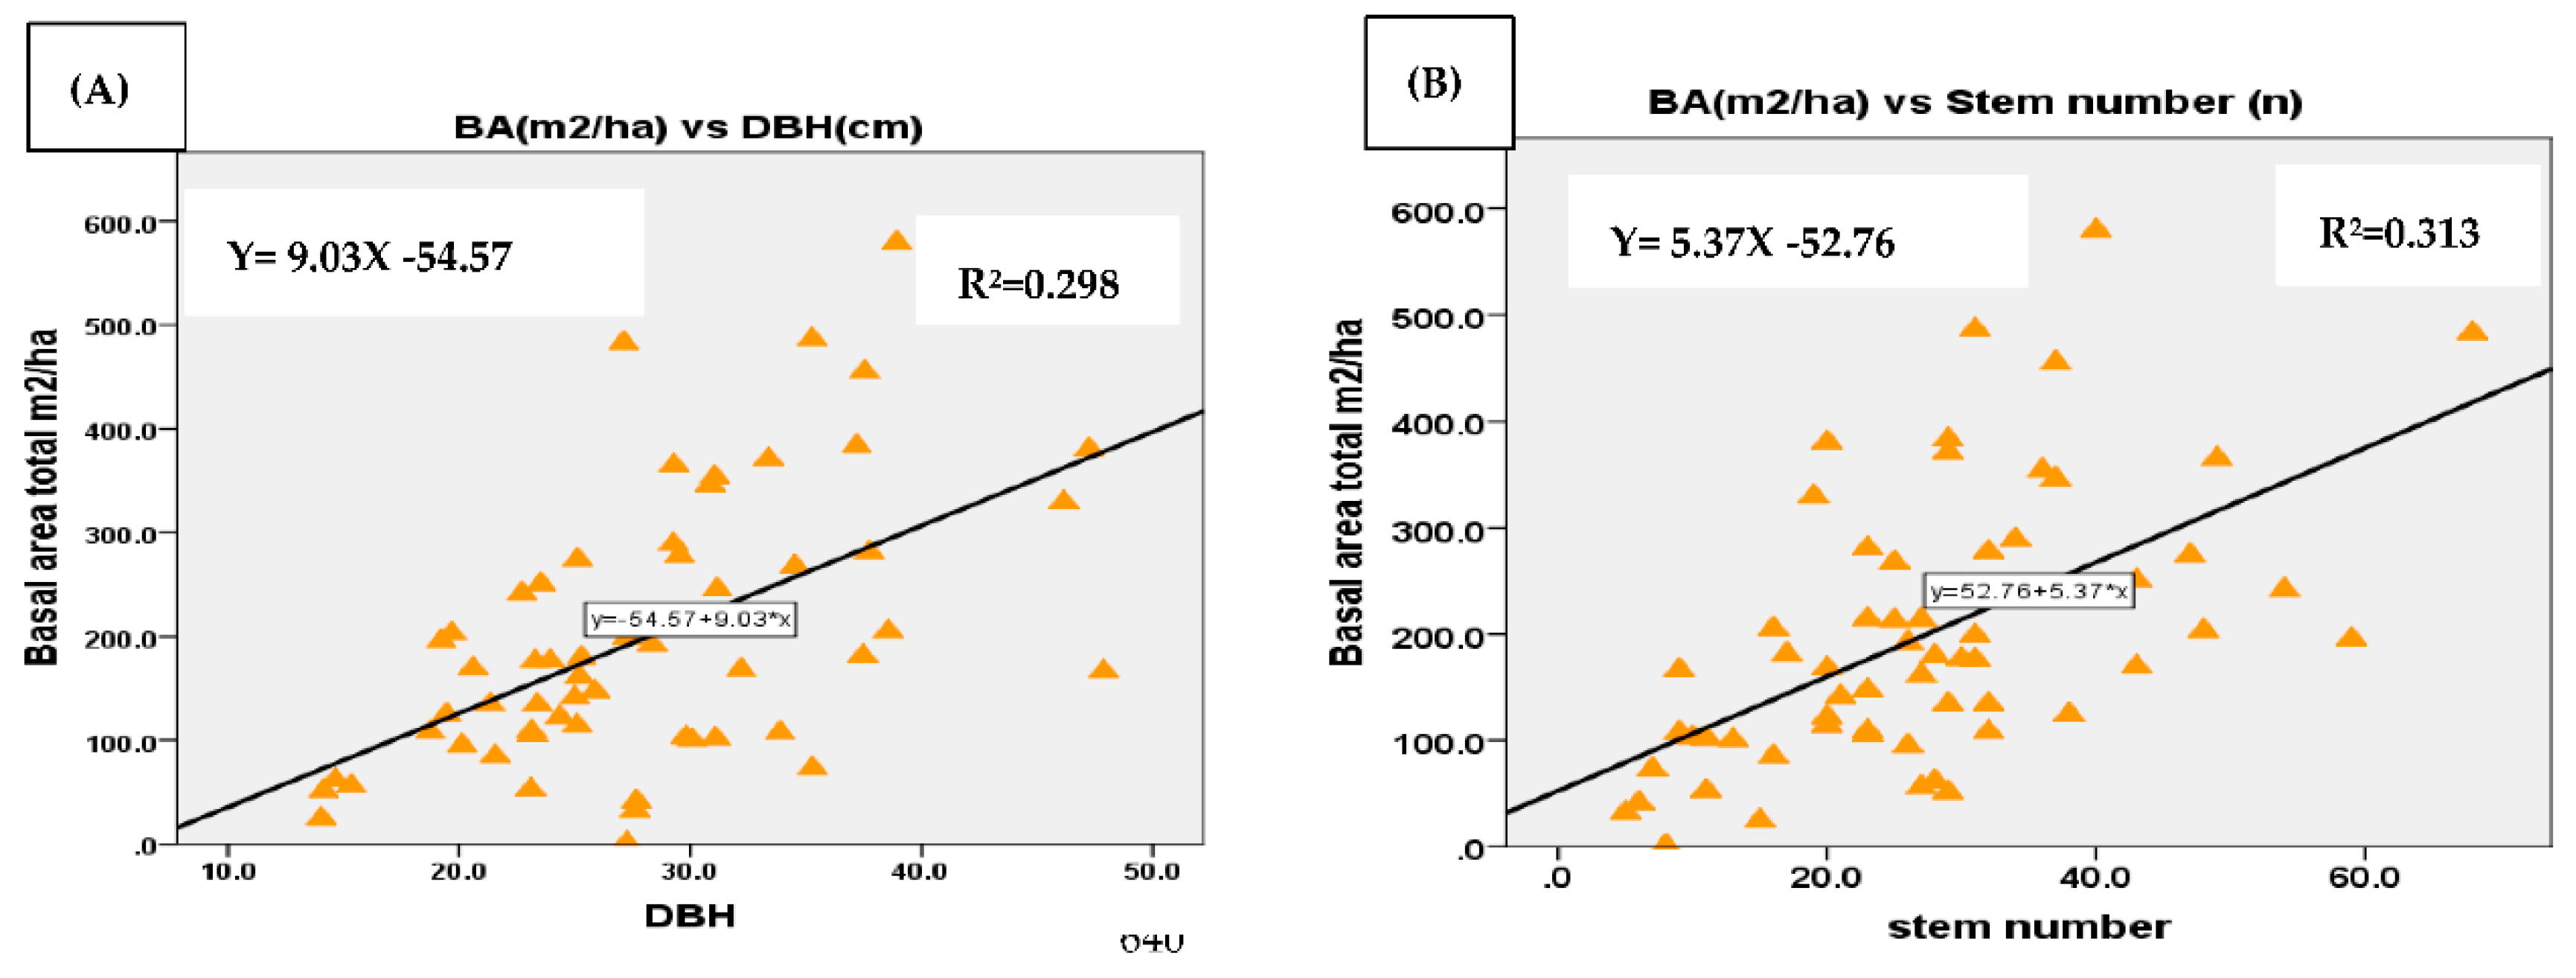
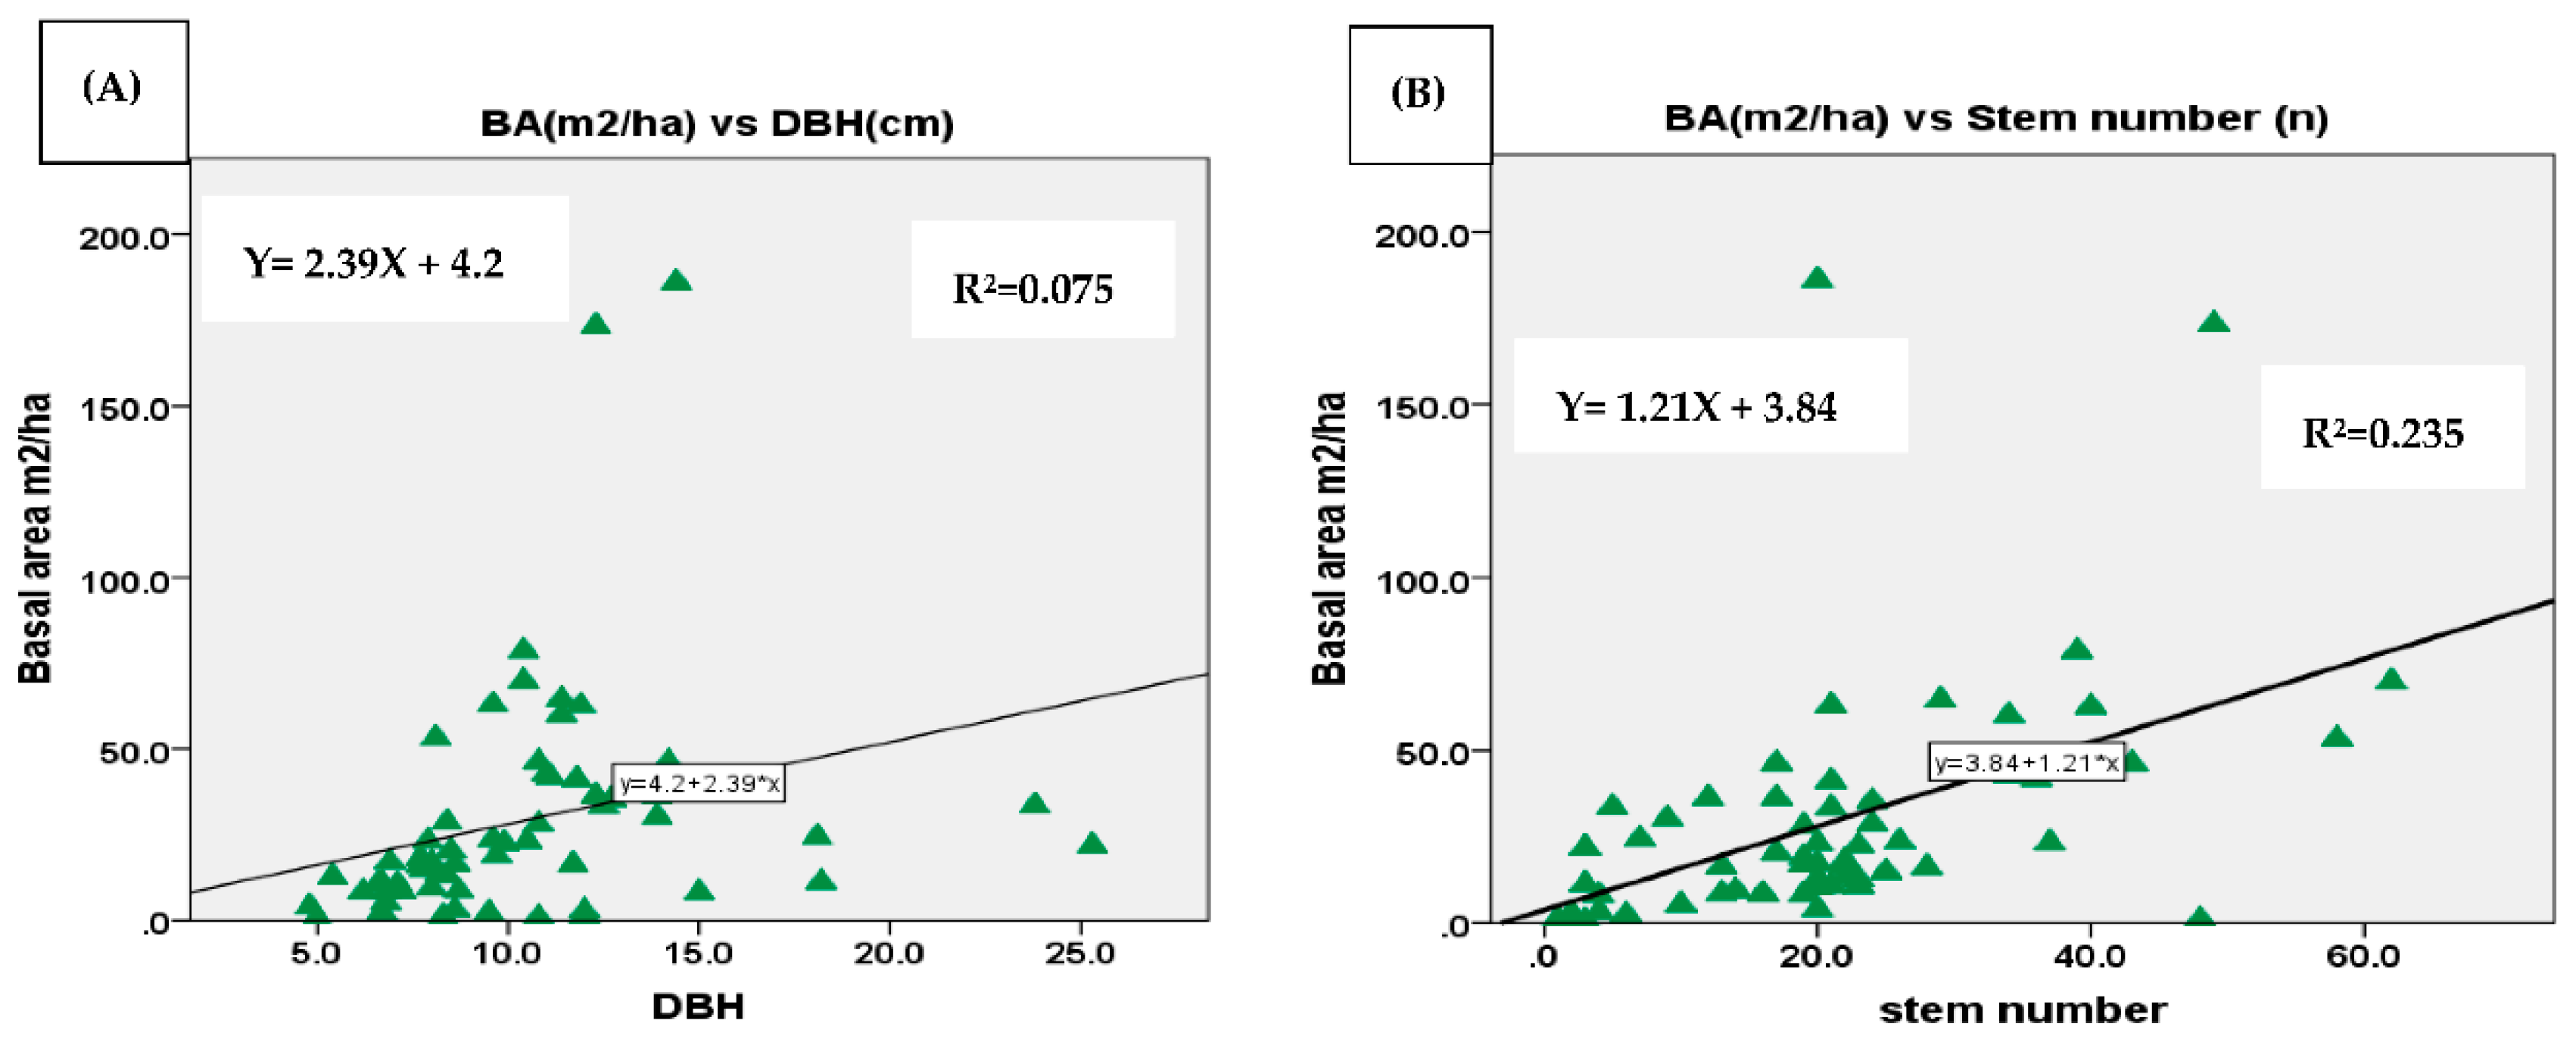
3.1.4. Stand structure, diversity and richness status of agroforestry systems
| Agroforestry system | n | Stem number (No/100 m2) | BA (m2 ha-1) |
Height (m) |
DBH (cm) |
| Enset based AF | 20 | 34.7(2.7)(b) | 306.4(28.8) (b) | 4.4(0.2) (b) | 31.0(1.7) (b) |
| C–E based AF | 20 | 29.3(2.8)(b) | 207.0(15.1) (c) | 4.1(0.2) (b) | 28.8(1.8) (ab) |
| C–Ft–E based AF | 20 | 13.1(2.0)(a) | 81.2(9.3) (a) | 3.6(0.2) (a) | 24.2(1.4) (a) |
| P–value | <0.05 | <0.05 | <0.05 | <0.05 |
| Agroforestry system | n | Stem number (No/100 m2) | BA (m2 ha-1) |
Height (m) |
DBH (cm) |
| Enset based AF | 20 | 9.3(1.7)(b) | 11.3(2.5) (b) | 6.0(0.8) (b) | 11.2(1.3) (a) |
| C–E based AF | 20 | 22.0(1.1)(c) | 21.9(4.1) (bc) | 3.6(0.2) (ac) | 8.1(0.3) (b) |
| C–Ft–E based AF | 20 | 31.2(3.5)(a) | 53.8(10.4) (a) | 4.2(0.2) (a) | 11.8(0.5) (a) |
| P–value | <0.05 | <0.05 | <0.05 | <0.05 |
| Agroforestry system | N | Stem number (No/100 m2) | BA (m2 ha-1) |
Height (m) |
DBH (cm) |
| Enset based AF | 20 | 46.9(3.0)(b) | 317.7(28.1) (b) | 4.6(0.1) (a) | 26.7(1.5) (b) |
| C–E based AF | 20 | 53.8(2.6)(b) | 228.5(14.8) (c) | 4.3(0.2) (a) | 18.9(0.7) (c) |
| C–Ft–E based AF | 20 | 71.2(3.2)(a) | 149.2(17.6) (a) | 4.3(0.1) (a) | 15.7(0.7) (a) |
| P–value | <0.05 | <0.05 | NS | <0.05 |
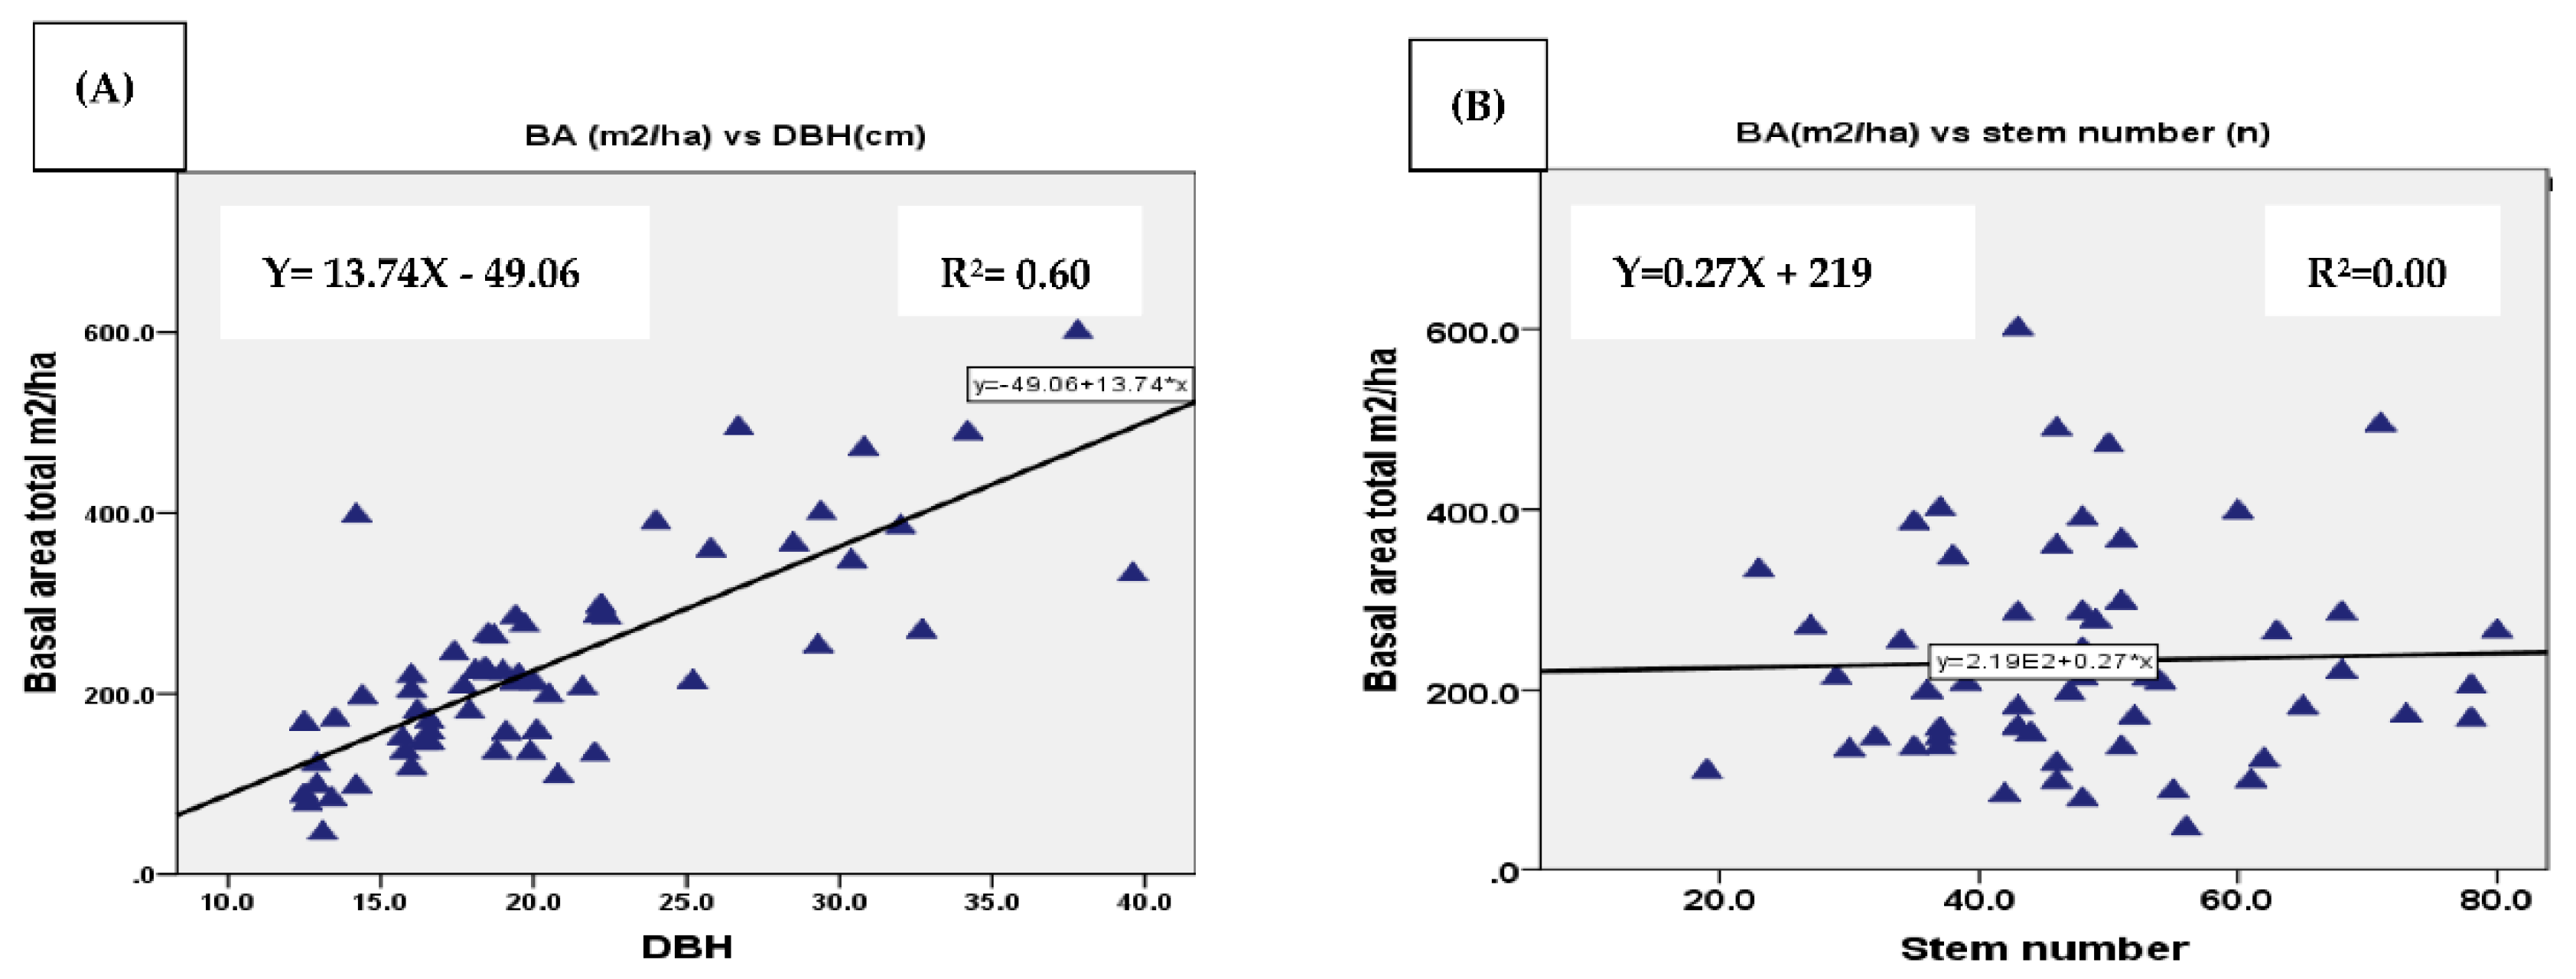
| Agroforestry system | N | Abundance Per 100 m2 |
Shannon diversity index | Margalef’s richness index | Pielou’s Eveness index |
| Enset based AF | 20 | 44.6(3.0) (a) | 0.7±0.2(b) | 0.6±0.2(b) | 0.6±0.1(a) |
| C–E based AF | 20 | 51.3(2.6) (a) | 1.0±0.1(c) | 1.0±0.3(c) | 0.6±0.1(a) |
| C–Ft–E based AF | 20 | 48.5(3.2) (a) | 1.1±0.2(a) | 1.2±0.3(a) | 0.6±0.1(a) |
| P–value | NS | <0.05 | <0.05 | NS |
3.1.5. Relationship of altitude with species richness and species abundance
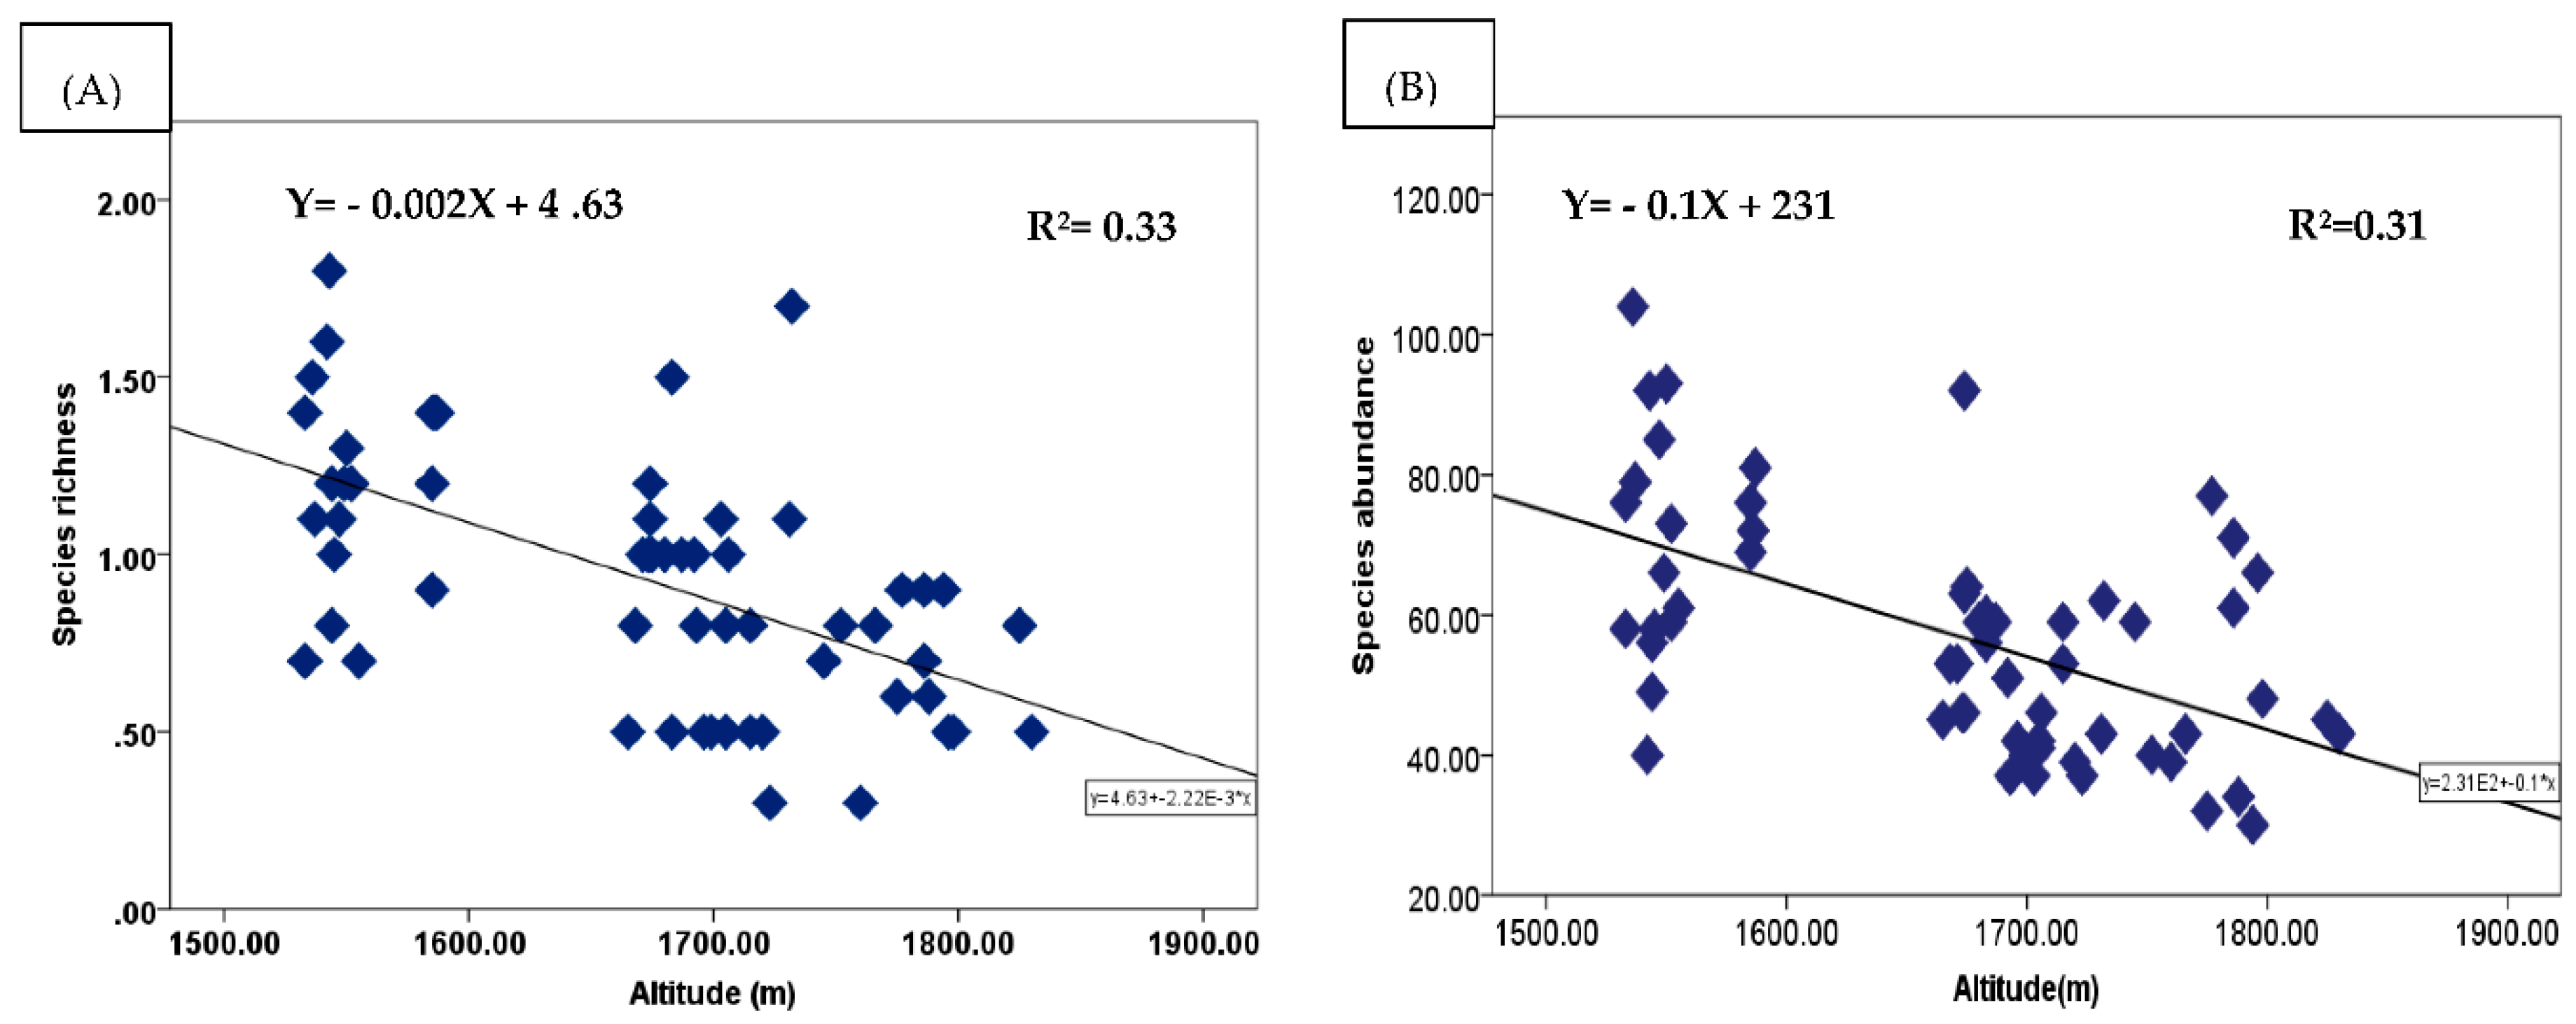
4. Conclusion and Recommendations
Author Contributions
Funding
Data Availability Statement
Acknowledgments
Conflicts of Interest
Appendix A
| Number | vernacular name | Scientific name | Family | Origin |
| 1 | Gorbe | Albizia gummifera (J.F. Gmel.) C.A.Sm | Fabaceae | Native |
| 2 | Geshita | Annona chrysophylla Bojer | Annonaceae | Non-native |
| 3 | Buno | Coffea arabica L. | Rubiaceae | Native |
| 4 | Papaya | Carica papaya | Caricaceae | Non-native |
| 5 | Abukere | Casimiroa edulis Lal lave and Lex | Rutaceae | Non-native |
| 6 | Godere | Clausena anisata (Willd.) Benth. | Rutaceae | Native |
| 7 | NI | Combretum sp. | Combretaceae | Native |
| 8 | Wedesa | Cordia africana Lam. | Boraginaceae | Native |
| 9 | Mokonisa | Croton macrostachyus | Euphorbiaceae | Native |
| 10 | NI | Dovyalis abyssinica | Salicaceae | Native |
| 11 | Cho’e | Dracaena steudneri Schweinf. Ex Engl. | Dracaenaceae | Native |
| 12 | Ensete | Ensete ventricosum (Welw. Cheesman) | Musaceae | Native |
| 13 | Welale/Gedogna | Erythrina brucei Schweinf. | Leguminosae | Native |
| 14 | Kulkal | Euphorbia abyssinica | Euphorbiaceae | Native |
| 15 | wagela | Ficus sur Forssk. | Moraceae | Native |
| 16 | Kilto | Ficus vasta Forsk. | Moraceae | Native |
| 17 | NI | Jacaranda mimosifolia | Bignoniaceae | Non-native |
| 18 | Lusina | Leucaena leucocephala | Mimosoideae | Non-native |
| 19 | Mango | Mangifera indica L. | Anacardiaceae | Non-native |
| 20 | Kobo/gulo | Maytenus senegalensis | Celastraceae | Native |
| 21 | Tatato | Millettia ferruginea (Hochst.) Baker | Leguminosae | Native |
| 22 | Muse | Musa acuminata | Musaceae | Non-native |
| 23 | Avocato | Persea americana Mill. | Lauraceae | Non-native |
| 24 | Gorbe | Prunus africana | Rosaceae | Native |
| 25 | Sholla | Psidium guajava L. | Myrtaceae | Non-native |
| 26 | Gesho | Rhamnus prinoides L. Herit. | Rhamnaceae | Native |
| 27 | NI | Senna siamea (Cassia siamea) | Fabaceae | Native |
| 28 | NI | Spathodea campanulata | Bignoniaceae | Native |
| 29 | Timatim zaf | Solanum betaceum | Solanaceae | Non-native |
| 30 | NI | Trichilia dregeana | Meliaceae | Native |
| 31 | Hebicha | Vernonia amygdalina Delile | Asteraceae | Native |
| List of perennial woody andnon–woody plant species recorded out of the study plots | ||||
| 32 | NI | Albizia grandibracteata Taub. | Fabaceae | Native |
| 33 | NI | Azadirachta indica var. | Meliaceae | Non-native |
| 34 | Tibero/Sessa | Bersama abyssinica Fresen | Francoaceae | Native |
| 35 | Yebelo | Bridelia micrantha (Hochst.) Baill. | Phyllanthaceae | Native |
| 36 | Tilo | Cassipourea malosana (Baker) Alst | Rhizophoraceae | Native |
| 37 | Chate | Catha edulis (Vahl) Forssk. ex Endl. | Celastraceae | Native |
| 38 | Motokomo | Celtis africana N.L. Burm | Ulmaceae | Native |
| 39 | Motokomo | Celtis sp. | Ulmaceae | Native |
| 40 | Lomie | Citrus limon (L.) Osbeck | Rutaceae | Non-native |
| 41 | Birtukan | Citrus sinensis (L.) Osbeck | Rutaceae | Non-native |
| 42 | NI | Cupressus lusitanica | Cupressaceae | Non-native |
| 43 | Bahirzaf | Eucalyptus camaldulensis | Myrtaceae | Non-native |
| 44 | Bahirzaf | Eucalyptus globules Labill. | Myrtaceae | Non-native |
| 45 | Bahirzaf | Eucalyptus grandis | Myrtaceae | Non-native |
| 46 | NI | Grevillea robusta | Proteaceae | Non-native |
| 47 | NI | Faidherbia albida | Fabaceae | Native |
| 48 | Kilto | Ficus elastica Roxb. | Moraceae | Native |
| 49 | NI | Hagenia abyssinica | Rosaceae | Native |
| 50 | NI | Melia azedarach L. | Meliaceae | Non-native |
| 51 | NI | Ricinus communis | Euphorbiaceae | Native |
| 52 | NI | Sesbania sesban | Fabaceae | Non-native |
| Scientific name | Family |
Fre n |
RF (%) |
Tot Dom |
RD (%) |
AB |
RA (%) |
IVI (%) |
| Albizia gummifera (J.F. Gmel.) C.A.Sm | Fabaceae | 2.0 | 3.0 | 0.2 | 0.3 | 6.0 | 0.6 | 3.9 |
| Combretum sp. | Combretaceae | 1.0 | 1.5 | 0.0 | 0.0 | 4.0 | 0.4 | 1.9 |
| Cordia africana Lam. | Boraginaceae | 11.0 | 16.7 | 0.9 | 1.4 | 39.0 | 4.1 | 22.2 |
| Crot macrostachyus | Euphorbiacee | 2.0 | 3.0 | 0.2 | 0.4 | 6.0 | 0.6 | 4.0 |
| Dovyalis abyssinica | Salicaceae | 1.0 | 1.5 | 0.0 | 0.0 | 3.0 | 0.3 | 1.9 |
| Dracaena steudneri Schweinf. ex Engl | Dracaenaceae | 1.0 | 1.5 | 0.0 | 0.0 | 11.0 | 1.2 | 2.7 |
| Ensete ventricosum (Welw. Cheesman) | Musaceae | 20.0 | 30.3 | 61.3 | 96.1 | 743.0 | 78.2 | 204.6 |
| Erythrina brucei Schweinf. | Leguminosae | 3.0 | 4.5 | 0.0 | 0.1 | 14.0 | 1.5 | 6.1 |
| Maytenus senegalensis | Celastraceae | 1.0 | 1.5 | 0.0 | 0.0 | 1.0 | 0.1 | 1.6 |
| Millettia ferruginea (Hochst.) Baker | Leguminosae | 19.0 | 28.8 | 0.9 | 1.3 | 102.0 | 10.7 | 40.9 |
| Prunus africana | Rosaceae | 1.0 | 1.5 | 0.0 | 0.0 | 4.0 | 0.4 | 1.9 |
| Rhamnus prinoides L. Herit. | Rhamnaceae | 1.0 | 1.5 | 0.0 | 0.0 | 6.0 | 0.6 | 2.1 |
| Senna siamea (Cassia siamea) | Fabaceae | 1.0 | 1.5 | 0.0 | 0.0 | 4.0 | 0.4 | 2.0 |
| Solanum betaceum | Solanaceae | 1.0 | 1.5 | 0.0 | 0.0 | 3.0 | 0.3 | 1.9 |
| Vernonia amygdalina Delile | Asteraceae | 1.0 | 1.5 | 0.2 | 0.3 | 4.0 | 0.4 | 2.2 |
| Scientific name | Family |
Fre
n |
RF
(%) |
Tot
Dom |
RD
(%) |
AB |
RA
(%) |
IVI
(%) |
| Albizia gummifera (J.F. Gmel.) C.A.Sm | Fabaceae | 1 | 0.8 | 0.0 | 0.0 | 4.0 | 0.3 | 1.1 |
| Annona chrysophylla | Annonaceae | 2 | 1.5 | 0.0 | 0.2 | 22.0 | 1.8 | 3.5 |
| Casimiroa edulis Lal lave and Lex | Rutaceae | 4 | 3.1 | 0.0 | 0.0 | 11.0 | 0.9 | 4.0 |
| Carica papaya | Caricaceae | 8 | 6.2 | 0.1 | 0.2 | 22.0 | 1.8 | 8.2 |
| Coffea arabica L. | Rubiaceae | 19 | 14.6 | 2.0 | 7.0 | 310.0 | 25.1 | 46.7 |
| Cordia africana Lam. | Boraginaceae | 5 | 3.8 | 0.1 | 0.5 | 16.0 | 1.3 | 5.7 |
| Ensete ventricosum ( Welw. Cheesman) | Musaceae | 20 | 15.4 | 16.9 | 58.6 | 363.0 | 29.4 | 103.4 |
| Erythrina brucei Schweinf. | Leguminosae | 1 | 0.8 | 0.0 | 0.2 | 2.0 | 0.2 | 1.1 |
| Ficus sur Forssk. | Moraceae | 1 | 0.75 | 1.5 | 5.15 | 1 | 0.1 | 6.0 |
| Ficus vasta Forsk. | Moraceae | 1 | 0.75 | 1.5 | 5.15 | 1.0 | 0.1 | 6.0 |
| Leucaena leucocephala | Mimosoideae | 1 | 0.8 | 0.0 | 0.0 | 2.0 | 0.2 | 0.9 |
| Mangifera indica L. | Anacardiaceae | 16 | 12.3 | 0.9 | 3.1 | 108.0 | 8.8 | 24.1 |
| Maytenus senegalensis | Celastraceae | 1 | 0.8 | 0.0 | 0.0 | 2.0 | 0.2 | 0.9 |
| Millettia ferruginea (Hochst.) Baker | Leguminosae | 12 | 9.2 | 0.6 | 2.1 | 64.0 | 5.2 | 16.6 |
| Musa acuminata | Musaceae | 15 | 11.5 | 3.4 | 11.8 | 234.0 | 19.0 | 42.3 |
| Persea americana Mill. | Lauraceae | 16 | 12.3 | 1.3 | 4.5 | 59.0 | 4.8 | 21.6 |
| Prunus africana | Rosaceae | 0 | 0.0 | 0.0 | 0.0 | 0.0 | 0.0 | 0.0 |
| Psidium guajava | Myrtaceae | 1 | 0.8 | 0.0 | 0.0 | 1.0 | 0.1 | 0.9 |
| Rhamnus prinoides L. Herit. | Rhamnaceae | 1 | 0.8 | 0.0 | 0.0 | 4.0 | 0.3 | 1.1 |
| Solanum betaceum | Solanaceae | 1 | 0.8 | 0.0 | 0.0 | 1.0 | 0.1 | 0.9 |
| Spathodea campanulata | Bignoniaceae | 3 | 2.3 | 0.4 | 1.5 | 5.0 | 0.4 | 4.2 |
| Trichilia dregeana | Meliaceae | 1 | 0.8 | 0.0 | 0.0 | 1.0 | 0.1 | 0.9 |
References
- Kenrick, P. and Crane, P. R. (1997) ‘The origin and early evolution of plants on land’, Nature, 389(6646), pp. 33–39. [CrossRef]
- Parmesan, C. and Yohe, G. (2003) ‘A globally coherent fingerprint of climate change impacts across natural systems.’, Nature, 421(6918), pp. 37–42. [CrossRef]
- ICRAF (2000) ‘Paths to prosperity through agroforestry’. ICRAF’s corporate strategy, 2001– 2010. Nairobi: International Centre for Research in Agroforestry.
- Jose, S. (2009) ‘Agroforestry for ecosystem services and environmental benefits: An overview’, Agroforestry Systems, 76(1), pp. 1–10. [CrossRef]
- Das, T. and Das, A. K. (2005) ‘Inventorying plant biodiversity in homegardens: A case study in Barak Valley, Assam, North East India’, Current Science 89(1). pp.155-163.
- Harvey, C. A. and Gonzalez -villalobos, J. A. (2007) ‘Agroforestry systems conserve species-rich but modified assemblages of tropical birds and bats’, Biodiversity and Conservation, 16(8), pp. 2257-2292. [CrossRef]
- Jose, S. (2012) ‘Agroforestry for conserving and enhancing biodiversity’, Agroforestry Systems, 85(1), 1–8. [CrossRef]
- Gillespie, A. R., Miller, B. K. and Johnson, K. D. (1995) ‘Effects of ground cover on tree survival and growth in filter strips of the Cornbelt Region of the midwestern US’, Agriculture, Ecosystems and Environment, 53(3), pp. 263–270. [CrossRef]
- McNeely, J. A. and Schroth, G. (2006) ‘Agroforestry and Biodiversity Conservation – Traditional Practices, Present Dynamics, and Lessons for the Future’, Biodiversity and Conservation, 15(2), pp. 549–554. [CrossRef]
- Bhagwat, S.A., Willis, K.J., Birks, H.J.B. and Whittaker, R.J., (2008) ‘Agroforestry: a refuge for tropical biodiversity?’ Trends in ecology and evolution, 23(5), pp.261-267. [CrossRef]
- Haggar, J., Pons, D., Saenz, L., & Vides, M. (2019). Contribution of agroforestry systems to sustaining biodiversity in fragmented forest landscapes. Agriculture, Ecosystems & Environment, 283, 106567. [CrossRef]
- Kumar, B. M. and Nair, P. K. R. (2004) ‘The enigma of tropical homegardens’, in Agroforestry Systems, 61-62(1-3), pp.135–152. [CrossRef]
- Negash, M., Yirdaw, E., and Luukkanen, O. (2012) ‘Potential of indigenous multistrata agroforests for maintaining native floristic diversity in the south-eastern Rift-Valley escarpment, Ethiopia’, Agroforestry Systems, 85(1), pp. 9-28. [CrossRef]
- Negash, M. (2013) ‘The indigenous agroforestry systems of the south-eastern Rift–Valley escarpment, Ethiopia: Their biodiversity, carbon stocks, and litterfall’, Viikki Tropical Resources Institute (VITRI) PhD Dissertation, University of Helsinki, Finland. 62 p.
- Hemp, A. (2006) ‘The Banana forests of Kilimanjaro: Biodiversity and conservation of the Chagga homegardens’, Biodiversity and Conservation, 15(4), pp. 1193-1217. [CrossRef]
- Kabir, M. E. and Webb, E. L. (2009) ‘Household and homegarden characteristics in southwestern Bangladesh’, Agroforestry Systems, 75(2), pp. 129–145.. [CrossRef]
- Kehlenbeck, K., Kindt, R., Sinclair, F. L., Simons, A. J. and Jamnadass, R. (2011) ‘Non-native tree species displace indigenous ones on farms at intermediate altitudes around Mount Kenya’, Agroforestry Systems, 83(2), pp. 133-147. [CrossRef]
- Abebe, T., Wiersum, K.F., Bongers, F.J.J.M. and Sterck, F. (2006) ‘Diversity and dynamics in homegardens of southern Ethiopia’, In Tropical Homegardens (pp. 123-142). Springer, Dordrecht. [CrossRef]
- Tamrat, S., (2011) ‘Study of useful plants in and around gate Uduma (traditional Gedeo Homegardens) in Kochere Woreda of Gedeo zone, SNNPR, Ethiopia: An ethnobotanical approach’, PhD thesis, Addis Ababa University, Ethiopia, 144 p.
- Negash, M. and Achalu, N. (2008) ‘History of indigenous agroforestry in Gedeo, southern Ethiopia, Based on local community interviews: vegetation diversity and structure in the land use systems. Ethiopian Journal of Natural Resources 10(1):31−52.
- Woldeyes, F. (2011) ‘Homegardens and spices of Basketo and Kafa (Southwest Ethiopia): Plant diversity, product valorization and implications to biodiversity conservation’, PhD thesis, Addis Ababa University, Ethiopia, 222 p.
- Duguma, L. A. and Hager, H. (2010) ‘Woody plants diversity and possession, and their future prospects in small-scale tree and shrub growing in agricultural landscapes in central highlands of Ethiopia’, Small-scale Forestry, 9(2), pp. 153–174. [CrossRef]
- Mengesha, B. (2010) ‘Alternative technologies for sustainable agricultural production and agroecosystem conservation in arsi highlands, Southeastern Ethiopia’, PhD thesis.Addis Ababa University, Ethiopia. 198 p.
- Kebede, T.M. 2010. Homegardens agrobiodiversity conservation in Sebeta-Hawas Woreda, southwestern Shewa Zone of Oromia Region, Ethiopia. M.Sc. thesis. Addis Ababa University, Ethiopia. 78 p.
- Fentahun, M. and Hager, H. (2009) ‘Integration of indigenous wild woody perennial edible fruit bearing species in the agricultural landscapes of Amhara region , Ethiopia’, Agroforestry Systems, 78(1), pp. 79–95. [CrossRef]
- Haileselasie, T. H. and Gebrehiwot, M. T. (2012) ‘Agroforestry practices and flora composition in backyards in Hiwane , Hintalo Wejerat of Tigray , Northern Ethiopia’, International Journal of Biodiversity and Conservation, 4(7). pp. 294-303. [CrossRef]
- Degefa, S. (2016). Home garden agroforestry practices in the Gedeo zone, Ethiopia: a sustainable land management system for socio-ecological benefits. Socio-ecological production landscapes and seascapes (SEPLS) in Africa, 28.
- Kanshie, T. K. (2002) ‘Five thousand years of sustainability? : a case study on Gedeo land use (Southern Ethiopia)’, PhD Dissertation, Wageningen University, Netherlands. 295 p.
- Tesfay, H.M.; Negash, M.; Godbold, D.L.; Hager, H. (2022) ‘Assessing Carbon Pools of Three Indigenous Agroforestry Systems in the Southeastern Rift–Valley Landscapes, Ethiopia’, Sustainability, 14, 4716. [CrossRef]
- Asfaw, Z. and Agren. IG (2007) ‘Farmers’ local knowledge and topsoil properties of agroforestry practices in Sidama, Southern Ethiopia’, Agroforestry Systems, 71(1), pp. 35-48. [CrossRef]
- Negash, M. (2007) ‘Trees management and livelihoods in Gedeo’s agroforests, Ethiopia’, Forests, trees and livelihoods, 17(2), pp. 157–168. [CrossRef]
- Negash, M., Yirdaw, E., and Luukkanen, O. (2012) ‘Potential of indigenous multistrata agroforests for maintaining native floristic diversity in the south-eastern Rift–Valley escarpment, Ethiopia’, Agroforestry Systems, 85(1), pp. 9-28. [CrossRef]
- Abebe, T. (2013) ‘Determinants of crop diversity and composition in enset-coffee agroforestry homegardens of Southern Ethiopia’, Journal of Agriculture and Rural Development in the Tropics and Subtropics, 114(1), pp.29-38.
- Seta, T. and Demissew, S. (2014) ‘Diversity and standing carbon stocks of native agroforestry trees in Wenago district , Ethiopia’, Journal of Emerging Trends in Engineering and Applied Sciences (JETEAS), 5(7), pp. 125–132.
- National Metreology Agency (2019) ‘Climatic data of South nations and nationalities peoples regional state’, Hawassa, Ethiopia.
- Mebrate, B.T. (2007) ‘Agroforestry practices in Gedeo Zone, Ethiopia: A geographical analysis’, PhD dissertation, Panjab University, India. 188 p.
- Food and agriculture organization (FAO) (2010) ‘Global forest resource assessment’, Main report no. 163.FAO (Food and Agriculture Organization of the United Nations), Rome.
- Asfaw, Z. (2003) ‘Tree species diversity, topsoil conditions and arbuscular mycorrhizal association in the Sidama traditional agroforestry land use, Southern Ethiopia’, PhD Dissertation, Swedish University of Agricultural Sciences, Department of Forest management and products, SLU. Acta Universitatis Sueciae. Silverstria, 263 p.
- Abebe, T. (2005) ‘Diversity in Homegarden Agroforestry Systems of Southern Ethiopia’, PhD thesis, Wageningen University, the Netherlands. ISBN 90-8504-163-5; 143 pp.
- Brandt, S., Spring, A., Hiebsch, C., McCabe, J.T., Tabogie, E., Diro, M., Wolde-michael, G., Yntiso, G., Shigeta, M. and Tesfaye, S. (1997) ‘The “Tree against Hunger.” enset-Based Agricultural Systems in Ethiopia’. New York: American Association for the Advancement of Science, pp. 55.
- Zewdie, S., Fetene, M. and Olsson, M. (2008) ‘Fine root vertical distribution and temporal dynamics in mature stands of two enset (Ensete ventricosum Welw Cheesman) clones’, Plant and Soil, 305(1–2), pp. 227–236. [CrossRef]
- Shank, R. and Ertiro, C. (1996) ‘A linear model for predicting enset plant yield and assessment of Kocho production in Ethiopia’, World Food Program, Ministry of Agriculture, Southern Nation Nationalities, People Regional State, UNDP Emergencies Unit for Ethiopia, Addis Ababa, 62 p.
- Tsegaye, A. and Struik, P. C. (2001) ‘enset (Ensete ventricosum (Welw. Cheesman) kocho yield under different crop establishment methods as compared to yields of other carbohydrate-rich food crops’, Netherlands Journal of Agricultural Science, 49(1), pp. 81–94.. [CrossRef]
- Negash, A. and Niehof, A. (2004) ‘The significance of enset culture and biodiversity for rural household food and livelihood security in southwestern Ethiopia ’, Agriculture and Human Values, 21(1), pp. 61-71.
- Negash, A. (2001) ‘Diversity and conservation of enset (Ensete ventricosum Welw . Cheesman ) and its relation to household food and livelihood security in South-western Ethiopia’, PhD dissertation. Wageningen University, The Netherlands. 247p.
- Tsegaye, A. (2002) ‘On indigenous production, genetic diversity and crop ecology of enset (Ensete ventricosum (Welw.) Cheesman)’, PhD Thesis, Wageningen University, Netherlands. 198 p.
- NBE (National Bank of Ethiopia) annual report. Last accessed January 2023: https://nbebank.com/wp-content/uploads/pdf/annualbulletin/Annual%20Report%202020-2021/2020-21%20Annual%20Report.pdf.
- Labouisse, J.P., Bellachew, B., Kotecha, S. and Bertrand, B. (2008) ‘Current status of coffee (Coffea arabica L.) genetic resources in Ethiopia: implications for conservation’, Genetic Resources and Crop Evolution, 55(7), pp. 1079–1093. [CrossRef]
- Abebe, T., Wiersum, K.F. and Bongers, F., (2010) ‘Spatial and temporal variation in crop diversity in agroforestry homegardens of southern Ethiopia’, Agroforestry systems, 78(3), pp. 309–322. [CrossRef]
- Asfaw, Z. Mulata, Y. Assefa, B. Abebe, T. Duna, S. Mulugeta, G. Mebrahten, H. and Kassa, H. (2015) ‘Enhancing the role of Forestry in Building Climate Resilient Green Economy in Ethiopia: Strategy for scalling up effective forest management practices in Southern Nations, Nationalities and Peoples Regional State with particular an emphasis on agroforestry’, Center for International Forestry Research (CIFOR), 66 p.
- Mulugeta, G. and Mabrate, A. (2017) ‘Production and ecological potentials of Gedeo’s indigenous agroforestry practices in Southern Ethiopia’, Journal of Resources Development and Management 30(1), pp. 68–76.
- Dytham, C. (2003) ‘Choosing and using statistics: a biologist’s guide’, 2nd edition. Blackwell, Oxford.
- Snowdon, P., Raison, J., Keith, H., Ritson, P., Grierson, P., Adams, M., Montagu., K., Bi HQ, Burrows, W. and Eamus, D. (2002) ‘Protocol for sampling tree and stand biomass’, National Carbon accounting System, Technical report no. 31. Australian Greenhouse Office, Canberra.
- Shannon, C.E. and Weaver, W. (1949) ‘The mathematical theory of communication’, University of Illinois Press, Urbana, Illinois.117 p.
- Kent, M. and Coker, K. (1992) ‘Vegetation description and analysis; A practical approach’, Belhaven Press, London, 363p.
- Magurran, A.E. (2004) ‘Measuring biological diversity’, Blackwell Sciences, Oxford.
- Pielou, E.C. (1969) ‘An Introduction to Mathematical Ecology’, Wiley, New York. 286 p.
- Caiafa, A. N., and Martins, F. R. (2010) ‘Forms of rarity of tree species in the southern Brazilian Atlantic rainforest’. Biodiversity and Conservation, 19(9), 2597–2618. [CrossRef]
- Edwards, S. and Kelbessa, E. (1999) ‘Forest genetic resources of Ethiopia: status and proposed actions. In: Edwards S, Demissie A, Bekele T and Haase G (eds), The national forest resources conservations strategy development workshop’, Proceedings of national workshop from 21–22, June 1999 held in Addis Ababa. Institute of Biodiversity Conservation and Research (IBCR), GTZ, Addis Ababa, pp 101–133.
- Vivero, L.J., Kelbessa, E. and Demissew, S. (2005) ‘The red list of endemic trees and shrubs of Ethiopia and Eritrea’, Fauna and Flora International, Cambridge, 23 p.
- Bekele, T., Haase, G. and Soromessa, T. (1999) ‘Forest genetic resources of Ethiopia: status and proposed actions. In: Edwards S, Demissie A, Bekele T and Haase G (Eds) The national forest resources conservations strategy development workshop’, Proceedings of national workshop from 21–22, June 1999 held in Addis Ababa. Institute of Biodiversity Conservation and Research (IBCR), GTZ, Addis Ababa, pp 39-48.
- Gebremariam, A.H., Bekele, M. and Ridgewell, A. (2009) ‘Small and medium forest enterprises in Ethiopia’, IIED Small and Medium Forest Enterprise Series No. 26. FARM-Africa and International Institute for Environment and Development, London. 52 p.
- Kassa, K., Abebe, T. and Ewnetu, Z. (2015) ‘Diversity, density and management of trees in different agro-forestry practices of Yem Special District, Southern Ethiopia’, Ethiopian Journal of Science, 38(1). pp. 1-16.
- Asfaw, Z. and Woldu, Z. (1997) ‘Crop association of home-gardens in Wolayta and Gurage in southern Ethiopia. Ethiopian Journal of Science, 20(1), pp. 73-90.
- Bajigo, A. and Tadesse, M. (2015) ‘Woody species diversity of traditional agroforestry practices in Gununo Watershed in Wolayitta Zone, Ethiopia. Forest Research 4(4). pp.155. [CrossRef]
- Tefera, Y., Abebe, W. and Teferi, B. (2016) ‘Woody plants species diversity of home garden agroforestry in three agroecological Zones of Dilla Zuria District, Gedeo Zone, Southern Ethiopia’, International Journal of Fauna and Biological Studies, 3(3). pp. 98-106.
- Negawo, W.J. and Beyene, D.N. (2017) ‘The Role of coffee Based Agroforestry System in Tree Diversity Conservation in Eastern Uganda’, Journal of Landscape Ecology, 10(2), pp. 1-18. [CrossRef]
- Molla, A., and Kewessa, G. (2015) ‘Woody species diversity in traditional agroforestry practices of Dellomenna District, Southeastern Ethiopia: Implication for maintaining native woody species’, International Journal of Biodiversity, 2015(3), pp.1-13. [CrossRef]
- Okafor, J. C. and Fernandes, E. C. M. (1987) ‘Compound farms of southeastern Nigeria’, Agroforestry Systems, 5(2), pp. 153–168. [CrossRef]
- Perera, A. H. and Rajapakse, R. M. N. (1991) ‘A baseline study of Kandyan Forest Gardens of Sri Lanka: Structure, composition and utilization’, Forest Ecology and Management, 45(1-4), pp. 269–280. [CrossRef]
- Kumar, M.B., George, S. J. and Chinnamani, S. (1994) ‘Diversity, structure and standing stock of wood in the homegardens of Kerala in peninsular India’, Agroforestry Systems, 25(3), pp. 243–262. [CrossRef]
- Padoch, C., & de Jong, W. (1991) ‘The house gardens of Santa Rosa: Diversity and variability in an Amazonian agricultural system’, Economic Botany, 45(2), pp. 166–175. [CrossRef]
- Soemarwoto, O. (1987) ‘Homegadens: a traditional agrforestry system with a promising future. In: Steppler H, Nair PKR (eds) Agroforestry: a decade of development. International Council for Research in Agroforestry (ICRAF), Nairobi, pp 157–170.
- Kumari, M.S., Kansuntisukmongkol, K. and Brockelman, W.Y., (2009) ‘ Plant diversity in home gardens and its contribution to household economy in suburban areas in Sri Lanka’. Environment and Natural Resources Journal, 7(2), pp.12-29.
- Oginosako, Z., Simitu, P., Orwa, C., and Mathenge, S. (2006) ‘Are they competing or compensating on farm?: Status of indigenous and non-native tree species in a wide range of agro-ecological zones of Eastern and Central Kenya, Surrounding Mt. Kenya’, Results of vegetation, farmer, and nursery Surveys (No. 16). World Agroforestry Centre, Nairobi, Kenya. 45 p.
- Nogués-Bravo, D., Araújo, M. B., Romdal, T. and Rahbek, C. (2008) ‘Scale effects and human impact on the elevational species richness gradients’, Nature, 453(7192), pp. 216-219. [CrossRef]
- Singh, M., Kumar, A., & Sharma, M. (2021). ‘Conservation of plant diversity in agroforestry systems in a biodiversity hotspot region of northeast India’. Agricultural Research, 10(4), 569-581.
- O’Neill, G. A., Dawson, I., Sotelo-Montes, C., Guarino, L., Guariguata, M., Current, D. and Weber, J. C. (2001) ‘Strategies for genetic conservation of trees in the Peruvian Amazon basin’, Biodiversity and Conservation, 10(6), pp. 837–850. [CrossRef]
- Hailu, T., Negash, L., and Olsson, M. (2000) ‘Millettia ferruginea from southern Ethiopia: Impacts on soil fertility and growth of maize’, Agroforestry Systems, 48(1), pp. 9–24. [CrossRef]
- Michon, G., Bompard, J., Hecketsweiler, P. and Ducatillion, C. (1983) ‘Tropical forest architectural analysis as applied to agroforests in the humid tropics: The example of traditional village-agroforests in West Java’, Agroforestry Systems, 1(2), pp.117–129. [CrossRef]
- Kessy, J.F. (1998) ‘Conservation and Utilization of Natural Resources in the East Usambara Forest Reserves: Conventional Views and Local Perseptives’, PhD thesis, Wageningen University, The Netherlands. ISBN: 90-5485-809-5;168 p.
- Berhanu, A. and Asfaw, Z. (2014) ‘The role of home gardens for conservation and sustainable utilization of plant biodiversity of Ethiopia. In: Girma, A. and Wube, T. (eds). Coffee production, variety and trading ways to maximize Ethiopia’s benefits. Proceedings of 24th annual conference of the biological society of Ethiopia. pp. 81-35.
- Schroth, G., Krauss, U., Gasparotto, L. J. A. D., Duarte Aguilar, J. A., & Vohland, K. (2000) ‘Pests and diseases in agroforestry systems of the humid tropics’. Agroforestry systems, 50, 199-241.
- Jensen, M. (1993b) ‘Productivity and nutrient cycling of a Javanese homegarden’, Agroforestry Systems, 24(2), pp.187–201. [CrossRef]
- Correia, M., Diabaté, M., Beavogui, P., Guilavogui, K., Lamanda, N. and de Foresta, H. (2010) ‘Conserving forest tree diversity in Guinée Forestière (Guinea, West Africa): the role of coffee-based agroforests’, Biodiversity and Conservation, 19(6), pp. 1725–1747. [CrossRef]
- Asase, A. and Tetteh, D. A. (2010) ‘The role of complex agroforestry systems in the conservation of forest tree diversity and structure in Southeastern Ghana’, Agroforestry Systems, 79(3), pp. 355-368. [CrossRef]
- Abreha, A. and Gebrekidan, W. (2014) ‘Woody plant inventory and diversity in traditional agroforestry of selected peasant association of South Gonder Zone, North West Ethiopia’, Journal of Environment and Earth Science, 4(15). pp.1-16.
- Körner, Ch. (2000) ‘Why are there global gradients in species richness? Mountains might hold the answer’, Correspondence, 15(12). pp.513-514.
- Wang, W., Wang, Q., Li, S. and Wang, G. (2006) ‘Distribution and Species Diversity of Plant Communities along Transect on the Northeastern Tibetan Plateau’, Biodiversity and Conservation, 15(5), pp. 1811-1828. [CrossRef]
- Shimono, A., Zhou, H., Shen, H., Hirota, M., Ohtsuka, T. and Tang, Y. (2010) ‘Patterns of plant diversity at high altitudes on the Qinghai-Tibetan Plateau’, Journal of Plant Ecology, 3(1), pp. 1-7. [CrossRef]
- Luzuriaga, A.L. and Escudero, A. (2011) ‘What Factors Affect Diversity and Species Composition of Endangered Tumbesian Dry Forests in Southern Ecuador’? Biotropica, 43(1) pp. 15–22. [CrossRef]
- Ma, M. (2005) ‘Species richness vs evenness: independent relationship and different responses to edaphic factors’, Oikos 111(1), pp. 192-198. [CrossRef]
Disclaimer/Publisher’s Note: The statements, opinions and data contained in all publications are solely those of the individual author(s) and contributor(s) and not of MDPI and/or the editor(s). MDPI and/or the editor(s) disclaim responsibility for any injury to people or property resulting from any ideas, methods, instructions or products referred to in the content. |
© 2023 by the authors. Licensee MDPI, Basel, Switzerland. This article is an open access article distributed under the terms and conditions of the Creative Commons Attribution (CC BY) license (http://creativecommons.org/licenses/by/4.0/).


