Submitted:
06 December 2023
Posted:
07 December 2023
You are already at the latest version
Abstract
Keywords:
1. Introduction
2. Materials and Methods
2.1. Governing Equations and Computational Solver of OpenFOAM Library
3. Results
3.1. Solver Validation
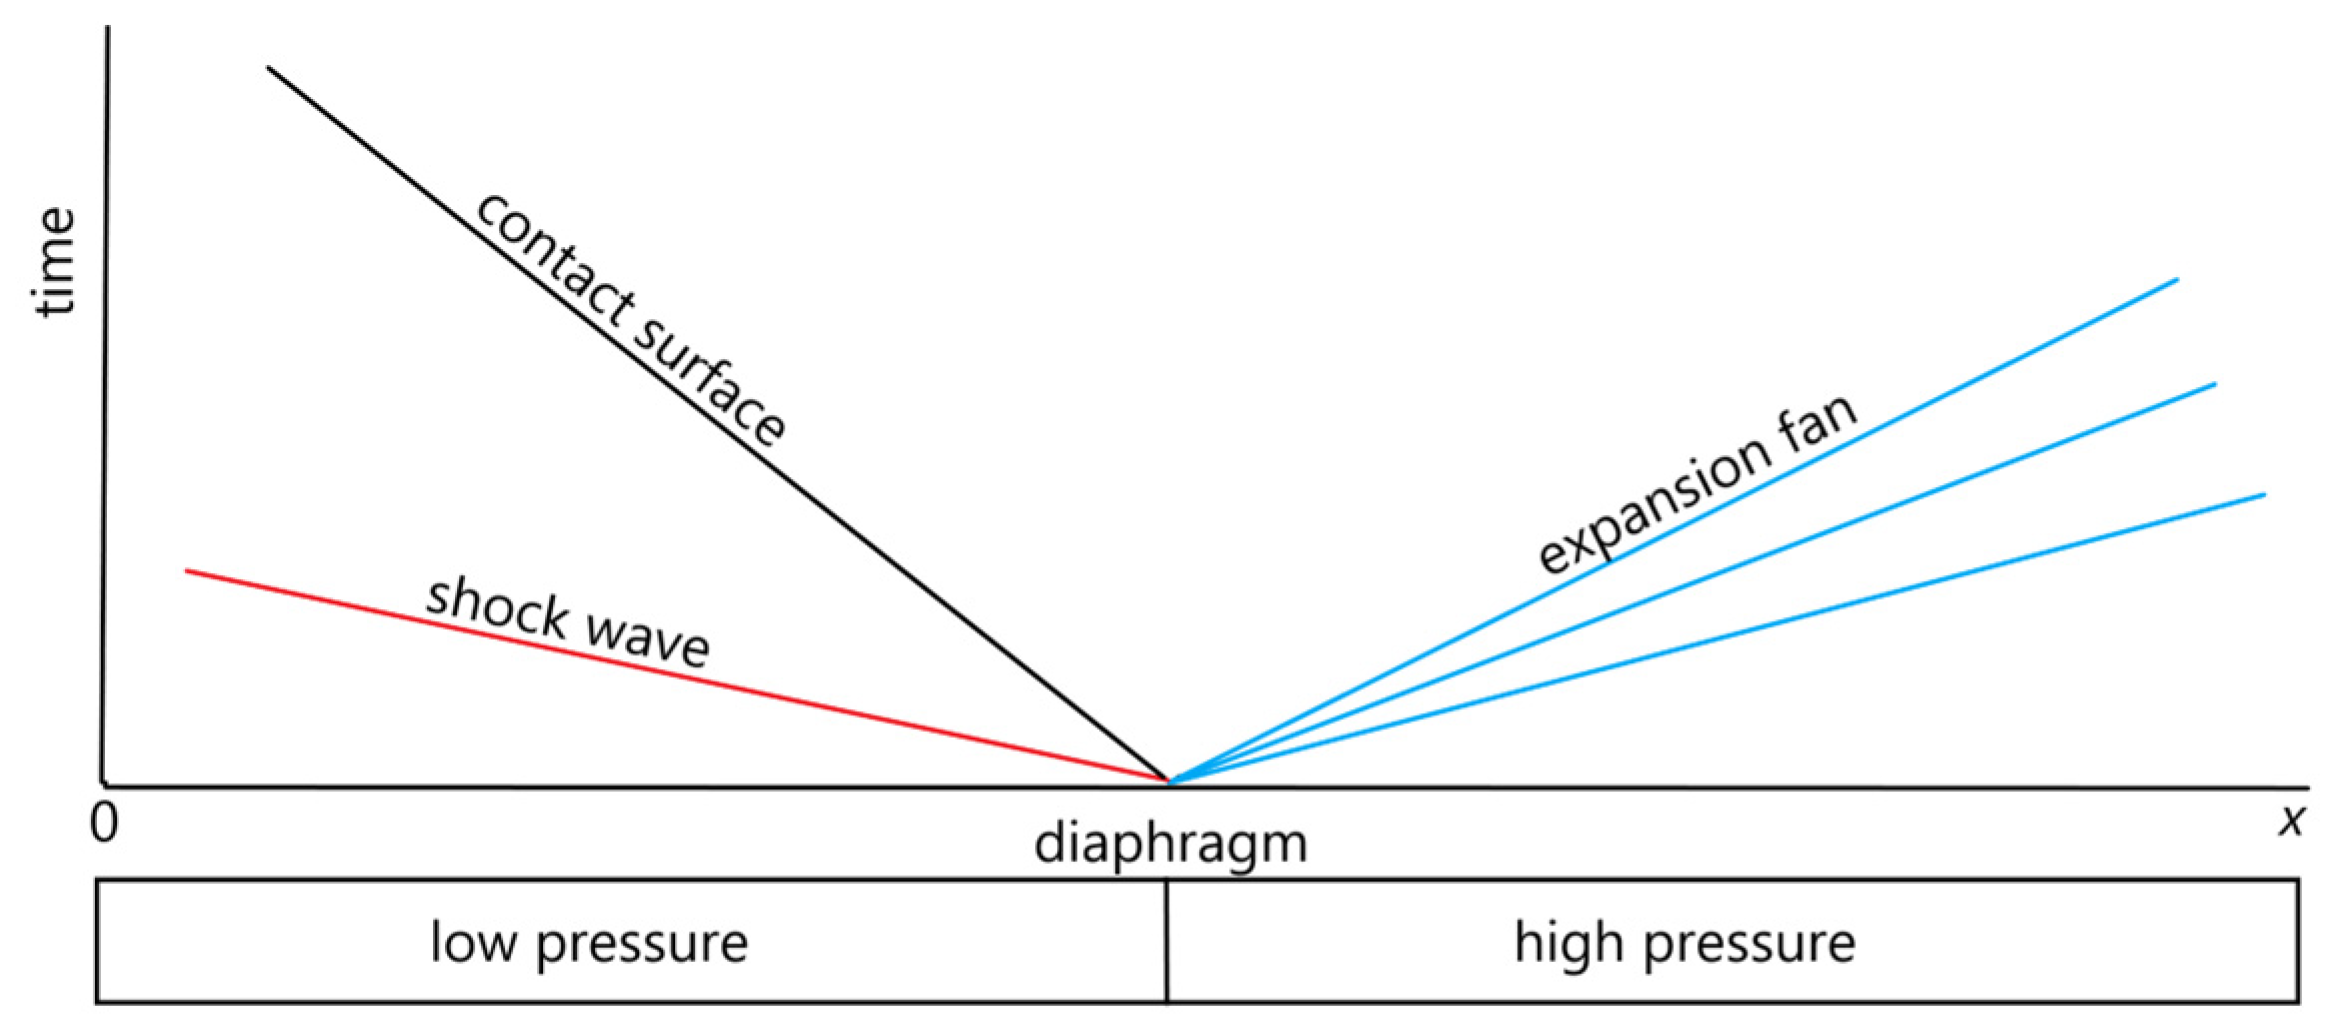
3.1.1. Shock Tube Problem.
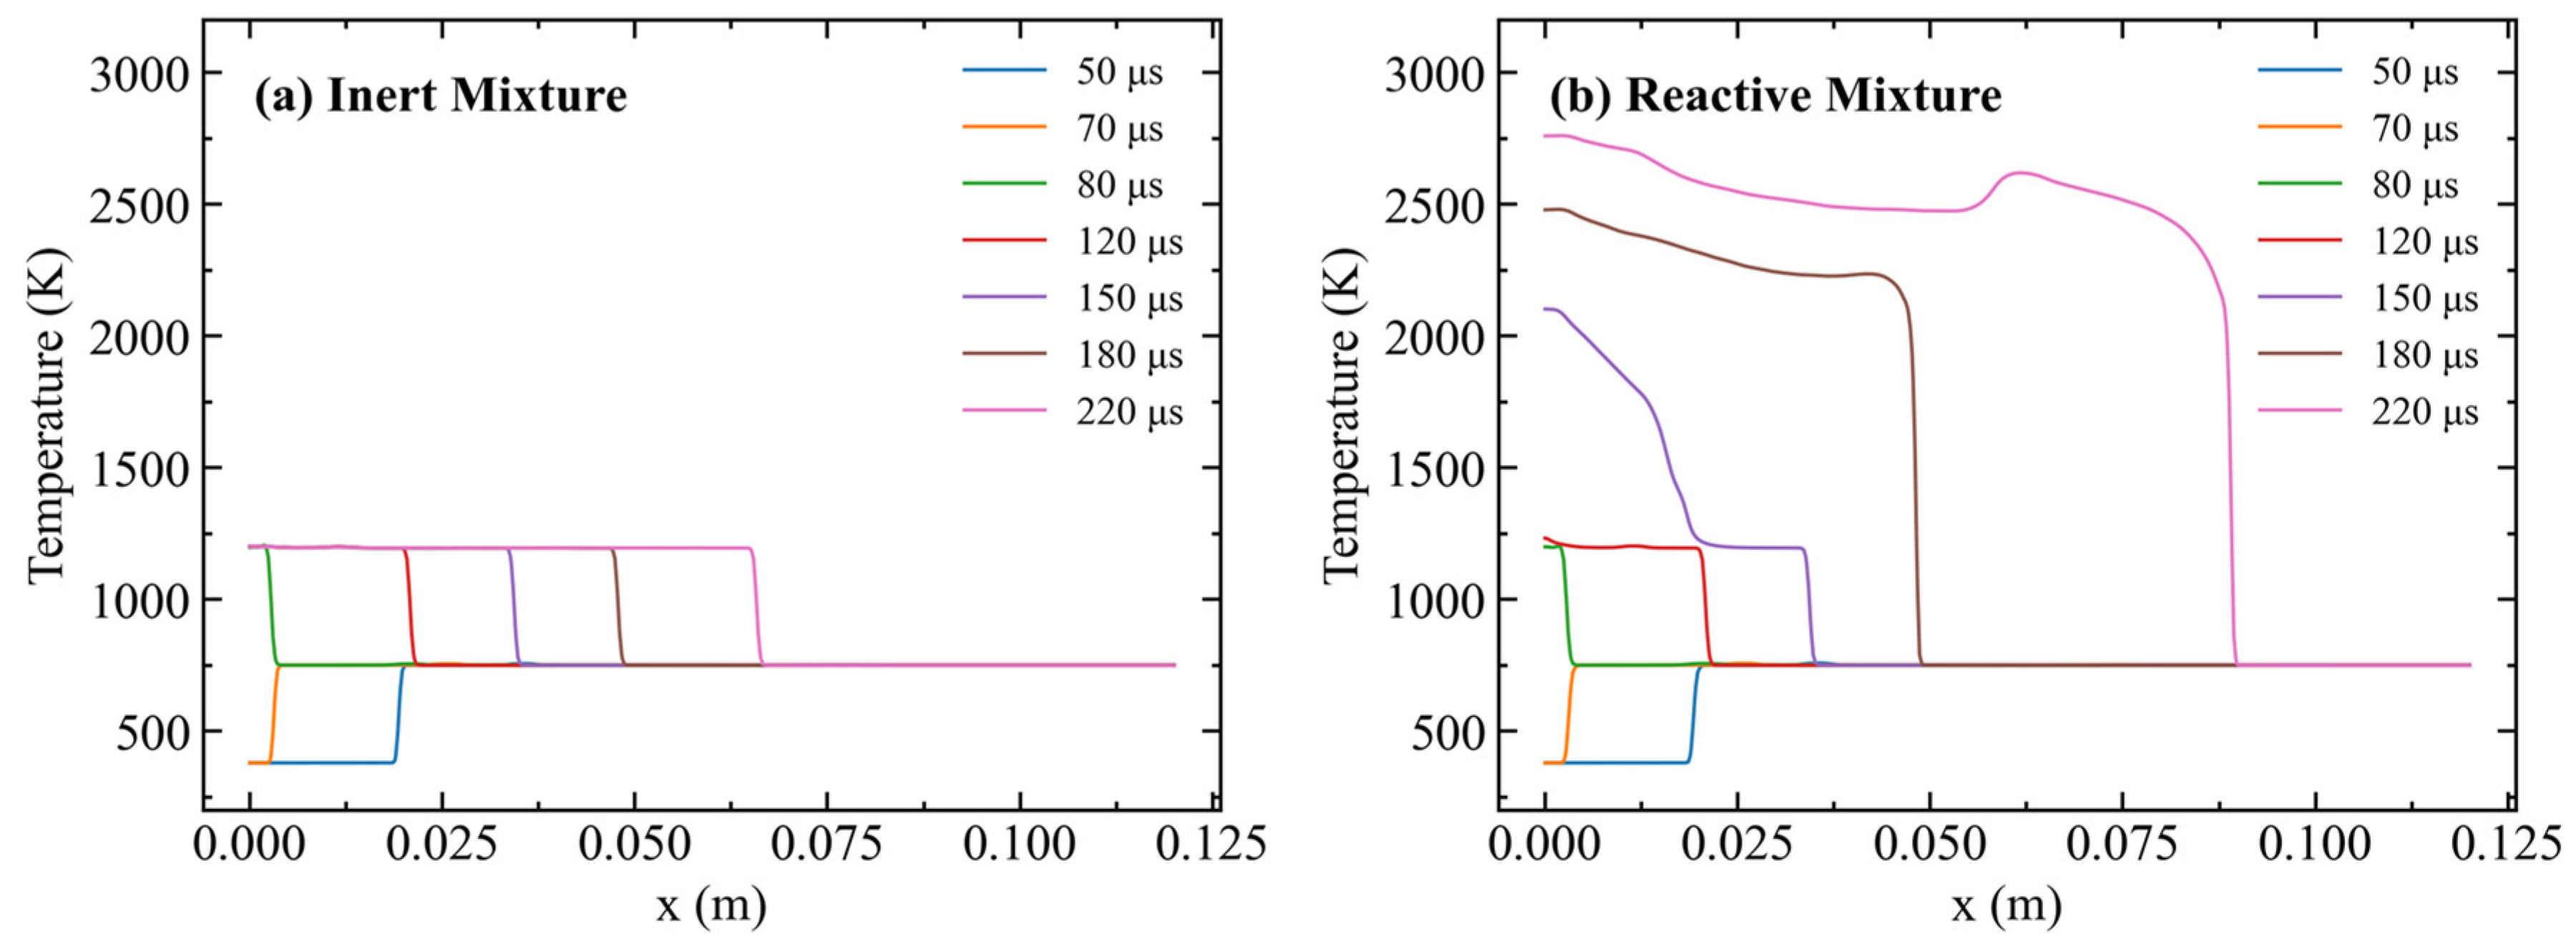
- Inert Multicomponent Shock Tube
- Reactive Multicomponent Shock Tube
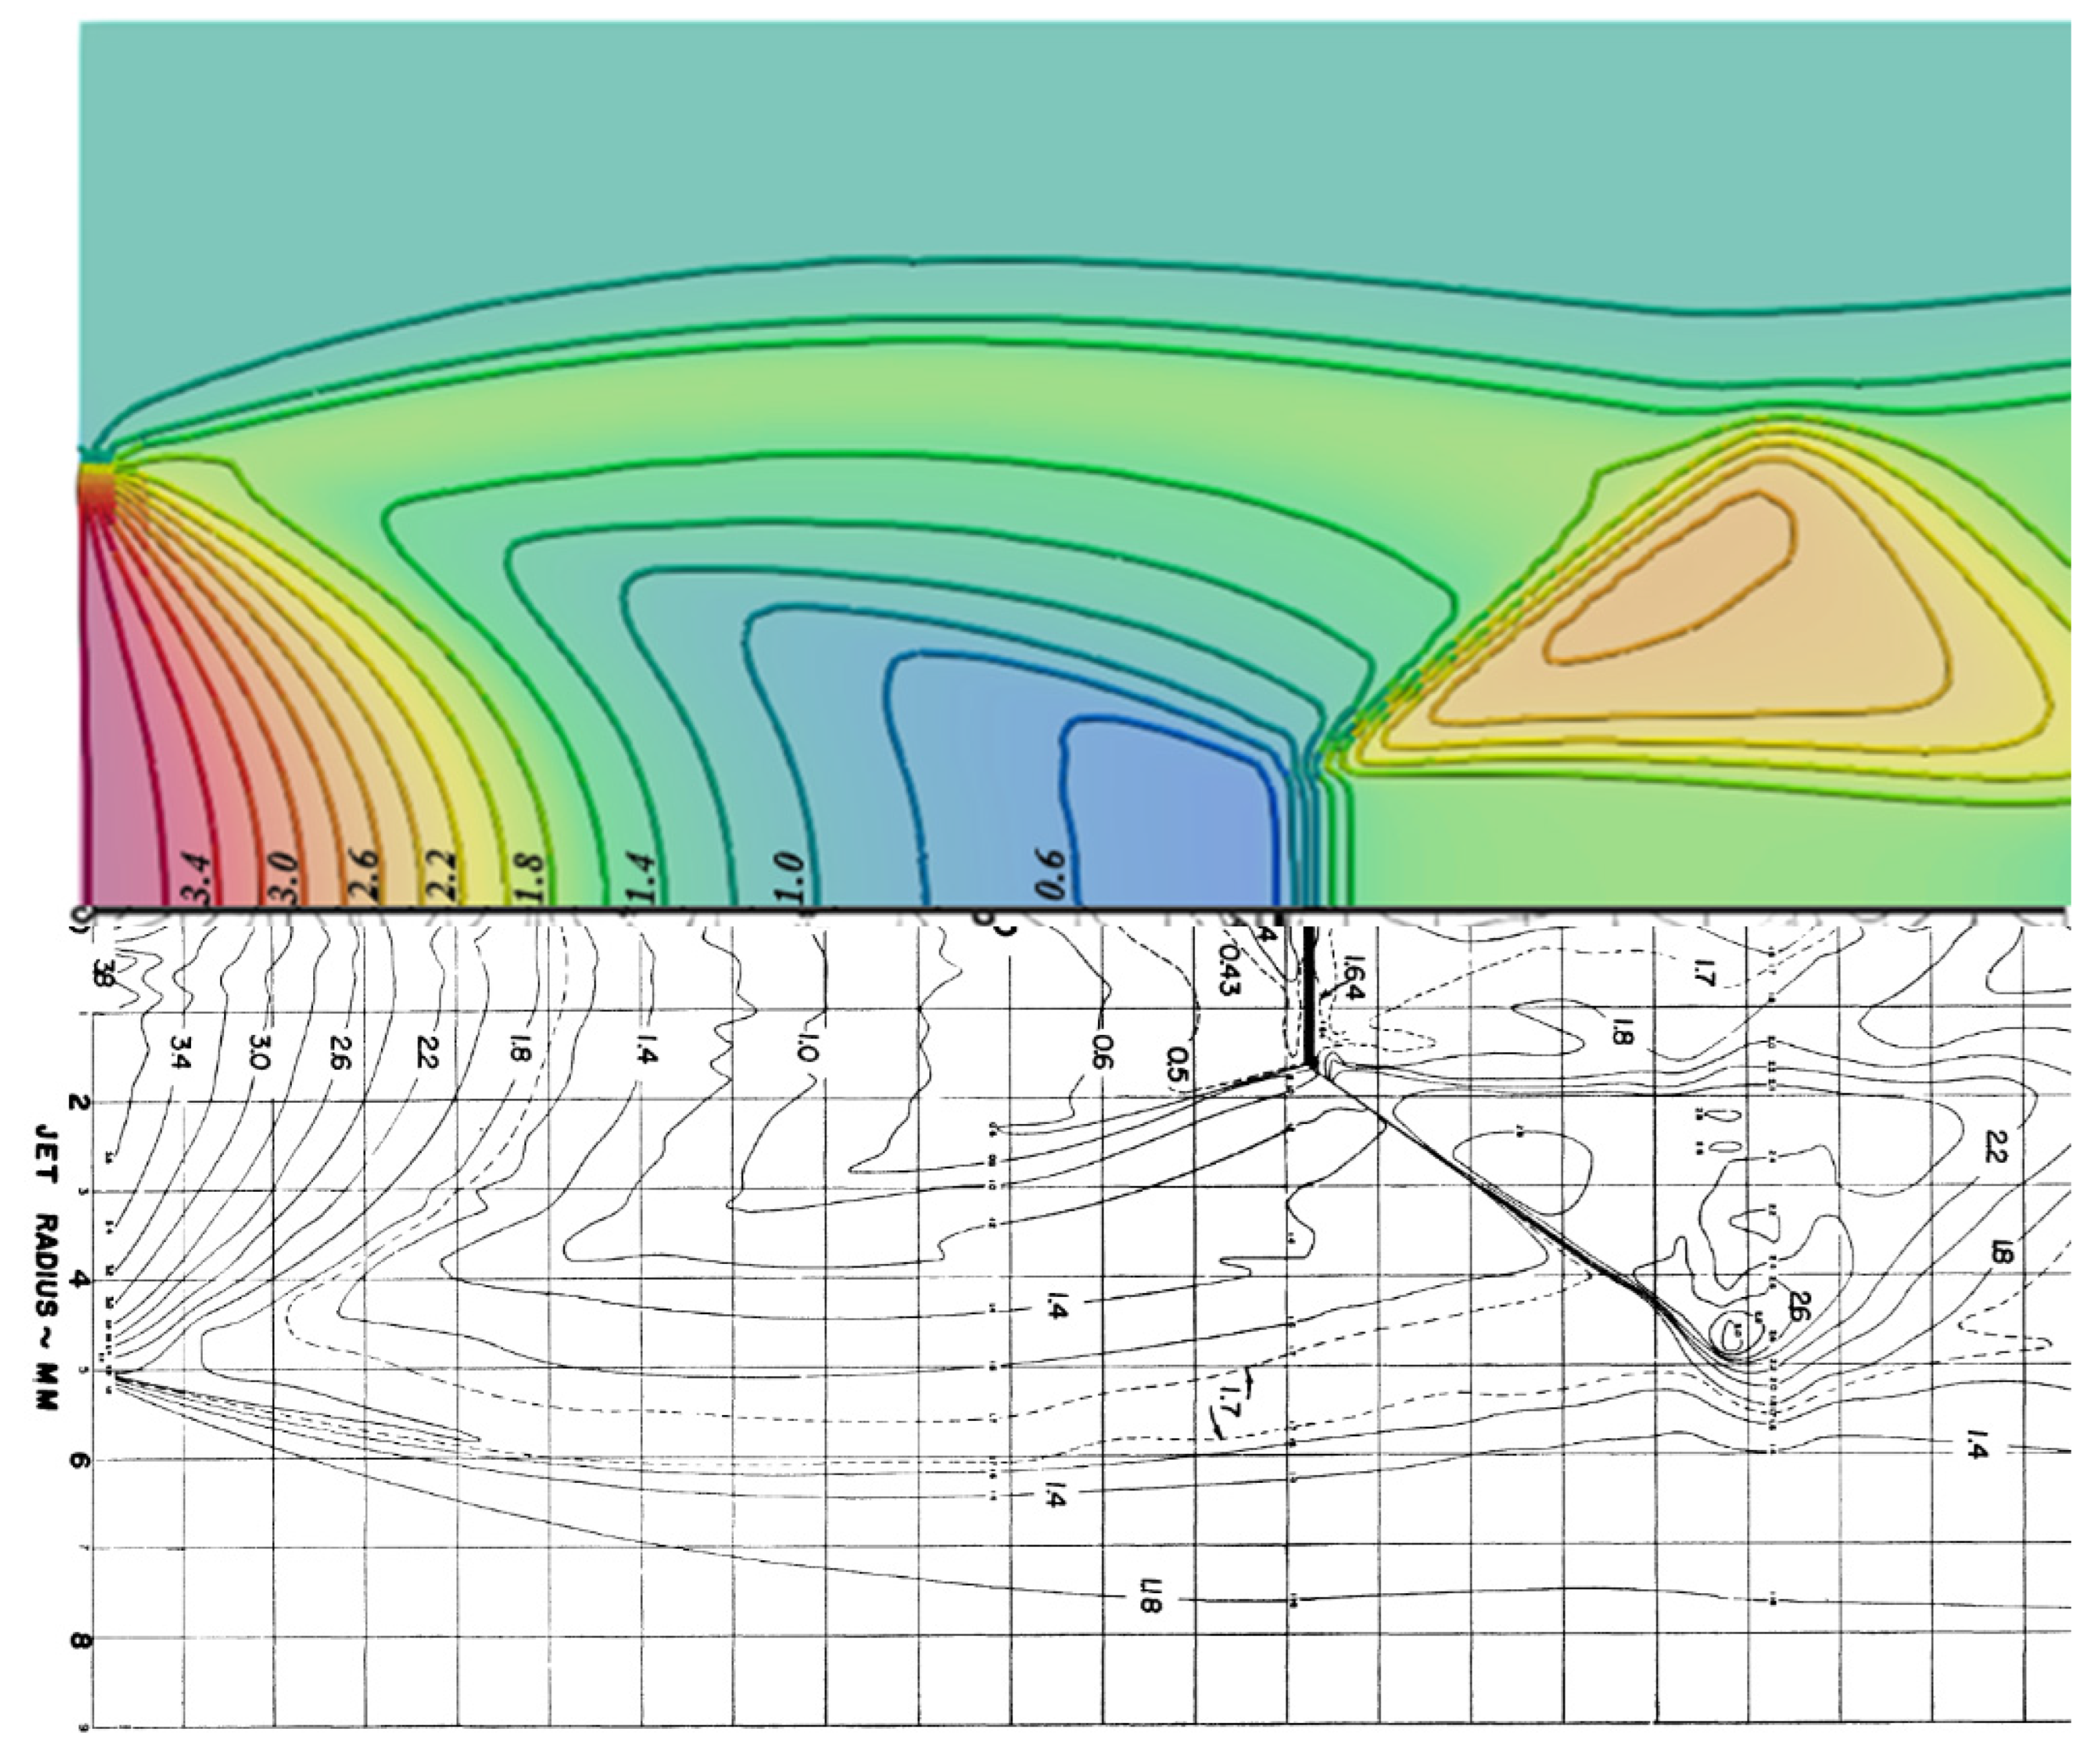
3.1.2. Simulation of Ladenburg Jet Problem.
3.1.3. Simulation of DLR Scramjet Combustor
- Simulation of Cold Flow DLR Combustor
- Simulation of Reacting Flow DLR Combustor
- Influence of Turbulent Models on Scramjet Combustion
- Analysis of Turbulence-Combustion Interaction in Scramjet Combustor
4. Conclusions
Author Contributions
Funding
Conflicts of Interest
References
- J. Urzay, “Supersonic Combustion in Air-Breathing Propulsion Systems for Hypersonic Flight,” Annual Review of Fluid Mechanics, vol. 50, no. 1, pp. 593–627, 2018, doi: 10.1146/annurev-fluid-122316-045217. [CrossRef]
- C. Fureby, “Large eddy simulation modelling of combustion for propulsion applications,” Philosophical Transactions of the Royal Society A: Mathematical, Physical and Engineering Sciences, vol. 367, no. 1899, pp. 2957–2969, Jul. 2009, doi: 10.1098/rsta.2008.0271. [CrossRef]
- G. A. Q. Abdulrahman, N. A. A. Qasem, B. Imteyaz, A. M. Abdallah, and M. A. Habib, “A review of aircraft subsonic and supersonic combustors,” Aerospace Science and Technology, vol. 132, p. 108067, Jan. 2023, doi: 10.1016/j.ast.2022.108067. [CrossRef]
- S. O’Byrne, M. Doolan, S. R. Olsen, and A. F. P. Houwing, “Measurement and imaging of supersonic combustion in a model scramjet engine,” Shock Waves, vol. 9, no. 4, pp. 221–226, Aug. 1999, doi: 10.1007/s001930050159. [CrossRef]
- S. Menon, V. Sankaran, and C. Stone, “Subgrid Combustion Modeling for the Next Generation National Combustion Code,” CCL-02–003, Apr. 2003. Accessed: Nov. 30, 2023. [Online]. Available: https://ntrs.nasa.gov/citations/20030038812.
- S. Menon and C. Fureby, “Computational Combustion,” in Encyclopedia of Aerospace Engineering, John Wiley & Sons, Ltd, 2010. doi: 10.1002/9780470686652.eae063. [CrossRef]
- Pierre Sagaut, Large Eddy Simulation for Incompressible Flows. in Scientific Computation. Berlin/Heidelberg: Springer-Verlag, 2006. doi: 10.1007/b137536. [CrossRef]
- T. Echekki and E. Mastorakos, Eds., Turbulent Combustion Modeling: Advances, New Trends and Perspectives, vol. 95. in Fluid Mechanics and Its Applications, vol. 95. Dordrecht: Springer Netherlands, 2011. doi: 10.1007/978-94-007-0412-1. [CrossRef]
- E. R. Hawkes, R. Sankaran, J. C. Sutherland, and J. H. Chen, “Direct numerical simulation of turbulent combustion: fundamental insights towards predictive models,” J. Phys.: Conf. Ser., vol. 16, no. 1, p. 65, Jan. 2005, doi: 10.1088/1742-6596/16/1/009. [CrossRef]
- L. F. Gutiérrez, Universidad Nacional de Córdoba-IDIT(CONICET), J. Tamagno, Univeridad Nacional de Córdoba, S. A. Elaskar, and Univeridad Nacional de Córdoba-CONICET, “RANS Simulation of Turbulent Diffusive Combustion using Open Foam,” JAFM, vol. 9, no. 2, pp. 669–682, Mar. 2016, doi: 10.18869/acadpub.jafm.68.225.24104. [CrossRef]
- A. Ingenito and C. Bruno, “Physics and Regimes of Supersonic Combustion,” AIAA Journal, vol. 48, no. 3, pp. 515–525, 2010, doi: 10.2514/1.43652. [CrossRef]
- F. Génin and S. Menon, “Simulation of Turbulent Mixing Behind a Strut Injector in Supersonic Flow,” AIAA Journal, vol. 48, no. 3, pp. 526–539, Mar. 2010, doi: 10.2514/1.43647. [CrossRef]
- C. Fureby, K. Nordin-Bates, K. Petterson, A. Bresson, and V. Sabelnikov, “A computational study of supersonic combustion in strut injector and hypermixer flow fields,” Proceedings of the Combustion Institute, vol. 35, no. 2, pp. 2127–2135, Jan. 2015, doi: 10.1016/j.proci.2014.06.113. [CrossRef]
- C. Fureby, G. Sahut, A. Ercole, and T. Nilsson, “Large Eddy Simulation of Combustion for High-Speed Airbreathing Engines,” Aerospace, vol. 9, no. 12, Art. no. 12, Dec. 2022, doi: 10.3390/aerospace9120785. [CrossRef]
- P. Gokulakrishnan et al., “LES-PDF Modeling of Flame Instability and Blow-out in Bluff-Body Stabilized Flames,” in 45th AIAA/ASME/SAE/ASEE Joint Propulsion Conference & Exhibit, in Joint Propulsion Conferences. , American Institute of Aeronautics and Astronautics, 2009. doi: 10.2514/6.2009-5409. [CrossRef]
- P. Gokulakrishnan, R. Bikkani, M. Klassen, R. Roby, and B. Kiel, “Influence of Turbulence-Chemistry Interaction in Blow-out Predictions of Bluff-Body Stabilized Flames,” in 47th AIAA Aerospace Sciences Meeting including The New Horizons Forum and Aerospace Exposition, in Aerospace Sciences Meetings. , American Institute of Aeronautics and Astronautics, 2009. doi: 10.2514/6.2009-1179. [CrossRef]
- A. Dasgupta, E. Gonzalez-Juez, and D. C. Haworth, “Flame simulations with an open-source code,” Computer Physics Communications, vol. 237, pp. 219–229, Apr. 2019, doi: 10.1016/j.cpc.2018.11.011. [CrossRef]
- E. D. Gonzalez-Juez, A. Dasgupta, S. Arshad, M. Oevermann, and D. Lignell, “Effect of the turbulence modeling in large-eddy simulations of nonpremixed flames undergoing extinction and reignition,” in AIAA SciTech Forum - 55th AIAA Aerospace Sciences Meeting, 2017. doi: 10.2514/6.2017-0604. [CrossRef]
- E. D. Gonzalez-Juez, A. R. Kerstein, R. Ranjan, and S. Menon, “Advances and challenges in modeling high-speed turbulent combustion in propulsion systems,” Progress in Energy and Combustion Science, vol. 60, pp. 26–67, May 2017, doi: 10.1016/j.pecs.2016.12.003. [CrossRef]
- N. Peters, Turbulent Combustion, 1st edition. Cambridge: Cambridge University Press, 2000.
- S. B. Pope, “Small scales, many species and the manifold challenges of turbulent combustion,” Proceedings of the Combustion Institute, vol. 34, no. 1, pp. 1–31, Jan. 2013, doi: 10.1016/j.proci.2012.09.009. [CrossRef]
- S. Huang, Q. Chen, Y. Cheng, J. Xian, and Z. Tai, “Supersonic Combustion Modeling and Simulation on General Platforms,” Aerospace, vol. 9, no. 7, Art. no. 7, Jul. 2022, doi: 10.3390/aerospace9070366. [CrossRef]
- M. Piasecka, A. Piasecki, and N. Dadas, “Experimental Study and CFD Modeling of Fluid Flow and Heat Transfer Characteristics in a Mini-Channel Heat Sink Using Simcenter STAR-CCM+ Software,” Energies, vol. 15, no. 2, Art. no. 2, Jan. 2022, doi: 10.3390/en15020536. [CrossRef]
- J. R. Edwards and J. A. Fulton, “Development of a RANS and LES/RANS Flow Solver for High-Speed Engine Flowpath Simulations,” in 20th AIAA International Space Planes and Hypersonic Systems and Technologies Conference, in International Space Planes and Hypersonic Systems and Technologies Conferences. , American Institute of Aeronautics and Astronautics, 2015. doi: 10.2514/6.2015-3570. [CrossRef]
- C. Nelson, “An Overview of the NPARC Alliance’s Wind-US Flow Solver,” in 48th AIAA Aerospace Sciences Meeting Including the New Horizons Forum and Aerospace Exposition, in Aerospace Sciences Meetings. , American Institute of Aeronautics and Astronautics, 2010. doi: 10.2514/6.2010-27. [CrossRef]
- J. Steelant, A. Mack, K. Hannemann, and A. Gardner, “Comparison of Supersonic Combustion Tests with Shock Tunnels, Flight and CFD,” in 42nd AIAA/ASME/SAE/ASEE Joint Propulsion Conference & Exhibit, in Joint Propulsion Conferences. , American Institute of Aeronautics and Astronautics, 2006. doi: 10.2514/6.2006-4684. [CrossRef]
- J. P. Drummond, P. M. Danehy, R. L. Gaffney, S. A. Tedder, A. D. Cutler, and D. Bivolaru, “Supersonic Combustion Research at NASA,” presented at the 2007 Fall Technical Meeting - Eastern States Section of the Combustion Institute, Charlotesville, VA, Oct. 2007. Accessed: Nov. 30, 2023. [Online]. Available: https://ntrs.nasa.gov/citations/20080013391.
- F. Palacios et al., “Stanford University Unstructured (SU 2 ): Open-source Analysis and Design Technology for Turbulent Flows,” 2014. Accessed: Nov. 30, 2023. [Online]. Available: https://www.semanticscholar.org/paper/Stanford-University-Unstructured-(SU-2-)%3A-Analysis-Palacios-Economon/3b6dd8951b4d1e30fca73c8e737585ec920d81b0.
- H. G. Weller, G. Tabor, H. Jasak, and C. Fureby, “A tensorial approach to computational continuum mechanics using object-oriented techniques,” Computers in Physics, vol. 12, no. 6, pp. 620–631, Nov. 1998, doi: 10.1063/1.168744. [CrossRef]
- H. Zhang, M. Zhao, and Z. Huang, “Large eddy simulation of turbulent supersonic hydrogen flames with OpenFOAM,” Fuel, vol. 282, p. 118812, Dec. 2020, doi: 10.1016/j.fuel.2020.118812. [CrossRef]
- M. Chapuis, E. Fedina, C. Fureby, K. Hannemann, S. Karl, and J. Martinez Schramm, “A computational study of the HyShot II combustor performance,” Proceedings of the Combustion Institute, vol. 34, no. 2, pp. 2101–2109, Jan. 2013, doi: 10.1016/j.proci.2012.07.014. [CrossRef]
- N. Droeske, K. Makowka, P. Nizenkov, J. J. Vellaramkalayil, T. Sattelmayer, and J. von Wolfersdorf, “Validation of a Novel OpenFOAM Solver using a Supersonic, Non-reacting Channel Flow,” in 19th AIAA International Space Planes and Hypersonic Systems and Technologies Conference, in AIAA AVIATION Forum. , American Institute of Aeronautics and Astronautics, 2014. doi: 10.2514/6.2014-3088. [CrossRef]
- K. Makowka, N. Droeske, J. J. Vellaramkalayil, T. Sattelmayer, and J. von Wolfersdorf, “Unsteady RANS Investigation of a Hydrogen-Fueled Staged Supersonic Combustor with Lobed Injectors,” in 19th AIAA International Space Planes and Hypersonic Systems and Technologies Conference, in AIAA AVIATION Forum. , American Institute of Aeronautics and Astronautics, 2014. doi: 10.2514/6.2014-3215. [CrossRef]
- Martínez-Ferrer, P.J., R. Buttay, G. Lehnasch, and A. Mura, “A detailed verification procedure for compressible reactive multicomponent Navier–Stokes solvers,” Computers & Fluids, vol. 89, pp. 88–110, Jan. 2014, doi: 10.1016/j.compfluid.2013.10.014. [CrossRef]
- Z. Huang, G. He, F. Qin, and X. Wei, “Large eddy simulation of flame structure and combustion mode in a hydrogen fueled supersonic combustor,” International Journal of Hydrogen Energy, vol. 40, no. 31, pp. 9815–9824, Aug. 2015, doi: 10.1016/j.ijhydene.2015.06.011. [CrossRef]
- C. J. Arisman and C. T. Johansen, “Nitric Oxide Chemistry Effects in Hypersonic Boundary Layers,” AIAA Journal, vol. 53, no. 12, pp. 3652–3660, 2015, doi: 10.2514/1.J053979. [CrossRef]
- D. Zhou, S. Zou, and S. Yang, “An OpenFOAM-based fully compressible reacting flow solver with detailed transport and chemistry for high-speed combustion simulations,” in AIAA Scitech 2020 Forum, in AIAA SciTech Forum. , American Institute of Aeronautics and Astronautics, 2020. doi: 10.2514/6.2020-0872. [CrossRef]
- J.-J. O. Hoste, V. Casseau, M. Fossati, I. J. Taylor, and R. Gollan, “Numerical Modeling and Simulation of Supersonic Flows in Propulsion Systems by Open-Source Solvers,” in 21st AIAA International Space Planes and Hypersonics Technologies Conference, in International Space Planes and Hypersonic Systems and Technologies Conferences. , American Institute of Aeronautics and Astronautics, 2017. doi: 10.2514/6.2017-2411. [CrossRef]
- A. Kurganov and E. Tadmor, “New High-Resolution Central Schemes for Nonlinear Conservation Laws and Convection–Diffusion Equations,” Journal of Computational Physics, vol. 160, no. 1, pp. 241–282, May 2000, doi: 10.1006/jcph.2000.6459. [CrossRef]
- A. Kurganov, S. Noelle, and G. Petrova, “Semidiscrete Central-Upwind Schemes for Hyperbolic Conservation Laws and Hamilton--Jacobi Equations,” SIAM J. Sci. Comput., vol. 23, no. 3, pp. 707–740, Jan. 2001, doi: 10.1137/S1064827500373413. [CrossRef]
- C. J. Greenshields, H. G. Weller, L. Gasparini, and J. M. Reese, “Implementation of semi-discrete, non-staggered central schemes in a colocated, polyhedral, finite volume framework, for high-speed viscous flows,” International Journal for Numerical Methods in Fluids, vol. 63, no. 1, pp. 1–21, 2010, doi: 10.1002/fld.2069. [CrossRef]
- 2306.
- J. Smagorinsky, “General Circulation Experiments with the Primitive Equations,” Monthly Weather Review, vol. 91, p. 99, Jan. 1963, doi: 10.1175/1520-0493(1963)091<0099:GCEWTP>2.3.CO;2. [CrossRef]
- G. Erlebacher, M. Y. Hussaini, C. G. Speziale, and T. A. Zang, “Toward the large-eddy simulation of compressible turbulent flows,” Journal of Fluid Mechanics, vol. 238, pp. 155–185, May 1992, doi: 10.1017/S0022112092001678. [CrossRef]
- W.-W. Kim and S. Menon, “A new dynamic one-equation subgrid-scale model for large eddy simulations,” in 33rd Aerospace Sciences Meeting and Exhibit, in Aerospace Sciences Meetings. , American Institute of Aeronautics and Astronautics, 1995. doi: 10.2514/6.1995-356. [CrossRef]
- S. Huang and Q. S. Li, “A new dynamic one-equation subgrid-scale model for large eddy simulations,” International Journal for Numerical Methods in Engineering, vol. 81, no. 7, pp. 835–865, 2010, doi: 10.1002/nme.2715. [CrossRef]
- F. Nicoud and F. Ducros, “Subgrid-Scale Stress Modelling Based on the Square of the Velocity Gradient Tensor,” Flow, Turbulence and Combustion, vol. 62, no. 3, pp. 183–200, Sep. 1999, doi: 10.1023/A:1009995426001. [CrossRef]
- M. Berglund, E. Fedina, C. Fureby, J. Tegnér, and V. Sabel’nikov, “Finite Rate Chemistry Large-Eddy Simulation of Self-Ignition in Supersonic Combustion Ramjet,” AIAA Journal, vol. 48, no. 3, pp. 540–550, Mar. 2010, doi: 10.2514/1.43746. [CrossRef]
- V. Sabelnikov and C. Fureby, “Extended LES-PaSR model for simulation of turbulent combustion,” in Progress in Propulsion Physics, EDP Sciences, 2013, pp. 539–568. doi: 10.1051/eucass/201304539. [CrossRef]
- E. Baudoin, R. Yu, Bai, K. J. Nogenmur, X.-S. Bai, and C. Fureby, “Comparison of LES Models Applied to a Bluff Body Stabilized Flame,” in 47th AIAA Aerospace Sciences Meeting including The New Horizons Forum and Aerospace Exposition, American Institute of Aeronautics and Astronautics. doi: 10.2514/6.2009-1178. [CrossRef]
- B. Magnussen, “On the structure of turbulence and a generalized eddy dissipation concept for chemical reaction in turbulent flow,” in 19th Aerospace Sciences Meeting, American Institute of Aeronautics and Astronautics. doi: 10.2514/6.1981-42. [CrossRef]
- G. A. Sod, “A survey of several finite difference methods for systems of nonlinear hyperbolic conservation laws,” Journal of Computational Physics, vol. 27, no. 1, pp. 1–31, Apr. 1978, doi: 10.1016/0021-9991(78)90023-2. [CrossRef]
- Z. Huang, M. Zhao, Y. Xu, G. Li, and H. Zhang, “Eulerian-Lagrangian modelling of detonative combustion in two-phase gas-droplet mixtures with OpenFOAM: Validations and verifications,” Fuel, vol. 286, p. 119402, Feb. 2021, doi: 10.1016/j.fuel.2020.119402. [CrossRef]
- M. Ó Conaire, H. J. Curran, J. M. Simmie, W. J. Pitz, and C. K. Westbrook, “A comprehensive modeling study of hydrogen oxidation,” International Journal of Chemical Kinetics, vol. 36, no. 11, pp. 603–622, 2004, doi: 10.1002/kin.20036. [CrossRef]
- R. Ladenburg, C. C. Van Voorhis, and J. Winckler, “Interferometric Studies of Faster than Sound Phenomena. Part II. Analysis of Supersonic Air Jets,” Phys. Rev., vol. 76, no. 5, pp. 662–677, Sep. 1949, doi: 10.1103/PhysRev.76.662. [CrossRef]
- M. Talukdar, “Numerical simulation of underexpanded air jet using OpenFOAM,” Master thesis, University of Stavanger, Norway, 2015. Accessed: Nov. 30, 2023. [Online]. Available: https://uis.brage.unit.no/uis-xmlui/handle/11250/302085.
- F. Alff, U. Brummund, W. Clauss, M. Oschwald, J. Sender, and W. Waidmann, Experimental Investigation of the Combustion Process in a Supersonic Combustion Ramjet (SCRAMJET) Combustion Chamber. 1994, p. 638.
- M. Oevermann, “Numerical investigation of turbulent hydrogen combustion in a SCRAMJET using flamelet modeling,” Aerospace Science and Technology, vol. 4, no. 7, pp. 463–480, Oct. 2000, doi: 10.1016/S1270-9638(00)01070-1. [CrossRef]
- U. Maas and J. Warnatz, “Ignition processes in hydrogenoxygen mixtures,” Combustion and Flame, vol. 74, no. 1, pp. 53–69, Oct. 1988, doi: 10.1016/0010-2180(88)90086-7. [CrossRef]
- M. Berglund and C. Fureby, “LES of supersonic combustion in a scramjet engine model,” Proceedings of the Combustion Institute, vol. 31, no. 2, pp. 2497–2504, Jan. 2007, doi: 10.1016/j.proci.2006.07.074. [CrossRef]
- H. Yamashita, M. Shimada, and T. Takeno, “A numerical study on flame stability at the transition point of jet diffusion flames,” Symposium (International) on Combustion, vol. 26, no. 1, pp. 27–34, Jan. 1996, doi: 10.1016/S0082-0784(96)80196-2. [CrossRef]
- R. W. Bilger, “Some Aspects of Scalar Dissipation,” Flow, Turbulence and Combustion, vol. 72, no. 2, pp. 93–114, Jun. 2004, doi: 10.1023/B:APPL.0000044404.24369.f1. [CrossRef]
- J. Warnatz · U. Maas · R.W. Dibble, Combustion. Springer Berlin Heidelberg, 2006. doi: 10.1007/978-3-540-45363-5. [CrossRef]
- T. Poinsot and D. Veynante, Theoretical and Numerical Combustion, Second Edition, 2nd edition. Philadelphia: R T Edwards Inc, 2005.








Disclaimer/Publisher’s Note: The statements, opinions and data contained in all publications are solely those of the individual author(s) and contributor(s) and not of MDPI and/or the editor(s). MDPI and/or the editor(s) disclaim responsibility for any injury to people or property resulting from any ideas, methods, instructions or products referred to in the content. |
© 2023 by the authors. Licensee MDPI, Basel, Switzerland. This article is an open access article distributed under the terms and conditions of the Creative Commons Attribution (CC BY) license (http://creativecommons.org/licenses/by/4.0/).


