Submitted:
07 December 2023
Posted:
07 December 2023
You are already at the latest version
Abstract
Keywords:
1. Introduction
2. Materials and Methods
3. Results and Discussion
3.1. Structural and microstructural analysis
3.1.1. PXRD analysis
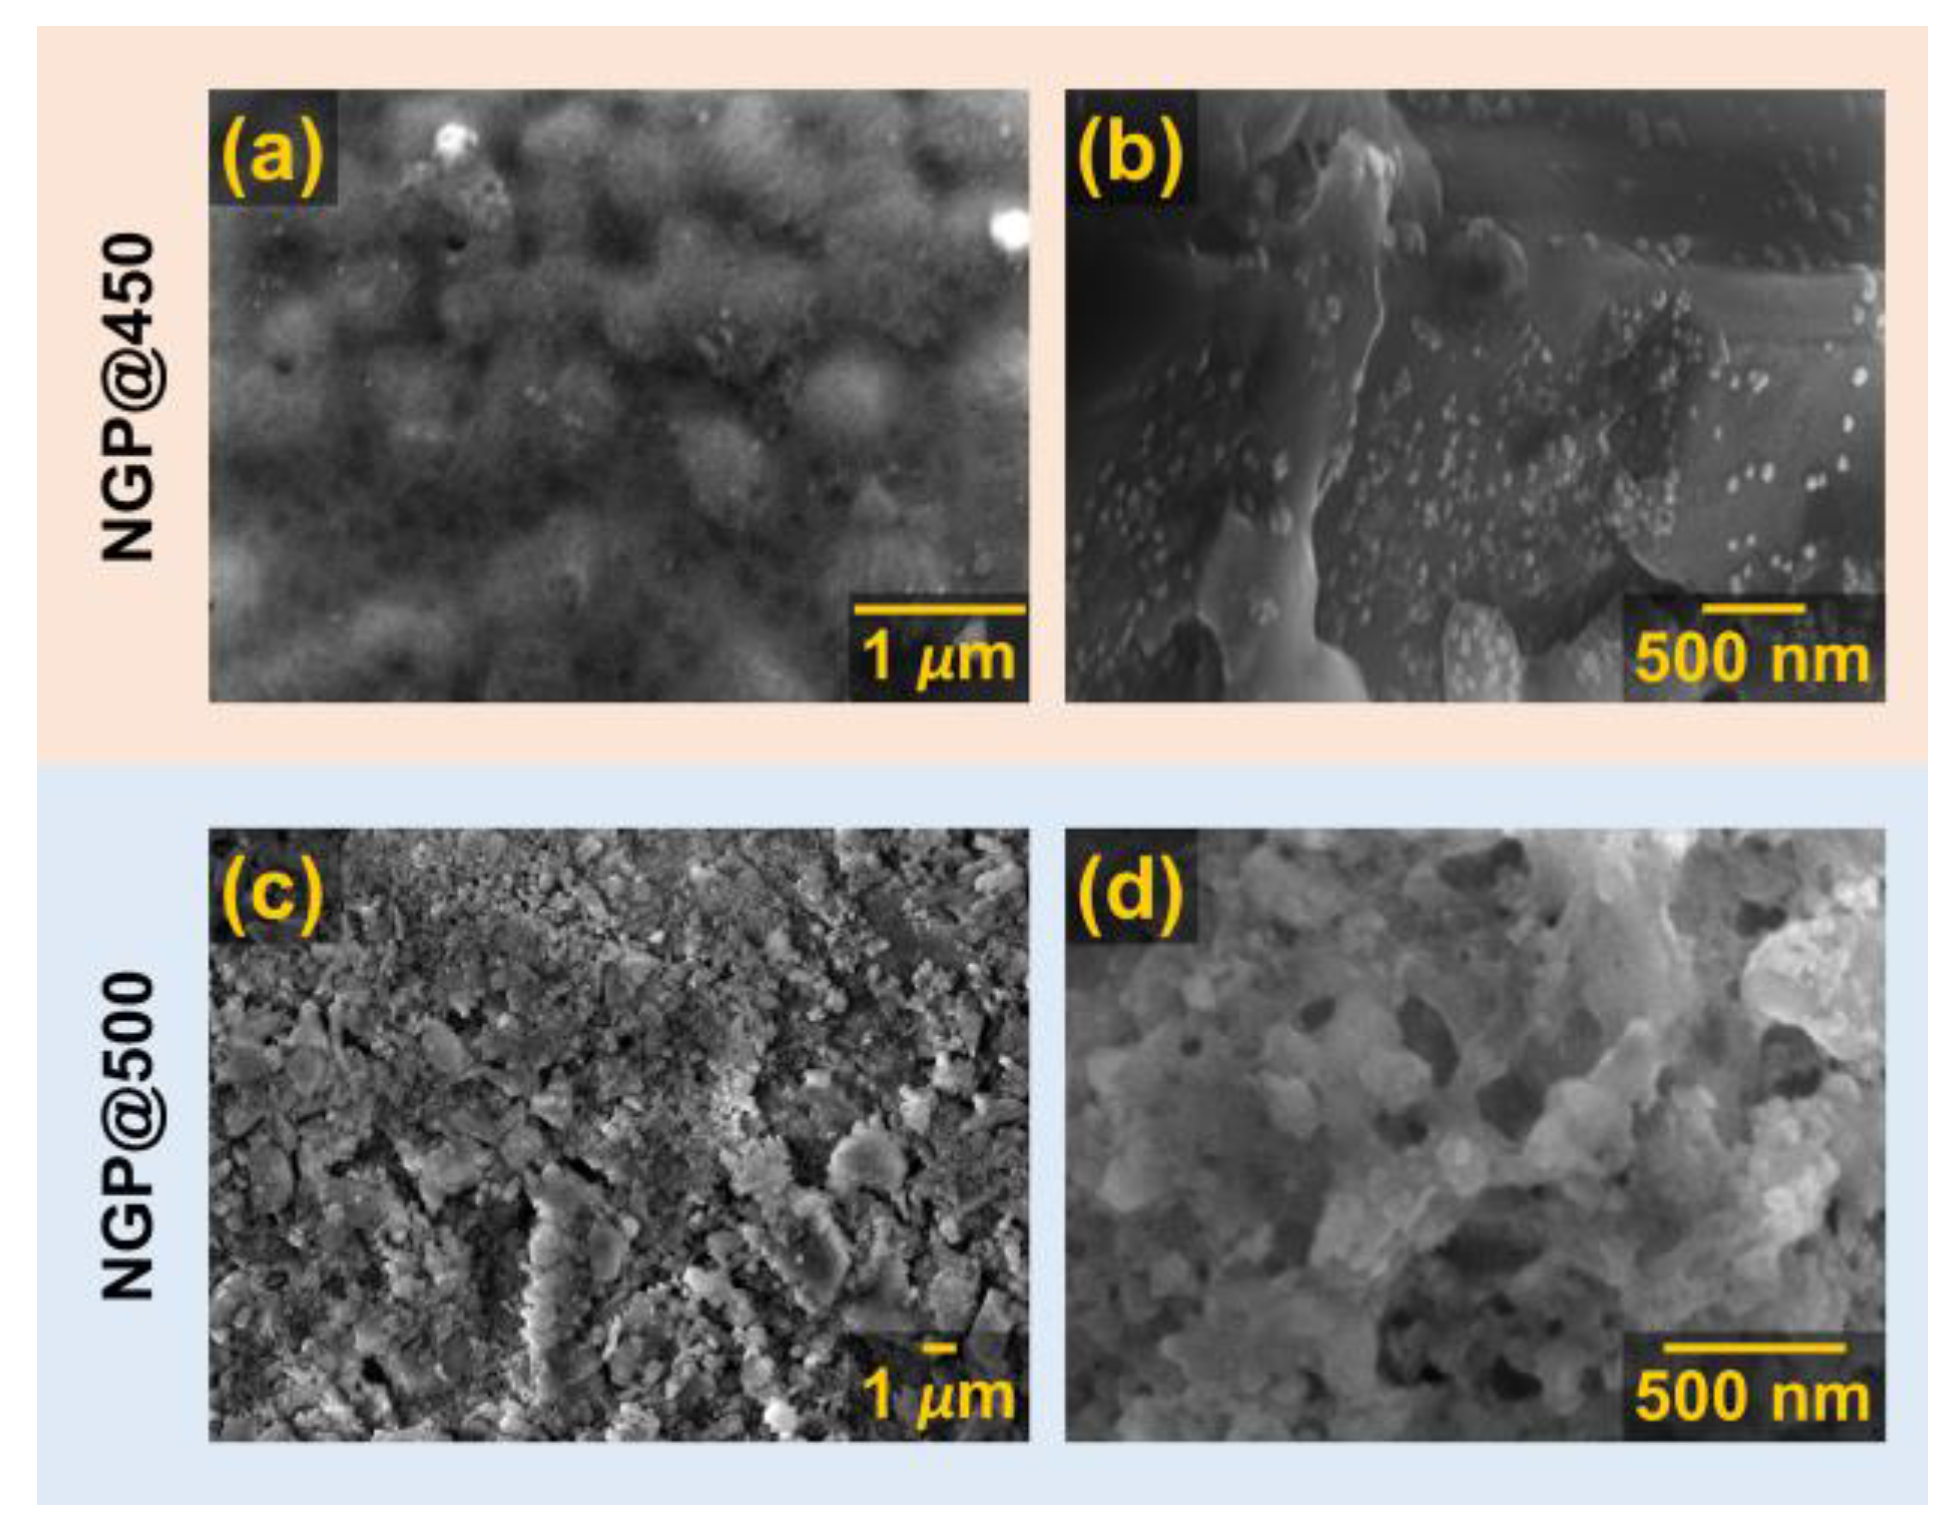
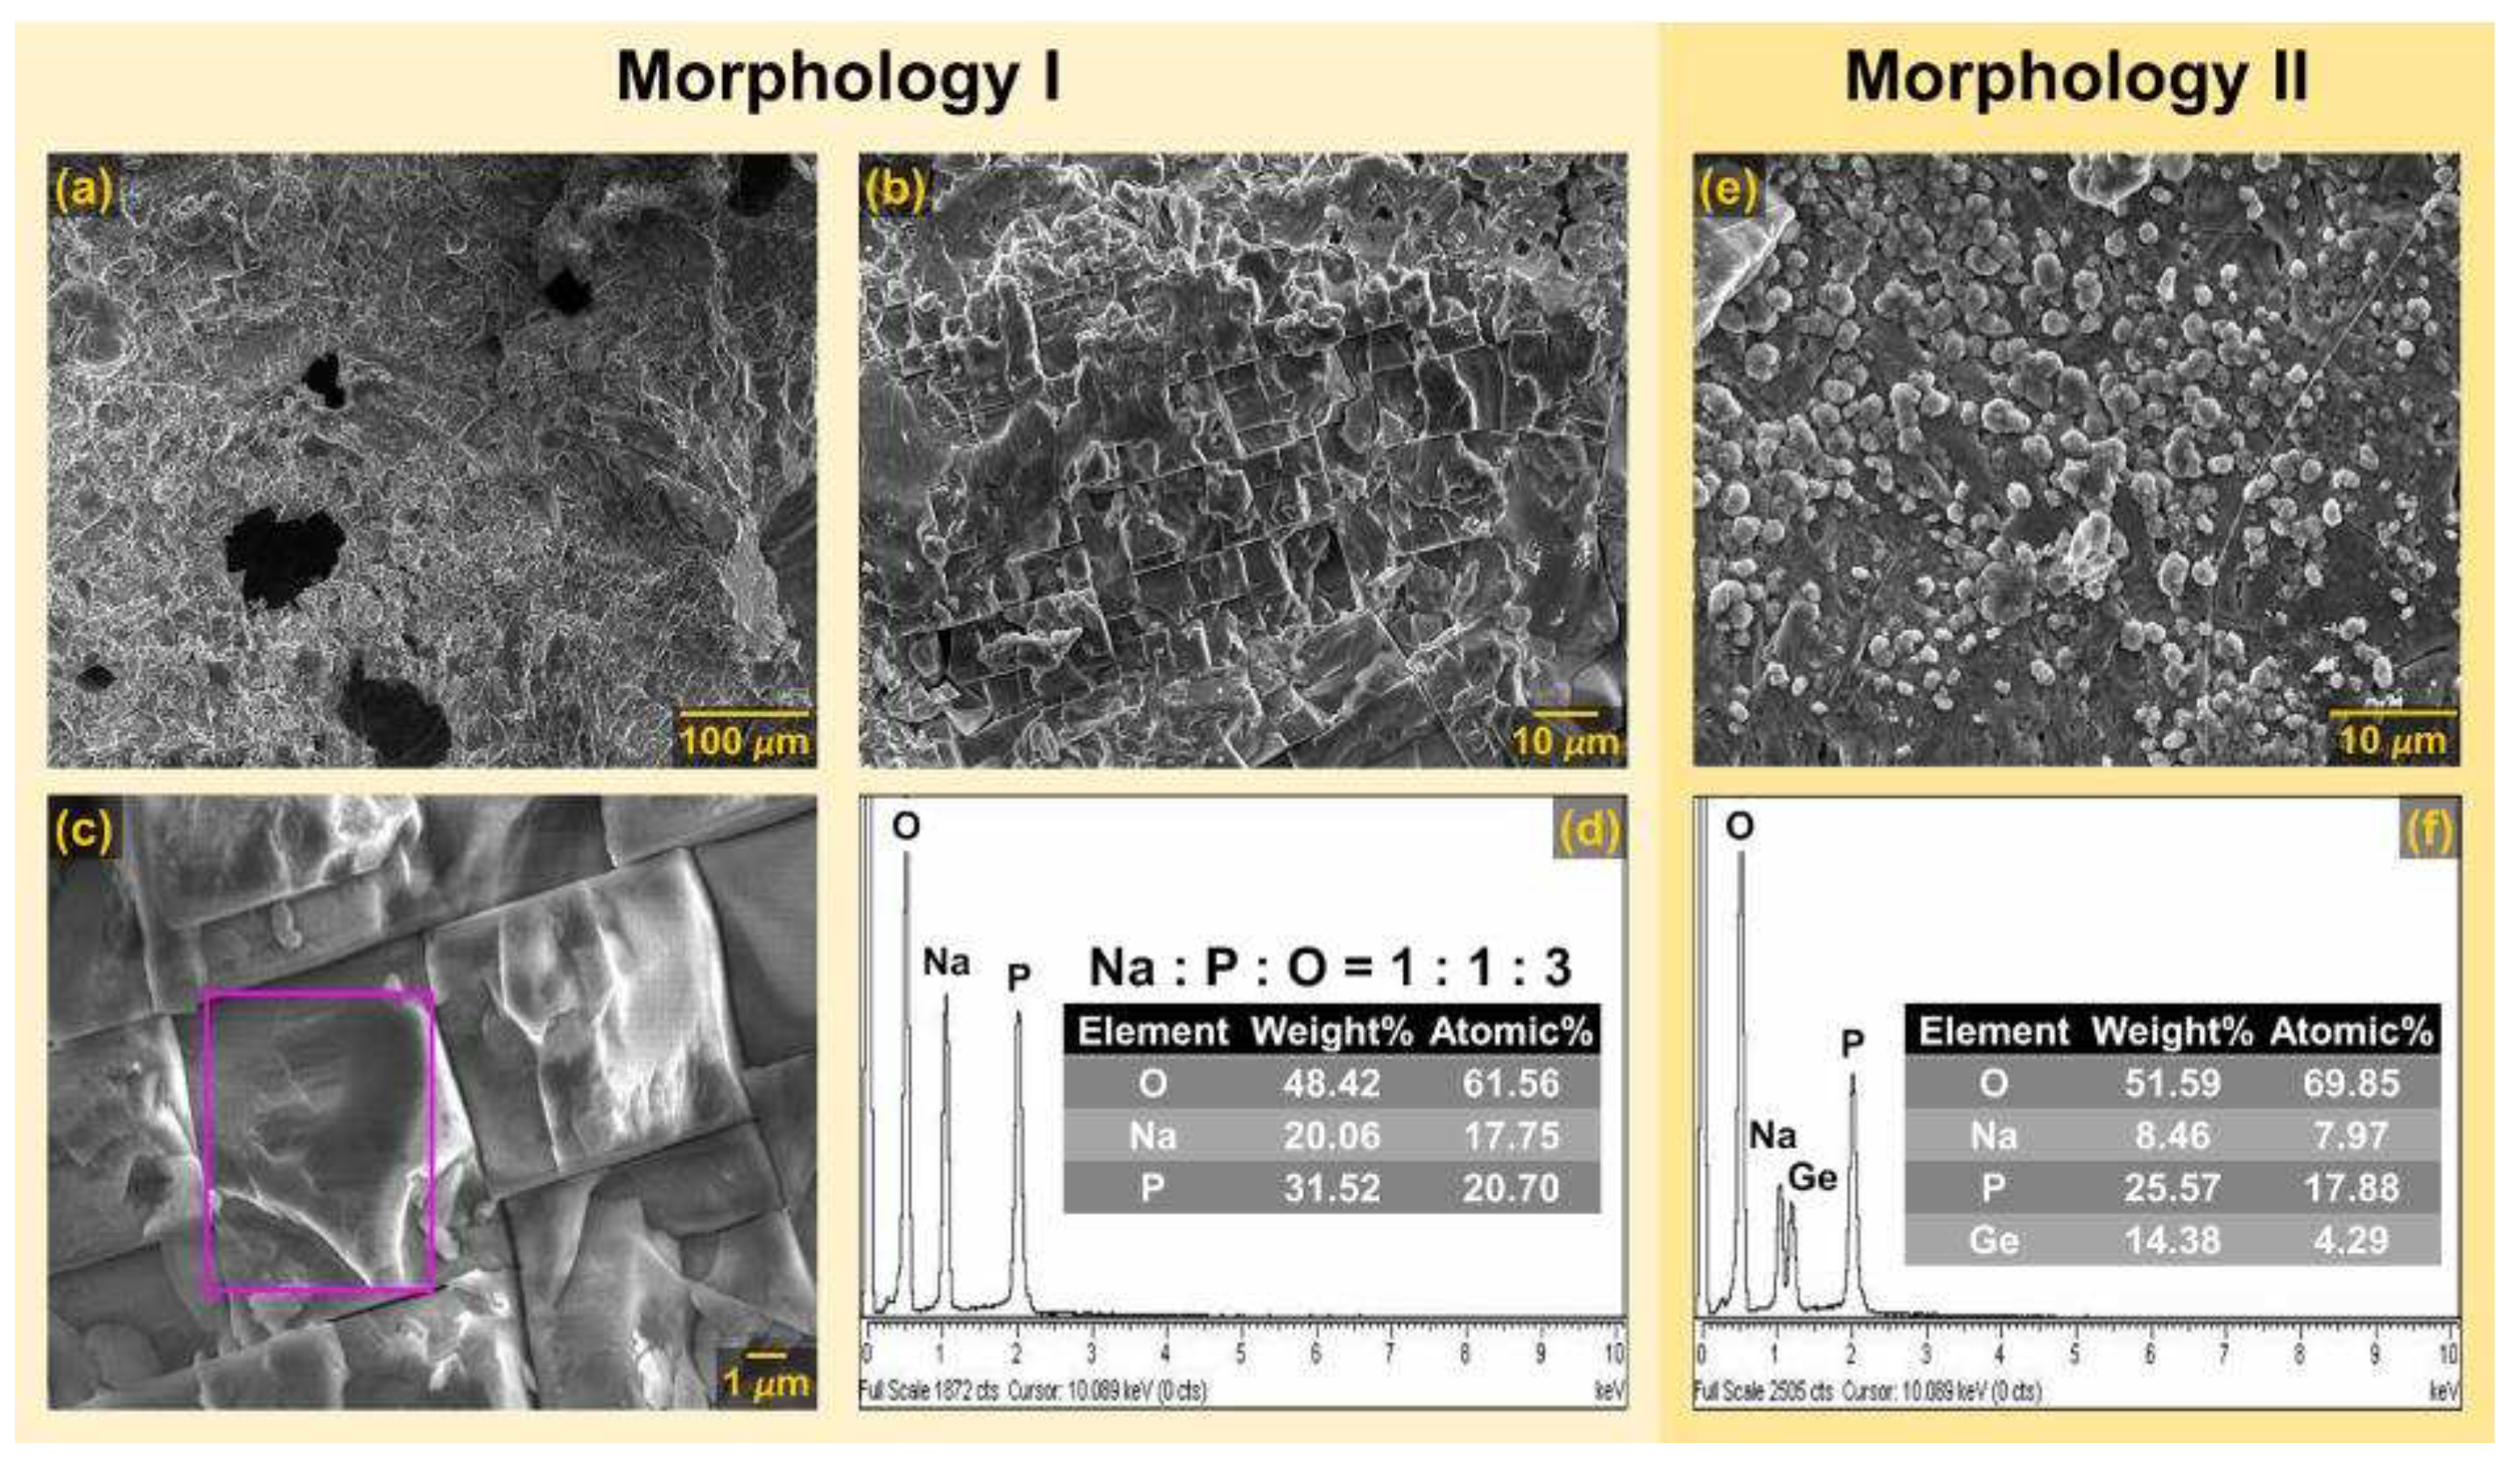
3.1.2. SEM-EDS analysis
3.2. Electrical analysis
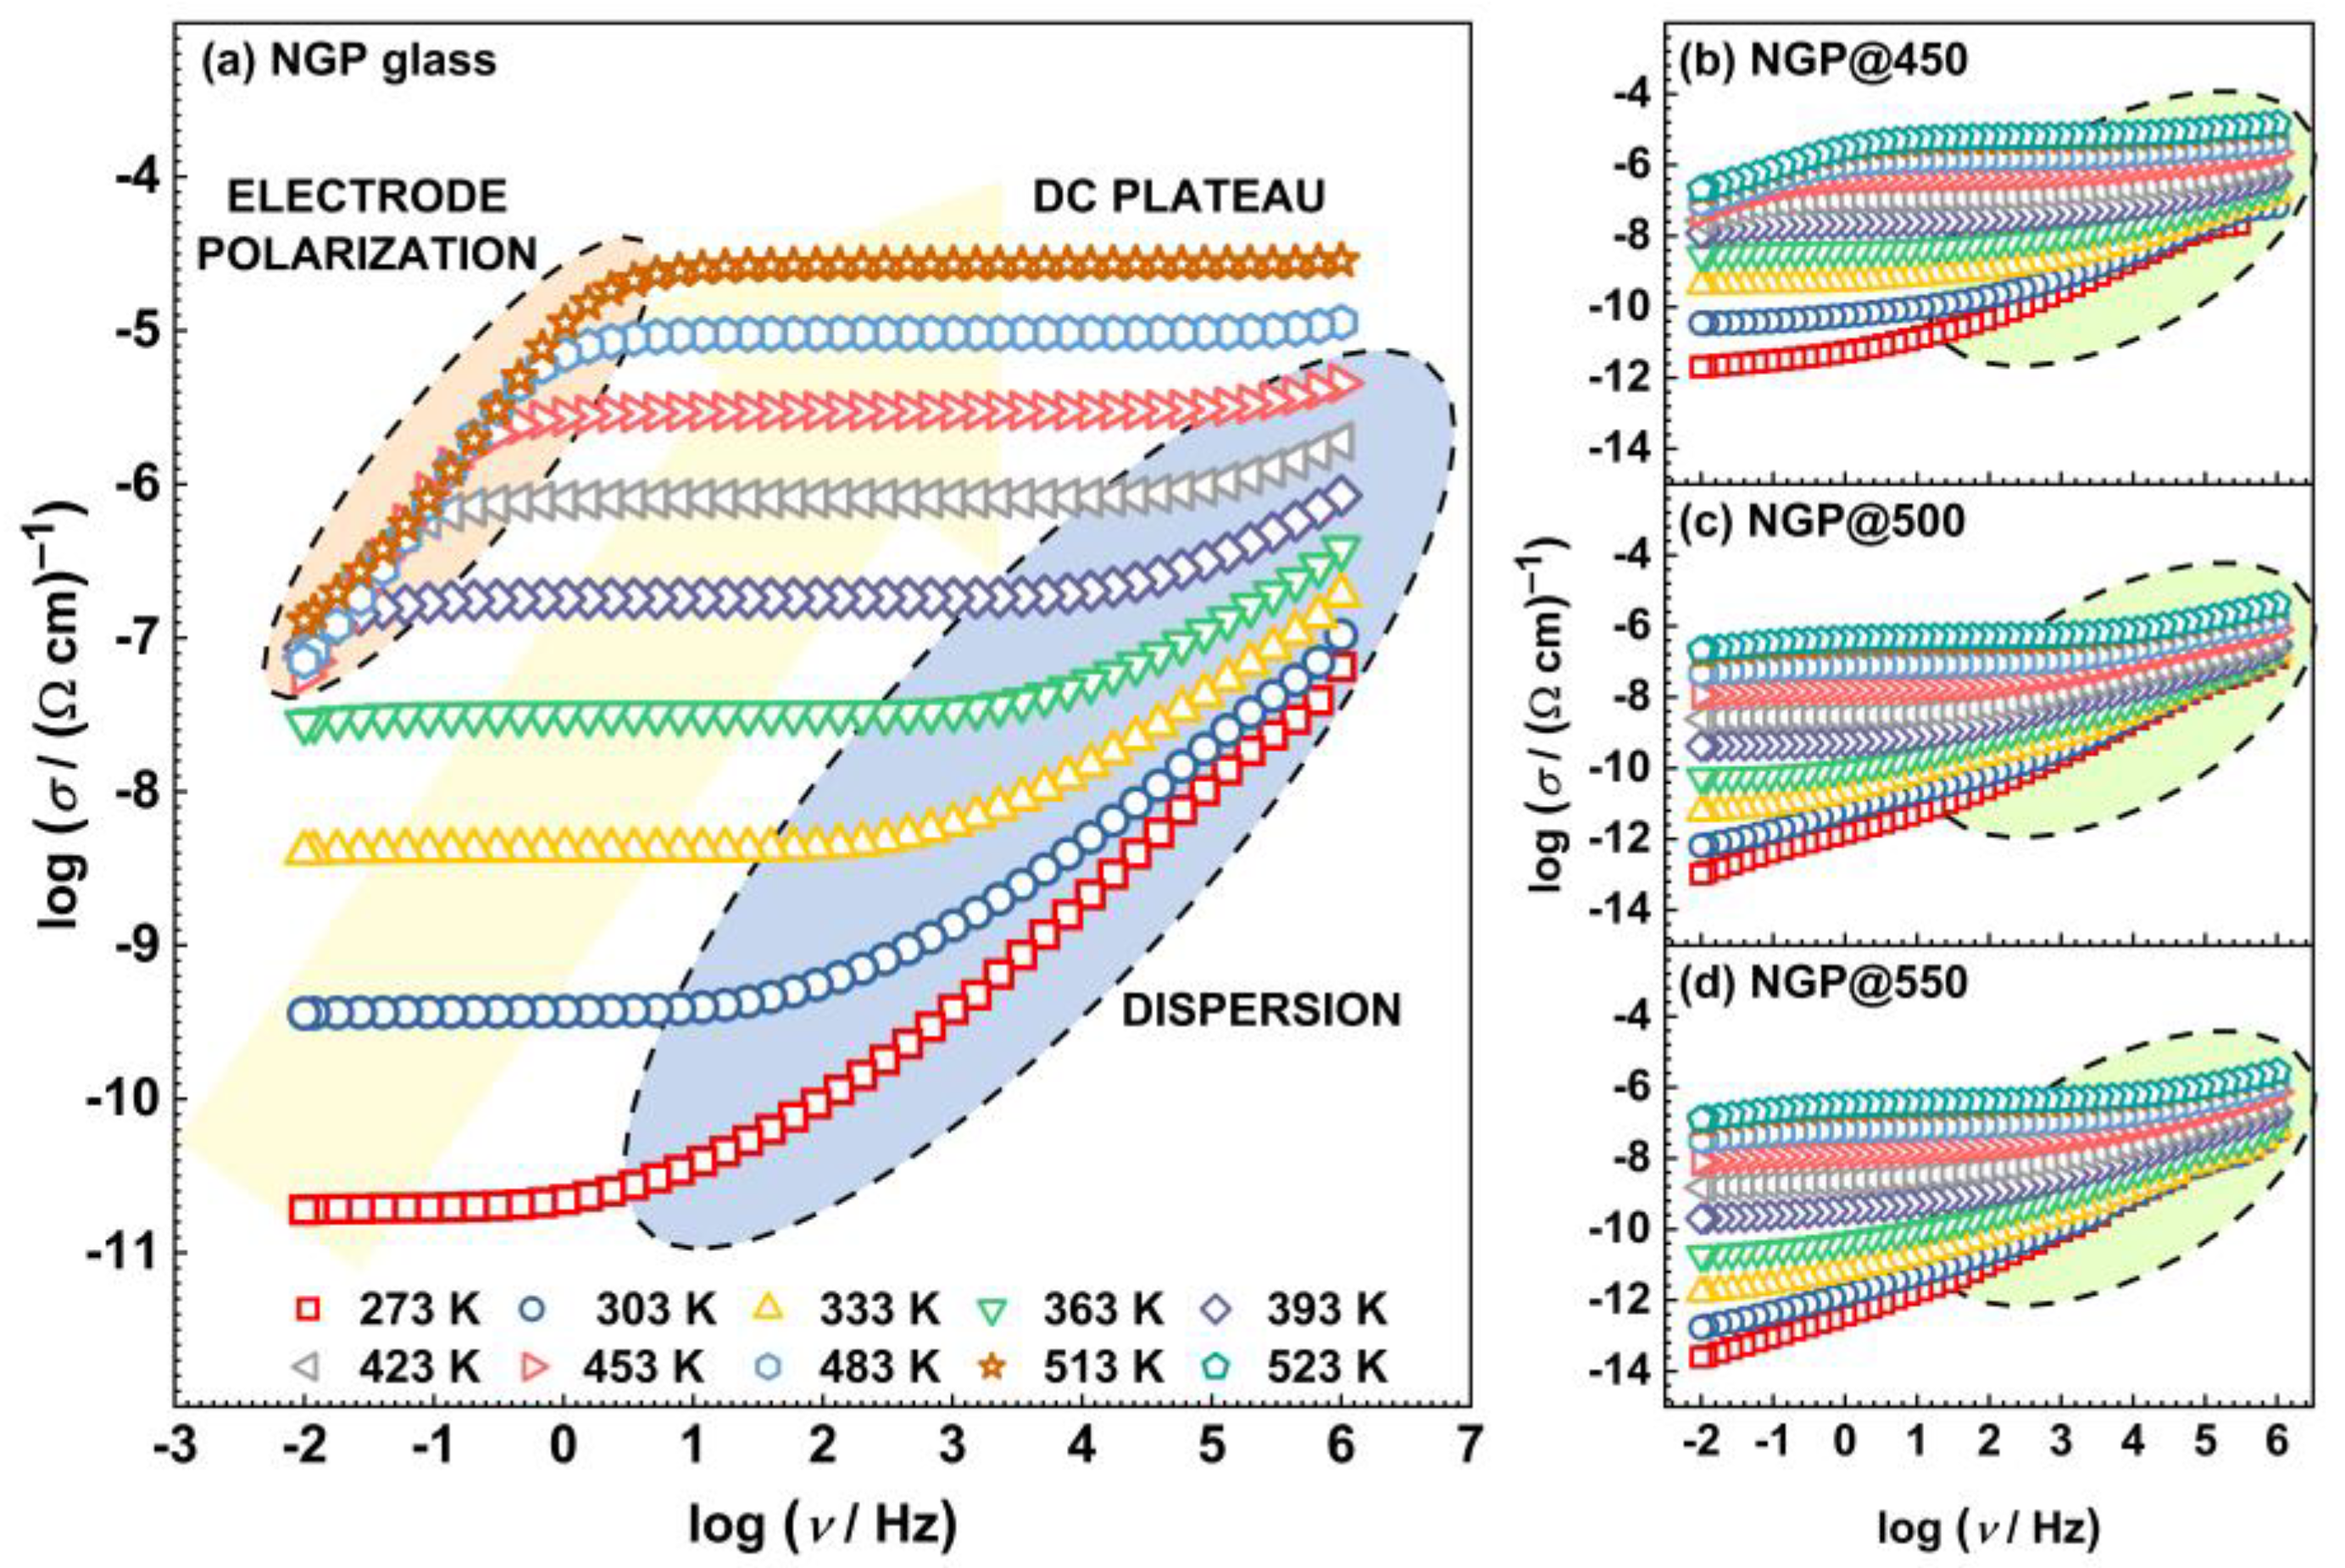
3.2.1. Electrical conductivity
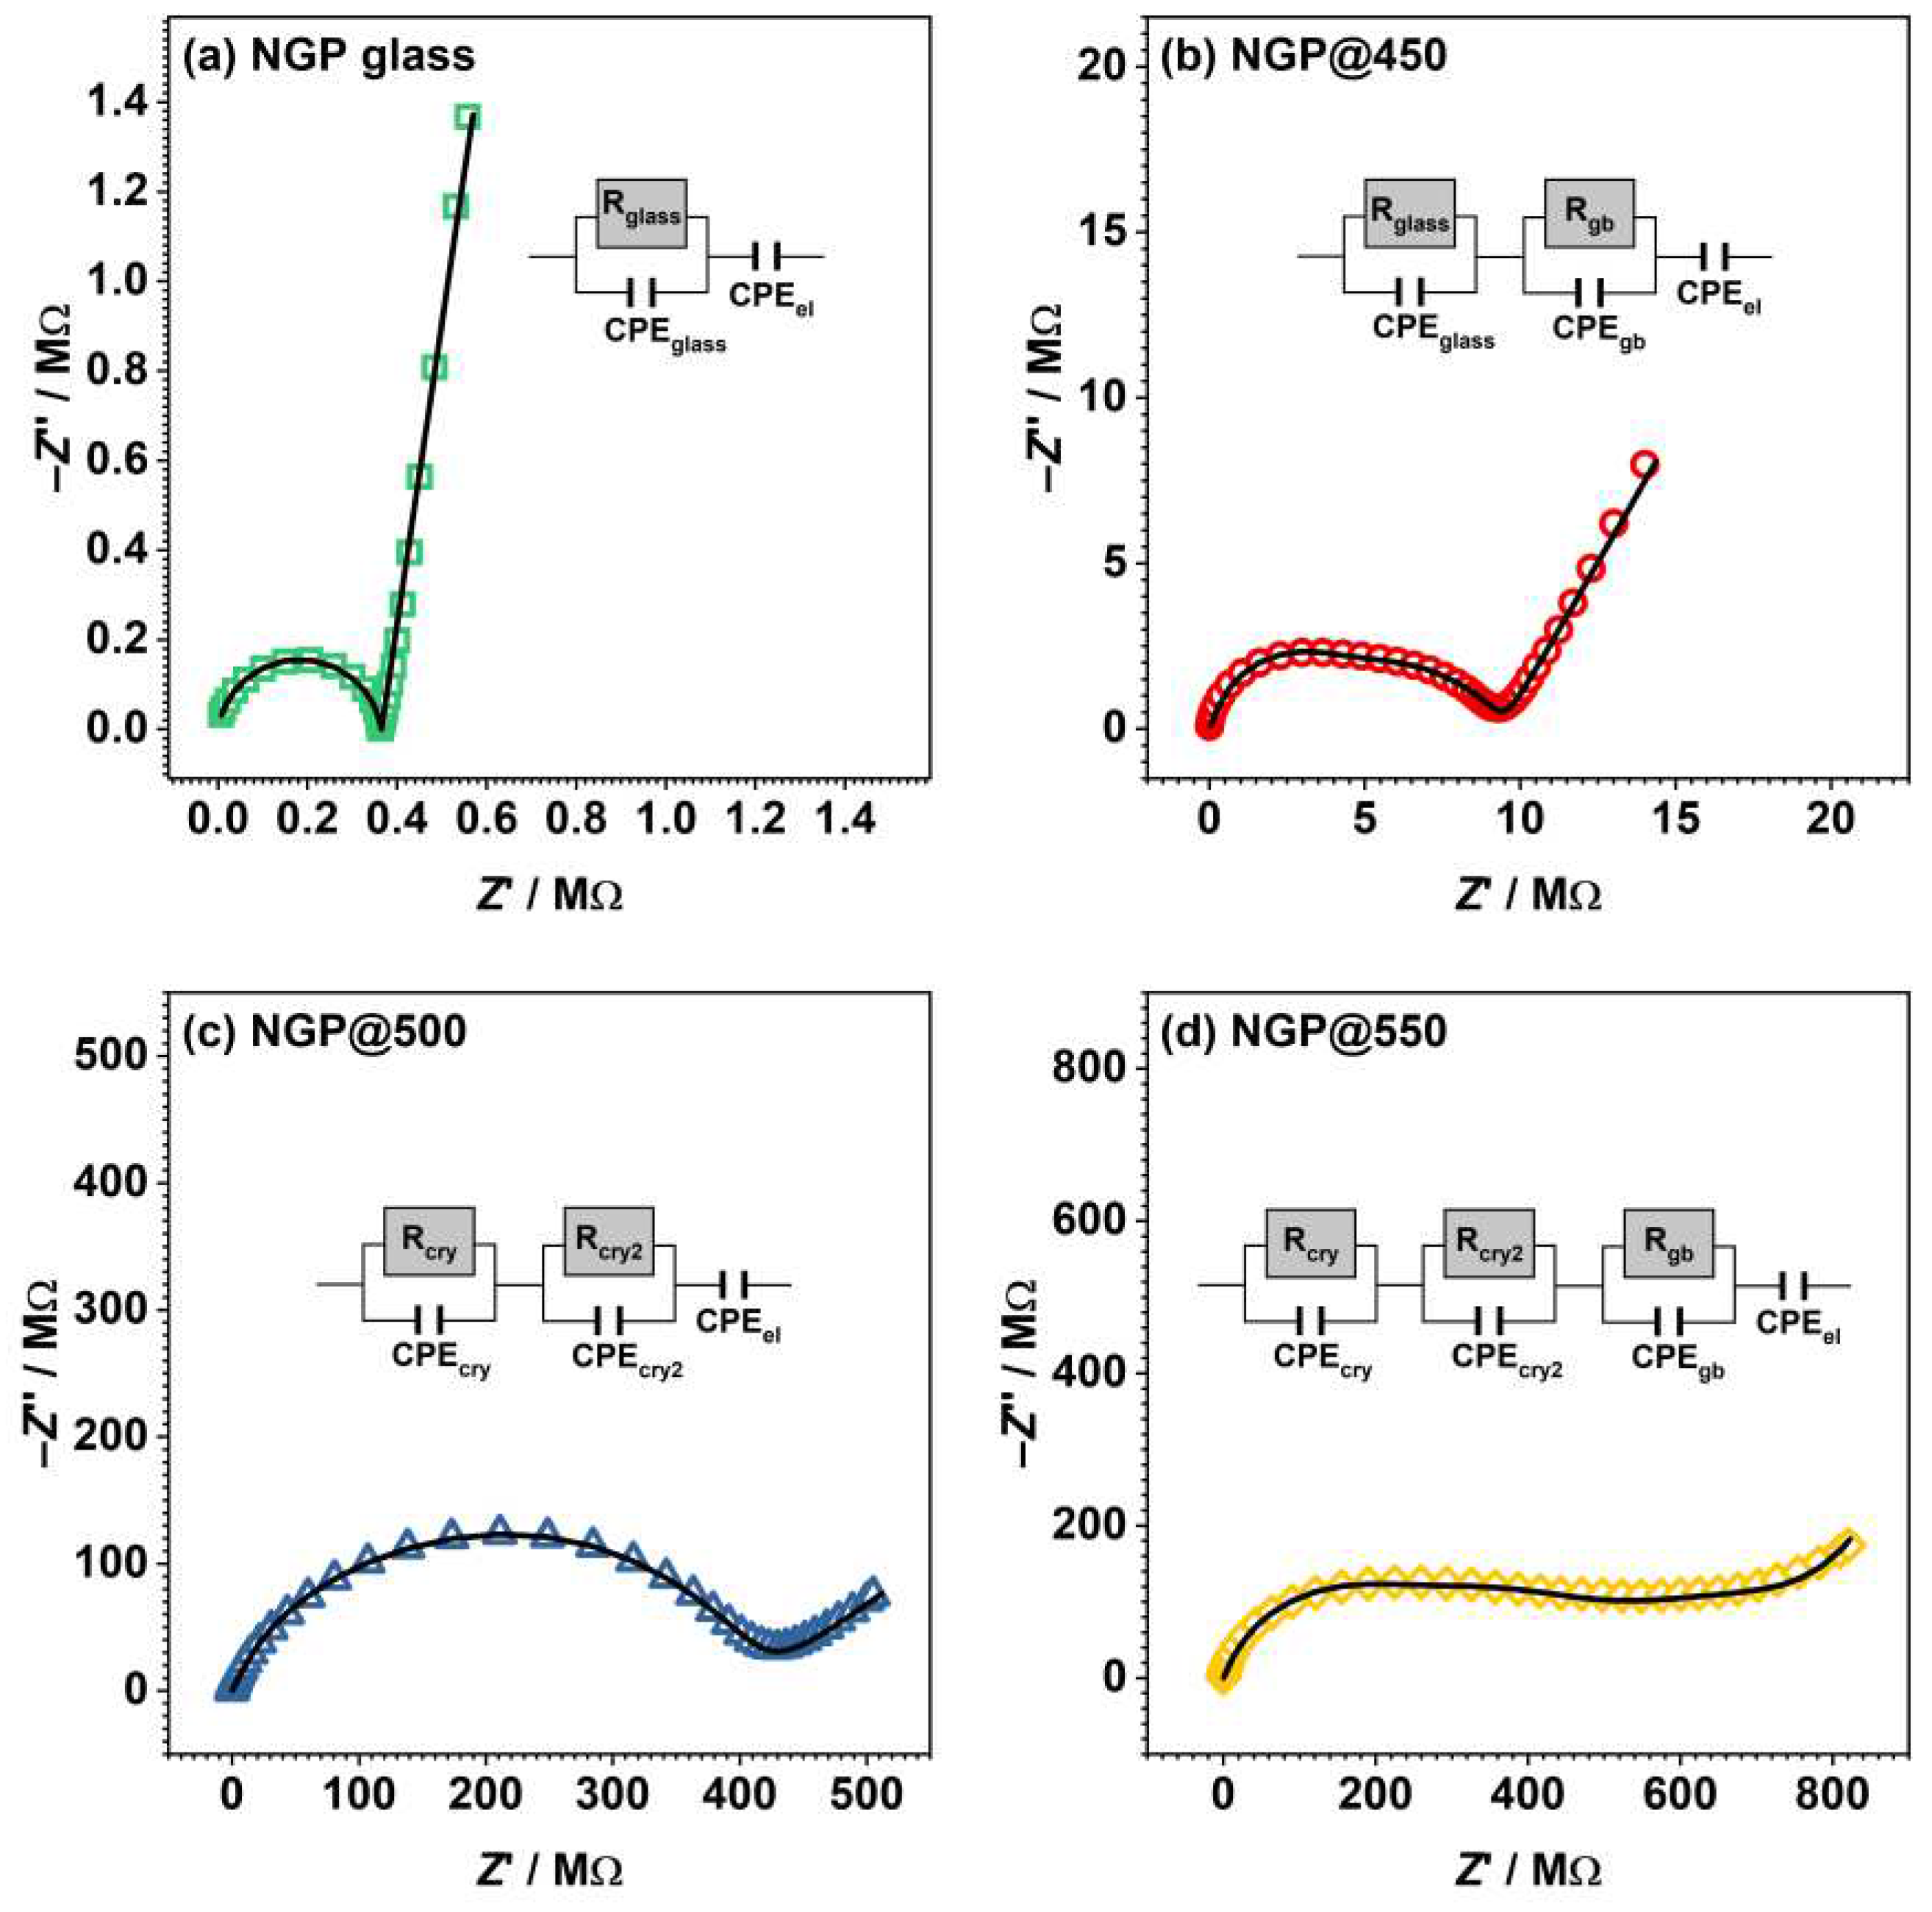
3.2.2. Complex impedance plane
3.2.3. DC conductivity and activation energy
3.3. Dielectric analysis
3.3.1. Complex permittivity
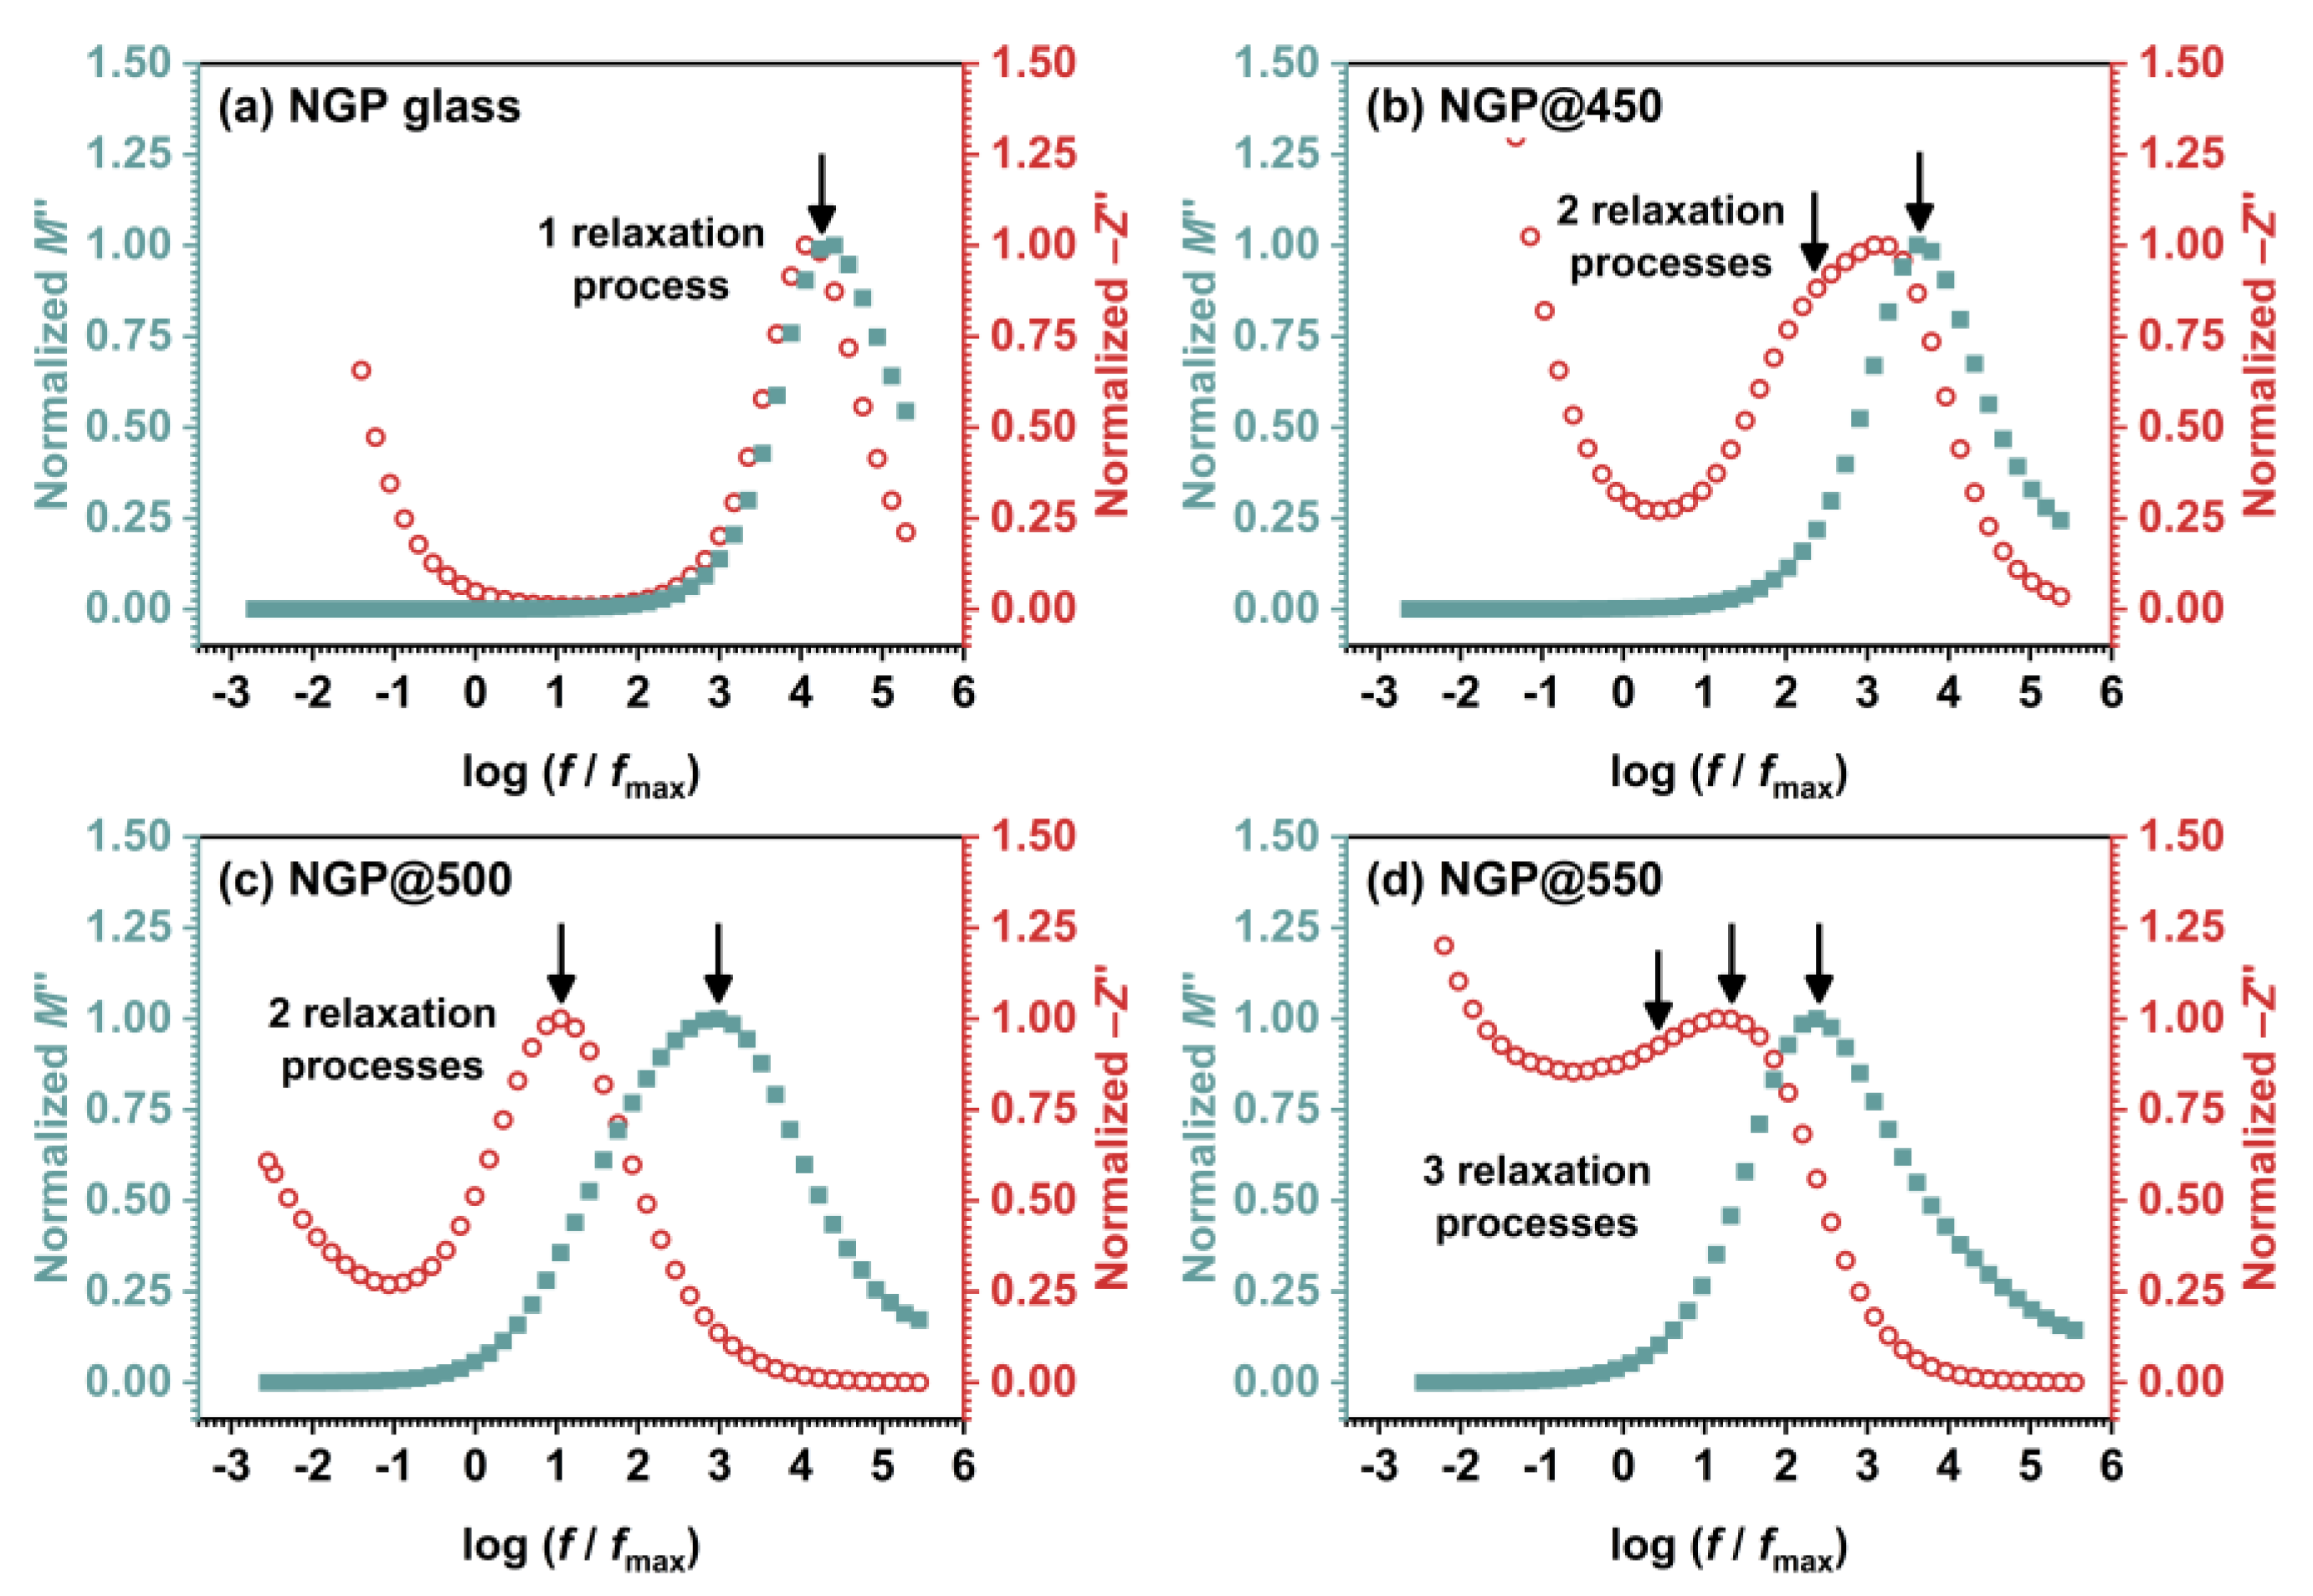
3.3.2. Electric modulus
4. Conclusions
Supplementary Materials
Author Contributions
Funding
Institutional Review Board Statement
Informed Consent Statement
Data Availability Statement
Acknowledgments
Conflicts of Interest
References
- Baniya, A.; Pathak, R.; Norris, B.; Li, H.; Rozyyev, V.; Elam, J.W.; Qiao, Q. 1 - Next-Generation Battery Technology Based on Solid-State Electrolytes. In Green Sustainable Process for Chemical and Environmental Engineering and Science; Smirnova, A., Numan-Al-Mobin, A., Inamuddin, Eds.; Elsevier, 2023; pp. 1–46 ISBN 978-0-323-90635-7.
- Yuan, Q.; Chen, M.; Zhan, S.; Li, Y.; Lin, Y.; Yang, H. Ceramic-Based Dielectrics for Electrostatic Energy Storage Applications: Fundamental Aspects, Recent Progress, and Remaining Challenges. Chem. Eng. J. 2022, 446, 136315. [Google Scholar] [CrossRef]
- Kumta, P.N.; Yong Kim, J. Chapter 2 - Low Dielectric Constant Glasses and Glass-Ceramics for Electronic Packaging Applications. In Handbook of Low and High Dielectric Constant Materials and Their Applications; Singh Nalwa, H., Ed.; Academic Press: Burlington, 1999; pp. 73–140. ISBN 978-0-12-513905-2. [Google Scholar]
- Arman Kuzubasoglu, B. Recent Studies on the Humidity Sensor: A Mini Review. ACS Appl. Electron. Mater. 2022, 4, 4797–4807. [Google Scholar] [CrossRef]
- Ku, C.-A.; Chung, C.-K. Advances in Humidity Nanosensors and Their Application: Review. Sensors 2023, 23, 2328. [Google Scholar] [CrossRef] [PubMed]
- Pietrzak, T.K.; Wasiucionek, M.; Garbarczyk, J.E. Towards Higher Electric Conductivity and Wider Phase Stability Range via Nanostructured Glass-Ceramics Processing. Nanomaterials 2021, 11, 1321. [Google Scholar] [CrossRef] [PubMed]
- Davis, M.J.; Zanotto, E.D. Glass-Ceramics and Realization of the Unobtainable: Property Combinations That Push the Envelope. MRS Bull. 2017, 42, 195–199. [Google Scholar] [CrossRef]
- Deubener, J.; Allix, M.; Davis, M.J.; Duran, A.; Höche, T.; Honma, T.; Komatsu, T.; Krüger, S.; Mitra, I.; Müller, R.; et al. Updated Definition of Glass-Ceramics. J. Non-Cryst. Solids 2018, 501, 3–10. [Google Scholar] [CrossRef]
- Dias, J.A.; Santagneli, S.H.; Messaddeq, Y. Methods for Lithium Ion NASICON Preparation: From Solid-State Synthesis to Highly Conductive Glass-Ceramics. J. Phys. Chem. C 2020, 124, 26518–26539. [Google Scholar] [CrossRef]
- Reddy, Ch.K.K.; Rao, R.B.; Reddy, Ch.G. The Role of Crystallization on Microstructural and Electrical Studies of Lithium Germanium Phosphate Glass-Ceramic Electrolytes. Ionics 2015, 21, 967–979. [Google Scholar] [CrossRef]
- Rohde, M.; Cui, Y.; Ziebert, C.; Seifert, H.J. Thermophysical Properties of Lithium Aluminum Germanium Phosphate with Different Compositions. Int. J. Thermophys. 2020, 41, 31. [Google Scholar] [CrossRef]
- Cruz, A.M.; Ferreira, E.B.; Rodrigues, A.C.M. Controlled Crystallization and Ionic Conductivity of a Nanostructured LiAlGePO4 Glass–Ceramic. J. Non-Cryst. Solids 2009, 355, 2295–2301. [Google Scholar] [CrossRef]
- Yan, B.; Zhu, Y.; Pan, F.; Liu, J.; Lu, L. Li1.5Al0.5Ge1.5(PO4)3 Li-Ion Conductor Prepared by Melt-Quench and Low Temperature Pressing. Solid State Ion. 2015, 278, 65–68. [Google Scholar] [CrossRef]
- Zhu, Y.; Zhang, Y.; Lu, L. Influence of Crystallization Temperature on Ionic Conductivity of Lithium Aluminum Germanium Phosphate Glass-Ceramic. J. Power Sources 2015, 290, 123–129. [Google Scholar] [CrossRef]
- Cui, Y.; Mahmoud, M.M.; Rohde, M.; Ziebert, C.; Seifert, H.J. Thermal and Ionic Conductivity Studies of Lithium Aluminum Germanium Phosphate Solid-State Electrolyte. Solid State Ion. 2016, 289, 125–132. [Google Scholar] [CrossRef]
- Santagneli, S.H.; Baldacim, H.V.A.; Ribeiro, S.J.L.; Kundu, S.; Rodrigues, A.C.M.; Doerenkamp, C.; Eckert, H. Preparation, Structural Characterization, and Electrical Conductivity of Highly Ion-Conducting Glasses and Glass Ceramics in the System Li1+xAlxSnyGe2-(x+y)(PO4)3. J. Phys. Chem. C 2016, 120, 14556–14567. [Google Scholar] [CrossRef]
- Das, A.; Goswami, M.; Illath, K.; Ajithkumar, T.G.; Arya, A.; Krishnan, M. Synthesis and Characterization of LAGP-Glass-Ceramics-Based Composite Solid Polymer Electrolyte for Solid-State Li-Ion Battery Application. J. Non-Cryst. Solids 2021, 558, 120654. [Google Scholar] [CrossRef]
- Zallocco, V.M.; Freitas, J.M.; Bocchi, N.; Rodrigues, A.C.M. Electrochemical Stability of a NASICON Solid Electrolyte from the Lithium Aluminum Germanium Phosphate (LAGP) Series. Solid State Ion. 2022, 378, 115888. [Google Scholar] [CrossRef]
- Gandi, S.; Chinta, S.R.; Ojha, P.K.; Surendra Babu, M.S.; Ravuri, B.R. High Na-Ion Conducting Na1+x[SnxGe2−x(PO4)3] Glass-Ceramic Electrolytes: Structural and Electrochemical Impedance Studies. J. Am. Ceram. Soc. 2018, 101, 167–177. [Google Scholar] [CrossRef]
- Lannerd, A.; Ly, K.; Smirnova, A. 8 - Beyond Lithium: Solid-State Sodium-Ion Batteries and Their Potential Applications. In Green Sustainable Process for Chemical and Environmental Engineering and Science; Smirnova, A., Numan-Al-Mobin, A., Inamuddin, Eds.; Elsevier, 2023; pp. 223–262 ISBN 978-0-323-90635-7.
- Gandi, S.; Chidambara Swamy Vaddadi, V.S.; Sripada Panda, S.S.; Goona, N.K.; Parne, S.R.; Lakavat, M.; Bhaumik, A. Recent Progress in the Development of Glass and Glass-Ceramic Cathode/Solid Electrolyte Materials for next-Generation High Capacity All-Solid-State Sodium-Ion Batteries: A Review. J. Power Sources 2022, 521, 230930. [Google Scholar] [CrossRef]
- Trivedi, S.; Pamidi, V.; Fichtner, M.; Reddy, M.A. Ionically Conducting Inorganic Binders: A Paradigm Shift in Electrochemical Energy Storage. Green Chem. 2022, 24, 5620–5631. [Google Scholar] [CrossRef]
- K. Arya, S.; S. Danewalia, S.; Singh, K. Frequency Independent Low- k Lithium Borate Nanocrystalline Glass Ceramic and Glasses for Microelectronic Applications. J. Mater. Chem. C 2016, 4, 3328–3336. [CrossRef]
- Kulwicki, B.M. Humidity Sensors. J. Am. Ceram. Soc. 1991, 74, 697–708. [Google Scholar] [CrossRef]
- Traversa, E. Ceramic Sensors for Humidity Detection: The State-of-the-Art and Future Developments. Sens. Actuators B Chem. 1995, 23, 135–156. [Google Scholar] [CrossRef]
- Foucaud, M.; Renka, S.; Klaser, T.; Popović, J.; Skoko, Ž.; Mošner, P.; Koudelka, L.; Šantić, A. Sodium-Ion Conductivity and Humidity-Sensing Properties of Na2O-MoO3-P2O5 Glass-Ceramics. Nanomaterials 2022, 12, 240. [Google Scholar] [CrossRef] [PubMed]
- Moguš-Milanković, A.; Sklepić, K.; Blažanović, H.; Mošner, P.; Vorokhta, M.; Koudelka, L. Influence of Germanium Oxide Addition on the Electrical Properties of Li2O–B2O3–P2O5 Glasses. J. Power Sources 2013, 242, 91–98. [Google Scholar] [CrossRef]
- Sklepić, K.; Banhatti, R.D.; Tricot, G.; Mošner, P.; Koudelka, L.; Moguš-Milanković, A. Insights from Local Network Structures and Localized Diffusion on the Ease of Lithium Ion Transport in Two Mixed Glass-Former Systems. J. Phys. Chem. C 2017, 121, 17641–17657. [Google Scholar] [CrossRef]
- Sklepić, K.; Tricot, G.; Mošner, P.; Koudelka, L.; Moguš-Milanković, A. Sodium Ion Conductivity in Mixed Former Na2O–P2O5–GeO2 and Na2O–B2O3–P2O5–GeO2 Glasses. J. Phys. Chem. C 2021, 125, 10593–10604. [Google Scholar] [CrossRef]
- Marijan, S.; Razum, M.; Klaser, T.; Mošner, P.; Koudelka, L.; Skoko, Ž.; Pisk, J.; Pavić, L. Tailoring Structure for Improved Sodium Mobility and Electrical Properties in V2O5–Nb2O5–P2O5 Glass(Es)-(Ceramics). J. Phys. Chem. Solids 2023, 181, 111461. [Google Scholar] [CrossRef]
- Pavić, L.; Sklepić, K.; Skoko, Ž.; Tricot, G.; Mošner, P.; Koudelka, L.; Moguš-Milanković, A. Ionic Conductivity of Lithium Germanium Phosphate Glass-Ceramics. J. Phys. Chem. C 2019, 123, 23312–23322. [Google Scholar] [CrossRef]
- Pavić, L.; Nikolić, J.; Graça, M.P.F.; Costa, B.F.O.; Valente, M.A.; Skoko, Ž.; Šantić, A.; Moguš-Milanković, A. Effect of Controlled Crystallization on Polaronic Transport in Phosphate-Based Glass-Ceramics. Int. J. Appl. Glass Sci. 2020, 11, 97–111. [Google Scholar] [CrossRef]
- Bafti, A.; Kubuki, S.; Ertap, H.; Yüksek, M.; Karabulut, M.; Moguš-Milanković, A.; Pavić, L. Electrical Transport in Iron Phosphate-Based Glass-(Ceramics): Insights into the Role of B2O3 and HfO2 from Model-Free Scaling Procedures. Nanomaterials 2022, 12, 639. [Google Scholar] [CrossRef]
- Marijan, S.; Pavić, L. Solid-State Impedance Spectroscopy Studies of Dielectric Properties and Relaxation Processes in Na2O–V2O5–Nb2O5–P2O5 glass system. Int. J. Miner. Metall. Mater. 2023. [Google Scholar] [CrossRef]
- Ondik, H.M. The Structure of Anhydrous Sodium Trimetaphosphate Na3P3O9, and the Monohydrate, Na3P3O9.H2O. Acta Crystallogr. 1965, 18, 226–232. [Google Scholar] [CrossRef]
- Kaiser, U.; Glaum, R. Beiträge zum thermischen Verhalten und zur Kristallchemie wasserfreier Phosphate. XI. Darstellung und Kristallstruktur einer triklinen Modifikation von GeP2O7. Z. Für Anorg. Allg. Chem. 1994, 620, 1755–1759. [Google Scholar] [CrossRef]
- Moustafa, Y.M.; El-Egili, K. Infrared Spectra of Sodium Phosphate Glasses. J. Non-Cryst. Solids 1998, 240, 144–153. [Google Scholar] [CrossRef]
- Sahar, M.R.; Hussein, A.W.M.A.; Hussin, R. Structural Characteristic of Na2O-P2O5-GeO2 Glass Systems. J. Non-Cryst. Solids 2007, 353, 1134–1140. [Google Scholar] [CrossRef]
- Sinclair, D.C. Characterization of Electro-materials using ac Impedance Spectroscopy. Bol. Soc. Esp. Cerámica Vidr. 1995, 34, 55–65. [Google Scholar]
- Schönhals, A.; Kremer, F. Analysis of Dielectric Spectra. In Broadband Dielectric Spectroscopy; Kremer, F., Schönhals, A., Eds.; Springer: Berlin, Heidelberg, 2003; pp. 59–98. ISBN 978-3-642-56120-7. [Google Scholar]

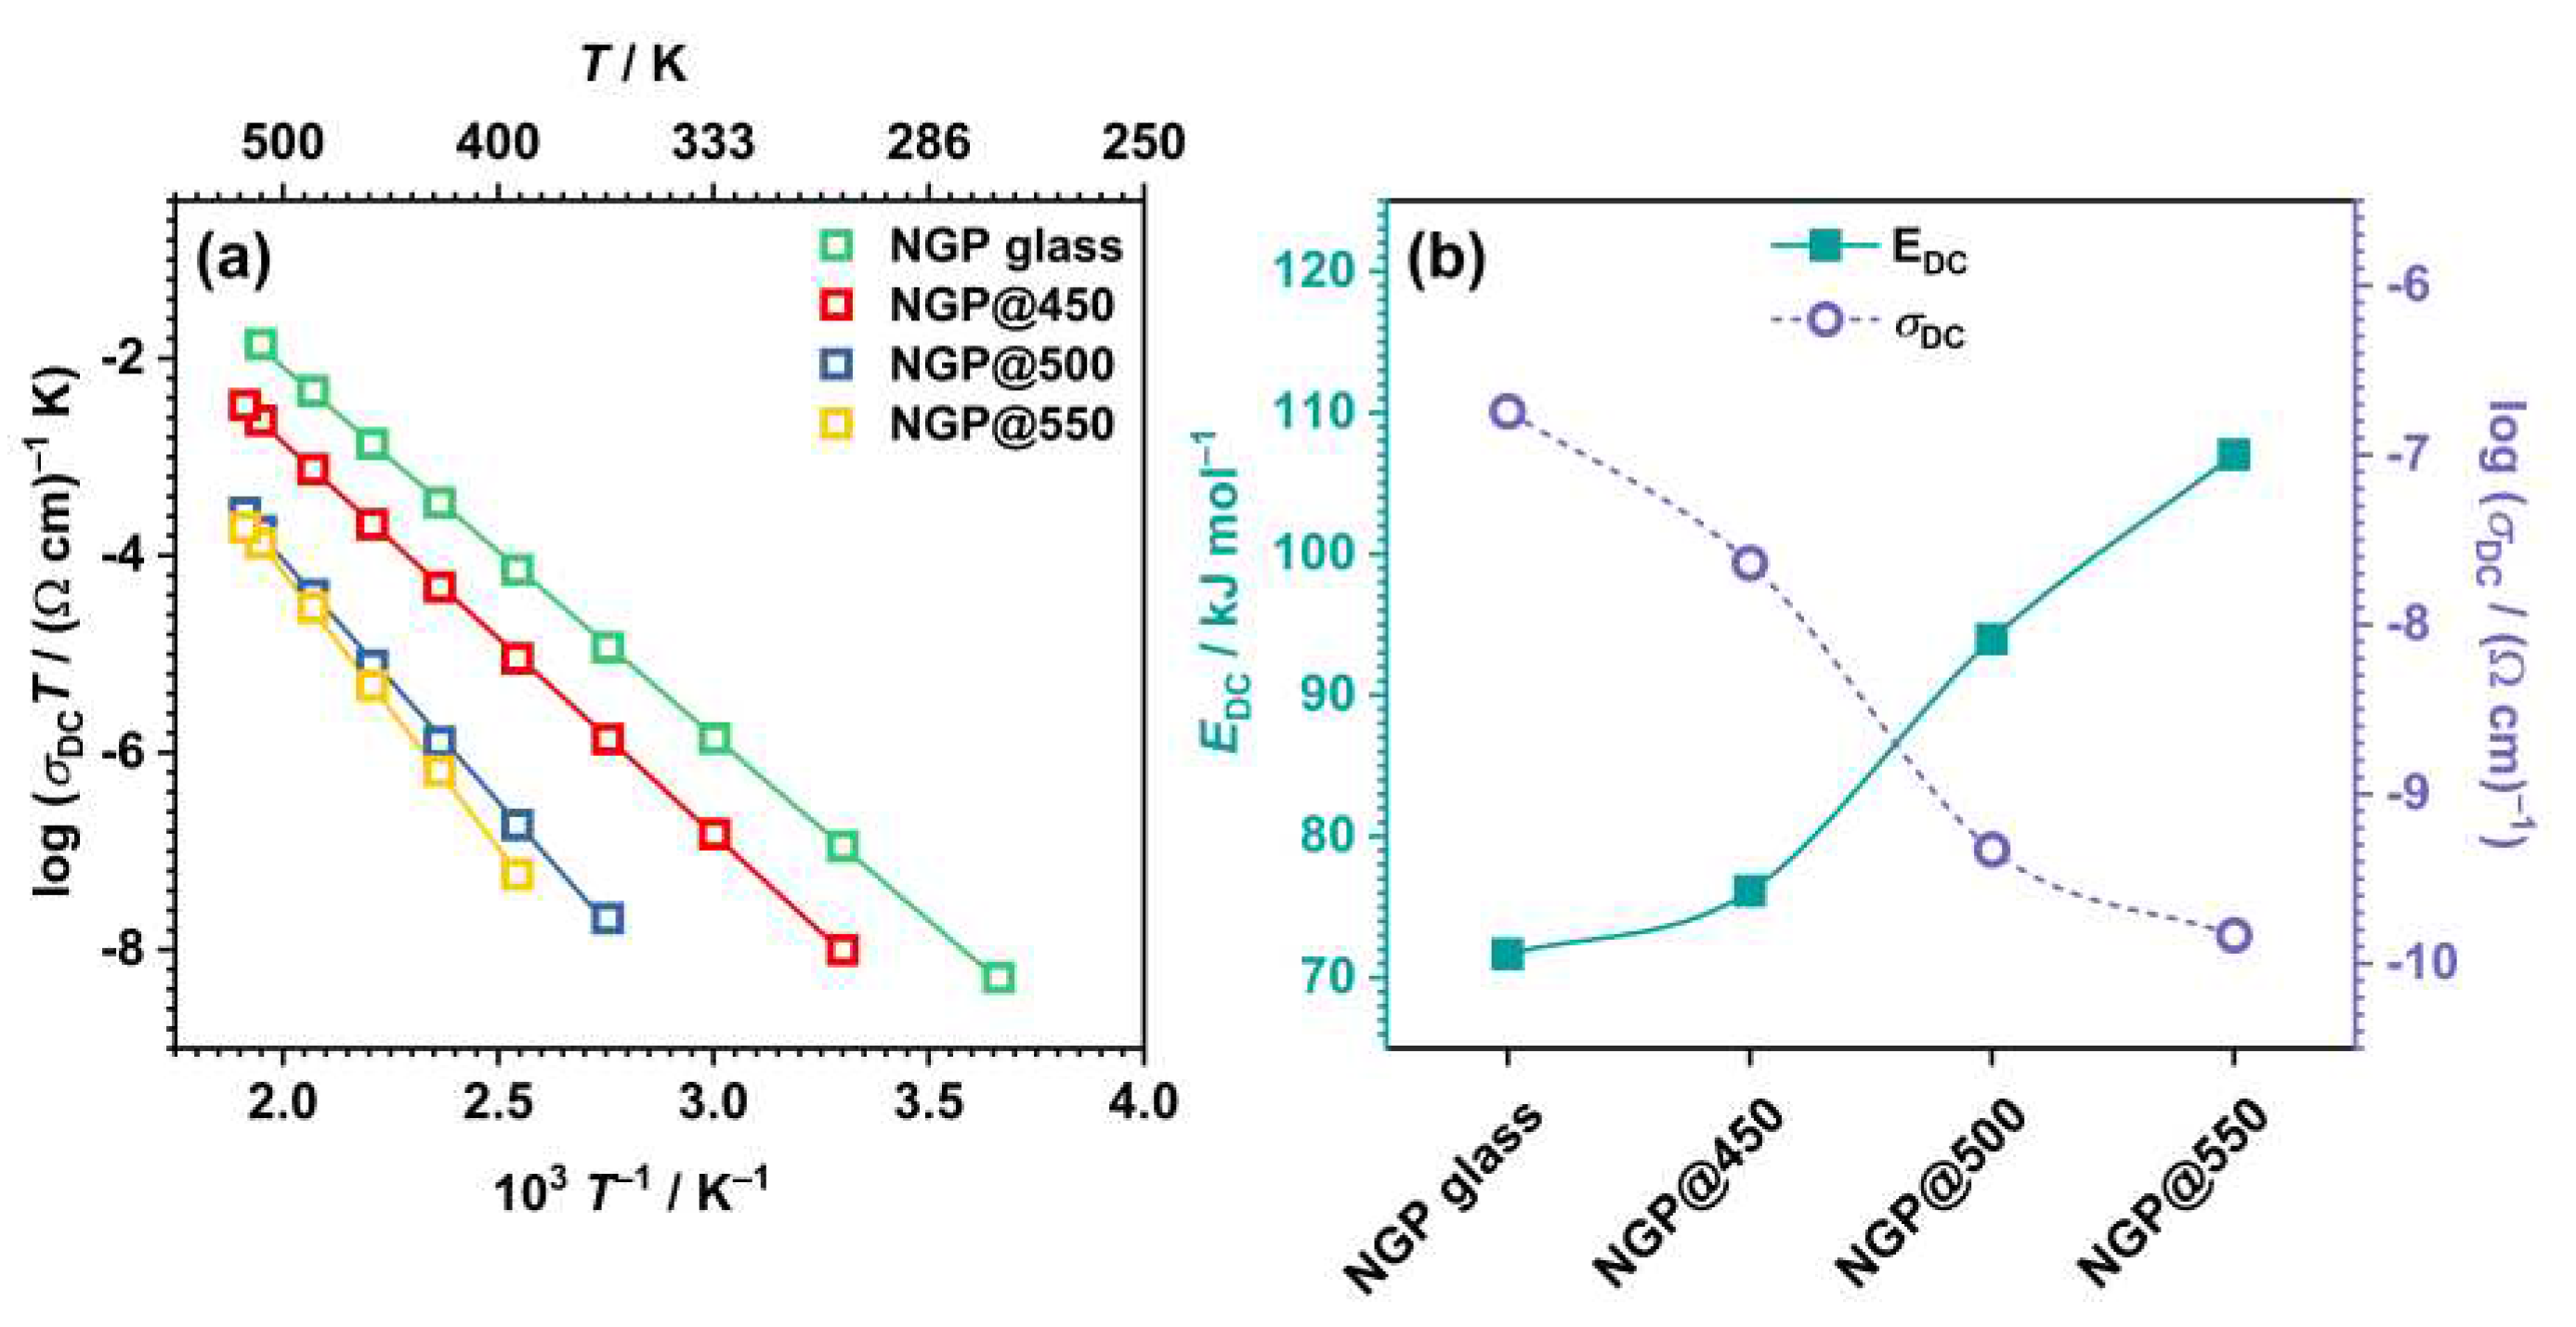
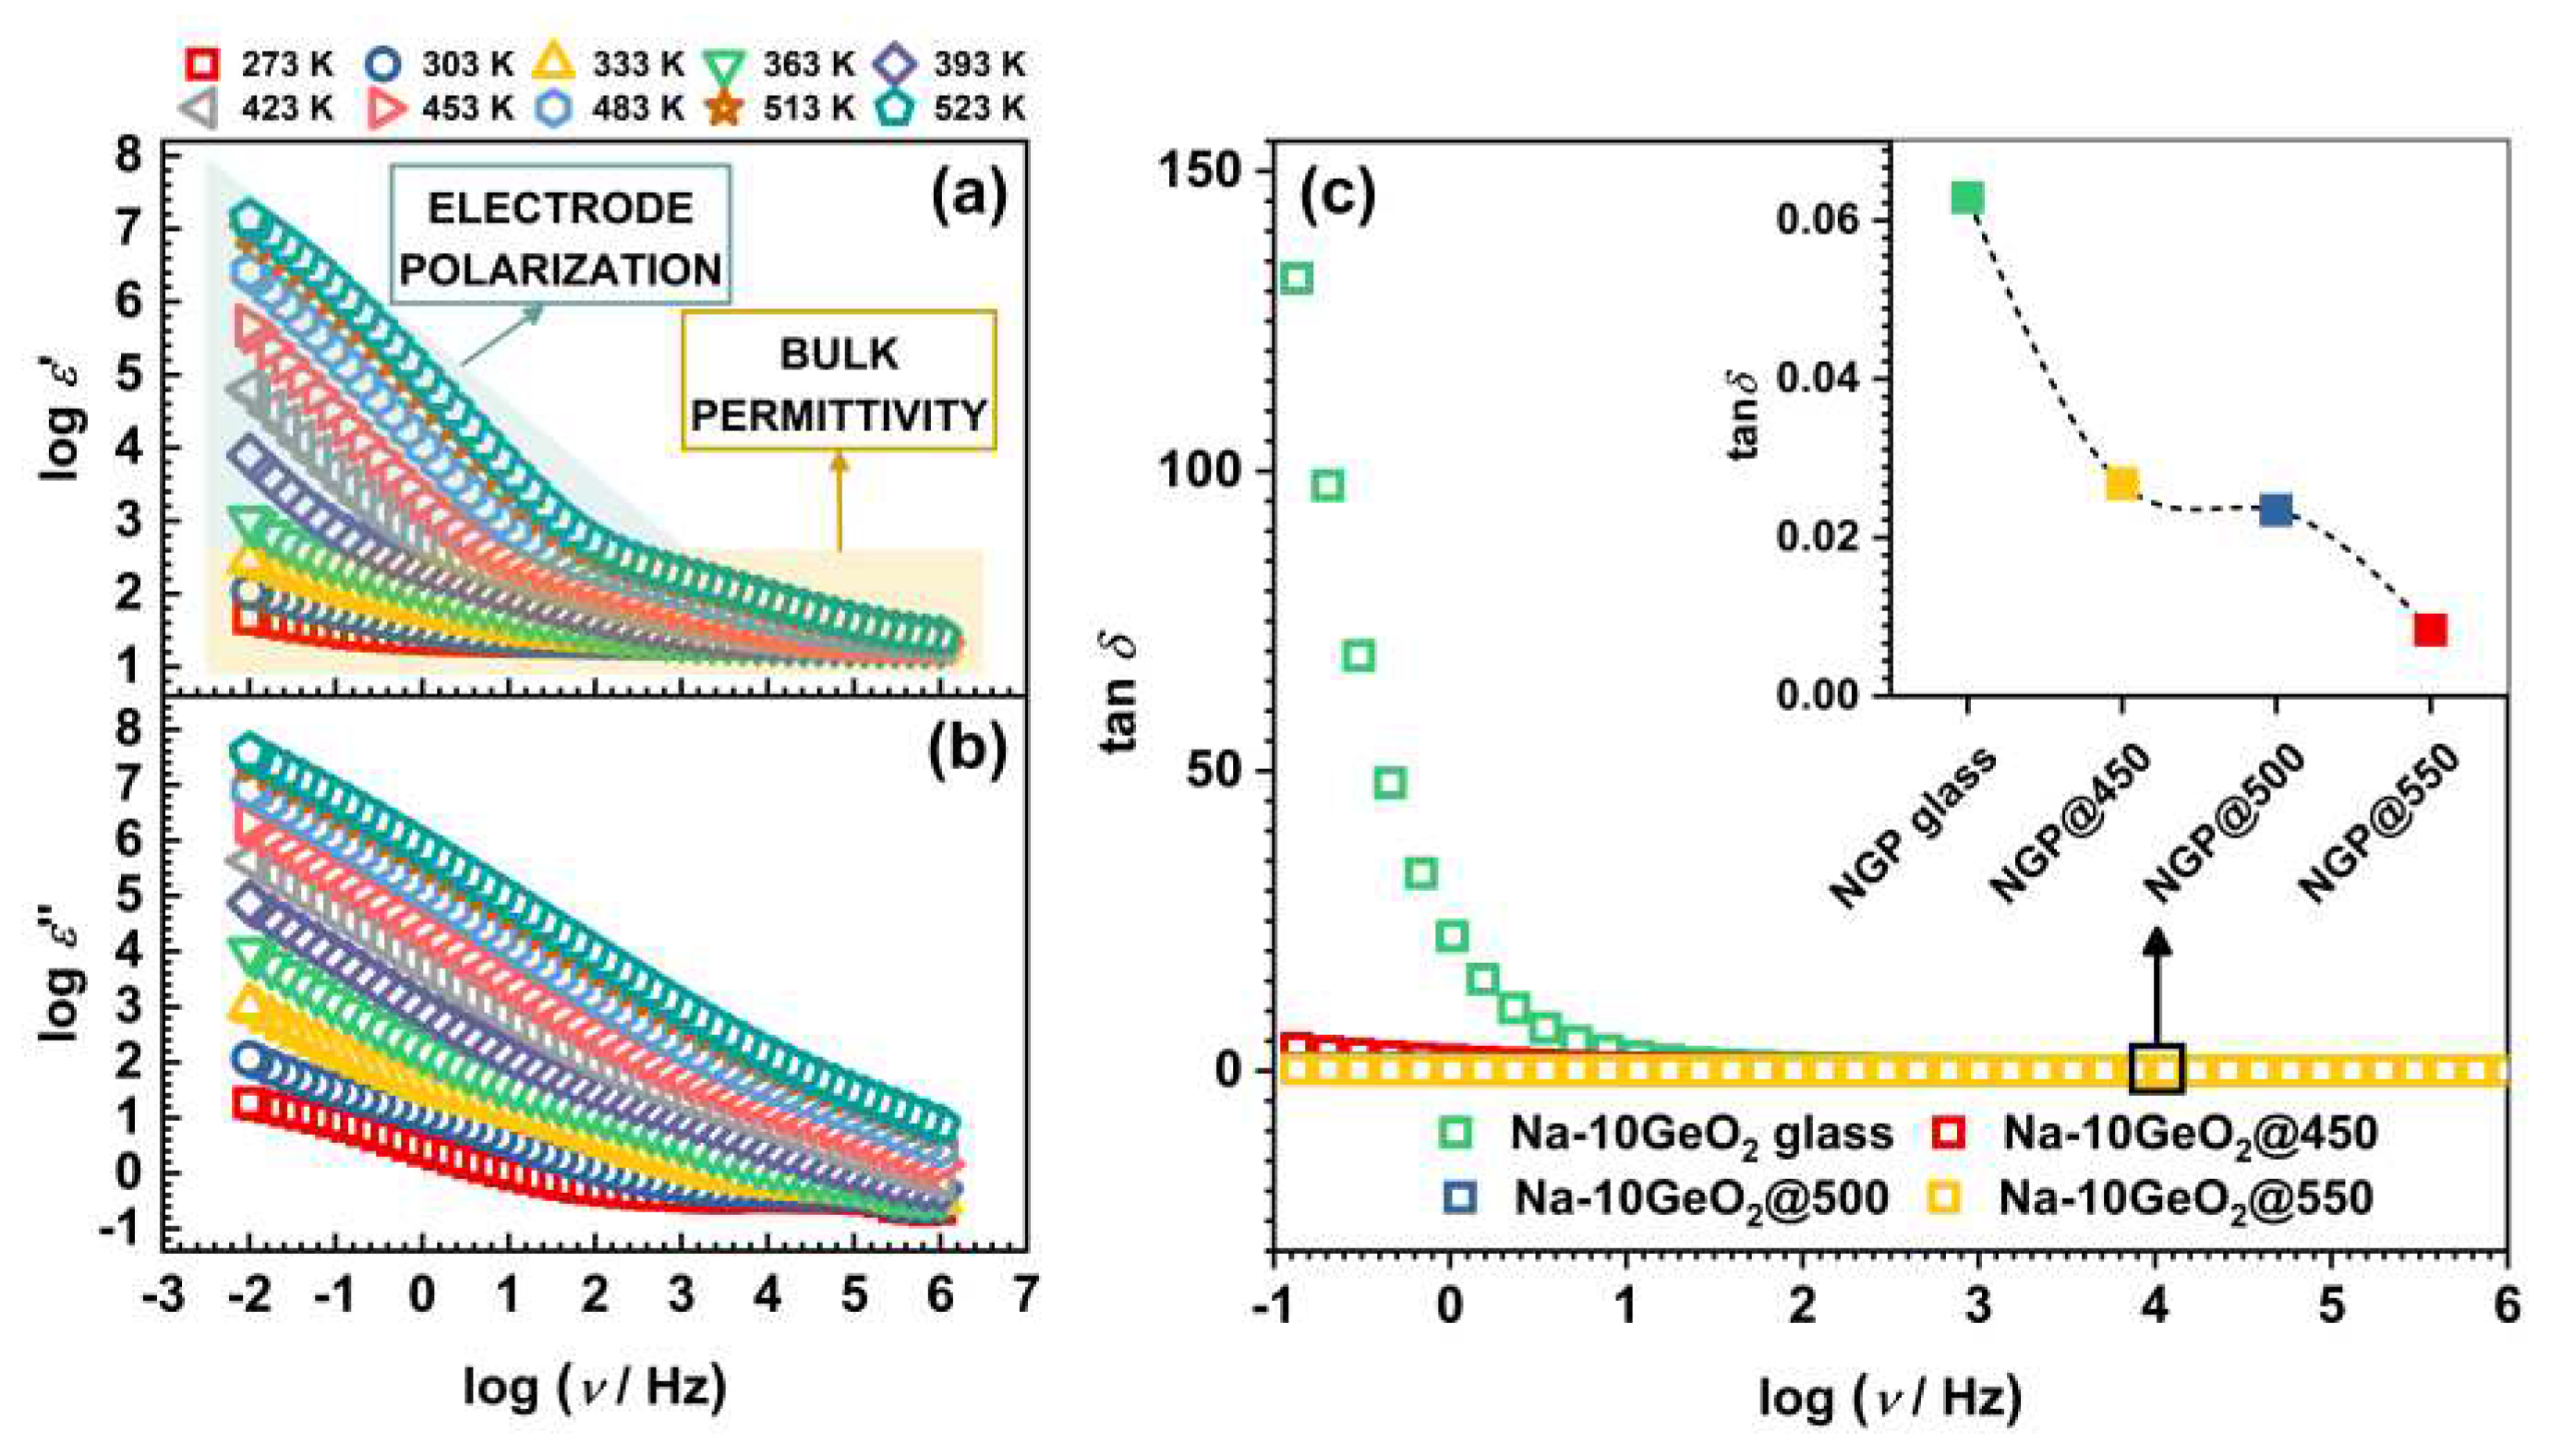
| Sample | σDC (Ω–1 cm–1)a | EDC (kJ mol–1) | ε’(ω) | tanδb |
| NGP glass | 1.81×10⁻⁷ | 71.7 | 13.24 | 0.063 |
| NGP@450 | 2.30×10⁻⁸ | 76.1 | 22.82 | 0.027 |
| NGP@500 | 4.70×10⁻¹⁰ | 94.0 | 20.98 | 0.023 |
| NGP@550 | 1.47×10⁻¹⁰ | 107.0 | 19.37 | 0.008 |
Disclaimer/Publisher’s Note: The statements, opinions and data contained in all publications are solely those of the individual author(s) and contributor(s) and not of MDPI and/or the editor(s). MDPI and/or the editor(s) disclaim responsibility for any injury to people or property resulting from any ideas, methods, instructions or products referred to in the content. |
© 2023 by the authors. Licensee MDPI, Basel, Switzerland. This article is an open access article distributed under the terms and conditions of the Creative Commons Attribution (CC BY) license (http://creativecommons.org/licenses/by/4.0/).


