Submitted:
07 December 2023
Posted:
07 December 2023
You are already at the latest version
Abstract
Keywords:
1. Introduction
2. Materials and Methods
2.1. Study population
2.2. US scanning
2.3. Data analysis
2.4. Exercise
2.4.1. Dumbbell shrugs targeting upper trapezius muscle
2.4.2. Dumbbell curl targeting biceps brachii muscle
2.5. Statistical analysis
3. Results
3.1. Study population
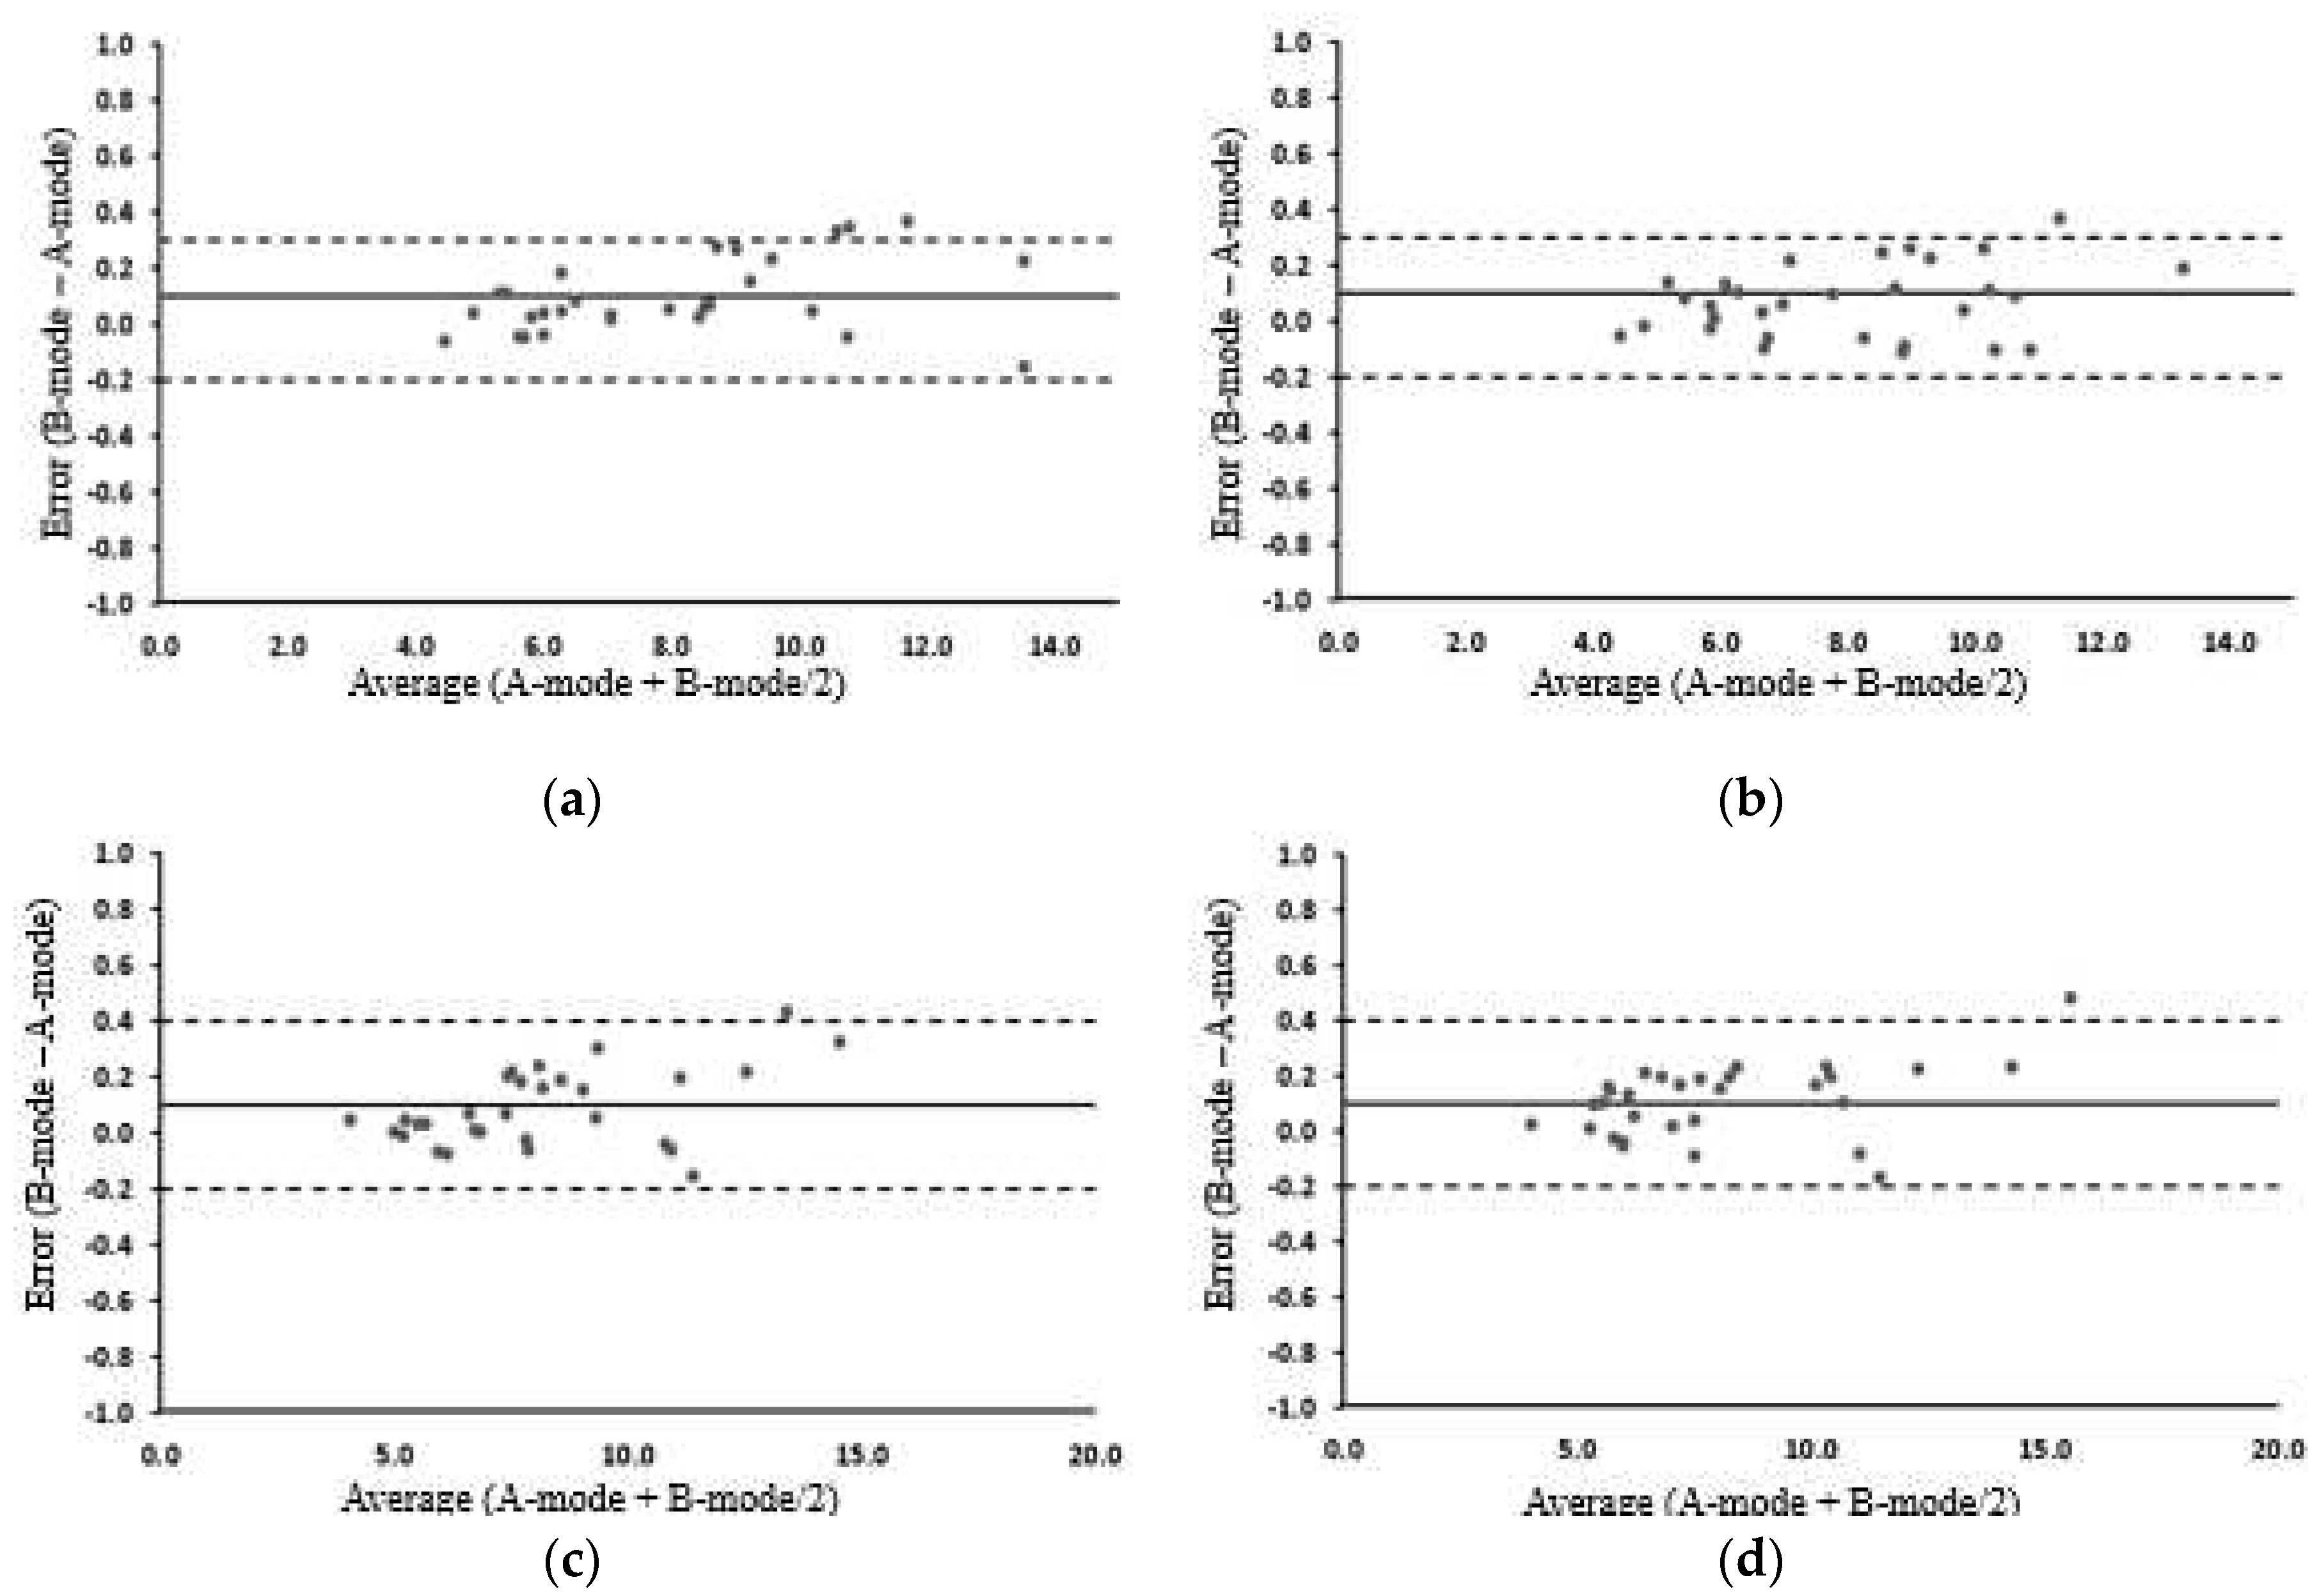
3.2. Changes in SFT before and after exercise
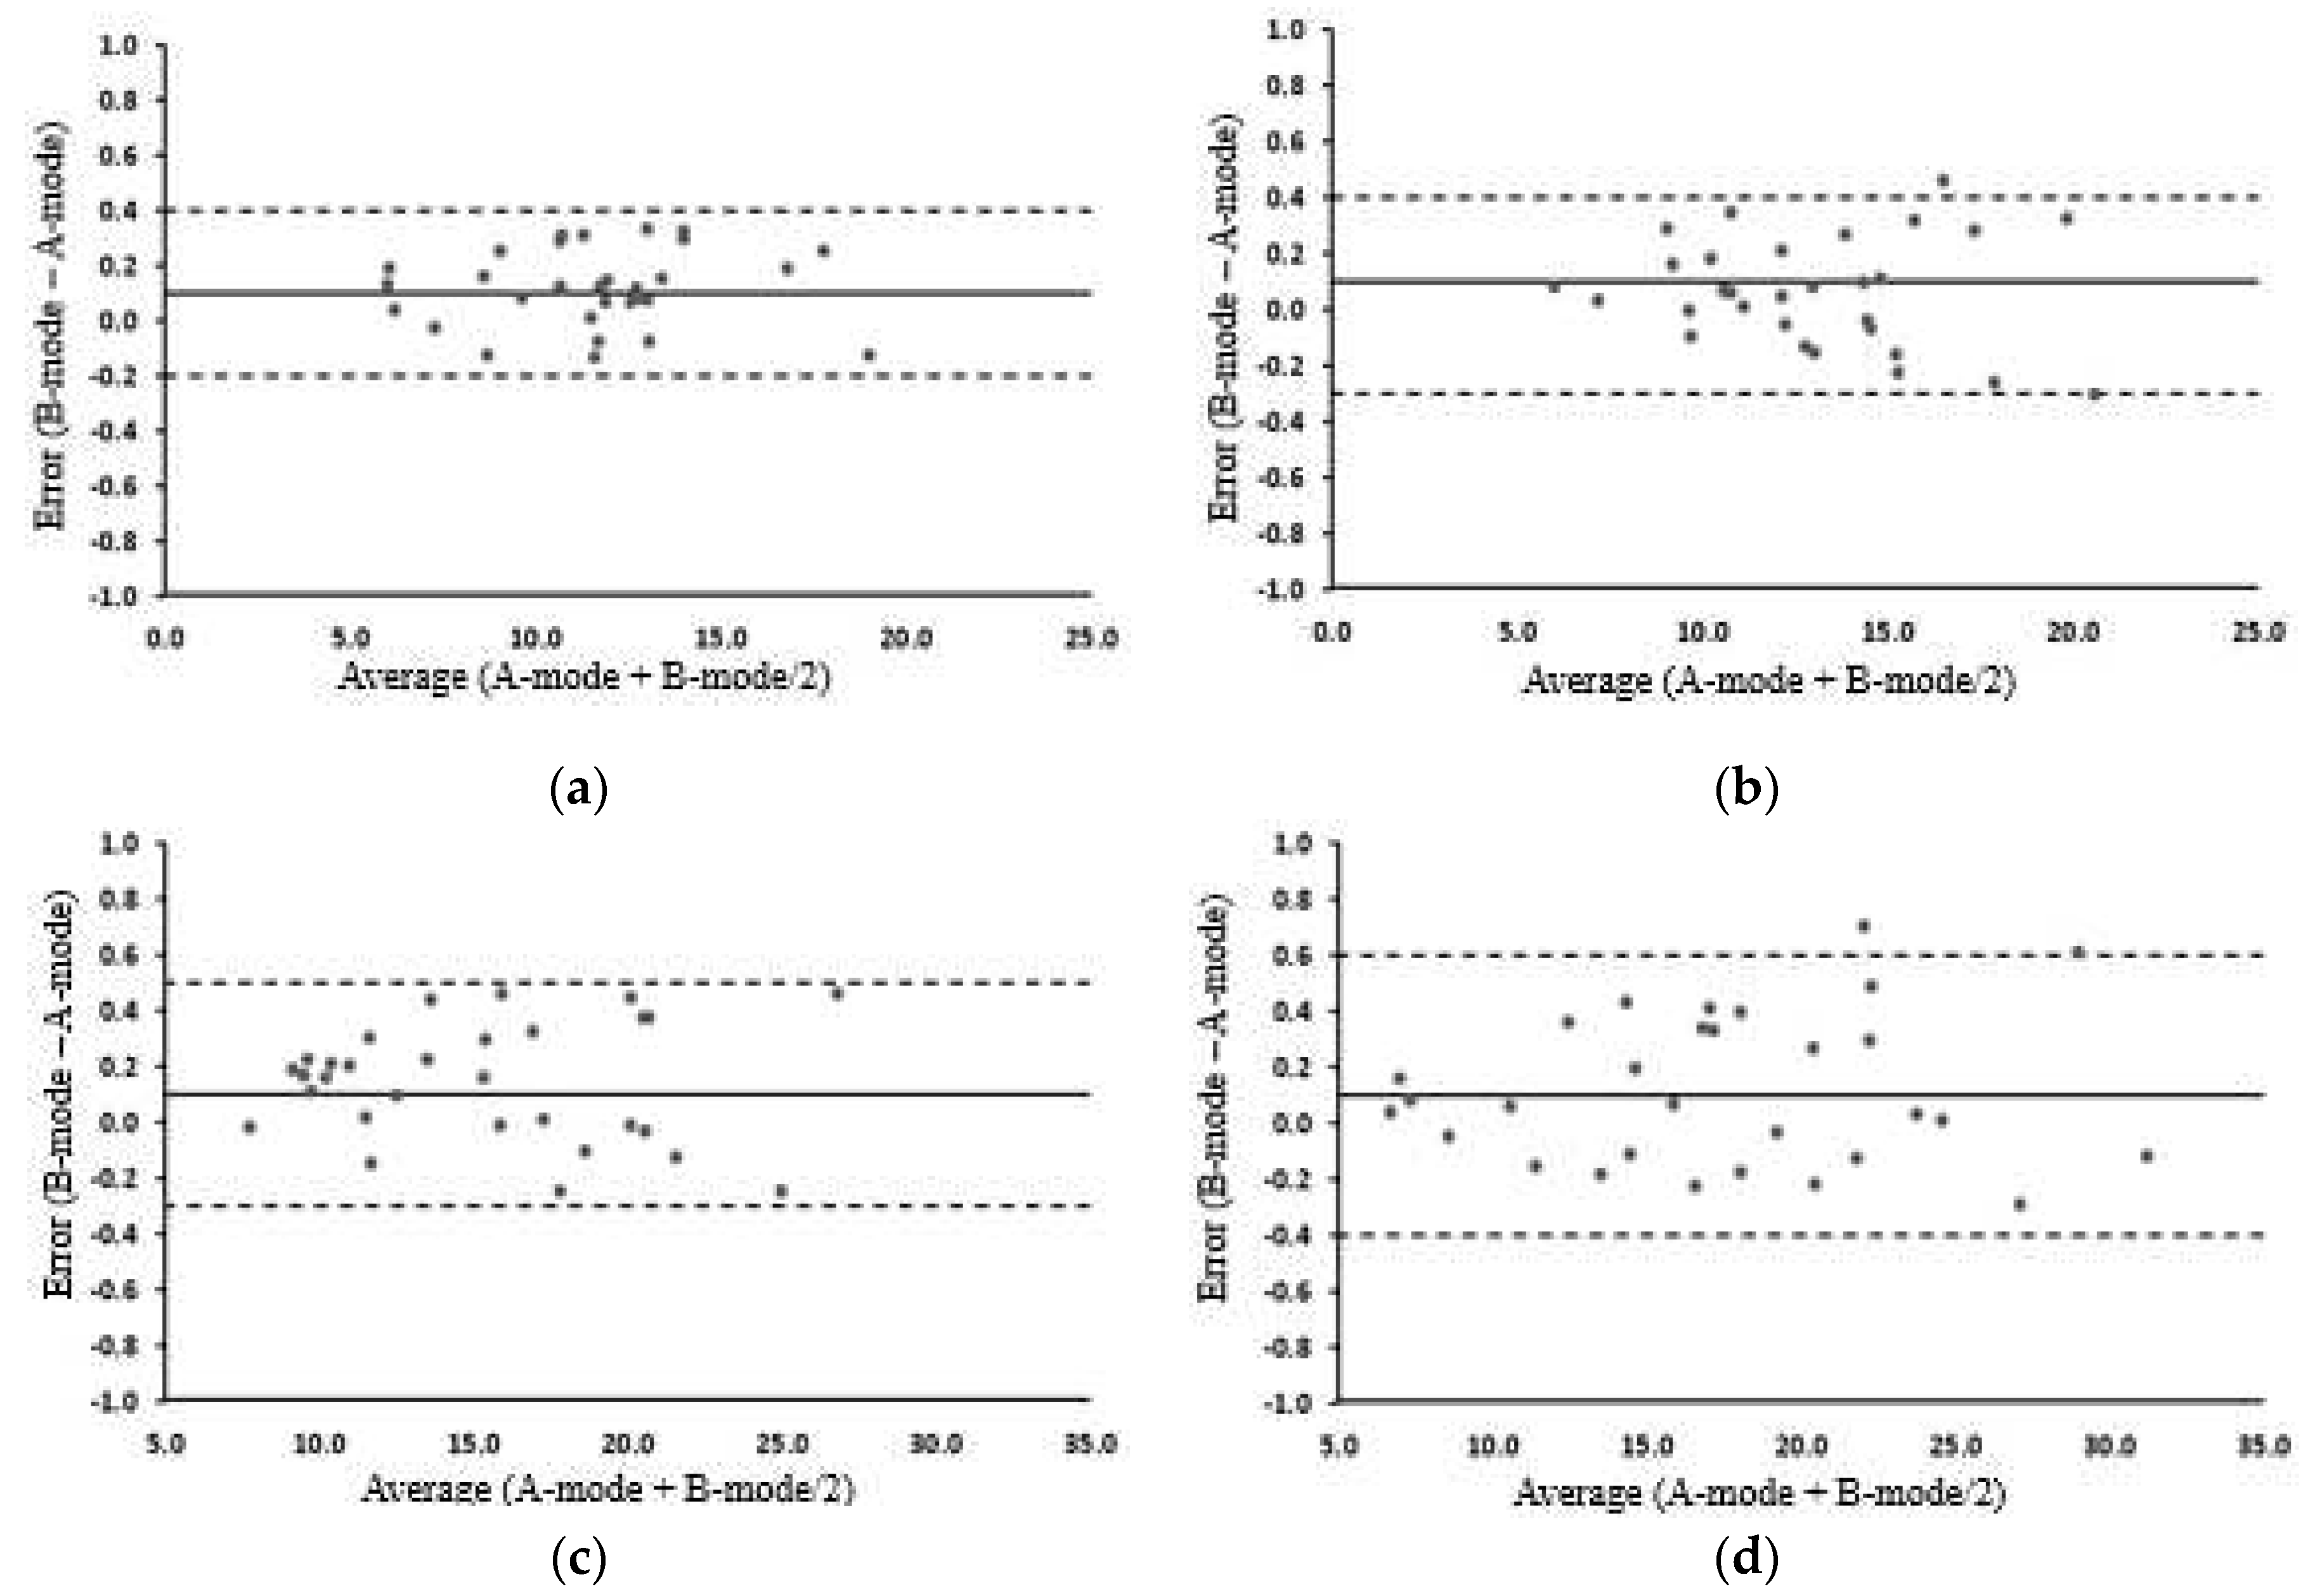
3.3. Changes in MT before and after exercise
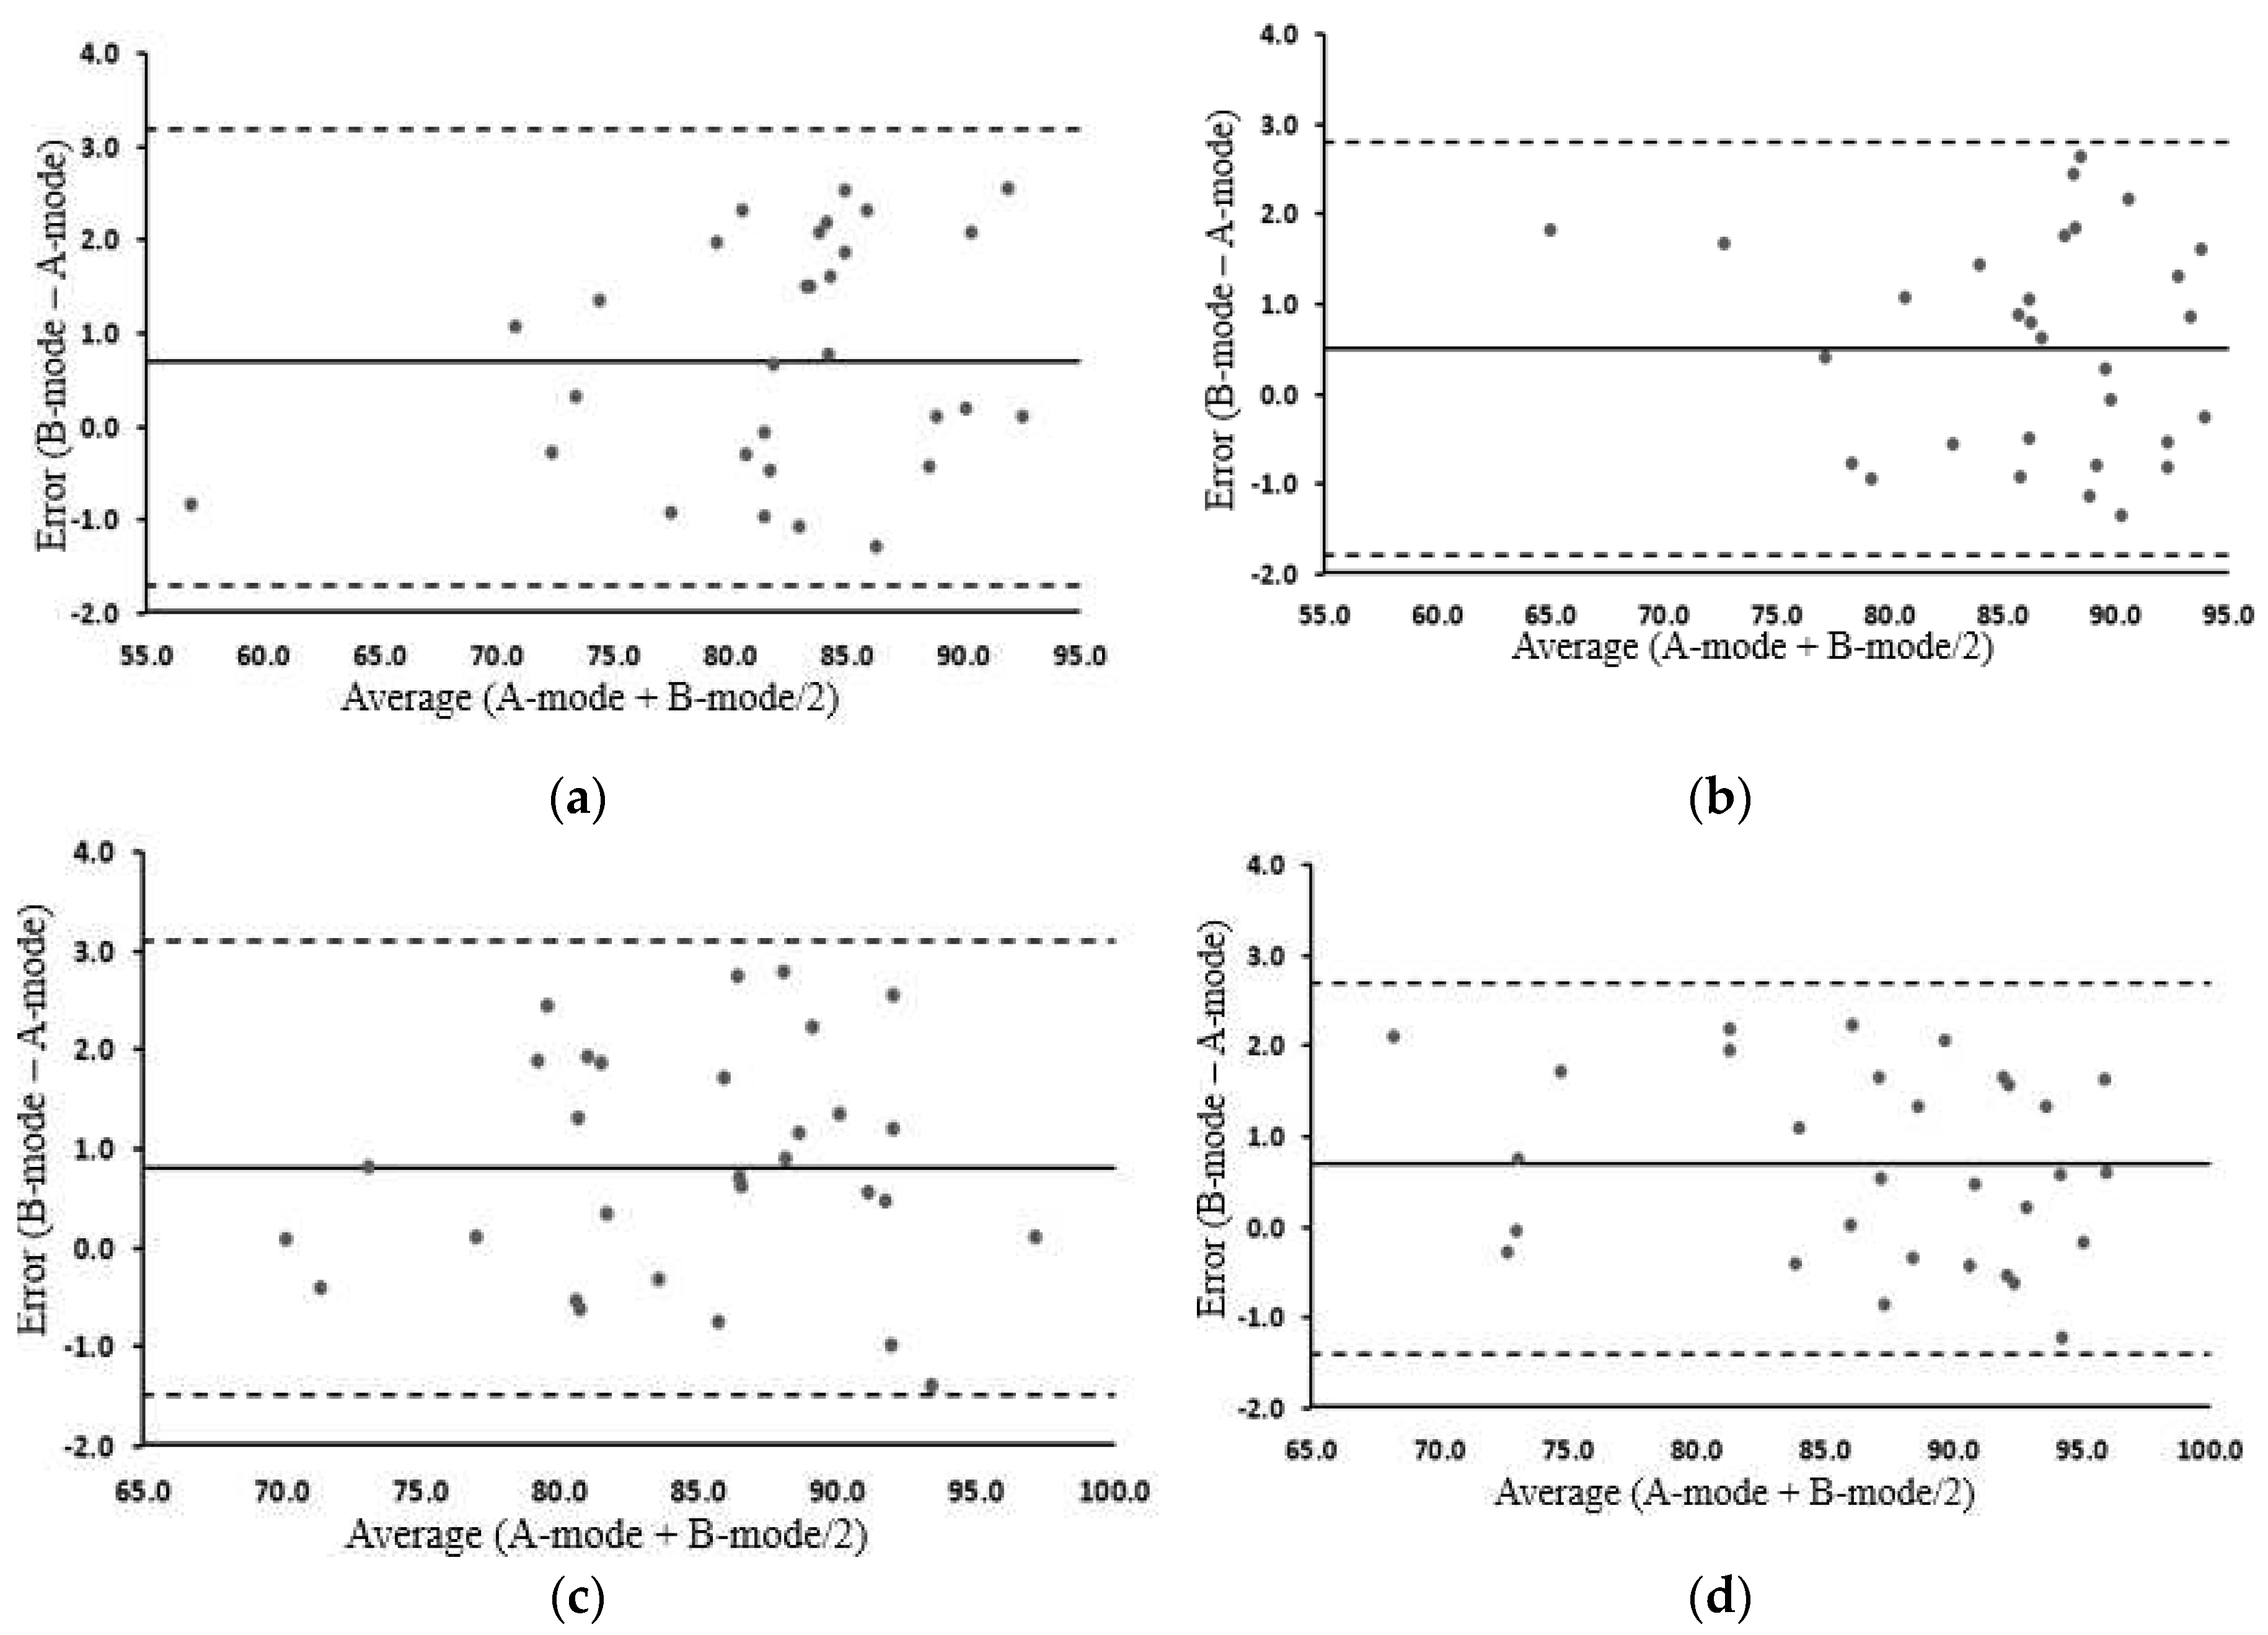
3.4. Changes in MQ before and after exercise
3.5. MT and MQ change before and after exercise in the A-mode and B-mode
4. Discussion
5. Conclusions
Author Contributions
Funding
Institutional Review Board Statement
Informed Consent Statement
Data Availability Statement
Acknowledgments
Conflicts of Interest
References
- Artero, E. G.; Lee, D. C.; Lavie, C. J.; Espana-Romero, V.; Sui, X.; Church, T. S.; Blair, S. N. Effects of muscular strength on cardiovascular risk factors and prognosis. J Cardiopulm Rehabil Prev 2012, 32, 351–358. [Google Scholar] [CrossRef]
- Farsijani, S.; Santanasto, A. J.; Miljkovic, I.; Boudreau, R. M.; Goodpaster, B. H.; Kritchevsky, S. B.; Newman, A. B. The Relationship Between Intermuscular Fat and Physical Performance Is Moderated by Muscle Area in Older Adults. J Gerontol A Biol Sci Med Sci 2021, 76, 115–122. [Google Scholar] [CrossRef]
- Addison, O.; Marcus, R. L.; Lastayo, P. C.; Ryan, A. S. Intermuscular fat: a review of the consequences and causes. Int J Endocrinol 2014, 2014, 309570. [Google Scholar] [CrossRef]
- Mah, J. K.; van Alfen, N. Neuromuscular Ultrasound: Clinical Applications and Diagnostic Values. Can J Neurol Sci 2018, 45, 605–619. [Google Scholar] [CrossRef]
- Watanabe, Y.; Ikenaga, M.; Yoshimura, E.; Yamada, Y.; Kimura, M. Association between echo intensity and attenuation of skeletal muscle in young and older adults: a comparison between ultrasonography and computed tomography. Clin Interv Aging 2018, 13, 1871–1878. [Google Scholar] [CrossRef]
- Stringer, H. J.; Wilson, D. The Role of Ultrasound as a Diagnostic Tool for Sarcopenia. J Frailty Aging 2018, 7, 258–261. [Google Scholar] [CrossRef]
- Storchle, P.; Muller, W.; Sengeis, M.; Lackner, S.; Holasek, S.; Furhapter-Rieger, A. Measurement of mean subcutaneous fat thickness: eight standardised ultrasound sites compared to 216 randomly selected sites. Sci Rep 2018, 8, 16268. [Google Scholar] [CrossRef]
- Ackland, T. R.; Lohman, T. G.; Sundgot-Borgen, J.; Maughan, R. J.; Meyer, N. L.; Stewart, A. D.; Müller, W. Current status of body composition assessment in sport: review and position statement on behalf of the ad hoc research working group on body composition health and performance, under the auspices of the I.O.C. Medical Commission. Sports Med 2012, 42, 227–249. [Google Scholar] [CrossRef]
- Sahinis, C.; Kellis, E. Hamstring Muscle Quality Properties Using Texture Analysis of Ultrasound Images. Ultrasound Med Biol 2023, 49, 431–440. [Google Scholar] [CrossRef]
- Correa-de-Araujo, R.; Harris-Love, M. O.; Miljkovic, I.; Fragala, M. S.; Anthony, B. W.; Manini, T. M. The Need for Standardized Assessment of Muscle Quality in Skeletal Muscle Function Deficit and Other Aging-Related Muscle Dysfunctions: A Symposium Report. Front Physiol 2017, 8, 87. [Google Scholar] [CrossRef]
- Wagner, D. R.; Teramoto, M.; Judd, T.; Gordon, J.; McPherson, C.; Robison, A. Comparison of A-mode and B-mode Ultrasound for Measurement of Subcutaneous Fat. Ultrasound Med Biol 2020, 46, 944–951. [Google Scholar] [CrossRef]
- Wagner, D. R.; Thompson, B. J.; Anderson, D. A.; Schwartz, S. A-mode and B-mode ultrasound measurement of fat thickness: a cadaver validation study. Eur J Clin Nutr 2019, 73, 518–523. [Google Scholar] [CrossRef]
- Bielemann, R. M.; Gonzalez, M. C.; Barbosa-Silva, T. G.; Orlandi, S. P.; Xavier, M. O.; Bergmann, R. B.; Assuncao, M. C.; Grupo de Estudos em Composicao Corporal e, N.-C. Estimation of body fat in adults using a portable A-mode ultrasound. Nutrition 2016, 32, 441–446. [Google Scholar] [CrossRef]
- Cho, Y. K.; Jung, H. N.; Kim, E. H.; Lee, M. J.; Park, J. Y.; Lee, W. J.; Kim, H. K.; Jung, C. H. Association between sarcopenic obesity and poor muscle quality based on muscle quality map and abdominal computed tomography. Obesity (Silver Spring) 2023, 31, 1547–1557. [Google Scholar] [CrossRef]
- Muller, W.; Horn, M.; Furhapter-Rieger, A.; Kainz, P.; Kropfl, J. M.; Maughan, R. J.; Ahammer, H. Body composition in sport: a comparison of a novel ultrasound imaging technique to measure subcutaneous fat tissue compared with skinfold measurement. Br J Sports Med 2013, 47, 1028–1035. [Google Scholar] [CrossRef]
- Kent-Braun, J. A.; Ng, A. V.; Young, K. Skeletal muscle contractile and noncontractile components in young and older women and men. J Appl Physiol (1985) 2000, 88, 662–668. [Google Scholar] [CrossRef]
- Wong, V.; Spitz, R. W.; Bell, Z. W.; Viana, R. B.; Chatakondi, R. N.; Abe, T.; Loenneke, J. P. Exercise induced changes in echo intensity within the muscle: a brief review. J Ultrasound 2020, 23, 457–472. [Google Scholar] [CrossRef]
- Van den Broeck, J.; Héréus, S.; Cattrysse, E.; Raeymaekers, H.; De Maeseneer, M.; Scafoglieri, A. Reliability of Muscle Quantity and Quality Measured With Extended-Field-of-View Ultrasound at Nine Body Sites. Ultrasound in Medicine & Biology 2023, 49, 1544–1549. [Google Scholar] [CrossRef]
- Taber, C. B.; Vigotsky, A.; Nuckols, G.; Haun, C. T. Exercise-Induced Myofibrillar Hypertrophy is a Contributory Cause of Gains in Muscle Strength. Sports Med 2019, 49, 993–997. [Google Scholar] [CrossRef]
- Wackerhage, H.; Schoenfeld, B. J.; Hamilton, D. L.; Lehti, M.; Hulmi, J. J. Stimuli and sensors that initiate skeletal muscle hypertrophy following resistance exercise. J Appl Physiol (1985) 2019, 126, 30–43. [Google Scholar] [CrossRef]
- Fukumoto, Y.; Ikezoe, T.; Yamada, Y.; Tsukagoshi, R.; Nakamura, M.; Mori, N.; Kimura, M.; Ichihashi, N. Skeletal muscle quality assessed from echo intensity is associated with muscle strength of middle-aged and elderly persons. Eur J Appl Physiol 2012, 112, 1519–1525. [Google Scholar] [CrossRef]
- Goodpaster, B. H.; Carlson, C. L.; Visser, M.; Kelley, D. E.; Scherzinger, A.; Harris, T. B.; Stamm, E.; Newman, A. B. Attenuation of skeletal muscle and strength in the elderly: The Health ABC Study. J Appl Physiol (1985) 2001, 90, 2157–2165. [Google Scholar] [CrossRef]
- Yitzchaki, N.; Kuehne, T. E.; Mouser, J. G.; Buckner, S. L. Can changes in echo intensity be used to detect the presence of acute muscle swelling? Physiol Meas 2019, 40, 045002. [Google Scholar] [CrossRef]
- Wong, V.; Abe, T.; Chatakondi, R. N.; Bell, Z. W.; Spitz, R. W.; Dankel, S. J.; Loenneke, J. P. The influence of biological sex and cuff width on muscle swelling, echo intensity, and the fatigue response to blood flow restricted exercise. J Sports Sci 2019, 37, 1865–1873. [Google Scholar] [CrossRef]
- Hill, J. C.; Millán, I. S. Validation of musculoskeletal ultrasound to assess and quantify muscle glycogen content. A novel approach. Phys Sportsmed 2014, 42, 45–52. [Google Scholar] [CrossRef]
- Dankel, S. J.; Abe, T.; Bell, Z. W.; Jessee, M. B.; Buckner, S. L.; Mattocks, K. T.; Mouser, J. G.; Loenneke, J. P. The Impact of Ultrasound Probe Tilt on Muscle Thickness and Echo-Intensity: A Cross-Sectional Study. J Clin Densitom 2020, 23, 630–638. [Google Scholar] [CrossRef]
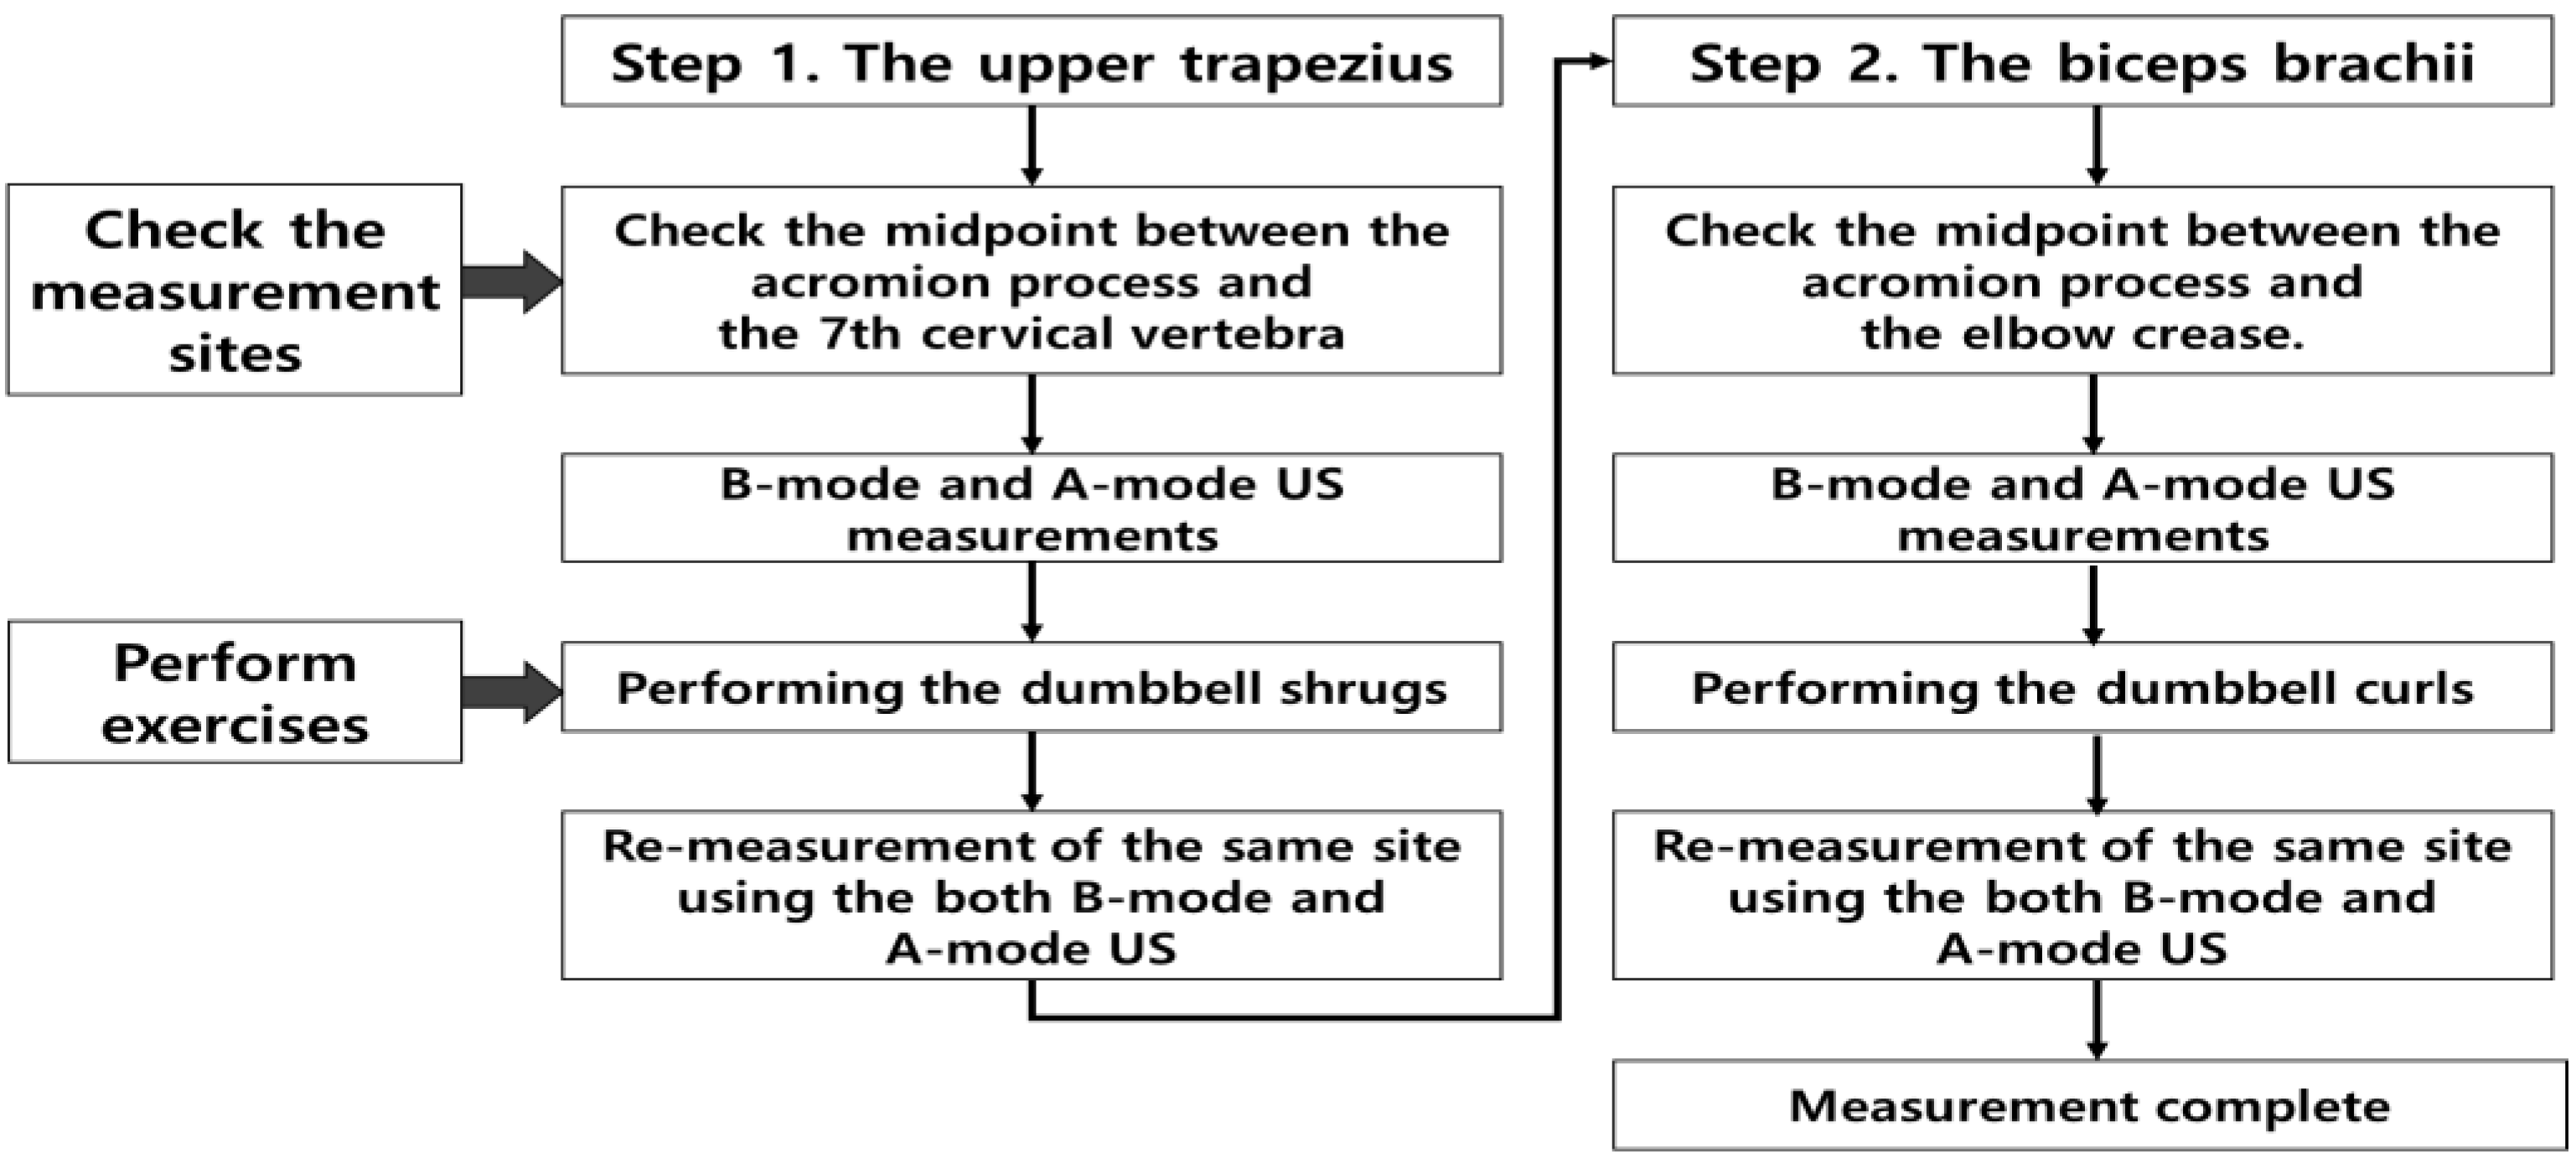
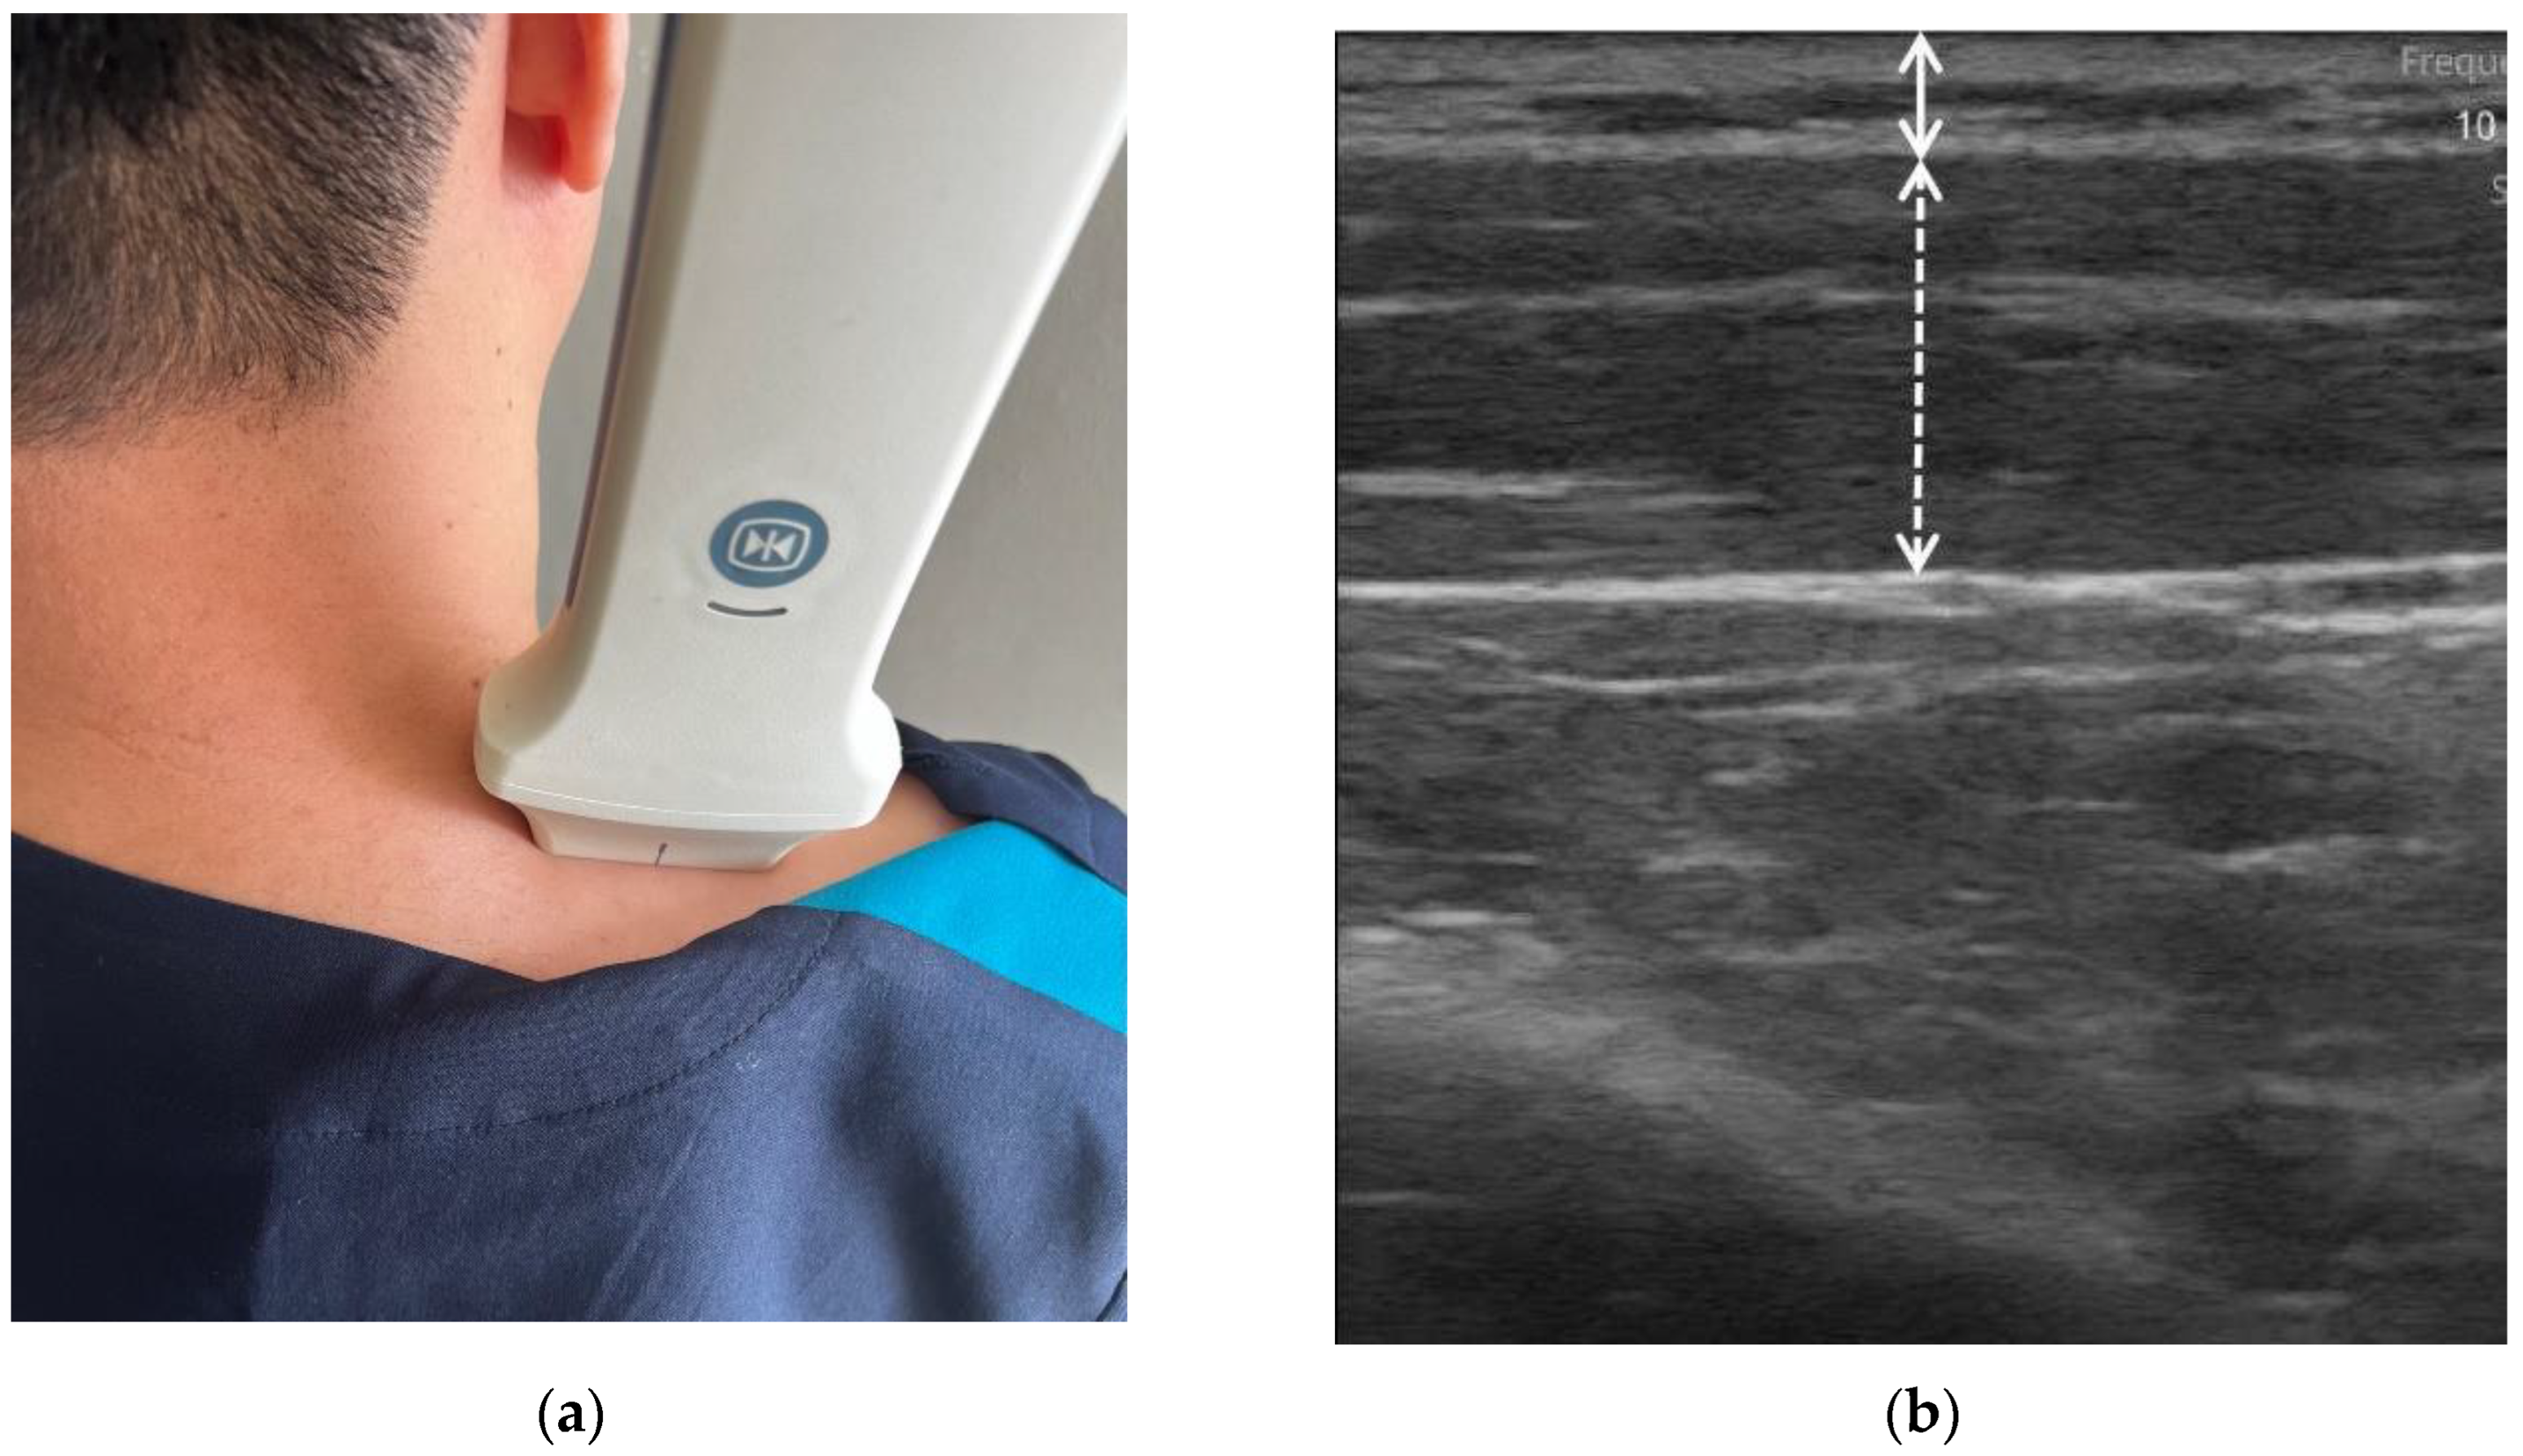
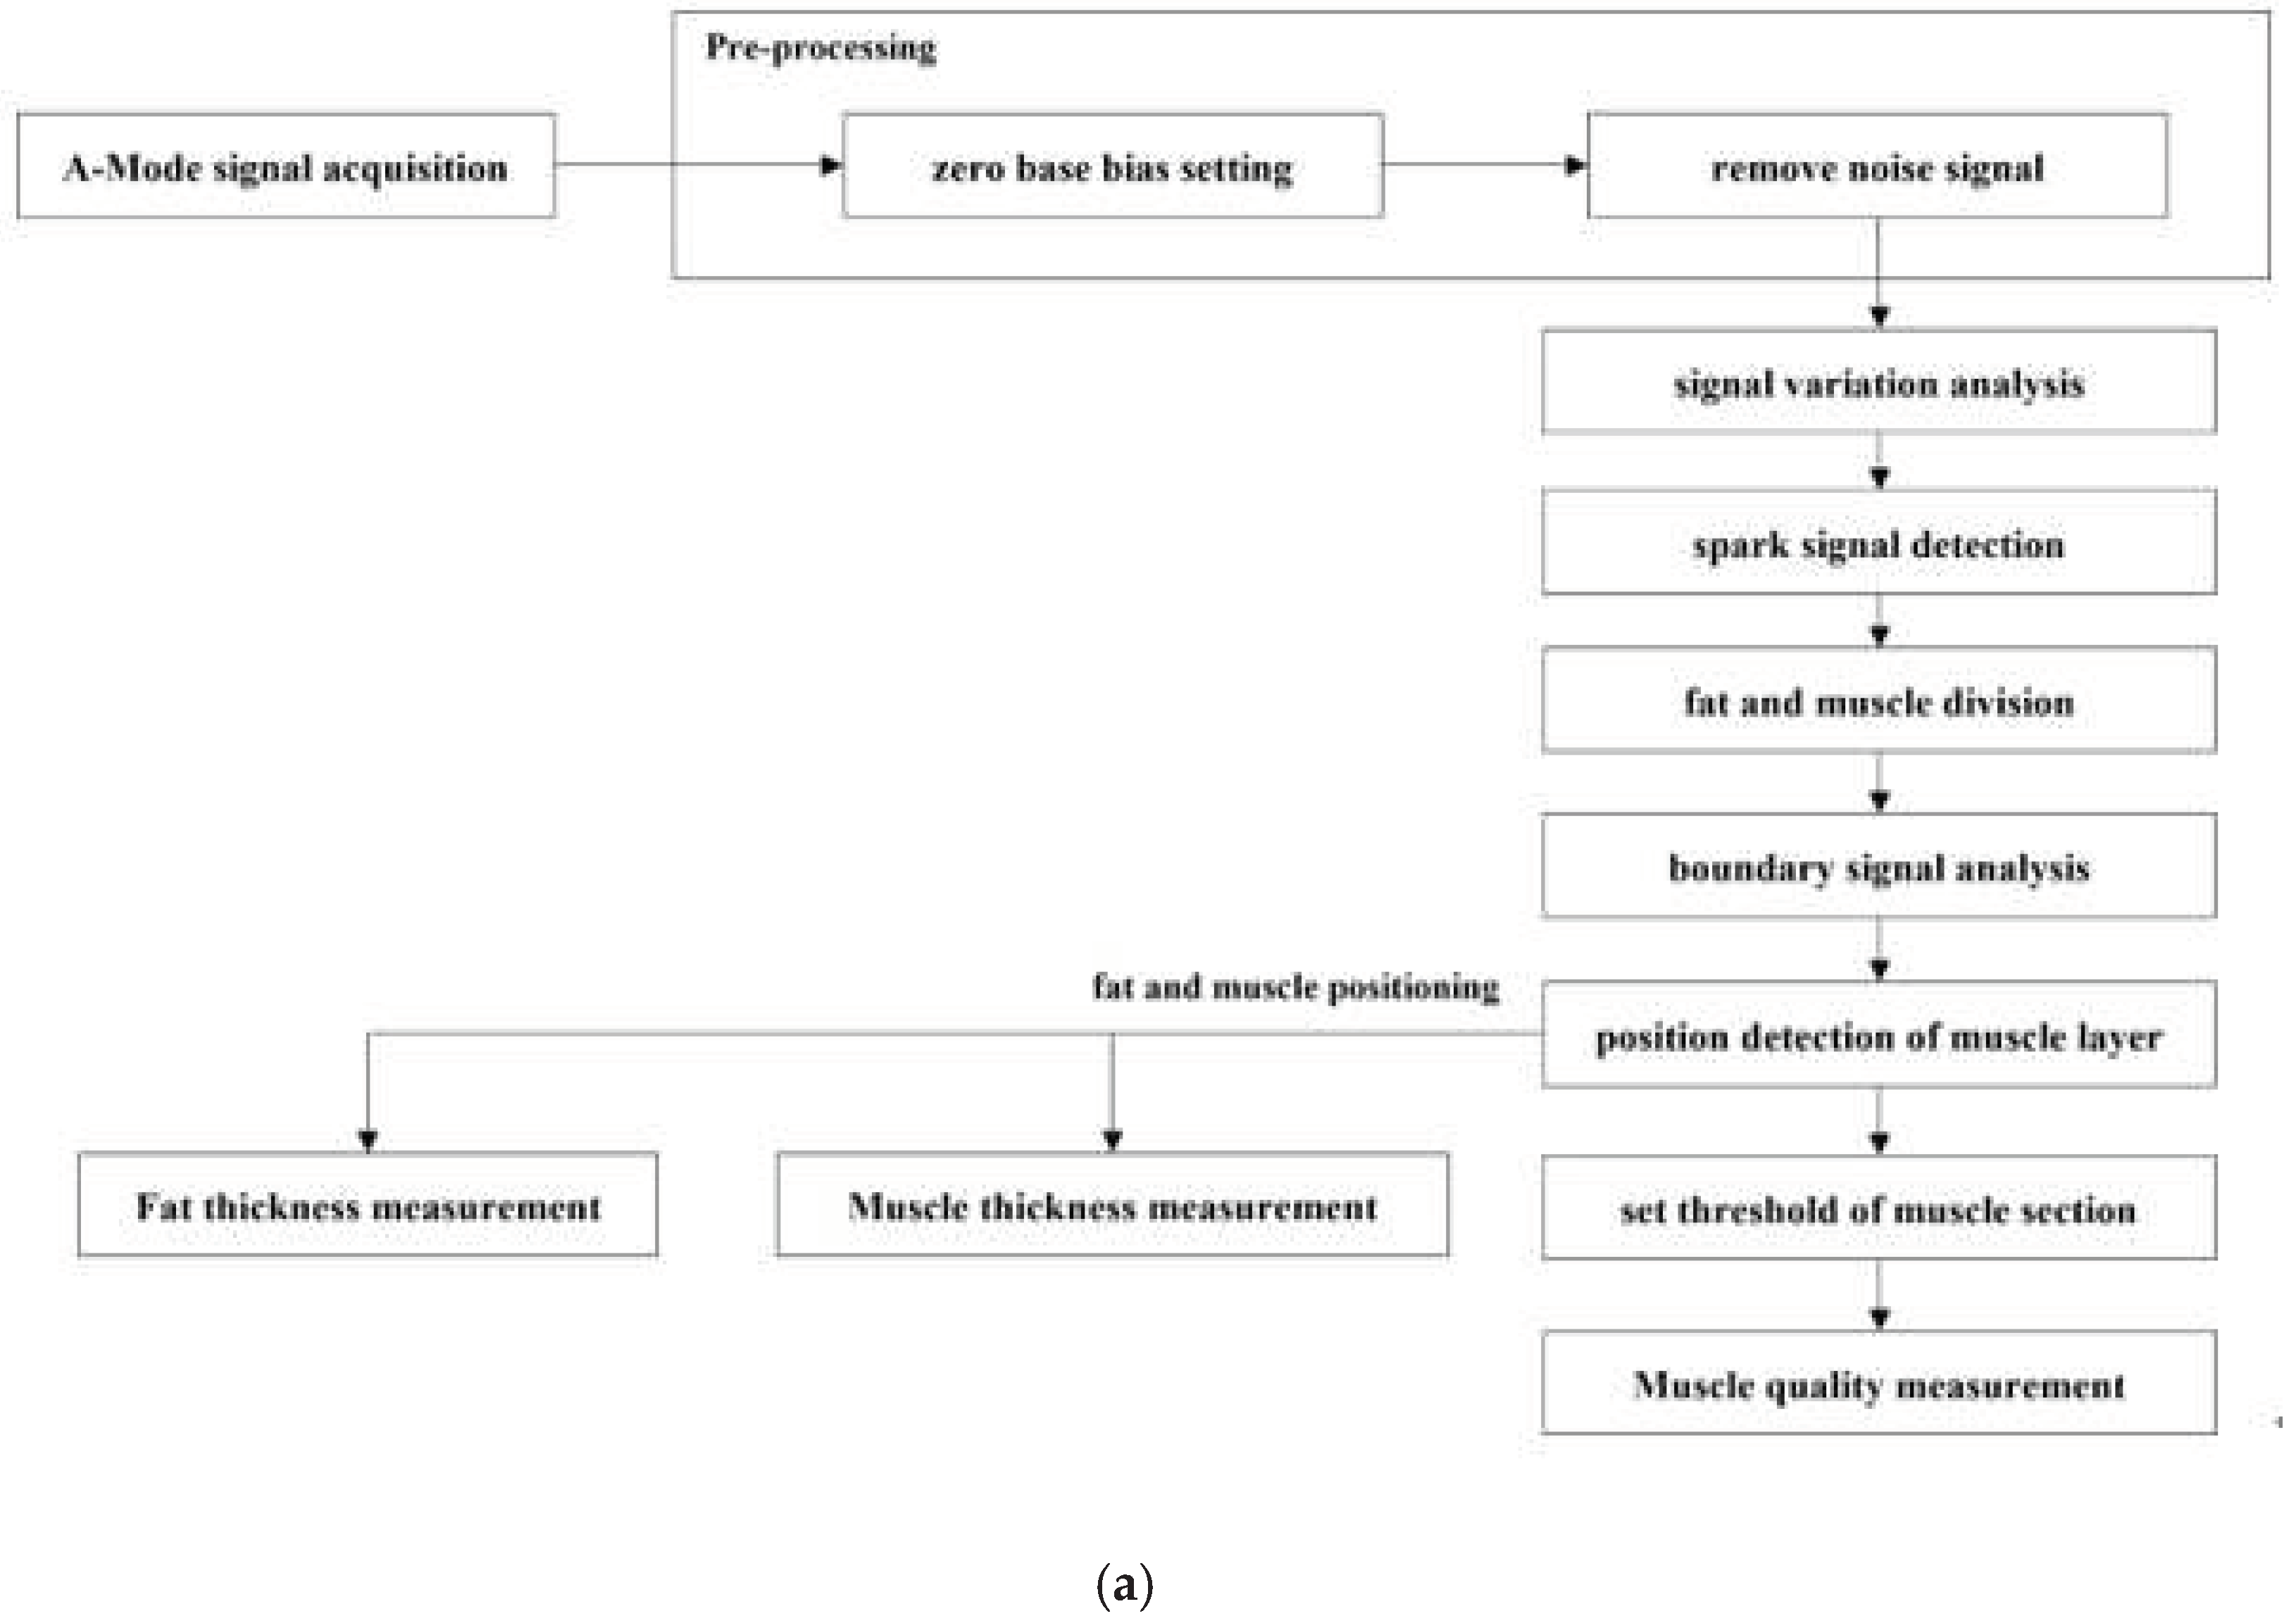
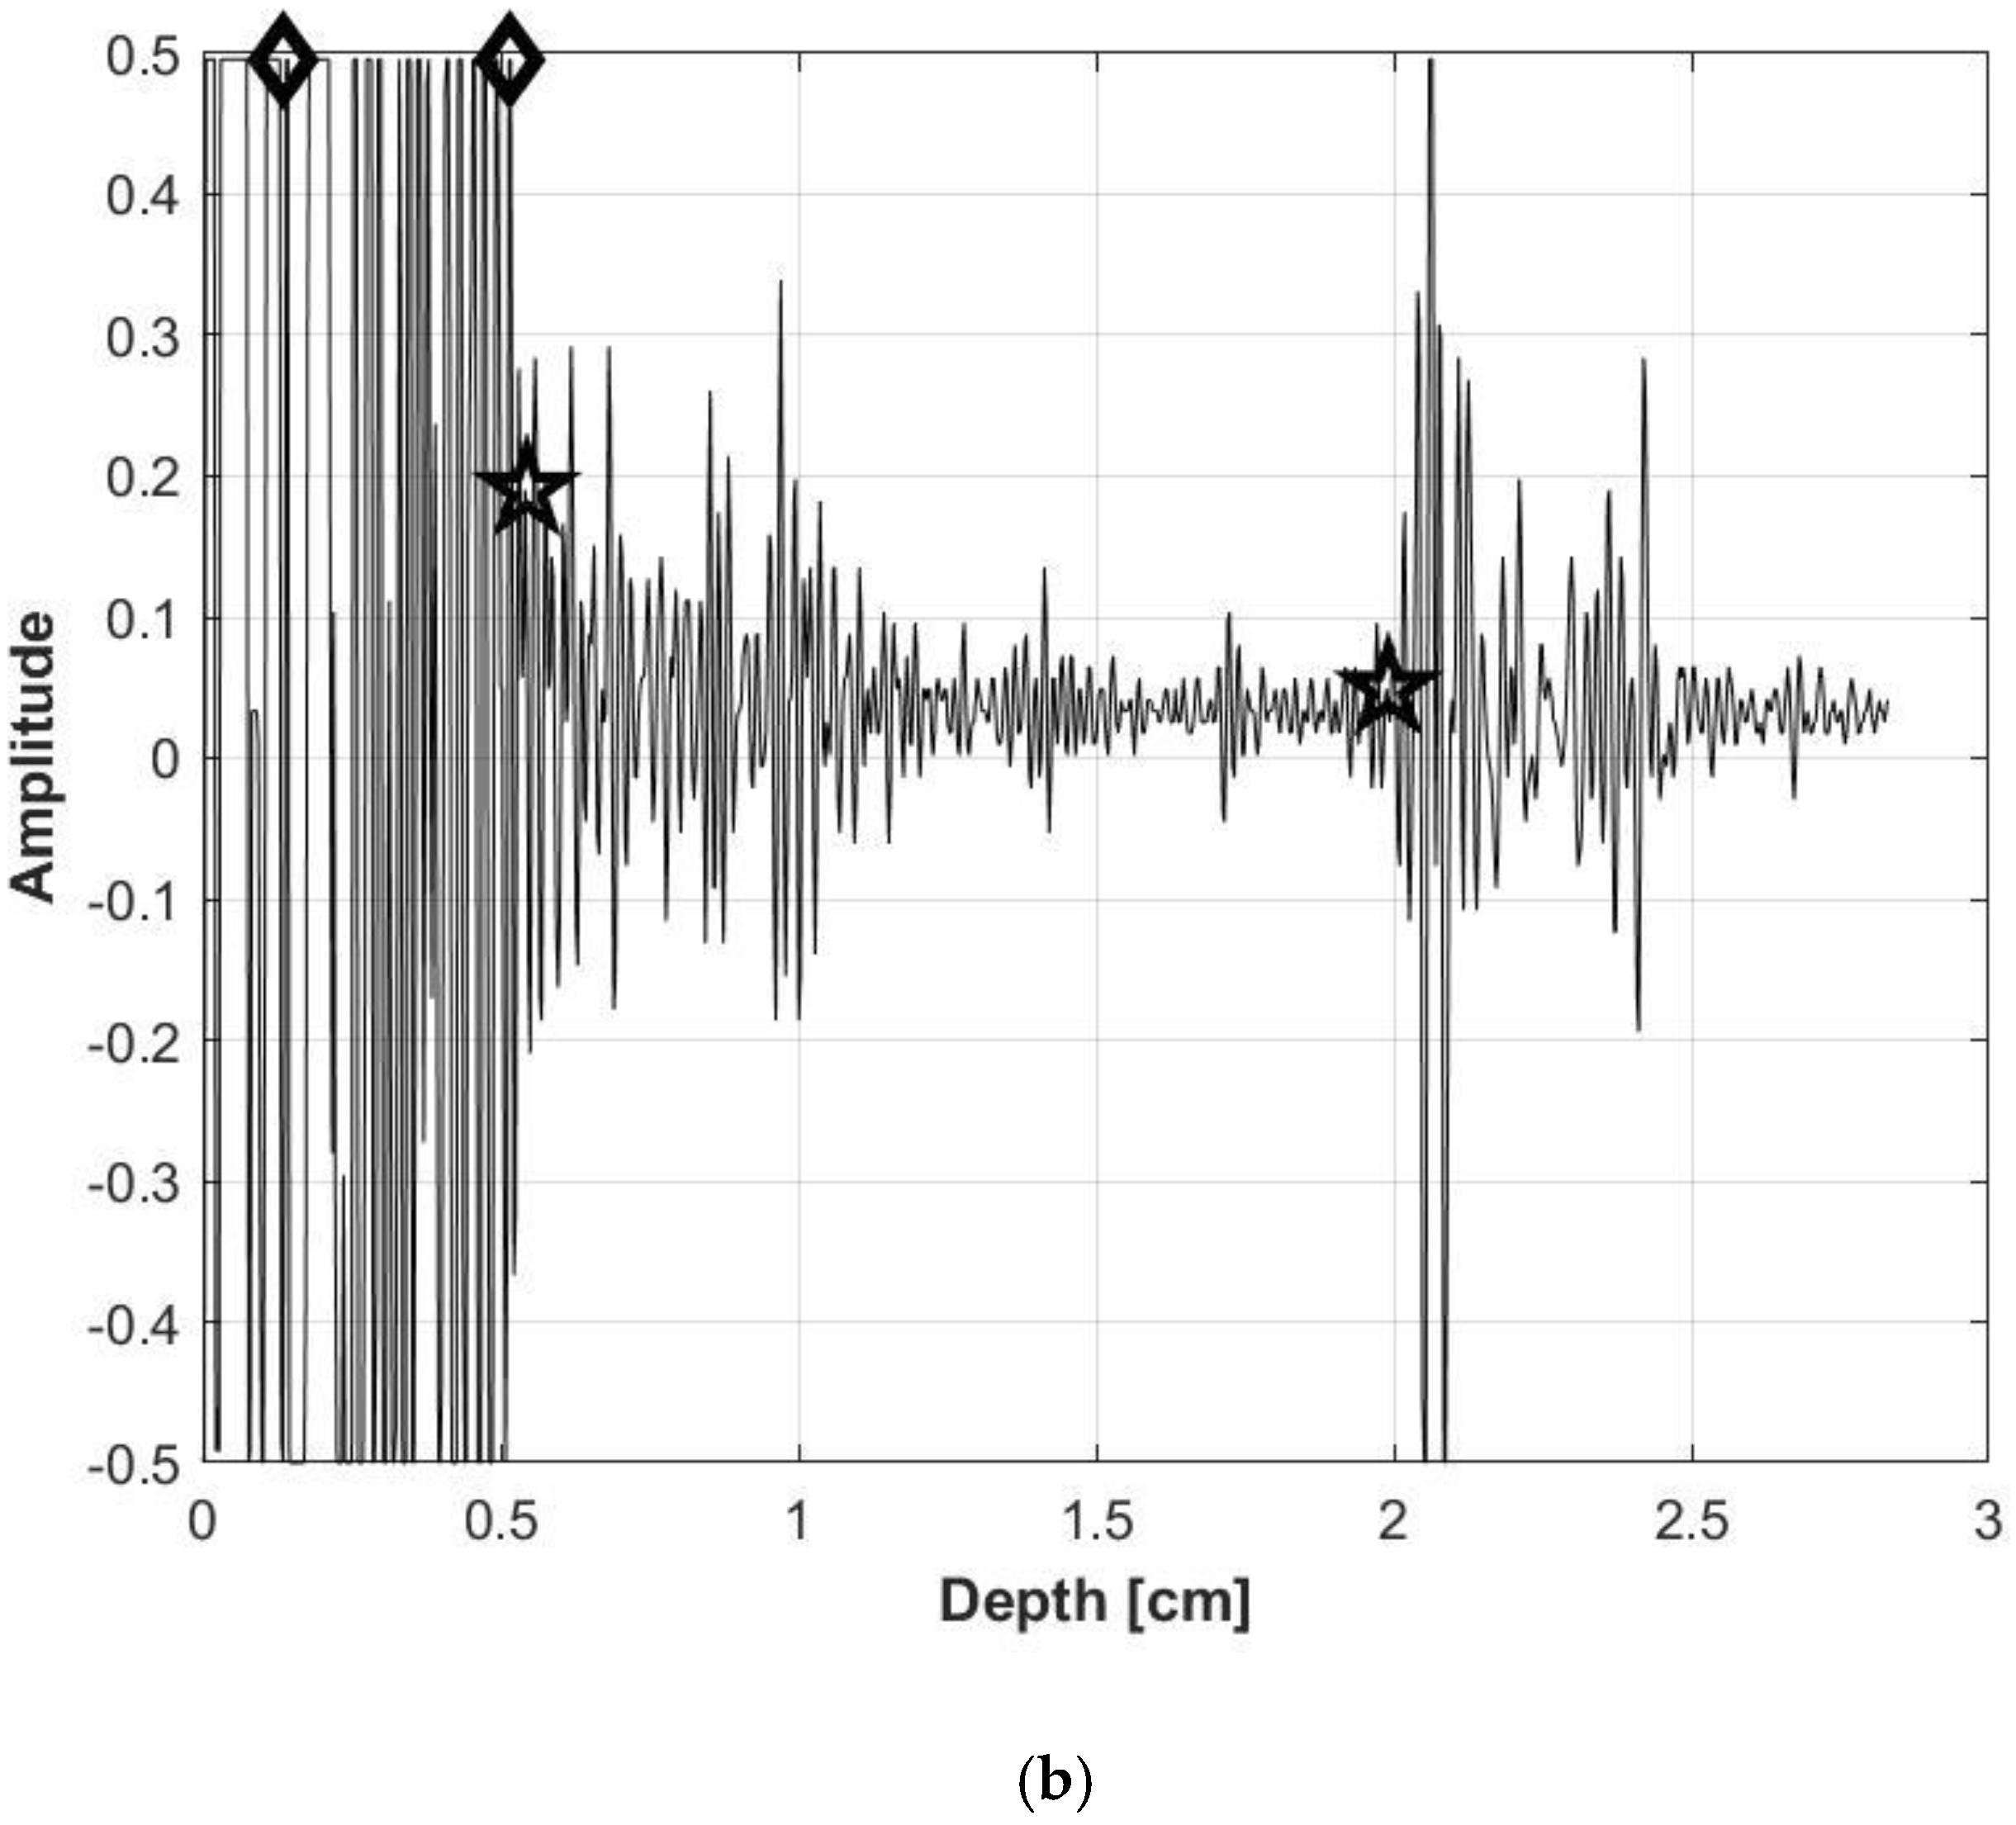
| Parameter | Male group (n=15, mean ± SD1) |
Female group (n=15, mean ± SD) |
P-value |
|---|---|---|---|
| Age (years) | 27.5 ± 2.6 | 30.5 ± 6.1 | 0.092 |
| Height (cm) | 175.4 ± 5.9 | 163.3 ± 6.9 | < 0.001 |
| Weight (kg) | 74.5 ± 11.0 | 56.2 ± 6.9 | < 0.001 |
| BMI (kg/m2) | 24.2 ± 3.2 | 21.1 ± 2.4 | 0.006 |
| Pre-exercise | Post-exercise | |||||||
|---|---|---|---|---|---|---|---|---|
| Biomarker | A-mode | B-mode | MD | ICCs | A-mode | B-mode | MD | ICCs |
| Trapezius | 8.06 ±2.45 | 8.14±2.50 | -0.09 | 0.998 | 7.99±2.20 | 8.06±2.24 | -0.06 | 0.998 |
| Male | 7.38±2.08 | 7.44±2.14 | -0.06 | 0.998 | 7.40±2.08 | 7.44±2.11 | -0.04 | 0.998 |
| Female | 8.73±2.67 | 8.84±2.71 | -0.11 | 0.998 | 8.59±2.23 | 8.67±2.26 | -0.08 | 0.998 |
| Biceps brachii | 8.19 ±2.58 | 8.27±2.65 | -0.08 | 0.998 | 8.07±2.80 | 8.18±2.86 | -0.10 | 0.998 |
| Male | 7.00±1.37 | 7.05±1.44 | -0.05 | 0.998 | 6.49±1.03 | 6.58±1.06 | -0.09 | 0.997 |
| Female | 9.31±2.78 | 9.41±2.85 | -0.10 | 0.998 | 9.39±3.08 | 9.53±3.17 | -0.14 | 0.998 |
| Pre-exercise | Post-exercise | |||||||
|---|---|---|---|---|---|---|---|---|
| Biomarker | A-mode | B-mode | MD | ICCs | A-mode | B-mode | MD | ICCs |
| Trapezius | 11.56±3.13 | 11.68±3.14 | -0.11 | 0.998 | 13.00±3.49 | 13.06±3.47 | -0.06 | 0.998 |
| Male | 12.70±3.29 | 12.80±3.28 | -0.10 | 0.998 | 14.82±3.01 | 14.80±3.01 | 0.02 | 0.998 |
| Female | 10.43±2.59 | 10.56±2.64 | -0.12 | 0.998 | 11.18±3.00 | 11.31±3.06 | -0.14 | 0.998 |
| Biceps brachii | 15.31±5.04 | 15.45±5.03 | -0.14 | 0.999 | 17.46±6.36 | 17.58±6.39 | -0.11 | 0.999 |
| Male | 17.52±5.83 | 17.57±5.79 | -0.06 | 0.999 | 20.11±7.62 | 20.19±7.62 | -0.08 | 0.999 |
| Female | 14.28±3.40 | 14.50±3.49 | -0.22 | 0.997 | 16.52±3.51 | 16.64±3.64 | -0.12 | 0.996 |
| Pre-exercise | Post-exercise | |||||||
|---|---|---|---|---|---|---|---|---|
| Biomarker | A-mode | B-mode | MD | ICCs | A-mode | B-mode | MD | ICCs |
| Trapezius | 81.80±7.10 | 82.53±7.43 | -0.73 | 0.981 | 86.01±6.65 | 86.53±6.51 | -0.51 | 0.981 |
| Male | 80.37±8.48 | 81.01±8.73 | -0.64 | 0.987 | 87.06±4.57 | 87.67±4.74 | -0.61 | 0.951 |
| Female | 83.23±5.29 | 84.05±5.75 | -0.83 | 0.966 | 84.97±8.27 | 85.39±7.91 | -0.42 | 0.992 |
| Biceps brachii | 84.49±6.70 | 85.30±6.76 | -0.81 | 0.978 | 86.53±7.87 | 87.21±7.65 | -0.67 | 0.988 |
| Male | 87.60±6.80 | 88.41±6.33 | -0.81 | 0.981 | 88.38±9.14 | 88.99±8.49 | -0.61 | 0.993 |
| Female | 82.61±5.37 | 83.37±5.74 | -0.77 | 0.971 | 86.79±5.39 | 87.70±5.33 | -0.91 | 0.971 |
| MT change | MQ change | |||
|---|---|---|---|---|
| p-value in A-mode | p-value in B-mode | p-value in A-mode | p-value in B-mode | |
| Trapezius muscle | 0.0012 | 0.0019 | 0.0056 | 0.0102 |
| Male | 0.0000 | 0.0002 | 0.0001 | 0.0003 |
| Female | 0.2885 * | 0.2867 * | 0.4834 * | 0.5868 * |
| Biceps brachii | 0.0231 | 0.0244 | 0.1866 * | 0.1887 * |
| Male | 0.2675 * | 0.2572 * | 0.9872 * | 0.8795 * |
| Female | 0.0003 | 0.0008 | 0.0013 | 0.0006 |
Disclaimer/Publisher’s Note: The statements, opinions and data contained in all publications are solely those of the individual author(s) and contributor(s) and not of MDPI and/or the editor(s). MDPI and/or the editor(s) disclaim responsibility for any injury to people or property resulting from any ideas, methods, instructions or products referred to in the content. |
© 2023 by the authors. Licensee MDPI, Basel, Switzerland. This article is an open access article distributed under the terms and conditions of the Creative Commons Attribution (CC BY) license (http://creativecommons.org/licenses/by/4.0/).


