1. Introduction
Water contaminated by microbial pathogens pose a considerable risk to public health in general, as they are responsible for outbreaks of waterborne diseases and thus lead to a high incidence of morbidity and mortality, especially in underdeveloped countries [
1,
2,
3]. Diseases such as cholera, polio, dysentery, hepatitis A and diarrhea are related to poor sanitation and contaminated water. Of all of them, diarrhea is considered the biggest cause of preventable deaths. Recent data from WHO (World Health Organization) shows that 829,000 people from low- and middle-income countries die each year due to inadequate water, sanitation and hygiene. Diarrhea represents 60% of the total deaths [
4,
5].
Viruses and bacteria are among the main pathogens that cause waterborne diseases [
6,
7]. Enteric viruses are so named because they are microorganisms excreted in the feces of infected individuals and that can contaminate humans through direct person-to-person contact through fomites, droplets and contact with secretions or are capable of contaminating indirectly through ingestion of contaminated water or food or through recreational activities in aquatic environments[
3]. They have been found in both surface and groundwater sources [
8].
Infected individuals are able to shed extremely high numbers in the stool, typically between 10
5 and 10
12 virus particles/gram of stool, and over the course of several weeks after infection [
9]. Its infectious dose is very low, reaching between 1 and 10 viral units, even when found in low concentrations in water. So even when diluted in water, it can pose a risk to human health [
10]. Enteroviruses, Adenoviruses, Noroviruses, Hepatitis A and E viruses, as well as Rotaviruses are among the viruses most associated with human waterborne diseases [
8].
Viruses of the genus Rotavirus (RV) are non-enveloped viruses, with a icosahedral capsid, belonging to the
Sedoreoviridae family and measuring from 70 nm to 100 nm in diameter [
8,
11,
12]. They have in their viral genome 11 segments of double-stranded RNA and each of these segments encodes a specific viral protein, six of which are structural, called viral protein (VP) and six are non-structural (NSP) [
8,
11]. RVs are classified into ten species (A-J) based on their antigenic differences and differences in the sequence of the VP6 capsid protein, with group A (RVA) being the predominant cause of RV gastroenteritis. Groups A–C can be identified in both humans and animals [
13,
14].
Rotavirus it’s the agent of one of the main causes of severe viral gastroenteritis in the pediatric population, being responsible for a significant portion of deaths related to diarrhea among children under five years. They are shed in extremely high numbers in the feces of infected individuals, possibly up to 10
11/g of feces [
11,
15]. The number of cases of deaths from gastroenteritis with diarrhea, after the introduction of vaccines against Rotavirus, managed to significantly reduce the number in some countries in Latin America, North America, Europe and Australia, with Brazil being one of the pioneers in the introduction of RV-A vaccine in its National Immunization Pro-gram (PNI) [
16].
The WHO Guidelines for Drinking-Water Quality identified Rotaviruses as a potential reference pathogens [
17,
18] and it is known that the persistence and infectivity of viral particles can be related to environmental factors, such as temperature, pH, humidity and sunlight (UV) [
19]. So, it is important to know if there is any relationship between the physical-chemical parameters of water and the environment in detecting rotaviruses [
20,
21].
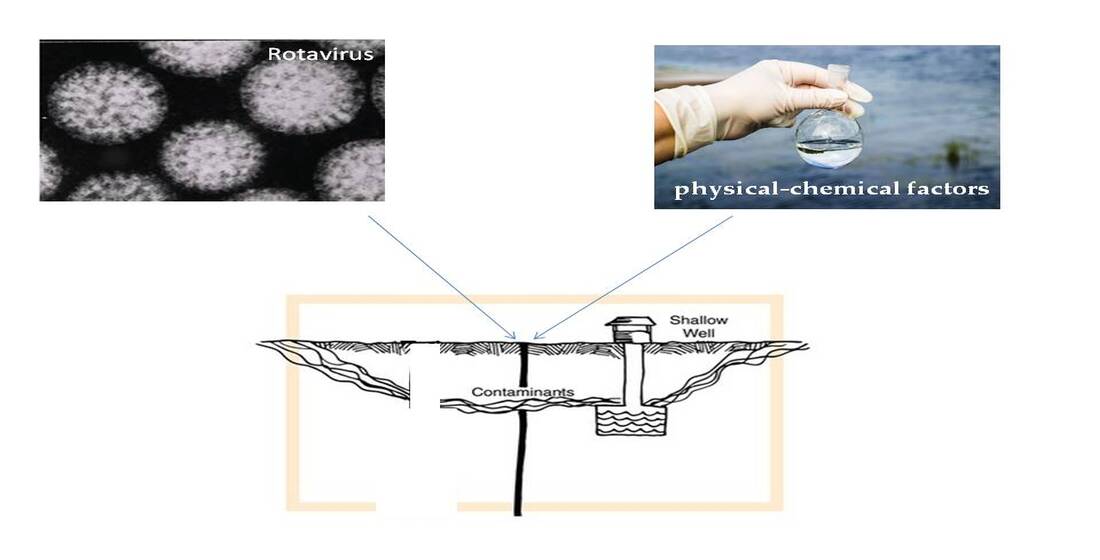
Therefore, the aim of the study was to identify and correlate the presence of Rotavirus in collective and individual water sources of rural communities in the state of Goiás, with the seasons in which the collections were made (rainy and dry season), from different water sources (deep tubular wells, shallow tubular wells, shallow dug wells, springs, surface water, rainwater stored in cisterns and water trucks that were collected from surface water).
2. Materials and Methods
2.1. Description of the Sample Collection Sites during Dry and Rainy Season
The study was carried out using water samples collected in rural and traditional communities (settlement, quilombola and riverside communities) in municipalities located in the State of Goiás. 500 mL of water was collected in sterile bottles for viral concentration and quantification.
In the State of Goiás, the rainy season lasts from October to April (summer), while the dry period lasts from May to September (winter). The sample collection in dry season was carried out in April to October of 2019 and a total of 86 samples were collected, while in the rainy season, 160 samples were collected during November and December of 2021.
The dry season collections were carried out in quilombola communities and settlements located in 16 municipalities: Campos Belos (Taquarussu), Niquelândia (Rafael Machado), Mimoso de Goiás (Queixo Dantas), Simolândia (Castelo/Retiro and Três Rios), São João da Aliança (Forte), Cidade Oeste (Mosque), Padre Bernardo (Sumidouro), Iaciara (Extrema), Flores de Goiás (Canabrava), Cavalcante (São Domingos), Mineiros (Cedro), Monte Alegre de Goiás (Pelotas), Colinas do Sul (José de Coleto) and Nova Roma (Magalhães community), Silvania (São Sebastião da Garganta settlement) and São Miguel do Araguaia (Lageado settlement).
The rainy season collections were carried out in 22 municipalities that includes settlement, quilombola and riverside communities, which are: São Miguel do Araguaia (Lageado); Mineiros (Pouso Alegre); Uruaçu (São Lourenço); Goianésia (Itajá II); Professor Jamil (Rochedo); Silvânia (São Sebastião da Garganta; João de Deus); Nova Crixás (Landi); ÁguaLimpa (Arraial da Ponte); Goiandira (Povoado Veríssimo); Gameleira (Olhos D’Água); Padre Bernardo (Sumidouro); Barro Alto (Santo Antonio da Laguna); Niquelândia (Povoado Vermelho); Cavalcante (São Domingos); Monte Alegre de Goiás (Pelotas); Campos Belos (Taquarussu); Divinópolis de Goiás (Vazante); Alto Paraíso de Goiás (PovoadoMoinho); Iaciara (Extrema); Posse (Baco Pari); Simolândia (Castelo, Retiro e Três Rios); Flores de Goiás (Canabrava) (Table 1).
The samples were transported immediately to the laboratory after collection, always kept in thermal boxes. In the laboratory they were kept at 4ºC until further analysis.
2.2. Rotavirus Concentration, Extraction and Molecular Analysis
The adsorption–elution methodology was chosen for the concentration of the water samples, collected both in the dry and rainy seasons. The technique was described byKatayama et al. (2002) [
22] and was performed with modifications, similarly to what was carried out by Vecchia et al. (2012) [
23].
The FAPEG (Research Support Foundation of the State of Goiás) and PPSUS (Research Program for SUS)programs were responsible for funding the purchases all of the materials and reagents needed for the laboratory.
2.3. Extraction of Viral Nucleic Acids of Rainy Season Samples
The Rotavirus genetic material was extracted using the Mini Spin Virus DNA/RNA (KASVI®) extraction kit, following the manufacturer's instructions. At the end of the reaction, the kit provides 30 μL of genetic material eluted in nuclease-free water, which were stored at -80ºC until the reverse transcriptase qPCR (RT-qPCR) step.
2.4. Rotavirus Control
The positive control was chosen and aligned through the NCBI Database (Gen-Bank), with accession number HM348746 (Human Rotavirus A strain mani-265/07 of the structural protein VP6 gene) and was then synthesized by the company Molecular Biotechnology LTDA®.
For the quantification of viral particles, Five-point standard curves were made, in serial dilutions at factor 10, of the Rotavirus Standard Control.
2.5. Detection and Quantification of Rotavirus of Rainy Season Samples
The Sybr Green® (double-stranded DNA intercalator) were used as the dye for the detection and quantification of the RV in the samples. RT-qPCR single step wereperformedusing the LightCycler® 480 Real-Time PCR System (Roche Molecular Systems, Inc., Pleasanton, CA, USA) with 96-well plates and analyzed using Light Cycler® 480 software, version 1.5. RT-qPCR results were given in genomic copies per liter (GC/L). Primers for RV are specific for RV group A. The primer used is described in
Table 2.
2.6. RT-qPCR of Rainy Season Samples
The protocol followed for the RT-qPCR reaction is described as:7.5 μL of Real Time PCR mastermix solution – SybrGreen/ROX 2x (QuatroG®), 0.5 μL of each primer (10 pmol/ μL), 0.5 μL of Reverse Transcriptase enzyme, provided by researchers from the Institute of Molecular Biology of Paraná (IMBP), Viviane Monteiro Goes, Mariely Cordeiro Estrela and Priscila Zanette de Souza, 5 μL of sample and 1 μL of DNAse/RNAse-free ultrapure water, adding a final volume of 15μL. The cycles performed in the thermocycler consisted ofonly 1 cycle of 15 minutes at 45ºC and 1 cycle of 2 minutes at 95ºC, to activate the RT enzyme and DNA polymerase, respectively. After this initial step, 40 cycles were followed, consisting of a 15 second step at 95ºC for strand denaturation and a 1minute step at 60ºC for annealing the oligonucleotides to the strand and extension. In each round of qPCR, a negative sample (NTC – in the template control) was used, which contained DNAse/RNAse-free water in place of the sample.
2.7. Detection and Quantification of Rotavirus of Dry Season Samples
For detection and quantification of RV in the samples, a single RT-qPCR step was performed using the Sybr Green® as a fluorophore. The qPCR cycles were performed on the StepOne system Biosystems® software version 2.3. qPCR results were presented in genomic copies per liter (GC/L). The primers for RV are specific for group A RV. The Prime sequence is the same as the rainy period, described in
Table 2.
2.8. RT-qPCR of Dry Season Samples
After cDNA synthesis, the qPCR reaction was performed. The reaction volume for qPCR was 20 µL for each sample, being 0.4 µL of Antisense oligonucleotide, 0.4 µL of sense Oligonucleotide at a concentration of 5 µg/mL, 10.2 µL of water, 4 µL of 5 × HOT FIRE Pol Eva Green qPCR mix Methods 23 plus (ROX) and 5 µL of sample (cDNA). The components of the mixture are: Taq DNA polymerase, Oligonucleotides and dNTPs). The cycling considered was that described by the manufacturer Solis Bio Dyne with: 95 ◦C for 12 minutes for initial activation, 95 ◦C for 15 seconds for denaturation, 63 ◦C for 25 seconds for annealing and 72 ◦C for 25 seconds for amplification.
2.9. Statistical Analysis
The sample calculation was carried out to ensure the accuracy of the results, the comparison among seasonal periods considered results of research carried out in dry and rainy periods [
1,
2,
3,
4,
5,
6,
7,
8,
9,
10,
11,
12,
13,
14,
15,
16,
17,
18,
19,
20,
21]. As a result, the beta power (β) resulted in 97%, considering the alpha (α) of 5%. Based on the imputed data, the sample size was 86 in the dry period and 160 in the rainy period. For the sample calculation, the GPower® software version 3.1 was considered.
Statistical analyzes were carried out using Minitab® version 19 and Jamovi® version 2.4 software. To determine the association between seasonality (dry season and rainy season) and the presence of Rotavirus, the chi-square, Fischer's exact and Odds Ratio tests were applied. The associations were also estimated considering the type of source where the samples were collected. Normality analysis was performed using the Shapiro-Wilk test and central tendencies, subsequently the non-parametric Mann-Whitney test was applied to compare concentrations of genomic copies, considering seasonality as a determining factor. The significance limit of 5% was considered to accept the hypotheses of associations and differences.
3. Results
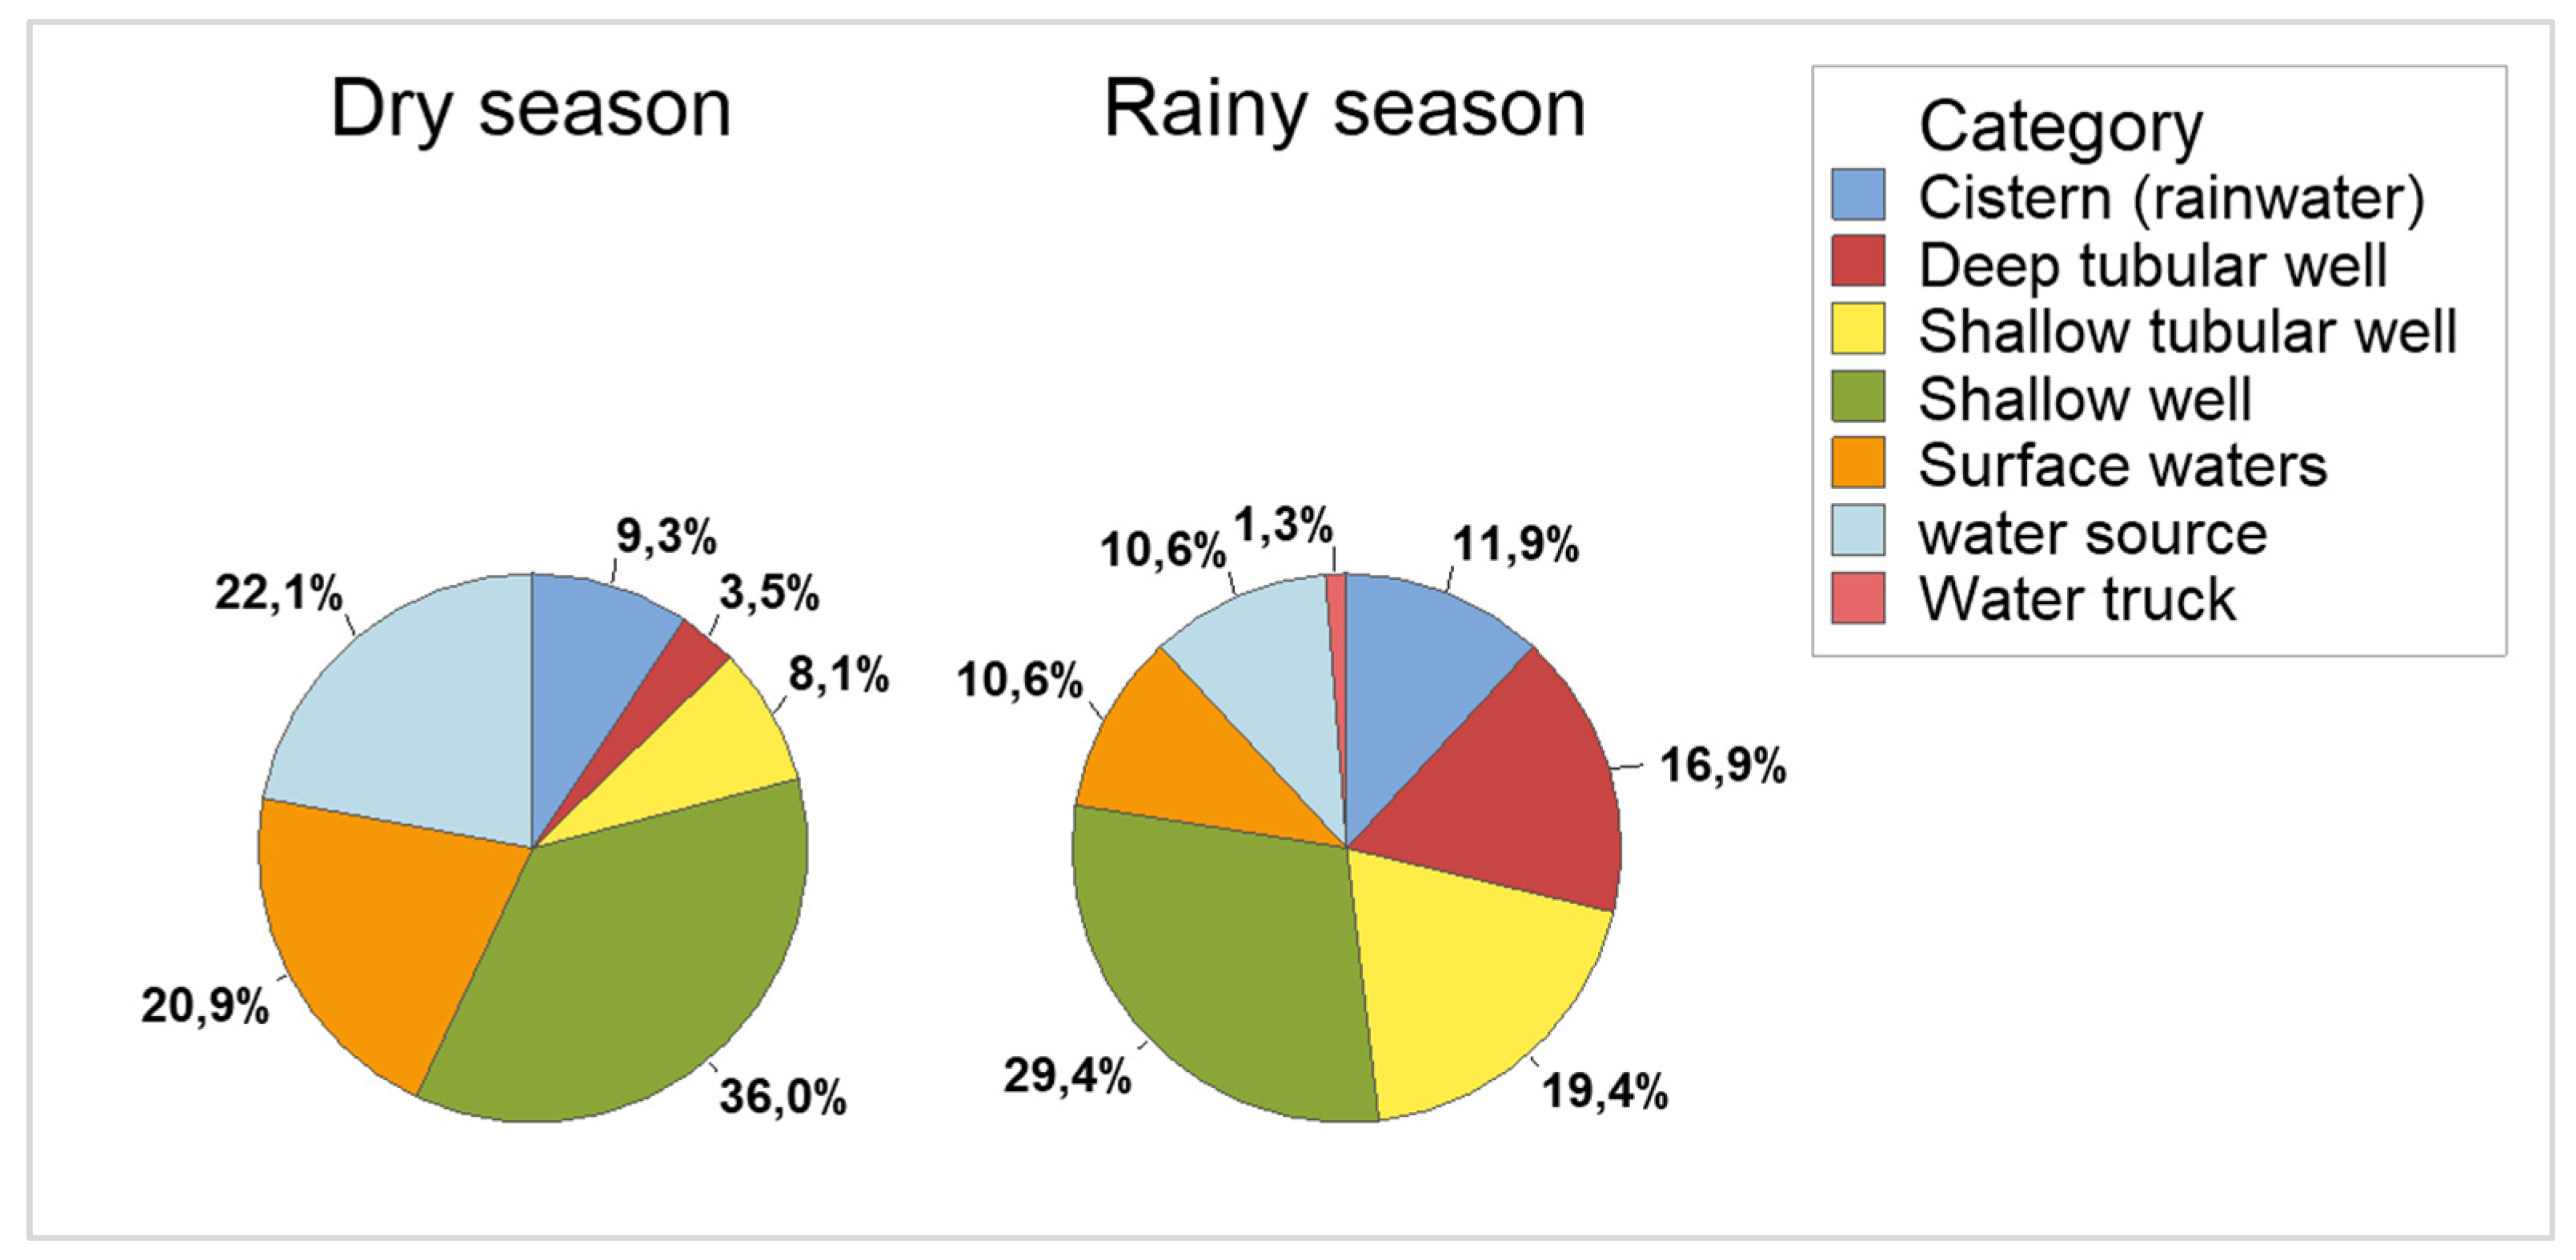
The samples were collected in two periods, the dry season (April 2019 to October 2019) and the rainy season (November and December 2021). In the dry season, 86 samples were collected and in the rainy season 160, totaling 246 samples. Samples were collected from seven types of sources (
Figure 1). The frequencies of samples collected by type of source, PCR and season can be seen in
Table 3.
Inferential analyzes determined a strong association between the dry season and the presence of Rotavirus. When considering the general picture regardless of the type of source, the association test (χ²) resulted in 30.8; p-value < 0.001, a result similar to Fisher's Exact with p-value <0.001. The proportion of positive samples in the dry period, considering the type of source, resulted in higher in Shallow wells (p-value <0.001), higher in surface waters (p = 0.001) and higher in spring water (p-value = 0.02). The other types of sources did not show significant proportional differences (
Table 4).
Estimates of associations to determine the chances of positive samples according to seasonality were carried out using the Odds Ratio or odds ratio (OR). In all cases, regardless of the type of source, higher frequencies of positive samples were observed in the dry season. The overall picture presented OR = 4.82 [2.71 – 8.56; p < 0.0001)], that is, the chances of positive samples in the dry season are approximately 5 times higher when compared to the rainy season, an increase of 382% compared to the rainy season. The shallow wells also presented a higher percentage of positive samples in the dry season, OR = 10.63 [3.63 – 30.87; p < 0.0001]. Similarly, spring water showed a higher percentage of positive samples in the dry season, OR = 9.33 [1.01 – 86.36; p = 0.05] (
Table 5).
For quantitative analysis, normality tests were carried out, the results pointed to non-parametric data in accordance with the data in
Table 6.
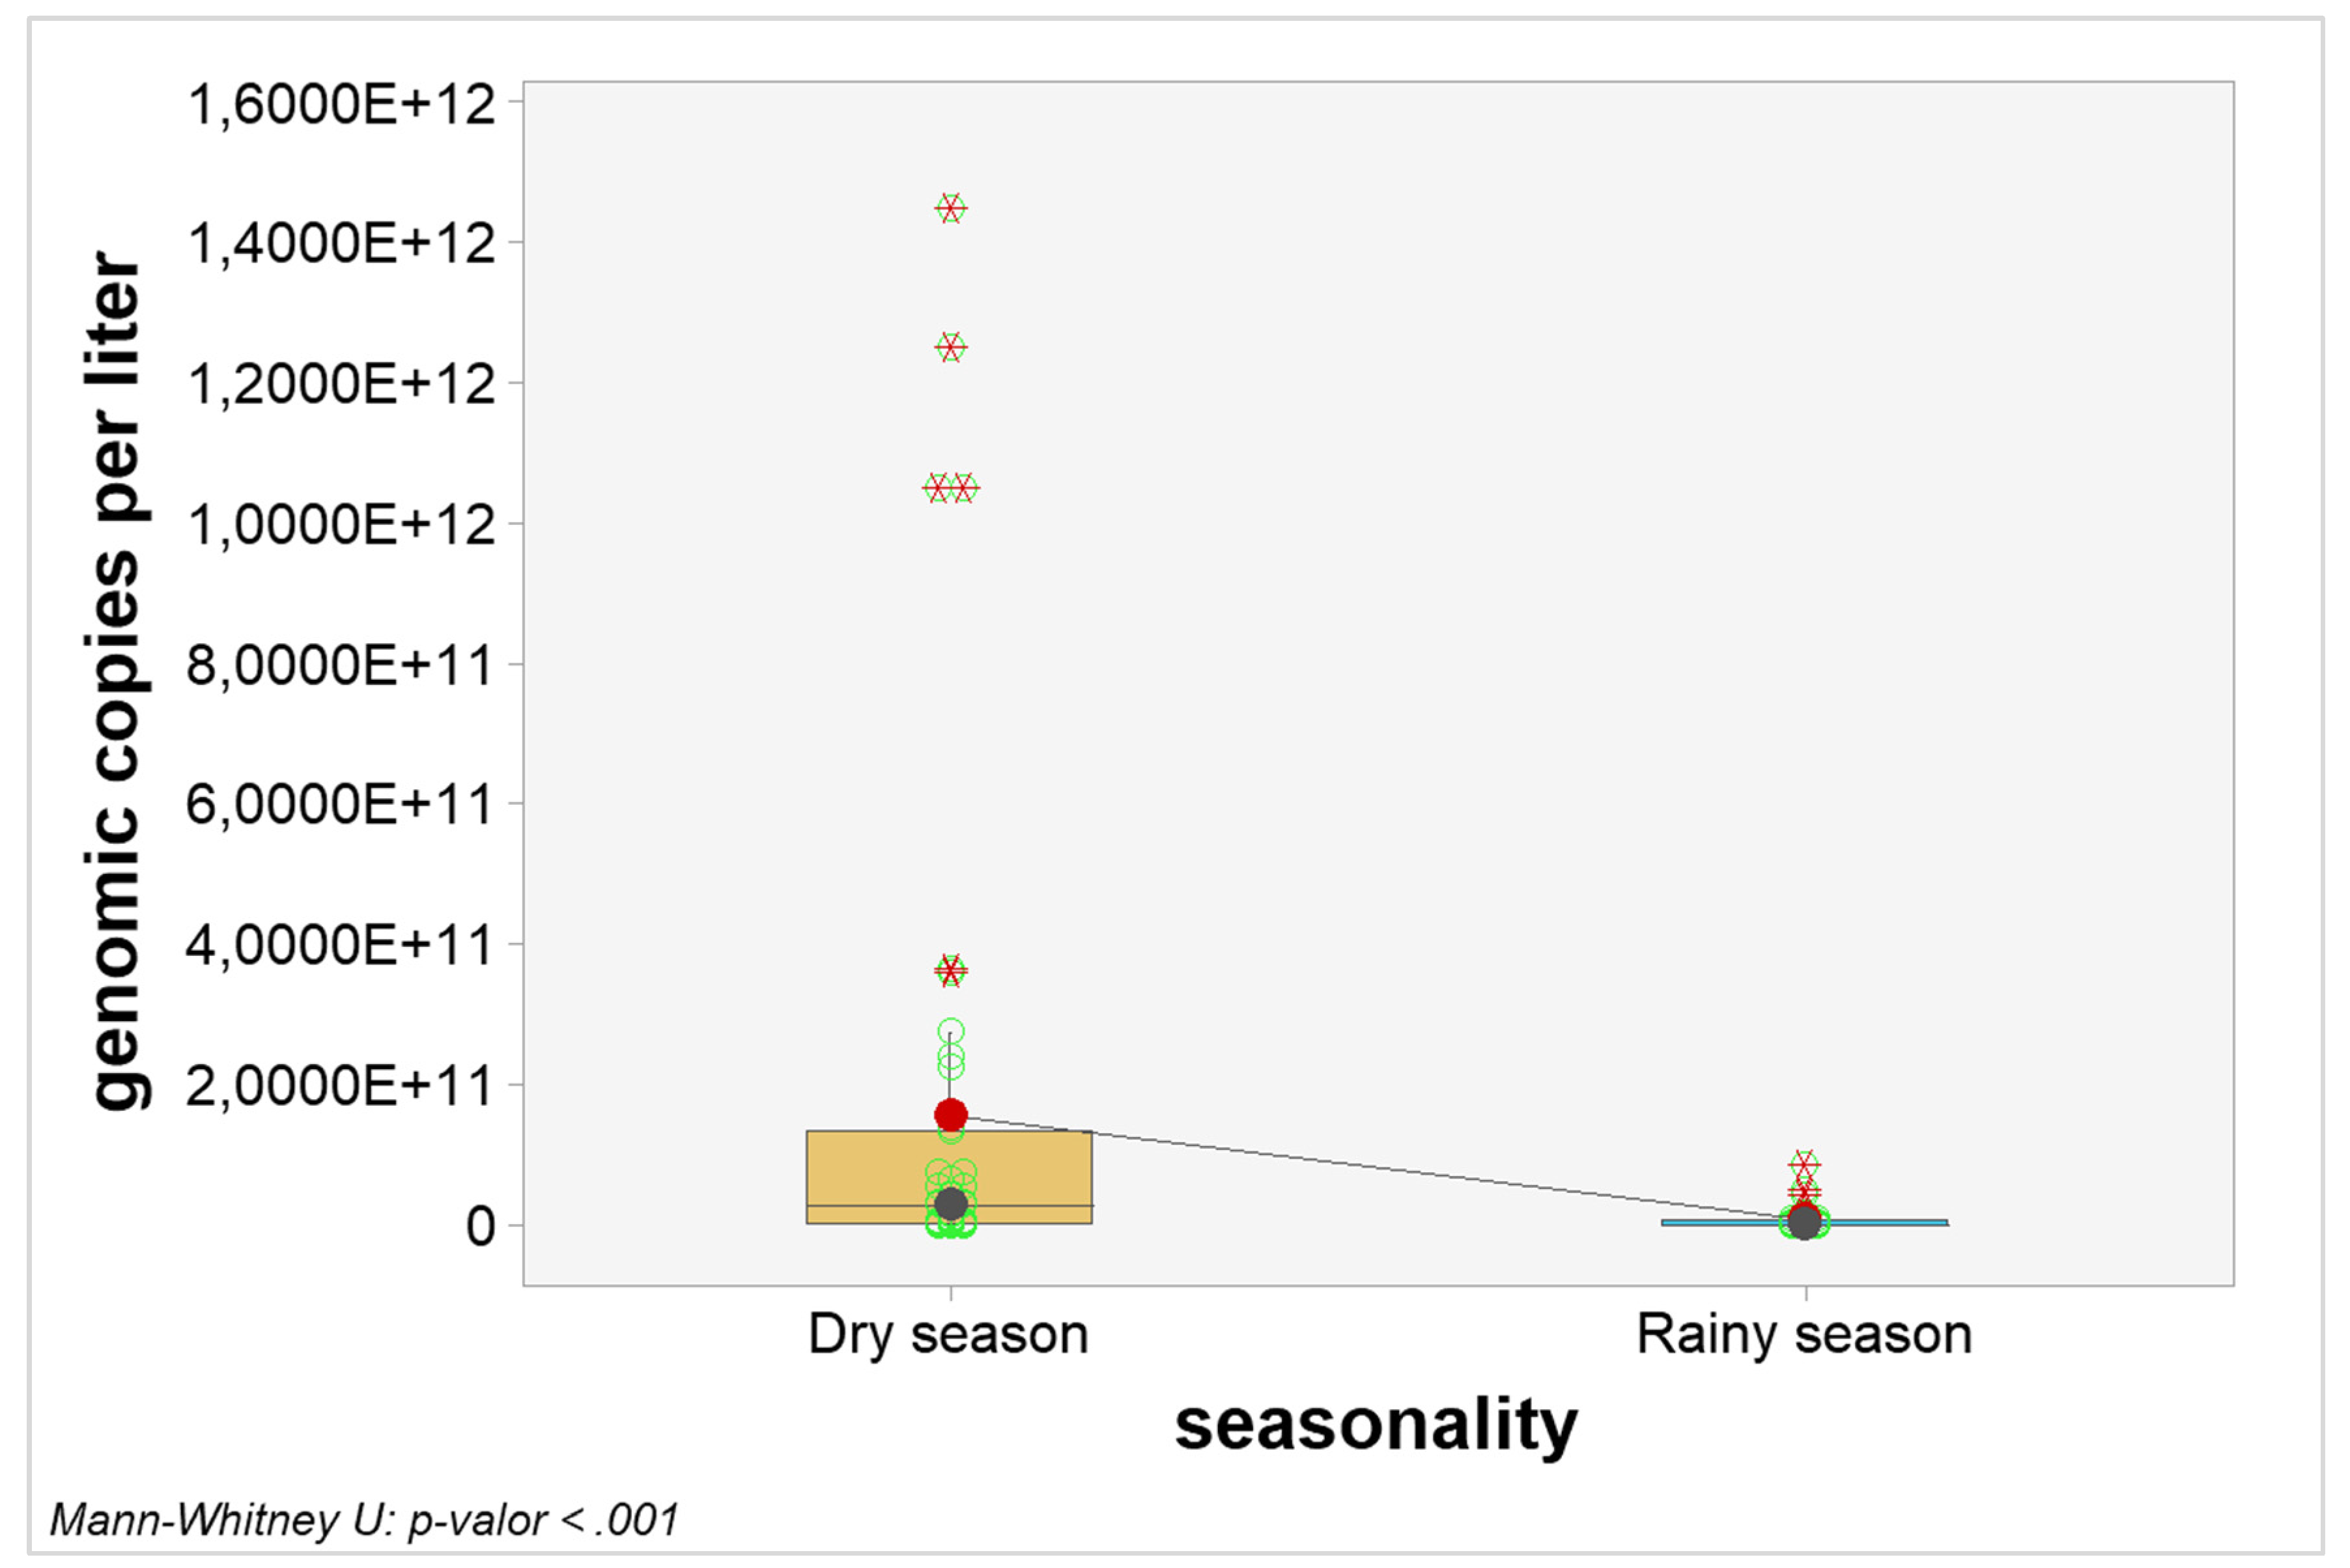
Quantitative analyzes were carried out to verify possible interference of seasonality in the number of genomic copies. When considering the general picture, the number of genomic copies per liter in samples from the dry season were statistically higher when compared to samples from the rainy season (p-value < 0.0001). The graphical visualization can be seen in
Figure 2 and the estimated results in
Table 7.
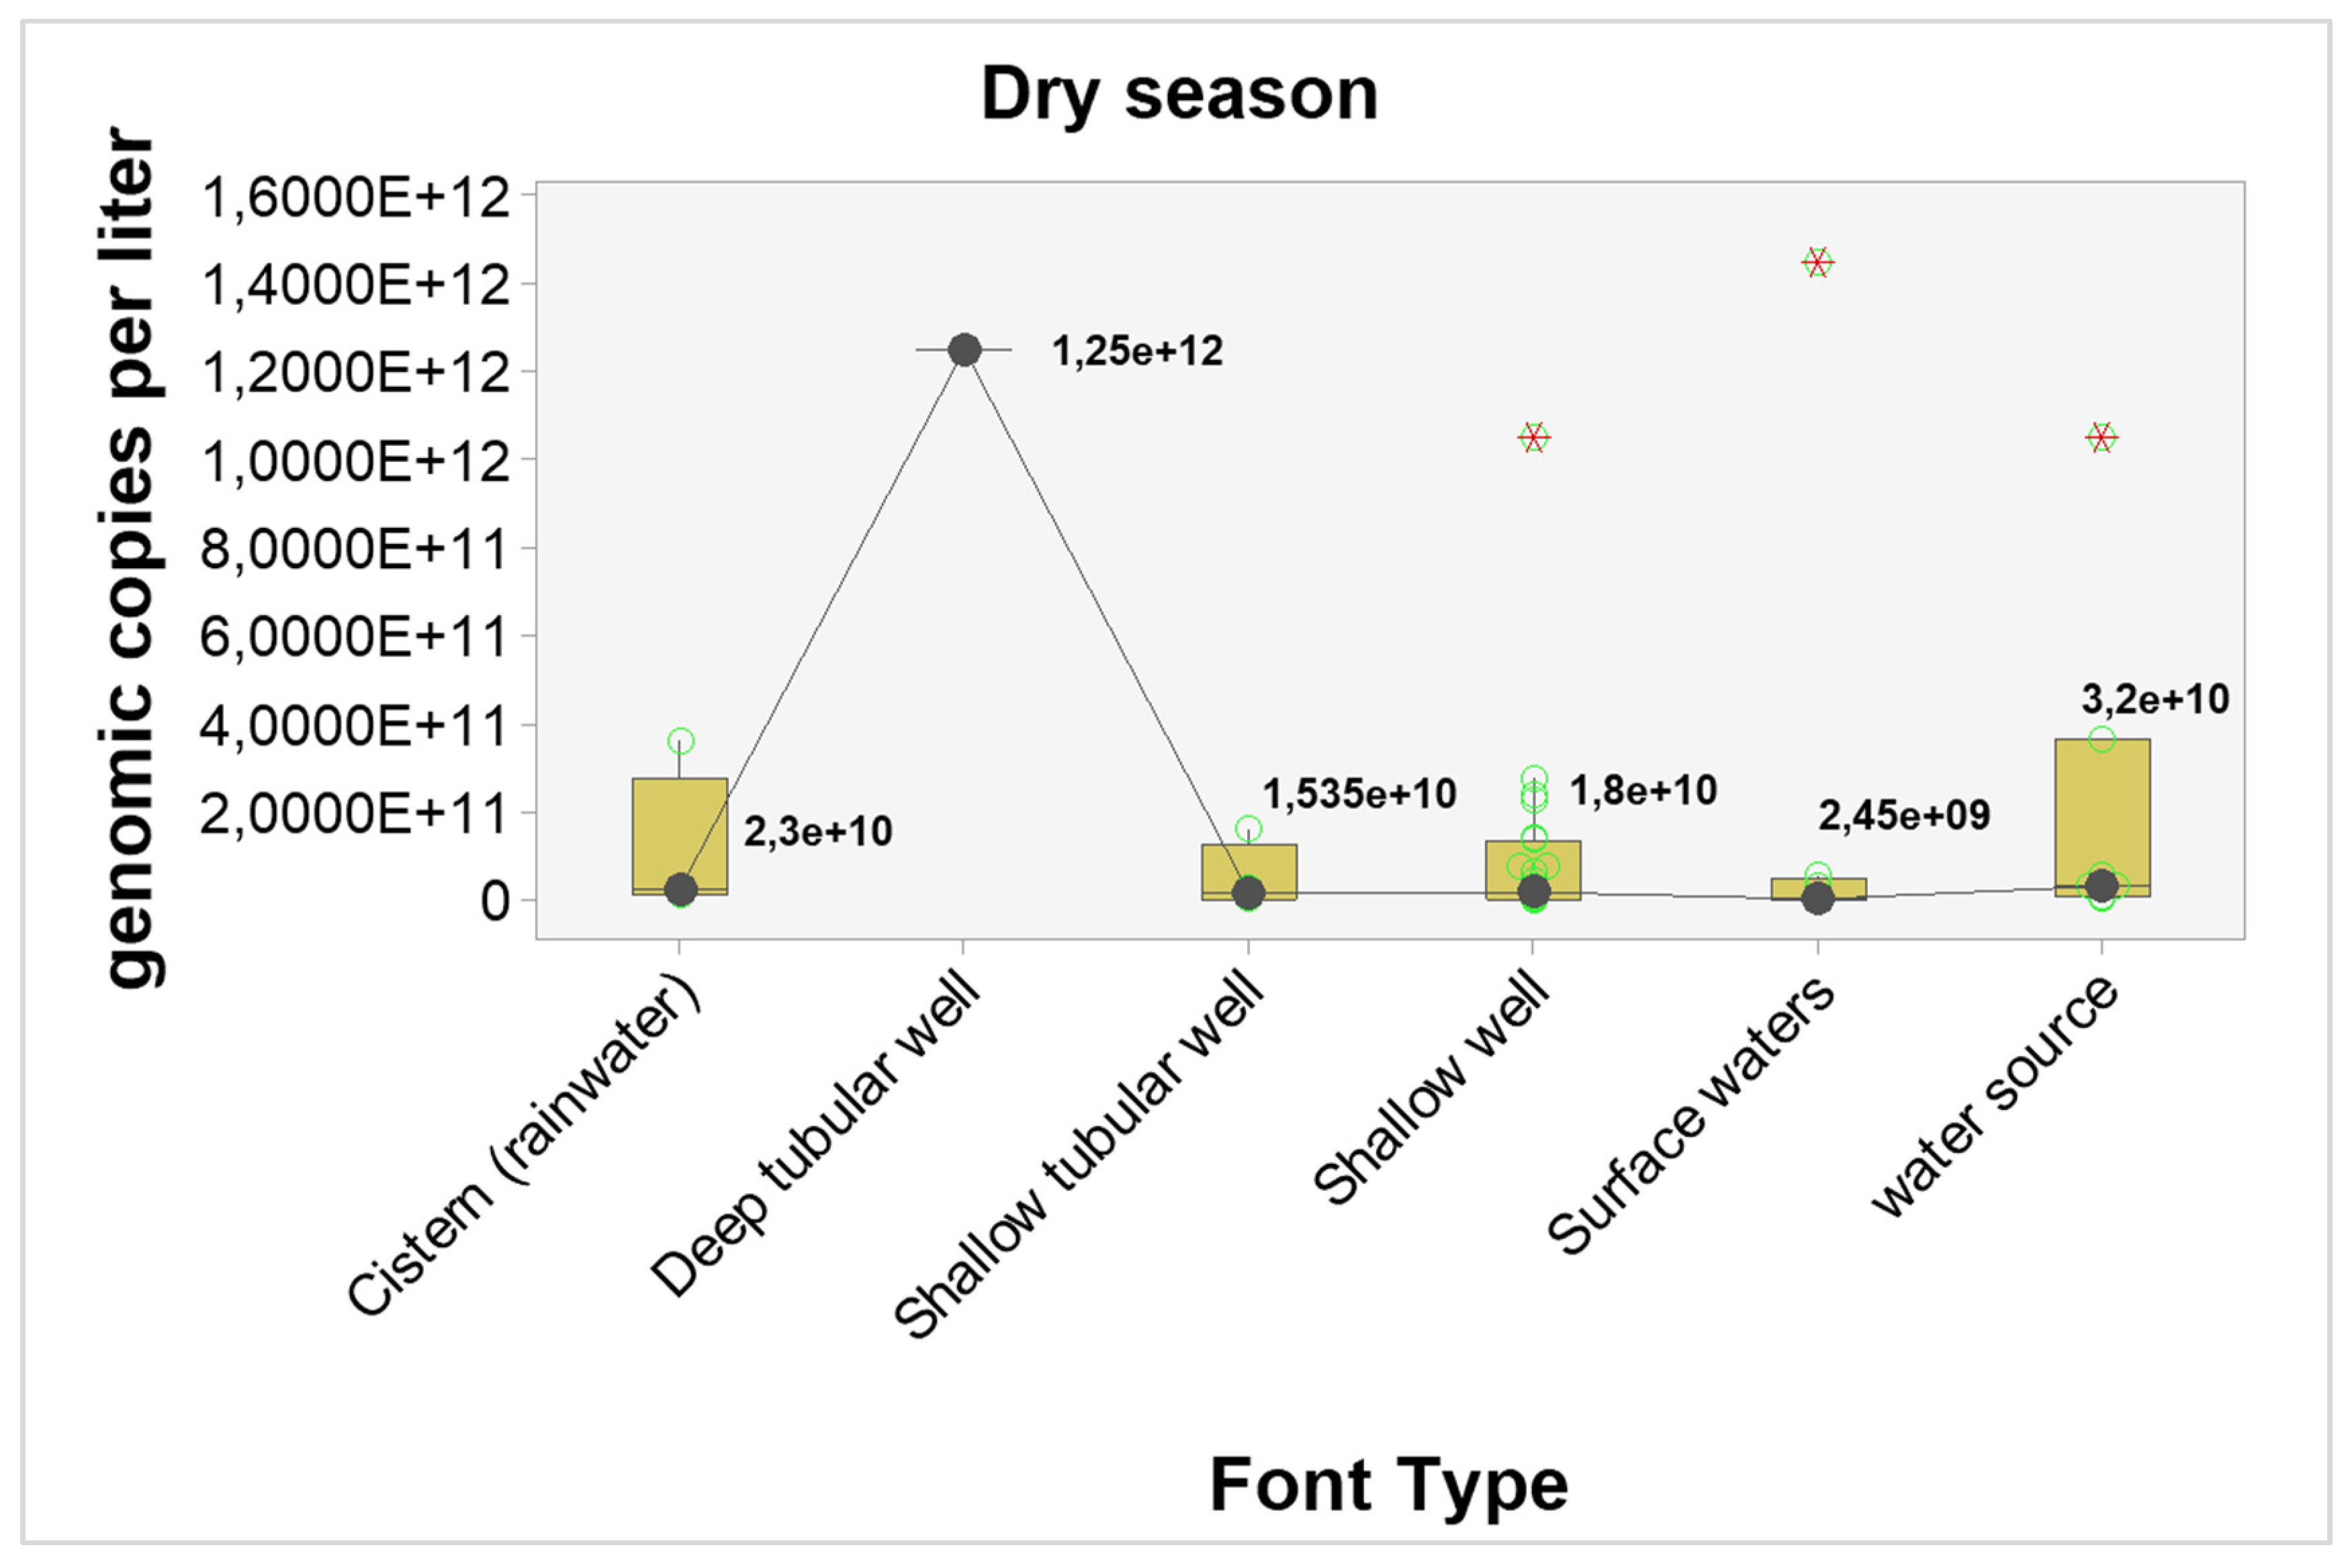
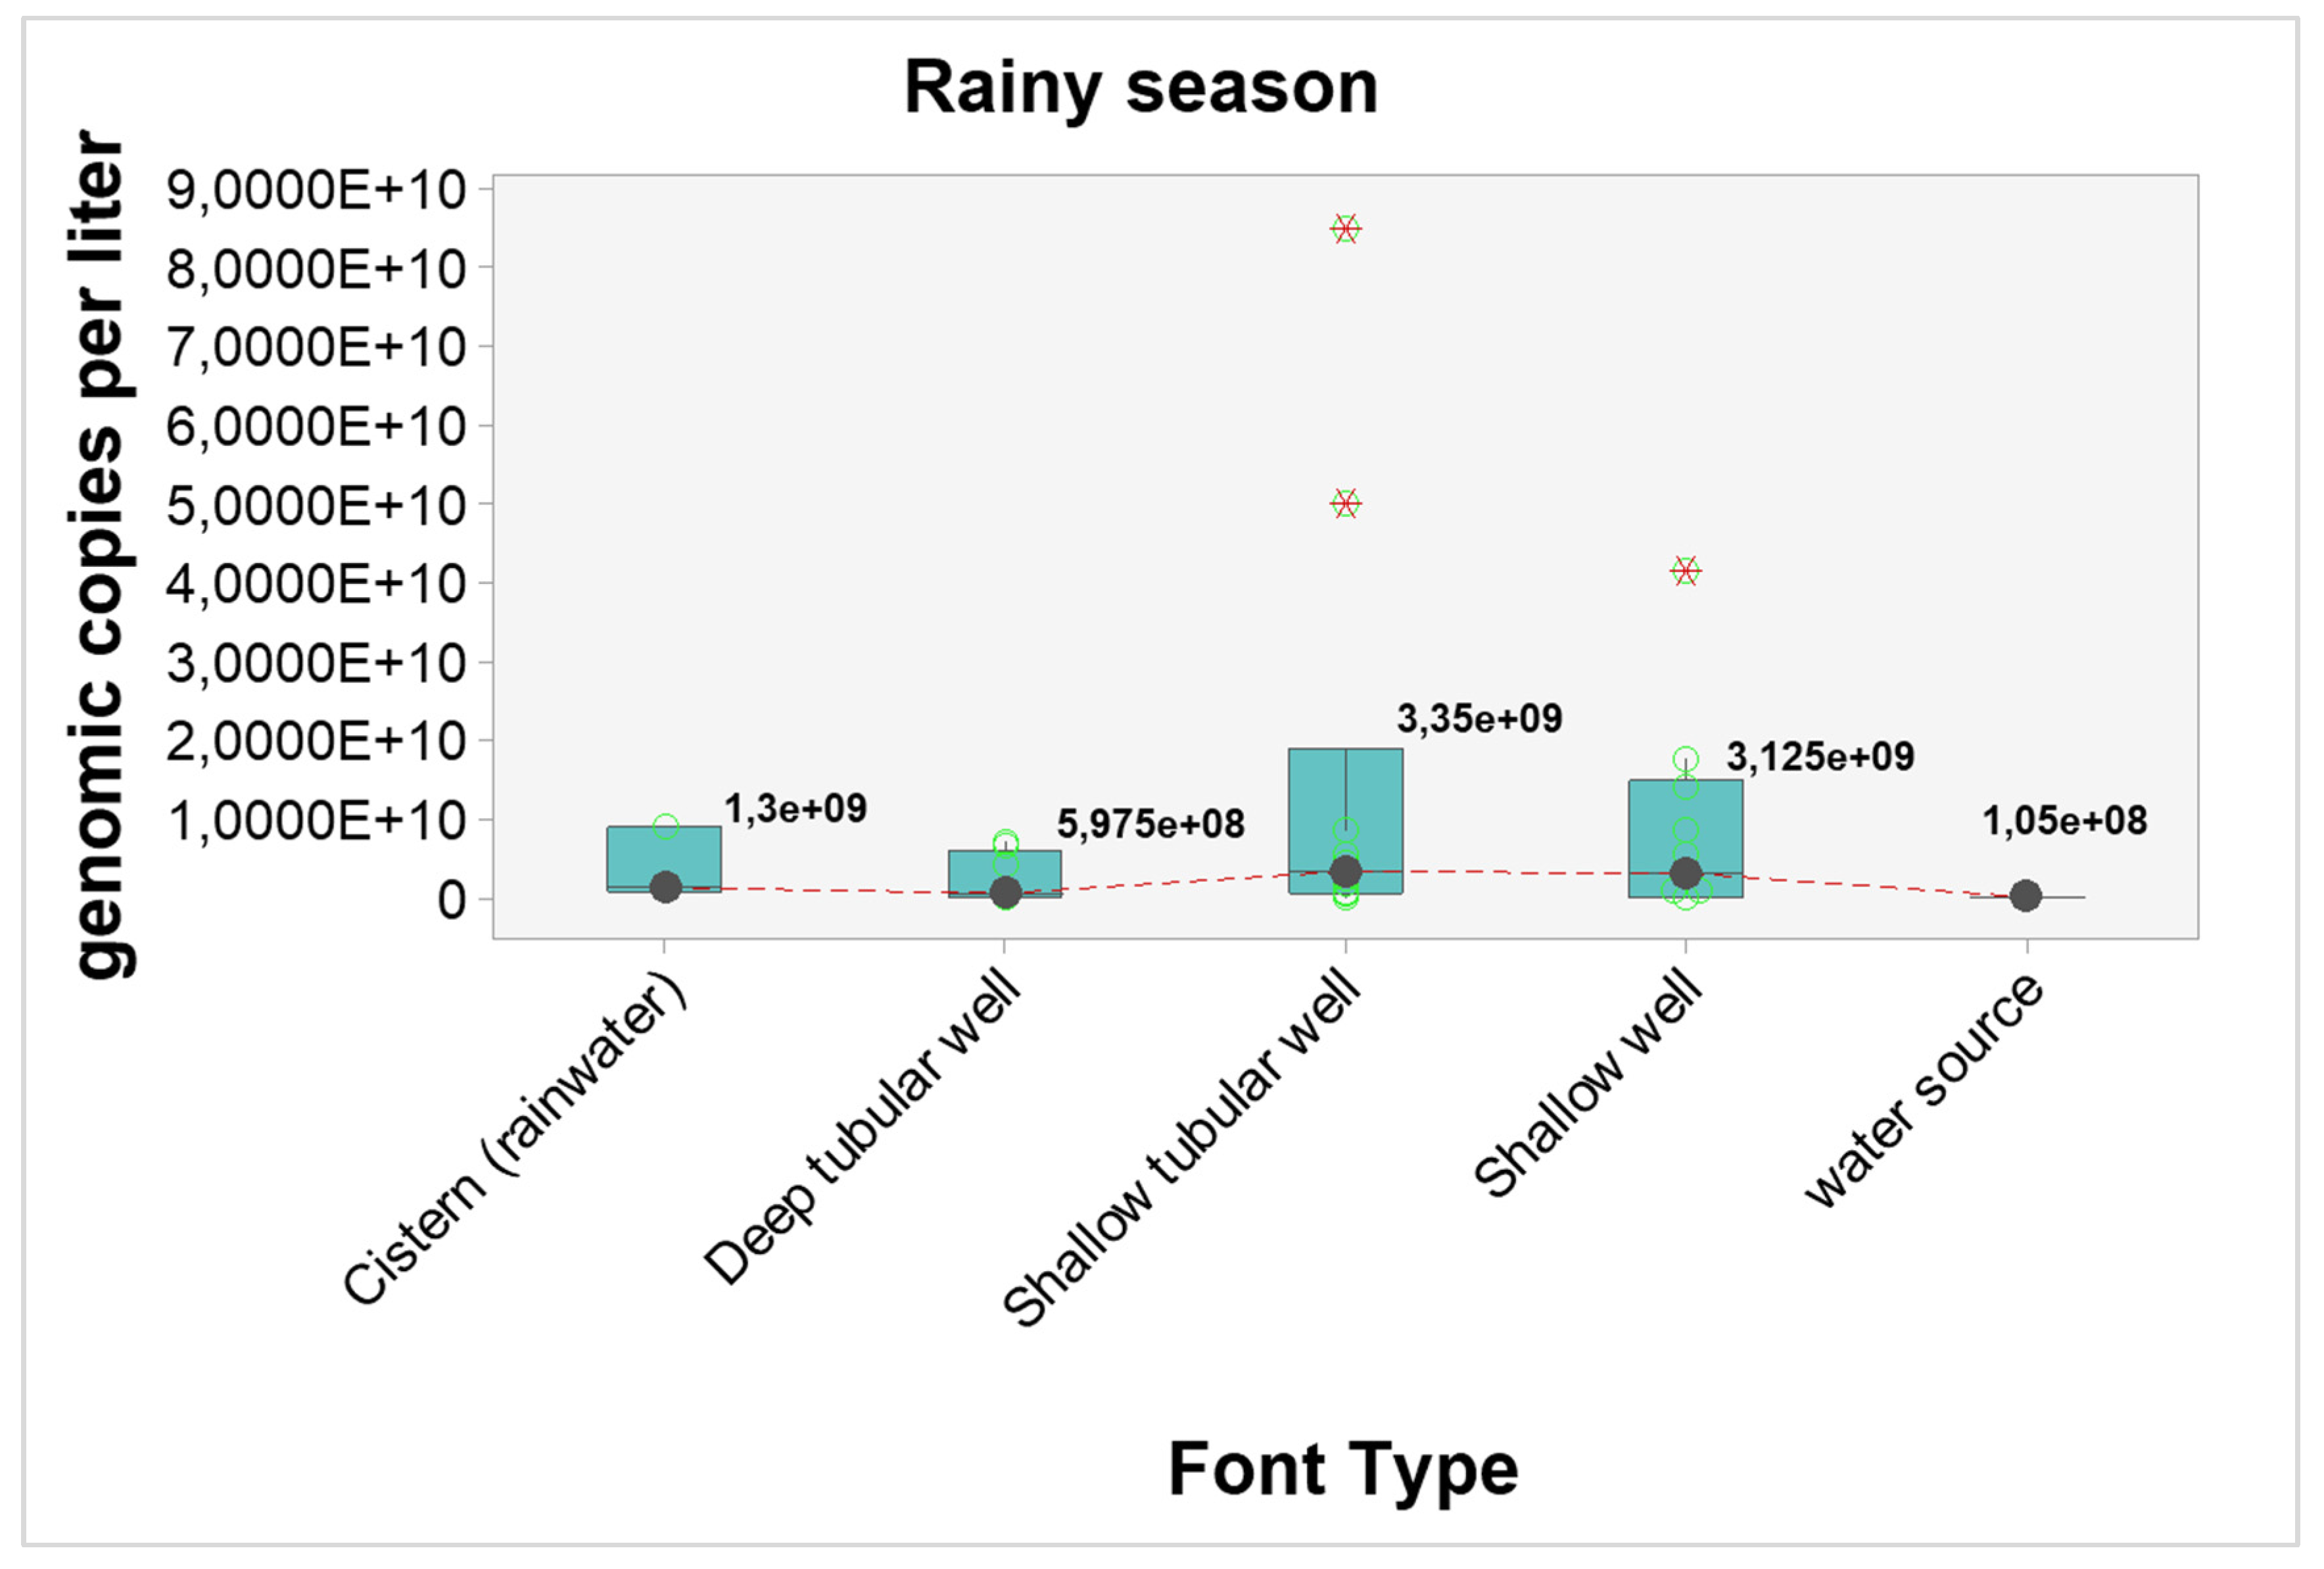
The results point to higher concentrations of genomic copies in the dry season, regardless of the type of source, however, only shallow wells showed statistically significant differences (p-value = 0.04). The estimated differences and probabilities can be seen in
Table 7. The graphical analysis can be seen in
Figure 3 and
Figure 4.
4. Discussion
Large numbers of pathogens such as viruses, bacteria and other microorganisms can be introduced to water sources due to inefficiency or lack of protection of these sources. This makes the water quality unsuitable for consumption and causes outbreaks of waterborne diseases [
24]. Isolated in groundwater, river water, sewage water and drinking water and causative of severe gastroenteritis in children, Rotavirus is responsible for approximately 24 million patients seeking hospitals, 2.4 million hospitalizations, 114 million episodes of gastroenteritis and per year 450,000 deaths of children under 5 years, documented majority in low-income countries [
25].
In tropical regions, Rotavirus prevalence can occur throughout the year, but has seasonal peaks during the dry period or cold months [
26]. In the MidWest region of Brazil, where the State of Goiás is located, the highest prevalence of rotavirus circulation occurs in the coldest months or in the dry period between May and September [
27]. The RV-A found in the study samples were found in water samples both in the dry (54,7%) and rainy periods (20%), but there was a higher prevalence in samples from the dry period. The results brought from the study also demonstrated a concordant relationship with the seasonality normally found by Rotavirus in the State of Goiás, where a strong statistical association between the dry season and the presence of Rotavirus (association test (χ²) resulted in a p-value < 0.001 and the Exact Test Fisher's test with p-value < 0.001).
These results are in line with what was found in the study by Stobnicka-Kupiec&Górny [
28] where the prevalence of positive rotavirus samples found in winter (dry period) was higher than those found in summer (rainy period) (73.3% vs. 26.7%), with there also being an statistics association between the prevalence and the period found (x2: p = 0.028; Fisher's Exact test: p = 0.033). Different from what was found in our study, in a study in the State of Minas Gerais, where there is also a higher incidence of rotavirus during the dry period, the RVA were found in water samples collected on both dry (54.1 %=13/24) and rainy period (70.8 %=17/24) but no significant association between the viral detection and the period in which the study was realized were found(p=0.371)[
21].
Outbreaks of infection not reported in the study areas, the elimination of feces with high concentrations of the virus (which can reach 10
8 to 10
11 particles/gram of feces) by infected patients, in addition to characteristics specific to the virus, may explain its greater detection of RV in the samples [
9,
10,
16,
20]. RVs survive diverse conditions and are capable of surviving for long periods, contributing to their prevalence in the environment [
28].
In the dry months (winter) the UV radiation is less intense and the temperatures are lower, which will lead to greater stability of Rotaviruses in the water [
29]. UV irradiation penetrates cellular structures, damages genetic material and interferes with cell reproduction. The viral capsid, nucleic acids and enzymes responsible for virus replication are damaged when present at high temperatures, preventing the adsorption of the virus to its host [
9]. In tropical regions, RVs associated with the incidence of diarrheal disease decrease by 10% for every 1ºC increase in temperature [
30].
Contrary to expectations, enteric viruses are the most likely microorganisms to contaminate groundwater. In rural areas, not all homes are connected to the sewage collection network, but rather to septic tanks, from where sewage can drain into the ground and migrate to deeper layers, reaching groundwater [
31,
32,
33]. Due to their extremely small size – between 25 and 100 nm – it allows them to easily infiltrate and pass through soil pores, which are capable of retaining bacteria and larger protozoa, reaching these sources [
31]. These are sources that, as they do not undergo treatment, are extremely vulnerable to contamination [
34]. For Fongaro et al. [
34] in groundwater source the prevalence of RV was higher in the rainy season than in the dry season (80% vs. 60%), with genomic copies varying from 4.5×10
4 to 4.5×10
8 gc/L for the rainy season and 1.2×10
3 to 1.5×10
5 gc/L in the dry season. In groundwater, the presence of RVA was positively correlated in dry and rainy periods (P<0.05, r2 = 0.92).
Shallow wells was the only groundwater source where Rotavirus contamination showed a higher percentage of positive samples in the dry season, with a strong statistical association (p-value < 0.001). Shallow wells are more vulnerable to viral contamination as the depth of the wells are generally smaller and may not have lining or protection factors, thus pipe failures and/or septic tank overflows, in addition to the presence of animals nearby and surface contaminants that can be taken to the wells through precipitation, increasing the contamination of this source by viruses [
35,
36]. Protection against UV radiação, low microbial activity and lower temperatures are reasons why viruses survive longer in groundwater [
9]. It has been shown that Rotaviruses were able to survive up to 7 months when stored in the dark [
20].
The characteristics of tubular wells of having smaller opening diameter, wall coverings made of PVC plastic material and being greater in depth, ensuring greater isolation and durability, did not ensure that that the water samples collected from this source were free from RV contamination [
37]. With regard to the construction aspect of the wells, Allen et al. [
38] obtained a positive association when relating the probability of detecting viruses in wells that do not have casing, that is, wells that are in direct contact with the aquifer (open well interval). Tube wells with longer open intervals will be better able to capture agreater flow of groundwater, thus increasing the likelihood of including a virus source gradient in the flow. In addition to problems with the structure and sealing of the well, sources of contamination that are at a distance of up to 10 meters, problems with the sealing of the well pump, and latrines close to the well, which, due to their lack of plumbing, facilitate the percolation of excreted in the soil, are some of the risk factors that contribute to viral contamination in tube wells [
39]. For the study by Verheyen et al [
40], the fact of having latrines within a 50-meter radius of the sample collection sites would already be a risk factor for viral contamination of wells.
Another groundwater source that also had a strong statistical association with the presence of RV were water springs (p-value = 0.02). The positive samples for adenovirus and rotavirus, in springs, found by Gonella et al. [
41], are explained by the presence of animals in its surroundings, which may be transmitting these agents, as it is located in an ecological park. Springs that are located in lower regions may be more subject to contamination than in higher regions; human density and agricultural activities are also factors that can lead to contamination from this source [
37].
The discharge of sewage into surface water sources is an important source of fecal pathogens, as bodies of water that receive untreated sewage or are subject to inefficient treatment often constitute public water supply sources, making them a risk to those who uses them [
42,
43]. In rural areas, most of the final disposal of sewage can occur directly on the ground or in streams, rivers and lakes, contaminating bodies of water and increasing the risk of waterborne diseases [
44,
45].
Collections carried out by Bortagaray et al. [
30], in two rivers, Santa Lucia and Uruguay, obtained a statistically significant association with the presence of rotavirus in the dry period (winter) (Uruguay river: p=0.0014, Santa Lucia river: p=0.0008). In the warmer months (rainy period), the presence of rotavirus was not found in any of the rivers surveyed. Similar to what was found by Bortagaray, the present study did not find RV in surface water samples during the rainy season (warm months) and in addition to finding the presence of RV in the dry period (colder months), it also found a strong statistical association between the viruses and dry period (p = 0.001).
Temperature, presence of microbiota and desiccation are factors that effectively contribute to the destruction and decomposition of viruses and microbial pathogens on surface water, in addition, when exposed to solar radiation (UV light), the viruses are readily inactivated [
46,
47]. It is known that these factors are capable of denaturing proteins, causing damage to the nucleic acid, or dissociation of the capsid. The presence of native aquatic microorganisms, such as bacteria, would lead to bacterial production of proteolytic enzymes, which works as a mechanism for the antiviral activity of bacteria [
8,
48,
49,
50]. These factors may justify the absence of RV in surface samples during the rainy season, as the temperature is higher during this period.
Considered the gold standard, the Polymerase Chain Reaction (PCR) and quantitative PCR (qPCR) molecular detection technique is emerging very quickly as a method for detecting viruses in environmental samples. Compared to cell culture, the main advantages when using PCR for viral diagnosis include high sensitivity and specificityand for detecting viruses that can be cultivated or not, and in addition to releasingrapid results, in the order of hours. The main disadvantage of PCR methods is that unlike the cell culture method, which are capable of detecting infectious viruses that causes infection in the cultured cell or demaged non-infectious viral particles, the PCR method can potentially detect both infectious viruses and non-infectious viruses [
9,
28,
51,
52].
Humic and fulvic acids, heavy metals, nucleases and polyphenols are organic and inorganic components, that can causedegradation of nucleic acids, impairing the extraction stage or affecting the polymerase and reverse transcriptase, preventing the amplification and quantification of the genetic material present in the samples [
53]. They are easily found in the environment [
53]. Therefore, when in the viral concentration of the samples step occurs, interferents and inhibitors of viral detection may be concentrated together with the samples [
53].
In addition to epidemiological issues, the difference in detection between the two periods studied may be due to: with an increase in water volume, rainwater may have increased the concentration of inhibitors in the samples. In this study, the method for concentrating samples using negatively charged membranes is based on the structure of the virus, thus, the detection of free genetic material (RNA) will be reduced [
54]. The two RNA/DNA extraction kits used in this study are not validated for environmental samples (specifically water), according to the manufacturer's instructions they are ideal for whole blood, plasma, serum and other biological fluids free of cells other than animal/plant tissue. Furthermore, there is a difference in the detection kits using Sybr Green® (with different protocols and reagents), different thermocyclers used, freezing/thawing cycles of samples degrading viral RNA or a bad pairing of the oligonucleotides used and when collecting samples for the dry period, the samples got through the cDNA synthesis stage, unlike in the rainy season, which only carried out the RT-q-PCR stage, which may be factors that affected the findings in both study periods [
53].
Author Contributions
Conceptualization, G.P.B., L.C.G.B., P.S.S. and L.C.C.; methodology, G.P.B., L.C.G.B., F.S.L. and M.d.O.S.; software, L.C.G.B.; validation, G.P.B., L.C.G.B. and L.C.C.; formal analysis, L.C.G.B; investigation, G.P.B.; resources, J.D.G.V., P.S.S. and L.C.C.; data curation, G.P.B., L.C.G.B., P.S.S. and L.C.C.; writing—original draft preparation, G.P.B., L.C.G.B., P.S.S. and L.C.C.; writing—review and editing, G.P.B., L.G.B, P.S.S. and L.C.C.; visualization, G.P.B., L.C.G.B, P.S.S. and L.C.C.; supervision, P.S.S. and L.C.C.; project administration, P.S.S. and L.C.C.; funding acquisition, P.S.S. All authors have read and agreed to the published version of the manuscript.
