Introduction
Due to their higher levels of integration and increasingly complex operating environments, products exhibit complex and diverse failure modes. Two major failure processes are related to degradation processes and random shocks. For systems subject to degradation and random shocks simultaneously, their failures can be divided into soft failure and hard failure due to the physical interpretation of the respective Stress–Strength model and cumulative damage/shock model. Soft failure, such as wear, fatigue and so on, occurs when the cumulative degradation of the system exceeds the critical threshold of failure. by incorporating multiple sources of dependence between competing risks into a rich reliability model. For complex systems, the dependence between the two competing risks of degradation and shocks can lead to complex behaviors, which can be considered in a variety of different analytical perspectives. When a system withstands shocks, it becomes more vulnerable to upcoming shocks, while at the same time, the shock process can also damage the system and accelerate the deterioration process. This paper aims to construct a new model by incorporating multiple sources of dependence between competing risks into a reliability model with varying failure threshold. In the study of Song et al [
1], they considered that random shocks could lead to a sudden increase in the amount of degradation and Hao et al [
2] argued that random shocks lead to a decrease in the threshold of the soft failure then random shocks of the same size are more likely to make the system to fail. Rafiee et al [
3] investigated the effect of random shocks on the natural rate of degradation. The degradation process affects the hard failure threshold, and the cumulative increase in the amount of degradation is considered to cause a change in the hard failure threshold in the study by jiang et al [
4], which is a major challenge for modeling system reliability. There are also many studies on reliability modeling of systems undergoing multiple interdependent degradation processes. Zhang et al [
5] applied Copula to fit the distribution of multiple degradation processes, and Liu et al [
6] utilized an inverse Gaussian process to build a reliability model with multiple degradation processes. In these studies, only the interdependence of degradation processes was considered, while the competition between shock and degradation processes was not considered
. Song et al [
1] developed a multi-part reliability model but didn't consider the interdependence of the parts. Li et al [
7] investigated a reliability model with one shock process and two degradation processes but in their study the three processes were independent of each other. An et al [
8] investigated a reliability model with one shock and two associated degradation processes, but didn't take into account the effect of degradation processes on the impact of the shock process. In a practical engineering context, on the one hand, random shocks will accelerate the degradation of the system, and on the other hand, an increase in performance degradation will lead to a decrease in the hard failure threshold of the system, thus making the system more susceptible to shocks while the system undergoes multiple interdependent degradation processes.
There is a large amount of research on modeling the degradation process of a system, and the typical methods for modeling the degradation process are the linear degradation model [
9], degradation quantity distribution model [
10] and stochastic process model. Among them, modeling the degradation process of a system with Wiener process [
11] and gamma process [
12] is the most common stochastic process model. And the random shock process is often described as a homogeneous Poisson process [
13]. According to the various failure mechanisms of hard failure, the following shock models mainly exist: extreme shock [
14], cumulative shock [
15],
shock [
16], and hybrid shock [
17]. As an example, Sandia National Laboratories conducted reliability tests on MEMS parts [
18]. Random shocks can lead to spring damage in MEMS parts, while wear, corrosion, and fatigue can cause wear and tear on MEMS parts. Shocks from external sources may lead to fragmentation of the parts and increase wear and tear, which leads to an increase in the amount of degradation of the MEMS. While other causes such as corrosion, aging, and wear can be considered as natural degradation of MEMS.
In this paper, a Copula-based approach is used to describe and model the symmetric or asymmetric correlations between the multiple performance degradation processes of a system using Copula functions. Four commonly used Copula functions for positive correlation are Gumbel Copula, Multivariate Normal Copula, Clayton Copula and Frank Copula, and the AIC criterion is utilized to select the most suitable Copula function. This paper also considers the effect of random shocks on the amount of system degradation and the effect of the amount of system degradation on the hard failure threshold, and establishes a system reliability model considering the change of competing failure thresholds, which is verified and analyzed by numerical examples.
The reminder of this paper is organized as follows. Section1 introduce the research system.
Section 2 describes the single degradation model with varying failure threshold and derives the formula for computing reliability. In
Section 3, the Copula function theory and Copula construction are outlined, as well as the multivariate system reliability Copula function. Experiments are performed using the dataset on MEMS presented in
Section 4. The conclusion is presented in
Section 5.
1. System description
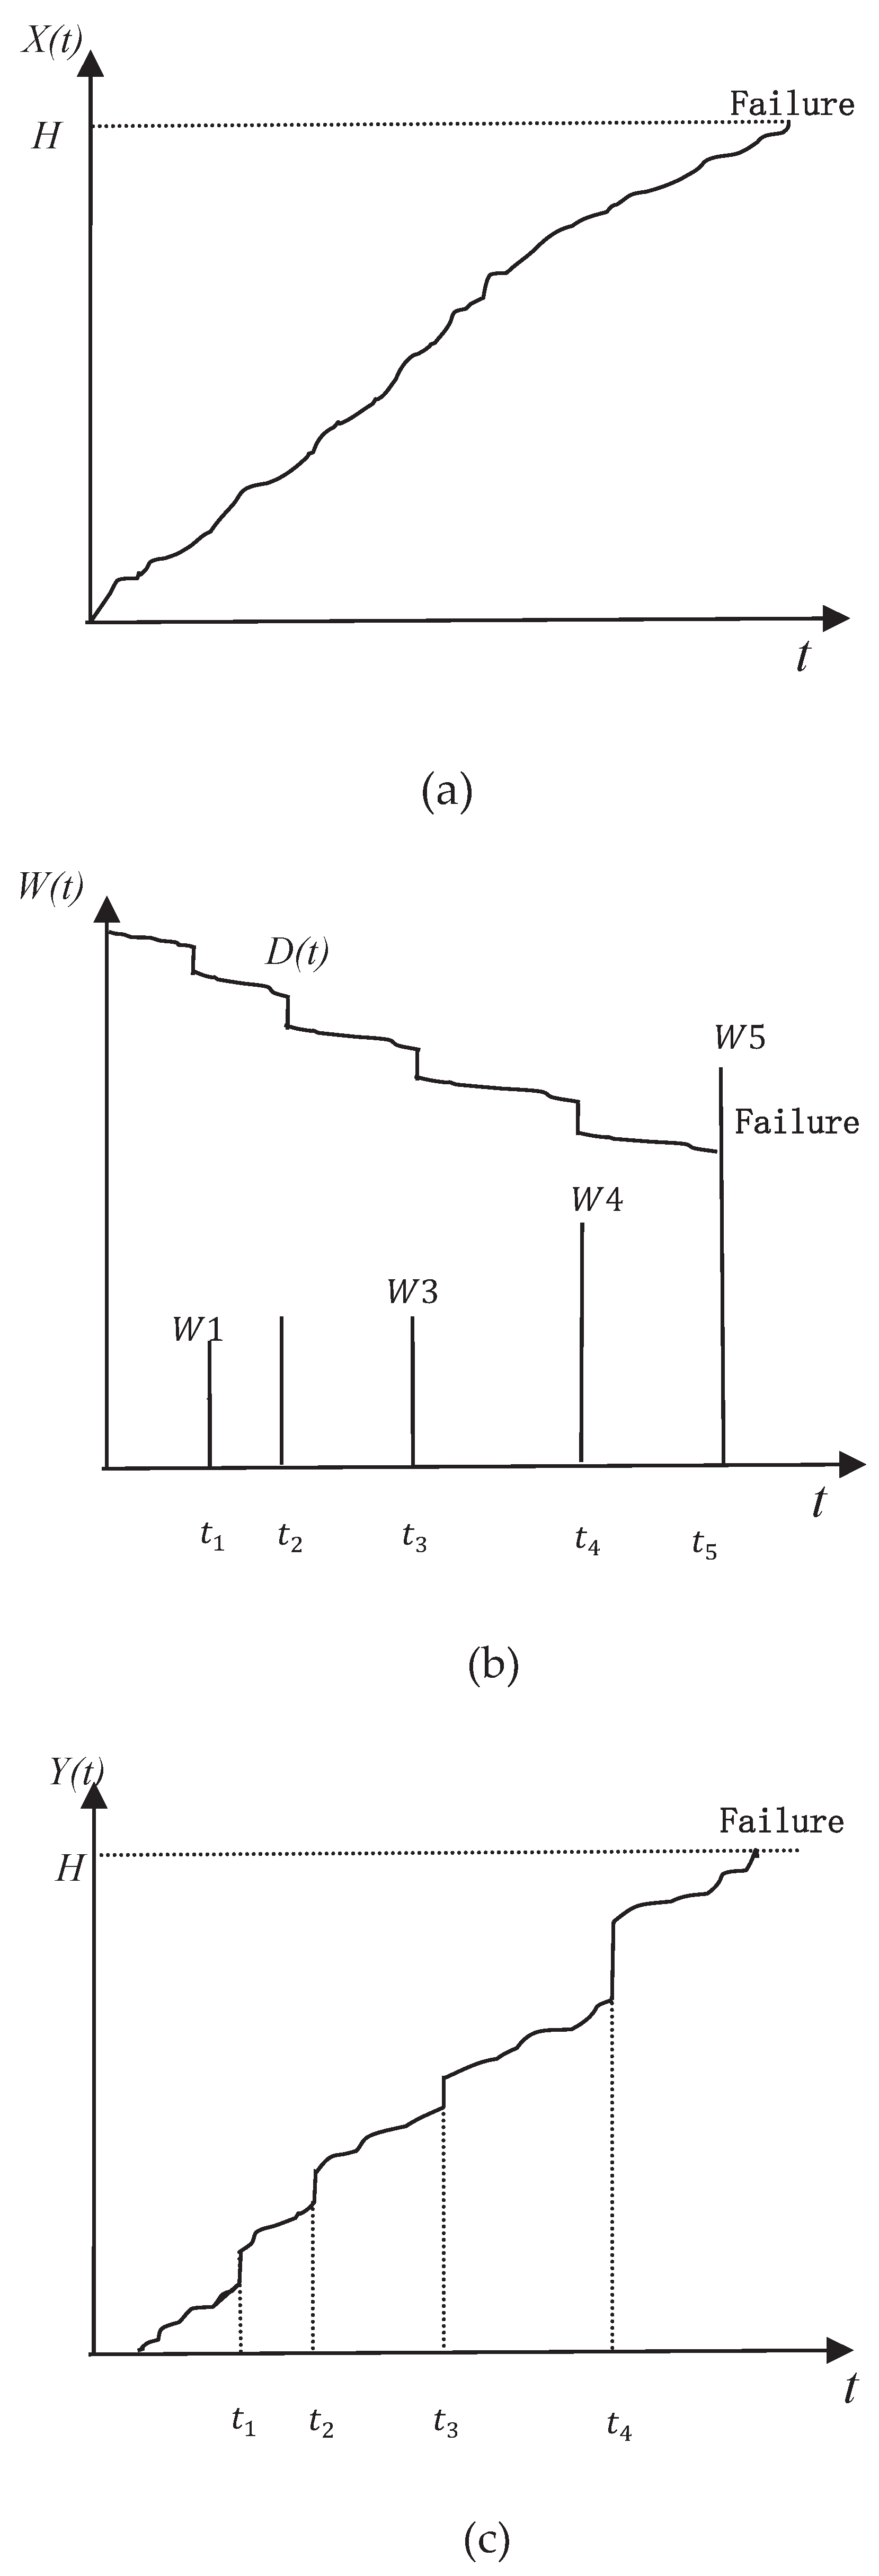
Soft failure occurs when the degradation performance is greater than the critical threshold level, as shown in
Figure 1a. External random shocks affect the stresses in the system by bringing a sudden increase in the degradation properties and thus the system undergoes both natural degradation processes and random shock processes during the working period, which are not independent, and random shocks have an effect on the natural degradation. The effects of random shocks on the system can be categorized into two types: shocks whose magnitude exceeds the hard failure threshold
lead to hard failure of the system, as shown in
Figure 1b;The shock magnitude is always below the hard failure threshold, but each non-lethal shock leads to an increase in the degradation performance of the system, and the system eventually reaches the soft failure threshold under the effect of natural degradation and random shocks, thus failing, as shown in
Figure 1c.
In the early stage of the system's work, the performance of system is excellent and has enough ability to resist external shocks, but after a period of operation, the system's performance gradually declines with the passage of time and the interference of external shocks. When considering the degradation process of natural degradation-stochastic shock competition, the hard failure threshold can be thought of as a varying that decreases as the total degradation increases. As the hard failure threshold decreases, smaller shock intensities may also fail the system.
In practice, the ability of a system to resist shocks decreases with time and the amount of degradation. If the change in the system's ability to resist shocks is not taken into account, the reliability of the system obtained may be on the high side. After deriving a single degradation path reliability model with varying failure thresholds, the model is generalized to the context of multiple degradation paths to compare the reliability of the degradation paths in the independent and correlated cases, and thus it is necessary to consider the variation of the system's hard failure thresholds and the correlation of the multiple degradation paths for the assessment of the system's reliability.
| Symbol |
|
|
|
|
Initial hard failure threshold of the system |
|
Diffusion coefficient for natural degradation |
|
Hard failure threshold at time t |
|
Magnitude of random shocks |
|
The natural degradation at time t |
|
Conversion rates for random shocks |
|
Total degradation due to natural degradation and random shocks at time t |
|
Conversion rate of total degradation to hard failure thresholds |
|
Cumulative degradation due to random shocks at moment t |
|
The moment when the system experiences the mth shock |
|
soft failure threshold |
R(t) |
reliability function |
|
Drift coefficient for natural degradation |
|
|
2. Competitive Failure Reliability Analysis with varying Hard Failure Thresholds
2.1. Natural degradation processes
To make the derivation in this paper easy to understand, the continuous degeneracy process is described by the Winner process, i.e.,
. Let CDF of
be
,
denotes the drift parameter of the system, and
denotes the diffusion parameter of the system, reflecting the rate and magnitude of degradation, respectively. As shown in
Figure 1a, in the state of natural degradation, if the total degradation of the system exceeds
then the system fails.
2.2. Natural degradation - random shock processes
The system may be subjected to external shocks such as corrosion, impact, etc. in the course of its operation, and these shocks will cause different degrees of loss to the system performance. Assuming that the arrival of random shocks follows the arrival rate of
of the homogeneous Poisson process (HPP), i.e.
Included in the random shocks described above are lethal and non-lethal shocks. The degradation process depends on random shocks, and each arriving shock leads to an increase in the cumulative degradation
. Assume that S(t) is a linear combination of shock magnitudes
.
Let
denote the intensity of the
random shock
is a set of independently and identically distributed random sequences, each random shock obeys the normal distribution,
, so
also obeys a normal distribution
Assume that the system suffers m shocks during operation, and denote the moments when the system suffers shocks by
. Then the total degradation of the system is expressed as
where
denotes the efficiency with which the shock intensity is transformed into a degradation increment after the system experiences a random shock. Since the natural degradation quantity
and the random shock intensity
both obey a normal distribution and they are independent,
as a linear combination of
and
also obeys a normal distribution.
The natural degradation process and the random shock process are defined above, and once the total degradation of
and
exceeds the soft failure threshold
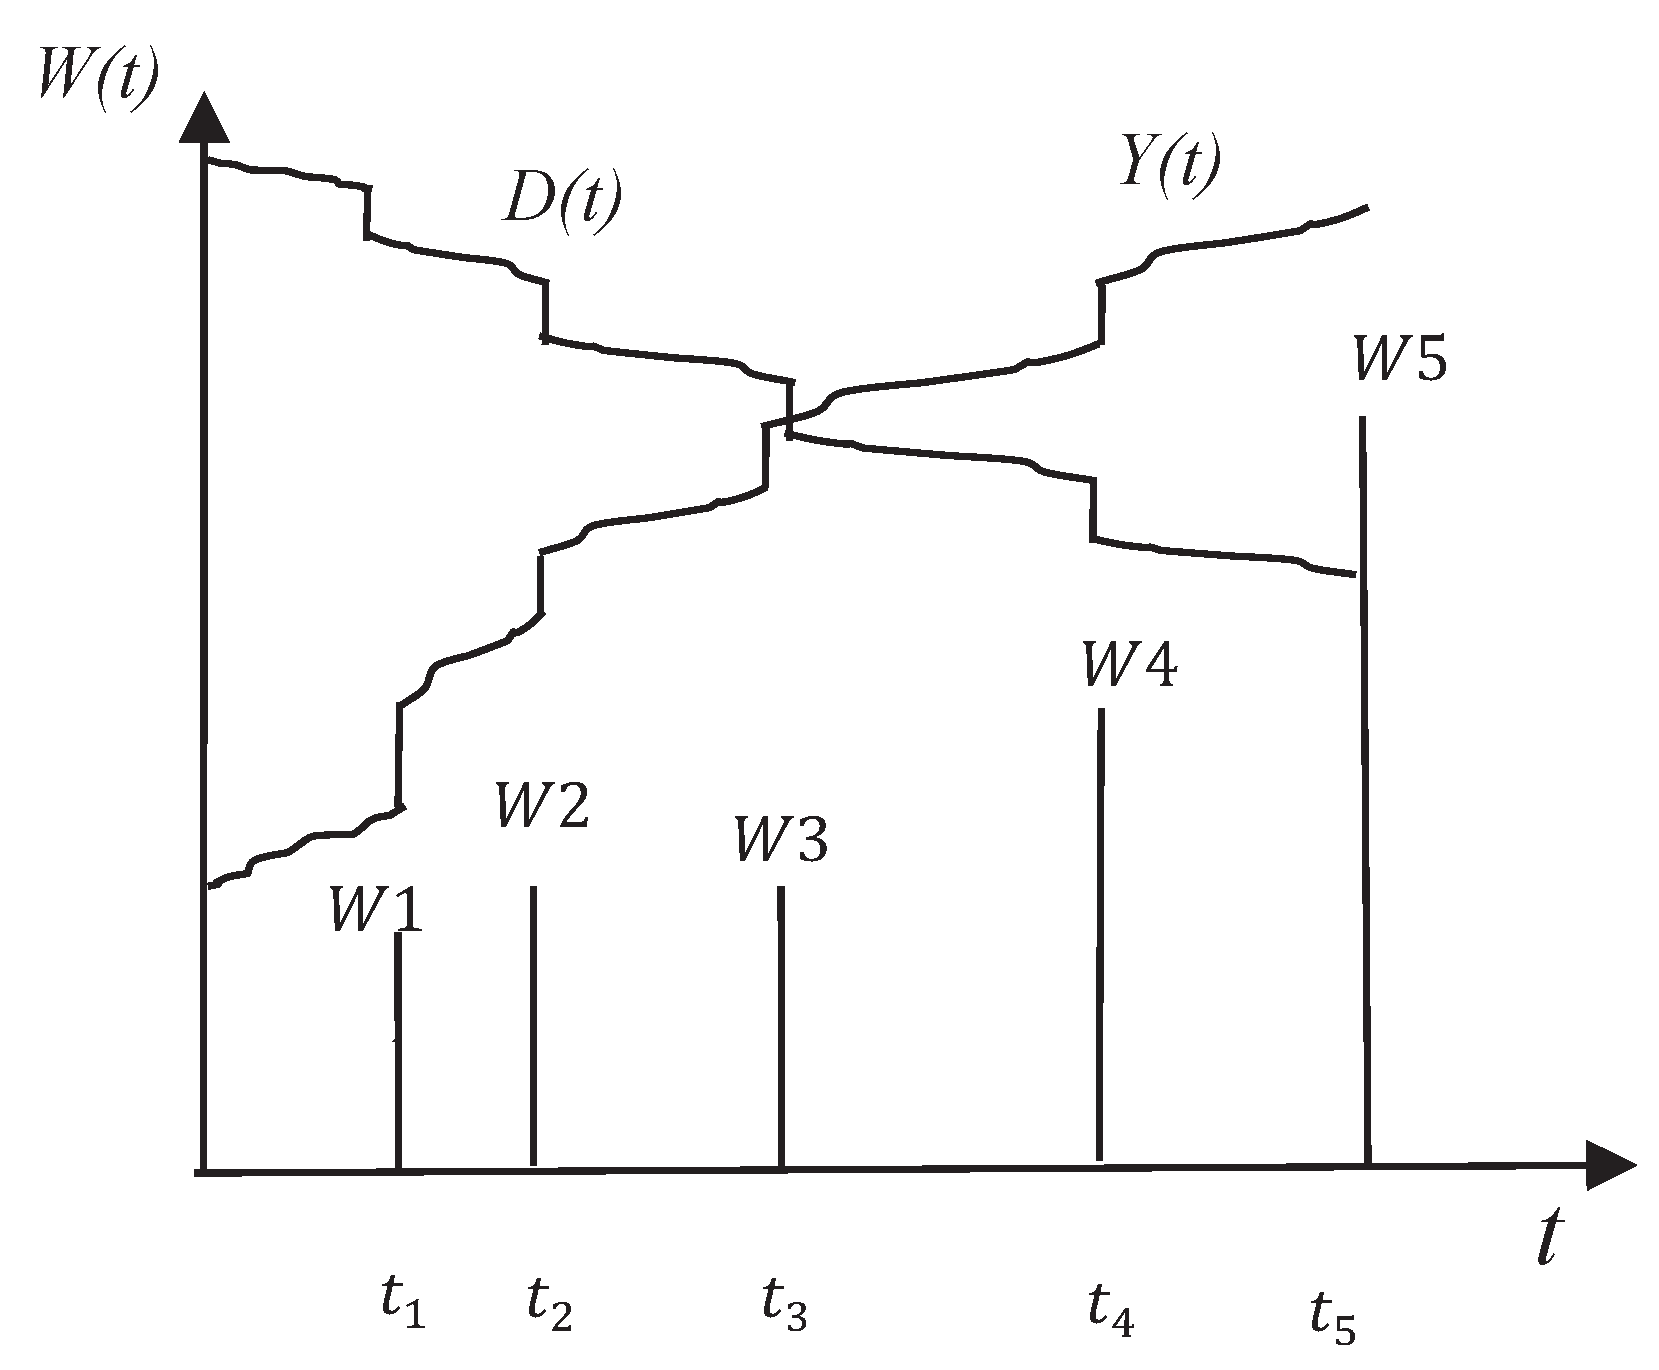
, the system will experience soft failure. The hard failure caused by the random shock process depends on the natural degradation process, and once the intensity of the random shock exceeds the hard failure threshold, the system undergoes hard failure. As the system degrades naturally, the system's ability to resist shocks decreases. As shown in
Figure 2.
2.3. Degradation-Shock Competition Failure Model for Single Degraded Paths Based on Varying Failure Thresholds
2.3.1. Degradation-Shock Process Modeling Based on Varying Failure Thresholds
Once the total degradation
exceeds the soft failure threshold
, the system will fail. The total degradation consists of the natural degradation process
and the cumulative degradation caused by random shocks
,
,Therefore, the probability that the system will not undergo a degradation failure after experiencing m shocks before the moment t is
The distribution of
has been derived above,
, so the above probability can be expressed by the CDF of the normal distribution, and the probability that the system does not fail at the time of t moments can then be expressed as
The performance of the system is constantly declining under the effect of natural degradation and random shocks. The fixed hard failure threshold in previous studies is transformed into a varying failure threshold that declines with performance. During random shocks, when the shock reaches a certain intensity, the system can no longer withstand external shocks and thus hard failure occurs.
Based on the above analysis it can be assumed that there is a relationship between the hard failure threshold and the total amount of degradation, and the hard failure threshold at moment t is: . Where N(t) is the number of shocks that occurred before moment .
At the
shock, the probability that the shock magnitude is less than the hard failure threshold D(t) is
Since both and follow normal distributions and are independent, it is straightforward to use the CDF of the normal distribution to represent the probability that the random shock intensity is less than the hard failure threshold.
The probability that the system does not fail without a hard failure at moment
under m random shocks is
2.3.2. Competitive Failure Reliability Modeling Based on Varying Failure Thresholds
Competing failures are the result of the interaction of soft and hard failures. During the operation of the system, the reliability of the system can be categorized into reliability without random shocks and reliability with random shocks. When no shock occurs before time t, i.e.,
,then
,。The probability that the system does not experience failure is
Since the number of times a shock arrives at time t is obeying a homogeneous Poisson process with arrival rate
. Therefore, the reliability function of the system when no shock occurs before time t is
The last equation is due to the fact that X(t) obeys a normal distribution with mean
and variance
. When the number of shocks arriving at time t,
, where
is the time of arrival of the mth shock, the hard failure threshold, D, decreases as the amount of degradation increases, so that two conditions must be met for the system not to fail: 1. the overall amount of degradation is less than the soft failure threshold; 2. the magnitude of a single shock is less than the hard failure threshold. Thus in the case of m random shocks occurring, the reliability function of the system is
Thus, by combining the reliability function
with no shock before moment t and m shocks, the reliability function of the system under random shocks and natural degradation conditions can be obtained as
3. Multiple Degradation Paths Based on Varying Failure Thresholds
3.1. Reliability analysis of multiple degradation paths
During the operation of a system, there may be multiple degradation processes. Assuming that there are K degradation processes in a given system, use to denote the total degradation of the degradation process, . The soft failure threshold for each degradation process is , and the system will undergo a soft failure when one of the degradation processes has a total degradation that exceeds the soft failure threshold . The total degradation consists of the natural degradation and the incremental degradation caused by the shock . Denote by the increment of sudden degradation caused by a shock to the degradation process. where there is a linear relationship between and the shock size: ,where denotes the increment of degradation caused by a random shock of unit size to the degradation path. The hard failure threshold for each failure process also decreases as the total degradation increases, ,where represents the hard failure threshold for the degradation process.
(t),According to Eq. 13, the reliability function for the
degenerate process
is
If multiple degradation paths are independent, the probability that the system does not experience failure is
In practical production applications, degradation processes are interdependent and the correlation between these degradation processes needs to be considered. Copula is an effective statistical tool for modeling correlations, and when marginal distributions are known, Copula provides a way to build joint distributions.
Copula Definition[
19]: A Copula is a joint distribution function of standard uniform random variables. That is
Sklar's theorem[
19]:
is the joint distribution function of the
n-dimensional random variable
, where the marginal distributions are
, respectively. Then there exists a unique n-dimensional Copula function
satisfying
One of the attractive properties of copulas is symmetry. A bivariate copula function C is said to be symmetric if
for all
. [
19]
The system should not be subjected to fatal shocks during normal operation, so the degradation process should not exceed each soft failure threshold and the intensity of the shock should not exceed the hard failure threshold for each degradation process. The marginal distribution function
of each degradation process is known according to Eq. 14, then the reliability function of the system when the degradation paths are correlated can be written as
3.2. Choose the Copula function
The degradation process of the system are positively correlated and the common positively correlated Copula models consist of, Gumbel Copula, Multivariate Normal Copula, Clayton Copula and Frank Copula. The parameters of the joint Copula distribution function are estimated by simulating the marginal distributions of each degenerate process and fitting the joint Copula using the functions in the Copula package in R. There are many ways to test the goodness of fit of a Copula function, and the goodness-of-fit test is performed on the Copula function using the AIC principle. The Copula with the smallest AIC value is the best joint density function. Where the AIC of the Copula function is denoted as
where
k is the number of parameters and L is the likelihood function。
Where is likelihood function of the multivariate Copula of ().
Table 1.
Common Copula Functions.
Table 1.
Common Copula Functions.
| Copula |
|
∈Ω |
| Gumbel |
|
∈(0,1) |
| Gauss |
|
∈[-1,1] |
| Frank |
|
∈[-∞,+∞]/{0} |
| Clayton |
|
∈(0,+∞) |
Gumbel Copula is a symmetric Copula function that describes the correlation between the upper and lower tails, while Clayton Copula is an asymmetric Copula function that describes the correlation of the lower tails.
When there are two degenerate paths, substituting into Eq. 15, the reliability function of the system is
4. Numerical example
The reliability models established for single degradation path and double degradation path are validated using microelectromechanical MEMS as an example. The failure process of MEMS may be: 1. soft failure due to mechanical aging caused by natural degradation and random shocks; 2. hard failure due to mechanical structure fracture caused by excessive intensity of random shocks. Moreover, the gradual aging of MEMS results in the decline of its own structural stability, lowering the hard failure threshold and making it more susceptible to random shocks. Using the data from Tanner [
19] as well as Peng [
20] and others, together with some reasonable assumptions. The parameter values of the system are shown in the table below.
Table 2.
Parameter list of microcomputer algorithms, single degenerate paths.
Table 2.
Parameter list of microcomputer algorithms, single degenerate paths.
| Parameters |
Value |
Source |
| H |
0.00125 |
[19] |
|
1.55 |
[19] |
| W |
|
[20] |
|
|
[20] |
|
|
[17] |
|
|
[4] |
|
-100 |
Assumption |
|
|
Assumption |
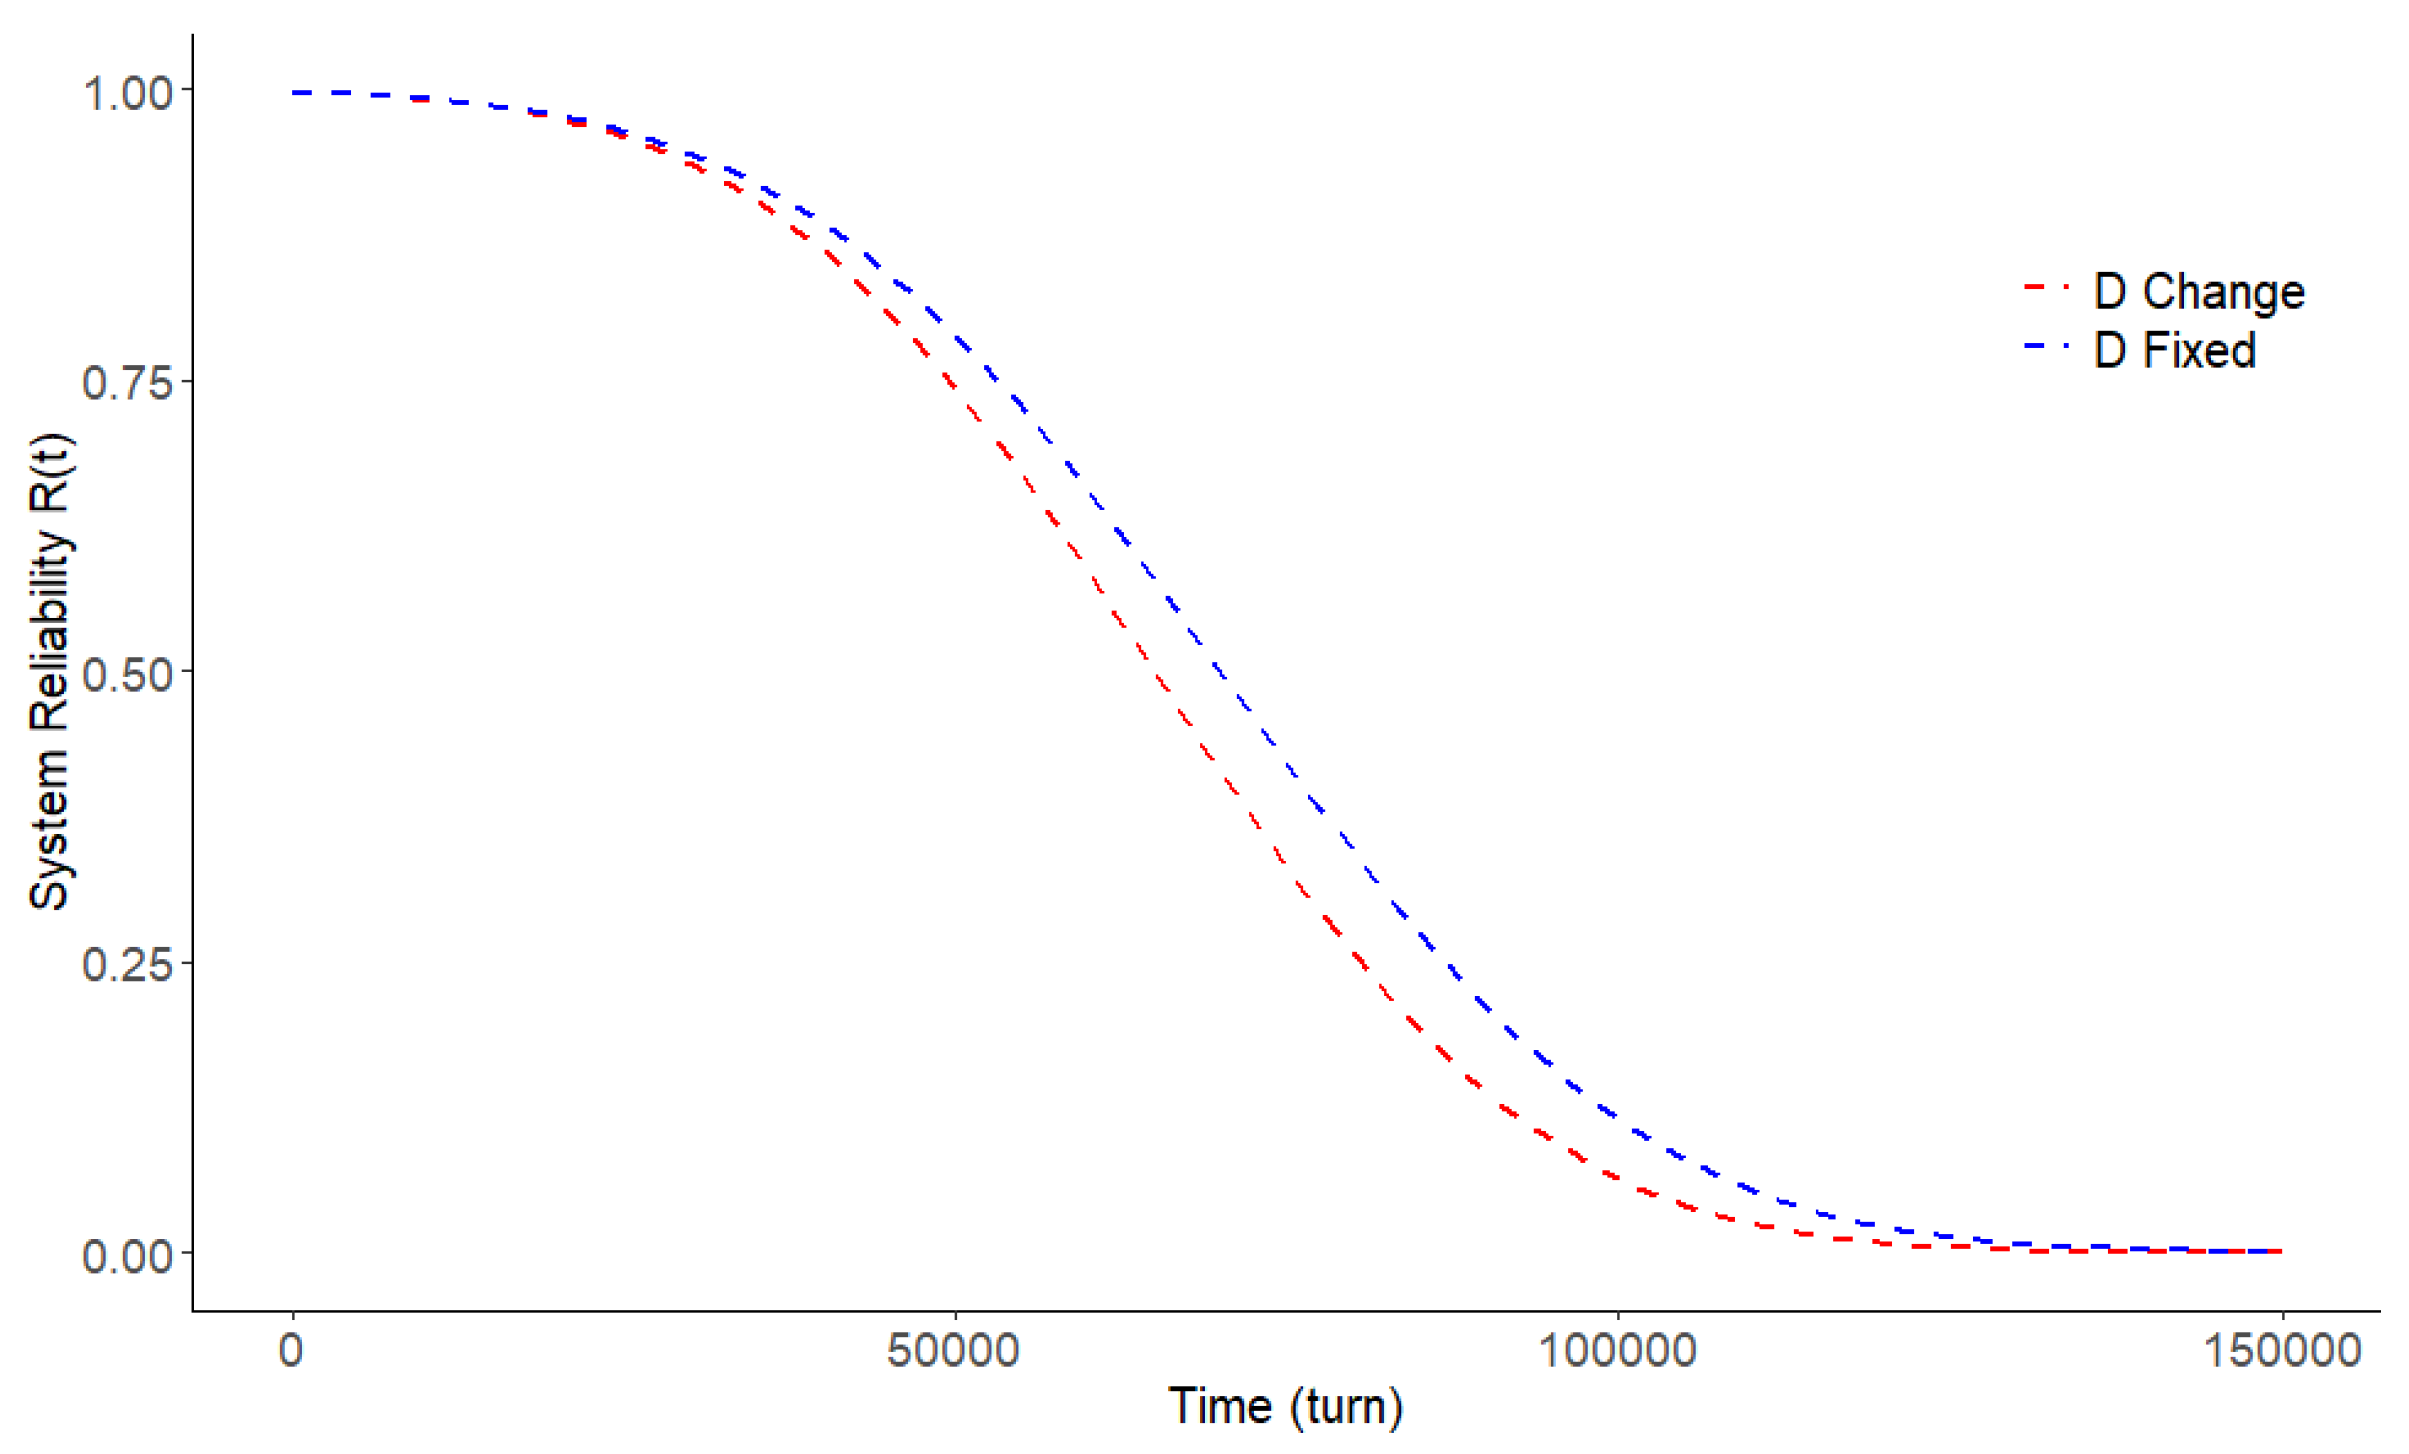
The reliability function curves of the system for fixed failure threshold and varying failure threshold cases are given in
Figure 3. It is observed from the figure that the variation of the failure threshold has an effect on the reliability of the system. Random shocks cause the degradation process to intensify, the hard failure threshold decreases as the cumulative degradation increases, and random shocks are more likely to fail the system at the same intensity. If the variation of hard failure threshold is not considered, the reliability of the system will be overestimated, which will result in unnecessary losses.
In order to investigate the effect of random shocks on the amount of degradation as well as the amount of degradation on the hard failure threshold, sensitivity analyses were performed for parameter
and parameter
, respectively. Parameter
measures the effect of random shocks on the amount of degradation and parameter
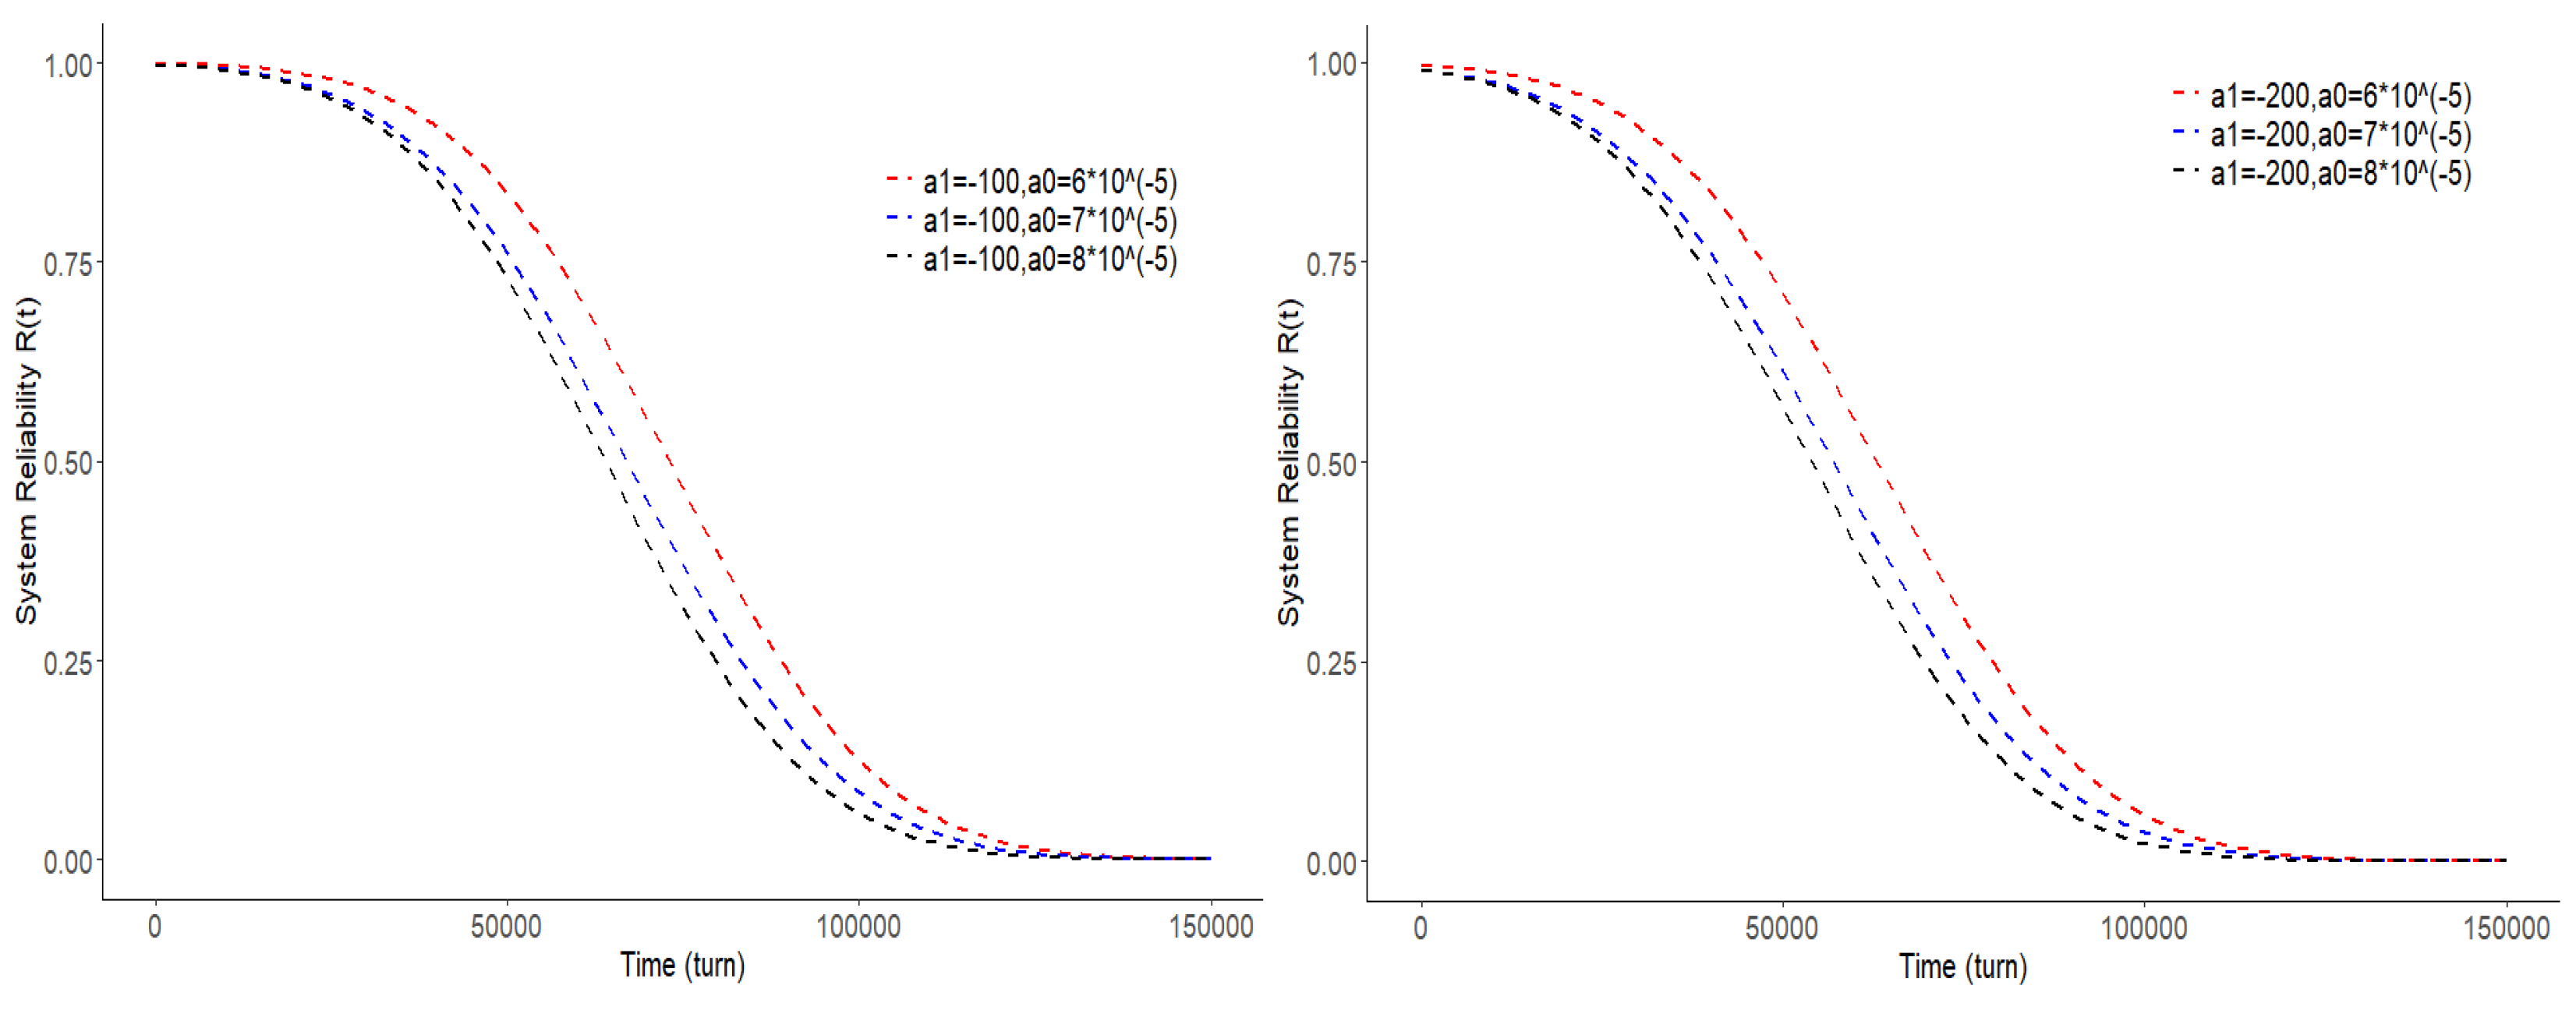
measures the effect of cumulative degradation on the hard failure threshold. As shown in
Figure 4, an increase in parameter
leads to a decrease in the reliability of the system. The larger the parameter
, the lower the reliability of the system, this is because an increase in
leads to a faster decrease in the hard failure threshold, and random shocks of the same intensity are more likely to lead to a hard failure of the system. The same parameter
increases, the reliability of the system decreases, this is because the increase of
, the greater the impact of random shocks on the cumulative amount of degradation of the system, the same intensity of random shocks let the system add more degradation.
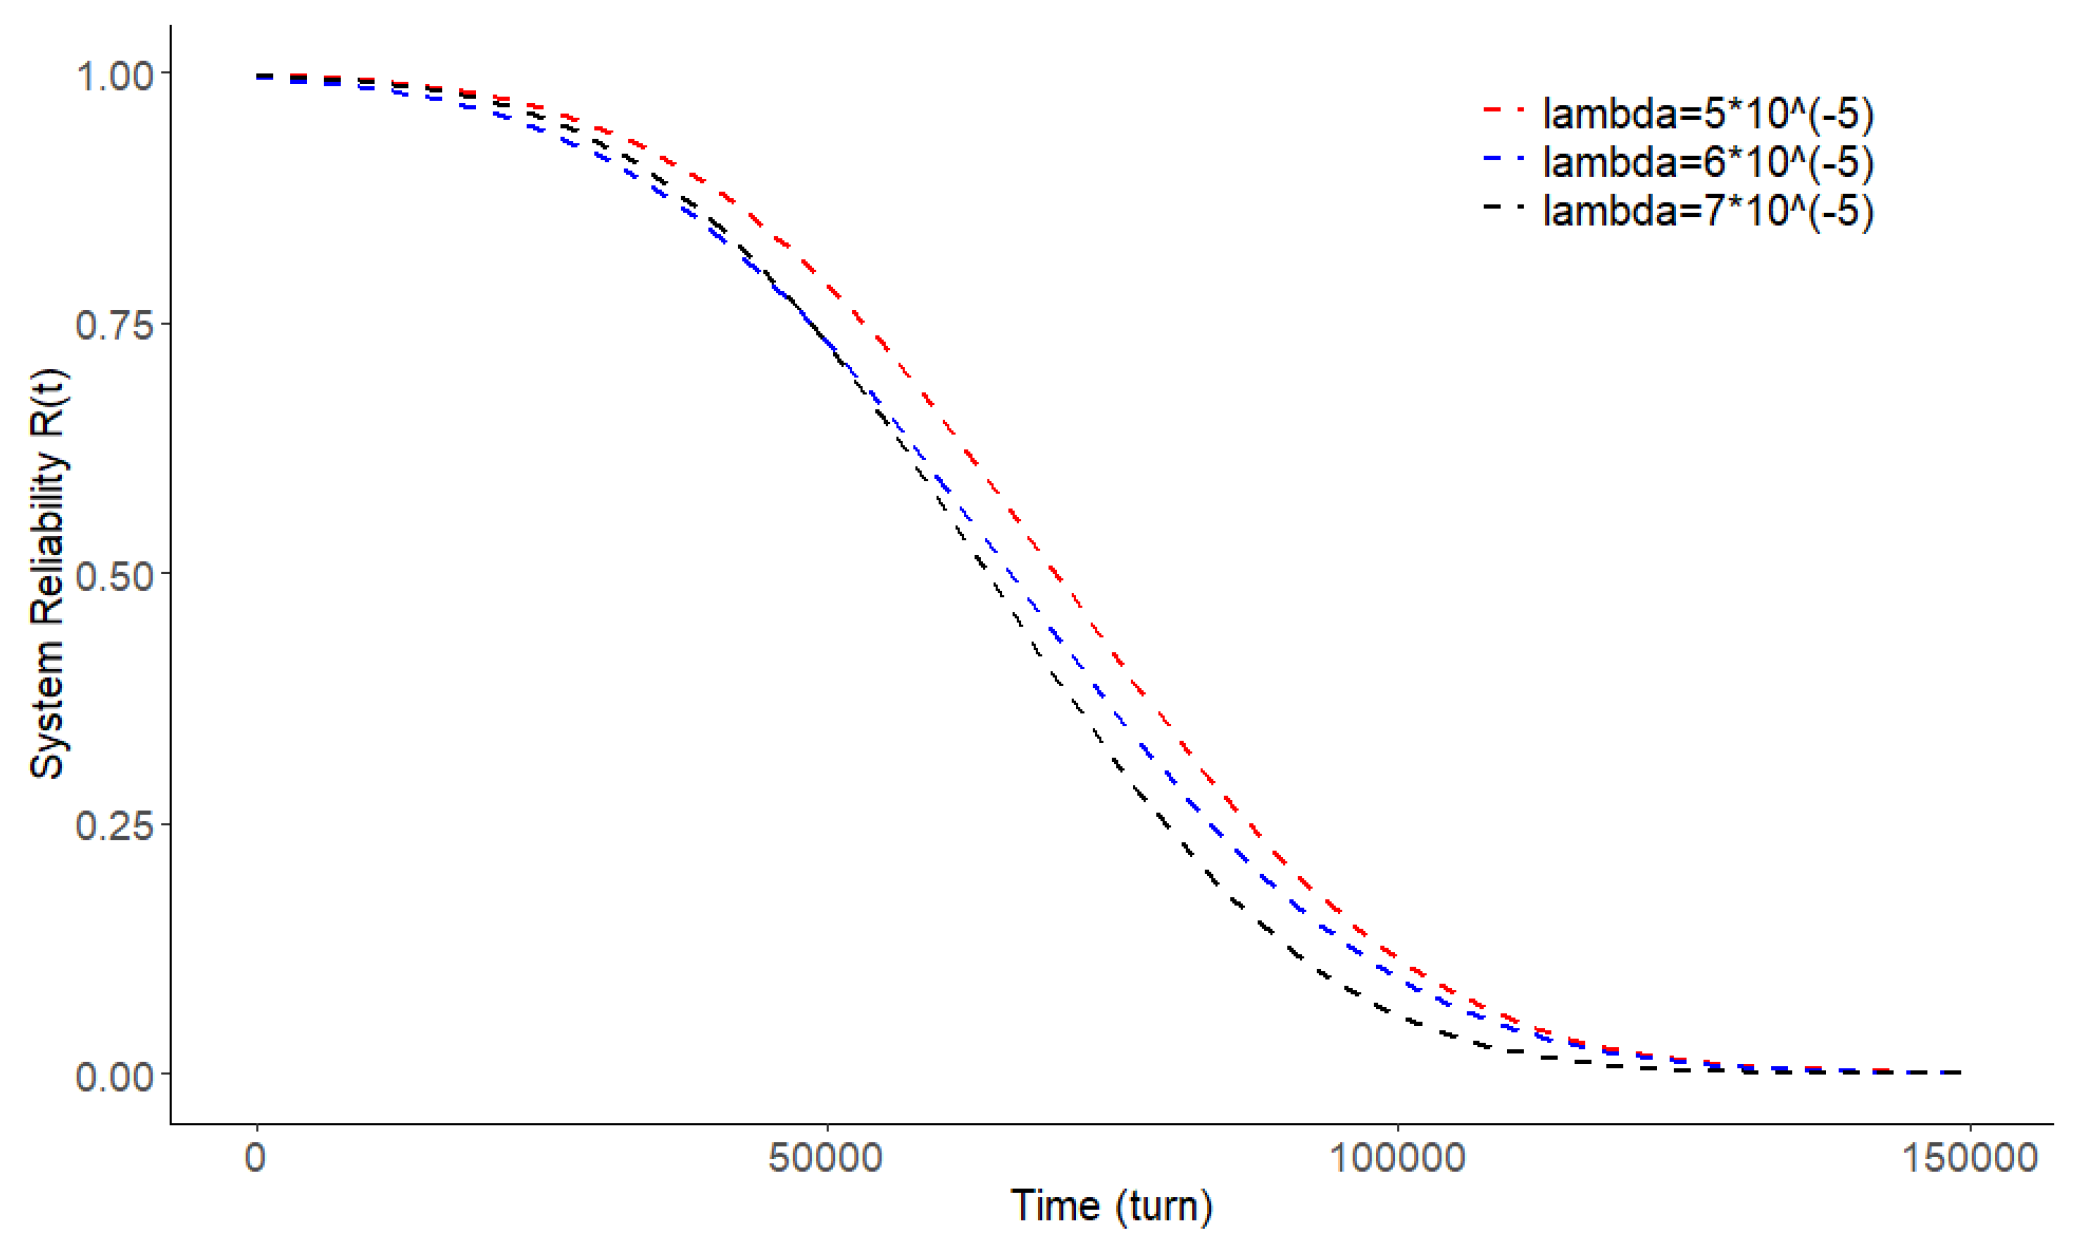
The arrival rate of random shocks is also an important factor in the reliability of a system. If the random shocks experienced by the system are too frequent, the faster the degradation of the system increases, the more likely the system will fail at a later stage.
Figure 5 shows the reliability function of the system under different random shock arrival rates. From these three reliability curves, it can be observed that the larger the random shock rate is, the lower the reliability of the system is, and the system is more likely to fail.
Table 3.
Parameter table for microcomputer algorithms, two degradation paths.
Table 3.
Parameter table for microcomputer algorithms, two degradation paths.
| Parameters |
Value |
Source |
|
0.00125 |
[20] |
|
0.00100 |
Assumption |
|
1.55 |
[20] |
|
1.45 |
Assumption |
|
|
[2] |
|
|
[21] |
|
|
[21] |
|
|
[4] |
|
-100 |
Assumption |
|
|
Assumption |
In order to obtain the Copula function for the two degenerate paths, the marginal distribution functions
and
are firstly calculated, and then the parameters of the Copula function are calculated. The relevant parameters of Copula are obtained as shown in
Table 4. The AIC of each Copula function is obtained by substituting the parameter values into the AIC criterion (Eq. (16)). From
Table 5, the Gumbel Copula has the smallest AIC, indicating that the Gumbel Copula is best suited for describing the correlation between the marginal failure distributions, with the estimated parameter a=0.0438 which implies that there is a strong correlation between the failure distributions in the upper and lower tail portions. The value of a is substituted into the Gumbel Copula function and combined with equation (16) to estimate the
of the system.
Since the Gumbel Copula is a symmetric Copula function, the reliability function (17) of the system is also symmetric, i.e.,. This means that both degradation paths have the same effect on the system, and whichever degradation path reaches the soft failure threshold first will lead to the failure of the system.
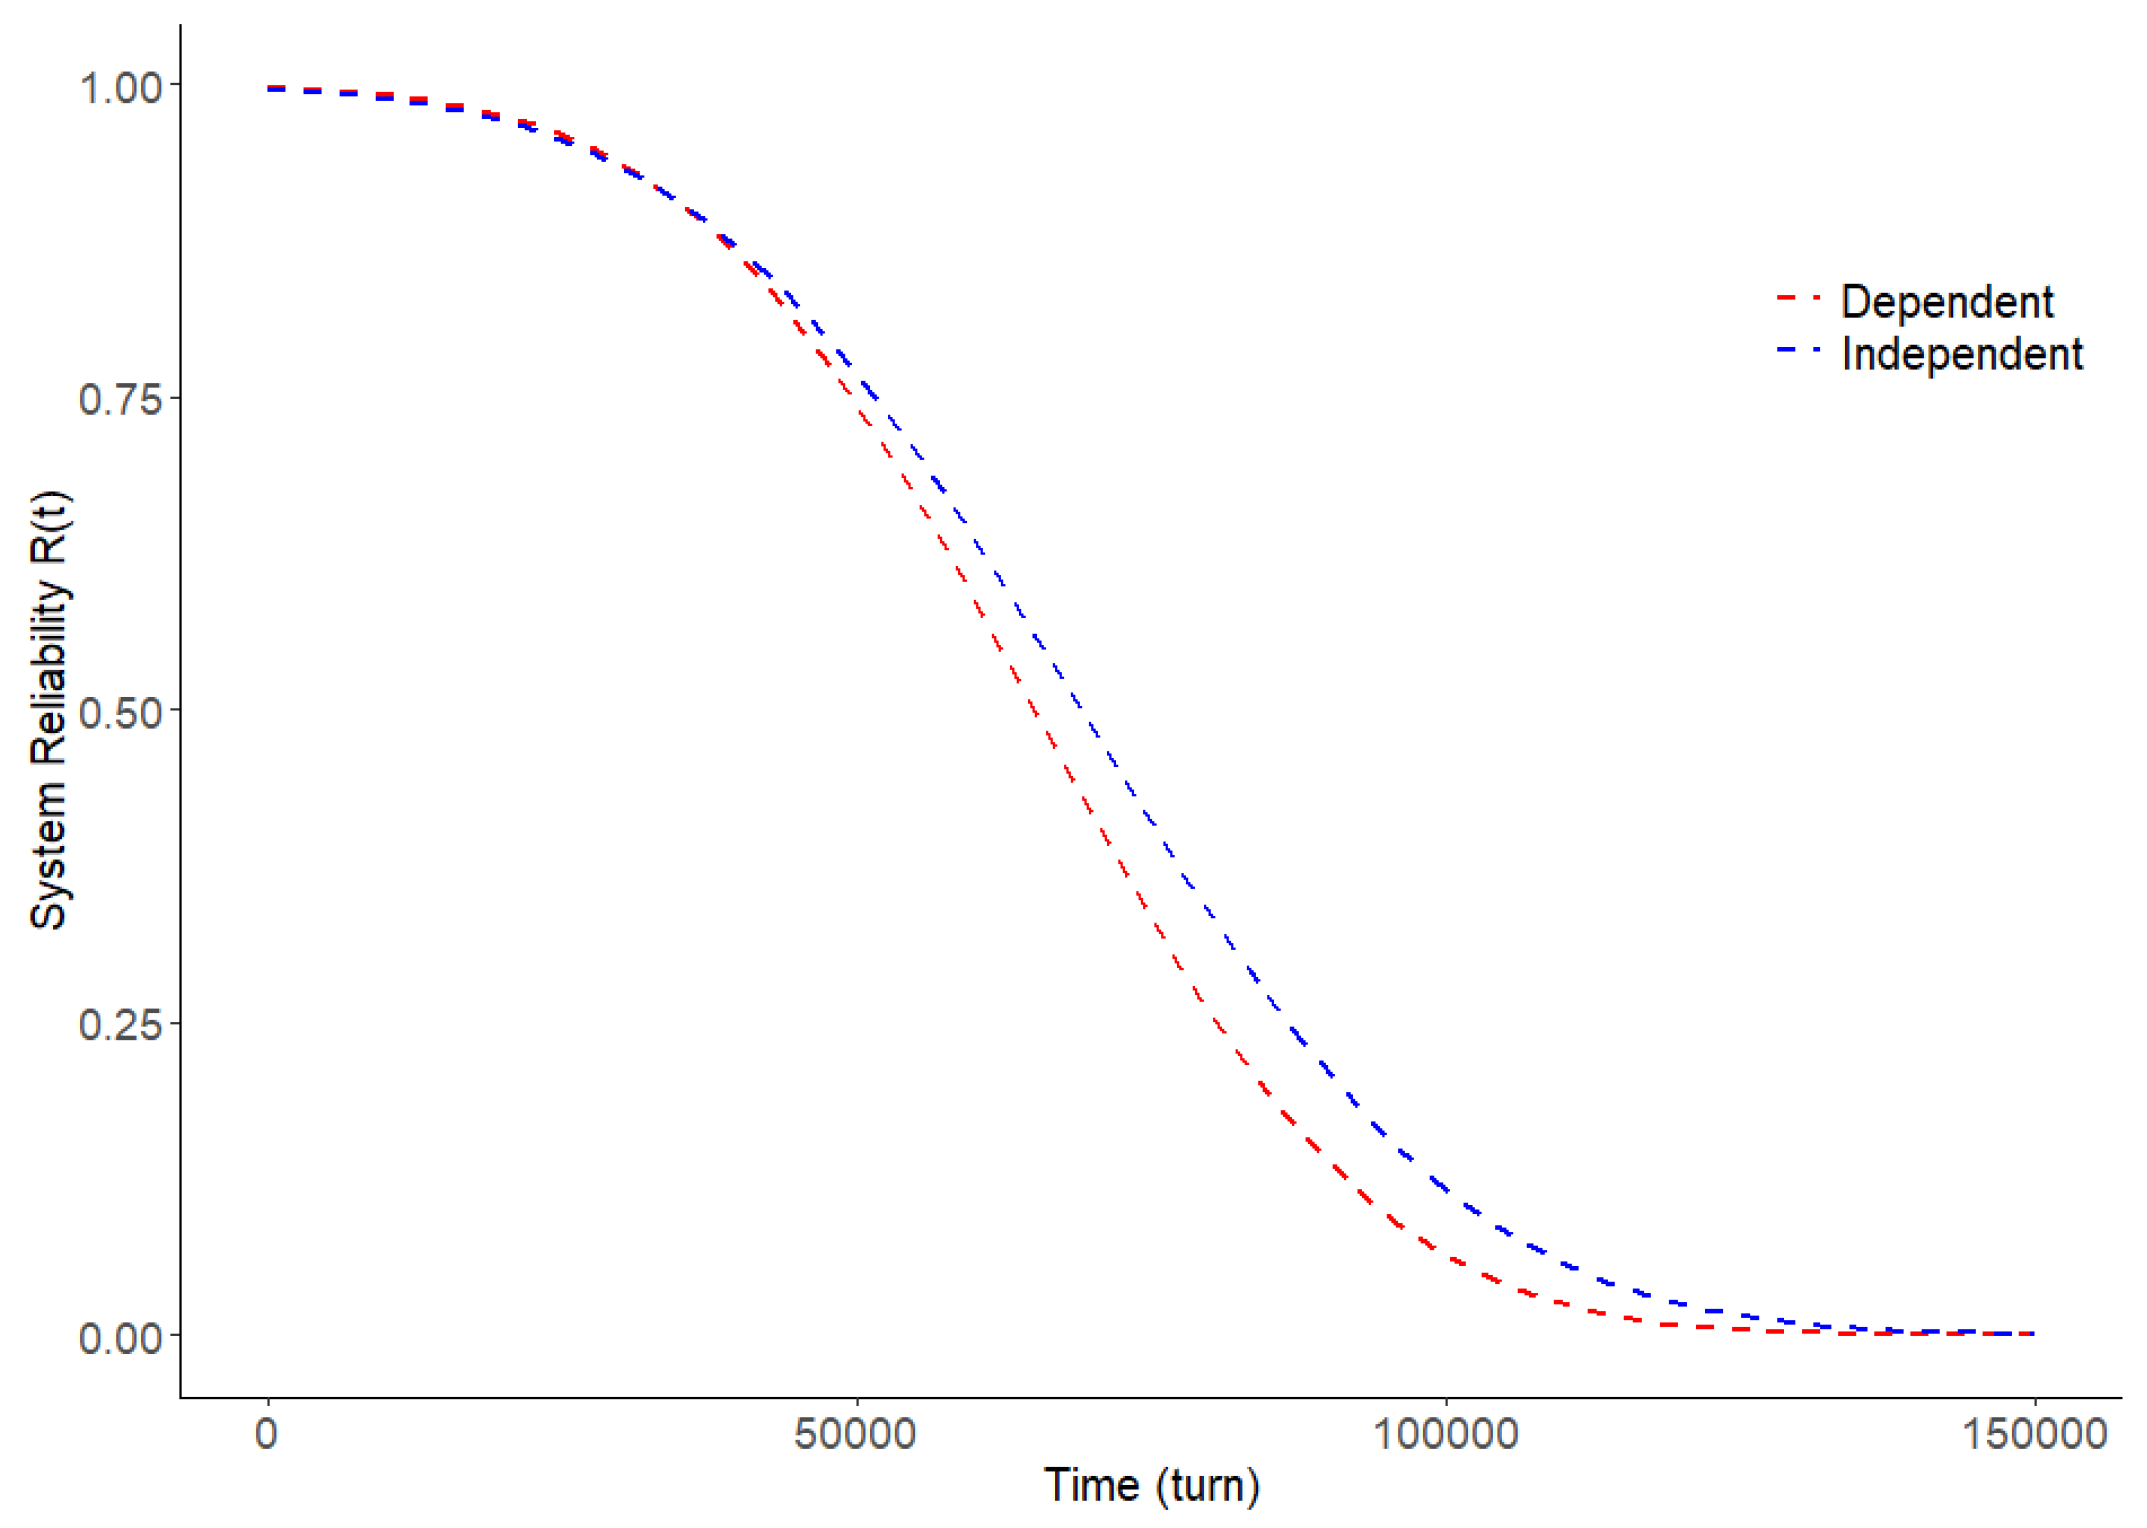
The reliability curves of the two degradation paths are plotted in
Figure 6, and the reliability functions for both the independent and correlated cases of the two degradation paths are plotted in
Figure 7, from which it can be seen that the reliability of the system when the two degradation paths are correlated is lower than the reliability of the system when the two degradation paths are independent, and therefore it is very important to take into account the correlation of the degradation paths.
5. Conclusion
In this study, a complex reliability model is developed. Firstly, a competitive failure model for a single degraded path based on the change of hard failure threshold is developed. Utilizing the symmetry of the Copula function, the marginal distribution function can be used flexibly when modeling multivariate reliability. The failure model for a single degradation path was combined with a Copula function to derive a degradation-shock competition failure model for multiple degradation paths. Competing failure models with a single degradation path compare the reliability of varying hard failure thresholds and fixed hard failure thresholds, and the system reliability with varying failure thresholds is lower than that with fixed failures, so the variation of hard failure thresholds cannot be ignored in the process of exploring system reliability. In the degradation-shock competition failure model with multiple degradation paths, the reliability of the system under the conditions of correlation and independence is compared with two degradation paths as an example. The reliability of the system is lower in the case where the degradation processes are correlated, so the correlation between multiple degradation paths cannot be ignored. From the arithmetic examples, it is shown that this study has applicability and validity in practical engineering applications.
The main contributions and innovations of this paper are as follows: the hard failure threshold of the system is considered to decrease with the cumulative degradation of the system, thus reflecting more realistically the failure risk of the system. A Copula-based approach is adopted to describe and model the symmetric or asymmetric correlation between the multi-performance degradation processes of the system using Copula functions, thus capturing the degradation characteristics of the system more flexibly. Four commonly used positively correlated Copula functions, namely Gumbel Copula, Multivariate Normal Copula, Clayton Copula, and Frank Copula, are selected and the AIC criterion is utilized to select the most suitable Copula function. A Copula-based approach is adopted to describe and model the symmetric or asymmetric correlation between the multi-performance degradation processes of the system using Copula functions, thus capturing the degradation characteristics of the system more flexibly.
The research in this paper is of great significance in understanding and evaluating the impact and effect of symmetry/asymmetry of a system because: the symmetry/asymmetry of a system reflects the failure mechanisms and failure characteristics of the system, and different failure modes and failure mechanisms may lead to changes in the symmetry/asymmetry of the system, which may affect the reliability and lifetime of the system. Considering the symmetry/asymmetry of the system can make the reliability model of the system more accurate and perfect, thus providing more valuable information and guidance for the reliability assessment and optimal design of the system.
References
- Song, S.; Coit, D.W.; Feng, Q. Reliability for systems of degrading components with distinct component shock sets. Reliability Engineering & System Safety 2014, 132, 115–124. [Google Scholar]
- Hao, S.; Yang, J.; Ma, X.; Zhao, Y. Reliability modeling for mutually dependent competing failure processes due to degradation and random shocks. Applied Mathematical Modelling 2017, 51, 232–249. [Google Scholar] [CrossRef]
- Rafiee, K.; Feng, Q.; Coit, D.W. Reliability modeling for multiple dependent competing failure processes with changing degradation rate. IIE Transactions. 2013.
- Jiang, L.; Feng, Q.; Coit, D.W. Reliability and maintenance modeling for dependent competing failure processes with shifting failure thresholds. Reliability, IEEE Transactions on 2012, 61, 932–948. [Google Scholar] [CrossRef]
- Zhang, X.; Shang, J.; Chen, X.; Zhang, C.; Wang, Y. Statistical inference of accelerated life testing with dependent competing failures based on copula theory. IEEE Transactions on Reliability 2014, 63, 764–780. [Google Scholar] [CrossRef]
- Liu, Z.; Ma, X.; Yang, J.; Zhao, Y. Reliability modeling for systems with multiple degradation processes using inverse gaussian process and copulas. Mathematical Problems in Engineering 2014, 2014, 1–10. [Google Scholar] [CrossRef]
- Wenjian, Pham, & Hoang. Reliability modeling of multi-state degraded systems with multi-competing failures and random shocks. IEEE Transactions on Reliability. 2005.
- An, Z.; Sun, D. Reliability modeling for systems subject to multiple dependent competing failure processes with shock loads above a certain level. Reliability Engineering & System Safety 2017, 157, 129–138. [Google Scholar]
- C. Joseph Lu, & William, O. Meeker. Using degradation measures to estimate a time-to-failure distribution.
- Huang, W.; Askin, R.G. Reliability analysis of electronic devices with multiple competing failure modes involving performance aging degradation. Quality and Reliability Engineering International 2003, 19, 241–254. [Google Scholar] [CrossRef]
- Guan, Q.; Tang, Y.; Xu, A. Objective bayesian analysis accelerated degradation test based on wiener process models. Applied Mathematical Modelling 2016, 40, 2743–2755. [Google Scholar] [CrossRef]
- Pan, Z.; Balakrishnan, N. Reliability modeling of degradation of products with multiple performance characteristics based on gamma processes. Reliability Engineering & System Safety 2011, 96, 949–957. [Google Scholar]
- Oumouni, M.; Schoefs, F.; Castanier, B. Modeling time and spatial variability of degradation through gamma processes for structural reliability assessment. Structural Safety 2018, 76, 162–173. [Google Scholar] [CrossRef]
- Ye, Z.S.; Tang, L.C.; Xu, H.Y. A distribution-based systems reliability model under extreme shocks and natural degradation. IEEE Transactions on Reliability 2011, 6, 246–256. [Google Scholar] [CrossRef]
- Montoro-Cazorla, D.; Perez-Ocon, R. A reliability system under cumulative shocks governed by a bmap. Applied Mathematical Modelling 2015, 39, 7620–7629. [Google Scholar] [CrossRef]
- Serkan, & Eryilmaz. δ-shock model based on polya process and its optimal replacement policy. European Journal of Operational Research. 2017.
- Pulcini, & G. A model-driven approach for the failure data analysis of multiple repairable systems without information on individual sequences. IEEE Transactions on Reliability 2013, 62, 700–713.
- Ye, Z.S.; Shen, Y.; Xie, M. Degradation-based burn-in with preventive maintenance. European Journal of Operational Research 2012, 221, 360–367. [Google Scholar] [CrossRef]
- Richards, D. An introduction to copulas (2nd ed.). Journal of the American statistical association 2010, 105, 445. [Google Scholar]
- Tanner, D.M.; Dugger, M.T. Wear mechanisms in a reliability methodology (invited). Proceedings of SPIE - The International Society for Optical Engineering 2003, 4980, 22–40. [Google Scholar]
- Peng, H.; Feng, Q.; Coit, D.W. Reliability and maintenance modeling for systems subject to multiple dependent competing failure processes. Iie Transactions 2010, 43, 12–22. [Google Scholar] [CrossRef]
|
Disclaimer/Publisher’s Note: The statements, opinions and data contained in all publications are solely those of the individual author(s) and contributor(s) and not of MDPI and/or the editor(s). MDPI and/or the editor(s) disclaim responsibility for any injury to people or property resulting from any ideas, methods, instructions or products referred to in the content. |
© 2023 by the authors. Licensee MDPI, Basel, Switzerland. This article is an open access article distributed under the terms and conditions of the Creative Commons Attribution (CC BY) license (http://creativecommons.org/licenses/by/4.0/).
