1. Introduction
The volatility of the global energy market and recent price-hikes by energy producers have caused never-before-seen levels of profit for the energy companies, and untold pressures for businesses and the population in most developed economies. Numerous countries are on the brink of recession across geographical Europe at the time of writing, and energy price increases have made a strong case for the urgent need to achieve greater energy independence. This could be considered one of the foremost important contemporary endeavours. The iron and steel industry, along with heavy industry and petroleum refineries1, are by far the largest emitters of CO
2 emissions, due to their high energy demand. The steel industry is accounting for between 7% and 11% [
1,
2,
3,
4,
5,
6,
7] of global CO
2 emissions as a result of steelmaking, and China is responsible for 50% of these GHGs [
7], due to their heavy reliance on coal. The increased use of coal in energy generation, due to imposed oil and gas shortages, was found to be the main factor [
1,
8] driving up global energy-related anthropogenic CO
2 emissions by over 2 billion tonnes, their largest ever rise in absolute terms.
2. Materials and Methods
Throughout this project, global data in connection with renewable energy technology implementation in different settings has been utilised [
9,
10,
11,
12,
13,
14]. Information on factual CO
2 emissions in steel production [
15] and manufacturing [
16,
17,
18] have been considered, as well as data from other industrial sectors [
4,
9,
19,
20,
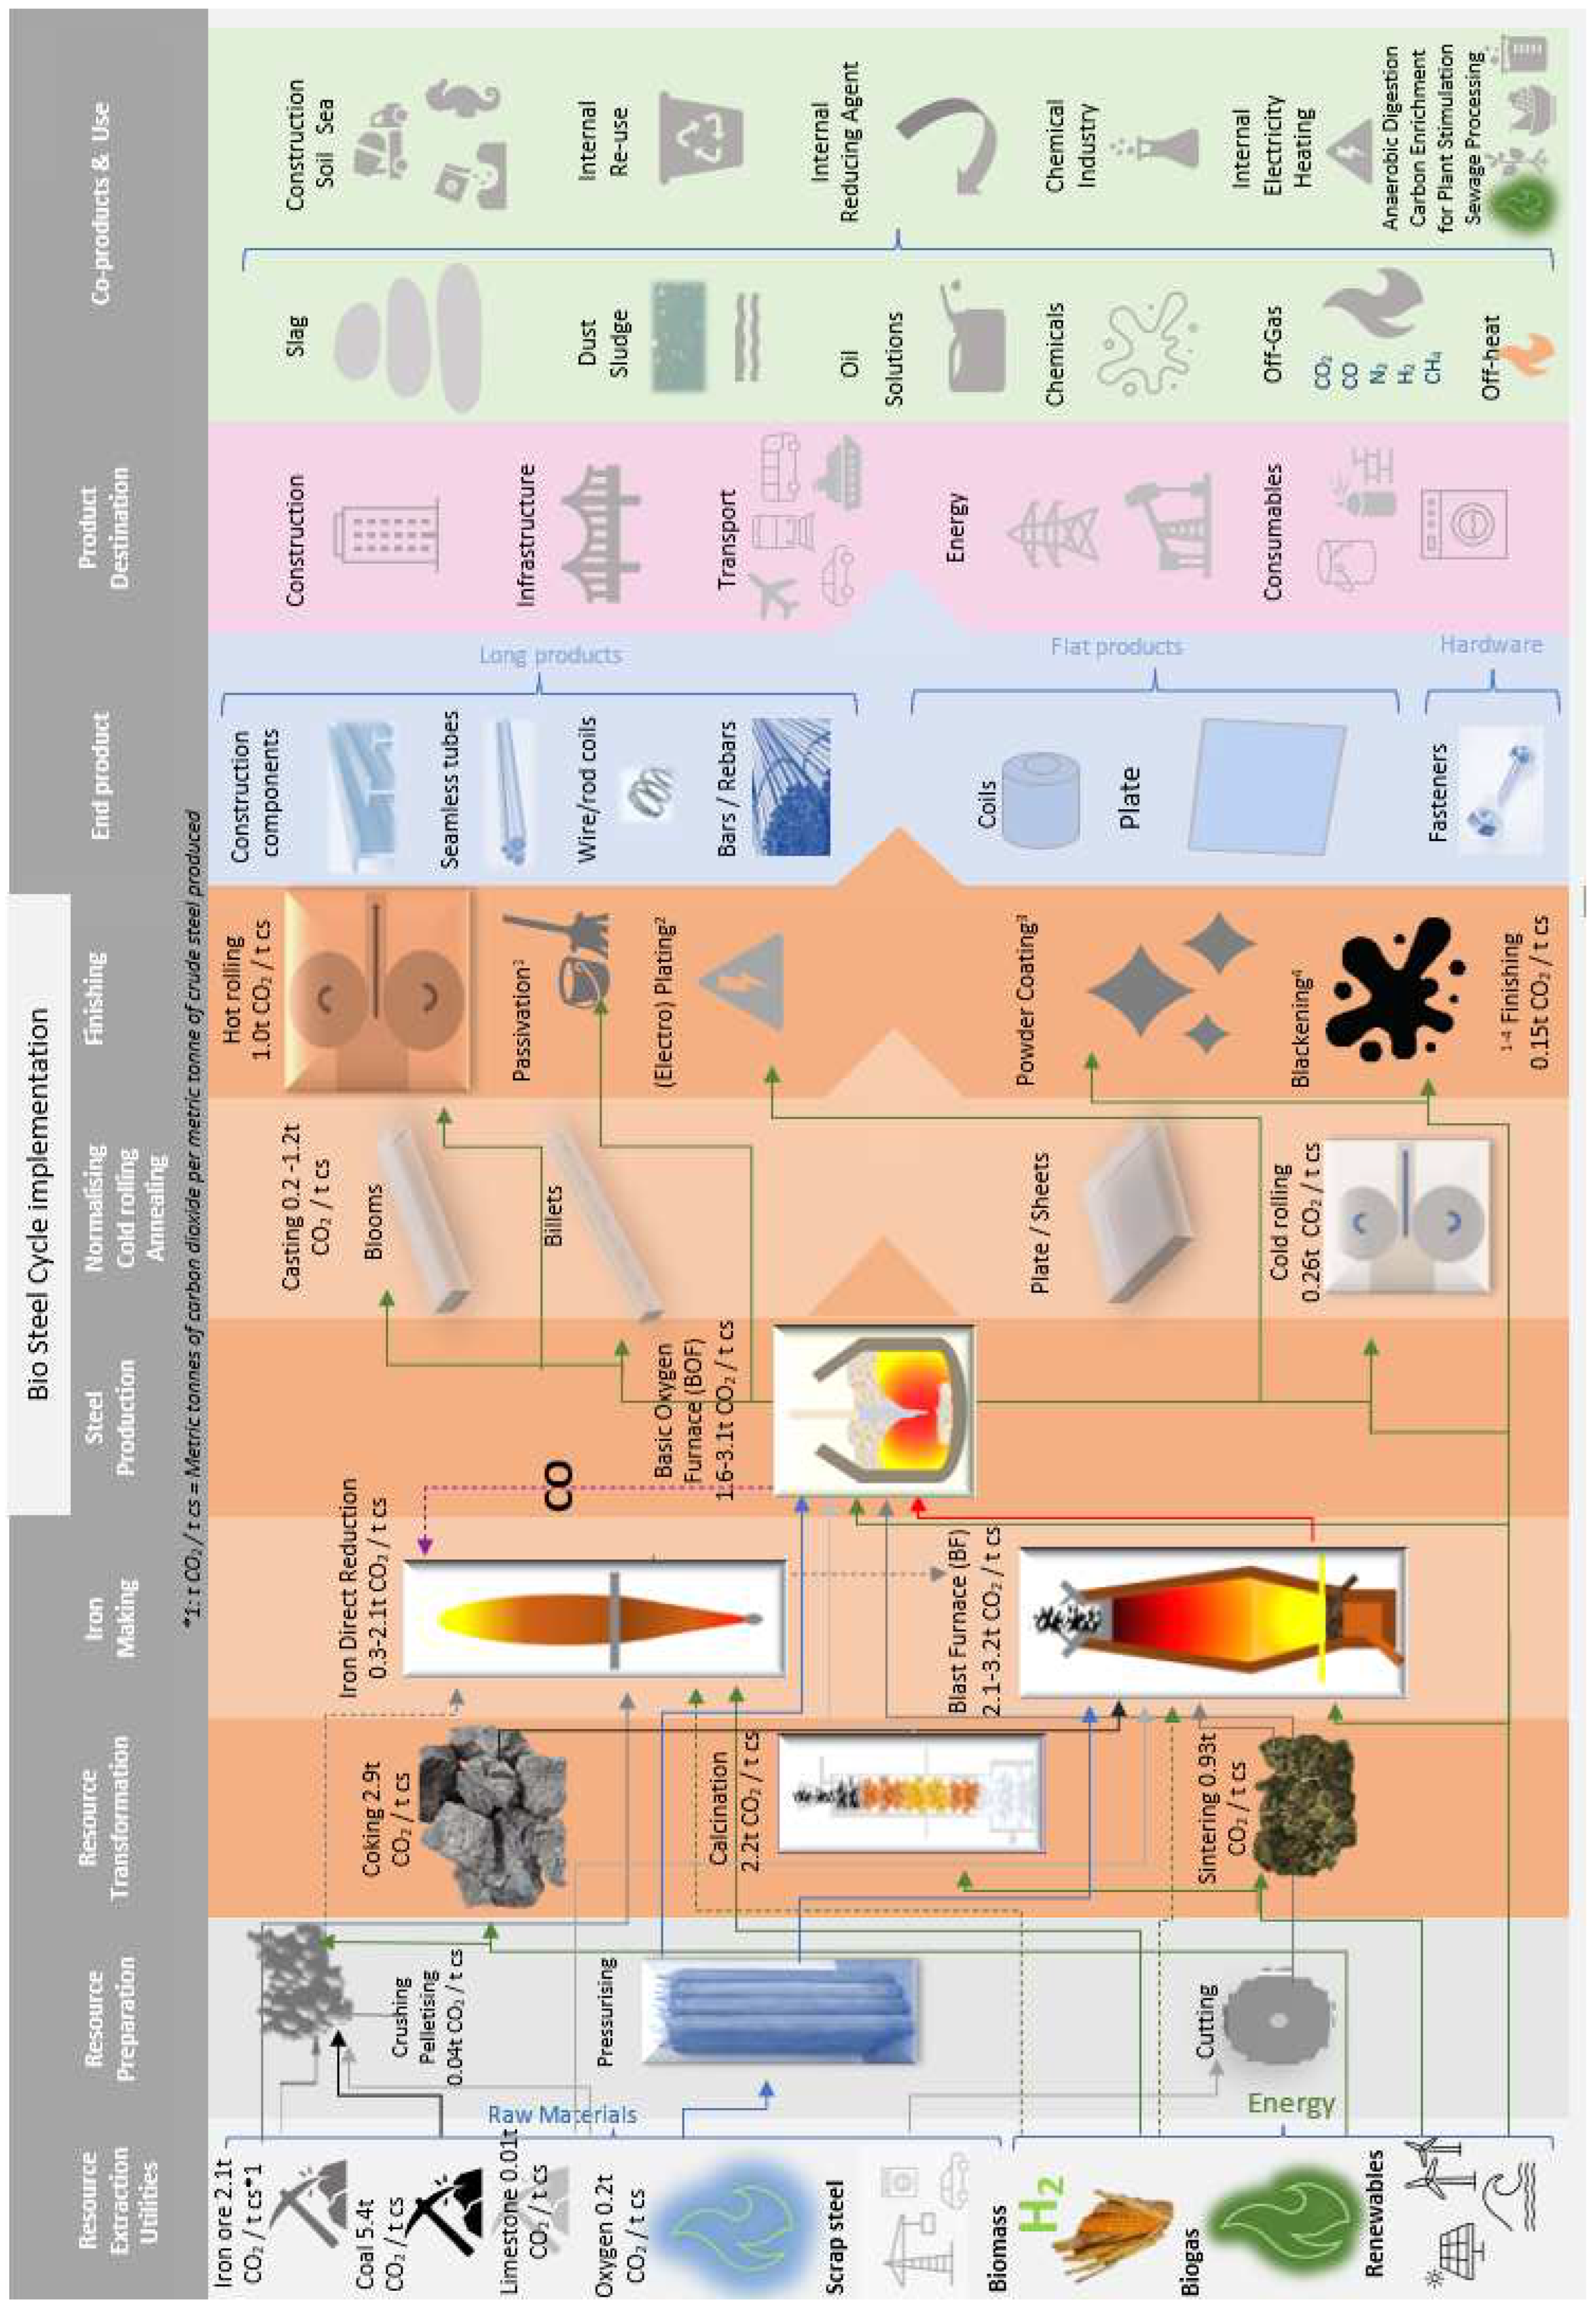
21]. In order to visualise the opportunities of a circular steel production process, implementation of sustainable elements and opportunities for achieving great energy independence, a comprehensive steel manufacturing overview has been compiled, as displayed in
Figure 1. The data was accumulated, analysed and used for modelling using MS Excel and simultaneously analysed by applying standard mathematical principles and followed for proof of concept with steel production simulations in Simul8, Inosim and Aspen.
‘The 7 Steps to Net-Zero CO
2 Emissions Steel Production’ [
15] strategy can be seen as a strategic guidance paper for the decarbonisation of steelmaking. Simultaneously, the BiSC [
15] implementation will likely achieve a higher degree of energy independence, in the short-term. It could be achieved in seven easy-to-follow steps, even if only some sections of the following are being applied:
Step 1: Switching to a 100% green energy provider
Step 2: Installing renewable energy technologies
Step 3: Replacing coal and coke with biomass (biochar)
Step 4: Installation of carbon capture flue stack filters
Step 5: Utilisation of CO2 in food and building projects
Step 6: Further process improvement in steel manufacturing
Step 7: Implementation of AD>biogas>green hydrogen
Conventional energy use and renewable energy component implementation points have been incorporated for highlighting the simplicity of achieving a higher degree of energy independence, whilst simultaneously decarbonising the steelmaking process.
As displayed in
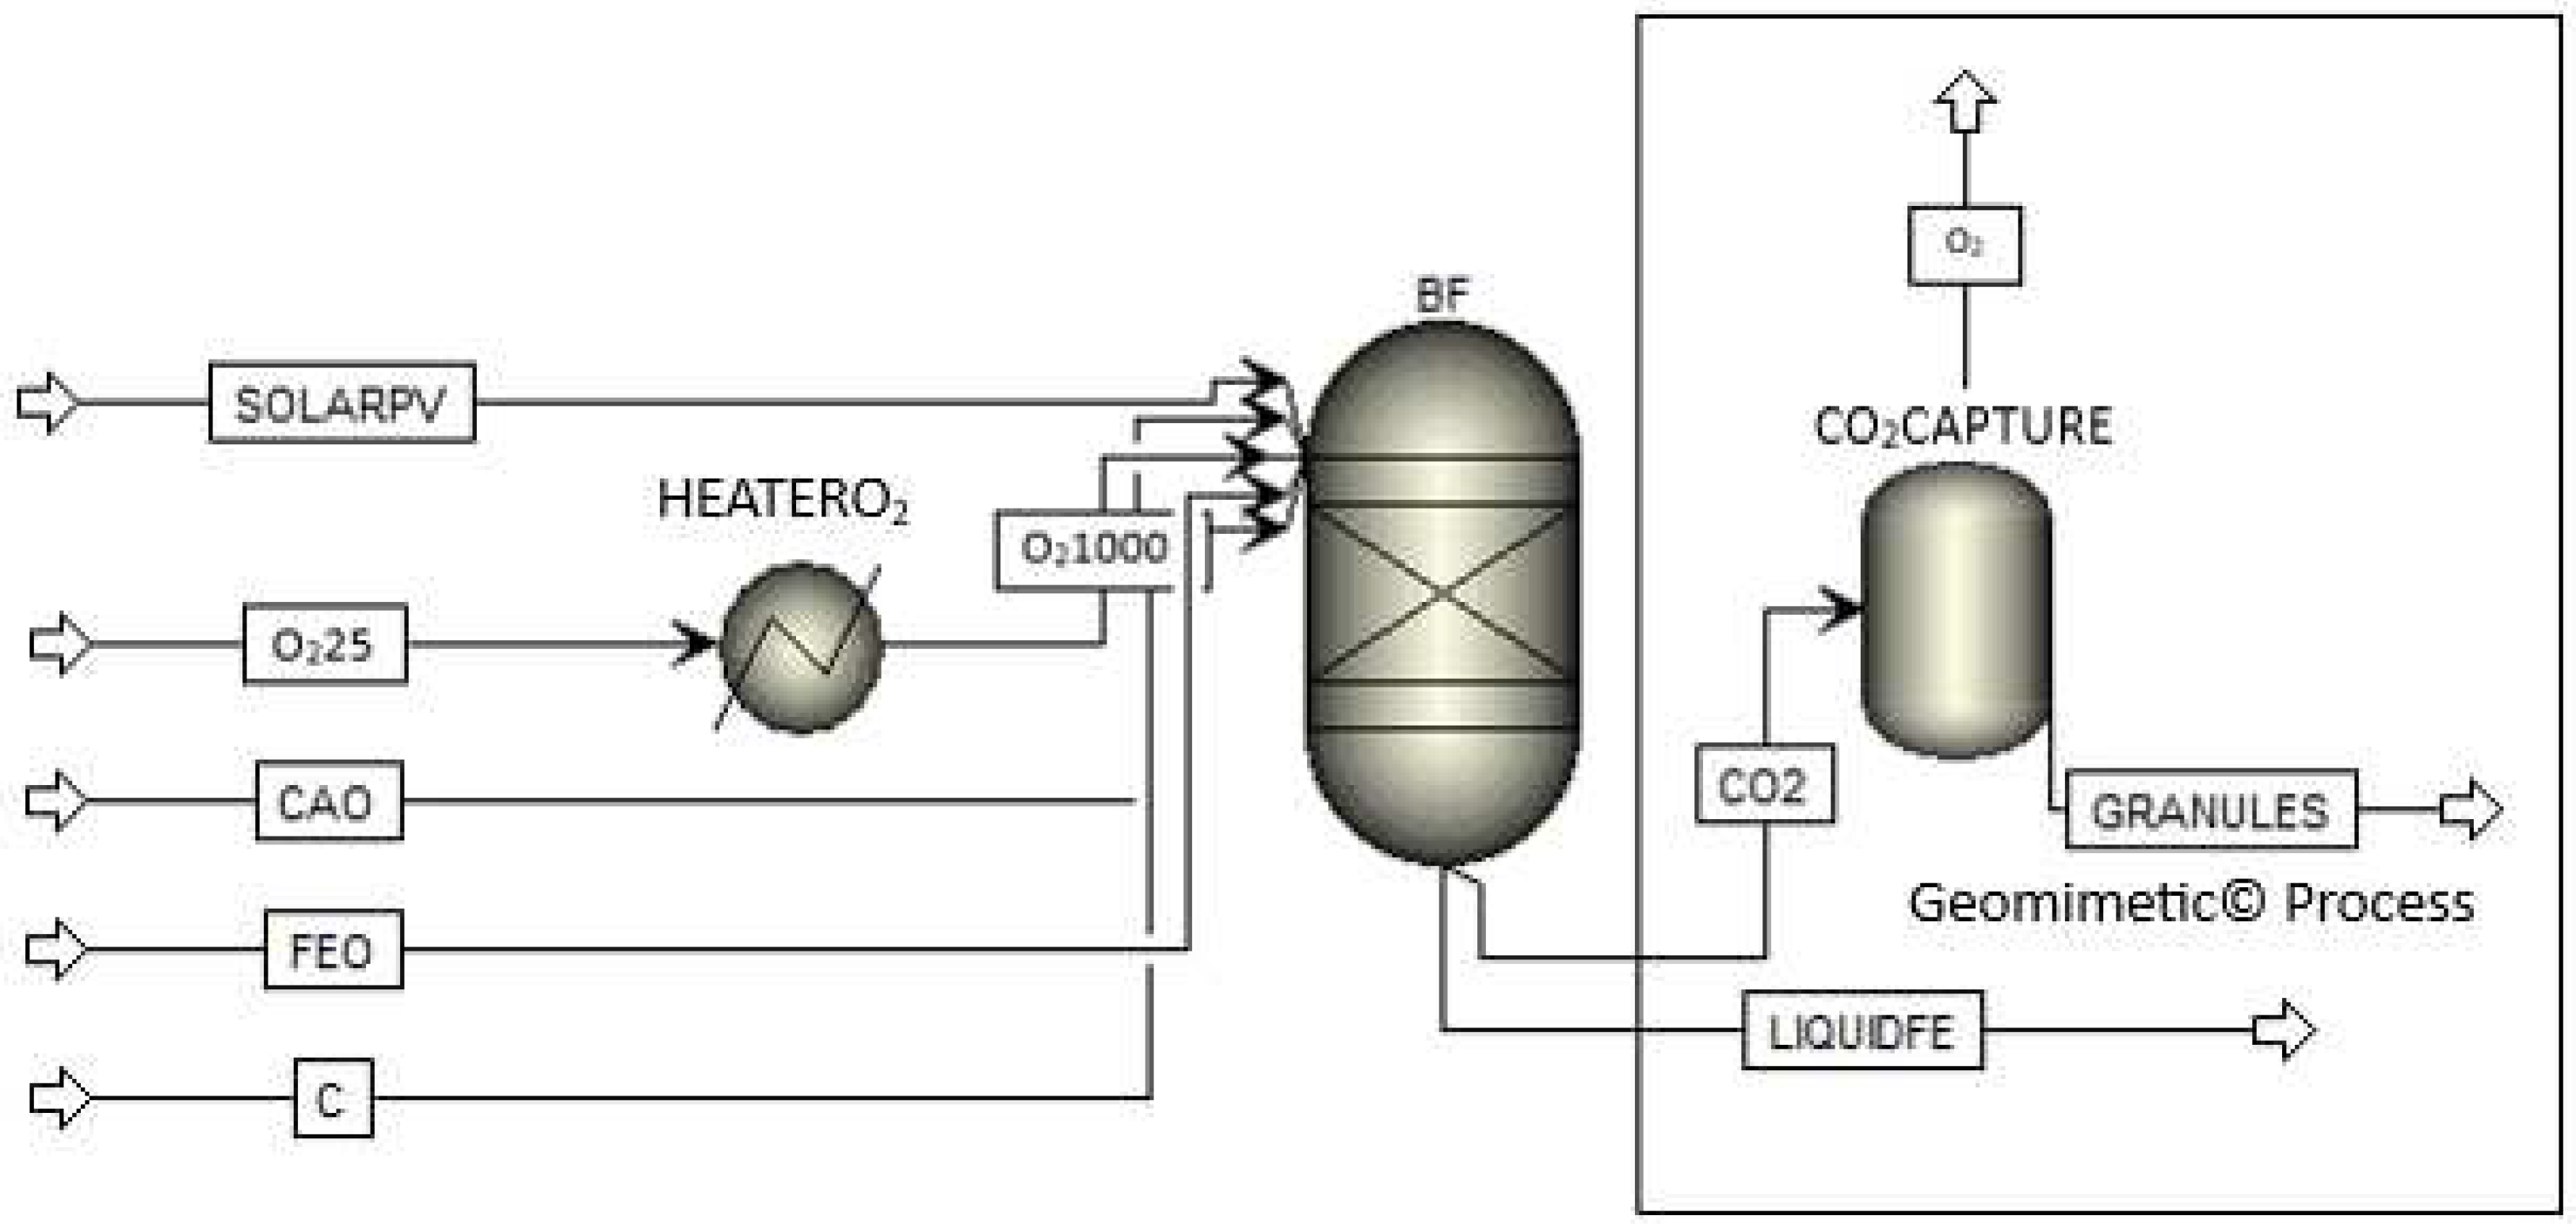
Figure 1, the same principle applies to the steel (
Figure 2), in the BF with CCUS unit in the Aspen configuration production process, as far as off-heat is concerned. It was established that a total potential of 425PJ (1 PJ (Petajoule) = 31.6 million m³ of natural gas or 278 million kilowatt hours of electricity) of excess heat is readily available at a 95°C temperature, and 960PJ at approximately 25°C [
22]. This amount is thought to represent between 4% and 9% of the total industrial final energy demand. Capturing this excess heat means utilising energy potential we have already used in industry, thus reducing the amount of energy to be produced by the same amount. The benefits for agri-businesses utilising off-heat from production and CO
2 in carbon enrichment for plant stimulation are the subject of ongoing research [
22]. Process simulations in Simul8, INOSIM and Aspen+ (BF,
Figure 2) were used to explain the individual production process implications. The BF/BOF route is the most widespread method of steelmaking, representing ~70% of current global crude steel production [
23]. It needs to be emphasised, though, that the displayed CO
2 emissions in metric tonnes are representing the CO
2 emissions at their respective stage, per t of product, and not per tonne of steel. The emissions burden on each of the input streams in the simulation software systems Simul8, and Aspen are already set within the system parameters and therefore calculated during the process simulations, and are providing a more detailed set of data, per metric tonne of respective product produced. Additionally, in order to represent the overall mean CO
2 emissions burden in t per t of steel, the mean value of 4.95t CO
2/t cs was allocated for entering in the input stream in S8 as BF 2.95t of CO
2 per metric tonne of liquid iron produced and BOF 2t/t of CO
2 per metric tonne of steel produced.
The BF-EAF-process-route simulation, representing the second most-common method of steelmaking, has a share of ca. 20% of global steel production. Initially, and as biomass [
21,61] has the potential to reduce CO
2 emissions by ~30%, the usage of biomass was implemented [
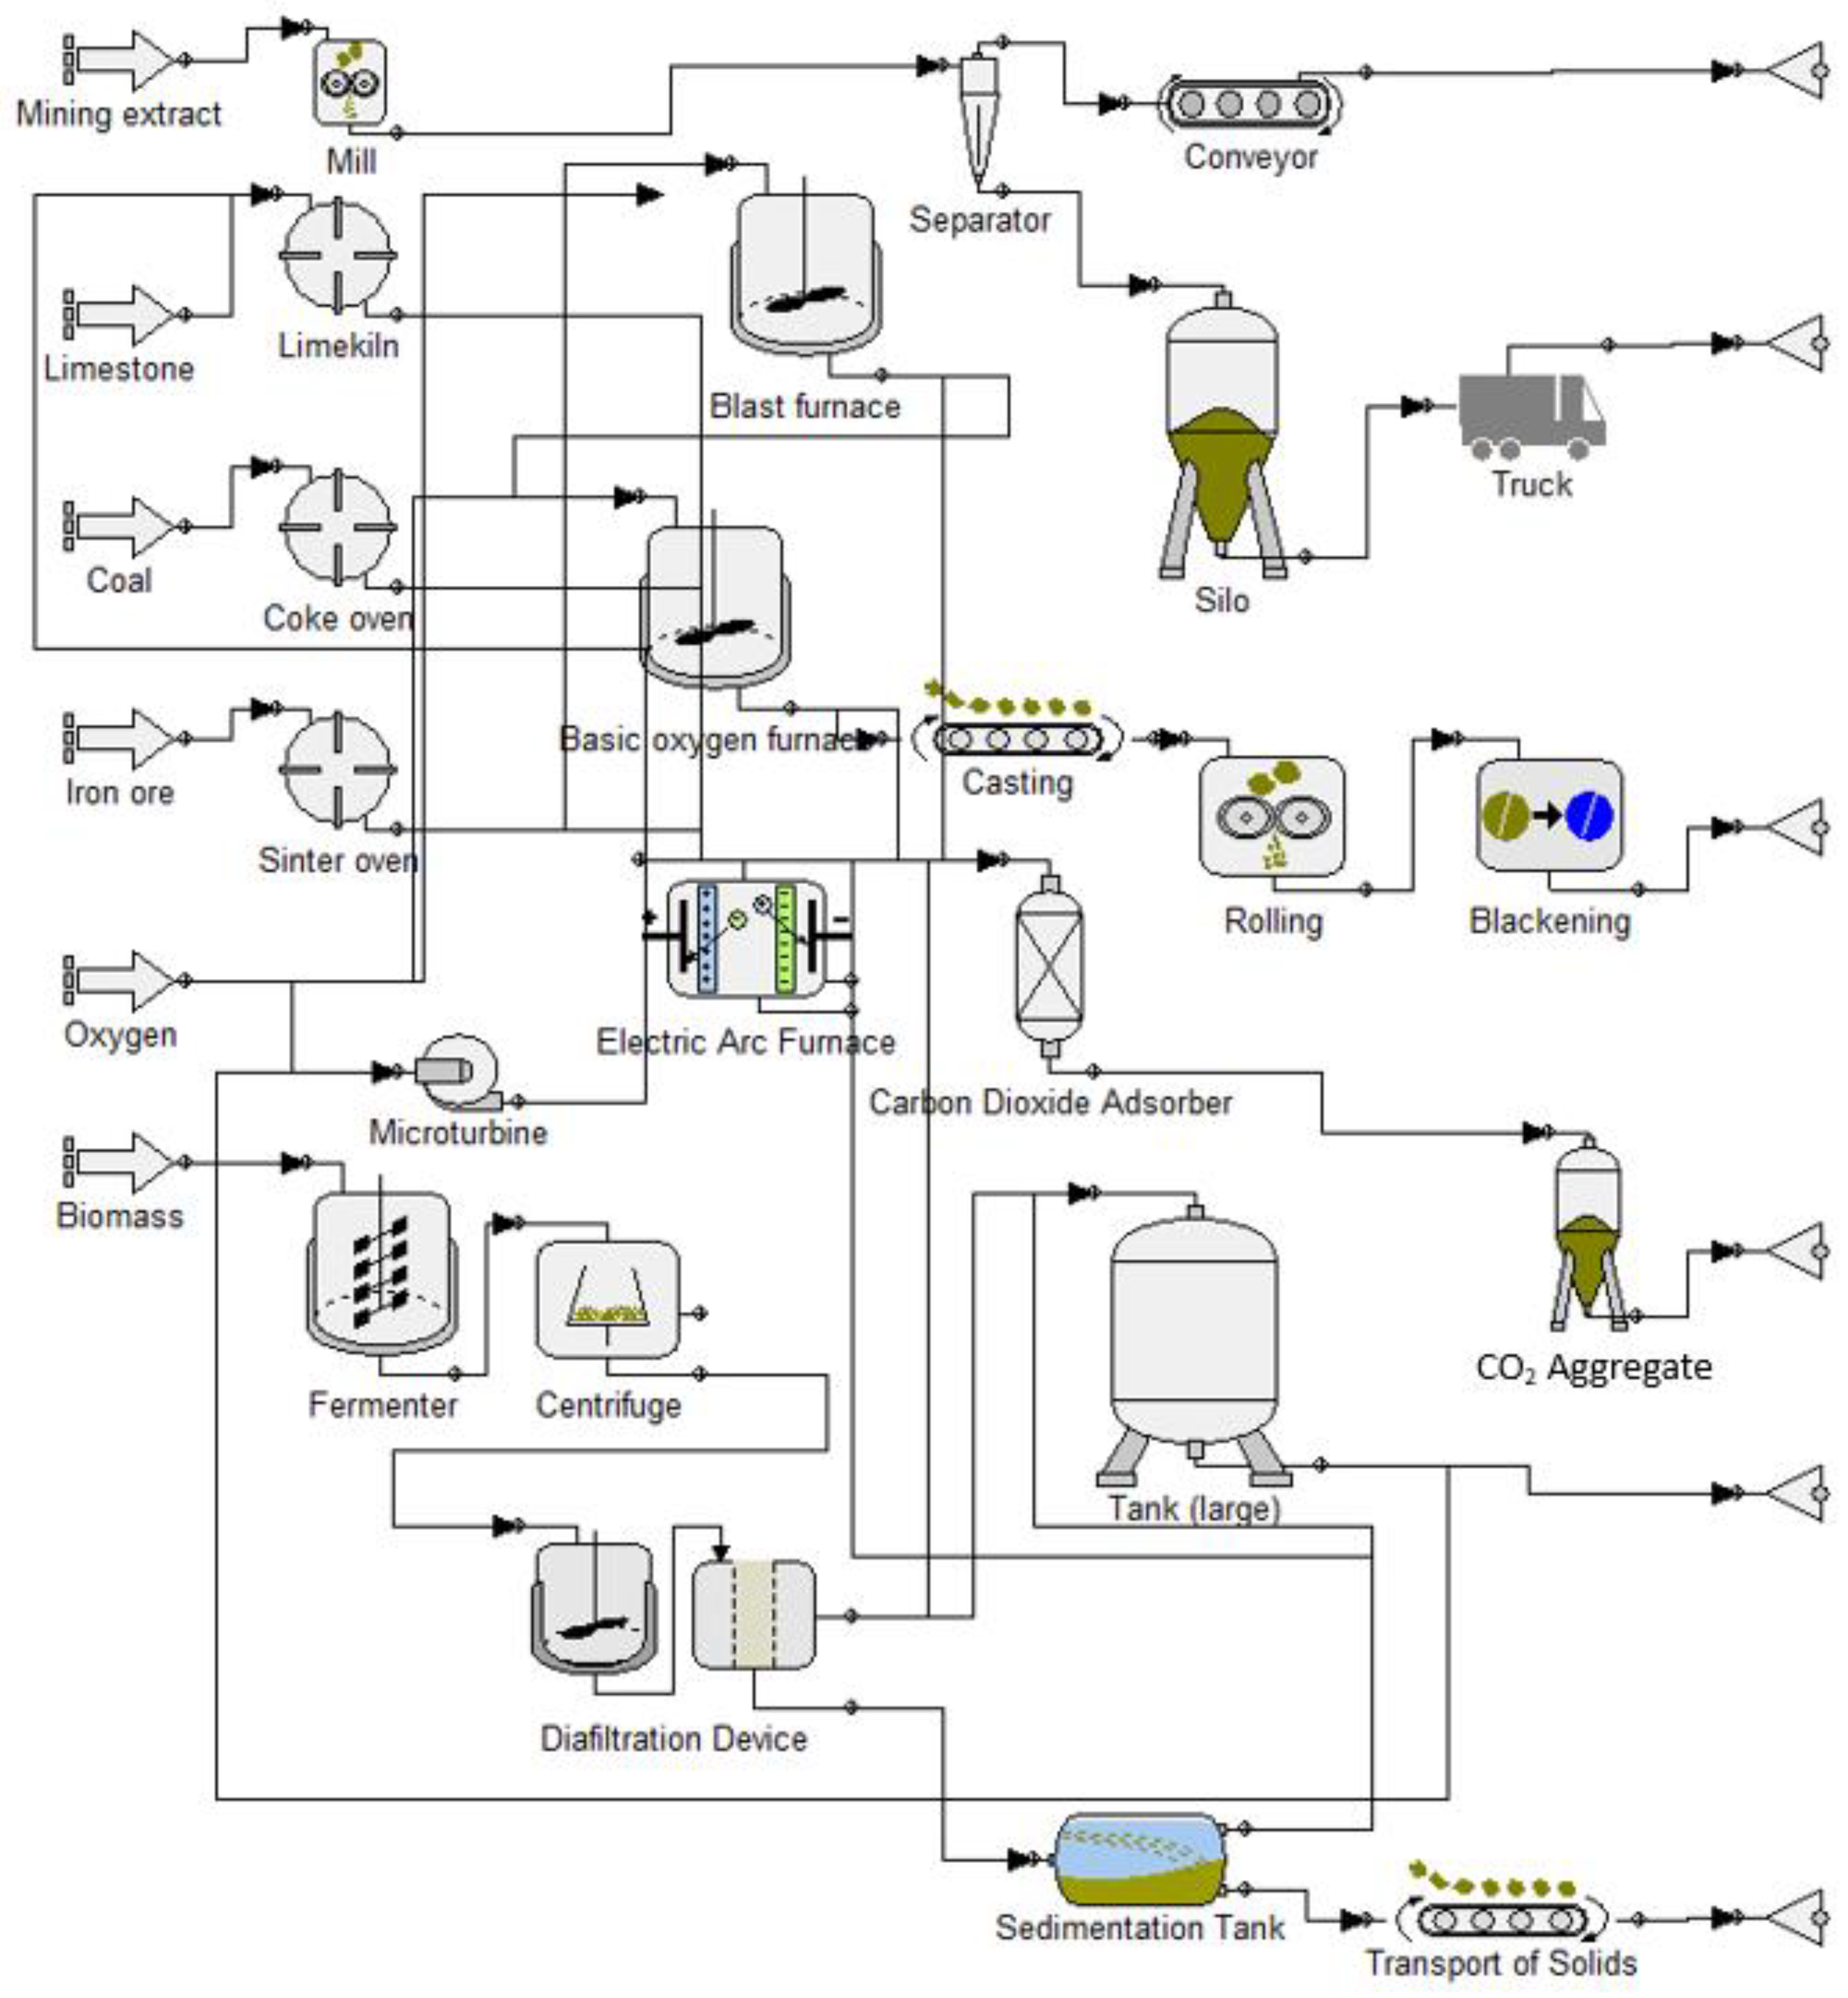
21,61] and filters as well as CCUS units installed (
Figure 2 and
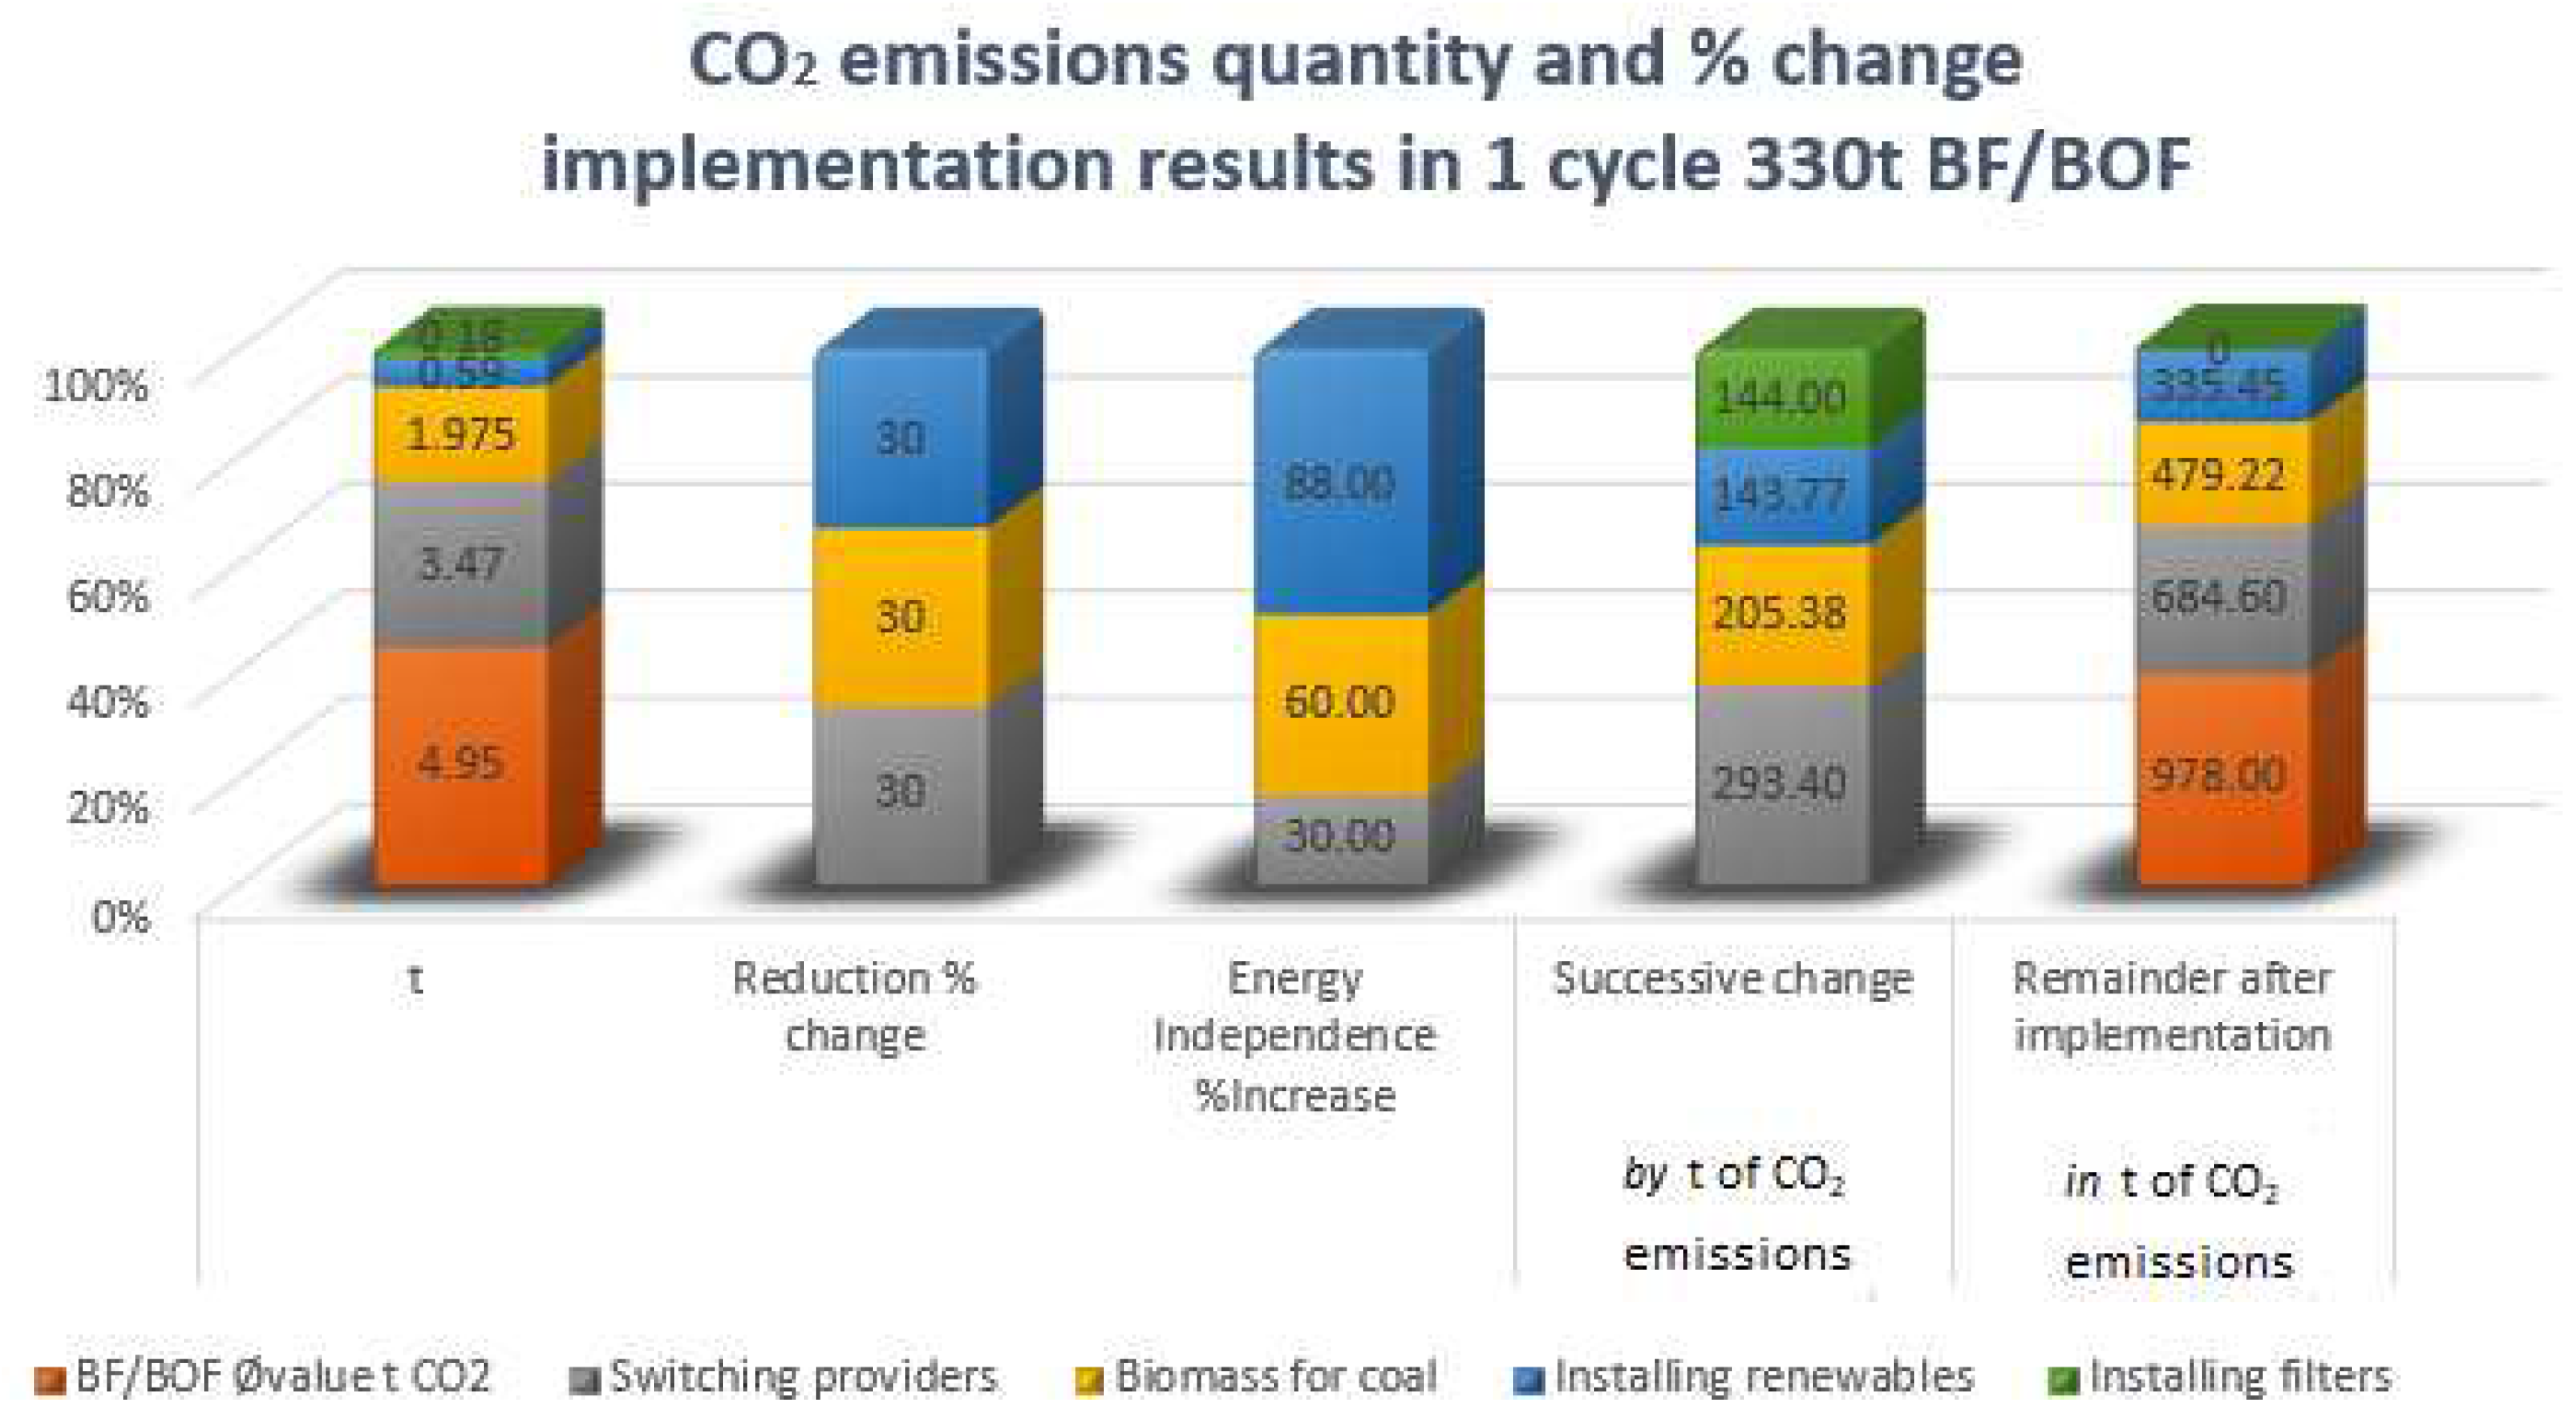
Figure 3), in direct comparison with the MS Excel modelling, and mathematical calculations. The calculations are set to work for a 330t blast furnace, similar to the British Steel site in Scunthorpe, and for the operational year of 1 hr, to reflect the 40-minute average charge processing and discharge time (
Figure 4). Verifying the results of the preceding evaluations, computations and calculations, initially 977t of CO
2e flow was reported by the Aspen system analysis, without any mitigating measures.
The CO
2 reductions in relation to a 330t blast furnace vessel, modelled in comparison to the British Steel Scunthorpe site, are quite remarkable. Having implemented steps of the Bio Steel Cycle model and strategy , the %-reduction per stage in CO
2 emissions have been successively implemented and the results in percentage and tonnes are displayed in
Figure 4. A reduction of ~30%, to 684t of CO
2e flow was reported when solar PV panels for energy generation on site were installed and subsequently a carbon capture module was installed (
Figure 2).
The process simulations and carbon reports in Simul8, demonstrated the effect of implementing biomass and carbon capture technology in the steelmaking process. These simulations were followed by configurations in Aspen and Inosim, including the implementation of CCUS processes, as the implementation of this process, which includes off-gas flue stack filters, makes it possible to produce steel at almost zero CO
2 emissions – for both, the BF/BOF and BF/EAF-process-route. To corroborate the results from the MS Excel modelling, the mathematical formulation and calculations, and Simul8 process simulation by producing configurations in AspenV12.1 and INOSIM, as displayed in
Figure 3.
The simulations reports provided proof for the concept of the Bio Steel Cycle, insofar as with implementation of both, biomass and the Geomimetic process, the steel production CO
2 emissions could be reduced by 30% and to almost zero, as detailed in
Figure 4. Therefore, proving the hypothesis that it is possible to produce steel without CO
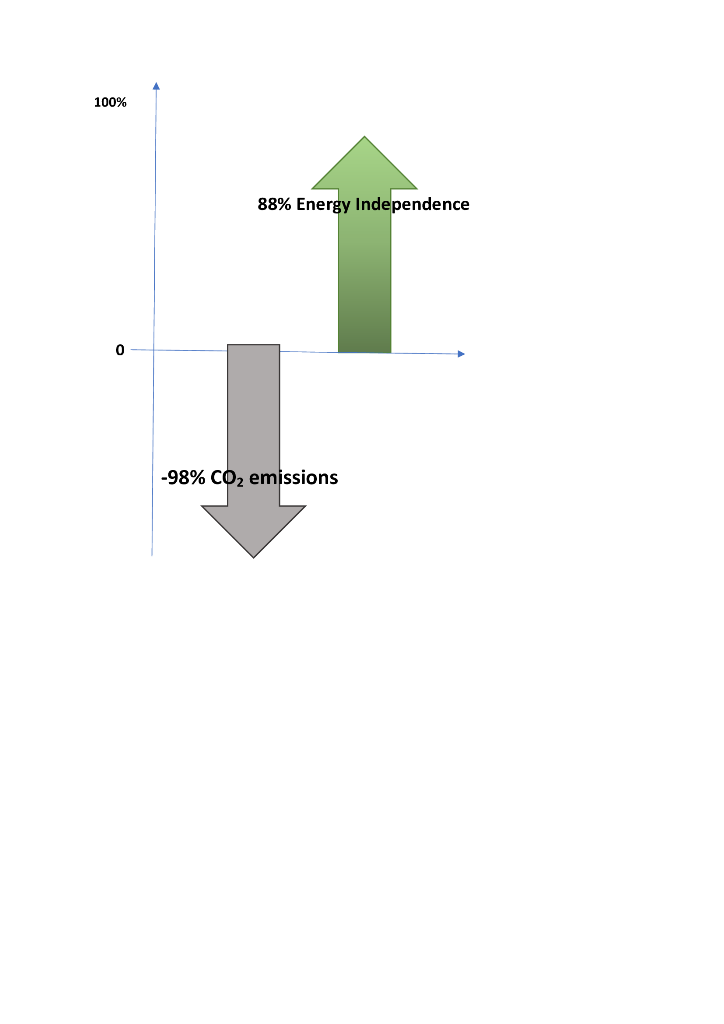
2 emissions if the novel concept and strategy was being implemented. At the same time, an up to 88% higher degree of energy to produce steel without CO
2 emissions if the novel concept and strategy was being implemented. At the same time, an up to 88% higher degree of energy independence can be achieved, when other components of the Bio Steel Cycle, including renewable energy sources, are being installed which will be further elaborated on in the following text and the summary results are shown in
Figure 4.
The simulation results are detailed in metric tonnes, occurring during one production cycle, based on 330 tonne BF and BOF furnaces.
2.1. Heat loss recovery – energy and CO2 saving protocols
Already since the 1990s, scientists were convinced [
24] that 30% of the heat energy entering any production process is: a) lost and b) could be recovered. The required technology has experienced a steep learning curve and is now commercially viable and available. Excess heat from any production or manufacturing process can be reused to supply any production site with heat and warm water, partly due to the simplicity of the technology required. The energy basis and flow have been investigated thoroughly, and an energy industry defining and telling report was produced by Moran and Sciubba (1994) [
24]. The theory of exergy analysis is based on the fact that if 100% of energy is being inserted into any energy requiring unit, the amount of 70% will be effectively used for the intended purpose, whilst 30% are being lost due to inefficiencies and deficits within the production and processing infrastructure. In this case: insulation of the heat-bearing infrastructure (pipework). Via a connected network of pipes and lines, the energy or heat can be exported to nearby agri-businesses or transferred to neighbouring homes and industries through a district energy system. Excess heat is a hidden resource of energy, and it is all around us. Utilising excess heat means enabling >95% energy efficiency. According to the International Energy Agency [
1,
5], it is apparent that energy demand is set to grow dramatically in the near future, due to population growth and rising lifestyle energy demands. Without urgent action to tackle the demand side of our lifestyle choices, and decarbonisation requirements of the climate crisis, by using energy more efficiently, we will not get on track to meet global climate goals.
Global emissions [
25] of CO
2 – including land use and fossil CO
2 – will remain relatively high at 40.5Gt CO
2 in 2022, but still below their 2019 peak of 40.9Gt CO
2. A global push for more efficient use of energy can reduce CO
2 emissions by an additional 5 gigatons per year by 2030 [
1,
8,
26,
27,
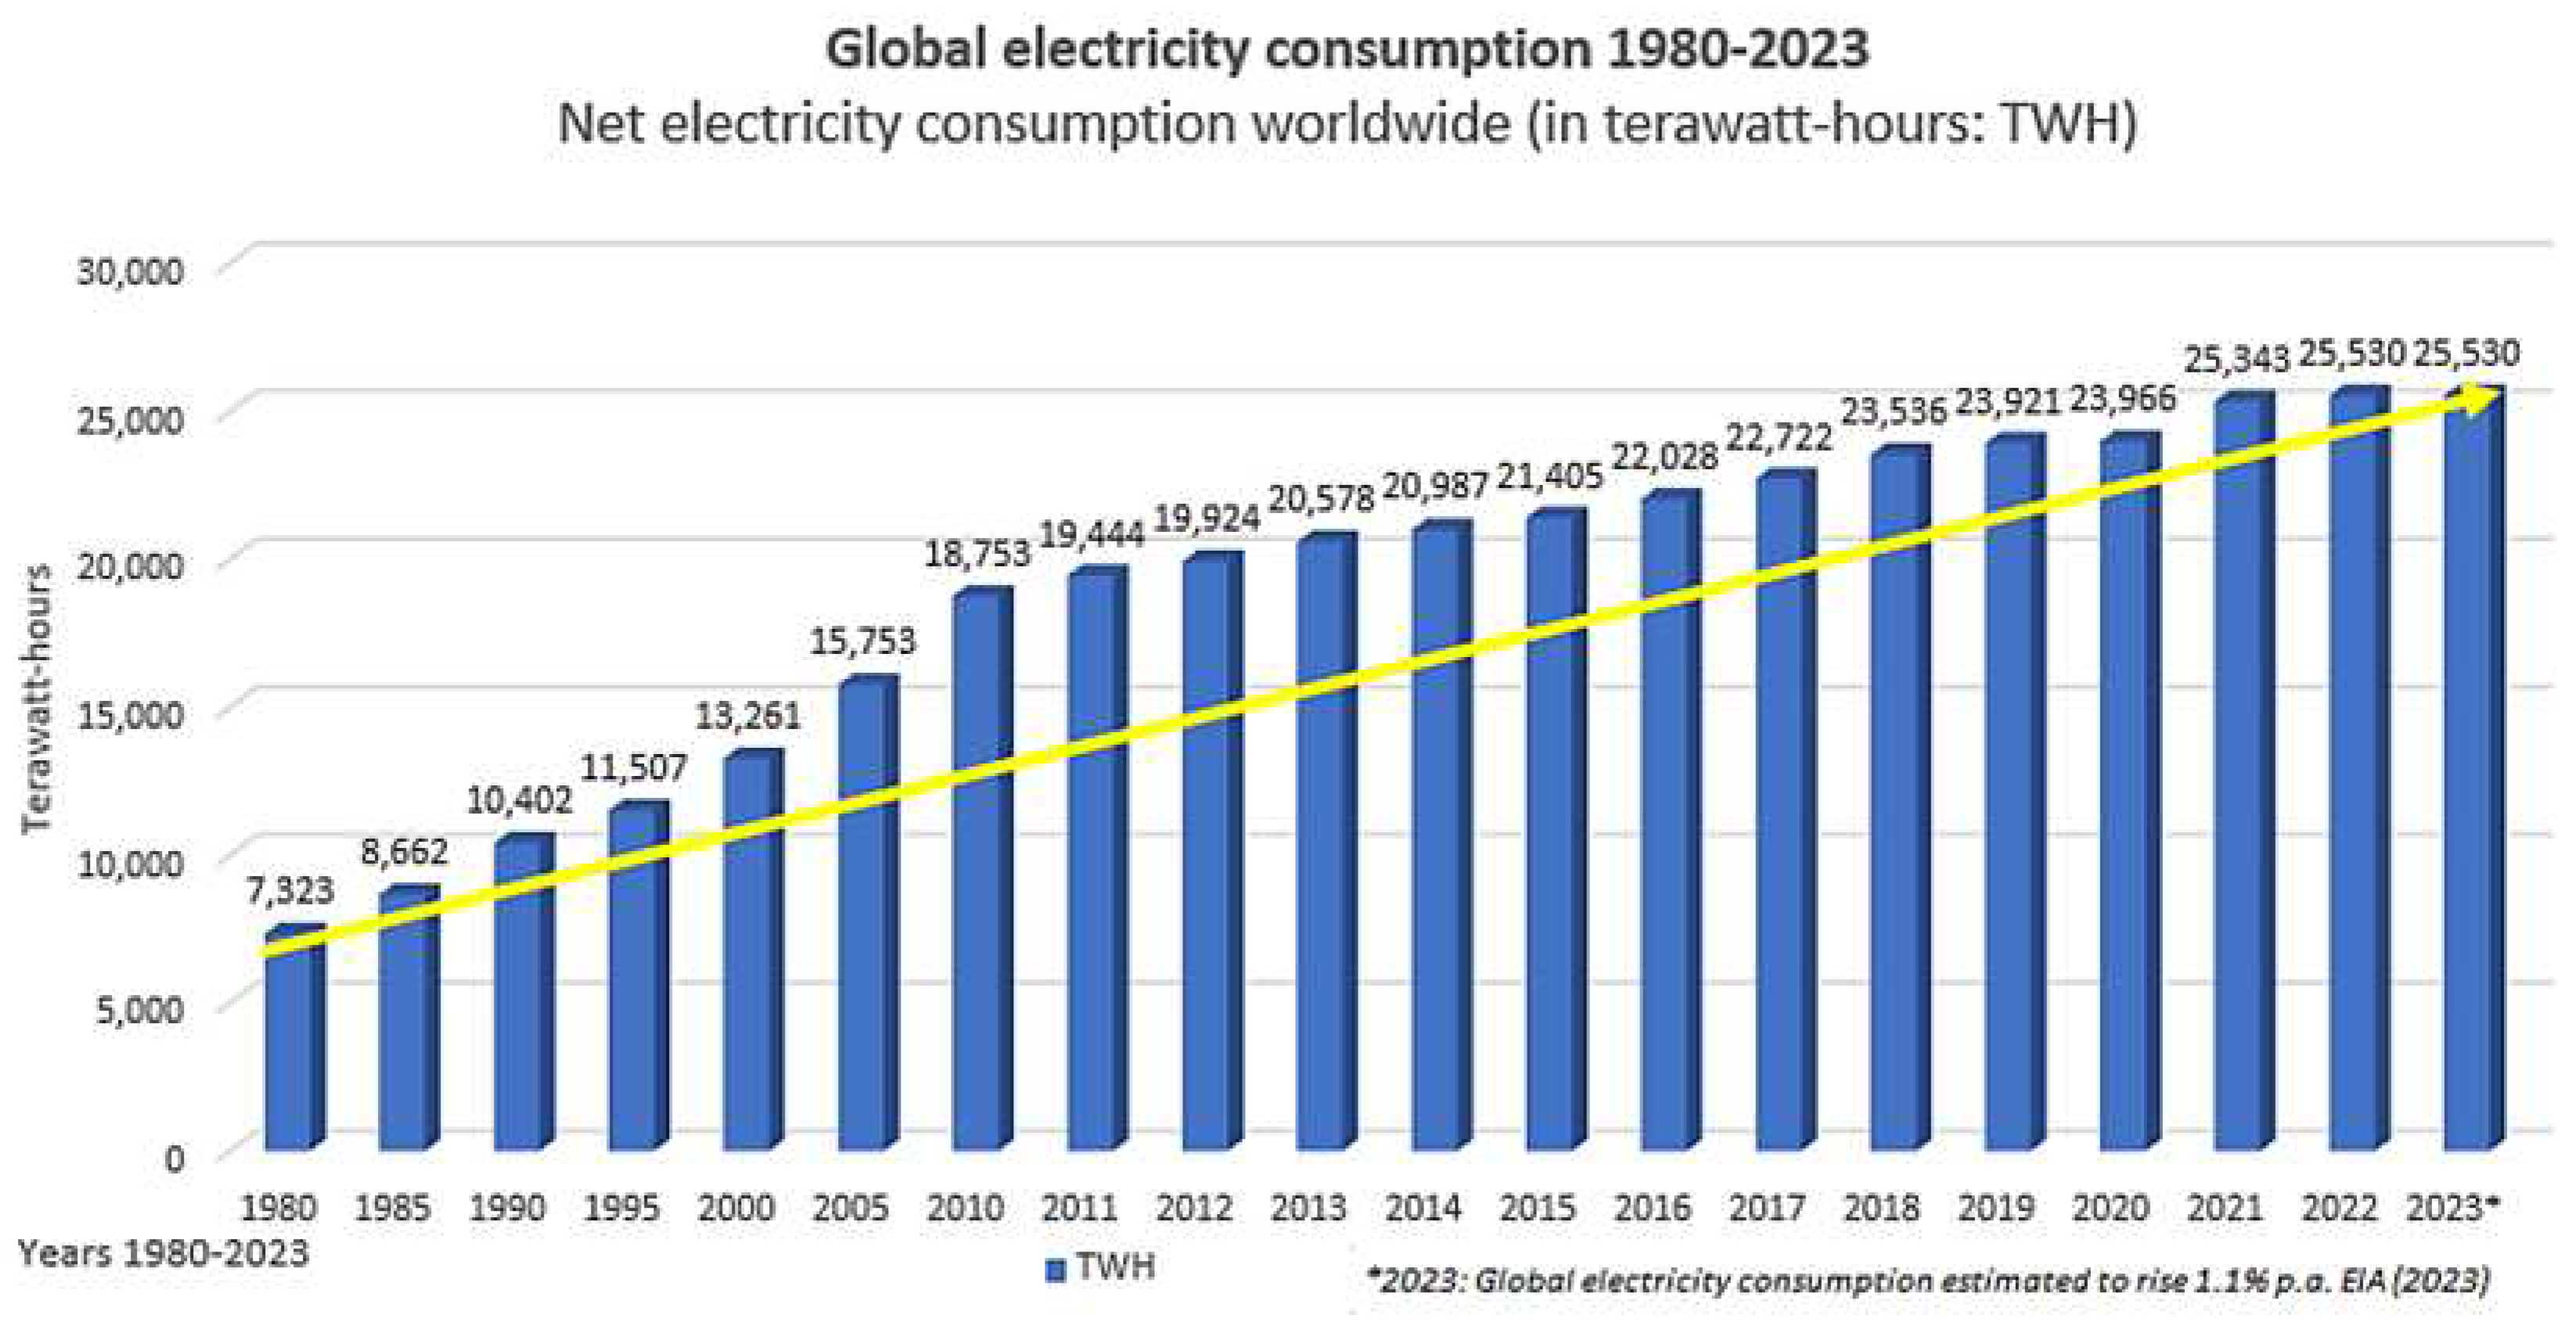
28], based on current energy demand. The global electricity consumption is displayed in the following
Figure 5. However, energy efficiency increases constitute merely 30% of the required CO
2 reduction needed to meet the Net Zero by 2050 Scenario [
1,
8,
26,
27,
28]. As far as energy security and greater energy independence are concerned, these energy savings are set to avoid having to produce almost 30 million barrels of oil - per day (three times Russia’s average annual production, based on 2021 data), and 650 billion m
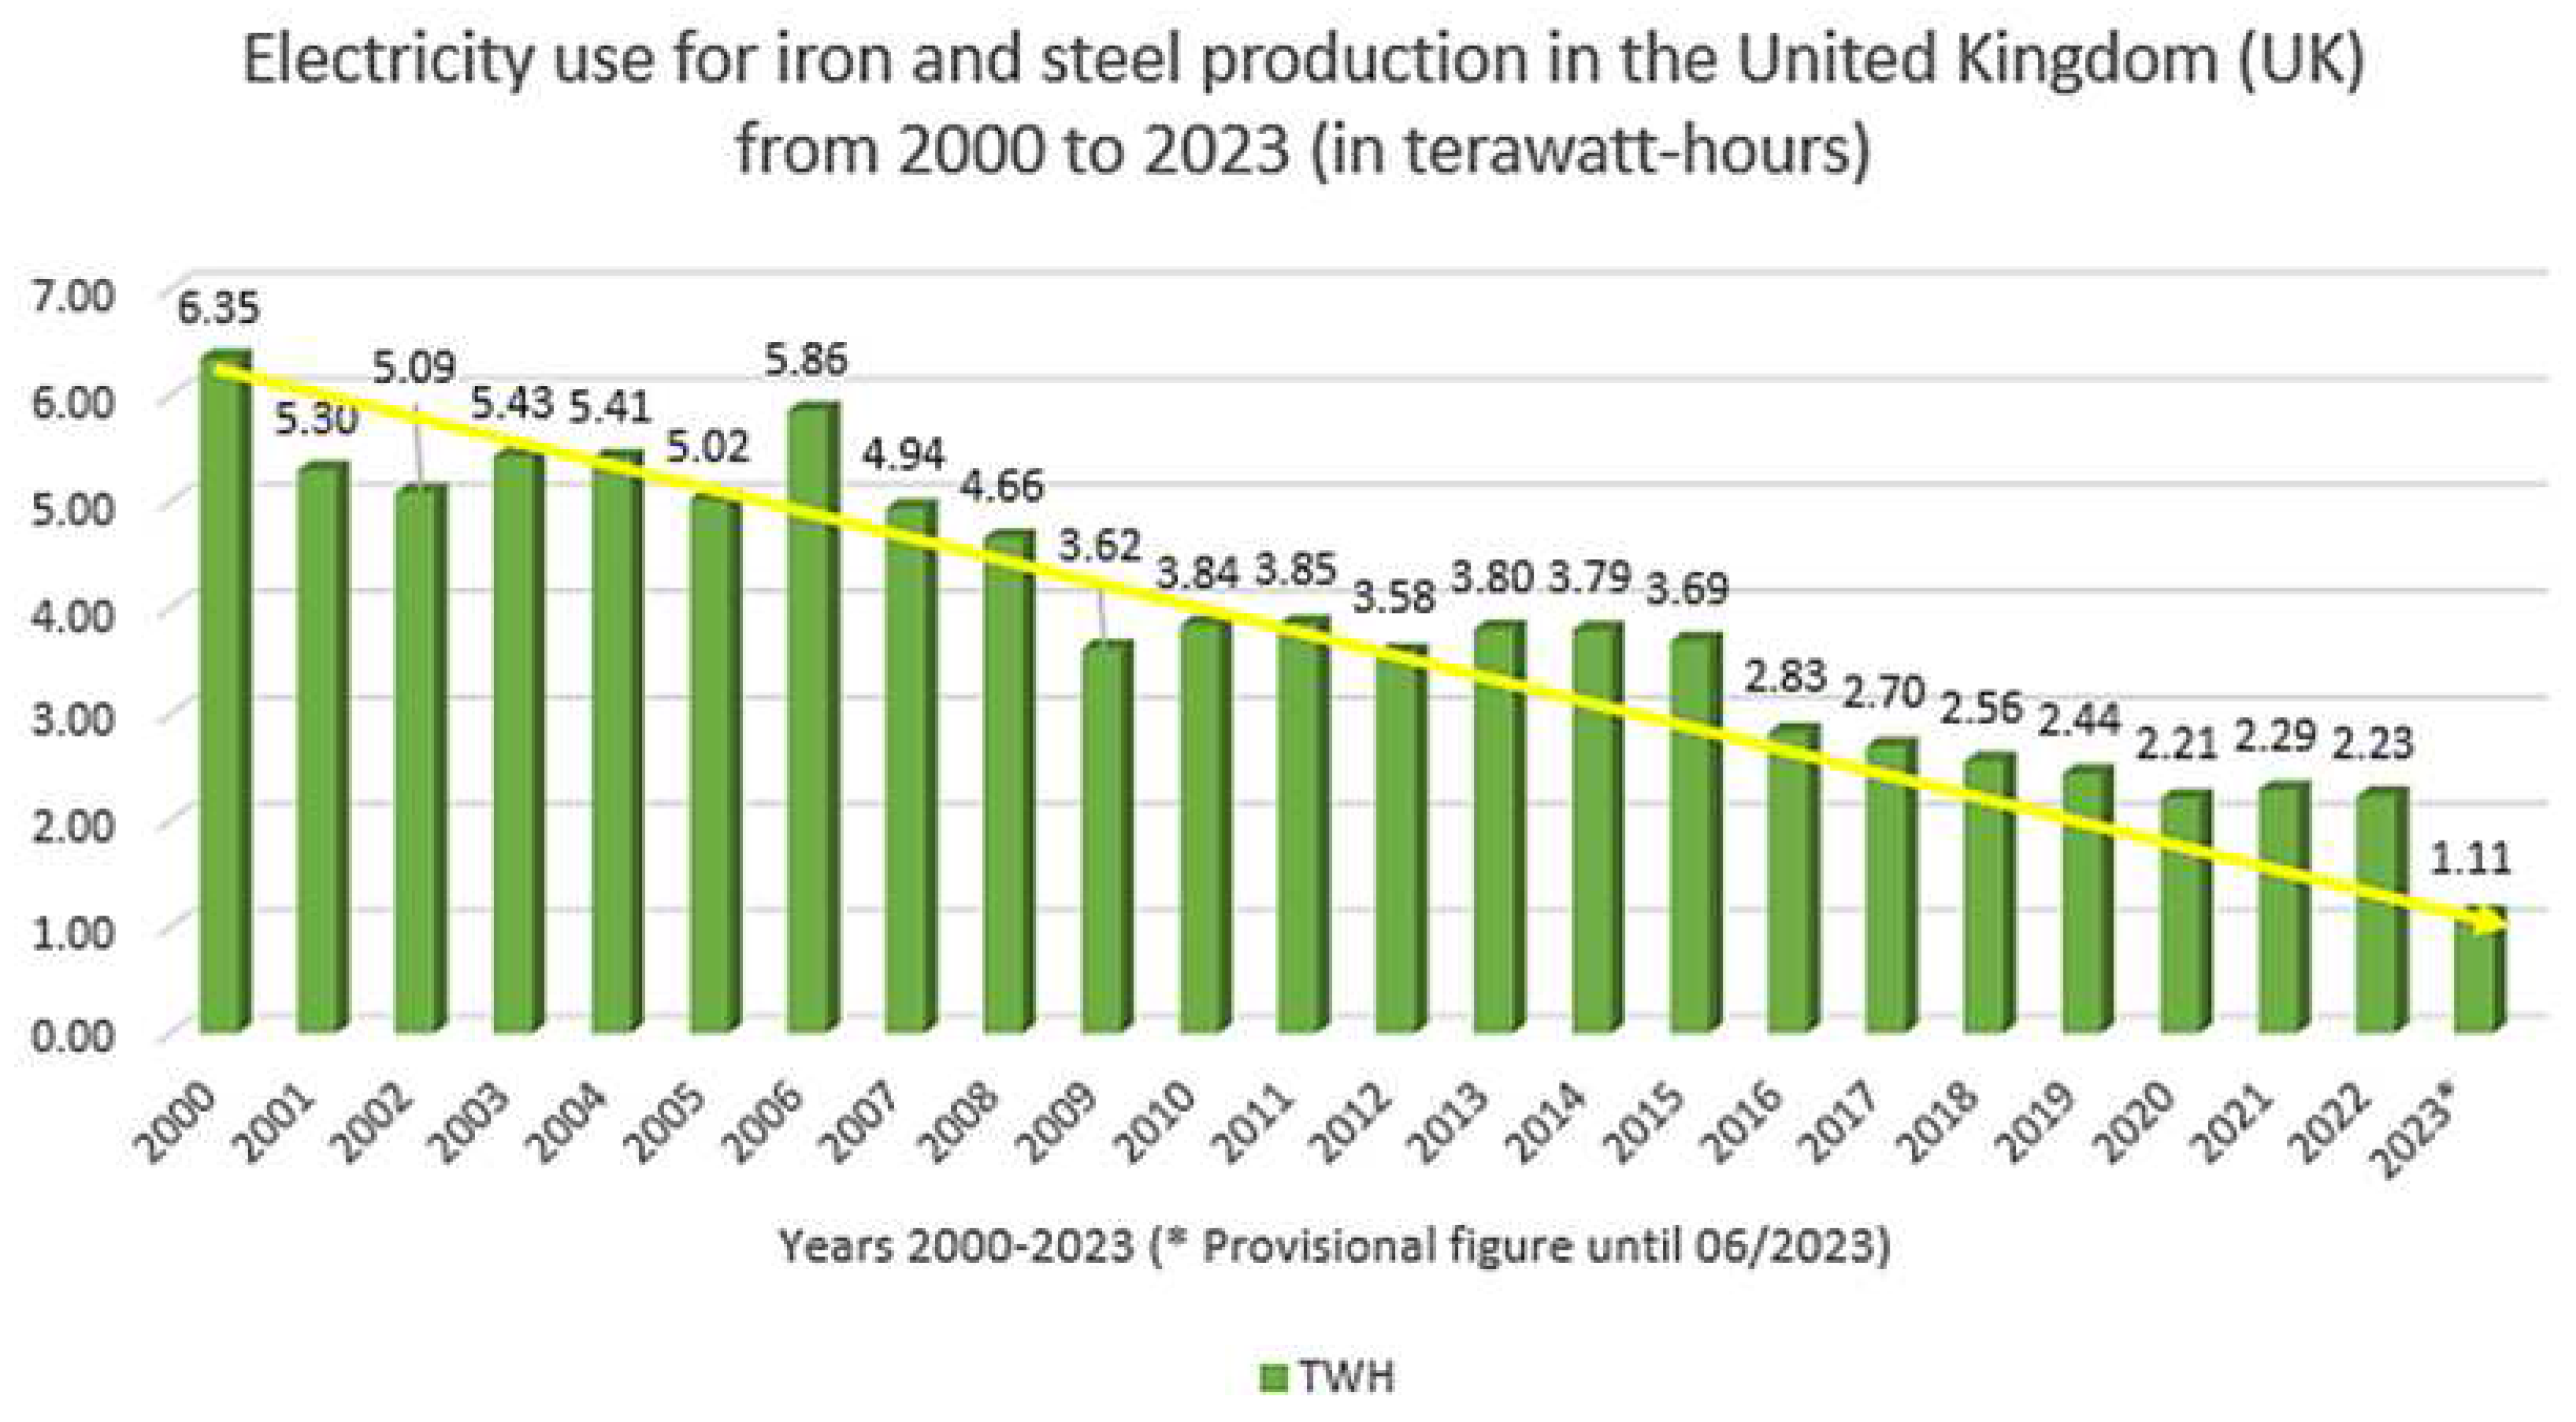
3 of natural gas per year – around four times of EU imports from Russia in 20211. Although there has been a steady decline in overall electricity consumption in the iron and steel manufacturing sector (
Figure 6), due to already implemented structural changes towards more sustainable production processes in the industry, along with the installation of energy efficiency measures, and improved energy efficiency measures [
29], there is still a substantial amount of electricity which could be saved (
Figure 5). Additionally, this would render the existing infrastructure utilisation more efficient. One of the most important factors, the required short-term solutions, is helped by using suitable existing infrastructure as it can be easily retrofitted with technology to prevent heat loss, and decarbonise production process technology at the same time.
Simultaneously, it could be utilised to a) capture >98% [
30] of CO
2 emissions, use the captured CO
2 in ancillary industries, b) installing renewable energy resources (solar, wind, hydro) in suitable locations to increase the level of energy independence. What is being produced on-site does not have to be imported from somewhere else, at fluctuating prices [
1,
8,
26]. As shown in
Figure 6, the development of electricity usage in steelmaking has been on a downward trajectory since the year 2000, partly due to process and efficiency improvements across most industries. In stark contrast, quite the opposite observation was made for global electricity consumption [
1,
8,
26] as previously demonstrated in
Figure 5. Global electricity consumption has continuously increased during the last 50 years, arriving at an estimated 25,530 terawatt-hours in 2023 [
27,
31] (
Figure 6). Since 1980 and up to 2021, global electricity consumption has increased three-fold, and the global population increased by roughly 75%, simultaneously. In line with extended industrialisation and infrastructural improvement, these factors caused a three-fold increased electricity demand, with an upward trajectory prognosis, as of the end of 2021. Since the year 2000, China's gross development product (GDP) was recorded as developing a 16-fold increase [
7,
27,
28] establishing China as the second-largest global economy, after the United States. The development of its billion-strong population and manufacturing industries has caused China to require increased levels of energy, more than any other country. Thus, it has become the largest consumer of electricity, worldwide. China and other BRIC countries (Brazil, Russia, India, China) are still vastly outpaced by developed economies with smaller population sizes, in terms of per capita electricity consumption. To place this in context: Iceland, with a population of less than half a million inhabitants, consumes the most electricity, per capita (per person) in the world, followed by Norway, Qatar, Canada, and the U.S. [
7,
27,
28]. Contributing factors such as the existence of power-intensive industries, household sizes, living situations, appliance and efficiency standards, and access to alternative heating fuels have been identified as the determinants of the amount of electricity the average person requires, in the cited countries. Therefore, given these developments and the looming climate catastrophe, greater energy efficiency, and exergy loss prevention, is a technically simple and effective short-term solution. There is vast potential to simultaneously save energy by making existing infrastructure more efficient by reducing the energy/heat loss and therefore saving energy at the same percentage (30%). Meaning: this is 30% of the energy industry does not have to import and pay for from external sources. At the same time, 30% of CO
2 emissions for the energy not required, as saved, would not have to be produced. Consequently, improving the existing infrastructure to prevent energy and heat loss would mean a more energy secure and more sustainable production cycle, in any industry, while achieving greater energy independence and reducing the greenhouse gas emissions linked to fossil fuel consumption, particularly of energy derived from fossil fuels.
2.2. Retrofitting renewable energy technologies on site
Renewable energy technologies are an economically viable alternative [
12] to combustion processes based on fossil fuels such as coal and gas to produce heat and energy [
4,
14,
27,
28,
29,
30,
31,
32]. Solar, wind, geothermal and hydropower are well-established technical solutions [
4,
14,
27,
28,
29,
30,
31,
32], which have already been successfully implemented in a range of countries and settings [
33,
34,
35,
36,
37,
38]. In the UK, there are a range of schemes accessible to businesses, such as finance and support from the Department for Business, Energy & Industrial Strategy (2023) and others, as displayed in the following
Table 1. Some countries and industries are supplying their entire energy needs via renewable energy solutions [
4,
29,
31] - hence why this component is one of the cornerstones of the BiSC, as producing electricity and heating energy accounts for 36% of the UK’s CO
2 emissions [
14,
26,
27,
29,
39,
40,
41]. Besides the emissions savings, using renewable energy technologies exclusively could provide greater independence to businesses across all sectors and increase the UK’s energy self-sufficiency. The first step to greener production and greater energy independence on a fossil fuel base is the switch to an energy provider which are deriving their energy at 100% from renewable sources. Utilising existing buildings on industrial and production sites, suitable locations can easily be retrofitted with photovoltaic (PV) solar panels, producing energy from daylight and sunshine. These have the additional benefit of monetary grants (non-repayable), provided by the UK government, and government-backed loans and subsidies [
42,
43]. Additionally, the same applies to wind turbines, technology generating electricity using either biomass or hydro-turbines turbines (water-based), and anaerobic digestion (AD) systems.
Renewable energy technology is market ready – now the implementation is key.
The choice and implementation of any of these technologies are entirely dependent on the individual site parameters and need to be thoroughly assessed with regard to their suitability for the identified location, their potential ROI (return on investment), and viability with an outlook over the next 30 years. These need to include service and maintenance time and cost, the likelihood of repairs and the availability of suitable service providers to carry out said repairs, servicing and maintenance. Some examples in
Table 2:
Some technical solutions for achieving a higher degree of energy independence have been intensely researched [
23,
44,
45,
46,
47] and implemented in a range of industrial sectors. Projects containing components such as DAC (Direct Air Capture), re-directing heat and utilising anaerobic digesters to produce biogas (methane and hydrogen), and producing energy on-site with suitably sized turbines [
48] can be directly linked to one of the incentives shown in
Table 1, such as the ‘Farming Investment Fund’ and includes funding for agricultural businesses such as farmers, foresters, growers and agri-contractors with grants for investing in new technologies, equipment and infrastructure [
43]. To make the green industrial revolution happen, the UK government has created new energy efficiency schemes from 2022 to replace the current domestic and non-domestic renewable heat incentives. The cost of manufacturing solar panels and wind turbines has plummeted dramatically in the past decade, making them affordable and often the cheapest form of electricity [
14]. As an example, solar module prices fell by up to 93% between 2010 and 2020. During the same period, the global weighted-average cost of electricity (LCOE) for utility-scale solar PV projects fell by 85%14. Although there is a variety of renewable energy technologies at TRL9 available (
Table 2), PV technology and on-shore wind generation for independent energy production were established as the mainly utilised renewable energy technology in a competitive market. The second largest dominant technology after solar in the UK is wind energy. Implementation of sustainable and renewable energy components into any production cycle, such as direct air capture (DAC) to a) capture off-gas carbon and b) produce biomass for the production of biogas in anaerobic digestion, carbon enrichment for plant stimulation (CEPS) (promoting growth in greenhouses for food production), anaerobic digestion (AD) to produce biogas and hydrogen, and capturing and utilising excess heat can individually make significant contributions to a higher degree of energy independence for the individual commercial entity. The MS Excel extrapolations established how the different components of the “7 steps to net zero carbon emissions steelmaking”-strategy can be implemented and installed. Installing renewable energy technologies can not only help to reduce CO
2 emissions but will supply the production site with renewable energy, where 30% of energy does not have to be imported from third parties and paid for, bringing the reduction in CO
2 emissions down to -49%. At this point in production, where biomass has already replaced the use of coke, and renewable energy technologies (solar, solar PV, wind, hydro) have been installed, an additional 30% of energy can be saved, and thus does not have to be bought in, by using biogas, bringing the reduction in CO
2 emissions to -65.7% [
49]. This will have been produced in the link-connected anaerobic digester, which produces biogas from connected agri-businesses. The negative percentage reduction in emissions means, in reverse, that at these points in the (steel) production process, a greater degree of energy independence can be achieved at 30%, 49% and 65.7% and 88% [
15,
49]. This implies that energy at the same percentage point levels is not required to be imported from external sources, as it is produced either on-site or link-connected. Besides energy and heat saving, generating their own energy will inevitably lead to achieve a higher level of independence, at least by 30% and ideally, at 88%, there are savings to be had by not being forced to import and pay for energy from conventional suppliers, energy derived from renewable sources or not. We have been made painfully aware that private and business users of energy and fuel are at the mercy of corporate stakeholder interests and thus vulnerable to high price velocity. Retrofitting the existing industrial building infrastructure with renewable energy technology, with components of the “7 step to net zero carbon emissions steelmaking”-strategy, can support achieving: a) greater energy efficiency and independence, b) turbo-charge the decarbonisation of energy production, c) decarbonise steel and industrial production, and d) provide savings opportunities via excess heat recovery. The MCDA analysis of different renewable energy systems, taking into consideration the incentives in
Table 1, leaves much hope for the establishment of the UK as a green energy hub, as the provided initiatives can enable the stakeholders willing to invest in green energy to not only make the green industrial revolution in the UK happen, but could enable the investors to do so at minimal cost.
Table 2 shows an extract of the extensive BiSC implementation MCDA analysis. Observing economic principles and baselines, it can be assumed that, overall, there is a third of cost involved, with two-thirds of savings on energy cost over a 30-year-investment period. Additional, significant positive milestones can be reached, such as investment into a workforce with “green” skills, future-proofing the business against energy price hikes, besides the positive effects of greater energy independence, decarbonisation of production and rehabilitation of the natural world which has been disrupted beyond recognition by the Anthropocene. The political and legal landscape and country governmental guidance will have to change dramatically [
50,
51] in order to meet the targets, set by the Paris Agreement [
52] and COP15 [
51] and the dire warnings issued by the recent IPCC reports (2023) [
53]. By improving their carbon capture and off-heat utilisation capabilities, and investing in renewable energy technology, businesses are:
supporting the decarbonisation of production,
reaching a higher degree of energy independence,
achieving a higher level of asset efficiency,
training workforce in required ‘green’ skills,
reducing their energy costs and
creating a viable additional income stream
Additionally, besides achieving a higher degree of energy independence, economic advantages in monetary terms are almost inevitable when renewable energy systems are being installed. Doing so will also support achieving limiting the global temperature rise to below 2°C and thus support avoiding climate disaster. The CO
2 emissions by industry sector were analysed [
33,
39,
54,
55,
56,
57] and besides the iron and steel industry, there are other heavy industries which are CO
2 emitters, and generating copious amounts of off-heat, co-products and therewith resources, which could be harvested and used to power energy-dependent devices: Transport, Chemical industry, Energy Supply, Residential/Commercial buildings sector, Agriculture, and Waste Management.
3. Conclusions
Achieving a higher degree of energy independence is within reach of all sectors of society, made possible by technological progress and incentives and grants provided by the respective governments and countries, besides the UK. The opportunities are manifold, they merely require political willingness and implementation across all industries. The process simulations compiled within the systems S8, Aspen+ and Inosim aligned with the mathematical analysis and modelling in MS Excel and provided almost matching reports stating a reduction of 30% from 977t of CO2e to 684t of CO2e flow in a 330t furnace, when the energy provider was switched to a 100% green energy provider (derived at 100% from renewable energy). Additional reductions to the value of 30% were observed, where CO2 emissions declined from 684t CO2e to 479t CO2e, when coal and coke were replaced by biomass (BECCS). The installation of solar PV panels for energy generation on site resulted in a further 30% reduction from 479t CO2e to 335t. Finally, the installation of CO2 filters reduced the CO2 emissions to almost ‘0’. Furthermore, the application points of renewable energy technology within the steel production process were established where achieving a 30%, 49% and 65.7% higher energy independence is achievable, in the short term. The cost risk of installing renewable energy and decarbonisation technology was minimised to less than a third of the initial outlay in individual cases, as the UK government is providing grants, funding and loan schemes to encourage all industrial sectors to work towards Net-Zero. The research preceding the compilation of the current paper has provided answers which are reaching over into multiple other heavy industries, and additionally resulting in further opportunity for a range of research directions, which are listed, as follows:
Utilisation of captured CO2 in the building industry (CCUS), agriculture (CEPS), chemical industry, food & drinks industry, and pharmaceuticals
Utilisation of waste products from steel making in infrastructural projects
Other GHG captured from post-combustion processes can be reused in the chemical industry, thus eliminating the need for waste management.
The upgrading and retrofitting of existing and new steel plants and other industrial sites provide an immense opportunity for further research, as there is a vast range of active and abandoned production plants in the UK, not limited to:
Adding solar foil, panels, tiles and shingles to buildings and carparks deemed structurally sound
Adding a biogas and/or hydrogen transfer network for hydrogen direct reduction in steel production from anaerobic digesters
Installing wind turbines at brownfield sites not suitable for human habitation
Developing filters to be retrofitted to existing production plants emitting GHGs, which are not based on using Zeolite or water based chemical processes
Further work is currently underway and will provide more detail on the more salient points of this paper, upon publication. as appropriate.
Author Contributions
Conceptualization, S.K. ; methodology, S.K., H.G.D. and A.-H.S. ; software, S.K.; validation, H.G.D. and A.-H.S.; formal analysis, S.K. ; investigation, S.K.; resources, S.K.; data curation H.G.D. and A.-H.S.; writing—original draft, preparation, review and editing, S.K.; visualization SK.; H.G.D. and A.-H.S. supervision, H.G.D. and A.-H.S.; project administration, A.-H.S.; funding acquisition, S.K. All authors have read and agreed to the published version of the manuscript.
Funding
This research received no external funding.
Institutional Review Board Statement
The study was conducted in accordance with the Declaration of Helsinki and approved by the Institutional Review Board (or Ethics Committee) Stafford-shire University (date of approval: 28/01/2022).
Informed Consent Statement
Not applicable.
Data Availability Statement
Not applicable.
Conflicts of Interest
The authors declare no conflict of interest
Nomenclature
BAT - Best available technology
BCA - Border carbon adjustment
BF - Blast furnace
BOF - Basic oxygen furnace
BS EN ISO - British Standard / European Standard / International Organization for Standardization [British national version of ISO Standards (International Organization for Standardization)]
CapBF - Total capacity (kg) Blast furnace
CapBOF - Total capacity (kg) Basic oxygen furnace
CapEAF - Total capacity (kg) Electric arc furnace
CAPEX - Capital expenses
CAT – Carbon avoidance technology
CCUS - Carbon capture and utilization or storage
CGE - Computable general equilibrium
CH4 - Methane CCS – Carbon capture and storage
CO2 - Carbon dioxide
DRI - Direct reduced iron
DRI - Direct reduced iron
EAF - Electric arc furnace
EAF - Electric arc furnace
Eimp - Total imported energy (kg/steel)
EmSp.El. - CO2 emission savings/avoidance potency factor
Fe2O3 - Hematite
FeO - Wuestite
GEI - Grid emission intensity
GHG - Greenhouse gas emissions
H2O - Water, chemical formula
HBI - Hot-briquetted iron
H-DR - Hydrogen direct reduction
HHV - Higher heating value
I4.0 – Industry 4.0
IEA - International Energy Agency
IPCC - Intergovernmental Panel on Climate Change
IRENA - International Renewable Energy Agency
LHV - Lower heating value
LKAB - Luossavaara-Kiirunavaara Aktiebolag (Swedish Mining Corporation)
LST - Tonne (metric) liquid steel
MAC - Marginal abatement cost
MCO2,proc - Onsite CO2 emission (kg/steel)
Mind - Production rate of steel (kg) capacity
MO.Ind - Usage of oxygen on site
NG - Natural gas, fossil derived methane
O&M - Operation and maintenance
O2 - Oxygen, chemical formula
OPC - Ordinary Portland Cement
OPEX - Operating expenses
PC - Pulverized coal
PCC - Electricity import for CO2 capture/savings process (MJ)
PEM - Proton exchange membrane
Pind - Electricity import for the industrial process (MJ)
PV - Solar Photovoltaic Cells
Q - Net heat transferred into the system, Q is the sum of all heat transfer into and out of the system
SEC - Specific energy consumption
SOE - Solid oxide electrolysis
SSAB - Svenskt Stål AB (Swedish Steel Corporation)
TGRBF - Top gas recycling blast furnace
W - Net work done by the system, W is the sum of all work done on/by the system
WTO - World Trade Organization
ΔU - Change in internal energy U of the system
Ø - Sign for average
References
- IEA (International Energy Agency). IEA. 2023 [cited 2023 Jul 7]. IEA Data and Statistics. Available from: https://www.iea.org/data-and-statistics.
- Baena-Moreno F, Cid-Castello N, Arellano-García H, Reina T. Towards emissions free steel manufacturing – Exploring the advantages of a CO2 methanation unit to minimize CO2 emissions. Science of The Total Environment. 2021;781(7):Article ID 146776. [CrossRef]
- Hasanbeigi A. Steel Climate Impact—An International Benchmarking of Energy and CO2 Intensities [Internet]. 2022 [cited 2023 Jul 7] p. 2. Available from: https://static1.squarespace.com/static/5877e86f9de4bb8bce72105c/t/624ebc5e1f5e2f3078c53a07/1649327229553/Steel+climate+impact-benchmarking+report+7April2022.pdf.
- COM (European Commission). CORDIS | European Commission. [cited 2023 Jul 6]. Steel industry boost research into cleaner technologies. Available from: https://cordis.europa.eu/article/id/29184-steel-industry-boost-research-into-cleaner-technologies.
- IEA (International Energy Agency). Data and Statistics [Internet]. 2021. Available from: https://www.iea.org/data-and-statistics/data-browser?country=WORLD&fuel=Energy%20transition%20indicators&indicator=ETISharesInPowerGen.
- Swalec C. Carbon Brief. 2021 [cited 2023 Jul 7]. Guest post: These 553 steel plants are responsible for 9% of global CO2 emissions. Available from: https://www.carbonbrief.org/guest-post-these-553-steel-plants-are-responsible-for-9-of-global-co2-emissions/.
- Ren L, Zhou S, Peng T, Ou X. A review of CO2 emissions reduction technologies and low-carbon development in the iron and steel industry focusing on China. Renewable and Sustainable Energy Reviews. 2021 Jun;143:110846. [CrossRef]
- IEA (International Energy Agency). IEA. 2018 [cited 2023 Jul 7]. Global energy demand grew by 2.1% in 2017, and carbon emissions rose for the first time since 2014 - News. Available from: https://www.iea.org/news/global-energy-demand-grew-by-21-in-2017-and-carbon-emissions-rose-for-the-first-time-since-2014.
- Nix J. John Nix Pocketbook – For Farm Management (50th edn). Leicestershire: The Anderson Centre; 2020.
- Nix J. John Nix Pocketbook – For Farm Management (53rd edn). Leicestershire: The Anderson Centre; 2023.
- Dastoor P. Solar Foil; Email 18/10/2021. 2021.
- Caminiti G, Anderson P, Pulido T, Owens T, Connor C. ArcGIS StoryMaps. 2021 [cited 2023 Jul 6]. Implementation of Solar Energy. Available from: https://storymaps.arcgis.com/stories/70d4da4a613a4829b4f258ad3e724923.
- El-Khozondar H, El-Batta F. Solar energy implementation at the household level: Gaza Strip case study. Energy, Sustainability and Society. 2022 Apr 28;12. [CrossRef]
- IRENA. Renewable Power Remains Cost-Competitive amid Fossil Fuel Crisis [Internet]. 2022 [cited 2023 Jul 13]. Available from: https://www.irena.org/news/pressreleases/2022/Jul/Renewable-Power-Remains-Cost-Competitive-amid-Fossil-Fuel-Crisis.
- Kiessling S, Darabkhani HG, Soliman AH. Energies | Free Full-Text | The Bio Steel Cycle: 7 Steps to Net-Zero CO2 Emissions Steel Production [Internet]. 2022 [cited 2023 Jul 11]. Available from: https://www.mdpi.com/1996-1073/15/23/8880.
- WSA World Steel Association. Worldsteel 2019 [Internet]. 2019 [cited 2023 Jul 7]. Available from: https://www.worldsteel.org/en/dam/jcr:96d7a585-e6b2-4d63-b943-4cd9ab621a91/World%2520Steel%2520in%2520Figures%25202019.pdf.
- WSA World Steel Association. Worldsteel in figures [Internet]. 2021 [cited 2023 Jul 7]. Available from: https://www.worldsteel.org/en/dam/jcr:976723ed-74b3-47b4-92f6-81b6a452b86e/World%2520Steel%2520in%2520Figures%25202021.
- WSA World Steel Association. World Steel in Figures 2022 A healthy economy needs a healthy steel industry [Internet]. 2022 [cited 2023 Jul 7]. Available from: https://worldsteel.org/wp-content/uploads/World-Steel-in-Figures-2022-infographic.pdf?x65430.
- ECRA European Cement Research Academy. ECRA CCS project and Report about phase II [Internet]. Düsseldorf: ECRA; 2009 [cited 2020 Mar 4]. Available from: https://ecra-online.org/fileadmin/redaktion/files/pdf/ECRA__Technical_Report_CCS_Phase_II.pdf.
- EULA (European Lime Association. How much lime per tonne of steel? Summary of the technical report A Competitive and Efficient Lime Industry - Cornerstone for a Sustainable Europe [Internet]. 2012. Available from: https://www.eula.eu/wp-content/uploads/2019/02/A-Competitive-and-Efficient-Lime-Industry-Summary_0.pdf.
- COM (European Commission). BIONICO: A pilot plant for turning biomass directly into hydrogen | BIONICO Project | Results in brief | H2020 | CORDIS | European Commission [Internet]. 2019 [cited 2023 Jul 6]. Available from: https://cordis.europa.eu/article/id/394984-bionico-a-pilot-plant-for-turning-biomass-directly-into-hydrogen.
- Fleiter T, Manz P, Neuwirth M, Mildner F, Persson U, Kermeli K, et al. Documentation on excess heat potentials of industrial sites including open data file with selected potentials : D5.1 [Internet]. 2020 [cited 2023 Jul 6]. Available from: https://urn.kb.se/resolve?urn=urn:nbn:se:hh:diva-42463.
- Li J, Li C, Zhang W, Zhang J, Xue Z. Material, energy and exergy flows of the oxygen blast furnace process with sintering flue gas injection. Journal of Cleaner Production. 2022 Oct 15;371:133294. [CrossRef]
- Moran MJ, Sciubba E. Exergy Analysis: Principles and Practice. Journal of Engineering for Gas Turbines and Power. 1994 Apr 1;116(2):285–90. [CrossRef]
- WEF World Economic Forum. World Economic Forum. 2019 [cited 2023 Jul 14]. The $86 trillion world economy – in one chart. Available from: https://www.weforum.org/agenda/2019/09/fifteen-countries-represent-three-quarters-total-gdp/.
- IEA (International Energy Agency). IEA. 2021 [cited 2023 Jul 7]. Global CO2 emissions rebounded to their highest level in history in 2021 - News. Available from: https://www.iea.org/news/global-co2-emissions-rebounded-to-their-highest-level-in-history-in-2021.
- STATISTA. Statista. 2023 [cited 2023 Nov 28]. Global electricity consumption 2022. Available from: https://www.statista.com/statistics/280704/world-power-consumption/.
- Statista. Statista. 2023 [cited 2023 Nov 29]. UK: electricity use for iron and steel production 2023. Available from: https://www.statista.com/statistics/323391/electricity-use-for-iron-and-steel-production-in-the-united-kingdom-uk/.
- Langley KF. Energy efficiency in the UK iron and steel industry. Applied Energy. 1986 Jan 1;23(2):73–107. [CrossRef]
- Yurcent Environmental Technology Co., Ltd. Zeolite Rotor-Product-Xi’an Yurcent Environmental Technology Co., Ltd.-Xi’an Yurcent Environmental Technology Co., Ltd. [Internet]. 2023 [cited 2023 Jul 7]. Available from: https://en.yurcent.com/Products_3/20.html.
- IEA (International Energy Agency). World Energy Outlook 2023. 2023.
- Chen Q, Gu Y, Tang Z, Wei W, Sun Y. Assessment of low-carbon iron and steel production with CO2 recycling and utilization technologies: A case study in China. Applied Energy. 2018 Jun;220:192–207. [CrossRef]
- Gozens J, Turnbull A, Jotzo F. An Installation-Level Model of China’s Coal Sector Shows How its Decarbonization and Energy Security Plans will Reduce Overseas Coal Imports (CCEP Working Paper). Crawford School of Public Policy, Centre for Climate and Energy Policy (CCEP) Australia National University 2021 [Internet]. 2021 [cited 2022 Aug 3]; Available from: https://nsuworks.nova.edu/tqr/vol8/iss4/6/.
- COM (European Commission). Circular economy: Faster progress needed to meet EU resource-efficiency targets, ensure sustainable use of materials and enhance strategic autonomy [Internet]. COM (European Commission); 2023 [cited 2023 Jan 3]. Available from: https://environment.ec.europa.eu/news/circular-economy-faster-progress-needed-meet-eu-resource-efficiency-targets-ensure-sustainable-use-2023-05-15_en#:~:text=In%20recent%20years%2C%20circular%20economy,0.8%25%20of%20the%20EU's%20GDP.
- COM (European Commission). CORDIS | European Commission. 2023 [cited 2023 Jul 6]. HYDROGEN MEETING FUTURE NEEDS OF LOW CARBON MANUFACTURING VALUE CHAINS | H2Future Project | Fact Sheet | H2020. Available from: https://cordis.europa.eu/project/id/735503.
- COM (European Commission). EU climate targets: how to decarbonise the steel industry [Internet]. [cited 2023 Jul 6]. Available from: https://joint-research-centre.ec.europa.eu/jrc-news-and-updates/eu-climate-targets-how-decarbonise-steel-industry-2022-06-15_en.
- EERE (US Department of Energy Efficiency & Renewable Energy). Hydrogen Production: Natural Gas Reforming [Internet]. 2021. (Hydrogen Production: Natural Gas Reforming). Available from: https://www.energy.gov/eere/fuelcells/hydrogen-production-natural-gas-reforming.
- Tata Steel Europe. Tata Steel in Europe Sustainability Report 2019/2020 [Internet]. 2020 [cited 2023 Jul 7]. Available from: https://www.tatasteeleurope.com/sites/default/files/TSE%20Sustainability%20report%202019-20%20(EN).pdf.
- Tata Steel. Tata Steel in Europe. 2023 [cited 2023 Jul 13]. SUSTAINABILITY PERFORMANCE AT OUR SITES Port Talbot. Available from: https://www.tatasteeleurope.com/construction/sustainability/performance-at-our-sites/port-talbot.
- Toktarova A. The Low-Carbon Steel Industry-Interactions Between the Hydrogen Direct Reduction of Steel and the Electricity System - ProQuest [Internet]. [Gothenburg, Sweden]: Department of Space, Earth and Environment CHALMERS UNIVERSITY OF TECHNOLOGY; 2021 [cited 2023 Jul 7]. Available from: https://www.proquest.com/openview/c2a4d77d71403fdbffd33f250b13251d/1?pq-origsite=gscholar&cbl=2026366&diss=y.
- Kittipongvises S. Assessment of Environmental Impacts of Limestone Quarrying Operations in Thailand. Environmental and Climate Technologies. 2017 Nov 27;20(1):67–83.
- Seethalakshmi KK, Jijeesh CM, Balagopalan M. Bamboo plantations: an approach to Carbon sequestration [Internet]. Kerala/Trichur: Kerala Forest Research Institute; 2016. Available from: https://www.researchgate.net/publication/215475397_Bamboo_plantations_An_approach_to_Carbon_sequestration.
- Kuramochi T, Ramírez A, Turkenburg W, Faaij A. Techno-economic assessment and comparison of CO2 capture technologies for industrial processes: Preliminary results for the iron and steel sector. Energy Procedia. 2011;4:1981–8.
- Kuramochi T, Höhne N, Schaeffer M, Cantzler J, Hare B, Deng Y, et al. Ten key short-term sectoral benchmarks to limit warming to 1.5°C. Climate Policy. 2018 Mar 16;18(3):287–305. [CrossRef]
- Office for National Statistics. Population estimates - Office for National Statistics [Internet]. 2021 [cited 2023 Jul 14]. Available from: https://www.ons.gov.uk/peoplepopulationandcommunity/populationandmigration/populationestimates.
- IRENA (International Renewable Energy Agency). World Energy Transitions Outlook: 1.5°C Pathway [Internet]. 2021. Available from: https://www.irena.org/publications/2021/Jun/World-Energy-Transitions-Outlook.
- IPCC Intergovernmental Panel for Climate Change. Climate Change 2021 - The Physical Science Basis Summary for Policymakers [Internet]. Cambridge: Cambridge University Press; 2021 [cited 2023 Jul 7]. Available from: https://www.ipcc.ch/report/ar6/wg1/downloads/report/IPCC_AR6_WGI_SPM.pdf.
- OFGEM. Ofgem. 2023 [cited 2023 Jul 7]. Smart Export Guarantee (SEG). Available from: https://www.ofgem.gov.uk/environmental-and-social-schemes/smart-export-guarantee-seg.
- OFGEM. Ofgem. [cited 2023 Jul 7]. Find business energy efficiency grants and schemes. Available from: https://www.ofgem.gov.uk/information-consumers/energy-advice-businesses/find-business-energy-efficiency-grants-and-schemes.
- WANG R. Energy saving technologies and optimisation of energy use for decarbonised iron and steel industry [Internet] [Doctoral]. Durham University; 2022 [cited 2023 Jul 7]. Available from: http://etheses.dur.ac.uk/14289/.
- Wang C, Walsh S, Haynes MW, Weng Z, Feitz A, Summerfield D, et al. From Australian iron ore to green steel: the opportunity for technology-driven decarbonisation [Internet]. 2022 [cited 2023 Jul 7]. Available from: https://ecat.ga.gov.au/geonetwork/srv/api/records/5377741d-ece0-4e01-b87e-6bf49da11c03.
- Wang R, Liang L, Wang Y, Roskilly AP. ID: 9. PROCESS SIMULATION OF BLAST FURNACE OPERATION WITH BIOMASS SYNGAS INJECTION FOR CLEAN PRODUCTION [Internet]. Newcastle, UK: Newcastle, UK: Sir Joseph Swan Centre for Energy Research, Newcastle University.; 2019 [cited 2020 Jan 10]. Available from: https://www.energy-proceedings.org/wp-content/uploads/2020/02/9_Paper_0705055709.pdf.
- Kempken T, Hauck T, DeSantis M, Rodriguez PQ, Miranda M, Gonzales D, et al. (2021) Collection of possible decarbonisation barriers (Deliverable D1.5). [Internet]. Centre for European Policy Studies (CEPS), Brussels (Belgium): Green Steel for Europe Consortium; 2021 [cited 2022 Mar 2]. Available from: https://www.estep.eu/assets/Uploads/D1.5-Collection-of-possible-decarbonisation-barriers.pdf.
- Bazooyar B, Darabkhani HG. Design, manufacture and test of a micro-turbine renewable energy combustor. Energy Conversion and Management. 2020;Article ID 112782. [CrossRef]
- Devlin A, Yang A. Regional supply chains for decarbonising steel: Energy efficiency and green premium mitigation. Energy Conversion and Management. 2022 Feb;254:115268. [CrossRef]
- UNEP United Nations EnvironmentProgram. UN Environment. 2020 [cited 2023 Jul 13]. The six-sector solution to the climate crisis. Available from: https://www.unep.org/interactive/six-sector-solution-climate-change/.
- UNEP United Nations EnvironmentProgram. UNEP - UN Environment Programme. 2022 [cited 2023 Jul 13]. UN Biodiversity Conference (COP 15). Available from: http://www.unep.org/un-biodiversity-conference-cop-15.
- UN United Nations. Paris Agreement 2016 [Internet]. United Nations; 2016 [cited 2020 Mar 2]. Available from: https://www.un.org/en/climatechange/paris-agreement#:~:text=To%20tackle%20climate%20change%20and,2015%3A%20the%20historic%20Paris%20Agreement.
- IPCC Intergovernmental Panel for Climate Change. AR6 Synthesis Report Climate Change 2023 [Internet]. 2023 [cited 2023 Jan 5]. Report No.: AR6. Available from: https://www.ipcc.ch/report/ar6/syr/downloads/report/IPCC_AR6_SYR_SPM.pdf.
- Jahani N, Sepehri A, Vandchali HR, Tirkolaee EB. Application of Industry 4.0 in the Procurement Processes of Supply Chains: A Systematic Literature Review. Sustainability. 2021 Jul 6;13(14):7520. [CrossRef]
- Mandova H, Patrizio P, Leduc S, Kjärstad J, Wang C, Wetterlund E, et al. Achieving carbon-neutral iron and steelmaking in Europe through the deployment of bioenergy with carbon capture and storage. Journal of Cleaner Production. 2019 May;218:118–29. [CrossRef]
- Office for National Statistics. Population estimates for the UK, England and Wales, Scotland and Northern Ireland - Office for National Statistics [Internet]. 2021 [cited 2023 Jul 14]. Available from: https://www.ons.gov.uk/peoplepopulationandcommunity/populationandmigration/populationestimates/bulletins/annualmidyearpopulationestimates/mid2018.
- ONS Office for National Statistics. Foreign direct investment, experimental UK subnational estimates: 2021 - Office for National Statistics [Internet]. 2023 [cited 2023 Jul 14]. Available from: https://www.ons.gov.uk/releases/foreigndirectinvestmentexperimentaluksubnationalestimatesmarch2023.
|
Disclaimer/Publisher’s Note: The statements, opinions and data contained in all publications are solely those of the individual author(s) and contributor(s) and not of MDPI and/or the editor(s). MDPI and/or the editor(s) disclaim responsibility for any injury to people or property resulting from any ideas, methods, instructions or products referred to in the content. |
© 2023 by the authors. Licensee MDPI, Basel, Switzerland. This article is an open access article distributed under the terms and conditions of the Creative Commons Attribution (CC BY) license (http://creativecommons.org/licenses/by/4.0/).
