Submitted:
07 December 2023
Posted:
08 December 2023
You are already at the latest version
Abstract
Keywords:
1. Introduction
2. Material and specimen
2.1. Additive manufacturing process
2.2. Anisotropic behavior of tensile properties
2.3. Fatigue specimen, data and microstructure
3. Results and discussion
3.1. Selected VHCF specimens A and B
3.2. Typical SEM morpholgy of crack initiation
3.3. Local fractography along crack growth path
3.4. TEM sampes preparation by using FIB technique
- 1.
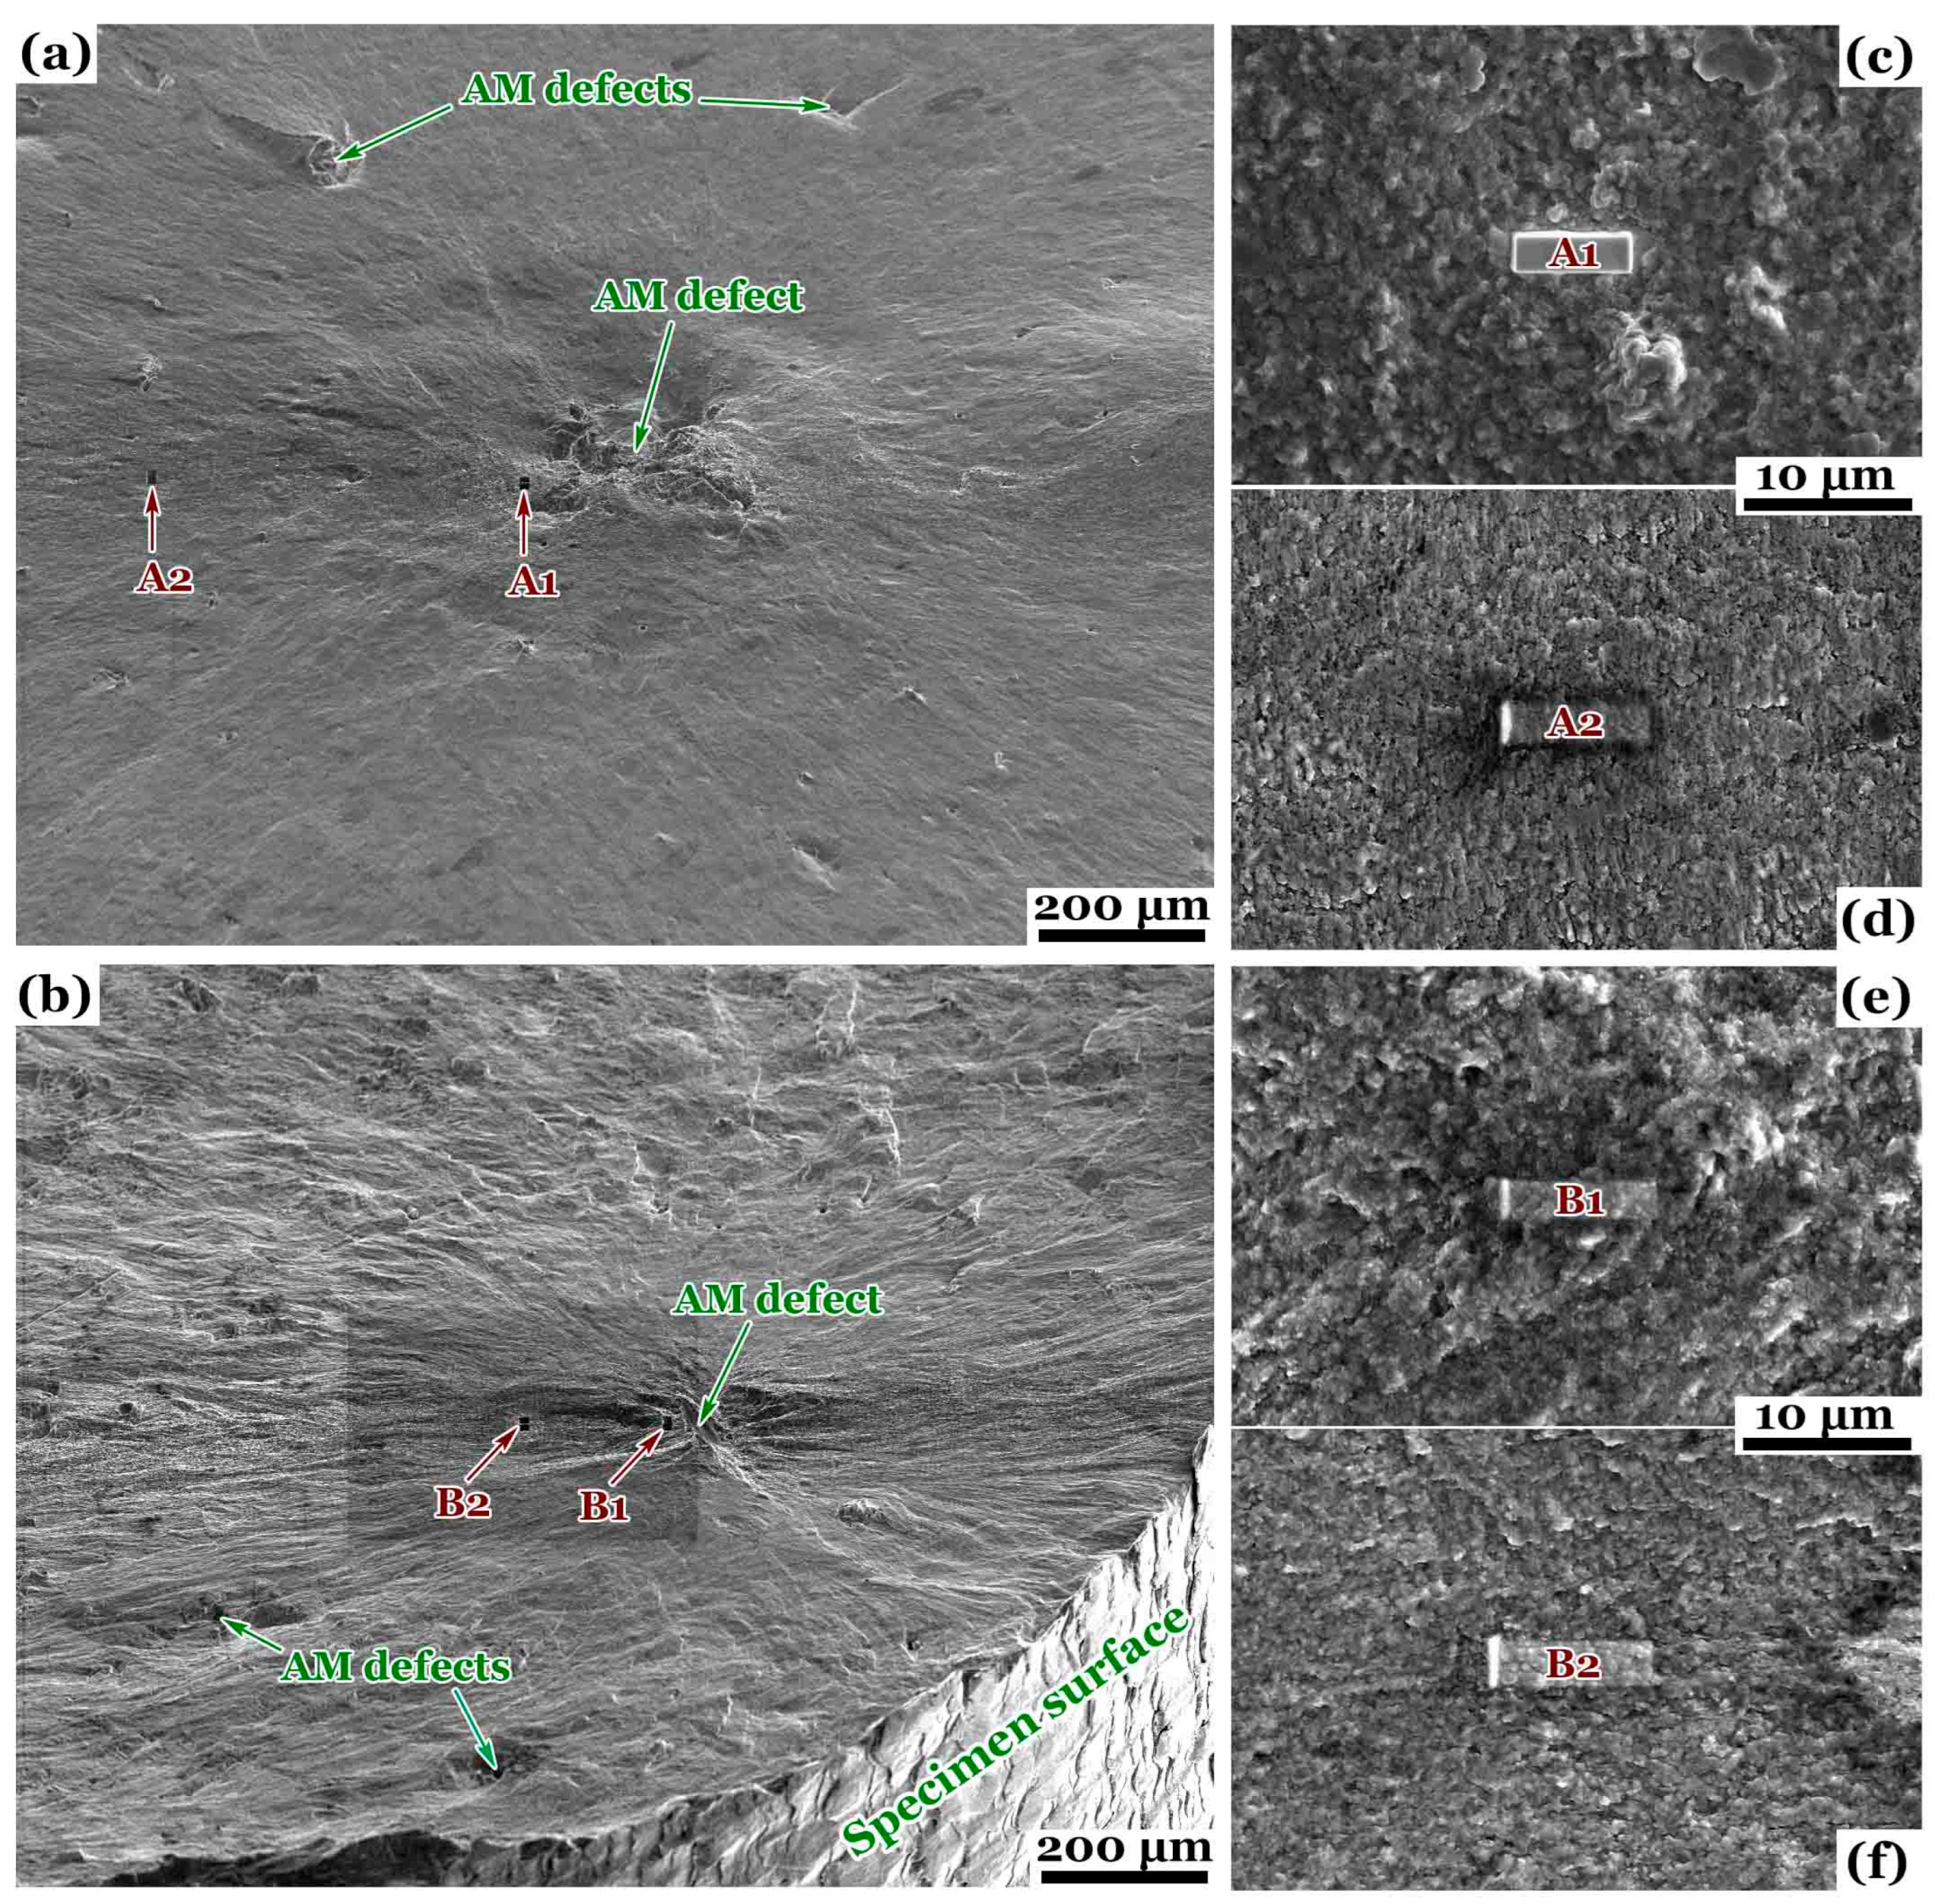
- A rectangular platinum layer was physically vapor-deposited on the posited location to protect the selective fracture surface and the microstructure underneath guided by beams of ions and electrons via a gas injection system of the FIB/SEM microscope. The platinum layers were labeled as A1, A2, B1, B2 in Figure 2c–f with small translucent blocks.
- 2.
- On both long sides of the rectangular layer, two trenches were milled from the unprotected fracture surface with spattered Ga+ cations, and obtained a rough sample of profile microstructure which was still connected with the matrix on three planes.
- 3.
- By tilting the fractured specimen, the sample was separated from the matrix with FIB etching, and attached to the tip of a nano-manipulator (OmniProbe, Oxford Instrument, Abingdon, UK).
- 4.
- Lifted out the rough sample of about length 10 μm, depth 5 μm and thickness 1 μm; and then mounted on an FIB-TEM grid holder; eventually thinned and polished to a foil of about length 5 μm, depth 4 μm and thickness 50 nm.
3.5. Al cell, Si network and grain boundary distribution
3.6. VHCF induced fracture and microstructure features
4. Conclusions
- Broadly, there are no characteristic microstructure of both grain size and chemical element distribution induced by fatigue crack initiation and growth in the differently oriented AM aluminium alloy under very-high-cyclic loading with various R values of stress ratios.
- A few nanograins were observed at a very local region around the crack initiation site of a vertically AM AlSi10Mg under VHCF loading at R = 0.
- The granulation of fracture surface and Si arrangement underneath the fracture surface occur in the neighboring area of VHCF crack initiation in the AM aluminium alloy with various orientations and under different R values.
- VHCF loading cycles are the first key factor dominating the behaviors of fracture surface granulation and chemical element arrangement, and the negative stress ratios are the second.
Author Contributions
Funding
Institutional Review Board Statement
Informed Consent Statement
Data Availability Statement
Acknowledgments
Conflicts of Interest
References
- Suresh, S. Fatigue of Materials, 2nd ed.; Cambridge University Press: Cambridge, United Kingdom, 1998.
- Schijve, J. Fatigue of Structures and Materials, 2nd ed.; Springer: Dordrecht, Germany, 2009.
- Meyers, M.A.; Chawla, K.K. Mechanical Behavior of Materials, 2nd ed.; Cambridge University Press: Cambridge, United Kingdom, 2009.
- Pan, X.; Su, H.; Sun, C.; Hong, Y. The behavior of crack initiation and early growth in high-cycle and very-high-cycle fatigue regimes for a titanium alloy. Int. J. Fatigue 2018, 115, 67–78. [CrossRef]
- Pan, X.; Hong, Y. High-cycle and very-high-cycle fatigue behaviour of a titanium alloy with equiaxed microstructure under different mean stresses. Fatigue Fract. Eng. Mater. Struct. 2019, 42(9), 1950–1964. [CrossRef]
- Sanaei, N.; Fatemi, A. Defects in additive manufactured metals and their effect on fatigue performance: A state-of-the-art review. Prog. Mater. Sci. 2021, 117, 100724. [CrossRef]
- Gibson, I.; Rosen, D.; Stucker, B.; Khorasani, M. Additive Manufacturing Technologies, 3rd ed.; Springer: Gewerbestrasse, Cham, Switzerland, 2021.
- Qian, G.; Jian, Z.; Qian, Y.; Pan, X.; Ma, X.; Hong, Y. Very-high-cycle fatigue behavior of AlSi10Mg manufactured by selective laser melting: Effect of build orientation and mean stress. Int. J. Fatigue 2020, 138, 105696. [CrossRef]
- Du, L.; Pan, X.; Qian, G.; Zheng, L.; Hong, Y. Crack initiation mechanisms under two stress ratios up to very-high-cycle fatigue regime for a selective laser melted Ti-6Al-4V. Int. J. Fatigue 2021, 149, 106294. [CrossRef]
- Piette, T.D.; Warren, R.J.; Spangenberger, A.G.; Hummelt, E.J.; Lados, D.A. Microstructure evolution, fatigue crack growth, and ultrasonic fatigue in as-fabricated laser powder bed and conventionally cast Al-10Si-0.4Mg: A mechanistic understanding and integrated flaw-sensitive fatigue design methods. Mater. Sci. Eng. A 2021, 825, 141892. [CrossRef]
- Tridello, A.; Fiocchi, J.; Biffi, C.A.; Rossetto, M.; Tuissi, A.; Paolino, D.S. Effect of microstructure, residual stresses and building orientation on the fatigue response up to 109 cycles of an SLM AlSi10Mg alloy. Int. J. Fatigue 2022, 160, 106825. [CrossRef]
- Hattingh, D.G.; Botha, S.; Bernard, D.; James, M.N.; Plessis, A.D. Corrosion fatigue of Ti-6Al-4V coupons manufactured by directed energy deposition. Fatigue Fract. Eng. Mater. Struct. 2022, 45(7), 1969-1980. [CrossRef]
- Behvar A.; Berto, F.; Haghshenas, M. A review on isothermal rotating bending fatigue failure: Microstructural and lifetime modeling of wrought and additive manufactured alloys. Fatigue Fract. Eng. Mater. Struct. 2023, 46(10), 3545-3595. [CrossRef]
- Tusher, M.M.H.; Ince A. Effect of stress-relieved heat treatment on very high cycle fatigue performance of additive manufactured Ti-6Al-4V alloy. Fatigue Fract. Eng. Mater. Struct. 2023, 46(10), 3982-4000. [CrossRef]
- Tusher, M.M.H.; Ince, A. A systematic review on high cycle and very high cycle fatigue behavior of laser powder bed fused (L-PBF) Al-Si alloys. Eng. Fail. Anal. 2023, 154, 107667. [CrossRef]
- Centola, A.; Ciampaglia, A.; Tridello, A.; Paolino, D.S. Machine learning methods to predict the fatigue life of selectively laser melted Ti6Al4V components. Fatigue Fract. Eng. Mater. Struct. 2023, 46(11), 4350-4370. [CrossRef]
- Pan, X.; Du, L.; Qian, G.; Hong, Y. Microstructure features induced by fatigue crack initiation up to very-high-cycle regime for an additively manufactured aluminium alloy. J. Mater. Sci. Tech. 2024, 173, 247–260. [CrossRef]
- Mondolfo, L.F. Aluminium Alloys: Structure and Properties; Butterworths: London, United Kingdom, 1976.
- Aboulkhair, N.T.; Simonelli, M.; Parry, L.; Ashcroft, I.; Tuck, C.; Hague, R. 3D printing of aluminium alloys: Additive manufacturing of aluminium alloys using selective laser melting. Prog. Mater. Sci. 2019, 106, 100578. [CrossRef]
- Boban, J.; Ahmed, A. Defect mitigation and surface enhancement of additively manufactured AlSi10Mg internal features using electro-thermal post-treatment. Mater. Lett. 2023, 353, 135267. [CrossRef]
- Nasab, M.H.; Romano, S.; Gastaldi, D.; Beretta, S.; Vedani, M. Combined effect of surface anomalies and volumetric defects on fatigue assessment of AlSi7Mg fabricated via laser powder bed fusion. Addit. Manuf. 2020, 34, 100918. [CrossRef]
- Vora, P.; Mumtaz, K.; Todd, I.; Hopkinson, N. AlSi12 in-situ alloy formation and residual stress reduction using anchorless selective laser melting. Addit. Manuf. 2015, 7, 12-19. [CrossRef]
- Wӧhler, A. Wӧhler's experiments on the strength of metals. Engineering, 1867, 4, 160-161.
- Hull, D. Fractography: Observing, Measuring and Interpreting Fracture Surface Topography; Cambridge University Press: Cambridge, United Kingdom, 1999.
- Hong, Y.; Lei, Z.; Sun, C.; Zhao, A. Propensities of crack interior initiation and early growth for very-high-cycle fatigue of high strength steels. Int. J. Fatigue 2014, 58, 144-151. [CrossRef]
- Sakai, T.; Sato, Y.; Oguma, N. Characteristic S-N properties of high-carbon-chromium-bearing steel under axial loading in long-life fatigue. Fatigue Fract. Eng. Mater. Struct. 2002, 25, 765-773. [CrossRef]
- Sakai, T.; Nakagawa, A.; Oguma, N.; Nakamura, Y.; Ueno, A.; Kikuchi, S.; Sakaida, A. A review on fatigue fracture modes of structural metallic materials in very high cycle regime. Int. J. Fatigue 2016, 93, 339-351. [CrossRef]
- Pan, X.; Qian, G.; Wu, S.; Fu, Y.; Hong, Y. Internal crack characteristics in very-high-cycle fatigue of a gradient structured titanium alloy. Sci. Rep. 2020, 10, 4742. [CrossRef]
- Pan, X.; Xu, S.; Qian, G.; Nikitin, A.; Shanyavskiy, A.; Palin-Luc, T.; Hong, Y. The mechanism of internal fatigue-crack initiation and early growth in a titanium alloy with lamellar and equiaxed microstructure. Mater. Sci. Eng. A 2020, 798, 140110. [CrossRef]
- Mayer, H.; Ede, C.; Allison, J.E. Influence of cyclic loads below endurance limit or threshold stress intensity on fatigue damage in cast aluminium alloy 319-T7. Int. J. Fatigue 2005, 27, 129-141. [CrossRef]
- Atrens, A.; Hoffelner, W.; Duerig, T.W.; Allison, J.E. Subsurface crack initiation in high cycle fatigue in Ti6Al4V and in a typical martensitic stainless steel. Scripta Metall. 1983, 17, 601-606. [CrossRef]
- Bathias, C. There is no infinite fatigue life in metallic materials. Fatigue Fract. Eng. Mater. Struct. 1999, 22(7), 559-565. [CrossRef]
- Oguma, N.; Harada, H.; Sakai, T. Mechanism of long life fatigue fracture induced by interior inclusion for bearing steel in rotating bending. J. Soc. Mater. Sci., Japan, 2003, 52, 1292-1297. [CrossRef]
- Grad, P.; Reuscher, B.; Brodyanski, A.; Kopnarski, M.; Kerscher, E. Mechanism of fatigue crack initiation and propagation in the very high cycle fatigue regime of high-strength steels. Scripta Mater. 2012, 67, 838-841. [CrossRef]
- Hong, Y.; Liu, X.; Lei, Z.; Sun, C. The formation mechanism of characteristic region at crack initiation for very-high-cycle fatigue of high-strength steels. Int. J. Fatigue 2016, 89, 108-118. [CrossRef]
- Liu, L.; Ma, Y.; Liu, S.; Wang, S. The fatigue behaviors of a medium-carbon pearlitic wheel-steel with elongated sulfides in high-cycle and very-high-cycle regimes. Materials 2021, 14, 4318. [CrossRef]
- Pan, X.; Qian, G.; Hong, Y. Nanograin formation in dimple ridges due to local severe-plastic-deformation during ductile fracture. Scripta Mater. 2021, 194, 11363. [CrossRef]
- Pan, X.; Su, H.; Liu, X.; Hong, Y. Multi-scale fatigue features of titanium alloys with equiaxed or bimodal microstructures from low-cycle to very-high-cycle loading numbers. Mater. Sci. Eng. A 2024, 890, 145906. [CrossRef]
- Ul-Hamid, A. A Beginners' Guide to Scanning Electron Microscopy; Springer: Gewerbestrasse, Cham, Switzerland, 2009.
- Lozano-Perez, S. A guide on FIB preparation of samples containing stress corrosion crack tips for TEM and atom-probe analysis. Micron 2008, 39, 320-328. [CrossRef]
- Fultz, B.; Howe, J. Transmission Electron Microscopy and Diffractometry of Materials; Springer-Verlag: Berlin, Germany, 2001.
- Thijs, L.; Verhaeghe, F.; Craeghs, T.; Humbeeck, J.; Kruth, J. A study of the microstructural evolution during selective laser melting of Ti-6Al-4V. Acta Mater. 2010, 58, 3303-3312. [CrossRef]
- Bathias, C.; Paris, P. Gigacycle Fatigue in Mechanical Practice; Marcel Dekker: New York, NY, USA, 2005.
- Marioara, C.D.; Andersen, S.J.; Birkeland, A.; Holmestad, R. Orientation of silicon particles in a binary Al-Si alloy. J. Mater. Sci. 2008, 43, 4962-4971. [CrossRef]
- Fang, L.; Zhong, Y.; Wang, B.; Xu, W.; Li, X.; Lu, K. Ultrahard and super-stable pure aluminum with Schwarz crystal structure. Mater. Res. Lett. 2023, 11(8), 662-669. [CrossRef]


| Al | Si | Mg | Fe | Ti | other |
|---|---|---|---|---|---|
| Balance | 9.75 | 0.22 | 0.092 | 0.011 | < 0.01 |
| p [W] | t [mm] | v [mm/s] | h [mm] | Ev [J/mm3] |
| 370 | 0.05 | 1300 | 0.19 | 30 |
Disclaimer/Publisher’s Note: The statements, opinions and data contained in all publications are solely those of the individual author(s) and contributor(s) and not of MDPI and/or the editor(s). MDPI and/or the editor(s) disclaim responsibility for any injury to people or property resulting from any ideas, methods, instructions or products referred to in the content. |
© 2023 by the authors. Licensee MDPI, Basel, Switzerland. This article is an open access article distributed under the terms and conditions of the Creative Commons Attribution (CC BY) license (http://creativecommons.org/licenses/by/4.0/).


