1. Introduction
Common issues in braided rivers include riverbank erosion and the shifting of sandbars [
1], both of which can lead to alterations in the course of the river [
2]. Sediment transport within a river can result in erosion and deposition, occasionally affecting riverbanks. Altering the trajectory of a substantial river has significant socio-economic repercussions for the nation [
3]. An exemplary illustration of such a dynamic braided river is the Jamuna River in Bangladesh, renowned for its pronounced geomorphic activity [
4]. Throughout its history, the Jamuna River has consistently experienced sediment erosion and deposition within the river, riverbank erosion, alterations in bank lines, and confluence and bifurcation events [
5]. The Jamuna River displays a complex braided pattern classified into different channel orders. The primary first-order channel spans the entire river, with multiple second-order anabranches and numerous third-order subchannels. This main channel, averaging approximately 12 km in width, undergoes annual lateral bankline shifts, leading to the loss of 20–50 km
2 of the floodplain and displacing thousands of people. In contrast, second-order channels maintain distinct characteristics and significantly contribute to floodplain and braid-bar/island erosion. Some third-order channels were formed during the falling stage, whereas others emerged during the bankfull stage [
6]. The annual changes in the configuration of channels and sandbars in the Jamuna River, influenced by flow patterns [
7], contribute to pronounced instability. This instability is driven by substantial discharge and a high sediment load during floods, leading to consistent lateral migration and causing riverbank erosion, which poses significant challenges for communities residing in the Jamuna River floodplain [
8]. The formidable Jamuna River captivates researchers across diverse fields, delving into hydrodynamics, morphology, and sediment transport. Numerous studies have been conducted to address critical aspects such as river control, training initiatives, and erosion protection along its banks.
Over the years, diverse methods have been employed to manage the Jamuna River. This study, crucial and ongoing for several years, focuses significantly on the prevention of erosion along riverbanks. Various structural methods, including building strong embankments, installing sturdy hard points, strategically placing groynes, and employing creative bundle-like structures, have been utilized to achieve this goal. The combination of these methods, coupled with the history of protecting the riverbanks of the Jamuna River, provides valuable insights into the complex interactions between humans and nature.
This study takes a closer look at previous countermeasures and meticulously assesses the changes they induced in the landscape after construction. Based on this historical knowledge, we introduced a set of new and well-thought-out countermeasures aimed at enhancing solutions to ongoing challenges. These new measures undergo a thorough examination using a specially designed model study that considers extreme climatic conditions, ensuring their effective performance and adaptability to future climatic conditions.
2. Morphological consequences of the implemented structures
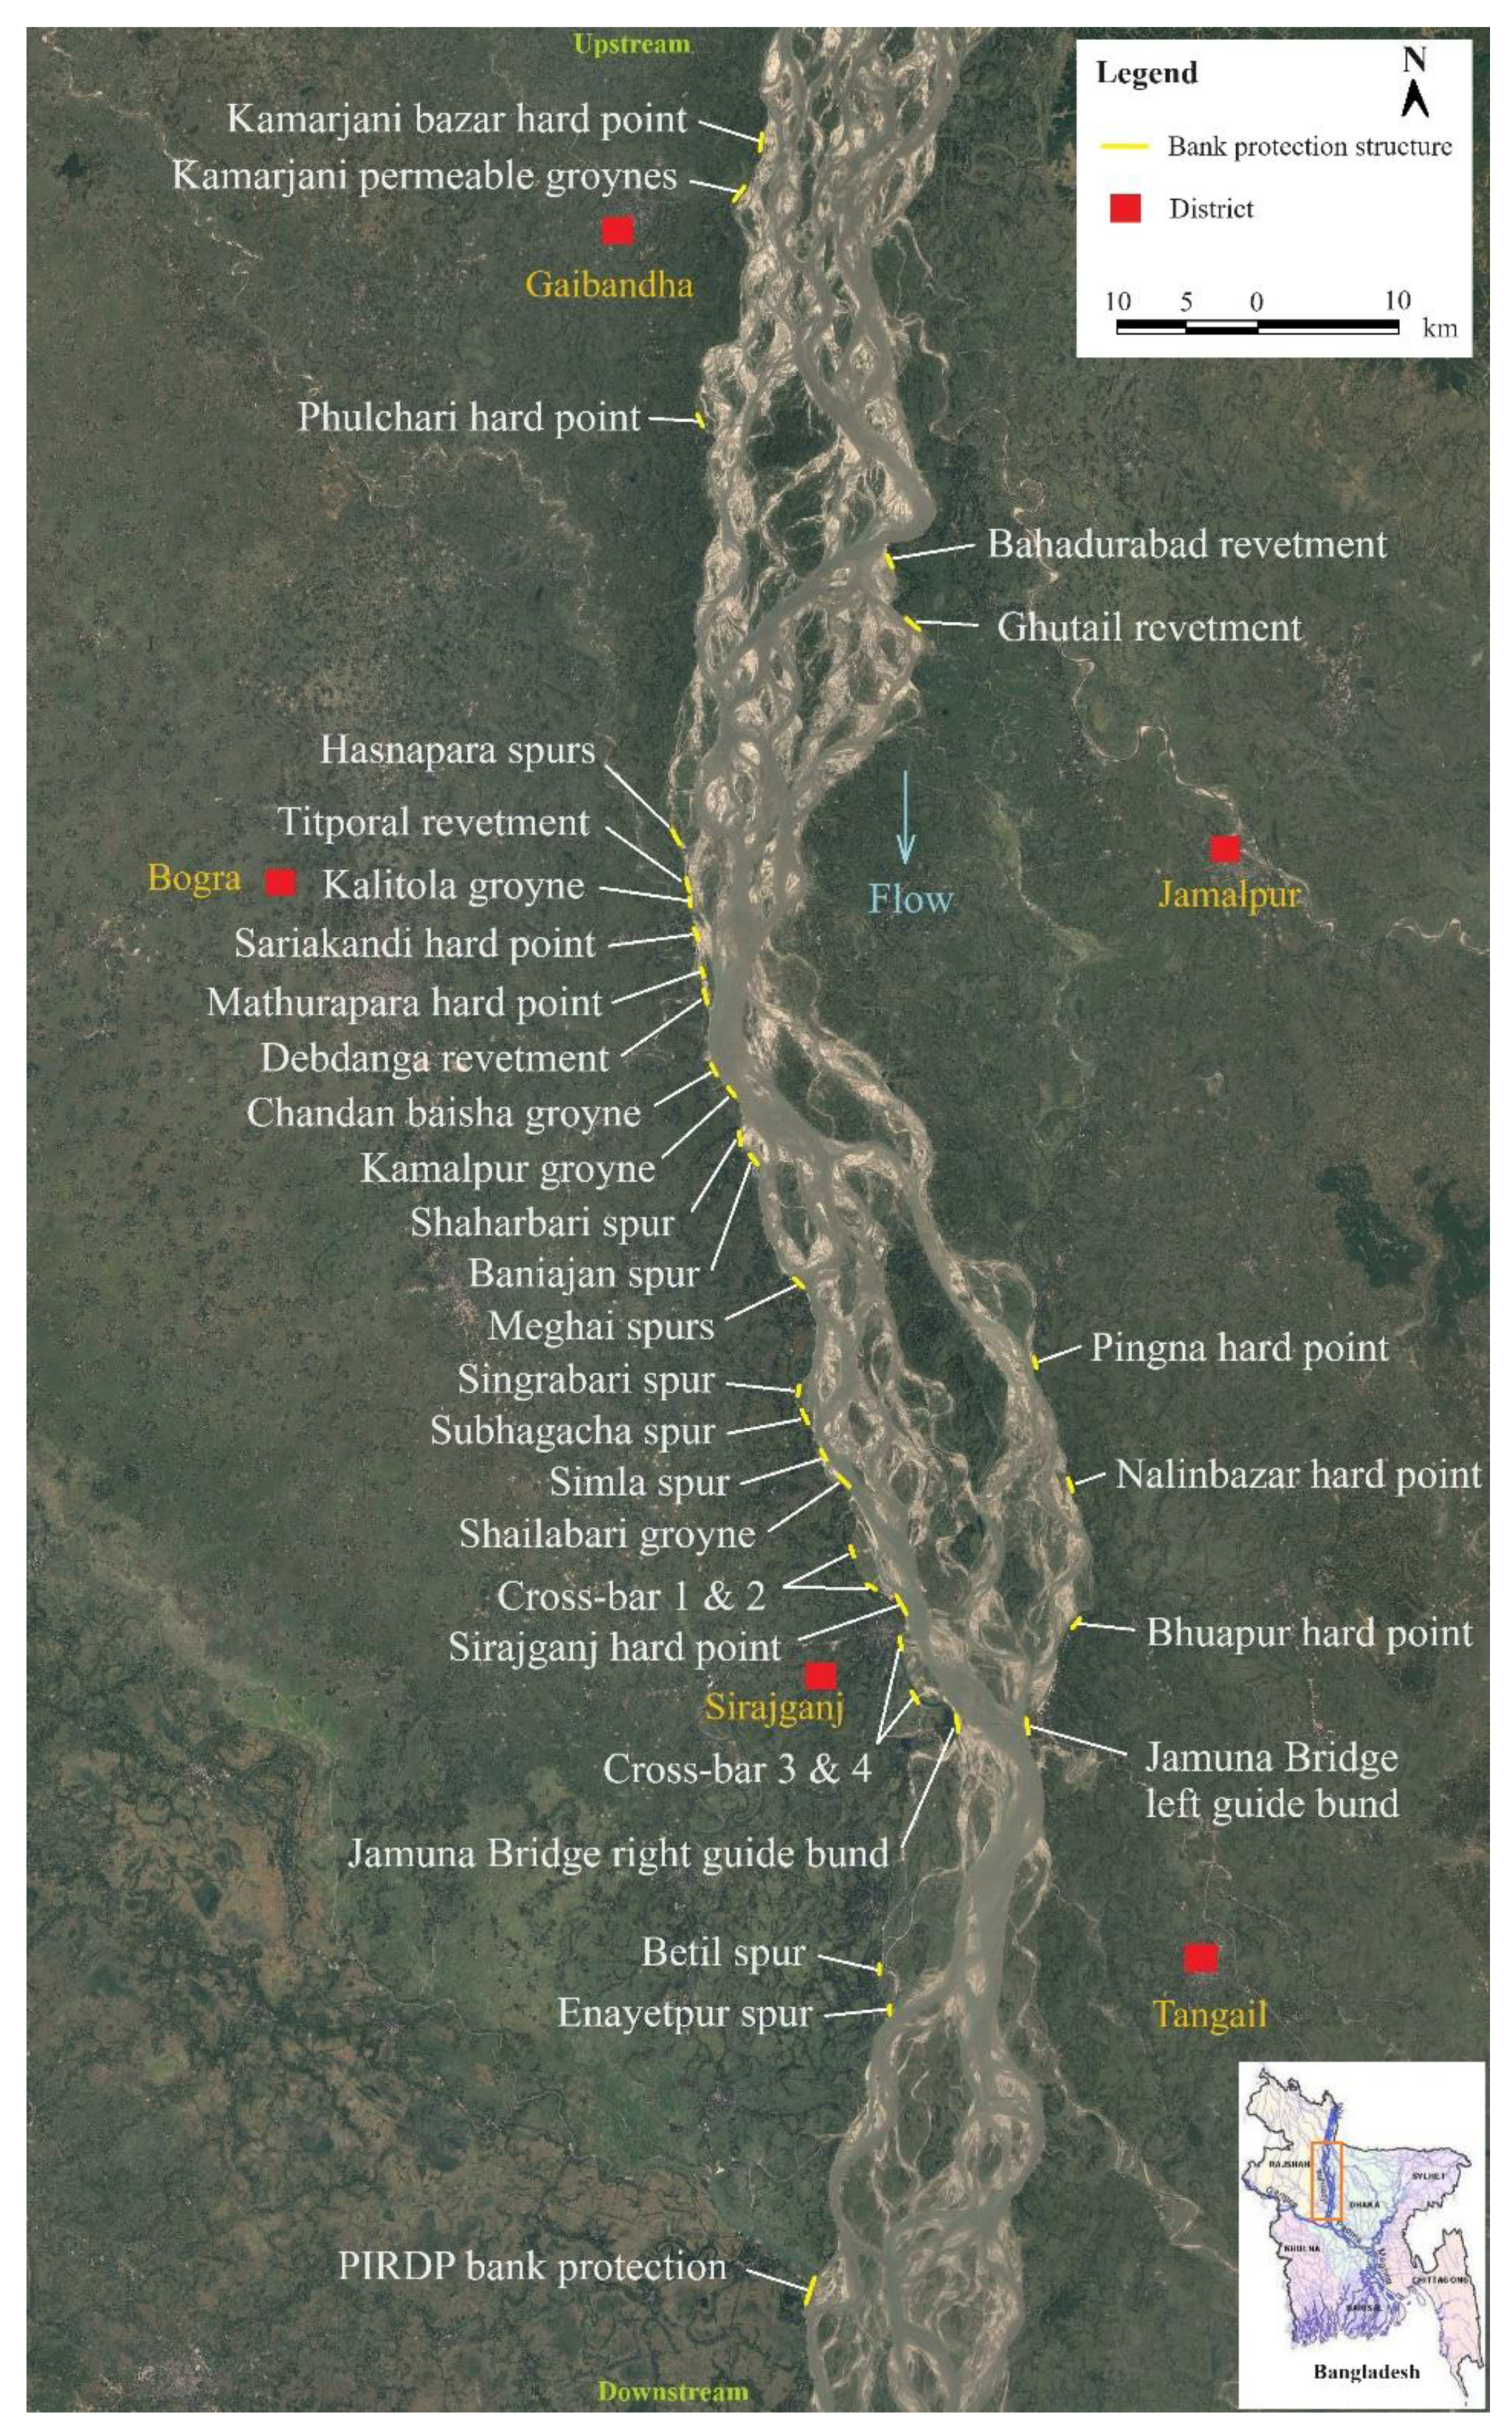
The Jamuna River, extending approximately 200 km in Bangladesh, is characterized by its considerable length and winding course. Due to the inherent unpredictability of rivers, many areas along their banks are vulnerable to erosion, with a heightened susceptibility observed on the right-hand side of the Jamuna River. Notably, a study revealed a significant disparity in protective structures, with only six identified on the left side compared to more than twenty-five on the right side [
9]. These structures span the entire stretch of the river, extending from its origin in Bangladesh to its downstream end. This section undertakes a thorough review and evaluation of crucial structures constructed using past countermeasures, specifically examining their effectiveness in mitigating riverbank erosion.
Figure 1.
Positions of various riverbank protection structures on both banks of the Jamuna River (Information source: [
7], slightly modified).
Figure 1.
Positions of various riverbank protection structures on both banks of the Jamuna River (Information source: [
7], slightly modified).
2.1. Revetment like structures
Revetments play a crucial role in bank protection, designed to address erosion along riverbanks while preserving natural river flow. These structures serve as a shield against forces induced by waves and currents, ensuring the protection of existing embankments. While the protective layer effectively resists current and wave impacts, the absence of proper toe protection may lead to slope destabilization, posing a threat to overall revetment stability. Commonly used materials include cement concrete (CC) blocks, boulders, mattresses, and open asphalt concrete. In contemporary practices, alternatives such as sand-filled geo-bags are progressively replacing traditional CC blocks in revetment construction [
9].
The Titporal Revetment, located at Titporal and Debdanga on the right bank of the Jamuna River, was built to prevent riparian erosion. This involved enhanced riverbank protection to impede the merging of the Jamuna and Bangali rivers, thereby reducing regional flooding around Sariakandi. Primarily constructed with CC blocks, the aim was to maintain the separation between the two rivers. This revetment has effectively mitigated erosion, providing critical protection against flood damage to crops, property, and infrastructure in the corresponding area [
10]. Similarly, the Bhuapur Hard Point, situated 5 km upstream of a bridge on the left bank [
4], used a geotextile mattress structure on dry land for comprehensive protection. Over the years, its effectiveness has been consistently evident, offering robust defense against the erosion of adjacent riverbanks.
The Sirajganj town protection initiative began several decades ago, featuring the Ranigram groyne at the upstream end of the current revetment structures. Both the groyne and revetment, armored with concrete blocks but lacking a filter layer, have suffered local damage. The significance of the Sirajganj Hard Point (
Figure 2) extends beyond town protection and plays a crucial role in preventing the widening of the Jamuna River. Additionally, it safeguards Jamuna Bridge, ensuring that the river width remains within a specified upstream corridor [
9].
2.2. Guide bunds
Guide bunds serve a dual purpose in providing protection to both bridges and riverbanks. These strategically positioned structures reinforce riverbanks, manage erosion, and enhance the foundations of bridges. By permitting sedimentation, guide bunds play a crucial role in ensuring the longevity and resilience of both bridges and the adjacent riverbanks, thereby contributing to sustainable infrastructure.
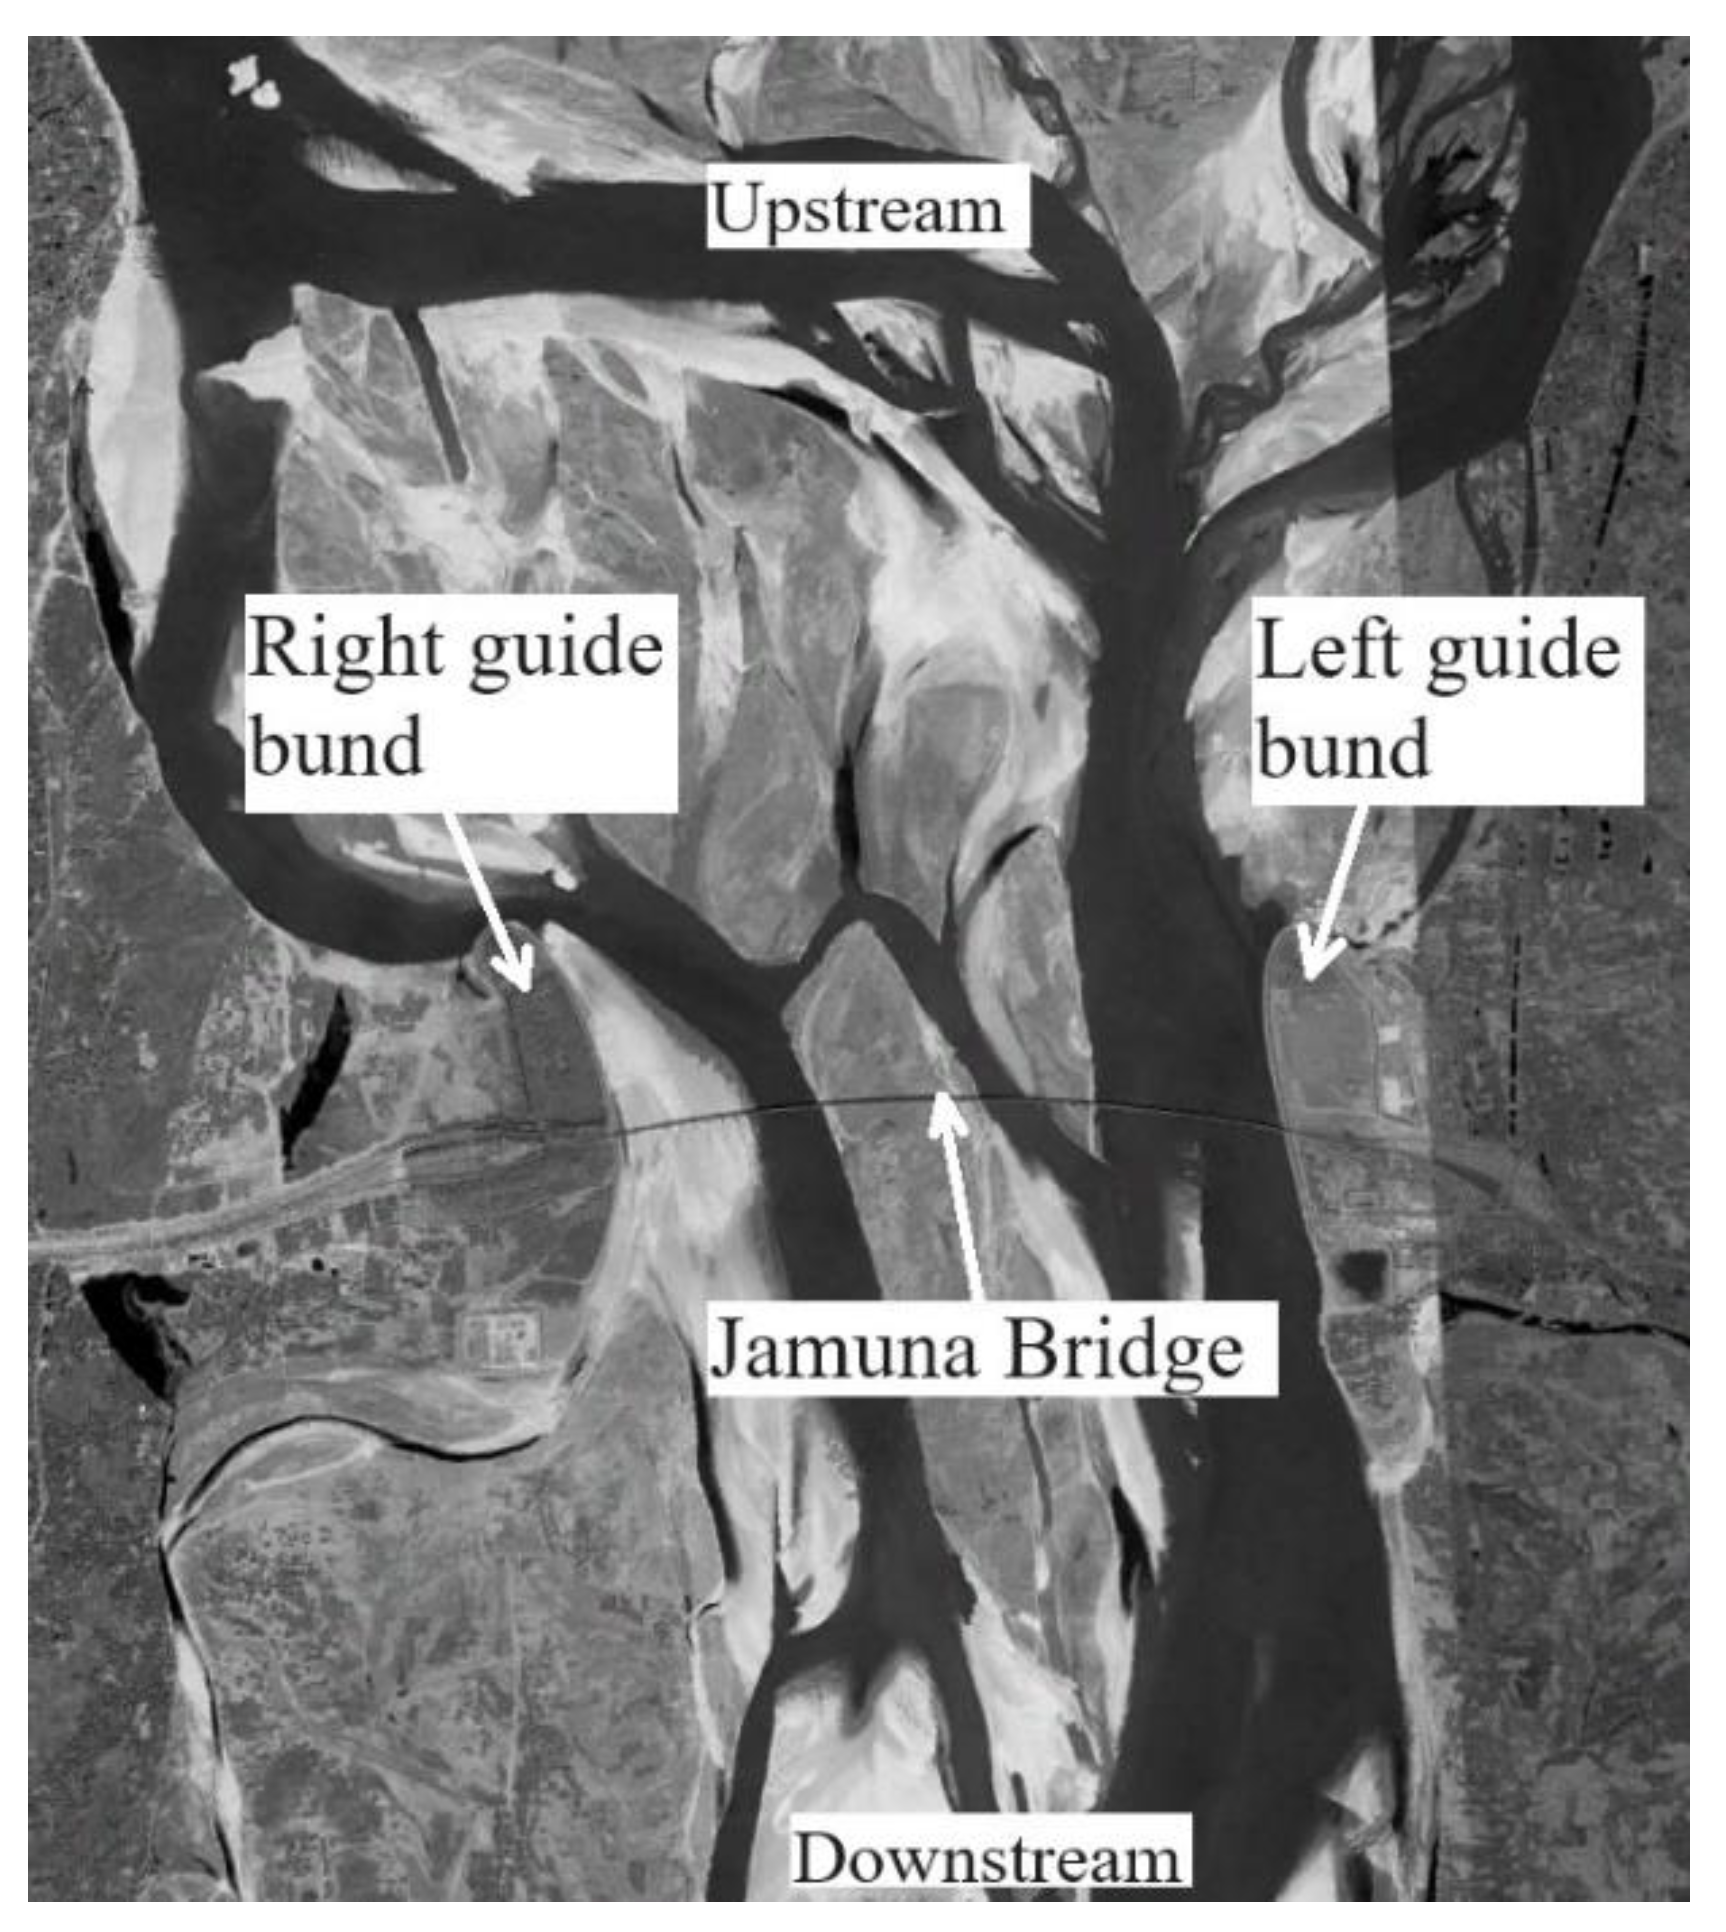
The construction of the Jamuna Bridge in 1998 included two guide bunds that play a pivotal role in regional connectivity, linking Bhuapur and Sirajganj (
Figure 3). These guide bunds effectively minimize river width, improve stability along riverbanks, protect bridges from erosion, and contribute to comprehensive river management, thereby safeguarding transportation routes. While the eastern channel near the left guide bund maintained a consistent course, the right guide bund significantly influenced the adjacent channel, leading to noticeable alterations. Over the years, a discernible trend emerged as the channel gradually shifted upstream of the western guide bund, resulting in significant changes in the river sandbars.
2.3. Groyne/spur like structures
Structures resembling groynes serve as a combination of active and passive river management strategies. These structures are typically erected and extend from the riverbank into the river. Their primary purposes include redirecting the river flow away from critical bank zones, providing protection, and narrowing the river's width to enhance navigational depth. Commonly used construction materials for these structures include stones, gravel, rock, earth, and piles.
Kalitola Groyne, a key initiative of the River Bank Protection Project (RBPP) [
11], aimed to prevent the Jamuna and Bangali rivers from merging in Sariakandi. Utilizing durable CC blocks and a reinforcing mat enhanced the groyne’s resilience against river forces, providing local erosion protection without altering the main river course.
Meghai Spur 1, partially damaged after two years and collapsing in the fifth year, underscores the importance of vigilant maintenance. Monitoring, particularly for structures such as Reinforced Concrete Cement (RCC) spurs, is crucial to avoid operational disruption. While Meghai Spur 2 initially contributed to land reclamation, insufficient maintenance led to reduced benefits and the loss of reclaimed land. Technical issues in both spurs caused bankline erosion, significantly diminishing the reclaimed area [
12].
In response to the 1988 flood, the World Bank's Flood Action Plan (FAP) launched Project 21 for erosion control along the Brahmaputra-Jamuna River. Focusing on Kamarjani village's right bank, the project aimed to build cost-effective bank protection, including a groyne test structure safeguarding 1700 m of the riverbank [
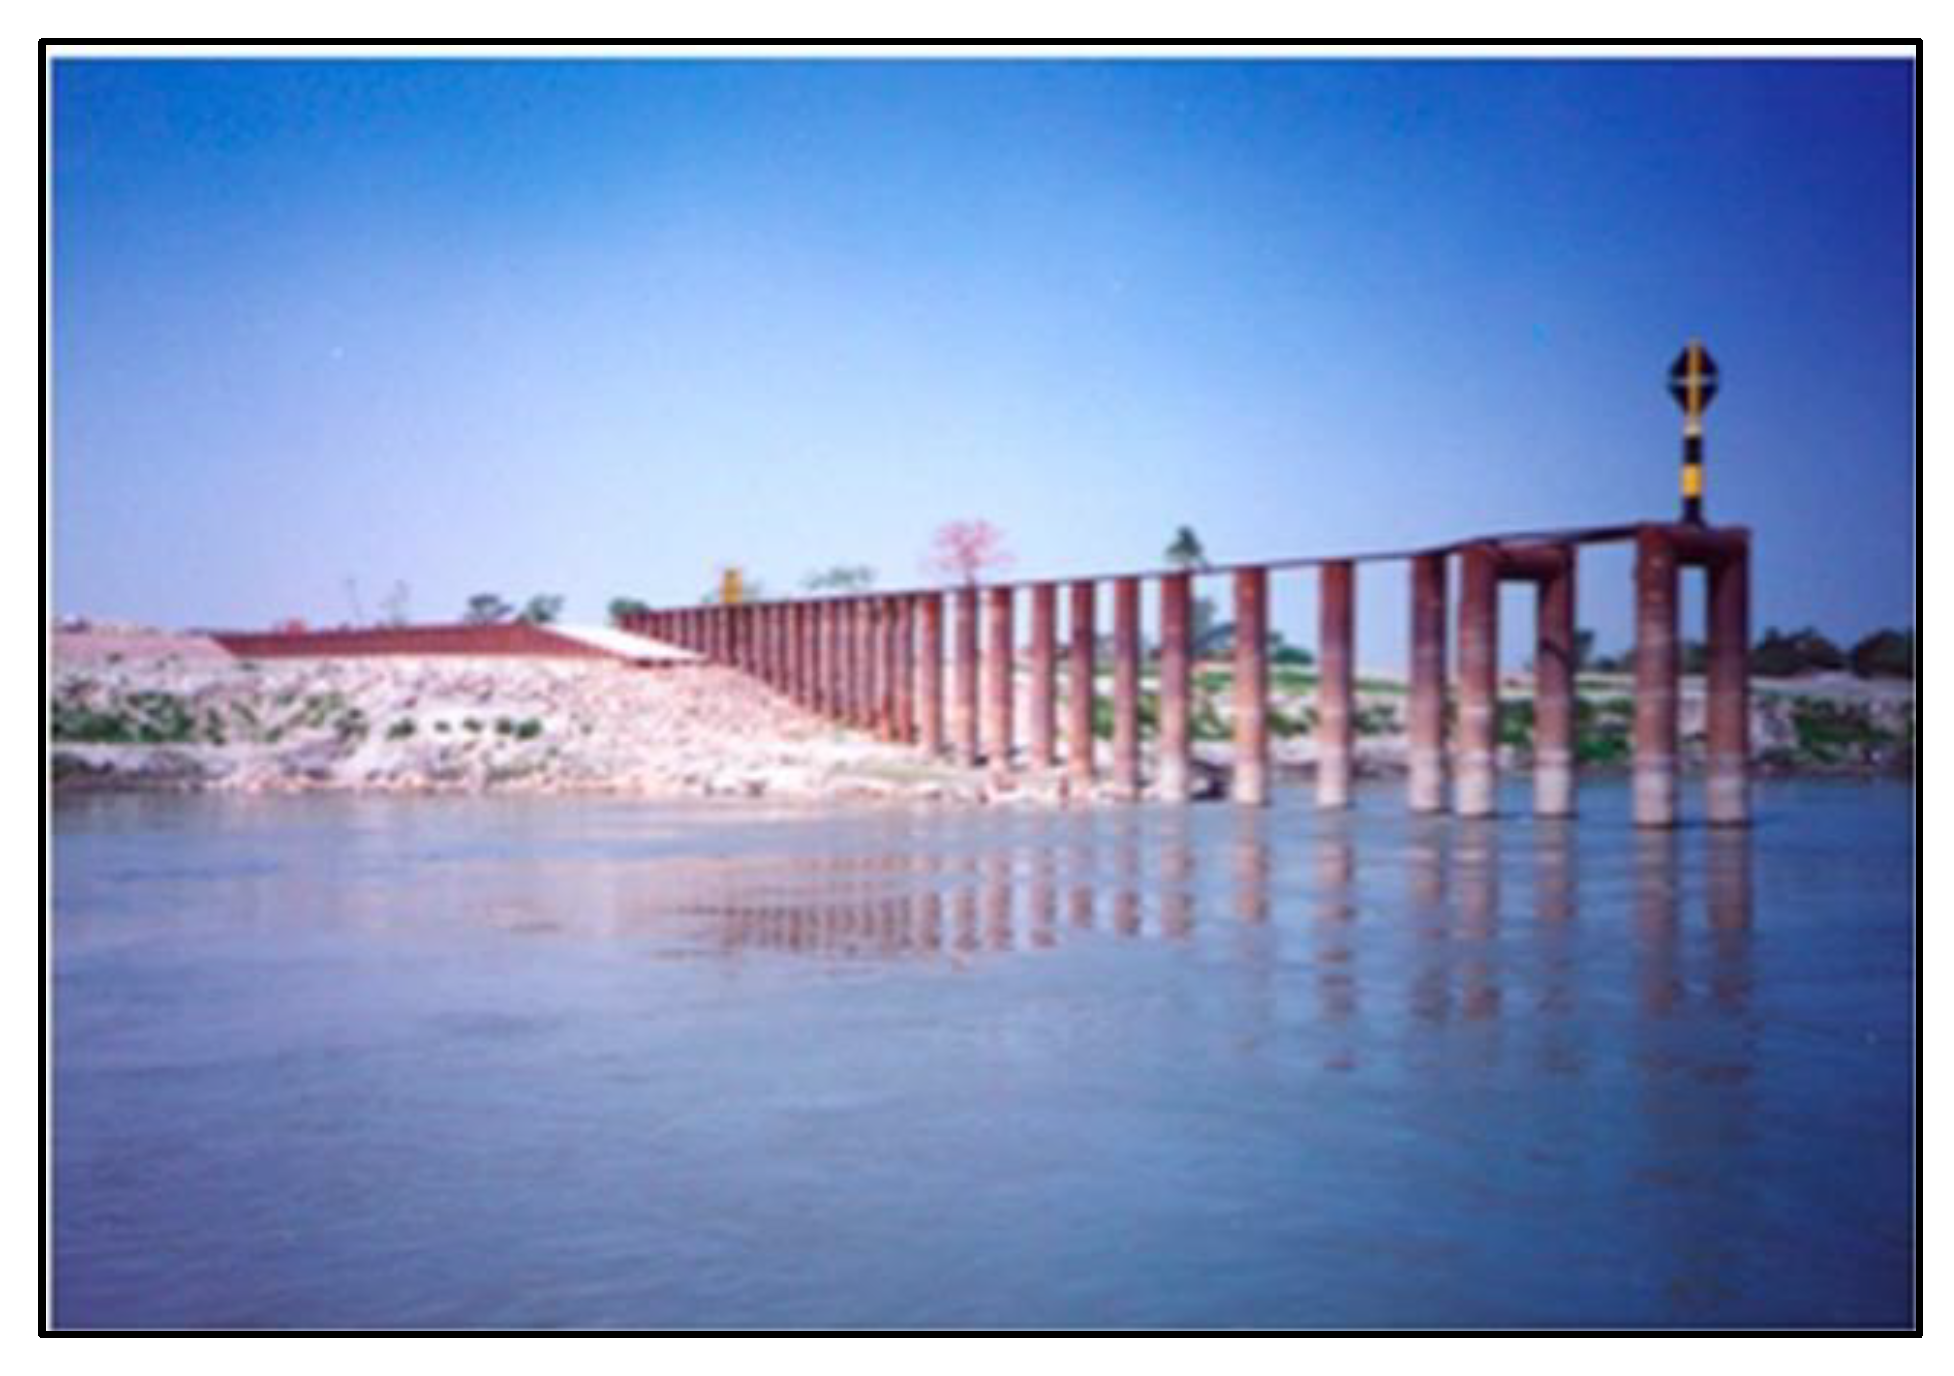
13]. However, permeable groynes (
Figure 4) constructed from 1994 to 1995 suffered damage and proved ineffective in preventing erosion, with limited impact on the river course and sandbar dynamics.
The Betil and Enayetpur spur dykes, constructed in 2002 to mitigate bank erosion in the eastern region of Belkuchi and Chowhali, south of Sirajganj, feature RCC heads supported by concrete piles (
Figure 5). The Betil spur experienced permeability in its lower section owing to local scouring, whereas the Enayetpur spur remained impermeable. Notably, the flood discharge did not induce an increase in the local scour around Betil, suggesting a sustained upstream sediment supply that prevented extensive bed degradation [
15]. Conversely, the Enayetpur spur area has undergone significant changes, marked by considerable erosion and sediment shifts over the years. Although these structures influenced the river morphology and sediment distribution, they did not substantially alter the primary course.
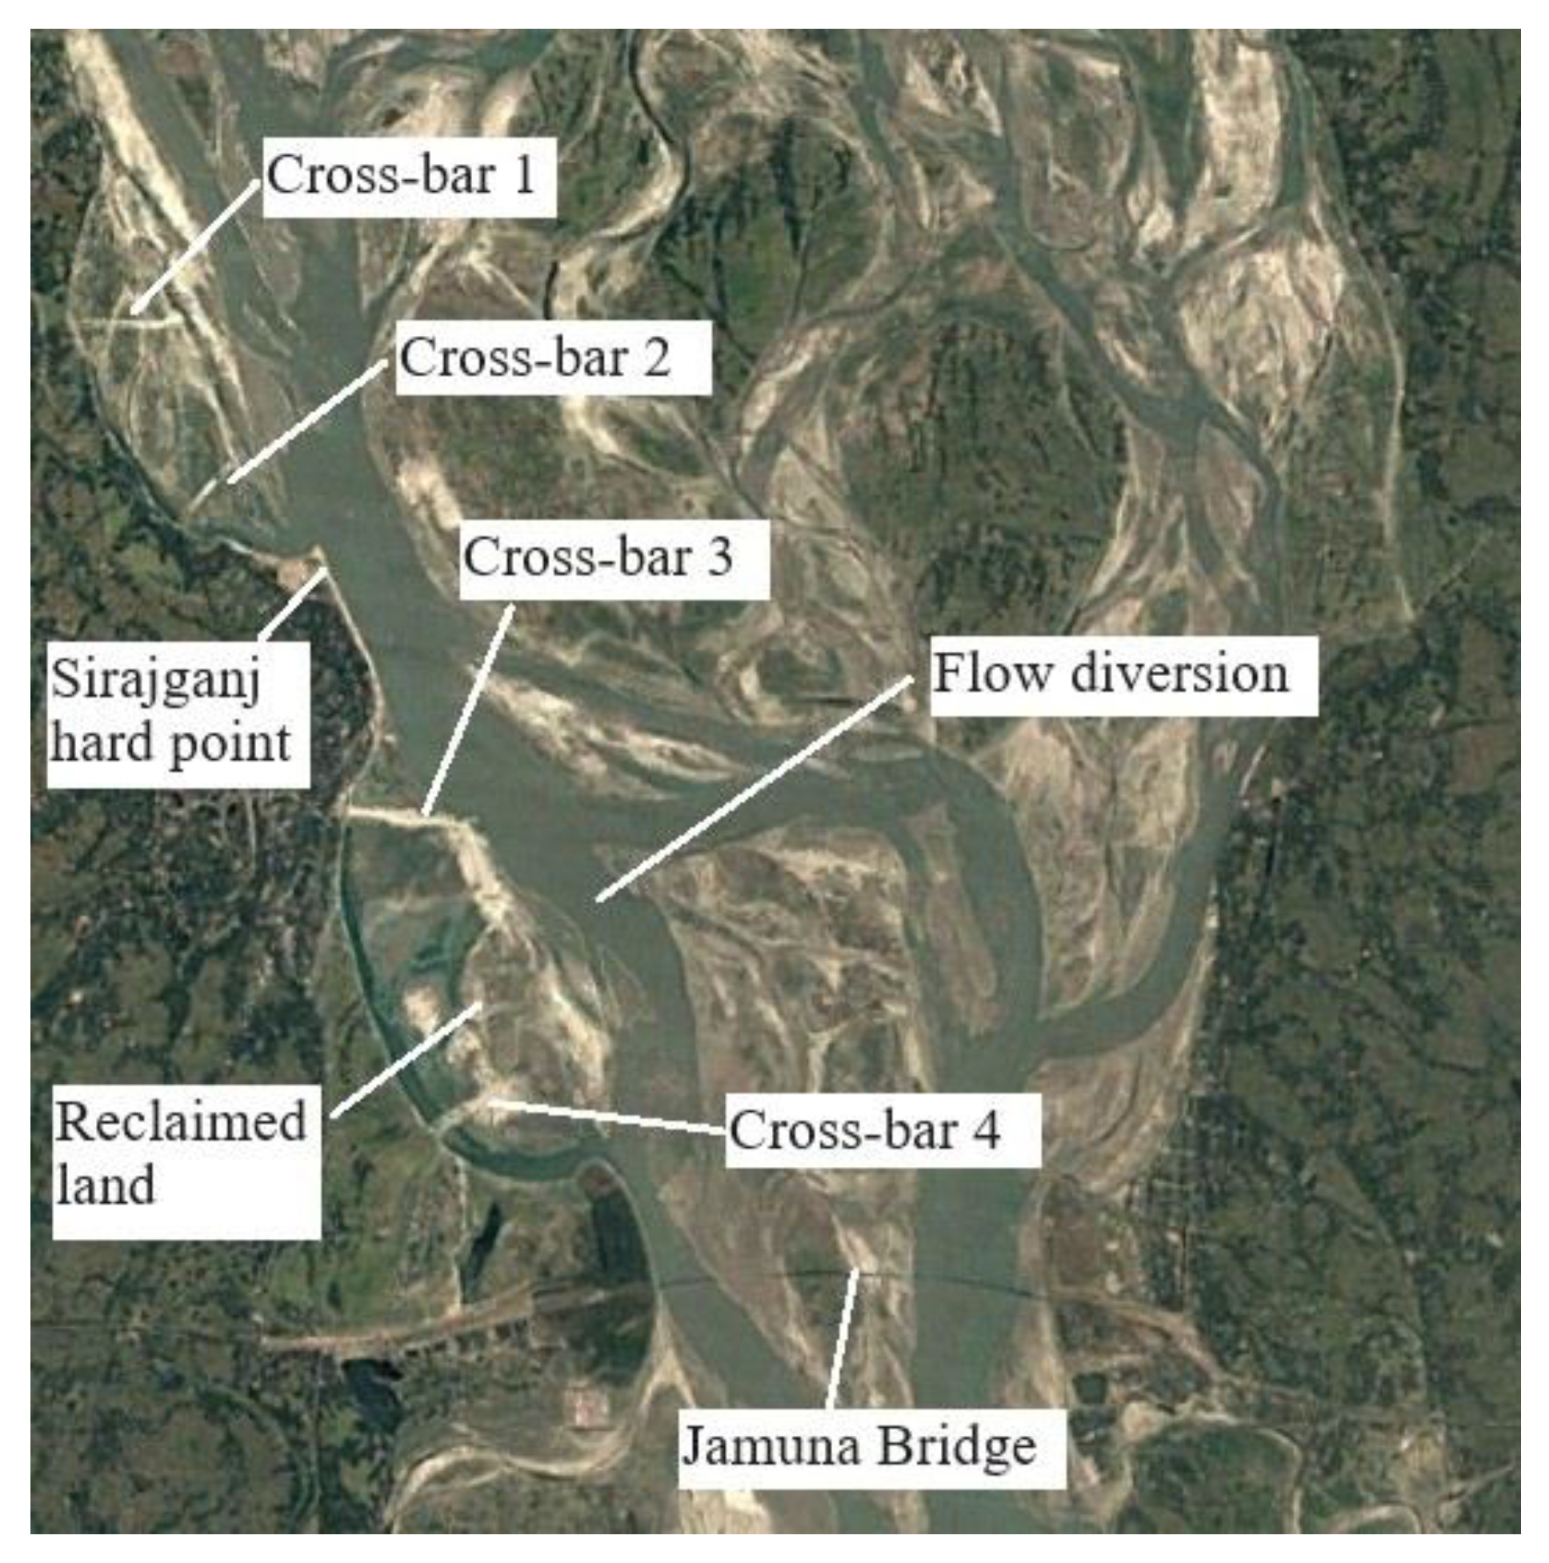
Following the construction of the Jamuna Bridge, persistent erosion occurred both upstream and downstream of the Sirajganj hard point, resulting in partial damage to the revetment. To tackle these challenges, the Bangladeshi Water Development Board (BWDB) strategically implemented the construction of four cross-bars along the right bank of the Jamuna River from 2011 to 2015. Crossbars 1 and 2 were positioned upstream of the hard point, whereas crossbars 3 and 4 were placed downstream (
Figure 6), accompanied by dredging and filling during construction. This intervention led to substantial land reclamation, effectively addressing bank erosion, and transforming reclaimed land into an economic zone. The combined impact of the cross bars and dredging also induced a significant shift in the major channel, diverting it from the right bank and causing substantial morphological changes in the area.
2.4. Evaluation of the past structures
The history of the structures along the Jamuna River reveals a more stable left bank compared to the right bank. The left bank has fewer and more effective structures, whereas the right bank, especially in areas such as Sirajganj, Bogura, and Gaibandha, is vulnerable. Records indicate that the upstream and downstream structures minimally impact the main course of the river, except in the middle section, particularly around Sirajganj. Structures such as the Jamuna Bridge guide bunds, Sirajganj hard point, and four crossbars significantly influenced the river's morphology and channel course. Another observation is that the prevailing structures widely utilized are revetments and groyne-type structures. Revetments are effective in preventing local scouring and occasionally stream closures. However, for safeguarding against riverbank erosion, facilitating land reclamation, and redirecting flow, the most efficacious structure is the groyne. Consequently, several groynes were installed on the Jamuna River. While some have experienced failure or damage, others have proven successful. Therefore, the key consideration lies in evaluating the location, number, and orientation of groynes to ensure sustained positive long-term outcomes.
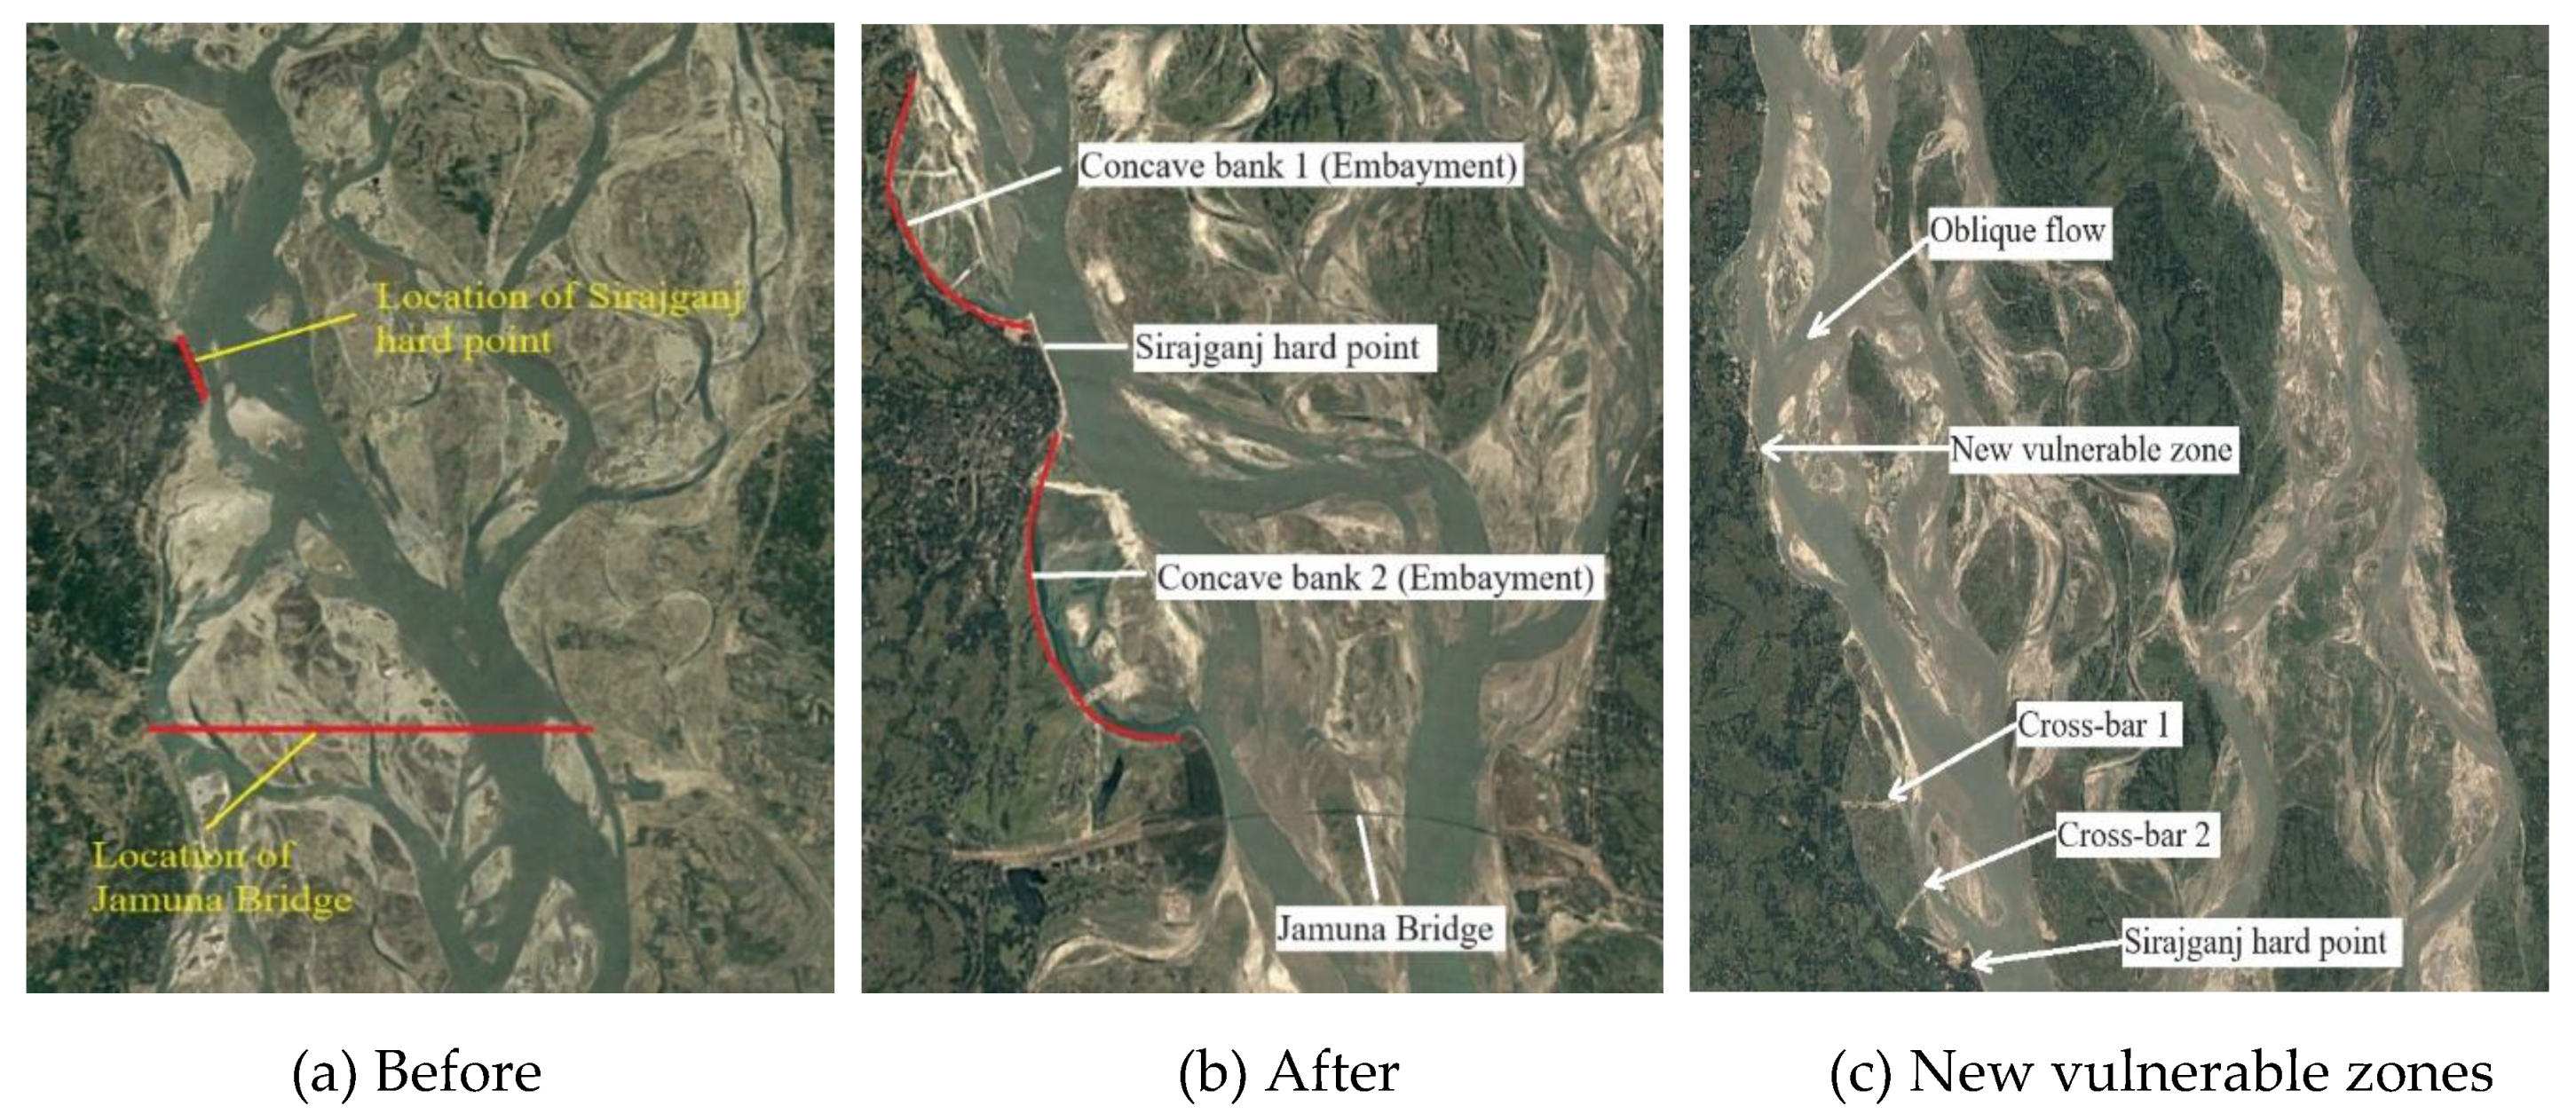
An important discovery here is that, following the construction of the right guide bund and hard point, two concave banks resembling embayments were created due to bank erosion (
Figure 7b). This occurred because the width of the river was reduced by several kilometers during the construction of the bridge guide bund. Consequently, the upstream flow attempts to impact the banks upstream to gain entry, leading to the erosion and formation of these concave banks. For concave bank 1, there is a slightly concave bank immediately upstream from the nose of the hard point. When the hard point is constructed using robust materials, a similar situation occurs with the upstream water current, ultimately causing the riverbank to erode and form a concave shape.
With the completion of the four crossbars, there is a possibility of a new concave bank or the emergence of erosion-prone zones just upstream of cross-bar 1. This potential development arises from the likelihood that crossbar 1 might alter the upstream flow, causing it to impact the upstream bank at an angle and potentially create an additional embayment. Consequently, our goal is to identify the optimal locations for implementing new countermeasures, such as groynes, further upstream from the current cross-bar 1. To accomplish this objective, simulations were conducted using different options to identify the most effective locations.
3. Navigating River Dynamics: Methodology, Modeling, and Strategic Interventions
This study employed a systematic research methodology to address the challenges of river erosion and sandbar movement. The key steps included accurate data collection, numerical modeling using iRIC Nays2DH, defining area-specific boundary conditions, and rigorous calibration and verification by comparing the simulations with real-world data. The methodology explores simulations for new erosion countermeasures and maintains controlled river channel flow. The results were carefully analyzed to optimize the strategies for managing river erosion and sandbar movement.
3.1. Data collection
This study obtained comprehensive bathymetric data for a 50 km stretch of the Jamuna River, encompassing 30 km upstream and 20 km downstream of the Jamuna Bridge. The dataset, which includes a detailed 50-meter by 50-meter digital elevation model (DEM) for the year 2010, played a crucial role in obtaining topographical information. Annual peak discharge data from 1956 to 2021, provided by the Institute of Water Modeling (IWM), served as an essential input for determining upstream boundary conditions. For the downstream boundary, river water levels corresponding to the discharge were incorporated under uniform flow conditions. The utilization of satellite imagery from Google Earth (1995–2018) enabled the capture of long-term changes and trends in the study area.
3.2. Model setup
The analysis in this study employed the numerical modeling software, International River Interface Cooperation (iRIC) [
17]. Among the available packages within the iRIC, Nays2DH was employed for our investigation. The iRIC-Nays2DH possesses robust capabilities for simulating various aspects of river dynamics, including river flow, sediment transport, and riverbed geomorphology [
18]. Depth-averaged continuity and momentum equations were employed in iRIC-Nays2DH, utilizing generalized curvilinear coordinates to apply the simulation to actual river shapes [
19].
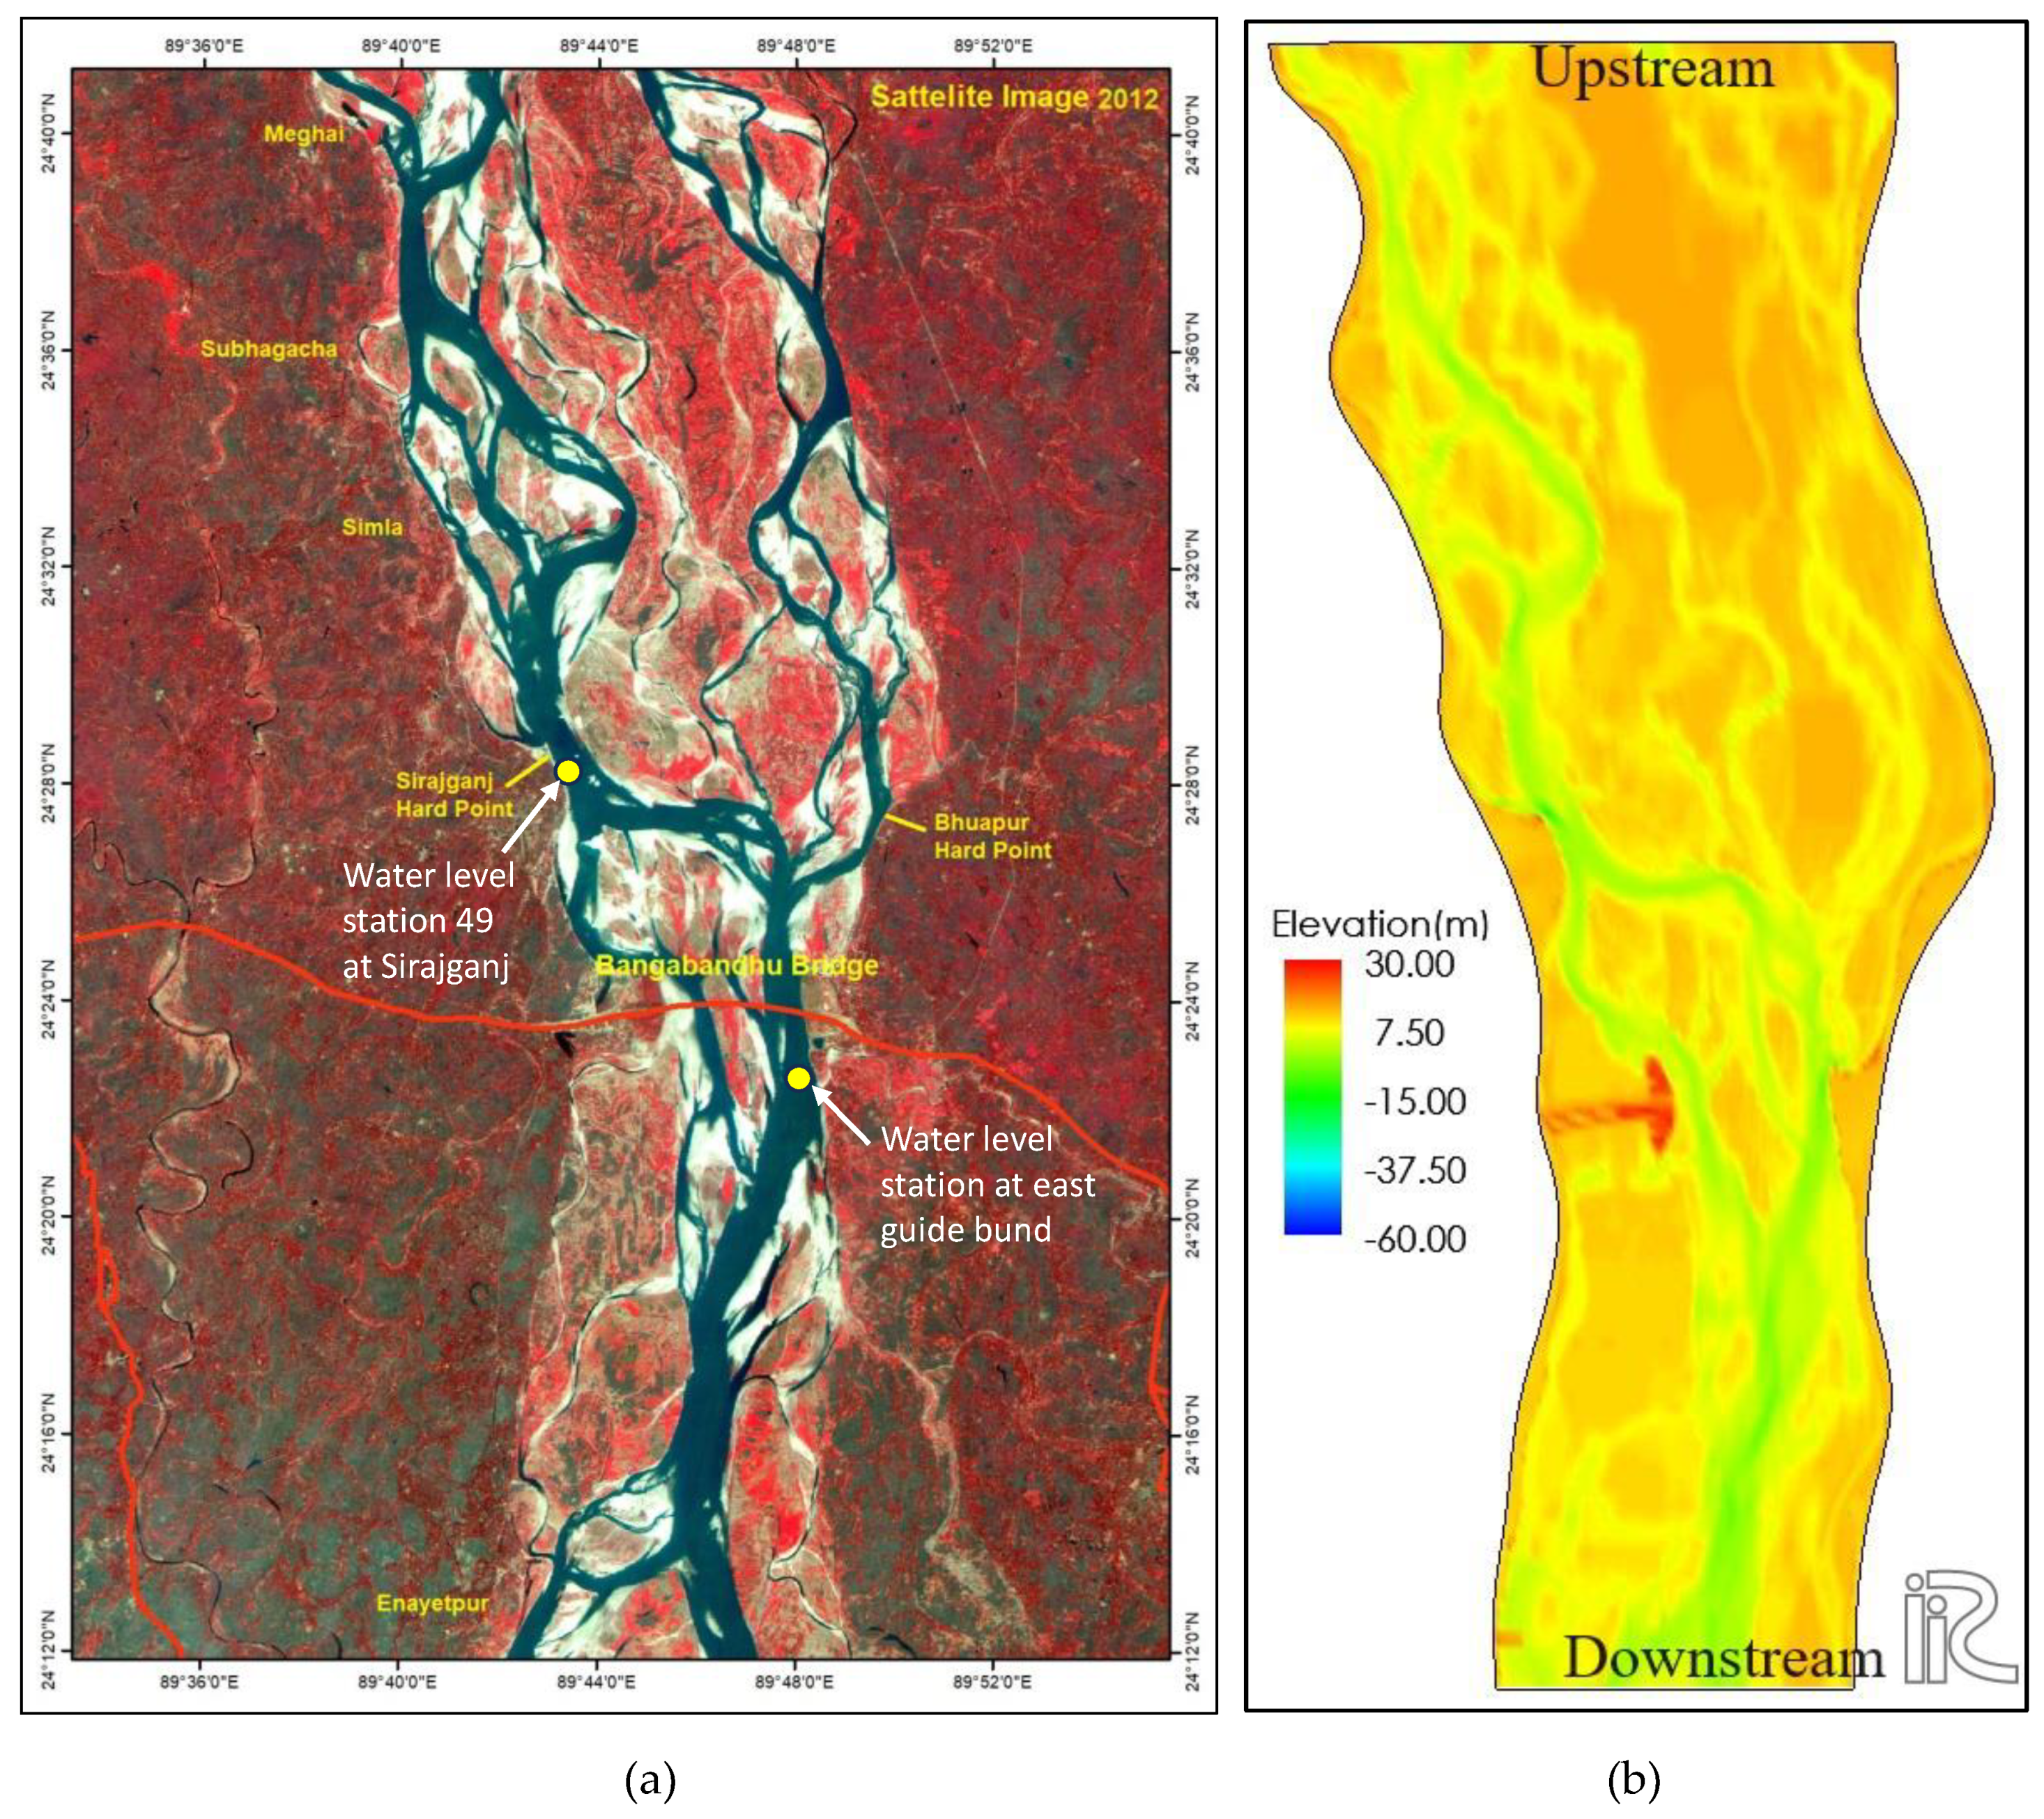
Our study focuses on a 50-kilometer reach of the Jamuna River, featuring two water-level measuring stations (
Figure 8a). To balance computational efficiency and model accuracy, our river model utilized a grid of 701 rows and 301 columns, with each cell measuring 50 m × 70 m. This configuration effectively manages the computational costs without compromising the simulation fidelity. Despite a slight deviation from the 50-meter by 50-meter DEM data in the cell size, no discernible impact was observed on the simulation outcomes.
The calculation conditions were configured for a two-dimensional model following the completion of grid generation and establishment of the initial model bathymetry (
Figure 8b). To facilitate the observation of morphological variations, it is imperative to define both the hydrodynamic and sediment transport parameters. In this phase, an advanced solver incorporating bed-deformation capabilities was employed. The finite differential method for advection terms adopts the upwind scheme selected because of its heightened stability, particularly in the context of large river simulations. The inclusion of supplementary input parameters in the model involves Manning’s roughness coefficient and specifies a uniform bed material with sediment transport characterized by both bed and suspended loads. Specifically, the Ashida and Michiue, Watanabe, and Itakura and Kishi formulas were employed to calculate the bed-load transport, vector of the bed-load transport, and upward flux of the suspended load, respectively [
20].
Examining the historical flood hydrographs of the Jamuna River reveals that peak discharges persisted for more than 24 hours during each flood season [
21,
22,
23,
24]. While an unsteady flow hydrograph is significant for morphological changes in braided rivers, minimal differences in the output morphology are observed between the input hydrograph and a constant peak flow lasting for specified hours, particularly when studying sandbar movements on a large scale [
25]. To efficiently manage the computational load, simulations were conducted for 24 hours at constant discharges, as significant morphological changes primarily occur during peak discharges. The model employs a calculation time step of 0.1 seconds.
3.3. Model calibration and verification
The model's calibration parameters involved determining Manning’s roughness coefficient and the size of the bed material. After employing trial-and-error methods, the value of Manning’s ‘n’ was established at 0.025. The uniform bed material size was set to 0.2 mm, consistent with previously measured data [
26].
To assess the accuracy of the model in simulating water levels, the simulated water levels were compared with the observed data for identical discharges [
27] at two crucial locations within the model domain: station 49 (Sirajganj hard point) and the station near the east guide bund of the Jamuna Bridge (
Figure 8a). This comparison yielded satisfactory results (
Figure 9), as illustrated in the accompanying graphs.
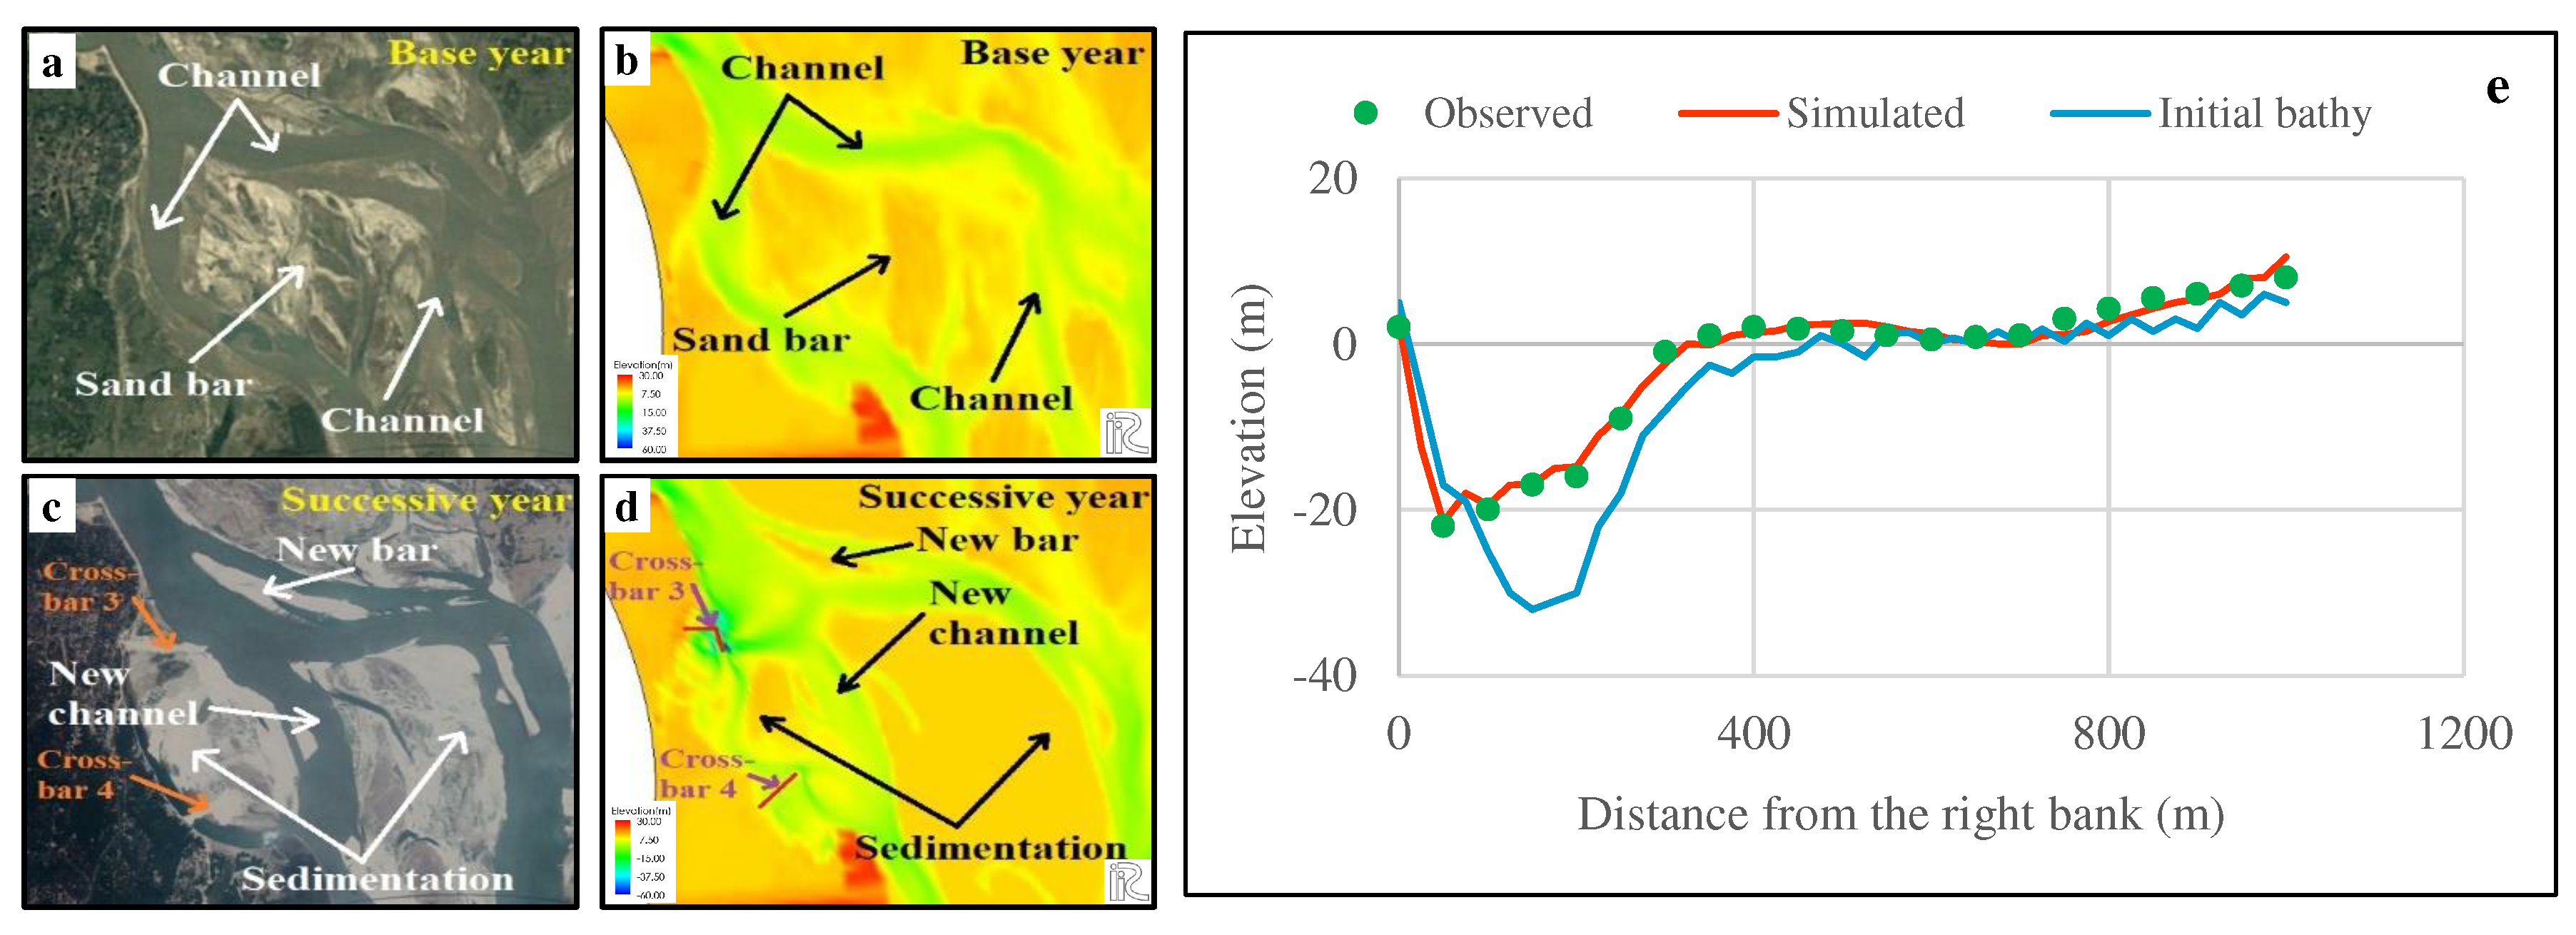
The iRIC Nays2DH software was employed for morphological verification through simulation, incorporating bathymetry data of the Jamuna River and implementing interventions such as cross bars around Sirajganj, dredging, and filling [
28]. The validation utilized a discharge value of 72,661 m
3/s for the upstream boundary derived from post-crossbar installation data (2011-2012). The simulation results were compared with the satellite imagery [
29] post-cross-bar construction, and the results are shown in Figures 10(a-d). Notably, the thickness reduction in the previous channel between crossbars 3 and 4 reduced the erosion susceptibility. Dredging and filling led to the formation of new channels that were accurately replicated in the model. A quantitative comparison at the Sirajganj hard point (
Figure 10e) confirmed the accuracy of the model. The channel shifting, erosion, and deposition patterns were aligned with the observed data, indicating satisfactory morphological verification.
3.4. Options for new countermeasures
In accordance with the discussion presented in
Section 2.4, this study proposes novel countermeasures to fortify riverbank protection upstream of the existing crossbar 1 at Sirajganj. An examination of
Figure 7c reveals a vulnerable riverbank area approximately 6.5 km upstream from crossbar 1, subject to erosion due to oblique flow channel impacts. Therefore, to safeguard against riverbank erosion or fortify bank protection, the installation of new groyne(s) has emerged as a viable measure. The efficacy of both single and series groyne installations has been validated; however, in the context of the Jamuna River, the deployment of multiple groynes in series has demonstrated superior performance compared to singular installations [
20]. This is evident from the successful fulfillment of their purpose by placing two pairs of crossbars in series on both sides of the Sirajganj hard point. In alignment with these findings, our approach involved conducting test cases to install new multiple groynes in series at various locations under diverse circumstances. Subsequently, we observed the resulting output scenarios and engaged in discussions for a comprehensive analysis.
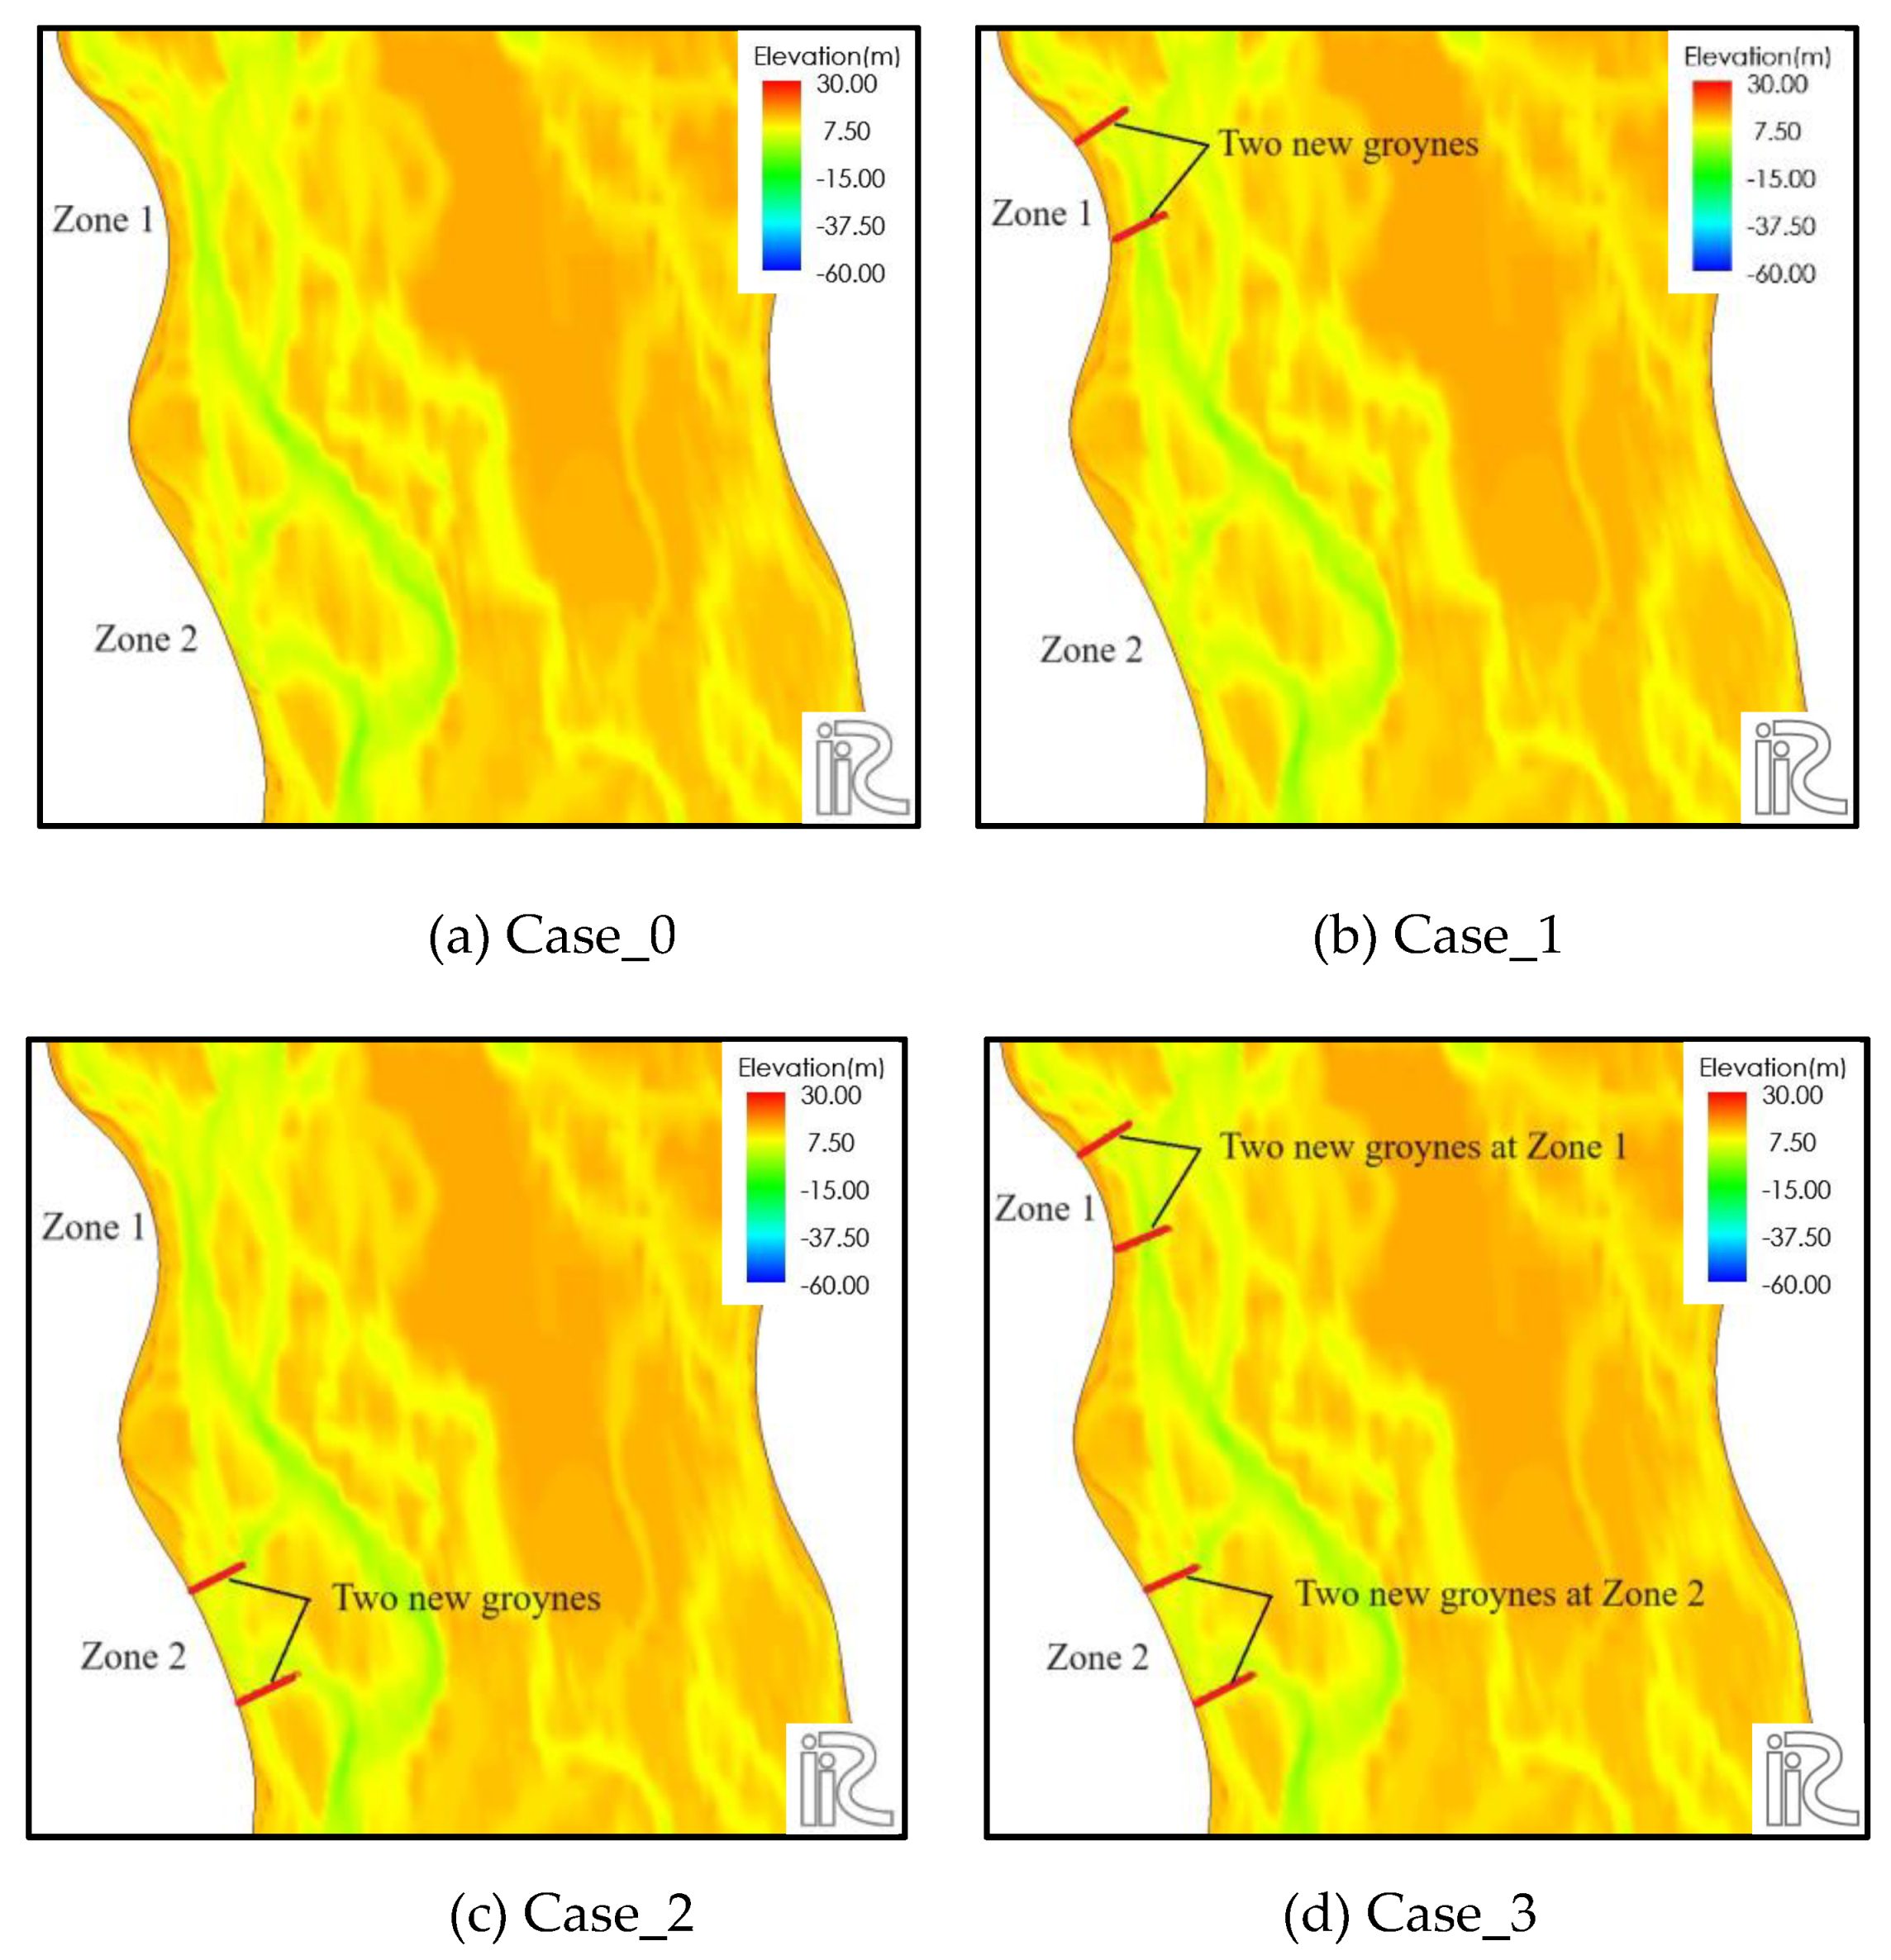
In order to enact the novel countermeasures outlined in this study, we have delineated two appropriate zones based on bathymetric considerations, denoted as Zones 1 and 2. Zone 1 originates around 12.5 km upstream from the existing crossbar 1, extending to a point 18.5 km upstream from the same crossbar, delineated by coordinates starting at Singrabari (465537, 723185) and concluding at Meghai (464235, 728066). Simultaneously, Zone 2 commences 2.5 km upstream from the existing crossbar 1, encompassing an area up to 8.0 km upstream from crossbar 1. Notably, the initiation point for Zone 2 is situated in the Pachthakuri area (468122, 712914), while the termination point is identified in the Subhagacha area (466134, 717550). It is worth highlighting that, based on the findings outlined in section 2.4, Zone 2 has been identified as a region of heightened vulnerability.
Our principal objective is to divert the mainstream flow away from the riverbank, aiming to safeguard the susceptible areas within Zone 2 and mitigate the risk of further erosion in the upstream section. To accomplish this, we strategically deployed new countermeasures in the form of groynes in four cases, strategically positioned in alternating arrangements within Zones 1 and 2, as well as in a combined configuration, tailored to address specific scenarios (
Figure 11).
We assessed the morphological changes through simulations for three scenarios: annual average flood (return period 2.33 years), 100-year return period flood, and 200-year return period flood. Considering the rapid pace of climate change, flood discharge from large rivers can unexpectedly escalate during flood seasons. Hence, we conducted simulations using high flood values, specifically those corresponding to the 100-year and 200-year return periods. Our objective was to observe the outcomes after a 24-hour simulation with peak discharges for the mentioned scenarios, with a particular focus on major sandbar movements, channel shifts, erosion-deposition patterns, and safeguarding of the adjacent vulnerable bank.
To establish the input parameters for the proposed alternatives, historical annual peak discharges of the Jamuna River spanning the last 65 years (1956-2021) were scrutinized. Subsequently, three distinct peak discharges were chosen as input data to simulate the selected stretch of the Jamuna River by employing Gumbel's distribution method, [
30] as outlined in the following
Table 1:
4. Results and discussio
Following the completion of the abovementioned simulations, this section delves into the results pertaining to the morphological changes resulting from the implementation of the new countermeasures. Four cases are simulated, each incorporating three distinct input discharges. In this section, a comprehensive comparison of the output scenarios is conducted with respect to the initial conditions.
4.1. Evaluation of two-dimensional morphological aspects in simulation options
This study encompasses four cases, each comprising three simulations with varying discharges to assess the morphological changes in the river. In the following section, we will systematically evaluate the 2-dimensional morphological aspects for each simulation case.
4.1.1. Morphological assessment for Case_0
For this scenario, the model's baseline condition, without the inclusion of any groynes, was employed. Simulations were conducted for three distinct discharges associated with the average annual flood (70,309 m³/s), the 100-year return period flood (117,941 m³/s), and the 200-year return period flood (126,180 m³/s). The purpose was to assess morphological changes with increasing discharge and identify vulnerable zones through computational analysis.
Figure 12 offers a comprehensive insight into Case_0, presenting the model output for elevation across three distinct discharges without the presence of any groyne. Upon meticulous examination of the output, it was noted that during the annual average flood, there were minimal changes in Zone 1, while new scouring occurred at Zone 2 (
Figure 12a). This observation aligns with previous studies indicating that oblique flow tends to attack the riverbank in certain angular directions (refer to Article 2.4). With an increase in discharge, there is a corresponding rise in erosion around Zone 2, accompanied by slight alterations in the shape of the sandbar just downstream of Zone 2 (
Figure 12b,
Figure 12c).
4.1.2. Morphological assessment for Case_1
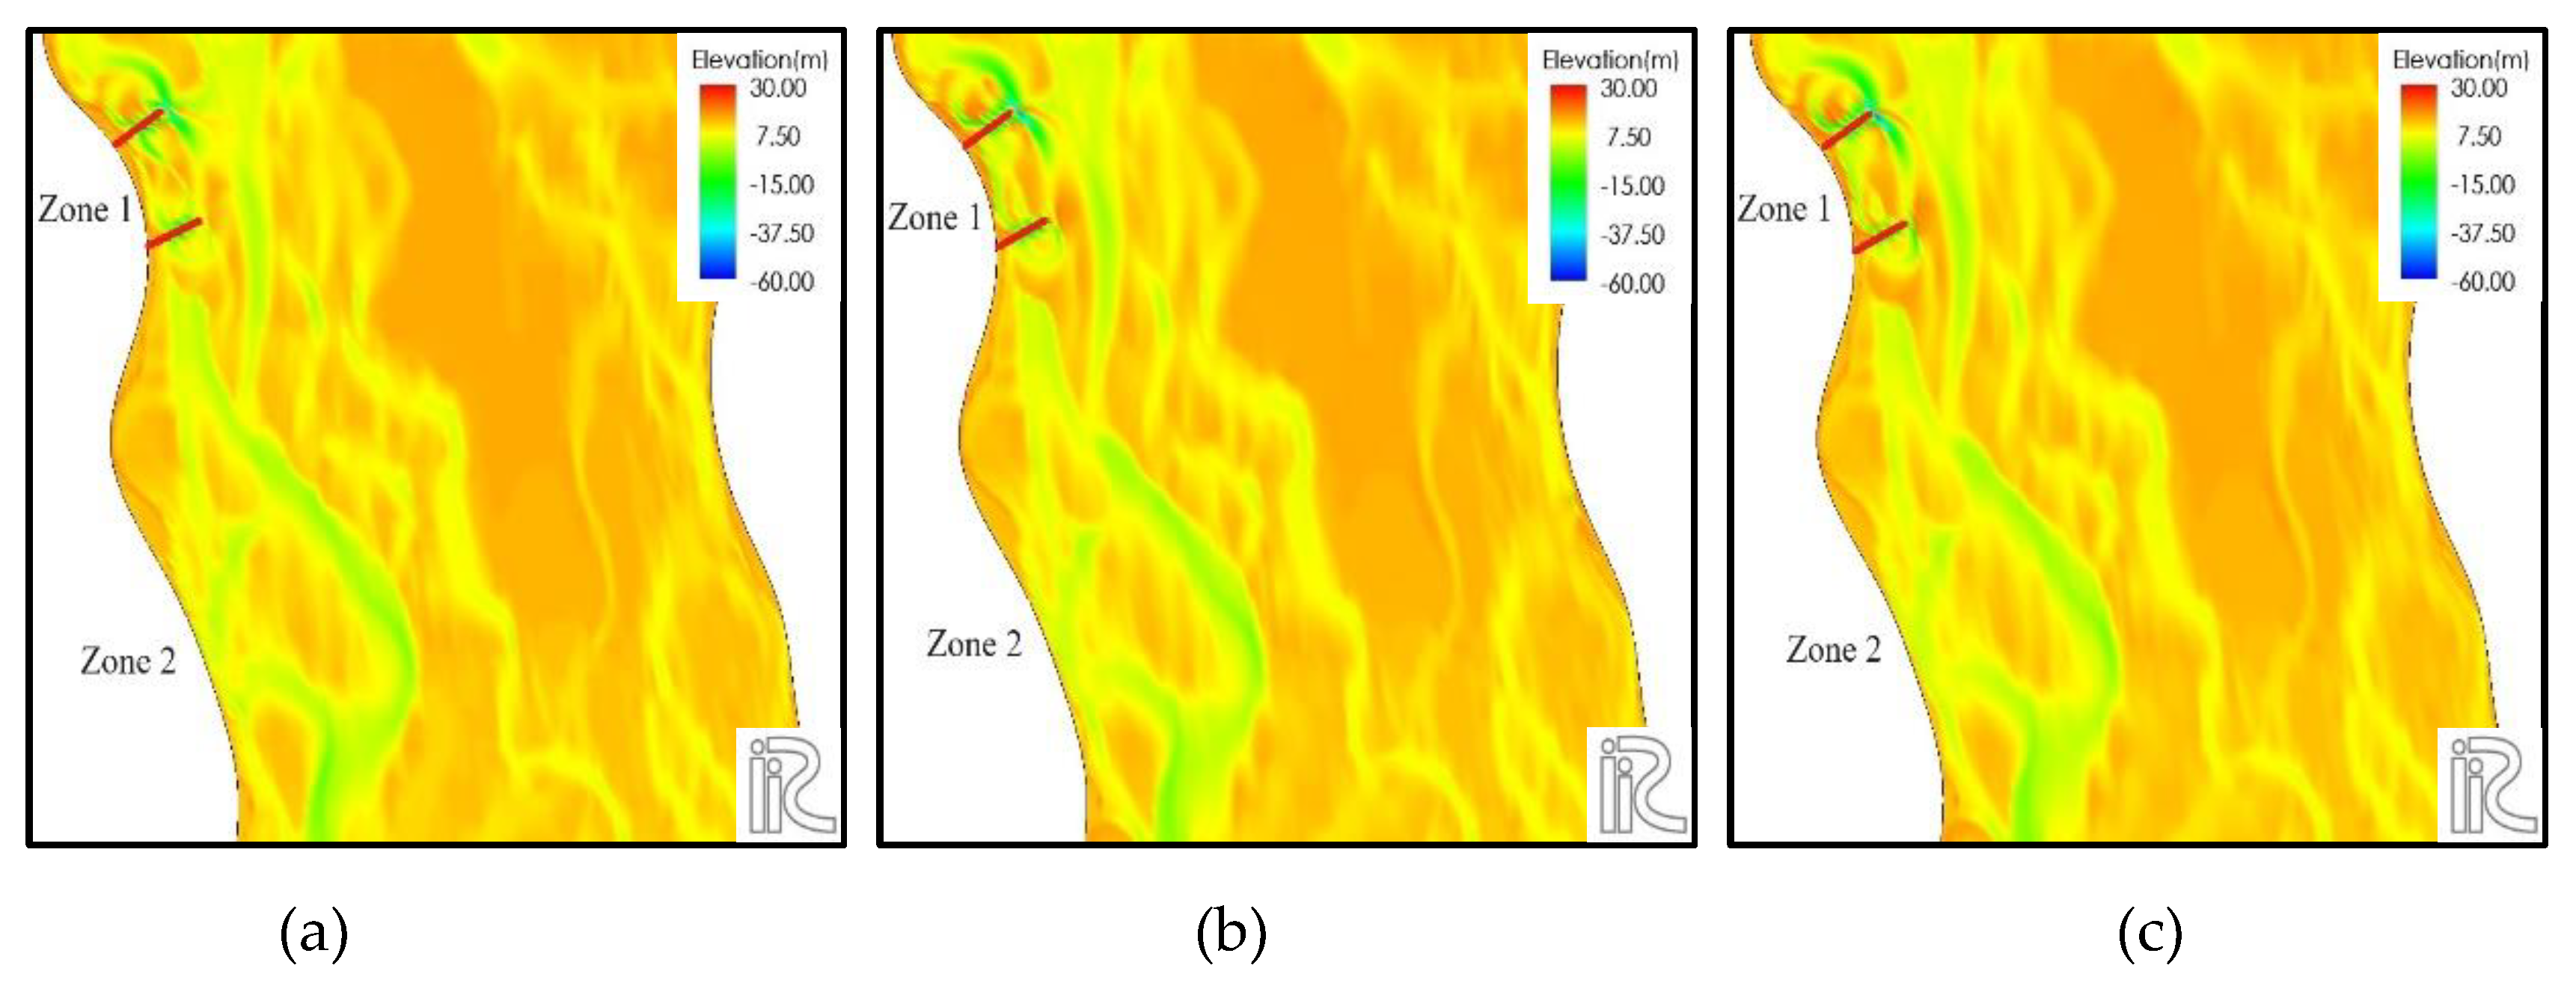
Two groynes were deployed in Zone 1 and subjected to simulations for three distinct discharges corresponding to the average annual flood (70,309 m³/s), the 100-year return period flood (117,941 m³/s), and the 200-year return period flood (126,180 m³/s). The objective was to track the erosion-deposition pattern as discharge increased and identify flow diversion to protect the riverbank.
Figure 13 provides a comprehensive overview of Case_1, presenting the model output for elevation across the three different discharges. Upon closer examination of the output, it was observed that during the annual average flood, turbulent flow induced erosion zones on both sides of the upstream groyne, with discrete deposition zones between the two groynes (
Figure 12a). Notably, there is an issue of concern because one erosion zone extends upstream of the first groyne. In the case of the 100-year flood, the erosion zone expanded, encompassing a larger area around the upstream groyne, and a deposition zone formed downstream of the second groyne (
Figure 12b). In the context of the 200-year flood, the depicted scenarios closely align with those observed in the preceding case, as delineated in
Figure 12c. The erosion-deposition dynamics between the two groynes exhibit noteworthy similarities between the 100-year and 200-year floods but diverge distinctly from the patterns witnessed during the annual average flood. It is crucial to note that throughout these three scenarios, there was no discernible change in Zone 2, the designated vulnerable area. The morphological impacts were primarily concentrated in Zone 1, proving inadequate in redirecting the main flow sufficiently to protect the riverbank in Zone 2.
4.1.3. Morphological assessment for Case_2
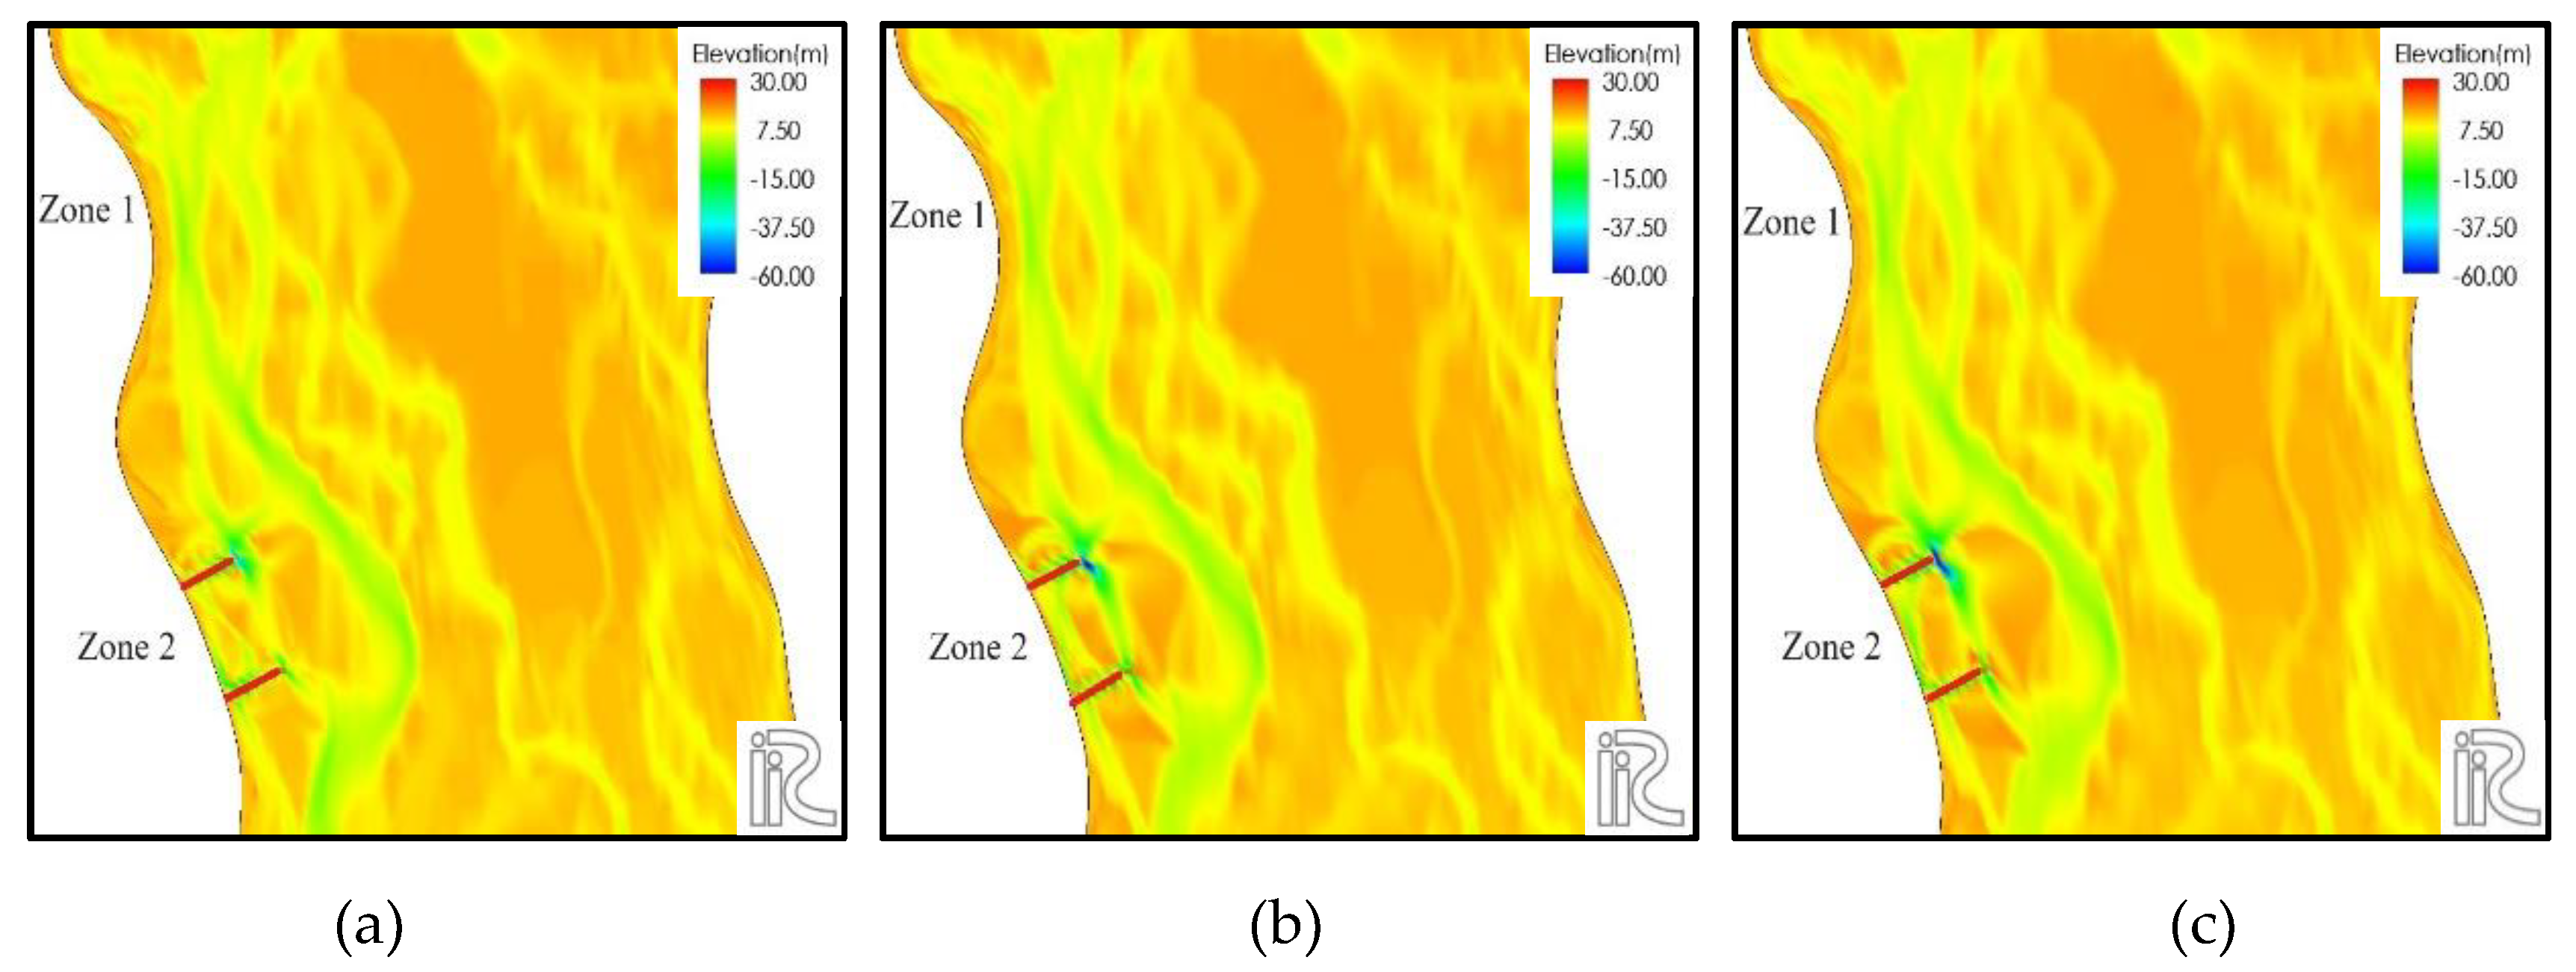
For Case_2, a series of two goyes were installed as a new countermeasure at Zone 2. Similar to the previous case, simulations were conducted for three different discharges, aligned with the average annual flood (70,309 m3/s), 100-year return period flood (117,941 m3/s), and 200-year return period flood (126,180 m3/s).
Figure 14 presents a comprehensive overview of Case 2, illustrating the model output for elevation under three distinct discharge conditions (Figures 14a, 14b, and 14c). In the context of an average annual flood, the incoming flow impacts the nose of the first groyne, diverting it from the riverbank. Simultaneously, the sandbar immediately upstream of the first groyne undergoes thinning, with sedimentation occurring between the two groynes and upstream of the first groyne. The large sandbar positioned at the middle front of the groynes undergoes a shift, altering its shape and moving toward the river center, consequently narrowing the adjacent major channel. During the 100-year flood, the degree of flow diversion intensified, accompanied by the enlargement of the large sandbar at the front. The shape of the sandbar downstream of the second groyne underwent modifications accompanied by additional deposition. The 200-year flood exhibited a pattern similar to that of the 100-year flood, which was characterized by increased flow diversion, sedimentation, and enlargement of the major sandbar. Across all three scenarios, it was evident that the intervention in Zone 2 did not affect Zone 1, with no significant concerns regarding local erosion in Zone 1. Upon comprehensive examination of all simulations in this instance, it is evident that the introduction of the two new groynes effectively redirects the mainstream flow, thereby mitigating the impact on the vulnerable riverbank associated with Zone 2. Notably, there are no significant erosion zones identified upstream of the initial groyne; instead, there are discernible deposition zones in that region.
4.1.4. Morphological assessment for Case_3
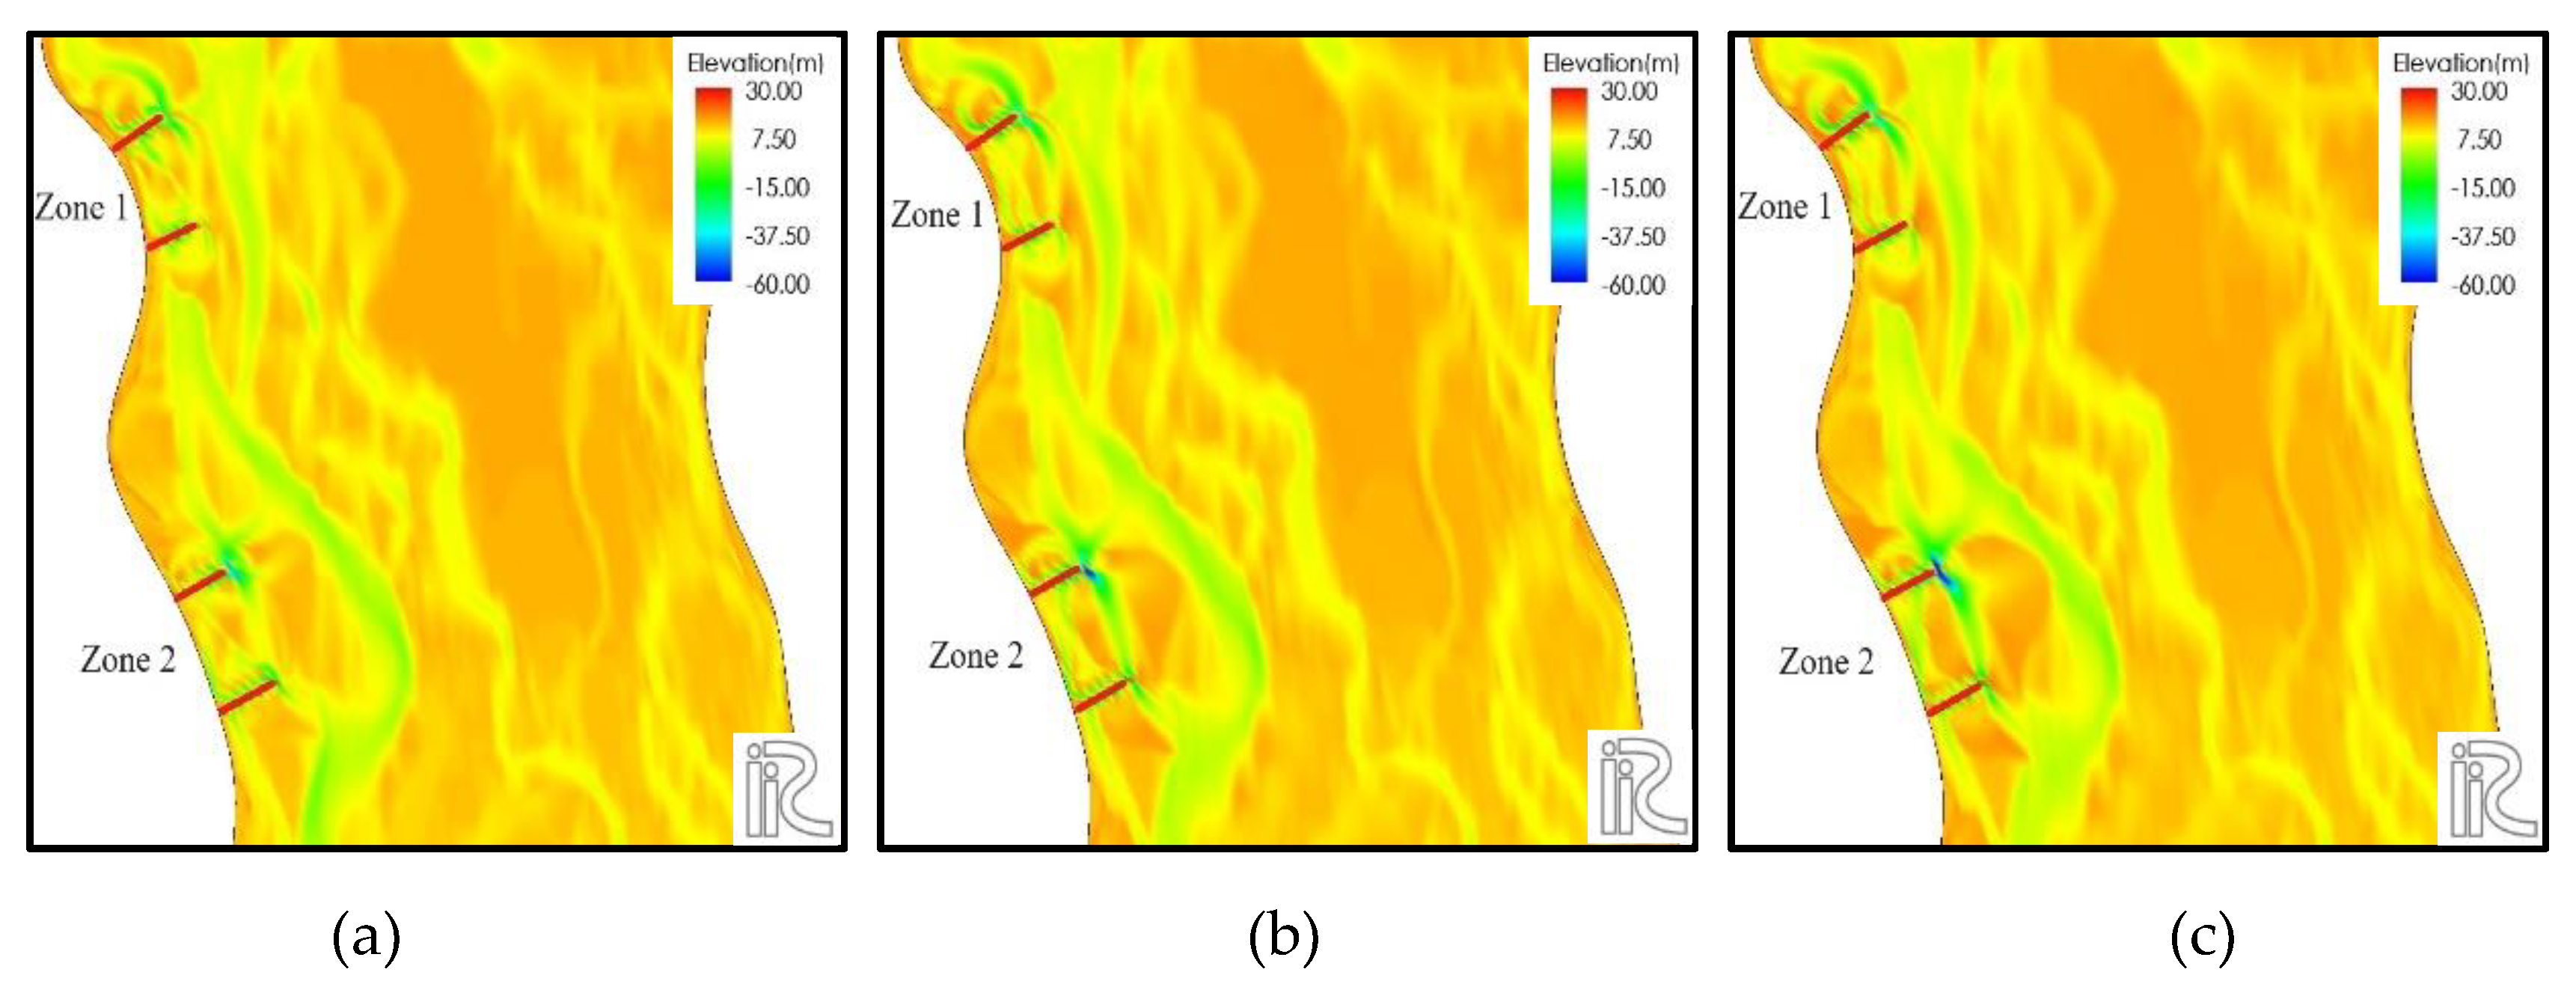
In Case 3, four groynes were installed, combining both zones (Zones 1 and 2) as new countermeasures. Specifically, a series of two groynes was implemented in Zone 1, and another series of two groynes was installed in Zone 2. This step involved the simulation of the combined effects of Cases 1 and 2. Similar to the previous instances, simulations were executed for three different discharges corresponding to the average annual flood (70,309 m3/s), 100-year return period flood (117,941 m3/s), and 200-year return period flood (126,180 m3/s).
Figure 15 shows a thorough examination of Case 3, presenting the model output for elevation under three distinct discharge conditions is illustrated (Figures 15a, 15b, and 15c). In the context of the average annual flood, 100-year flood, and 200-year flood, the output scenarios closely resemble those of the previous cases. Consequently, the effects of the groynes in Zone 1 persisted within its surrounding area, and likewise, the effects of the groynes in Zone 2 were confined to its territory, echoing the patterns observed in Cases 1 and 2. A notable gap existed between the two affected zones, making the length of the river a pivotal factor influencing the combined effect of the groynes installed in different zones. Notably, owing to the absence of a major channel adjacent to the riverbank between these two zones, no groynes were installed in that region. Consequently, for this specific case, the output scenarios exhibited a pattern like that observed previously and were delineated by their respective zones.
4.2. Comparisons of mean bed elevations for the new countermeasures
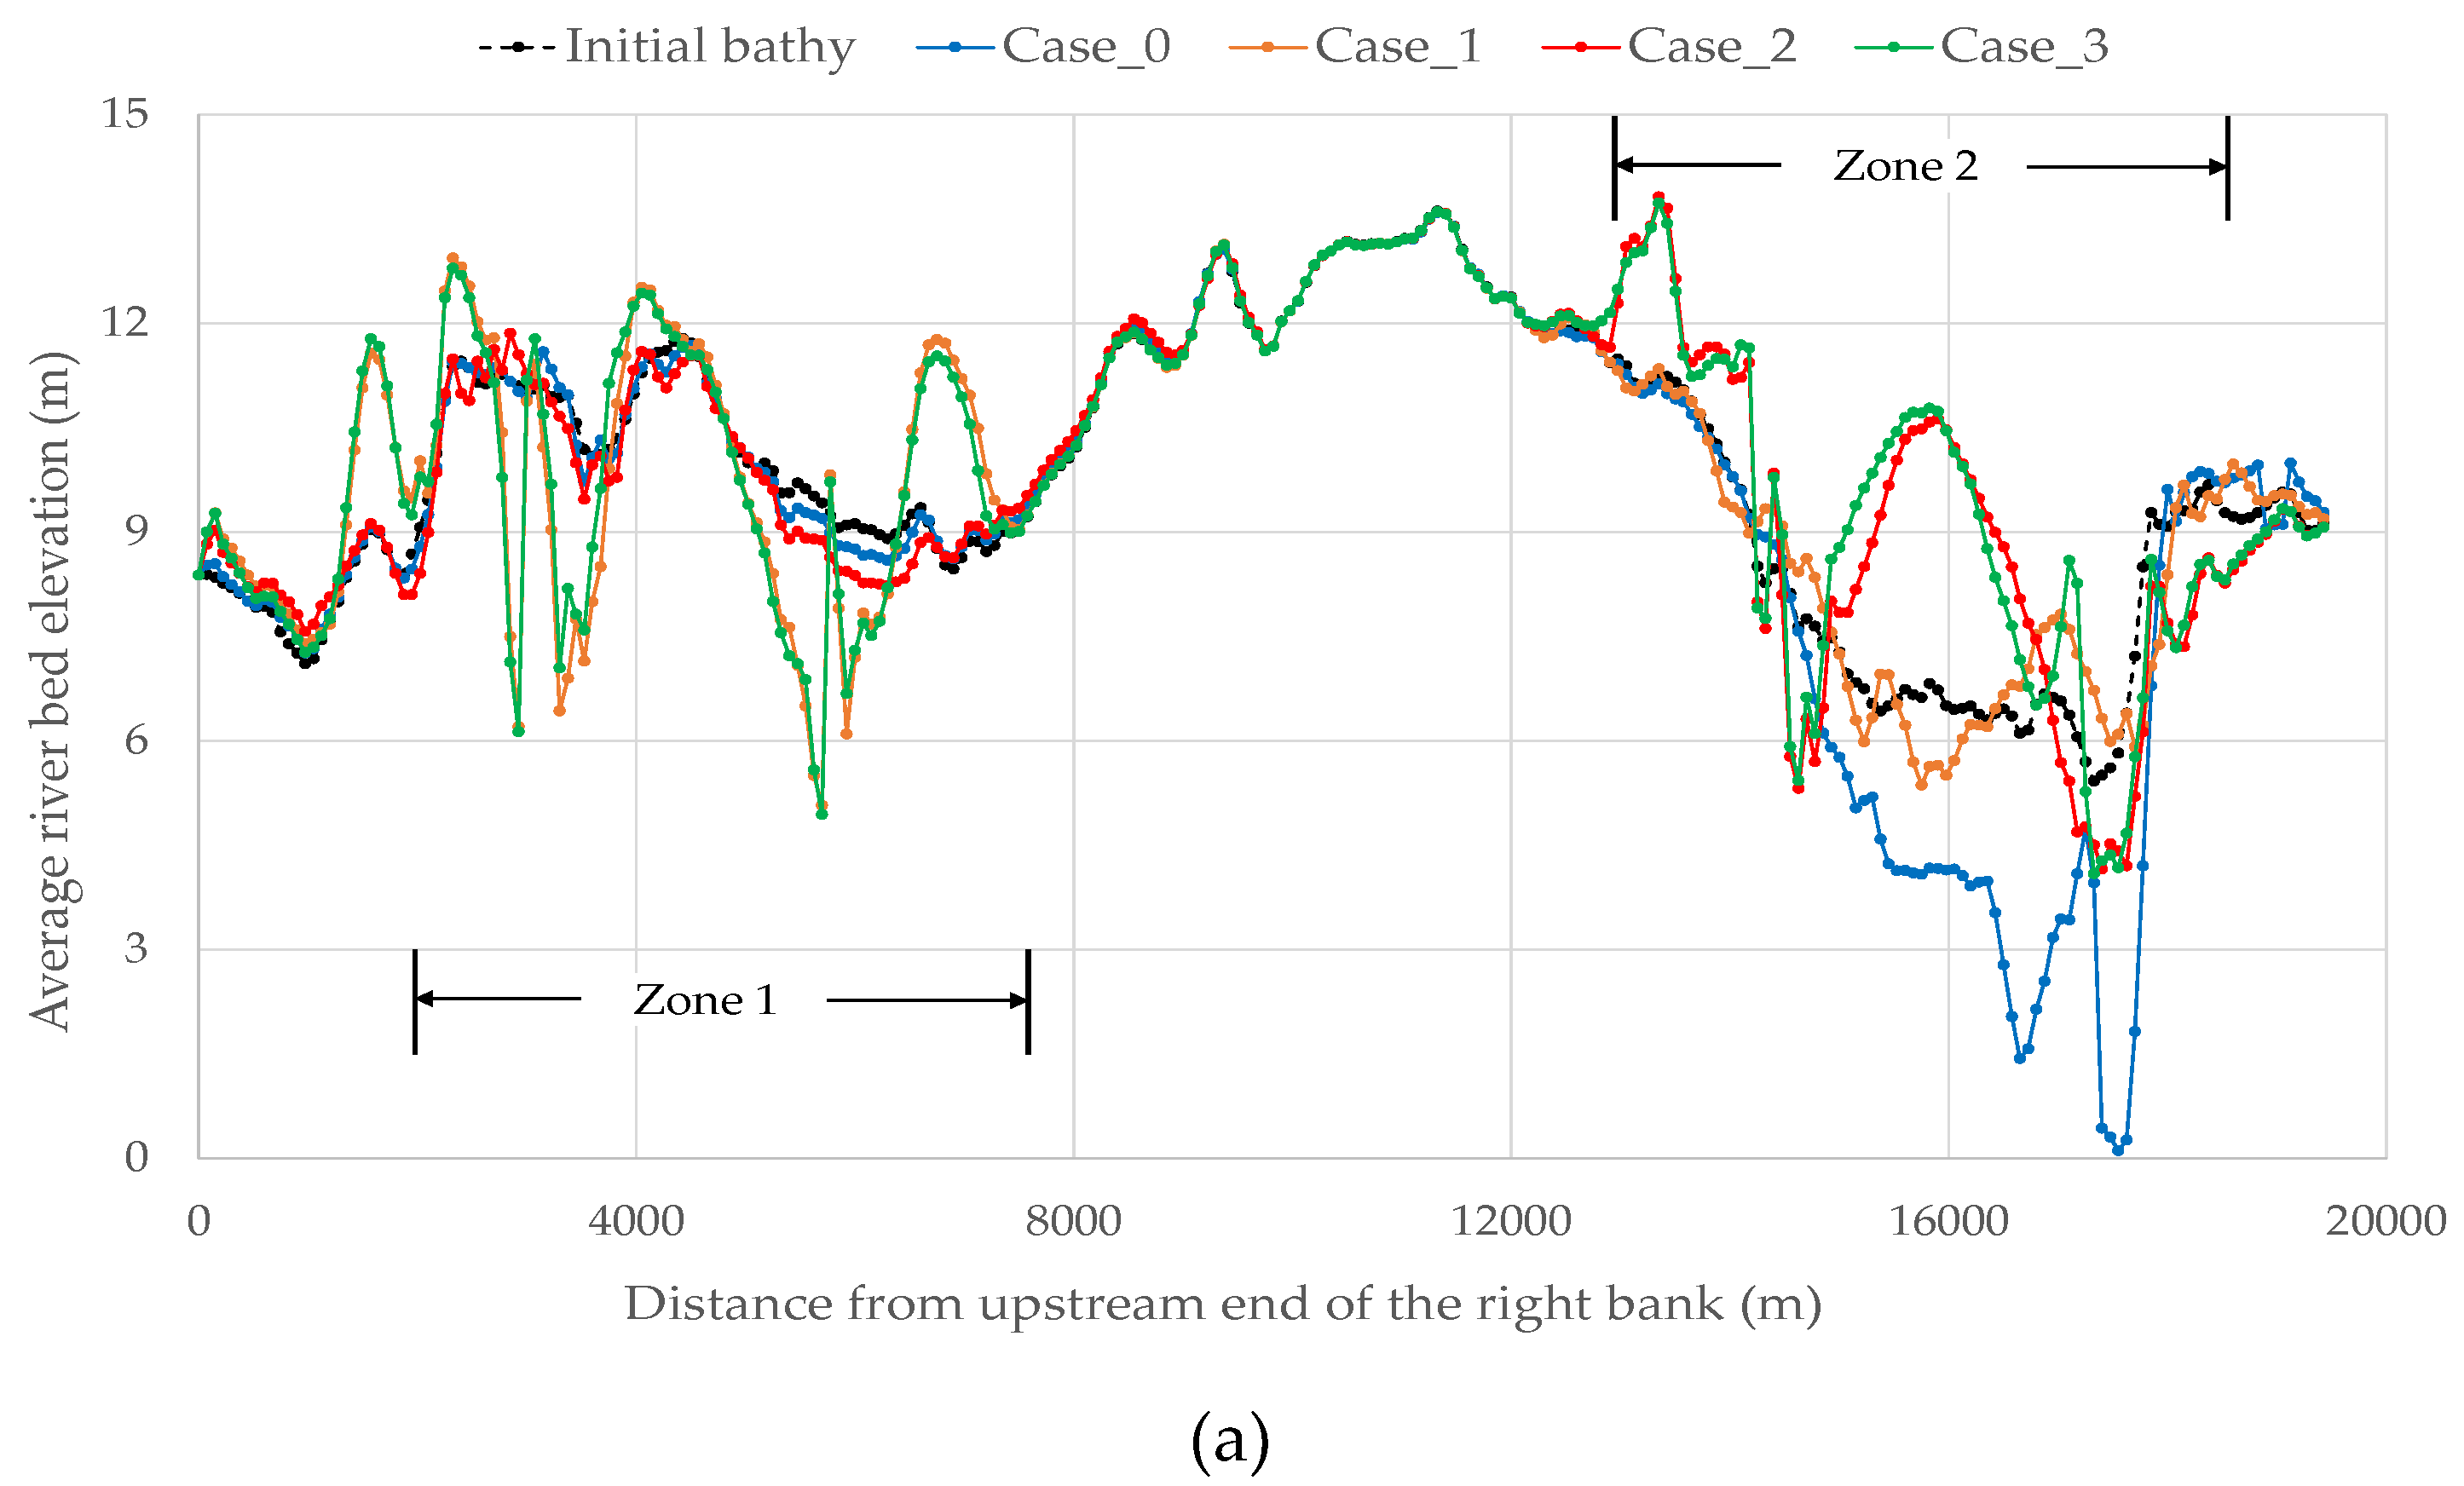
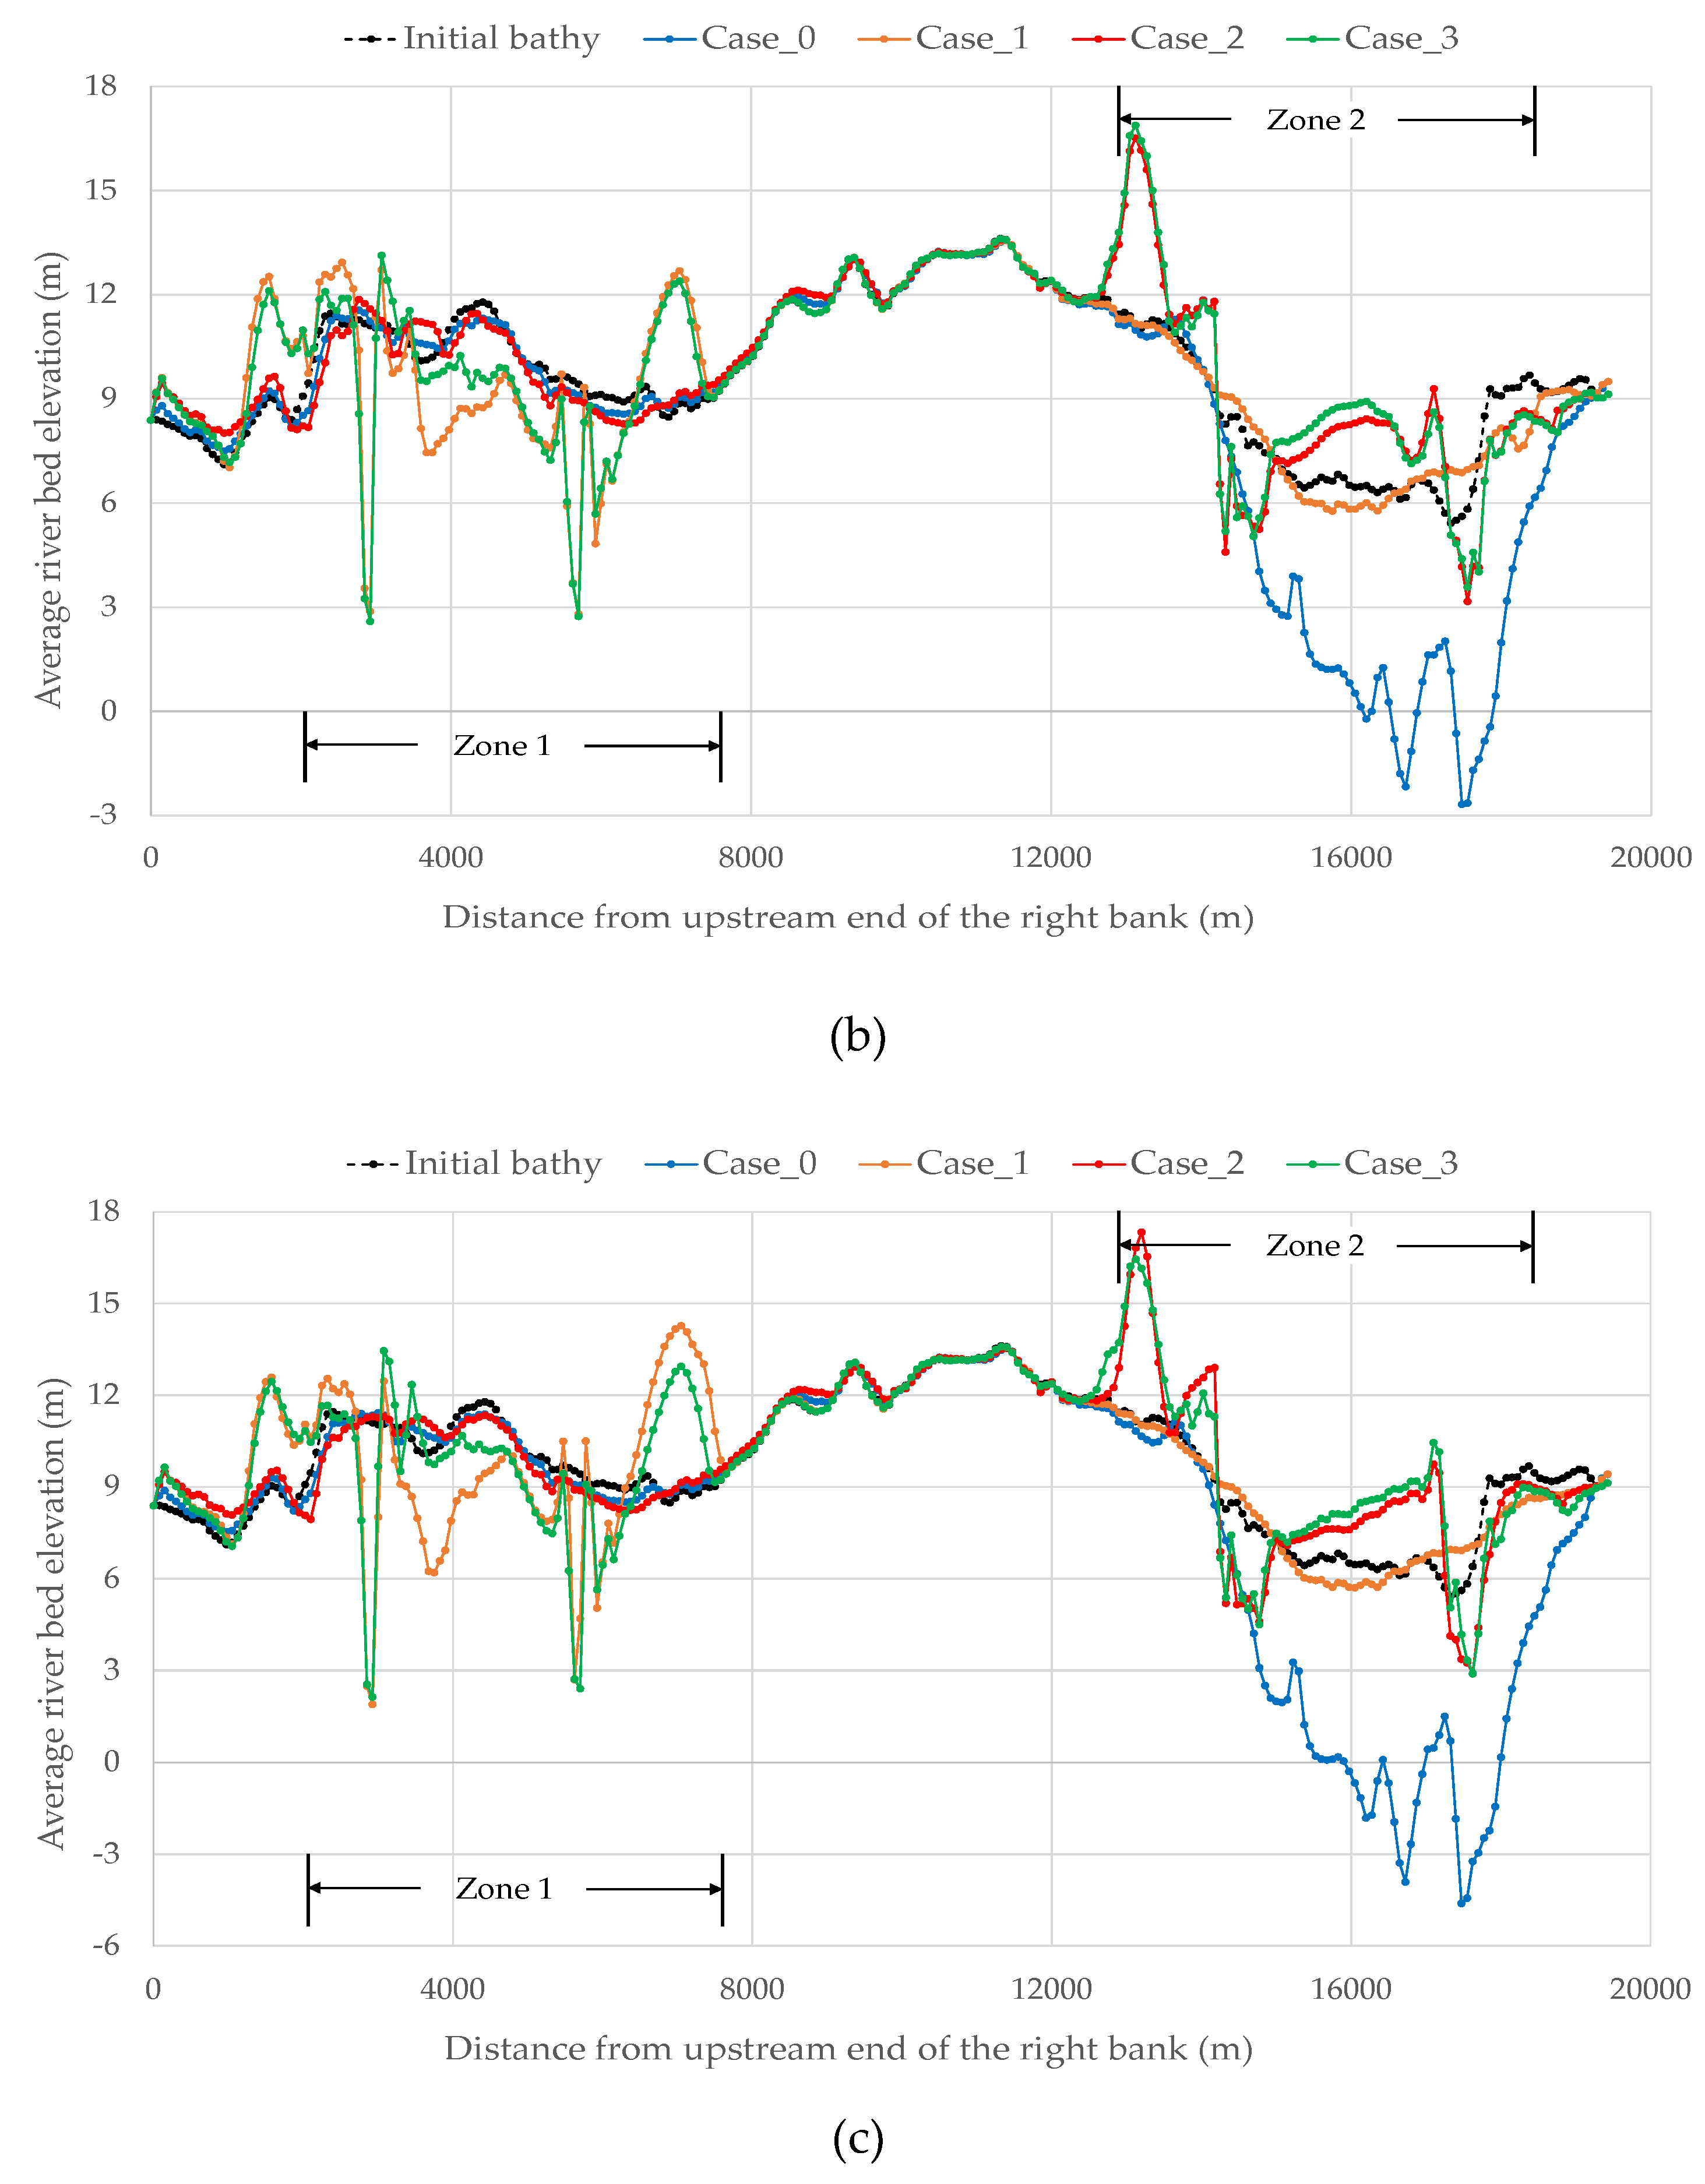
In this section, the average bed elevation is assessed across the cases to quantify the vulnerability and protection of the riverbank resulting from the implementation of new countermeasures. Given the challenge of displaying sectional bed elevations along the entire riverbank, a representative strip was chosen for averaging the bed elevation. The strip's width was approximately half of the groyne length (700 m). This comparative analysis serves to quantify erosion and sedimentation zones near the bankline, providing valuable insights into identifying suitable countermeasures in this stretch of the river.
Figure 16 provides an exhaustive overview of average bed elevation alterations in close proximity to the right bank. Specifically, Figures 16a, 16b, and 16c delineate the fluctuations in average bed levels resulting for each case considering annual flood discharge (70,309 m³/s), 100-year flood discharge (117,941 m³/s), and 200-year flood discharge (126,180 m³/s), respectively. The average bed elevation near the bank enables a comprehensive analysis of erosion-deposition patterns along the riverbank.
In Case_0, the figures illustrate significant erosion occurring around Zone 2, and this erosion intensifies with higher discharges. The impacted erosion zone extends approximately 2.0 km along Zone 2 and continues to expand with increasing discharge. In contrast, there is minimal change in bed elevation at Zone 1 for this particular case. This quantitative analysis makes it evident that, under critical high discharge conditions, Zone 2 is more vulnerable than Zone 1.
For Case_1, all three figures demonstrate the presence of two prominent erosion zones flanking the two groynes in Zone 1. This phenomenon may be attributed to the alignment of the adjacent channel and the configuration of the convex bank of the river. Notably, in the case of the annual average flood, a modest deposition zone is discernible between the groynes; however, in the context of the other two flood scenarios, erosion predominantly governs the dynamics of this intermediate zone, overshadowing any deposition tendencies. In this instance, there is a modest impact in Zone 2, resulting in a reduction in the amount of erosion compared to Case_0. This effect may be attributed to the discontinuity of one channel created by the groyne insertion at Zone 1 (refer to
Figure 13). However, it is noteworthy that despite this improvement, Case_1 does not represent a fully efficient option for the comprehensive safeguarding of the riverbank.
In this analysis, a noteworthy observation is the presence of two significant deposition zones—one upstream of the first groyne and the other situated between the two groynes, aligning closely with the characteristics of the natural scenario. The quantity of deposition at the upstream portion increases with higher input discharge. Regarding thearea between the groynes, the deposition varies across simulations. Remarkably, from the upstream end up to the commencement of Zone 2, the average bed elevation remains relatively stable. The quantitative data also indicates that there is minimal impact on Zone 1 due to the presence of these groynes. However, it is notable that two minor erosion zones are observed adjacent to the groynes. Two potential causes for these erosion zones are postulated. Firstly, it is suggested that water circulation between the two groynes may induce some erosion in that location. Secondly, the two-dimensional nature of the software may contribute, as the groynes are modeled as obstacles with sharp edges, leading to erosion as the flow navigates around them. It is essential to note that this erosion occurs over the entire 700-meter width of a lengthy channel strip. Previous experience suggests that such small erosions, when averaged over the channel width, do not significantly impact the bankline.
Case_3 is the combination of the Case_1 and Case_2. The results also show the similar pattern as the previous. The figures reveal two prominent erosion zones flanking the Zone 1 groynes, attributed to channel alignment and riverbank convexity. During the annual average flood, a modest deposition zone appears between groynes, but in other floods, erosion prevails, overshadowing deposition. For Zone 2, upstream of the first groyne and between the two groynes, noteworthy deposition zones align with natural patterns, intensifying with higher discharge. The groynes minimally impact Zone 1, causing two minor erosion zones, potentially due to water circulation and software limitations. These erosions, averaged over the 700-meter channel width, align with past experience, showing minimal impact on the bankline.
4.3. Review and analysis of results across all simulation cases
Upon scrutinizing the four aforementioned cases, it becomes evident that the Zone 2 is vulnerable to erosion due to higher dicharge conditions rather than Zone 1. When groynes were installed alone in Zone 1 (Case_1), it was found to be effective in suppressing erosion in the vulnerable Zone 2, but not to the extent of causing sedimentation and protecting the banks in Zone 2. This was attributed to the lack of impact in the vulnerable areas near Zone 2. Consequently, effective measures for riverbank erosion protection can be found in Cases_2 and 3. In Case_2, the groynes successfully diverted oblique flow away from the riverbank, enhancing bank safety and establishing a sedimentation zone between them and also the upstream area. The upstream and downstream sides of the groynes remained relatively risk-free owing to deposition, although severe erosion near the toe of the groynes was observed during increased discharge under extreme conditions. This study places significant emphasis on the morphological changes in sandbars and channels as pivotal factors in safeguarding vulnerable banks. Further investigation is warranted to ensure the protection of groynes, encompassing considerations such as material properties and construction methods.
For Case_3, a combination of the previous two cases proved effective in safeguarding the riverbank. However, because there was no combined effect of the two zones, installing groynes in Zone 1 in this case would be deemed uneconomical or overdesigned. Without groynes, the riverbank in Zone 1 remained free from erosion risks. Consequently, Case 2 proved to be the most effective in achieving the desired outcomes. In this study, the length and spacing of the groynes were selected based on previous studies [
31,
32]. Given the various considerations involved in groyne installation, further studies are essential, including an examination of the length variations and spacing configurations. Such a comprehensive approach is expected to produce more precise results, thereby enhancing the achievement of the study objectives.
5. Conclusions
This study provides a comprehensive examination of riverbank protection strategies along the Jamuna River in Bangladesh, focusing on the morphological consequences of various implemented structures. The complex braided pattern and history of erosion, sedimentation, and channel shifts in the Jamuna River pose significant challenges, necessitating effective countermeasures. This study extensively reviewed past structures, including revetments, guide bunds, and groyne-like structures, and evaluated their effectiveness in mitigating riverbank erosion. Notable structures, such as the Titporal Revetment, Bhuapur Hard Point, Sirajganj Hard Point, Betil and Eneyetpur spurs as well as Cross-bars at Sirajganj are discussed, highlighting both successful and less effective initiatives. The evaluation revealed the relative stabililty of the left bank compared to the right, emphasizing the importance of groyne-type structures in redirecting flow and preventing erosion.
The methodology section outlines a systematic approach employing numerical modeling (iRIC Nays2DH) to assess the morphological impacts of new countermeasures. The data collection, model setup, calibration, and verification processes were detailed to ensure the accuracy and reliability of the simulations. This paper presents the results of three simulated scenarios, each involving the installation of groynes in different zones. Morphological assessment demonstrates that installing groynes alone in Zone 1 (from Singrabari to Meghai) is ineffective in safeguarding vulnerable banks in Zone 2 (from Pachthakuri to Subhagacga). However, the installation of groynes in Zone 2 proved successful in diverting oblique flows, reducing erosion risks, and shaping the sandbars. Although the combined approach in Case_3 was effective, it was deemed uneconomical for Zone 1, where no significant erosion risk existed. This discussion emphasizes the importance of morphological changes, specifically the redirection of flow and sedimentation patterns, in achieving effective riverbank protection. Case_2, involving groynes in Zone 2, emerged as the most suitable and economical solution for mitigating riverbank erosion along the Jamuna River. This study also acknowledges the need for further research to explore variations in groyne length and spacing configurations for more precise results.
In summary, this study provides valuable insights to enhance riverbank protection strategies in the Jamuna River, underscoring the significance of groyne-type structures and the necessity for a holistic understanding of the morphological dynamics for sustainable solutions. These findings can guide future river management practices, aiding in the implementation of effective countermeasures to address the challenges posed by dynamic river systems.
Author Contributions
Conceptualization, writing-original draft, M.Z.H.; Investigation, M.Z.H and Y.T; writing-review & editing, Y.T. All authors have read and agreed to the published version of the manuscript.
Funding
Please add: This research is funded by the Ministry of Education, Culture, Sports, Science and Technology (MEXT), Japan.
Acknowledgments
The authors extend their gratitude to the Bangladesh Water Development Board (BWDB) and Institute of Water Modeling (IWM) for their substantial assistance in data collection. Appreciation is also conveyed to the Hydraulics laboratory of Nagoya University, Japan for facilitating the optimal environment for this research.
Conflicts of Interest
The authors declare no conflict of interest.
References
- Jiongxin, X. Evolution of Mid-Channel Bars in a Braided River and Complex Response to Reservoir Construction: An Example from the Middle Hanjiang River, China. Earth Surface Processes and Landforms, 1997, 953-965. [CrossRef]
- Williams, R.D; Rennie, C.D.; Brasington, J.; Hicks, D.M.; Vericat, D. Linking the spatial distribution of bed load transport to morphological change during high-flow. Journal of Geophysical Research: Earth Surface, 2015, 604-622. [CrossRef]
- Omar, P.J.; Rai, S.P.; Tiwari, H. Study of morphological changes and socio economic impact assessment: a case study of Koshi River. Arabian Journal of Geosciences, 2022, 1-15. [CrossRef]
- Baki, A.B.M.; Gan, T.Y. Riverbank migration and island dynamics of the braided Jamuna River of the GangeseBrahmaputra basin using multi-temporal Landsat images. Quaternary International, 2012, 148-161. [CrossRef]
- Marra, W.A.; Kleinhans, M.G.; Addink, E.A. Network concepts to describe channel importance and change in multichannel systems: test results for the Jamuna River, Bangladesh. Earth Surface Processes and Landforms, 2014, 766-778. [CrossRef]
- Sarker, M.H.; Thorne, C.R.; Aktar, M.N.; Ferdous, M.R. "Morpho-dynamics of the Brahmaputra–Jamuna River, Bangladesh," Geomorphology, 2014, 45-59. [CrossRef]
- Khan, N.I.; Islam, A. Quantification of erosion patterns in the Brahmaputra-Jamuna River using geographical information system and remote sensing techniques. Hydrol. Process., 2003, 17, 959-966. [CrossRef]
- Khan, I.; Ahammad, M.; Sarker, S. A study on River Bank Erosion of Jamuna River using GIS and Remote Sensing Technology. International Journal of Engineering Development and Research, 2014, 2, 3365-3371.
- Saker, M.H; Akter, J; Ferdaous, M.R. River bank protection measures in the Brahmaputra-Jamuna River: Bangladesh Experience. In International Seminar on River, Society and Sustainable Development, Dibrugarh University, India, 2011.
- Rahman, M.M.; Kamal, M.A.H.M.; Rahman, M.M. Functioning Hydraulic and Morphological Sustainability of River Training Works in Bangladesh. Journal of Civil Engineering and Architecture, 2013, 7, 756-766.
- Khan, N.S.; Roy, S.K.; Mazumder, M.T.R.; Talukdar, S.; Mallick, J. Assessing the long-term planform dynamics of Ganges–Jamuna confuence with the aid of remote sensing and GIS. Natural Hazards, 2022, 114, 883-906. [CrossRef]
- Uddin, M.J.; Jujuly, M.M.; Hossain, M.M.; Rahman, D.A. Applicability of Reinforced Concrete Spurs in River Bank Protection: A Case Study in Bangladesh. In International Multidisciplinary Scientific GeoConference SGEM, 2011.
- Rahman, S.; Lasker, M.S.; Islam, M.N. River Training Program and Hydro Morphological Dynamics: A Case Study of Bangabandhu Bridge at Jamuna River. The Jahangirnagar Review, Part II: Social Sciences, 2018, 183-195.
- Wal, M.V.D. Bank Protection Structures along the Brahmaputra-Jamuna River, a Study of Flow Slides. Water, 2020, 12, 2588. [CrossRef]
- Zhang, H.; Nakagawa, H.; Baba, Y.; Kawaike, K.; Rahman, M.M.; Uddin, M.N. Hydraulic and Morphological Consequences of Bank protection Measures along the Jamuna River, Bangladesh. Annuals of Disater Prevention Research Institute, Kyoto University, 2011, 54, 477-496.
- Nakagawa, H.; Zhang, H.; Baba, Y.; Kawaike, K.; Teraguchi, H. Hydraulic characteristics of typical bank-protection works along the Brahmaputra/Jamuna River, Bangladesh. Journal of Flood Risk Management, 2013, 6, 345-359. [CrossRef]
- iRIC Software. Available online: https://i-ric.org/en/about/ (accessed on 27 September 2023).
- Inoue, T.; Mishra, J.; Kato, K.; Sumner, T.; Shimizu, Y. Supplied Sediment Tracking for Bridge Collapse with Large-Scale Channel Migration. Water, 2020, 12, 7. [CrossRef]
- Dai, H.; Iwasaki, T.; Shimizu, Y. Effect of Sediment Supply on Morphodynamics of Free Alternate Bars: Insights from Hydrograph Boundary Layer Water, 2021, 13, 23. [CrossRef]
- Hasan, M.Z.; Toda, Y. Evaluation of Groynes Installation at the Vulnerable Bank of a Braided River. Journal of Hydraulic Engineering (JSCE), 2024, 12, in press. [CrossRef]
- Ashworth, P.J.; Best, J.L.; Roden, J.; Bristow, C.S.; Klaassen, G.J. Morphological evolution and dynamics of a large, sandbraid-bar, Jamuna River, Bangladesh. Sedimentology, 2000, 47, 533-555. [CrossRef]
- Laz, O.U.; Navera, U.K. Application of Delft3D Mathematical Model in the Jamuna River for Two-Dimensional Simulation. In Proceedings of the 4th International Conference on Civil Engineering for Sustainable Development, Khulna, Bangladesh, 2018.
- Musfequzzaman, M. Study of Hydro-Morphological Impact of Dredging in Selected Reach of the River Jamuna using Two-dimensional Morphological Model. MSc Thesis, Bangladesh University of Engineering and Technology, Dhaka, Bangladesh, 2012.
- Haque, A.; Matin, M.A. A Study of Bank Line Shifting of the Selected Reach of Jamuna River Using Multi-Variant Regression Model. Journal of Soft Computing in Civil Engineering, 2022, 6, 21-33. [CrossRef]
- Zin Zin, N.C.; Kazama, S.; Hagiwara, T. Morphological Changes due to the Peak Flow and Seasonal Flow of the Babame River. Journal of JSCE, Ser. G (Environmental Research), 2021, 77, 85-91. [CrossRef]
- Uddin, M.N.; Rahman, M.M. Flow and erosion at a bend in the braided Jamuna River. International Journal of Sediment Research, 2012, 27, 498-509. [CrossRef]
- Shampa; Hasegawa, Y.; Nakagawa, H.; Takebayashi, H.; Kawaike, K. Dynamics of Sand Bars in a Braided River: A Case Study of Brahmaputra-Jamuna River. Natural Disaster Science J. JSNDS, 2017, 36, 123-137.
- Rahman, M.M.; Hasan, M.S.; Eusufzai, M.K.; Rahman, M.M. Impacts of Dredging on Fluvial Geomorphology in the Jamuna River, Bangladesh. Journal of Geoscience and Environment Protection, 2021, 9, 1-20. [CrossRef]
- Shampa; Ali, M.M. Interaction between the braided bar and adjacent channel during flood: a case study of a sand-bed braided river, Brahmaputra–Jamuna. Sustainable Water Resources Management, 2019, 5, 947-960. [CrossRef]
- Hongshi, X.; Kui, X.; Wang, T.; Wanjie, X. Investigating Flood Risks of Rainfall and Storm Tides Affected by the Parameter Estimation Coupling Bivariate Statistics and Hydrodynamic Models in the Coastal City. International Journal of Environmental Research and Public Health (MDPI), 2022, 19, 19. [CrossRef]
- Hasan, M.Z. Assessment of Hydro-Morphological Response of Selected Reach of the Jamuna River due to Structural Intervention using Delft3D Model. MSc Thesis, Bangladesh University of Engineering and Technology, Dhaka, Bangladesh, 2018.
- Alauddin, M. Morphological Stabilization of Lowland Rivers by Using a Series of Groynes. PhD Thesis, Nagoya University, Japan, 2011.
Figure 2.
Sirajganj hard point along with the revetment (Source: Google image, and [7]).
Figure 2.
Sirajganj hard point along with the revetment (Source: Google image, and [7]).
Figure 3.
Guide bunds of the Jamuna Bridge (Google image)
Figure 3.
Guide bunds of the Jamuna Bridge (Google image)
Figure 4.
Kamarjani permeable groyne (Source: [
14])
Figure 4.
Kamarjani permeable groyne (Source: [
14])
Figure 5.
Betil and Eneyetpur spurs (Source: [
16]).
Figure 5.
Betil and Eneyetpur spurs (Source: [
16]).
Figure 6.
Four cross-bars implemented near Sirajganj town.
Figure 6.
Four cross-bars implemented near Sirajganj town.
Figure 7.
Formation of two concave banks due to construction of guide bund and hard point along with the formation of new vulnerable area after construction of the cross-bars.
Figure 7.
Formation of two concave banks due to construction of guide bund and hard point along with the formation of new vulnerable area after construction of the cross-bars.
Figure 8.
(a) Satellite image of the Jamuna River, 50 km reach including two water level stations, (b) Initial bathymetry of the river reach in iRIC-Nays2DH model.
Figure 8.
(a) Satellite image of the Jamuna River, 50 km reach including two water level stations, (b) Initial bathymetry of the river reach in iRIC-Nays2DH model.
Figure 9.
Water level verification at two stations within the model domain [
20].
Figure 9.
Water level verification at two stations within the model domain [
20].
Figure 10.
Reproduction of the change scenarios for morphological verification. (a) Satellite image for base year, (b) initial model bathymetry for base year, (c) satellite image for successive year, (d) model output for successive year, and (e) cross-section comparison at Sirajganj hard point [
20].
Figure 11.
(a) Case_0: Base condition without groyne, (b) Case_1: two groynes at Zone 1, (c) Case_2: two groynes at Zone 2, and (d) Case_3: two groynes at Zone 1, and two groynes at Zone 2.
Figure 11.
(a) Case_0: Base condition without groyne, (b) Case_1: two groynes at Zone 1, (c) Case_2: two groynes at Zone 2, and (d) Case_3: two groynes at Zone 1, and two groynes at Zone 2.
Figure 12.
For Case_0, model output for elevation due to (a) annual average flood, (b) 100-year flood, and (c) 200-year flood.
Figure 12.
For Case_0, model output for elevation due to (a) annual average flood, (b) 100-year flood, and (c) 200-year flood.
Figure 13.
For Case_1, model output for elevation due to (a) annual average flood, (b) 100-year flood, and (c) 200-year flood.
Figure 13.
For Case_1, model output for elevation due to (a) annual average flood, (b) 100-year flood, and (c) 200-year flood.
Figure 14.
For Case_2, model output for elevation due to (a) annual average flood, (b) 100-year flood, and (c) 200-year flood.
Figure 14.
For Case_2, model output for elevation due to (a) annual average flood, (b) 100-year flood, and (c) 200-year flood.
Figure 15.
For Case_3, model output for elevation due to (a) annual average flood, (b) 100-year flood, and (c) 200-year flood.
Figure 15.
For Case_3, model output for elevation due to (a) annual average flood, (b) 100-year flood, and (c) 200-year flood.
Figure 16.
Illustrating the contrast in average bed elevation from the initial bathy to the final condition of all cases, spanning from the right bank to 700 m across the river for (a) annual average flood, (b) 100-year flood, and (c) 200-year flood.
Figure 16.
Illustrating the contrast in average bed elevation from the initial bathy to the final condition of all cases, spanning from the right bank to 700 m across the river for (a) annual average flood, (b) 100-year flood, and (c) 200-year flood.
Table 1.
Input parameters for simulations in all cases.
Table 1.
Input parameters for simulations in all cases.
| Cases |
Run no. |
No. of groynes |
Zone |
Return period (years) |
Discharge (m3/s) |
| Case 0 |
Run 1 |
- |
- |
2.33 |
70,309 |
| Run 2 |
- |
- |
100 |
117,941 |
| Run 3 |
- |
- |
200 |
126,180 |
| Case 1 |
Run 4 |
2 |
1 |
2.33 |
70,309 |
| Run 5 |
2 |
1 |
100 |
117,941 |
| Run 6 |
2 |
1 |
200 |
126,180 |
| Case 2 |
Run 7 |
2 |
2 |
2.33 |
70,309 |
| Run 8 |
2 |
2 |
100 |
117,941 |
| Run 9 |
2 |
2 |
200 |
126,180 |
| Case 3 |
Run 10 |
2+2 |
1, 2 |
2.33 |
70,309 |
| Run 11 |
2+2 |
1, 2 |
100 |
117,941 |
| Run 12 |
2+2 |
1, 2 |
200 |
126,180 |
|
Disclaimer/Publisher’s Note: The statements, opinions and data contained in all publications are solely those of the individual author(s) and contributor(s) and not of MDPI and/or the editor(s). MDPI and/or the editor(s) disclaim responsibility for any injury to people or property resulting from any ideas, methods, instructions or products referred to in the content. |
© 2023 by the authors. Licensee MDPI, Basel, Switzerland. This article is an open access article distributed under the terms and conditions of the Creative Commons Attribution (CC BY) license (http://creativecommons.org/licenses/by/4.0/).
