1. Introduction
The common bean (
Phaseolus vulgaris L.) holds the distinction of being the most widely consumed legume in human diets [
1]. Known for its affordability, the common bean seeds serve as a crucial source of protein, dietary fiber, complex carbohydrates, and other essential nutrients, particularly for low-income populations in Africa and Latin America [
2,
3]. However, the productivity and quality of common bean crops are significantly threatened by
Colletotrichum lindemuthianum (Sacc. & Magnus) Briosi & Cavara, a hemibiotrophic ascomycete fungus that causes anthracnose (ANT) [
4,
5]. This pathogen represents one of the most severe, widespread, and recurring threats to the common bean cultivation. Under favorable environmental conditions, ANT can lead to reduced seed quality and significant yield losses [
5,
6].
Efforts to control
C. lindemuthianum have primarily relied on genetic resistance, as the pathogen exhibits high genetic variability that challenges conventional breeding programs [
4,
5]. Unfortunately, the pathogen has shown a remarkable ability to overcome cultivated plant resistance through coevolution, rendering previously resistant cultivars to become susceptible over time [
7,
8]. The use of resistant cultivars remains the most effective and environmentally friendly approach for managing
C. lindemuthianum in common bean cultivation [
9]. These cultivars offer a cost-effective and user-friendly solution. However, developing cultivars that are resistant to the diverse range of physiological races of
C. lindemuthianum poses significant challenges [
7].
Anthracnose (ANT) resistance in common beans is conferred by independent loci known as ‘
Co.’ These resistance loci have been mapped to various chromosomes of the common bean genome, often clustering in disease-resistance regions [
10]. Among the identified resistance loci in the Andean genetic pool, many have been mapped to chromosome Pv01. Notable alleles include
Co-1,
Co-12,
Co-3,
Co-14,
Co-15 and
Co-1HY at the
Co-1 locus [
11,
12,
13,
14],
Co-x [
15,
16],
Co-Pa [
17],
CoPv01CDRK [
18], and
Co-AC [
19], all located at the end of Pv01.
Plants have successfully thrived for millions of years by developing sophisticated immune systems to combat pathogenic attacks [
20,
21]. Plants have evolved robust defense mechanisms to resist attacks by pathogens, relying on their innate immune responses. These responses are activated by specialized receptors known as pattern-recognition receptors (PRRs) located on the cell surface, as well as intracellular nucleotide-binding domain leucine-rich repeat containing receptors (NLRs). PRRs initiate pattern-triggered immunity (PTI), while NLRs trigger effector-triggered immunity (ETI). Together, PTI and ETI form a formidable defense system, safeguarding plants against various pathogenic threats [
22,
23]. Therefore, the identification of novel genes involved in the resistance response to
C. lindemuthianum in common beans holds significant promise for the development of genetically resistant cultivars. Such discoveries can enhance our understanding of resistance mechanisms and contribute to the breeding of improved cultivars.
The identification and molecular characterization of novel resistance genes play a crucial role in breeding for disease resistance [
24,
25]. One effective approach to achieve this is by assessing the expression levels of candidate genes associated with resistance loci and known resistance genes in response to pathogens, utilizing the Reverse Transcription-Quantitative Polymerase Chain Reaction (RT-qPCR) technique. Gene expression analysis offers valuable insights into the role and interaction of these genes in mounting an effective resistance response. Moreover, it provides additional knowledge necessary for the identification of promising genes for utilization in plant breeding programs. By employing RT-qPCR, researchers can gain a better understanding of the molecular mechanisms underlying disease resistance and ultimately enhance the selection and incorporation of effective genes into breeding strategies.
Gene expression analysis has proven to be a valuable tool in understanding the resistance response of common bean genotypes SEL 1308 and T9576R to the race 73 of
C. lindemuthianum [
26,
27]. Several defense-related genes, including those encoding pathogenesis-related proteins (
PR) such as
PR1a,
PR1b, and
PR2, were found to be spatially and temporally induced by the pathogen [
26,
27,
28]. Notably, a potential gene associated with the
Co-12 locus was identified [
27]. Similarly, changes in the expression levels of
PR1a,
PR1b, and
PR2 genes were reported during incompatible interactions with race 2 of
C. lindemuthianum [
29].
In the evaluation of expression levels of candidate genes for the
Co-12 allele of the
Co-1 gene in response to race 73 of
C. lindemuthianum, the gene
Phvul.001G243800 exhibited high induction, suggesting its potential as a candidate gene for the
Co-12 allele of the
Co-1 gene [
27]. Additionally, through fine mapping in the Hongyundou genotype, four candidate genes were identified for the
Co-1HY allele. Among them,
Phvul.001G243600 and
Phvul.001G243700 showed higher induction in response to race 81 of
C. lindemuthianum, indicating their potential as candidate genes for the
Co-1HY locus [
13]. Moreover, in a genetic study focusing on the anthracnose resistance
Co-x gene, a gene called
KTR2/3 was found within a CRINKLY4 kinase cluster located between the
Phvul.001G243600 and
Phvul.001G243700 genes. Gene expression analysis revealed that
KTR2/3 was induced by strain 100 (race 3993) of
C. lindemuthianum, and its transient expression in susceptible genotype BAT93 resulted in increased resistance to the pathogen [
16]. The authors suggested that this gene may act as a decoy involved in indirectly recognizing fungal effectors [
16]. These findings highlight the significance of gene expression analysis in uncovering potential resistance genes and their roles in the common bean’s defense response to
C. lindemuthianum.
Through fine mapping, five candidate genes for the
CoPv01CDRK/PhgPv01CDRK locus, which confer resistance to anthracnose and angular leaf spot in the CDRK common bean cultivar, were identified [
18]. Among these candidate genes, gene expression analysis revealed that
Phvul.001G246300, potentially encoding an Abscisic Acid Receptor (PYL5), exhibited the highest responsiveness to both pathogens, making it the primary candidate gene for the
CoPv01CDRK/PhgPv01CDRK locus [
30].
Another noteworthy common bean cultivar, Amendoim Cavalo (AC), is an Andean landrace collected in the state of Santa Catarina, Brazil [
19]. AC possesses the
Co-AC gene that confers resistance to races 2, 7, 9, 19, 23, 39, 55, 65, 73, 89, 1545, 2047, and 3481 of
C. lindemuthianum [
31]. Through fine mapping, the
Co-AC gene was located at the end of the Pv01 chromosome, within a genomic region containing three candidate genes:
Phvul.001G244300,
Phvul.001G244400, and
Phvul.001G244500 [
19].
We propose that candidate genes located within the Co-AC loci on Pv01 demonstrate unique expression patterns when inoculated with race 73 of C. lindemuthianum in the Amendoim Cavalo (AC) cultivar. The primary aim of this study was to investigate the dynamic expression profiles of Co-AC candidate genes Phvul.001G244300, Phvul.001G244400, and Phvul.001G244500 within the AC cultivar upon exposure to C. lindemuthianum race 73. This investigation will be conducted through quantitative real-time PCR-based gene expression analysis. The present study hypothesizes that each of the candidate genes that overlap with the Co-AC loci on Pv01 exhibits distinct expression patterns in response to inoculations with race 73 of C. lindemuthianum in the Amendoim Cavalo cultivar. The objective of this study was to investigate the expression patterns of the Co-AC candidate genes (Phvul.001G244300, Phvul.001G244400, and Phvul.001G244500) in the AC cultivar, in response to C. lindemuthianum race 73, using gene expression analysis employing quantitative real-time PCR. Specifically, we seek to gain insights into their potential roles in the plant’s defense mechanisms against these pathogens, contributing to a deeper understanding of disease resistance in common beans.
3. Discussion
Gene expression analysis plays a crucial role in understanding the genetic basis of disease resistance and can aid in the identification of effective resistance genes for plant breeding and molecular studies within specific pathosystems. In our study, we investigated the resistance response to
C. lindemuthianum in the Amendoim Cavalo cultivar, focusing on the relative expression of candidate genes associated with resistance loci, namely
Co-AC [
19],
CoPv01CDRK/
PhgPv01CDRK [
18],
Co-x [
15,
16], and the
Co-12 allele for the
Co-1 locus [
27] (
Figure 2 and
Figure 3). Additionally, we examined the relative expression of disease resistance genes
PR1a, PR1b, and
PR2 in the same pathosystem (
Figure 4 and
Figure 5).
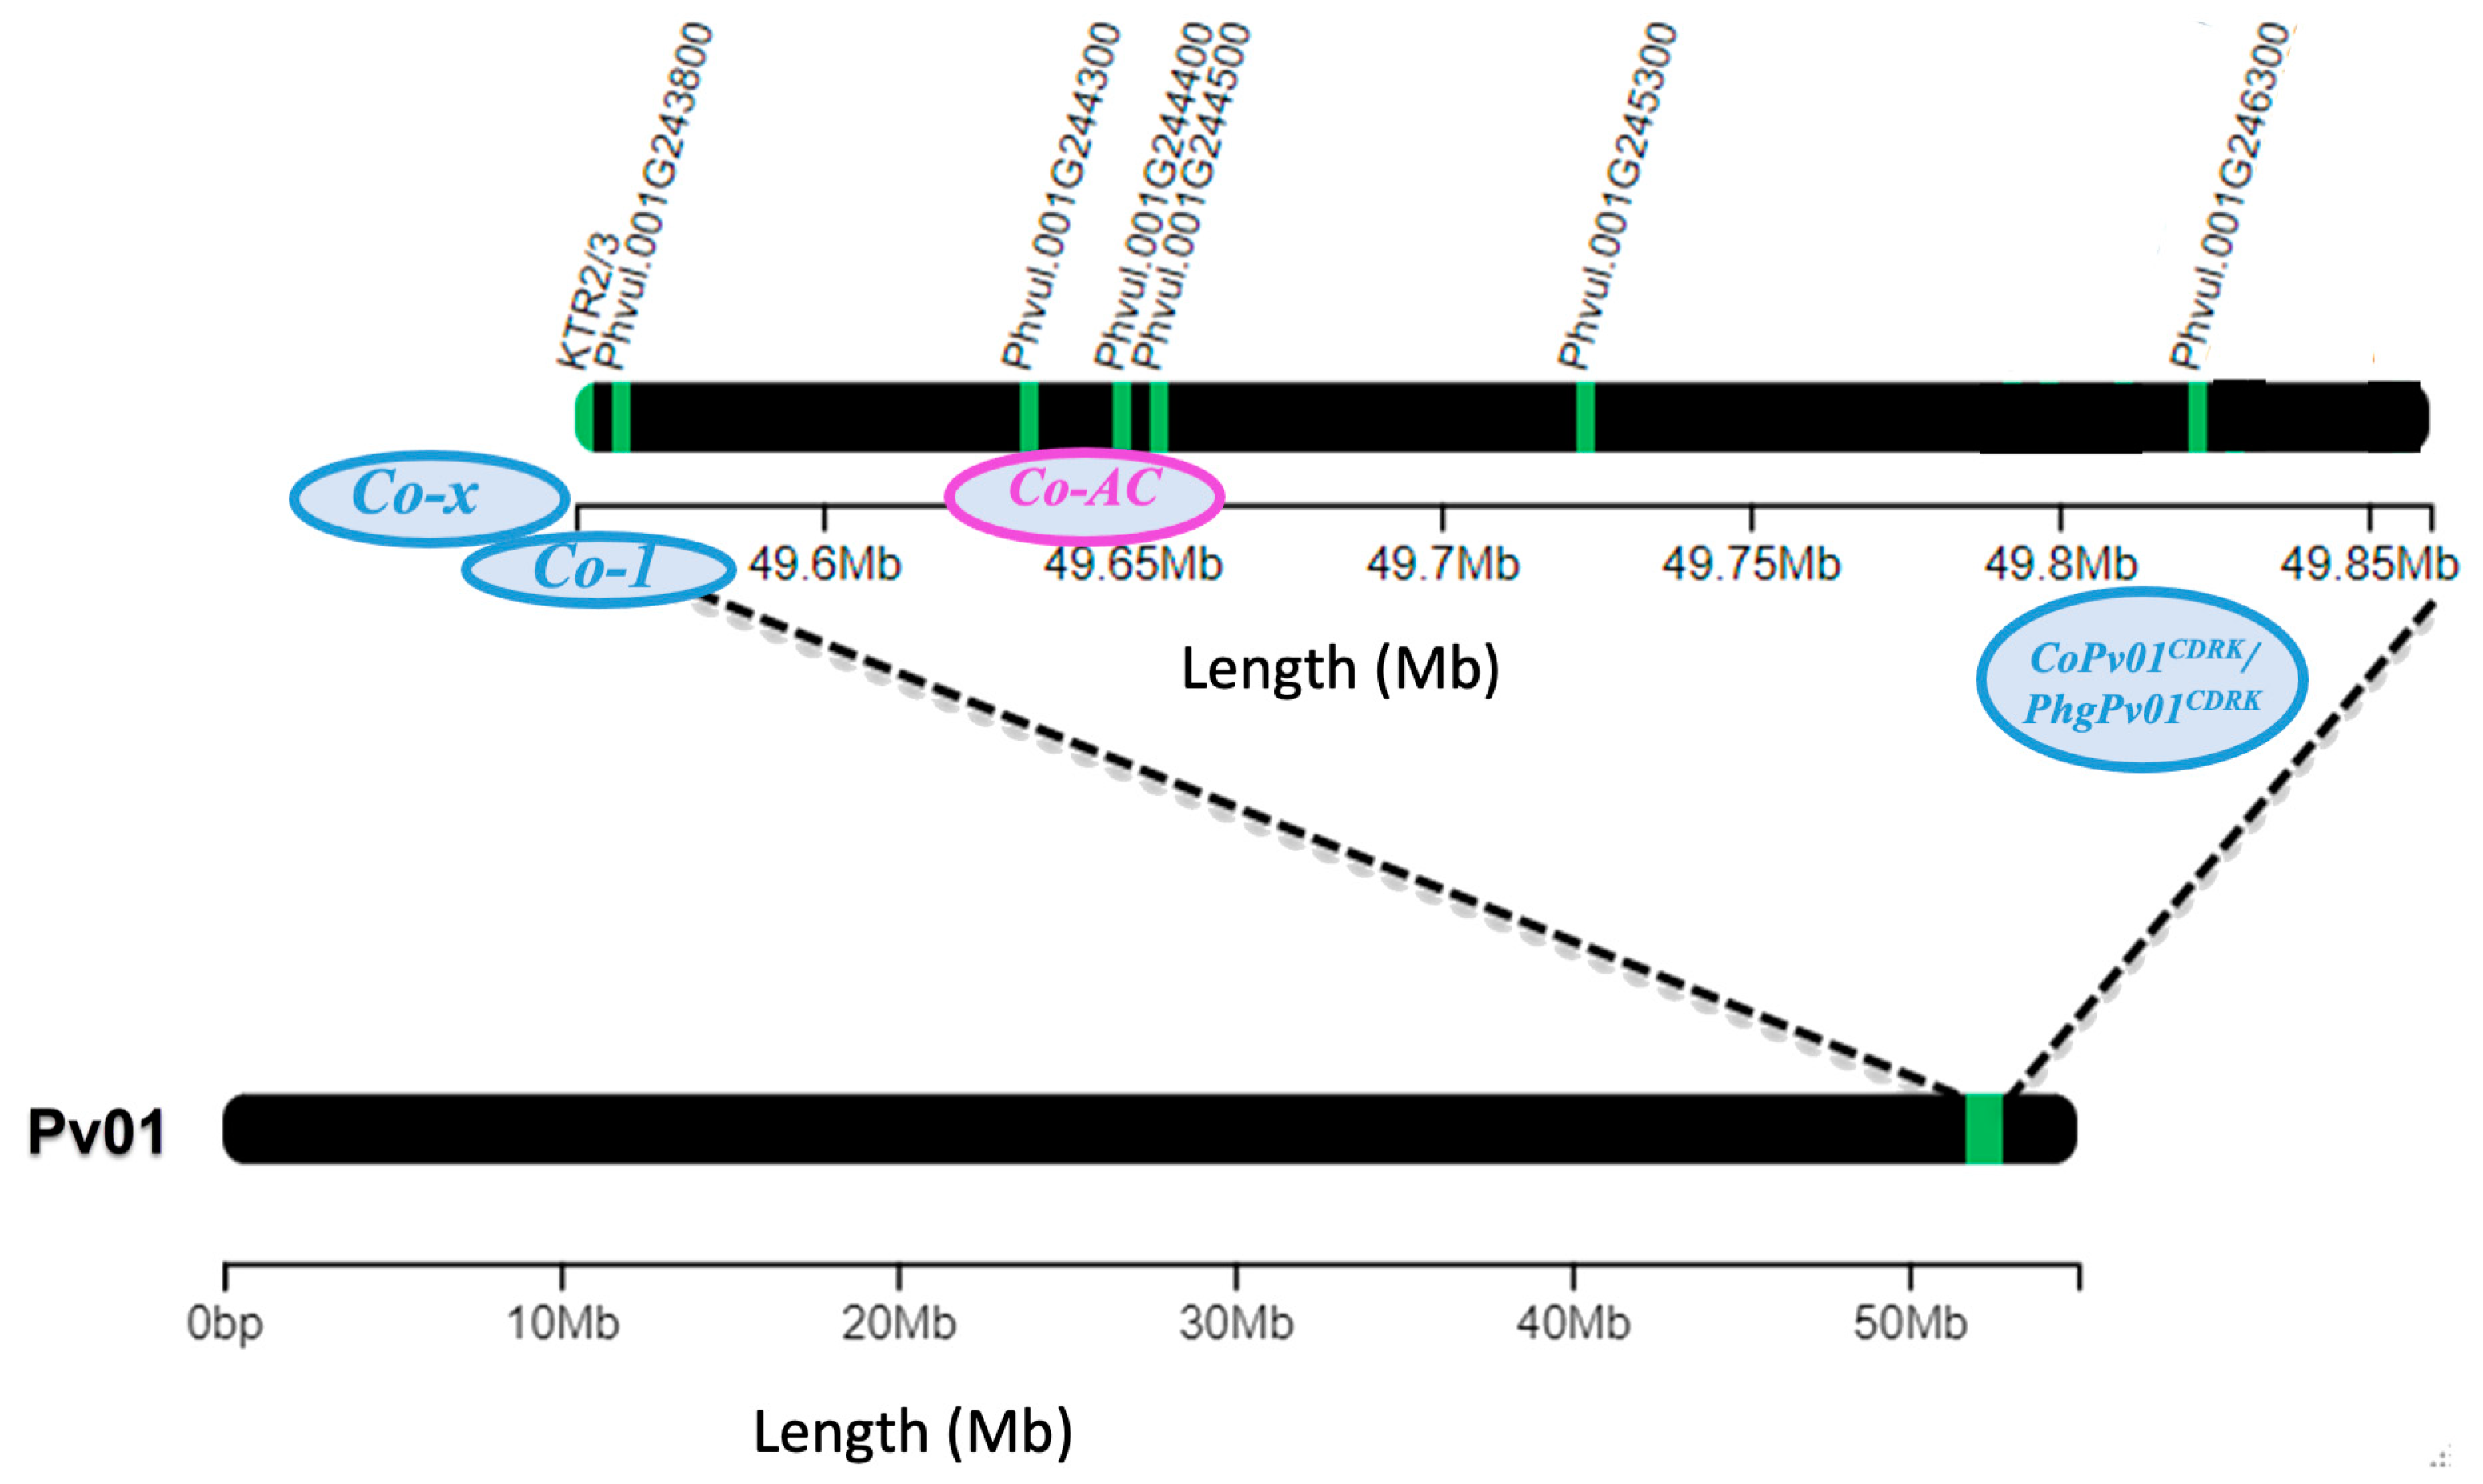
Our study focused on a genomic region spanning 250 Kb at the end of Pv01, which encompasses the candidate genes for
Co-AC and potential genes closely linked to this locus (
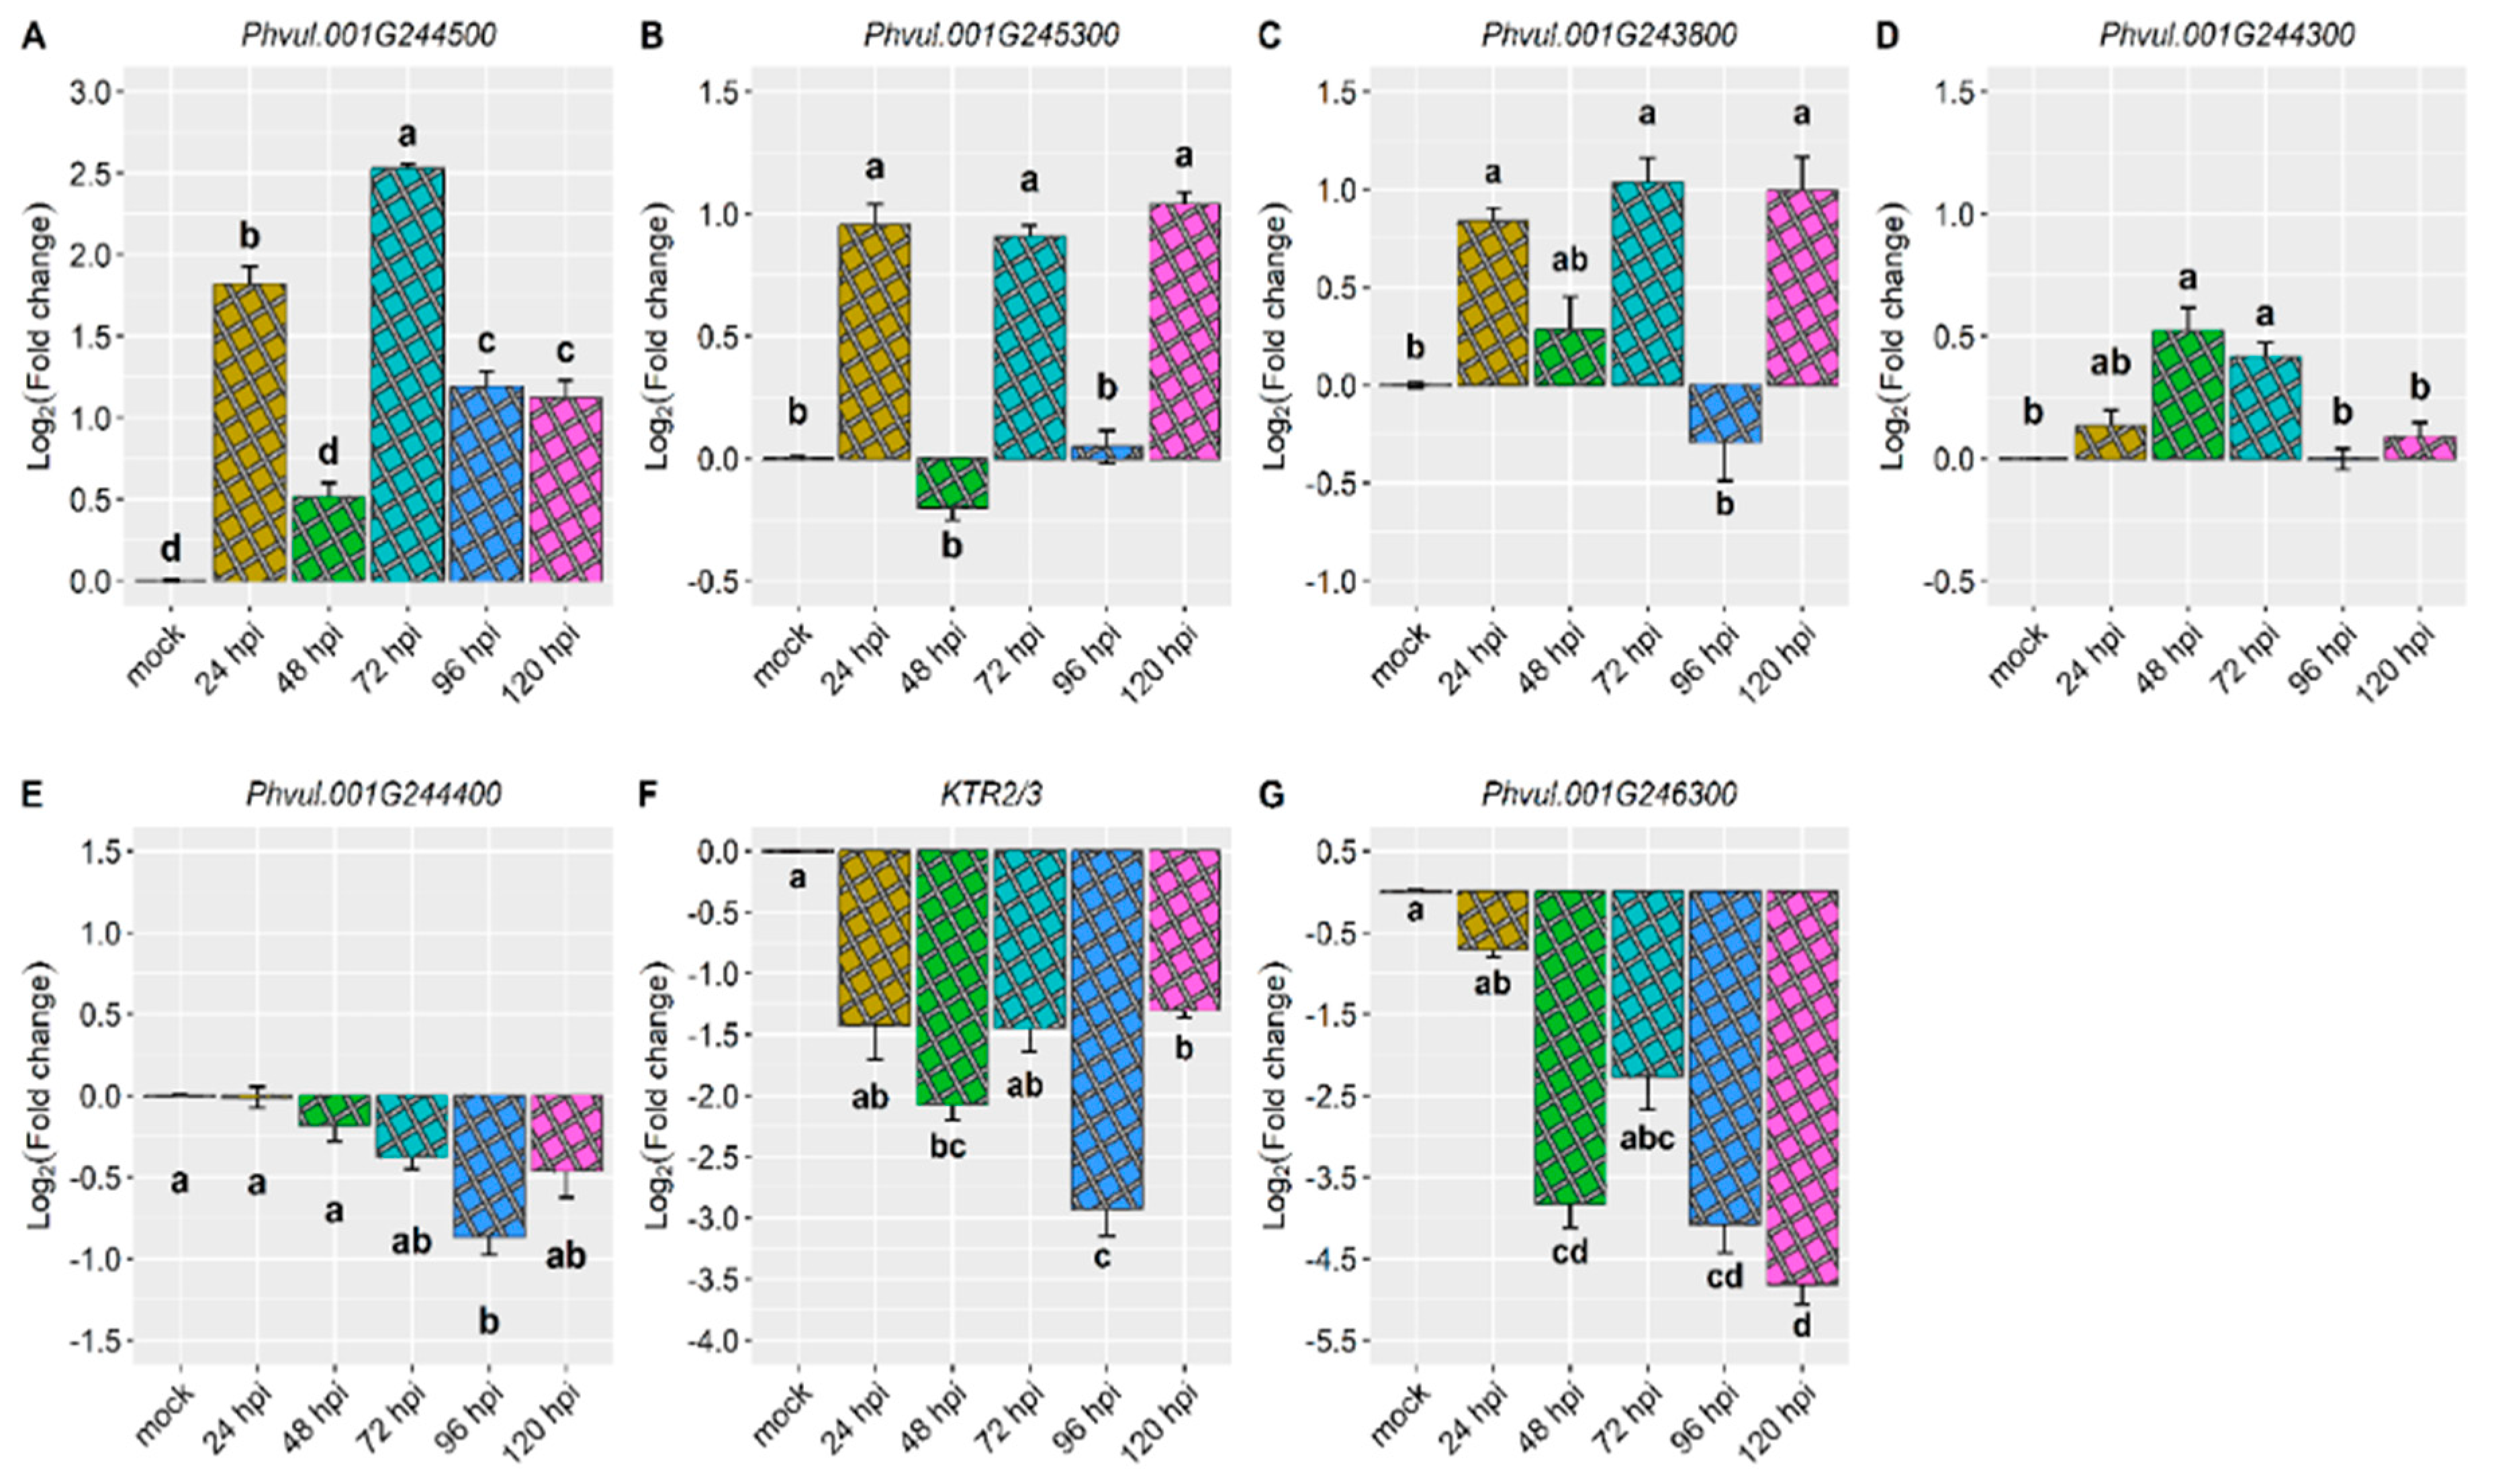
Figure 6). Notably, we observed distinct expression patterns among the candidate genes of
Co-AC resistance gene in the AC common bean cultivar. Among these candidate genes (
Phvul.001G244300,
Phvul.001G244400, and
Phvul.001G244500),
Phvul.001G244500 displayed the most pronounced responsiveness to race 73 of
C. lindemuthianum, particularly at 72 hpi, with a 2.5-fold change in gene expression (
Figure 2 and
Figure 3 and
Table 1).
The identification and characterization of specific genes involved in the defense response against pathogens are crucial for understanding plant resistance mechanisms. Our findings highlight the potential role of the
Phvul.001G244500 gene, which encodes a Basic Helix-Loop-Helix (bHLH) transcription factor, in regulating defense processes against
C. lindemuthianum race 73. This gene exhibited the highest responsiveness in the Amendoim Cavalo cultivar, particularly at 72 hpi, suggesting its involvement in the defense against this specific pathogen. Unlike the robust induction of
Phvul.001G244500 in the Amendoim Cavalo cultivar, a previous study showed a low expression pattern of this candidate gene in the California Dark Red Kidney cultivar inoculated with
C. lindemuthianum race 73. Lovatto [
30] et al. (2022) reported that
Phvul.001G244500 displayed only a slight induction at 120 hpi, with less than a 1-fold change in gene expression.
Phvul.001G244500 is a strong candidate for the
Co-AC resistance gene in the Amendoim Cavalo cultivar, while it was not responsive in the California Dark Red Kidney cultivar.
Phvul.001G245300 expression in AC cultivar was the second most induced gene, although at lower levels, with approximately 1.0-fold change at 24, 72, and 120 hpi. This observation suggests that Phvul.001G245300 may function in a secondary layer of the resistance response.
In the AC cultivar
Phvul.001G243800 showed only minor increases in expression levels at 24, 72, and 120 hpi (approximately 1-fold change). In contrast, the
Phvul.001G244500 gene exhibited a substantial 2.5-fold change in gene expression (
Figure 2 and
Figure 3 and
Table 1). These results suggest that
Phvul.001G243800 has a limited effect on the resistance response in the AC cultivar. The
Phvul.001G243800 gene, which is a candidate for the
Co-12 allele of the
Co-1 locus, was found to be highly induced at 72 hpi in the T9576R genotype inoculated with race 73 of
C. lindemuthianum [
27].
The present study demonstrated a different pattern for the
KTR2/3 gene in the AC cultivar inoculated with race 73 of
C. lindemuthianum. It was consistently downregulated at 48, 96, and 120 hpi, indicating that this gene may not trigger the resistance response in this specific pathosystem. Conversely, the
KTR2/3, a candidate gene for the
Co-x gene, was upregulated at 24 hpi in the JaloEEP558 cultivar [
16].
In our study, the Phvul.001G246300 gene in AC cultivar was downregulated, suggesting that it may not be the responsive resistance gene in this specific pathosystem. On the other hand, in the CDRK cultivar, the Phvul.001G246300 gene showed the highest responsiveness to both C. lindemuthianum race 73 and P. griseola race 63-39, indicating that the CoPv01CDRK/PhgPv01CDRK resistance gene confers resistance to both diseases in common bean.
Taking together, it is possible to identify distinct roles of the genes Phvul.001G244500, Phvul.001G243800, KTR2/3, and Phvul.001G246300 involved in the resistance response to race 73 of C. lindemuthianum in different common bean cultivars. The contrasting expression patterns emphasize the complexity of resistance mechanisms and highlight the importance of the candidate gene Phvul.001G244500 for Co-AC in conferring robust resistance.
Plant resistance to pathogens involves the activation of genes encoding pathogenesis-related (
PR) proteins, which are categorized into 17 families and are known to accumulate following pathogen infection in various plant species [
32].
PR1 genes, a subset of the PR family, are commonly used as markers for systemic acquired resistance [
33]. However, our understanding of
PR1 genes remains limited, with only a small proportion having been studied thus far [
34].
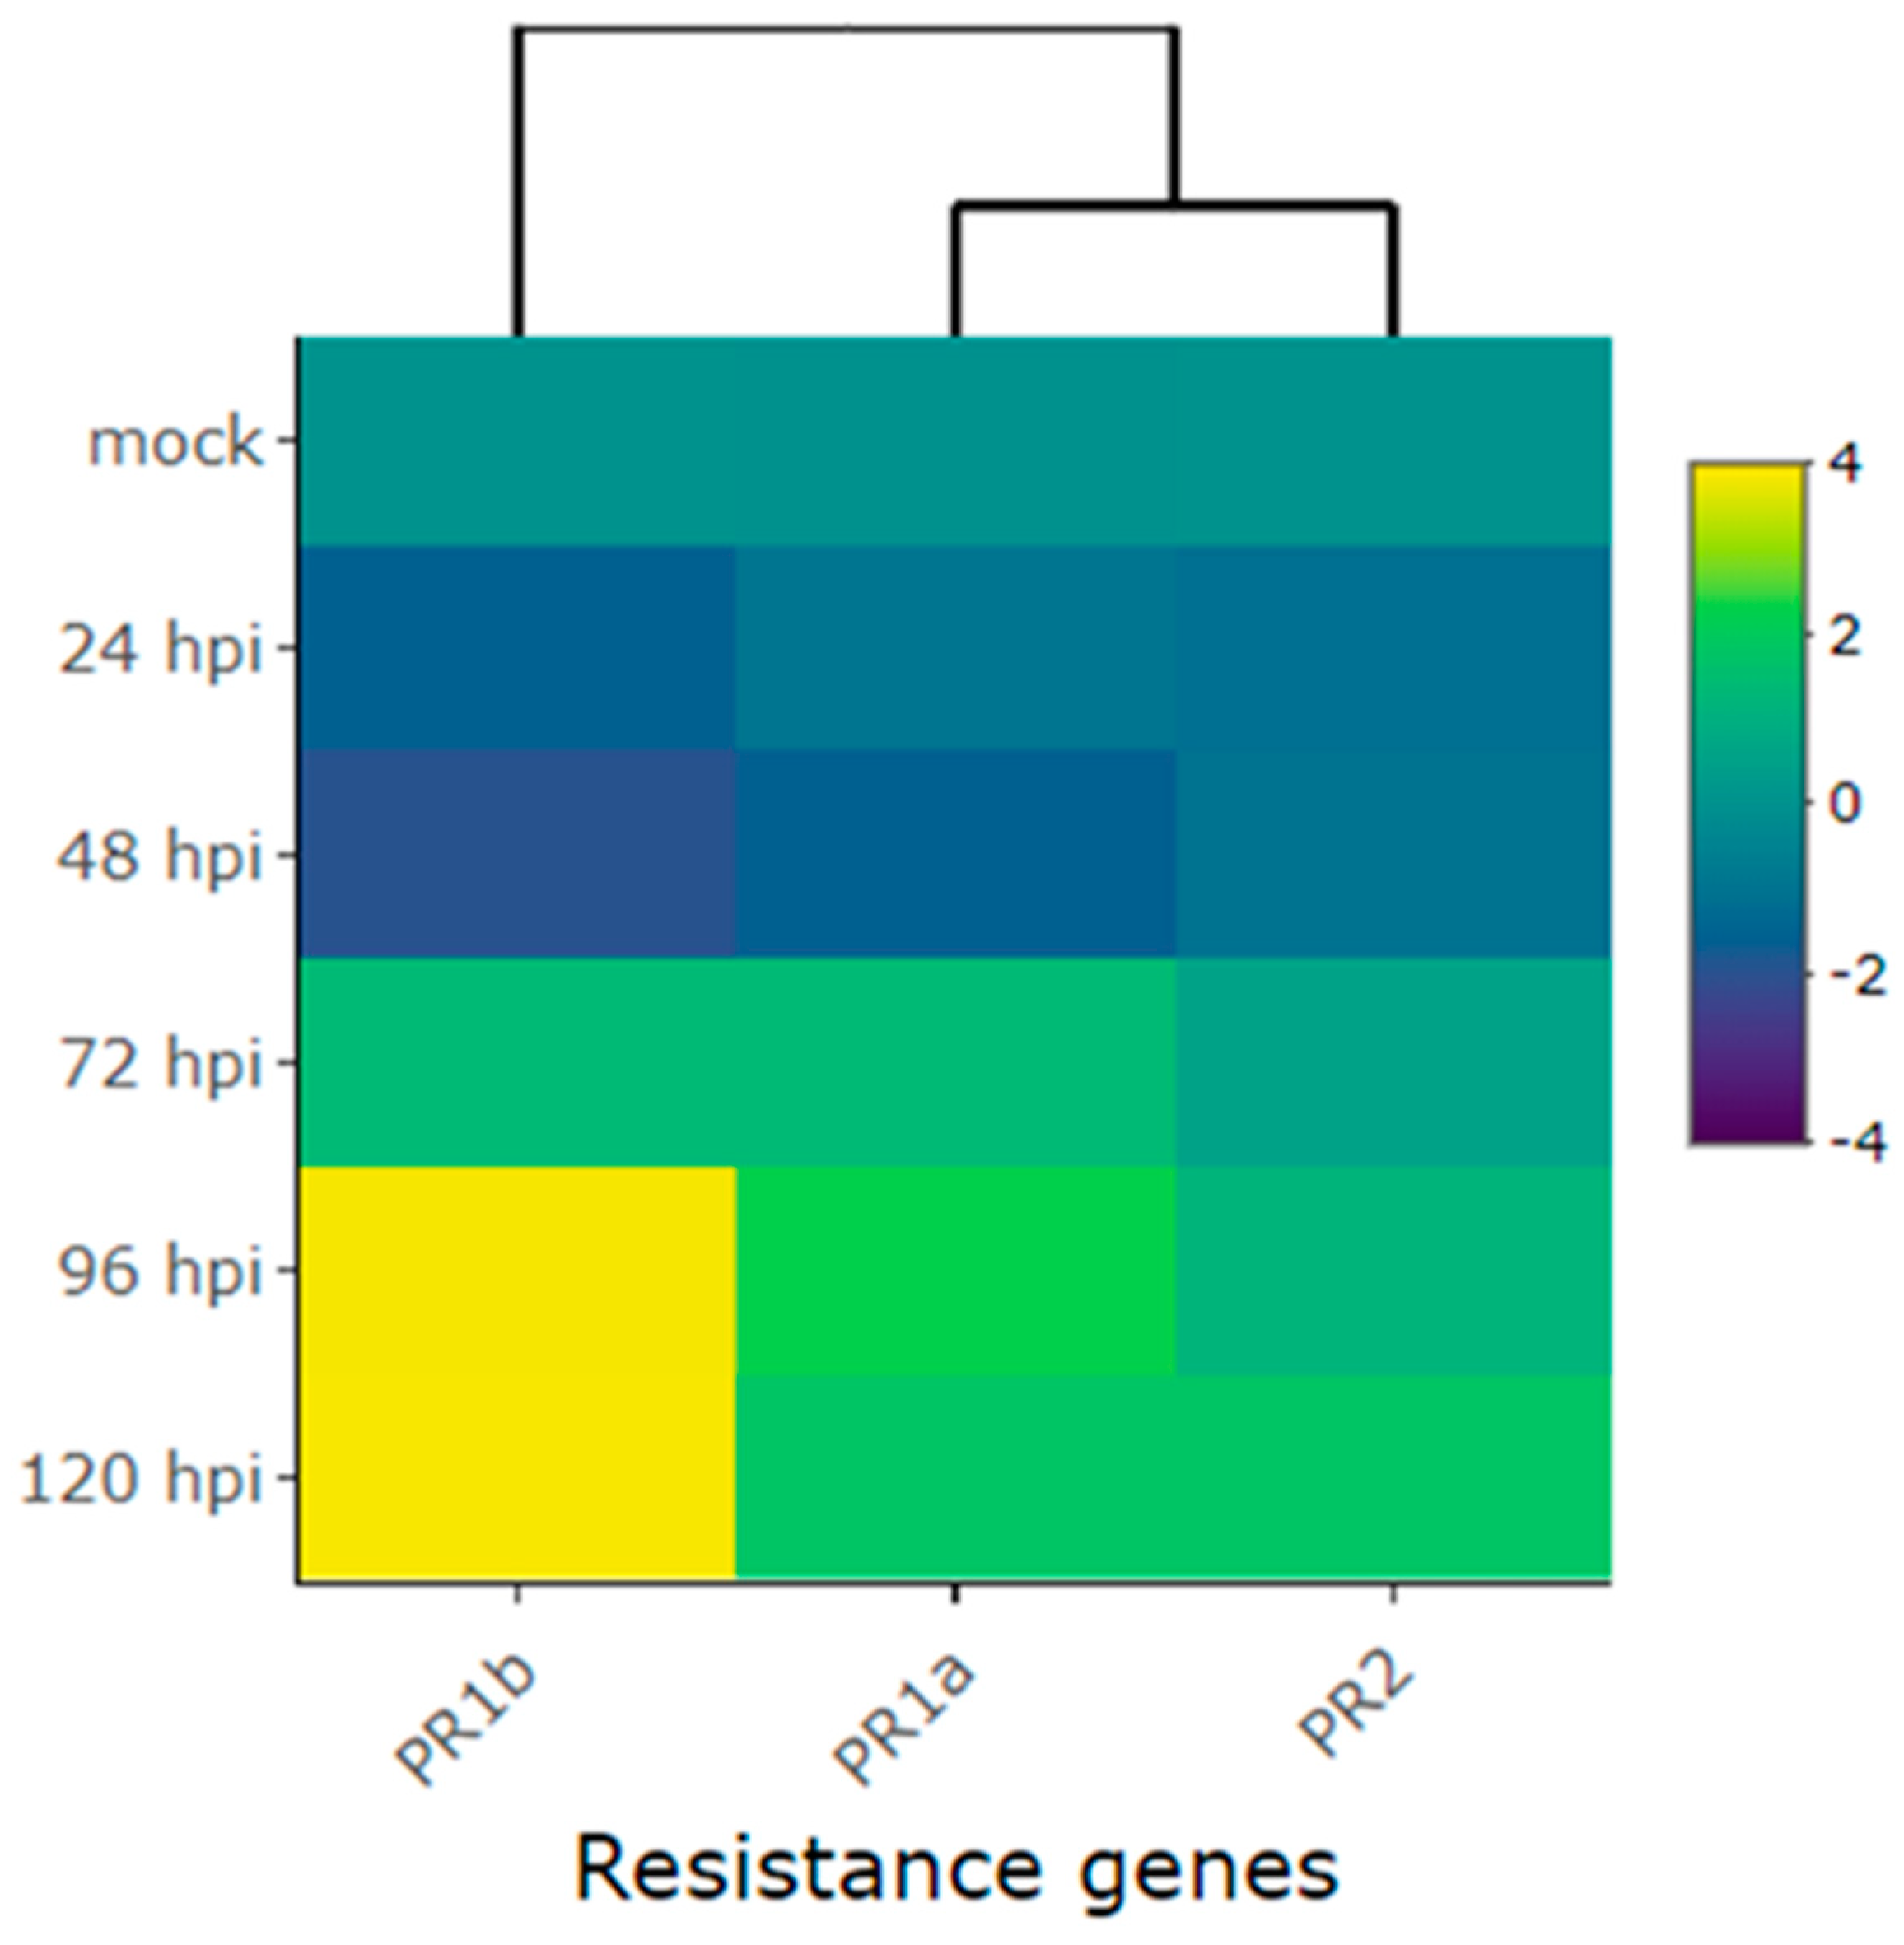
In the present study, we observed that among the tested known disease resistance genes,
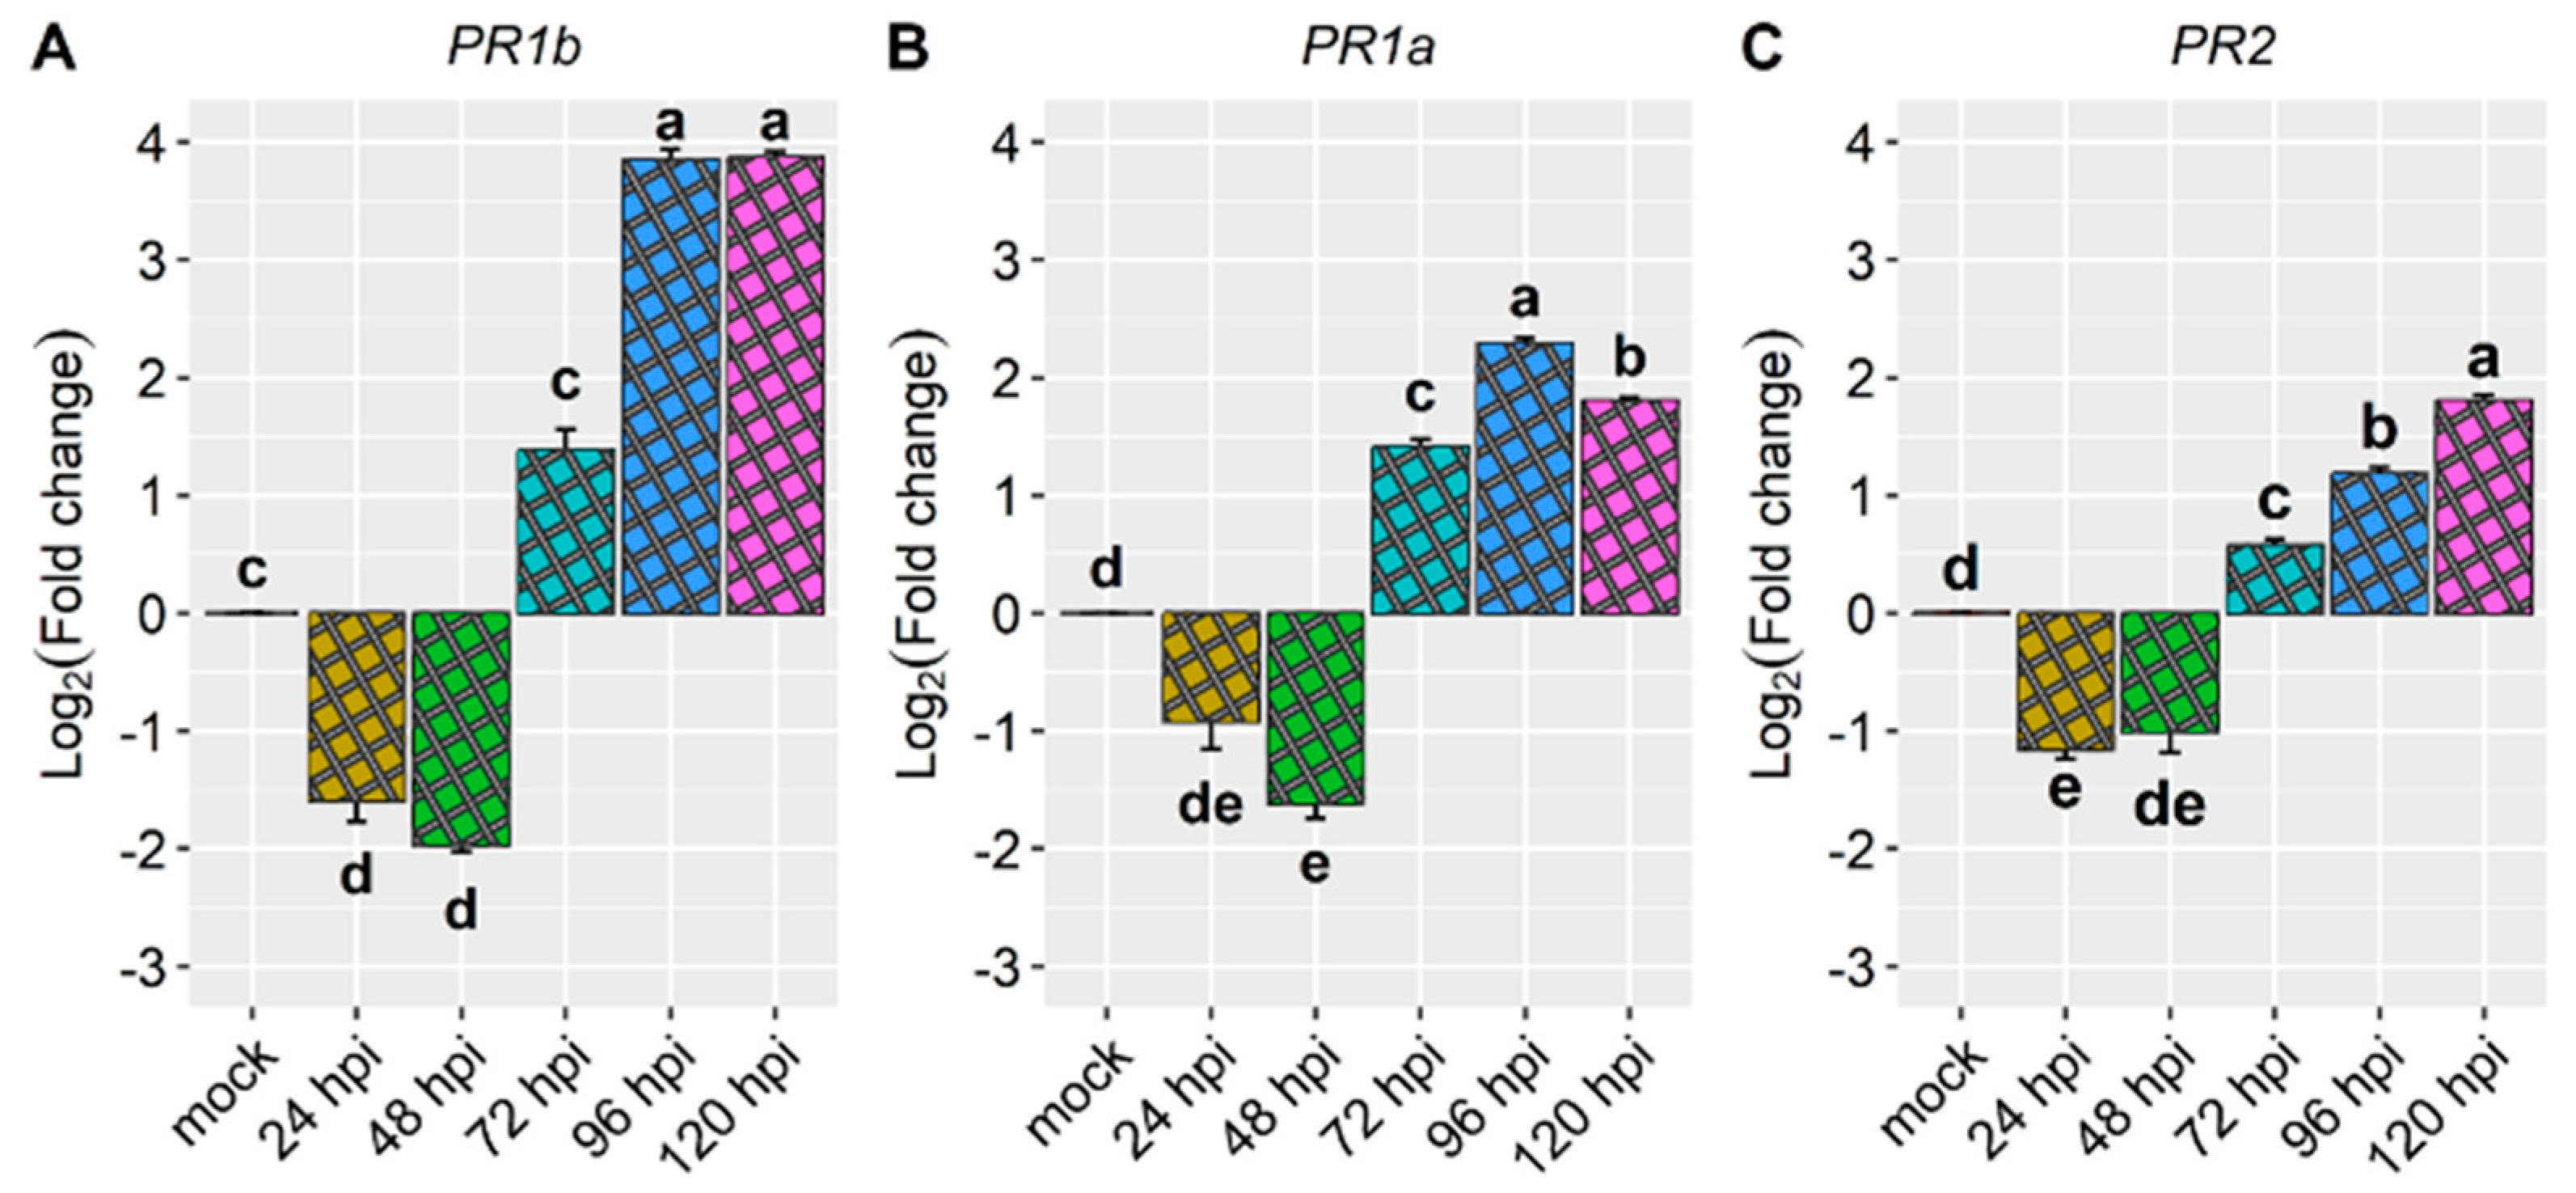
PR1b exhibited the highest responsiveness to race 73 of
C. lindemuthianum in the AC cultivar, particularly at 96 and 120 hpi (
Figure 4 and
Figure 5). Interestingly,
PR1b also demonstrated the most pronounced induction in the CDRK cultivar inoculated with race 73 of
C. lindemuthianum, mainly at 120 hpi [
29]. Hypothetically,
PR1b encodes a
PR1-like protein that is typically secreted into the extracellular spaces of plant leaves in response to pathogen infection [
35]. In
Arabidopsis thaliana, a homolog of
PR1b is involved in defense responses against necrotrophic pathogens mediated by methyl jasmonate and ethylene, while being repressed by salicylic acid [
36].
In our study, we also observed upregulation of
PR1a in the AC cultivar inoculated with race 73 of
C. lindemuthianum, particularly between 72 and 120 hpi, with a notable peak at 96 hpi (
Figure 4,
Figure 5 and
Table 1). Similarly, in the CDRK cultivar inoculated with race 73 of
C. lindemuthianum,
PR1a showed the highest induction at 72 and 96 hpi [
30]. Upregulation of
PR1a was also observed in the SEL 1308 cultivar inoculated with race 73 of
C. lindemuthianum (Borges et al., 2012 a; Oblessuc et al., 2012), as well as in T9576R common bean inoculated with race 73 of
C. lindemuthianum [
27] and in the ‘Naz’ cultivar when inoculated with race 2 of
C. lindemuthianum [
29].
PR1a hypothetically encodes a PR protein containing the Bet v I domain [
37]. A recent transcriptome study investigating the incompatible interaction between strain C531 and the BAT93 cultivar emphasized the prominent role of
PR10/Bet vI in common bean disease resistance [
38].
In our experiment with the Amendoim Cavalo cultivar inoculated with race 73 of
C. lindemuthianum, we observed a slight repression of
PR2 at 24 hpi, followed by induction from 72 hpi, with a notable peak at 120 hpi. Similarly,
PR2 was upregulated in response to race 73 of
C. lindemuthianum in the CDRK cultivar, primarily between 72 and 96 hpi [
30].
PR2 was also found to be upregulated in the SEL 1308 cultivar following inoculation with race 73 of
C. lindemuthianum [
26,
28], as well as in the Naz cultivar, which is resistant to race 2 of
C. lindemuthianum, particularly from 48 hpi [
29]. In the T9576R genotype inoculated with race 73 of
C. lindemuthianum,
PR2 was upregulated by the pathogen at all evaluated time points except 96 hours post-inoculation [
27]. Hypothetically,
PR2 encodes a 1,3-beta-glucan endohydrolase [
39]. Therefore,
PR2 may play a role in the resistance response by degrading fungal cell walls, potentially triggering a plant’s pattern-triggered immunity (PTI) [
40,
41].
Our findings contribute valuable knowledge regarding the genetic mechanisms underlying resistance to C. lindemuthianum in the AC cultivar and provide insights into potential genes involved in the resistance response to anthracnose in common beans. These results have implications for future research and can aid in the development of effective strategies for anthracnose resistance in common bean breeding programs. The characterization of a specific candidate gene, Phvul.001G244500, broadens our understanding of the defense networks activated in response to pathogen infection. Additionally, PR1a, PR1b and PR2 play significant roles in the defense responses of different common bean cultivars against C. lindemuthianum.
5. Materials and Methods
5.1. Plant Material and Growth Conditions
The experiment was performed in a completely randomized design. Seedlings of the resistant Amendoim Cavalo and the susceptive Cornell 49-242 cultivars were inoculated with race 73 of
C. lindemuthianum, and relative expression of ten genes only in Amendoim Cavalo cultivar was evaluated at 24, 48, 72, 96, and 120 hpi and in the mock. Three biological replicates (plants) were collected for each experimental condition evaluated, and for each biological replicate, three technical replicates (qPCR reactions) were performed in each experiment. The experiment was conducted at the Núcleo de Pesquisa Aplicada à Agricultura (Nupagri) at the Universidade Estadual de Maringá (UEM) in Maringá, Paraná, Brazil (latitude 23° 26′8” S, longitude 51° 53′42” W). Briefly, seeds were planted in plastic trays filled with a commercial substrate, MecPlant (MEC PREC—Ind. Com Ltda, Telemaco Borba, Brazil), that had been previously sterilized and fertilized. The seedlings were grown in greenhouses under natural light at a temperature of 25 °C until the first trifoliate leaf growth stage [
8].
5.2. Pathogenesis Assay
Monosporic cultures of
C. lindemuthianum were prepared following the methodologies described by Mathur et al. [
42]. The inoculum was produced on a medium comprising green common bean pods incubated at 22 ± 2 °C without light for 14 days. Conidiospore quantification was conducted using a hemacytometer under an optical microscope. The plants were sprayed with a conidiospore suspension prepared in distilled water and Tween 20® (0.01%) at an approximate concentration of 1.2 x 10
6 mL
-1. Inoculation was carried out by spraying the suspension onto the plants using a manual pressurized pump sprayer. For the negative control (mock), plants were sprayed only with distilled water and Tween 20® (0.01%). After inoculation, the plants were placed in a mist chamber at a temperature of 22 ± 2 °C, a photoperiod of 12 hours, and ≥95% relative humidity for 72 hours. Subsequently, the plants were transferred to a growth chamber with a temperature of 22 ± 2 °C and a photoperiod of 12 hours for the duration of the experiment. Anthracnose symptoms were evaluated using the 1-to-9 disease severity scales proposed by Pastor-Corrales et al. [
8]. Plants with disease reaction scores between 1 and 3 were considered resistant, whereas plants with scores from 4 to 9 were considered susceptible.
5.3. RNA Extraction
For sample collection and total RNA extraction, leaf samples weighing approximately 100 ± 10 mg from the AC cultivar inoculated with race 73 of C. lindemuthianum were collected at 24, 48, 72, 96 and 120 hours post-inoculation (hpi), as well as from the mock control. The leaf samples were immediately submerged in liquid nitrogen (N2) and stored at -80 °C until further processing. Total RNA extraction was performed by macerating the tissue and adding 1000 µL of TRIzol® (Invitrogen™, Waltham, USA) to each microtube. The subsequent steps for RNA extraction and isolation followed the manufacturer’s recommendations. The precipitated total RNA pellets were washed with 70% ethanol (EtOH) and then suspended in RNase-free H2O.
The integrity of the total RNA was assessed by electrophoresis on a 1% m/v agarose gel, run for 80 minutes at 80 volts, at 5°C, and in the absence of light. To assess the quality and quantity of total RNA, a spectrophotometer (FEMTO 700STM) was used to measure absorbance at 230 nm, 240 nm, 260 nm, and 280 nm. The following absorbance ratios were used to determine RNA purity: A
260/A
230 between 1.9 and 2.4, A
260/A
240 ≥ 1.4, and A
260/A
280 between 1.8 and 2.2. The concentration of total RNA was calculated using the formula [RNA] (ng µL-1) = A
260nm × 40 × 100 [
43]. Total RNA samples that met the purity criteria and exhibited no visual signs of degradation were subjected to DNase I treatment using DNase ITM (Invitrogen™, Waltham, USA) to remove any residual DNA. The purification reaction was carried out using 1 µg of total RNA, following the manufacturer’s instructions.
5.4. Reverse Transcription (cDNA Synthesis)
The cDNA synthesis was carried out using the ‘Superscript® IV First-Strand Synthesis System’ kit (Invitrogen™, Waltham, USA) following the manufacturer’s protocol. The total volume of cDNA synthesis reaction was 20 µL with the following components: 1 µg of total RNA, primer-oligo d(T) (2.5 µM), dNTP mix (0.5 mM each), First-Strand Buffer (1X), DL-dithiothreitol (5 mM), ribonuclease inhibitor (2 U µL-1), MMLV-RT (10 U µL-1) and RNase-free water. Initially, total RNA, primer-oligo d(T), dNTP mix and RNase-free water (to 13 µL) were added to the reaction. The samples were incubated in a thermocycler (Applied Biosystems® Veriti® 96-Well Fast Thermal Cycler) at 65 °C for 5 minutes, followed by 4 °C for 1 minute. Then, the First-Strand Buffer, DL-dithiothreitol, ribonuclease inhibitor and 1 MMLV-RT were added to the reaction. The samples were incubated at 55 °C for 10 minutes for cDNA synthesis activation, followed by 80 °C for 10 minutes to inactivate the reaction. To remove residual RNA after cDNA synthesis, 1 µL of Escherichia coli RNase H was added, and the samples were incubated at 37 °C for 20 minutes. The cDNA synthesis product (20 µL) was diluted 1:100 for qPCR analysis. To assess the cDNA synthesis efficiency, positive control was included, in which HeLa-S3 RNA (10 ng) was used instead of total RNA.
For the control of cDNA synthesis, the PCR reaction was conducted using the following components: 5 µL of PCR buffer (10X), 2 µL of MgCl2 (50 mM), 1 µL of dNTP Mix (10 mM), 1 µL of sense primer (10 µM), 1 µL of antisense primer (10 µM), 2 µL of cDNA for the positive control, and 2 µL of ultrapure H2O for the negative control. Additionally, 0.2 µL of Taq PlatinumTM DNA polymerase (Invitrogen™, Waltham, USA) and 37.8 µL of ultrapure H2O were included in the reaction mixture. The PCR amplification was performed under the following thermocycling conditions: an initial denaturation step at 94 °C for 2 minutes, followed by 35 cycles of denaturation at 94 °C for 15 seconds, annealing at 55 °C for 30 seconds, and synthesis at 68 °C for 1 minute. After completion of the PCR reaction, both the positive and negative controls were subjected to electrophoretic analysis using a 1.5% (w/v) agarose gel. The expected fragment size of approximately 353 bp was observed in the positive control lane, confirming the successful amplification, while no fragment was detected in the negative control lane, validating the absence of non-specific amplification as indicated by the manufacturer’s instructions.
5.5. Target Genes and Primer Design
The candidate genes selected for expression analysis in the Amendoim Cavalo cultivar were associated with resistance to race 73 of
C. lindemuthianum. Specifically, the genes
Phvul.001G244300,
Phvul.001G244400, and
Phvul.001G244500 that were identified within the
Co-AC locus of the Amendoim Cavalo cultivar [
19]. Additionally, the gene
Phvul.001G246300, located within the
CoPv01CDRK/PhgPv01 CDRK loci, that exhibited significant responsiveness in California Dark Red Kidney cultivar when inoculated with race 73 of
C. lindemuthianum [
30]. The gene
Phvul.001G245300 is located in close proximity to the genomic region of the California Dark Red Kidney cultivar. The inclusion of the
Phvul.001G243800 gene was based on its induction in the near-isogenic line T9576R, possessing the
Co-12 resistance allele, when inoculated with race 73 of
C. lindemuthianum [
27]. The
KTR2/3 candidate gene for
Co-x in the Jalo EEP558 cultivar was also evaluated due to its induction in response to race 3993 of
C. lindemuthianum [
16]. Furthermore, the well-known plant defense genes
Phvul.003G109100 (
PR1a),
Phvul.006G196900 (
PR1b), and
Phvul.009G256400 (
PR2) were included in the analysis [
26,
27,
28]. To standardize gene expression levels, we employed the reference genes
Phvul.008G011000 (actin - ACT) and
Phvul.001G133200 (insulin-degrading enzyme - IDE) [
44]. ACT had previously been validated for quantifying the relative expression of candidate genes in studies [
27,
29], while IDE’s validation was previously established by Oblessuc et al. [
28]. Both genes have been utilized as reference genes for quantifying the relative expression of resistance genes against ANT in studies [
16,
44]. For normalization purposes, the reference genes
Phvul.008G011000 (ACT) and
Phvul.001G133200 (IDE) were used [
44].
To obtain the coding sequences (CDS) and DNA sequences of the target genes, the common bean (
P. vulgaris L.) genome available at v1.2 Phytozome [
45] was accessed. Primer design for the qPCR assay was performed using the ‘Primer-Blast web tool’ [
46] with the following specifications: primer size between 18 and 24 base pairs (bp), melting temperature between 59 and 61 °C, amplicon size between 80 and 160 bp, and, when possible, the primer pair should be separated by at least one intron in the corresponding genomic DNA sequence. Primer dimers and secondary structures were assessed using Gene Runner software (version 6.5.52), the ‘Multiple Prime Analyzer’ web tool (Thermo Fisher Scientific:
https://bit.ly/34kZpnP), and ‘The Sequence Manipulation Suite’ web tool [
47]. The secondary structure of the amplicons was verified using “The Mfold Web Server” platform [
48] with coding sequences obtained from v1.2 Phytozome. All primer design and in silico validation procedures not explicitly mentioned followed established literature recommendations [
49,
50].
Table 2 provides the primer sequences for each candidate gene evaluated, with the primers for the
KTR2/3 gene obtained from Richard et al. [
16].
5.6. Quantitative PCR (qPCR) and Data Analysis
The determination of PCR efficiency for each primer involved establishing a standard curve through a fivefold serial dilution, utilizing the cDNA pool as the template. This process incorporated three replicates at every dilution point [
51,
52]. The amplification efficiency was computed employing the equation E = [10
(-1/slope)] - 1 [
52], using the slope values derived from linear regression analysis. This analysis encompassed the log
10-transformed cDNA concentrations on the x-axis and corresponding Cq values on the y-axis. The calculated amplification efficiency for each primer pair ranged from 0.92 to 1.09, while maintaining a coefficient of determination (R
2) for the linear regression of at least 0.98 (
Table 2).
The cDNA quantification reactions were conducted in the StepOnePlus™ real-time PCR system (Applied Biosystems™; StepOnePlus™ Real-Time PCR Systems) using 96-well microplates [MicroAmp™ Fast 96 -well Reaction Plate (0.1 mL)] sealed with MicroAmp™ Optical Adhesive Film. The total reaction volume was 10 µL, consisting of 3.4 µL of cDNA, 1.6 µL of forward and reverse primer mix (800 nM), and 5 µL of PowerUp™ SYBR™ Green Master Mix (Applied Biosystems™). The thermocycling conditions included 50°C for 2 minutes, 95°C for 2 minutes, 40 cycles of 15 seconds at 95°C, and 30 seconds at 60°C.
After completing the cDNA quantitation reaction, a thorough assessment of target specificity was conducted through a dissociation curve analysis, employing the continuous melt curve setup as per the manufacturer’s specifications. Only samples demonstrating clear specificity in accordance with the dissociation curve were considered for subsequent analysis. Quantification cycle (Cq) values were extracted using StepOnePlus™ Software v2.3 (Applied Biosystems™). The baseline was automatically established, and the threshold was set manually during the exponential phase of amplification. For all cDNA quantification reactions, a consistent threshold value of 0.7707 was applied.”
The genes
Phvul.008G011000 (IDE) and
Phvul.001G133200 (ACT) served as reference genes [
44]. The arithmetic mean of quantification cycle (Cq) values [
53] was computed for each experimental condition under consideration. Relative expression levels were determined by normalizing Cq values with the reference genes, employing the 2
-ΔΔCT method [
54,
55]. Mean Cq values were derived for each gene in every experimental condition through the calculation based on three biological repetitions and three replicates (n=3x3). Top of Form
The investigation into the relative expression of candidate genes at the Co-AC locus and known disease resistance genes was conducted in response to race 73 of
C. lindemuthianum, spanning time points at 24, 48, 72, 96, and 120 hours post-inoculation (hpi) in the Amendoim Cavalo cultivar. The calibrator condition for each gene was the relative expression observed in the mock (control, without pathogen). For data analysis and presentation of results, a logarithmic base 2 transformation was applied before statistical analysis. The Alexander-Govern test, with a significance level of 5%, was utilized to compare expression levels among experimental conditions. Pairwise comparisons of relative expression means at different time points for each gene were assessed, with significance levels adjusted using Bonferroni correction (p≤0.05). These statistical analyses employed the ‘oneway.test’ [
56] and ‘companion’ R packages.
All data and statistical analyses were conducted using R software (version 4.0.3) (R Core Team), and plots were generated using the ggplot2 package [
57] and R base. Error bars, representing the standard deviation of the means from three biological and three technical replicates (3x3), were incorporated into the visualizations. Heatmaps representing mean Cq values were generated using the ‘heatmaply’ R package, and the dendrogram was constructed based on the Euclidean distance measure and the average linkage function [58] among the relative expression values of the genes.
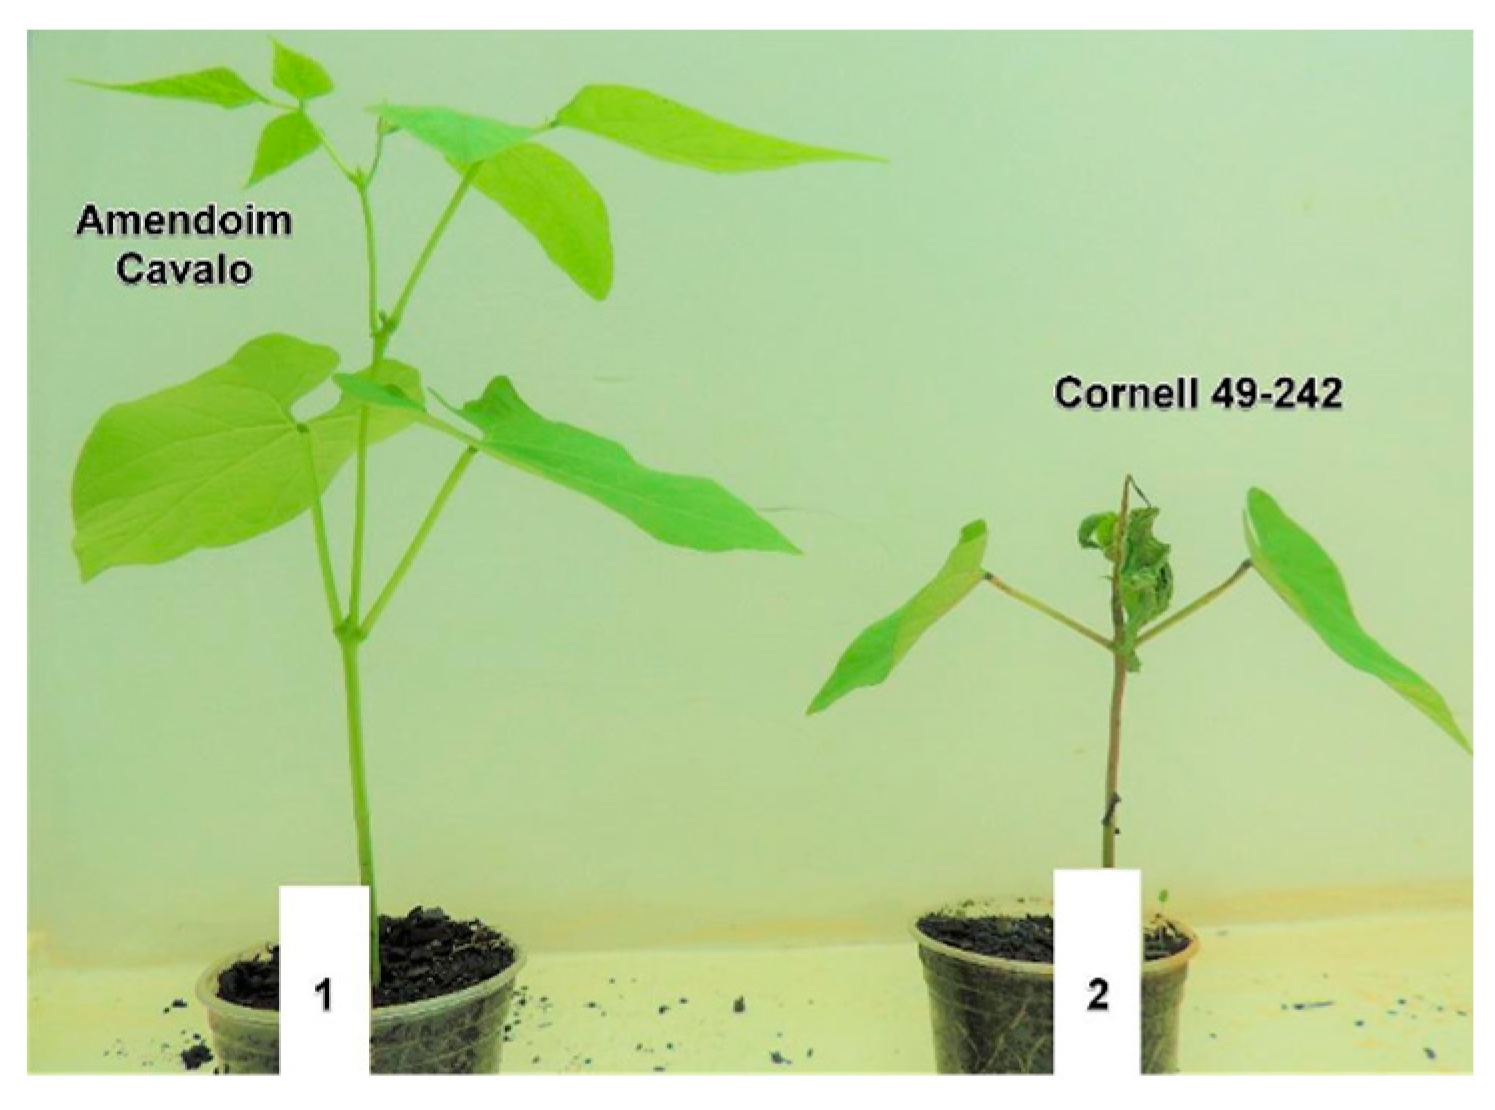
Figure 1.
Disease reaction of the resistant cultivar Amendoim Cavalo and susceptible cultivar Cornell 49-242 after 72 hours post-inoculation with race 73 of Colletotrichum lindemuthianum.
Figure 1.
Disease reaction of the resistant cultivar Amendoim Cavalo and susceptible cultivar Cornell 49-242 after 72 hours post-inoculation with race 73 of Colletotrichum lindemuthianum.
Figure 2.
Relative expression of candidate genes (A) Phvul.001G244500, (B) Phvul.001G245300, (C) Phvul.001G243800, (D) Phvul.001G244300, (E) Phvul.001G2444400, (F) KTR2/3, (G) Phvul.001G246300 in the Amendoim Cavalo at 24, 48, 72, 96, and 120 hours post-inoculation (hpi) with the race 73 of C. lindemuthianum and mock. The results are presented as logarithmic base 2 of the fold change of gene expression. Means with the same letter, for each gene, are not significantly different at the 5% significance level, using the Alexander-Govern test.
Figure 3.
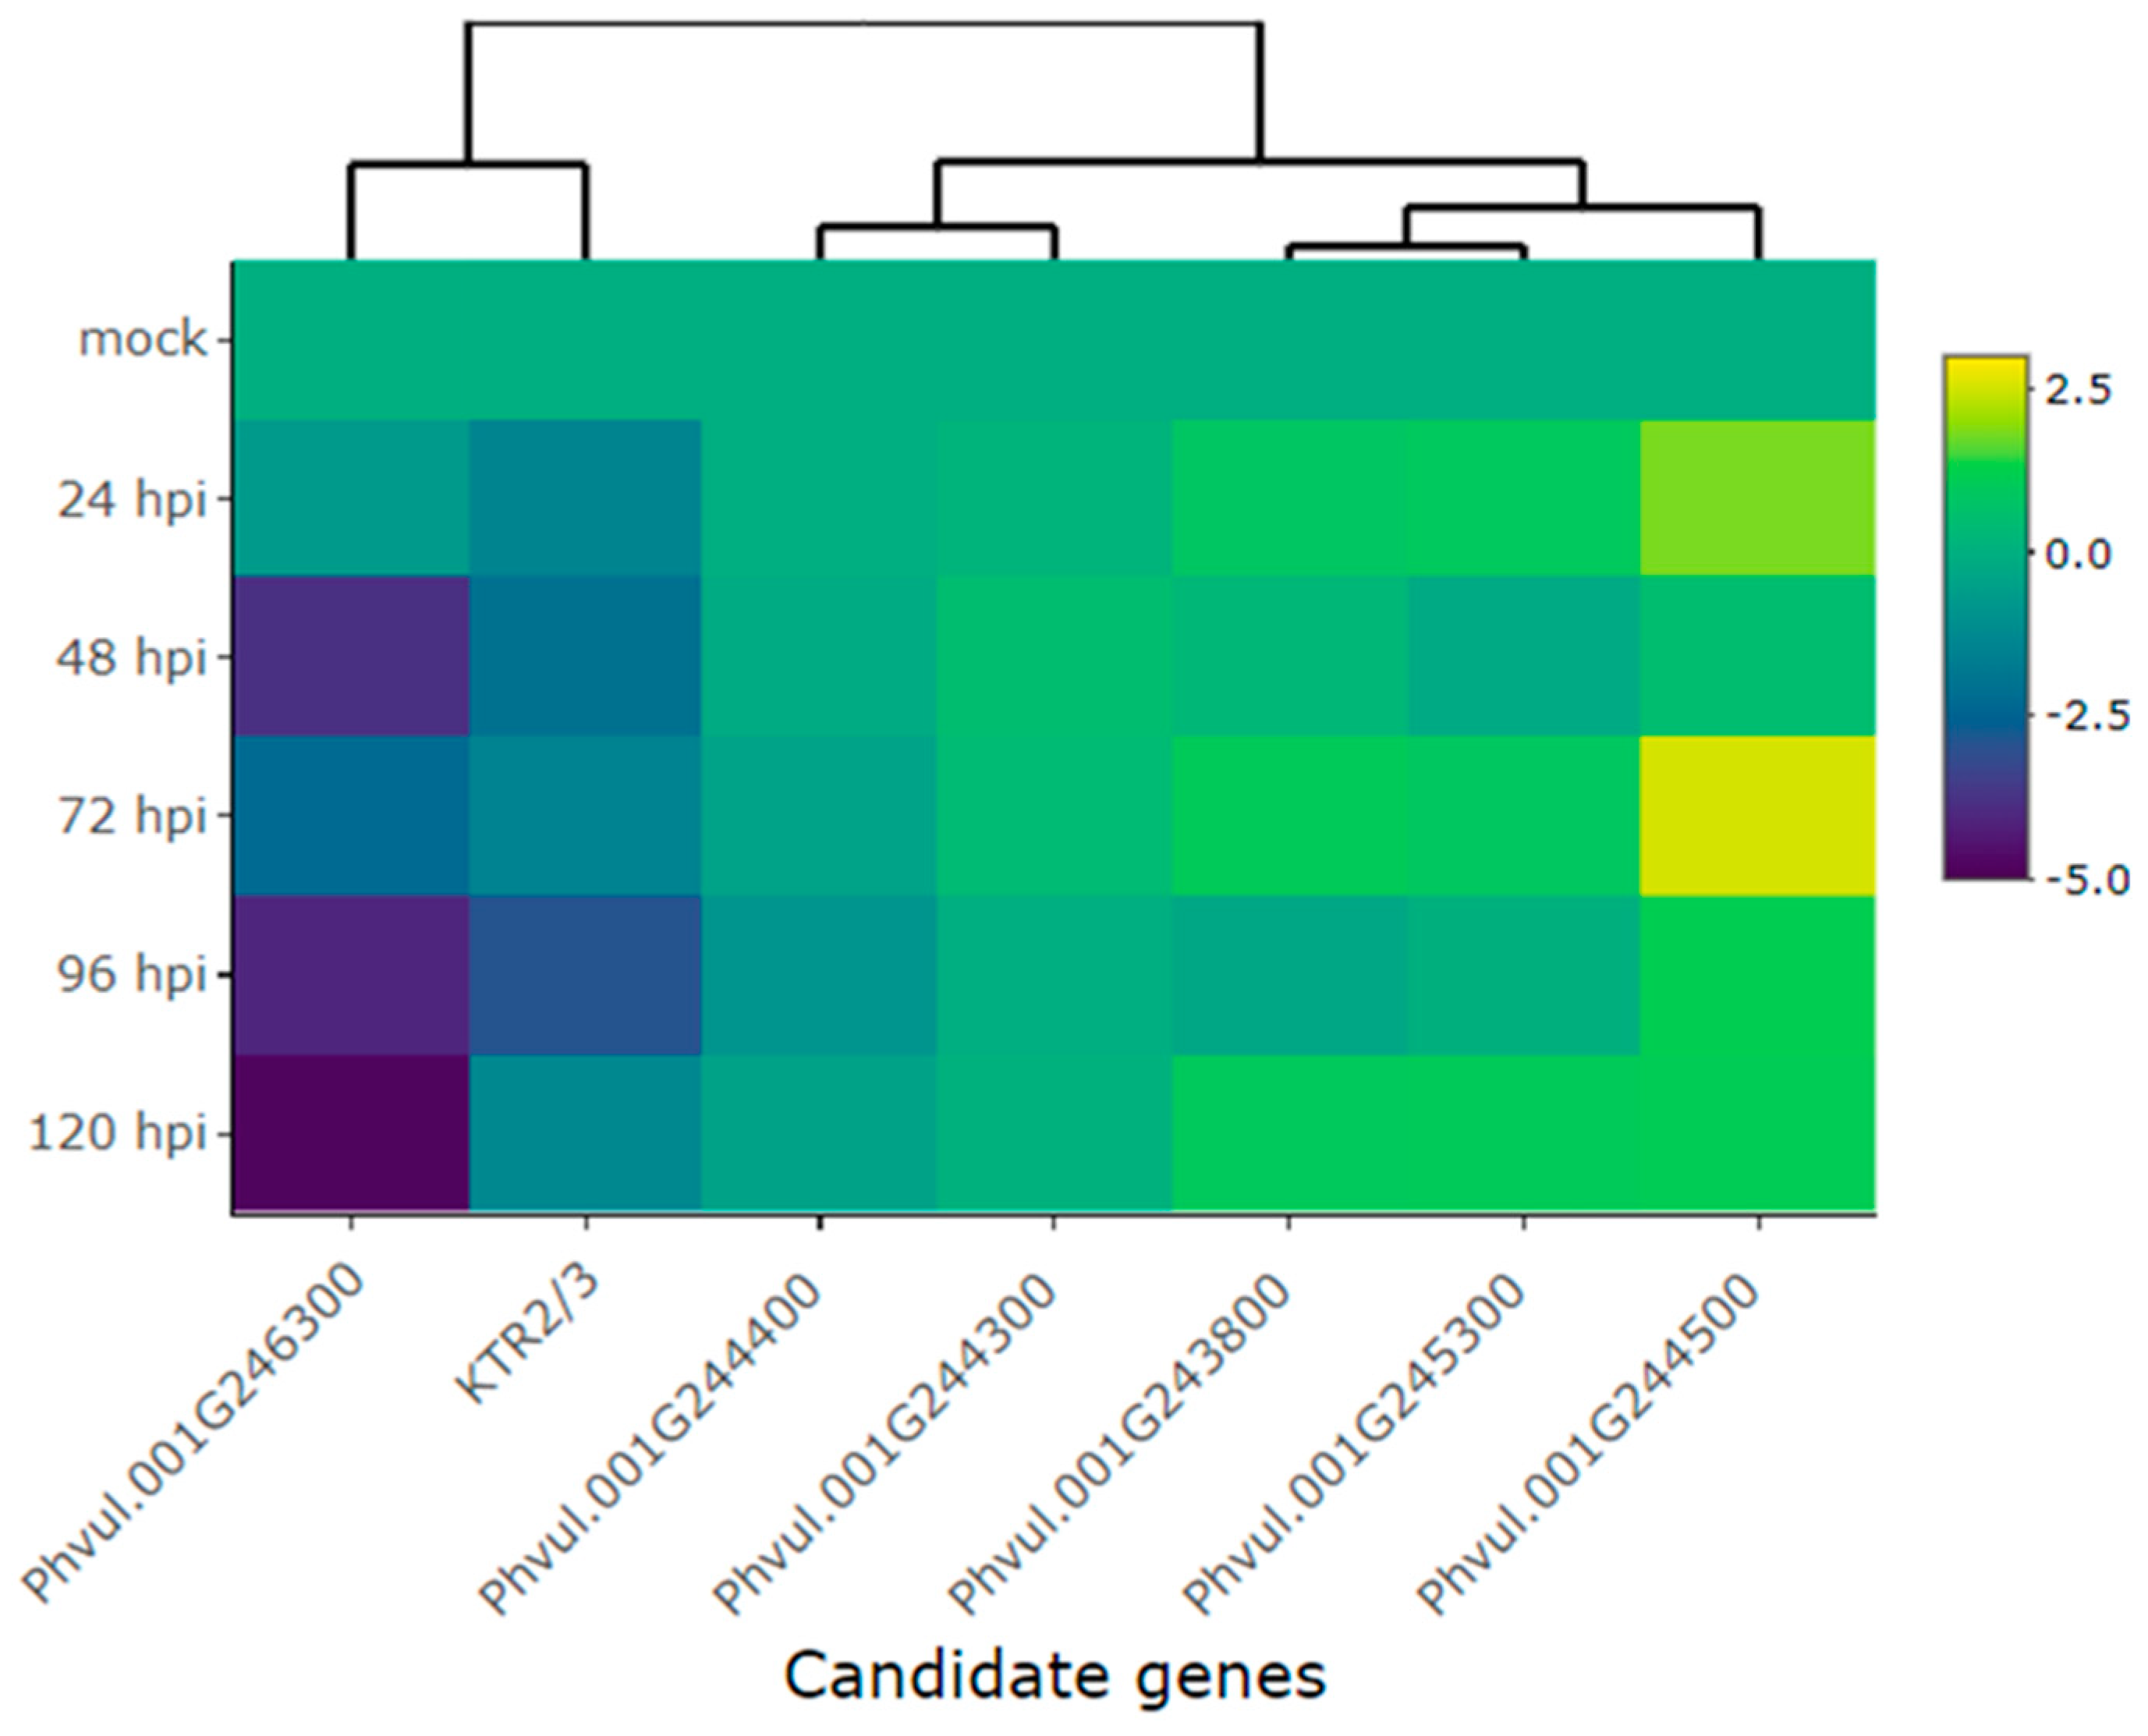
Heatmap of the relative expression of candidate genes for the Co-AC and genes proximal to this locus in the Amendoim Cavalo cultivar at 24, 48, 72, 96, and 120 hours post-inoculation (hpi) of race 73 of C. lindemuthianum and mock. The genes evaluated were Phvul.001G244500, Phvul.001G245300, Phvul.001G243800, Phvul.001G244300, Phvul.001G2444400, KTR2/3, Phvul.001G246300. Yellow shading indicates higher expression and dark blue shading has lower expression than reference genes.
Figure 4.
Relative expression of plant defense genes (A) Phvul.006G196900 (PR1b), (B) Phvul.003G109100 (PR1a), and (C) Phvul.009G256400 (PR2) in the common bean cultivar Amendoim Cavalo at 24, 48, 72, 96, and 120 hours post-inoculation (hpi) with the race 73 of C. lindemuthianum and mock. The results are presented as logarithmic base 2 of the fold change of gene expression. Means with the same letter, for each gene, are not significantly different at the 5% significance level, using the Alexander-Govern test.
Figure 5.
Heatmap of the relative expression of plant defense genes Phvul.006G196900 (PR1b), Phvul.003G109100 (PR1a), and Phvul.009G256400 (PR2) in the common bean cultivar Amendoim Cavalo at 24, 48, 72, 96 and 120 hours post-inoculation (hpi) of race 73 of C. lindemuthianum and mock. Yellow shading indicates higher expression and dark blue shading lower expression than that of reference genes.
Figure 6.
Common bean chromosome Pv01 containing candidate genes for anthracnose resistance genes Co-x (KTR2/3), Co-1 (Phvul.001G243800), Co-AC (Phvul.001G244300, Phvul.001G244400, and Phvul.001G244500), and CoPv01CDRK/PhgPv01CDRK (Phvul.001G245300, Phvul.001G246000, Phvul.001G246100, Phvul.001G246200, Phvul.001G246300, Phvul.001G246400 and Phvul.001G246800).
Table 1.
Gene model, previously mapped genes and functional annotation using Phytozome.
Table 1.
Gene model, previously mapped genes and functional annotation using Phytozome.
| Gene |
Gene model |
C. lindemuthianum race 73 |
| 24 hpi |
48 hpi |
72 hpi |
96 hpi |
120 hpi |
| Co-x |
KTR2/3 |
-1.4 |
-2.1 |
-1.4 |
-2.9 |
-1.3 |
| Co-1 |
Phvul.001G243800 |
0.8 |
0.3 |
1.0 |
-0.3 |
1.0 |
| Co-AC |
Phvul.001G244300 |
0.1 |
0.5 |
0.4 |
0.0 |
0.1 |
| Phvul.001G244400 |
0.0 |
-0.2 |
-0.4 |
-0.9 |
-0.5 |
| Phvul.001G244500 |
1.8 |
0.5 |
2.5 |
1.2 |
1.1 |
| CoPv01CDRK /PhgPv01CDRK |
Phvul.001G245300 |
1.0 |
-0.2 |
0.9 |
0.0 |
1.0 |
| Phvul.001G246300 |
-0.7 |
-3.8 |
-2.3 |
-4.1 |
-4.8 |
| Pathogenesis-related genes |
Phvul.003G109100 (PR1a) |
-0.9 |
-1.6 |
1.4 |
2.3 |
1.8 |
| Phvul.006G196900 (PR1b) |
-1.6 |
-2.0 |
1.4 |
3.8 |
3.9 |
| Phvul.009G256400 (PR2) |
-1.2 |
-1.0 |
0.6 |
1.2 |
1.8 |
Table 2.
Target genes, primers used, qPCR product size (amplicon), primer melting temperature (Tm), amplification efficiency (E) and coefficient of determination of linear regression (R²).
Table 2.
Target genes, primers used, qPCR product size (amplicon), primer melting temperature (Tm), amplification efficiency (E) and coefficient of determination of linear regression (R²).
| Genea
|
Reference |
Primers Forward (F) and |
Tm |
Amplicon |
E |
R² |
| Reverse (R) (5`-3`) |
(°C) |
(bp) |
| Phvul.001G133200* |
IDE |
F: AAGCAGGTATCTTGGCCATCTC |
F: 60.16 |
126 |
0.92 |
0.99 |
| R: AAAGCAAACTCCAAGCTCCAATC |
R: 59.99 |
| Phvul.008G011000* |
ACT |
F: ACAGCCAGGACCAGTTCATC |
F: 59.67 |
154 |
0.93 |
0.98 |
| R: TGTATGTGGTCTCGTGAATGC |
R: 58.38 |
| Phvul.001G243800 |
Co-1 |
F: CCTCAAGGTGGGGCTTTTGAG |
F: 61.16 |
118 |
1.01 |
0.99 |
| R: TCACCGAGAAACTCCCATTGC |
R: 60.61 |
| KTR2/3 |
Co-x |
F: ATGCACAGGGGAATGGGATG |
F: 60.11 |
279 |
1.06 |
0.98 |
| R: GCCATAGCGAGTGAGAGTGCG |
R: 63.42 |
| Phvul.001G244300 |
Co-AC |
F: GAAACGTCTCCGCAGAATAGTG |
F: 59.40 |
150 |
0.99 |
0.99 |
| R: GTCTTGTGTTGTTCCTTGGAGTTG |
R: 60.44 |
| Phvul.001G244400 |
Co-AC |
F: TACAGCAAGAGAGCGGTTAAAGG |
F: 60.62 |
121 |
1.07 |
0.99 |
| R: CCCTTTGTCACTTTGTTTTGAAGC |
R: 59.67 |
| Phvul.001G244500 |
Co-AC |
F: CAATGCACAGCTCGCAACTC |
F: 60.45 |
141 |
1.09 |
0.98 |
| R: GGAACTGTGAAAGCTCTGCTAAC |
R: 59.81 |
| Phvul.001G245300 |
CoPv01CDRK |
F: TCTGCTGGAAGGGTGGTAGTC |
F: 61.17 |
93 |
1.04 |
0.99 |
| R: GGACGTTATGTGAACAAGGTTTGC |
R: 61.08 |
| Phvul.001G246300 |
CoPv01CDRK |
F: CTTCTTCCCTTCACTTCGATACC |
F: 58.57 |
87 |
0.95 |
0.99 |
| R: GTTGAGAGTGTTTGTGGCAGT |
R: 58.98 |
| Phvul.003G109100 |
PR1a |
F: GTCCTAACGGAGGATCACTCA |
F: 58.62 |
148 |
1.01 |
0.98 |
| R: CAGGGATTGGCCAGAAGGTAT |
R: 59.50 |
| Phvul.006G196900 |
PR1b |
F: GGTTTGCCTATGATCCCAATGC |
F: 59.96 |
115 |
0.99 |
0.99 |
| R: TGTTGTGAGCGTTGAGGAAGTC |
R: 61.06 |
| Phvul.009G256400 |
PR2 |
F: CAGAGGTTCTCATTTGCTGCTTTC |
F: 60.62 |
98 |
1.09 |
0.99 |
| R: ATGCCATAACACACCCCGATTTG |
R: 61.75 |
