1. Introduction
In this century, there have been three global coronavirus epidemics, namely coronavirus disease-2019 (COVID-19), middle east respiratory syndrome (MERS), and influenza-a viruses. These outbreaks have caused significant health and economic damages [
1,
2,
3]. The COVID-19 pandemic, in particular, has affected nearly 700 million individuals and resulted in approximately 7 million deaths worldwide [
4]. One of the main ways through which the coronavirus is transmitted is via virus-loaded aerosols in the air. These aerosols are produced when infected individuals exhale air from their respiratory tract through speaking, exhaling, or coughing, causing the mucus layer on the inner walls of their respiratory airway to break into multiple small aerosols. Each aerosol has the capacity to carry a certain number of viruses [
5,
6,
7,
8]. Some of these virus-loaded aerosols are then carried into the external environment by the ongoing exhaled airflow. These suspended aerosols can linger for some time in the environment before being inhaled by uninfected individuals. Once inhaled, these virus-loaded aerosols can settle on the inner walls of the respiratory airway, paving the way for viral invasion of the immune system and subsequent infections [
6,
7,
8,
9,
10,
11,
12,
13,
14]. Therefore, the quantity of exhaled aerosols released into the external environment is directly connected to the risk of virus transmission [
15,
16,
17]. Deep investigation of the properties of exhaled aerosols is therefore of great significance in effectively addressing the potential for widespread epidemic transmission in the future. Understanding these properties will aid in the development of appropriate preventative measures and strategies to combat the spread of viruses like coronavirus.
Due to experimental and ethical limitations, conducting in-vivo/in-vitro experiments on respiratory airflow and aerosol dynamics in the human respiratory system is challenging. However, the computational fluid dynamics (CFD) method has been widely employed to study the aerosol dynamics in the human respiratory system [
18,
19,
20,
21,
22,
23]. This method offers advantages such as high visualization capabilities and low computational costs, without the constraints posed by experiments and medical ethics. For example, Jing et al. [
19] utilized large eddy simulation (LES) to comprehensively understand the evolution process of airflow within a whole-lung airway model, providing a solid foundation for investigating the subsequent transport and deposition of virus aerosols. Mortazavi et al. [
24] conducted a fluid-structure coupled simulation to examine the uptake of virus aerosols in the human respiratory airway using computer tomography (CT) imaging. Their findings revealed that nasal cavity virus deposition was lower when individuals exclusively breathed through their mouths. Additionally, they found that 10 μm aerosols had a deposition fraction of approximately 100% at an inspiration flow rate of 30 L/min. Beni et al. [
25] employed numerical methods to investigate the transport and deposition of virus droplets in the upper respiratory airway when individuals only breathed through their noses. Their results indicated that a high concentration of virus in the upper respiratory airway could potentially lead to headaches. Similarly, Wedel et al. [
26] analyzed the impact of age on aerosol deposition in the upper respiratory airway. Their results revealed higher aerosol deposition in the upper respiratory airway and a significant reduction in deposition in the lower respiratory airway. These studies showcase the utility of numerical methods and computational simulations in advancing our understanding of aerosol dynamics and virus deposition in the human respiratory system.
In addition to studying the deposition of inhaled aerosols in the human respiratory system, researchers have recently begun investigating the dynamics of exhaled virus aerosols expelled from the respiratory airway. For instance, Guo et al. [
27] explored the influence of airflow structures and the release locations of droplets on droplet deposition in the respiratory airway during exhalation. They also identified the critical particle size of exhaled droplets under specific scenarios. Furthermore, Ren et al. [
28] conducted simulations to examine the breaking process of the mucus layer under the wall shear stress of exhaled airflow during coughing. Their results demonstrated that at a peak flow rate of 6 L/s, the maximum airflow velocity near the respiratory airway wall could reach 38 m/s, with a shear stress of 14 Pa. However, their study did not specifically investigate the subsequent transport and deposition of droplets resulting from the breaking of the mucus layer within the respiratory airway. Moreover, both the high-speed airflow generated by laryngeal jets and the vibration of vocal cords contribute to the formation of virus aerosols. The bronchioles within the respiratory airway are also significant sites for virus aerosol production. Large aerosols generated in the bronchus are closer to the lungs and may carry a greater quantity of viruses, making them more contagious [
5,
27,
29]. Findings by Weolfel et al. [
30] indicated that COVID-19 viruses are more likely to replicate in the throat region of the upper respiratory airway in humans. Another study highlighted that the coronavirus omicron variant replicated faster in the human bronchus and slower in the human lung [
31]. These studies reveal that virus aerosols can exist in different locations within the respiratory airway.
In summary, although it is known that aerosols can be generated within the respiratory airway and exhaled, contributing to the transmission of the coronavirus, there are limited studies focusing on the characteristics of exhaled aerosols outside the respiratory airway, especially considering the thermal effects of the mucus layer [
20,
32,
33,
34,
35]. Therefore, this study aims to address this gap by investigating the exhaled characteristics of aerosols with diameters ranging from 0.1 to 20 μm (
dp=0.1, 0.3, 0.5, and 1-20 μm) and five different steady expiratory flow intensities (
Q=15, 30, 60, 90, and 120 L/min) at the mouthpiece using the Euler-Lagrange method.
2. Methodology
2.1. Geometrical Model and Mesh
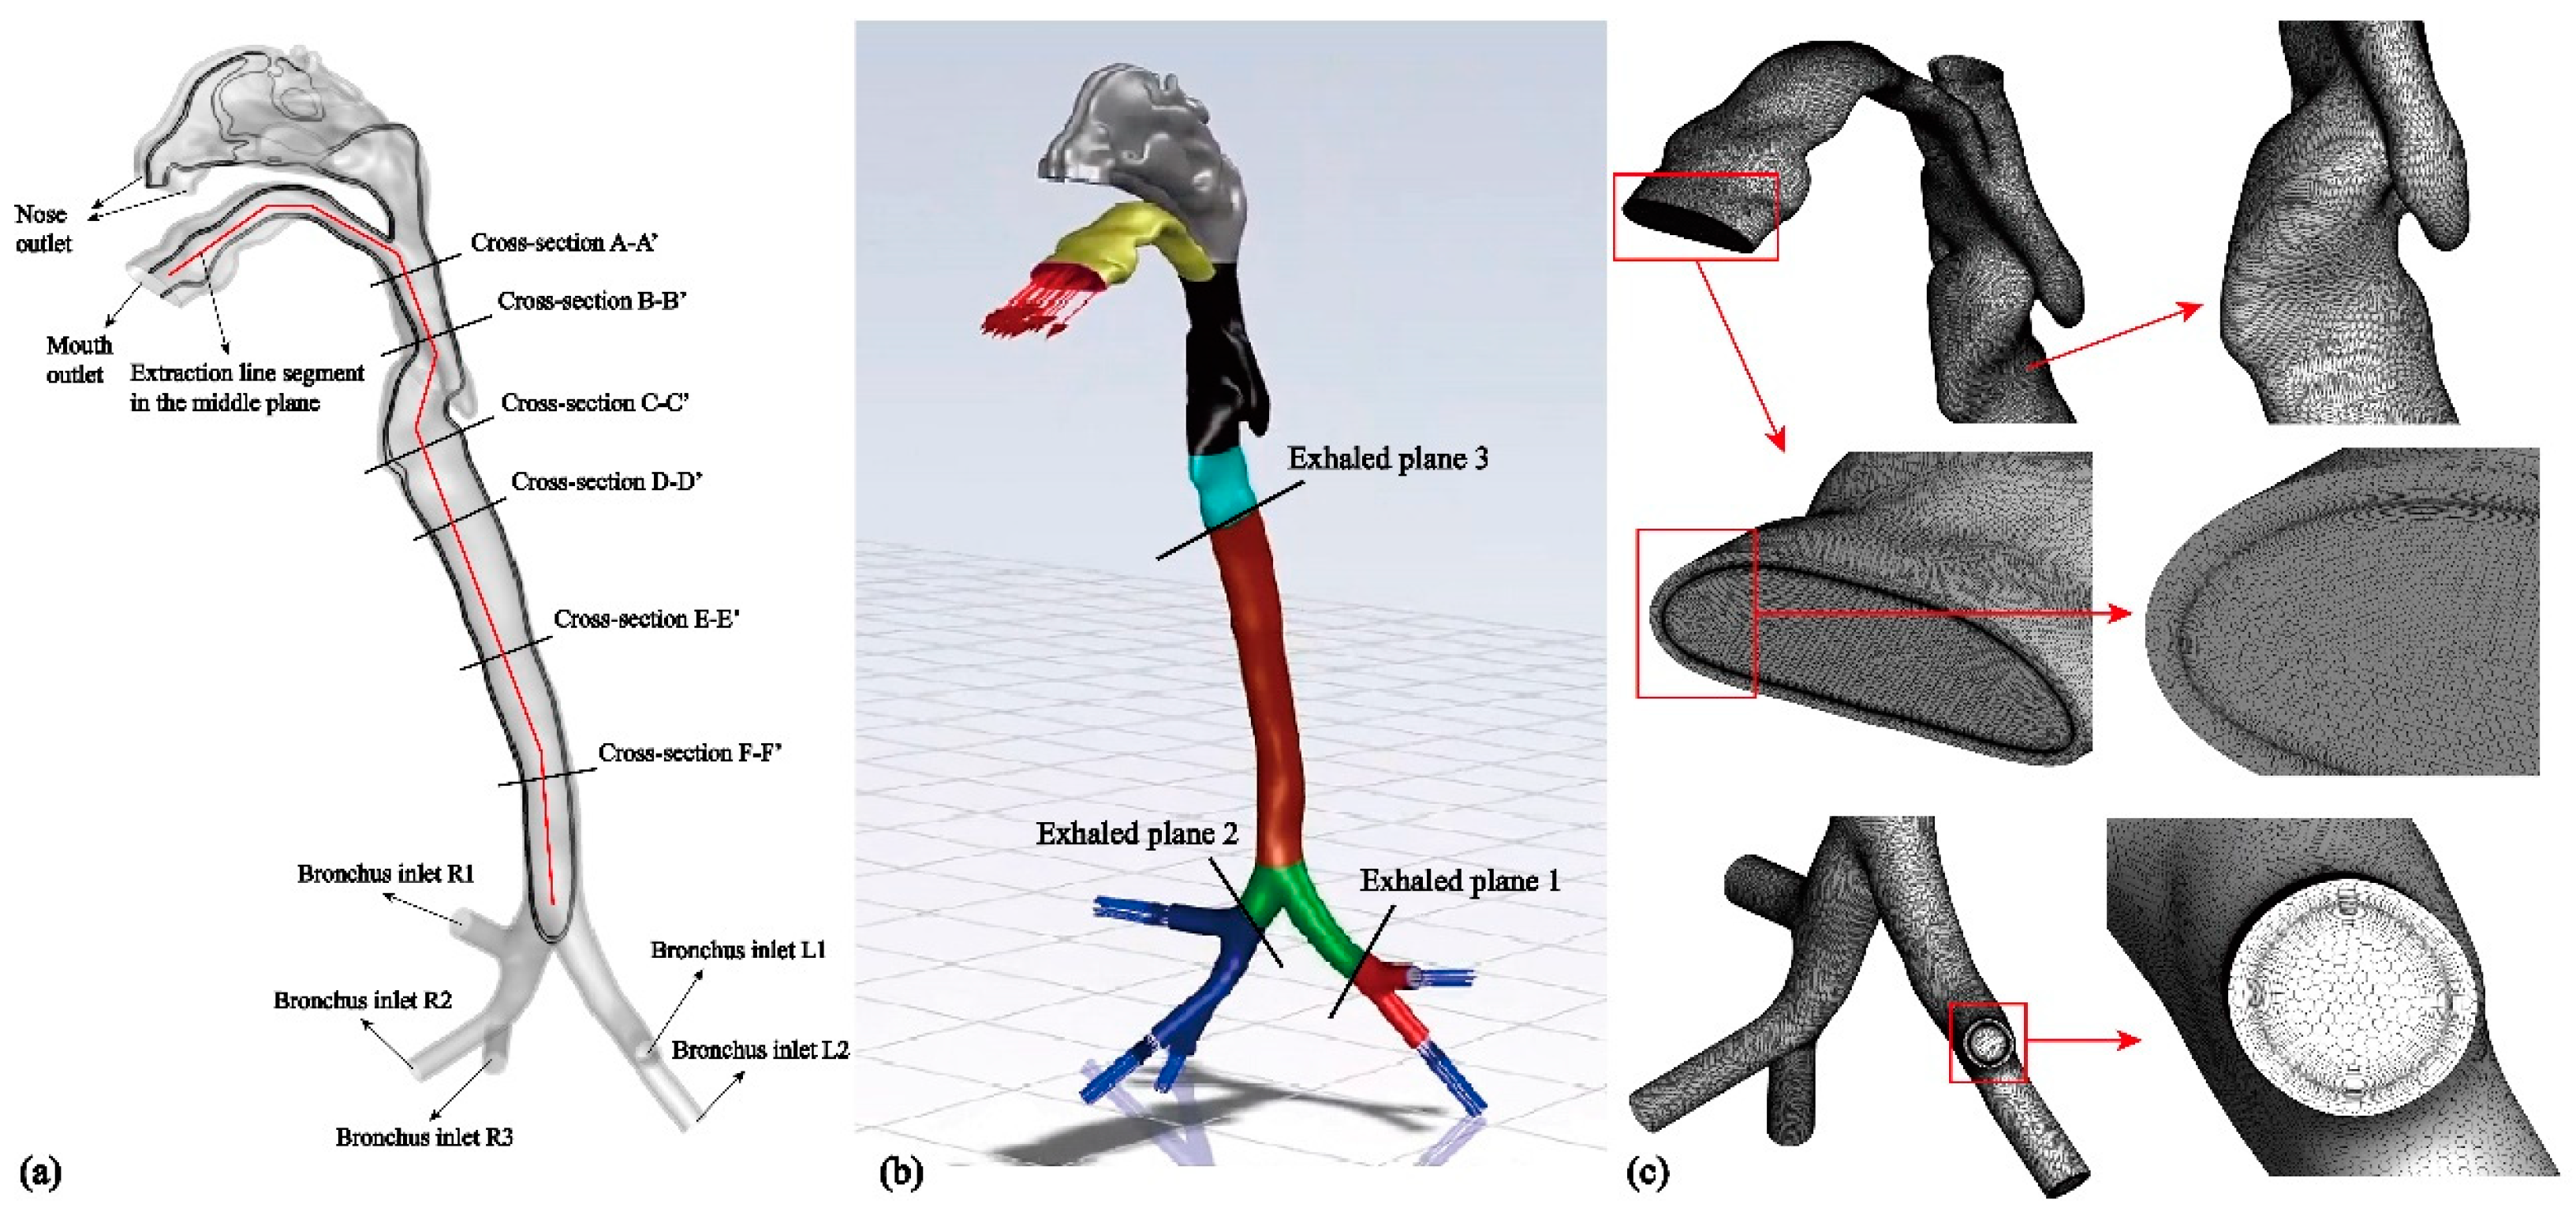
In this study, a realistic human respiratory airway model, including a mucus layer, was reconstructed using CT scans of a healthy Asian male volunteer (
Figure 1). The model comprises the mouth, nose, pharynx, larynx, main trachea, and G3-bronchus, which consists of five bronchial branches. To account for thermal effects, the shell model is extended outward by 1 mm to represent the mucus layer [
20,
33,
35,
36]. Due to the irregular morphology of the airway model, an unstructured polyhedral mesh is chosen to reduce the number of grids and conserve computational resources [
21,
35]. It is also important to consider the boundary layer adequately based on the chosen turbulence model and mesh structure. Specifically, eight boundary layers are applied to the fluid domain side, while six boundary layers are used on the mucus layer side (
Figure 2(c)). Additionally, the y+ value is set to be less than 1 to comply with the requirements of the turbulent model [
18,
21,
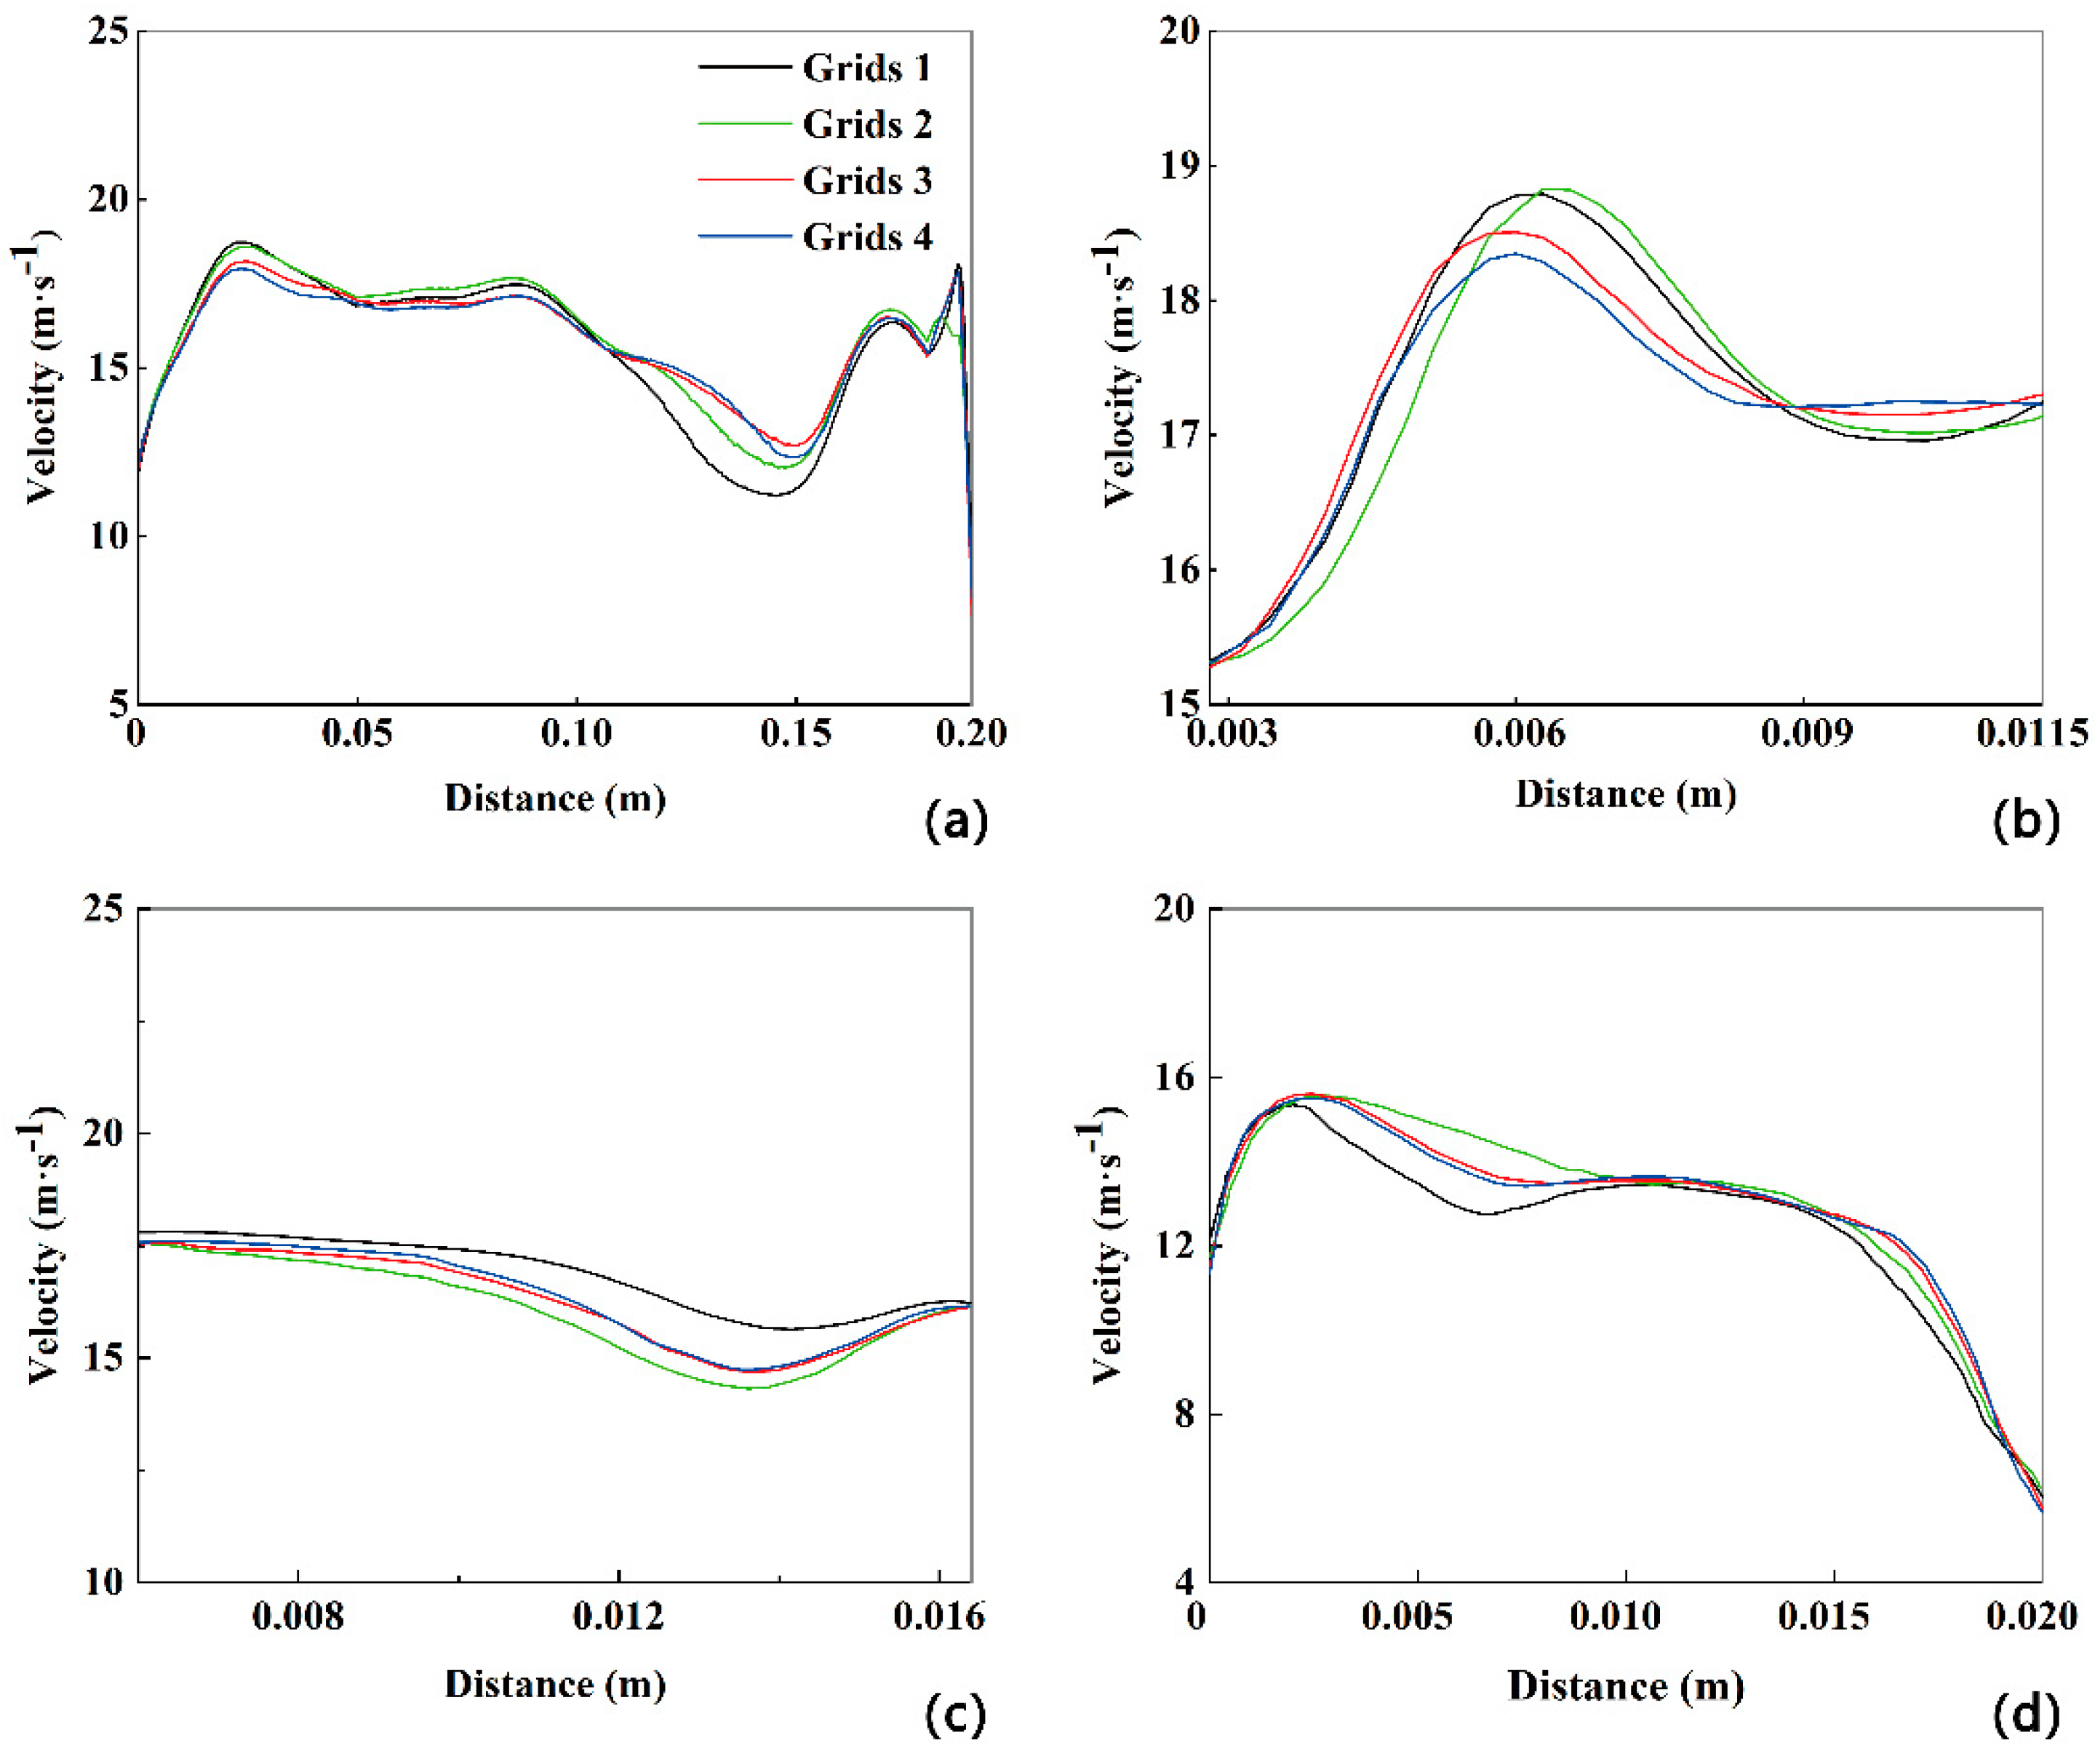
35]. To assess grid independence, four sets of grids with grid nodes numbering 13, 17, 21, and 29 million are employed.
2.2. Numerical Methods
In this study, the Euler-Lagrange method is utilized for solving the process of exhaled aerosol transport within the respiratory airflow. Assuming the exhaled air is a single-component gas, the RANS (Reynolds-averaged Navier-Stokes) Transition Shear-stress Transport turbulence model is employed to solve the continuity equation, momentum equation, and energy equation. The one-way coupling method is adopted, assuming that the volume fraction of aerosols in the air is small [
16,
18,
20,
21]. Due to the complex composition of virus-loaded aerosols, including not only viruses but also proteins, electrolytes, inorganic salts, and other components [
11], there is currently no precise model available to describe the exhaled aerosol from within the human respiratory airway. Consequently, the literature assumes that the density of the exhaled virus-loaded aerosol is the same as water and that it has a spherical shape [
27]. We adopt the same assumptions in the present work. The discrete phase model (DPM) within ANSYS Fluent is employed to simulate the transport and deposition of exhaled aerosols [
18,
20,
21,
22].
2.2.1. Governing Equations of the Airflow
The continuity equation, momentum equation and energy equation of the airflow are expressed as follows [
21,
36]:
where
t is the air flow time and
is the air density;
and
are the airflow velocity and displacement;
and
are the average time velocity in the
i and
j direction;
,
and
T are the thermal conductivity, dynamic viscosity coefficient and temperature of airflow, respectively. Then, the stress term
is defined by:
where
and
are the fluctuant velocity in the
i and
j direction;
and
k are the turbulent viscosity and turbulent kinetic energy of airflow. Then the turbulent kinetic energy equation of airflow is defined by [
37]:
where
,
,
and
are the correction of turbulent kinetic energy production term, correction of turbulent kinetic energy dissipation term, turbulent Prandtl number and effective intermittent factor, respectively. And the
and
are defined by:
Then, the equation of turbulence specific dissipation rate of airflow is expressed as [
37]:
where
is the airflow turbulence specific dissipation rate (
);
and
are the production term and dissipation term of turbulence specific dissipation rate (N/m
4), respectively.
Since the flow velocity of the mucus layer is 91.6 μm/s, it can be considered as a stationary solid wall. Assuming that it has the same physical properties as water, the governing equation about heat transfer considering the mucus layer is expressed as [
20,
33,
35]:
where
T,
,
and
h are the temperature, thermal conductivity, density and enthalpy of mucus layer, respectively.
2.2.2. Transport Equations of Virus Aerosols
According to Newton’s second law, the movement equation of a virus aerosol is defined by:
where
,
,
and
represent the drag force, gravitational force, thermophoretic force and Brownian force exerted on virus aerosols.
and
are the mass and velocity of virus aerosol. The drag force
is defined by [
21]:
where
and
are the density and diameter of virus aerosols. And for submicron virus aerosols, the drag force
can be simplified as:
where the coefficient
is defined by [
21,
38]:
And the gravity force
is defined by:
Similarly, the thermophoretic force
is defined by [
21,
36]:
where
is the thermophoretic coefficient. And since a virus aerosol is assumed as a spherical particle and the air is ideal gas,
can be given by [
16,
37,
38]:
Then, the Knudsen number
is defined as [
21]:
where
is the mean free path, and coefficients
,
,
, respectively. Then, the coefficient
is defined as [
21,
38]:
where
k is the air thermal conductivity based on average kinetic energy, and
is the thermal conductivity of virus aerosols. Specifically, for virus aerosols with submicron diameter, the Brownian force
can be defined as follows [
20,
21,
38]:
where
is the kinematic viscosity of air,
is the Boltzmann constant and
is a Gaussian random number with zero mean and independent unit variance [
20,
21,
38].
In order to consider the influence of turbulent diffusion on the movement trajectory of virus aerosols, the fluctuation velocity of virus aerosols needs to be corrected. The fluctuation velocity of virus aerosol is a piecewise constant function, defined by the following formula [
21,
23,
38]:
where
and
are the normally distributed random number and root mean square of the velocity fluctuation. For isotropic turbulent airflow-field,
is given by [
21,
23,
38]:
It is assumed that the virus aerosols interact with the vortex for a short time during the vortex lifetime and particle-vortex crossing time. When this time is reached, the new value of the instantaneous velocity is obtained by applying the new value of
in formula (2.21). Thus, the eddy life can be defined by [
23,
38]:
where
is a constant,
is turbulence kinetic energy dissipation rate, and the particle-vortex crossing time can be given by [
23,
38]:
where
is the relaxation time of the virus aerosols.
is the length of the vortex, which is defined by [
21,
23,
38]:
2.3. Simulation Setups
In this study, different exhaled airflow rates (
Q) of 15, 30, 60, 90, and 120 L/min are set as boundary conditions of velocity inlet at the end of the five bronchial airways, representing various human expiratory intensities [
16,
18,
20,
27]. The boundary condition of pressure outlet is set at the mouth lips. The temperature at the mouth lips is set to 15 ℃ [
16,
20]. The velocity at the airway wall is set to no-slip, and the temperature is set to 37 ℃ [
16,
20,
36]. The pressure and momentum equations of the airflow are discretized using the second-order upwind scheme, and the equations are solved using the Simple (Semi-Implicit Method for Pressure Linked Equations) algorithm in ANSYS Fluent until convergence is achieved, with an iterative error less than 10
-5. To generate aerosols, an in-house code is used to randomly distribute 10,000 aerosols at three cross sections, as shown in
Figure 1(b). Cross section-1 and section-2 are located in the bronchus, while cross section-3 is located in the larynx. Aerosol diameters range from 0.1 μm to 1-20 μm. The initial velocity of the aerosols is equal to the airflow velocity [
18,
23,
27].
In the DPM model, the respiratory airway wall is set as the ''Trap'' boundary condition, meaning that once aerosols come into contact with the respiratory airway wall, they are considered to be ''deposited''. The mouth outlet is set as an ''Escaped'' boundary condition, through which aerosols enter the external environment [
21]. Aerosols are tracked individually until they are either removed from the airflow field or deposited on the respiratory wall. Additionally, in turbulent airflow, both fluctuating velocity and average velocity of the airflow can affect aerosol transport and deposition. Thus, the discrete random walk (DRW) model of particles is adopted in to consider the effect of fluctuating velocity on aerosol transport and deposition [
21,
38]. All numerical simulations are performed using ANSYS Fluent on a local self-assembly workstation. The workstation is equipped with an Intel® Xeon® Platinum 8280L CPU running at 2.60 GHz, with dual processors, 28 cores, and 128 GB RAM. Each simulation case takes approximately 20 hours to calculate.
3. Results
3.1. Evaluation Grid Independence
The accuracy of the numerical simulation greatly relies on the number of cells in the grid. Therefore, in order to determine the most appropriate grid, the grids with 13, 17, 21, and 29 million cells are used when turbulence is strongest in the human upper airway at
Q=180 L/min. As depicted in
Figure 2, as the number of cells increases from 13 million to 29 million, the velocity profiles along the extracted polyline at the mid-plane and several cross-sections (B-B', D-D', and F-F') remain consistent, with a deviation of less than 5%. Hence, the grid with 21 million cells is selected for all subsequent numerical simulations, taking into account both calculation accuracy and computational resources.
3.2. Validation of Methodology
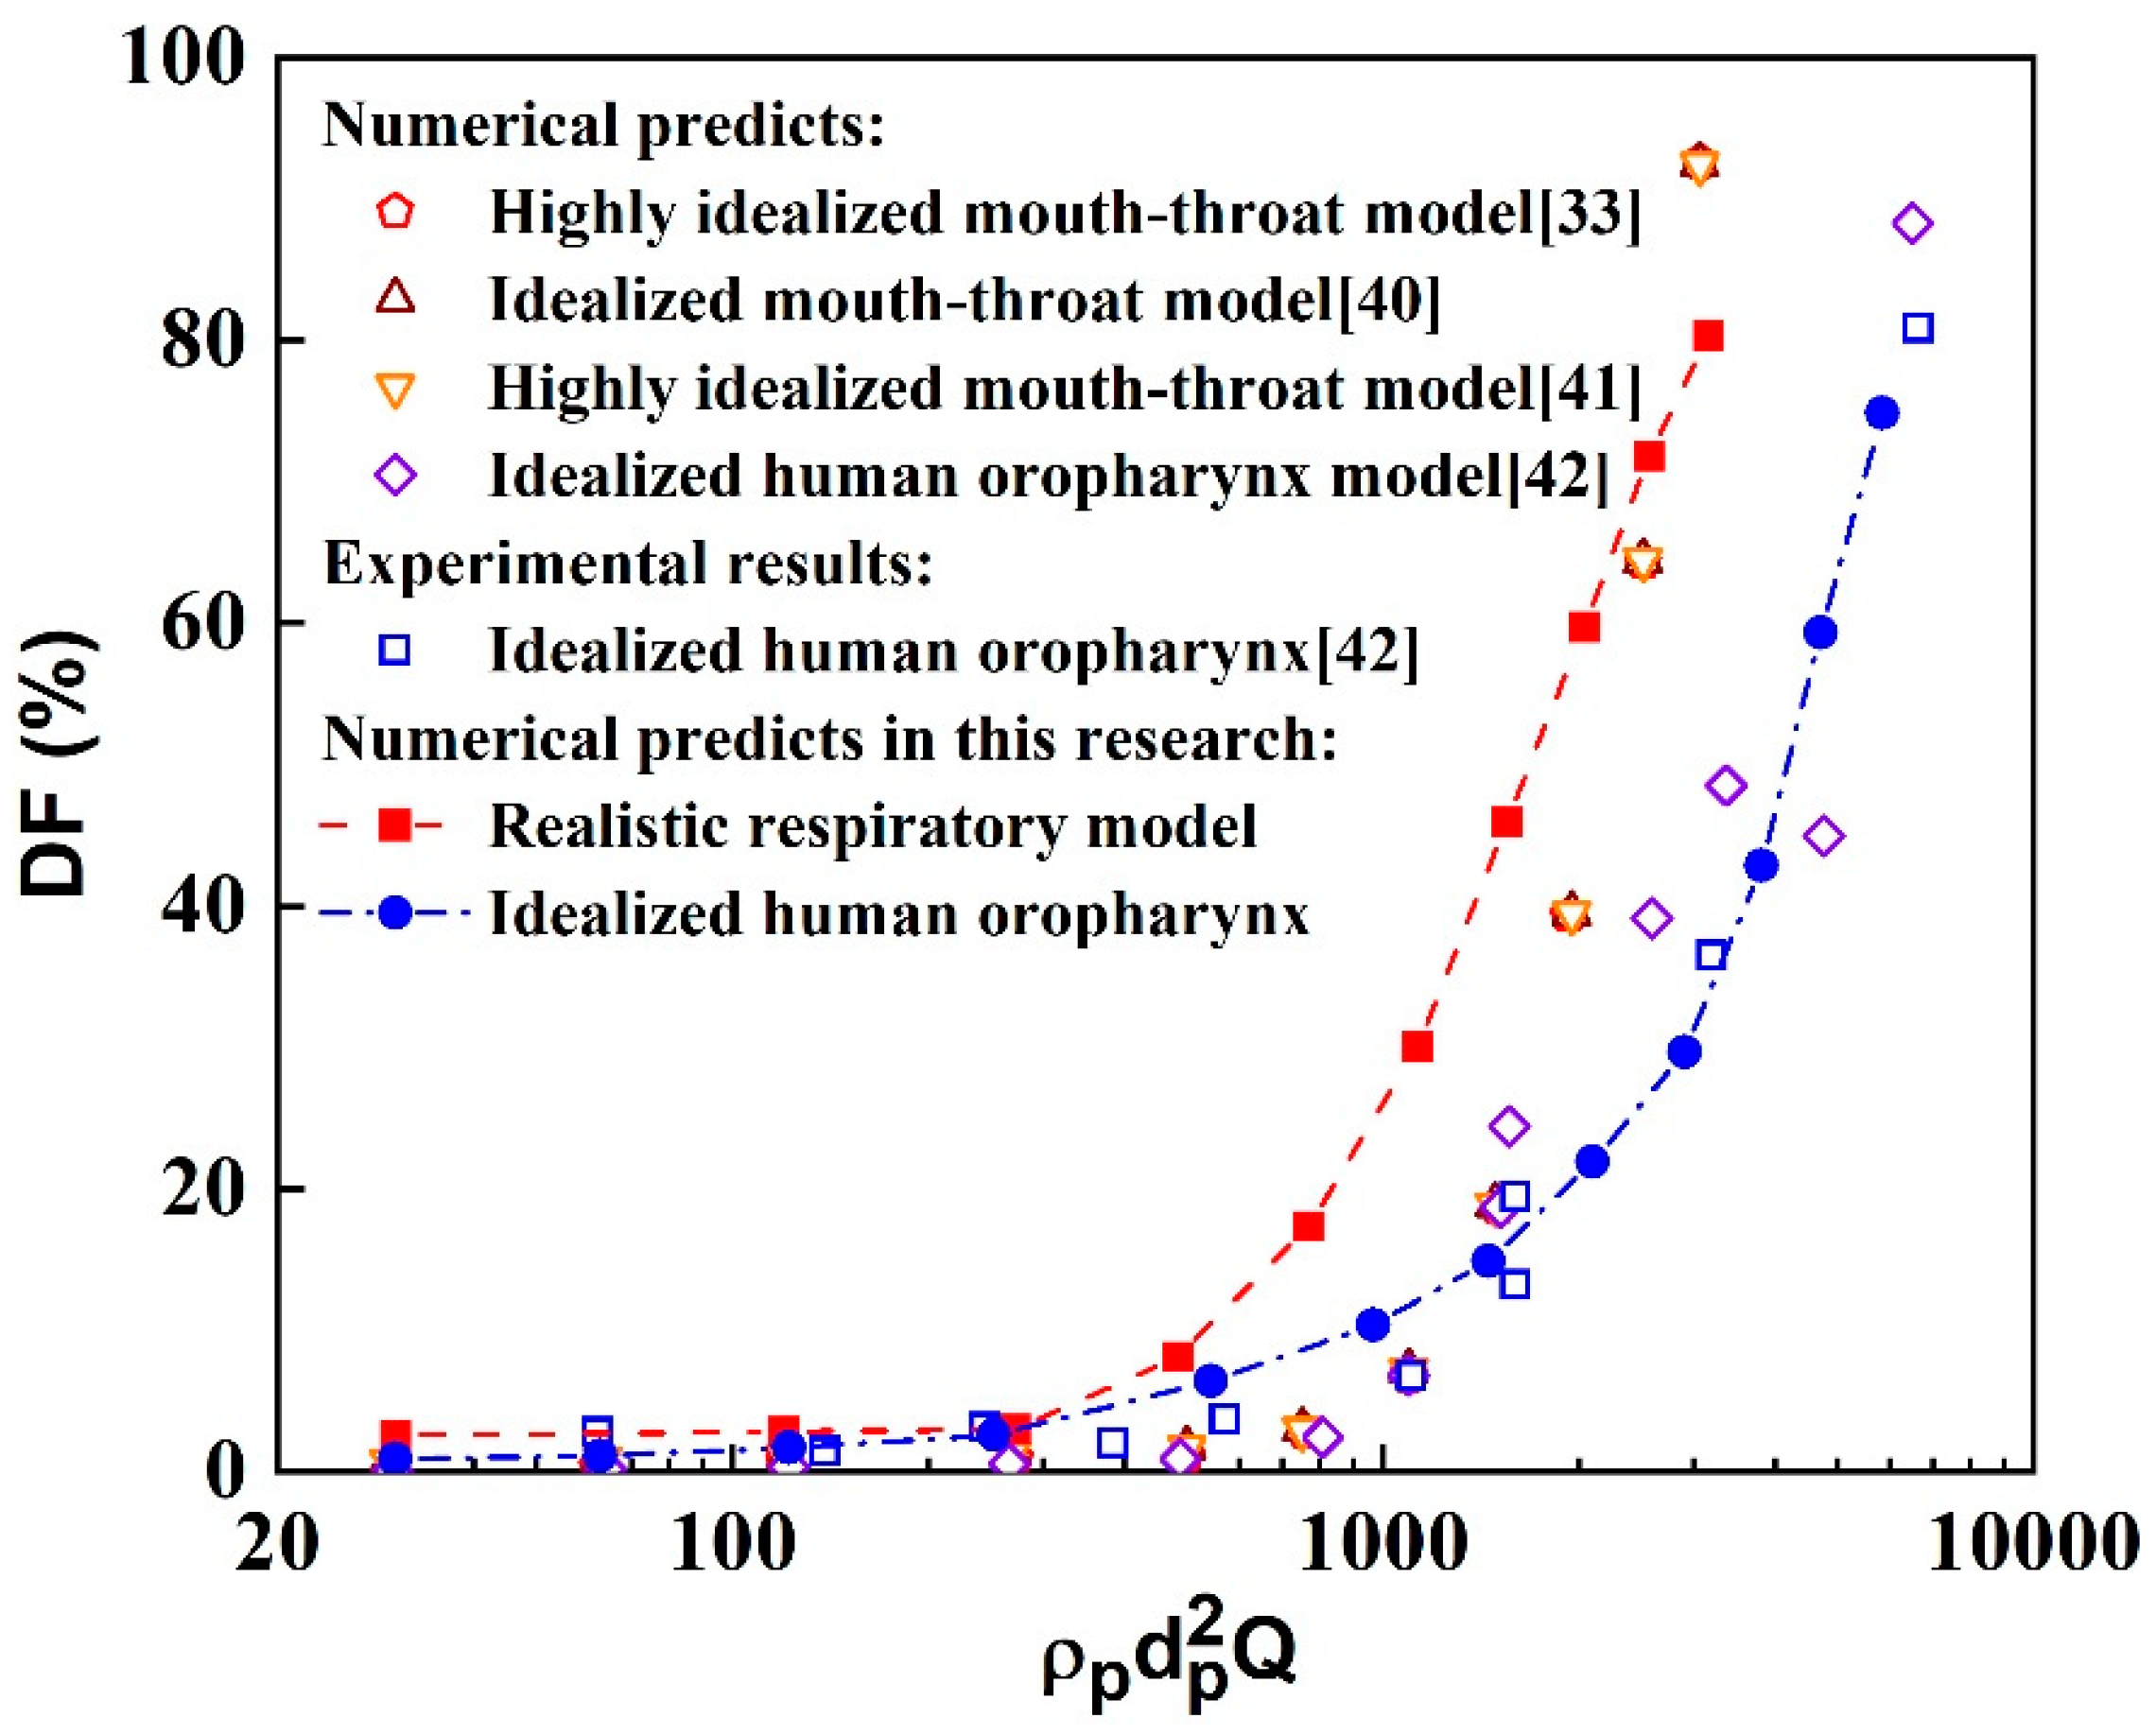
This study evaluates the particle tracking method by comparing the deposition fraction (
DF) obtained from the present methodology with values reported in the literature. Here, the
DF is defined as the ratio of the deposited aerosol number (
) to the total aerosol number (
), i.e.,
. The inertial factor (
), defined as the product of aerosol density, the square of diameter and the rate of airflow, is also used for this evaluation [
33,
37,
38,
39]. The comparative results of the numerical and experimental particle deposition fractions in different human respiratory airway models are shown in
Figure 3. Some of the data were obtained from simplified airway models, while others were obtained from realistic airway models. Overall, the particle deposition fractions obtained from the present simulation method in the idealized human oropharynx model are in good agreement with the literature, although some differences exist. For example, the deposition fractions of small particles are slightly higher compared to the literature. Conversely, the particle deposition fractions in the realistic human respiratory airway model are slightly higher than those reported in the literature. These differences can be attributed to several factors, including variations in the geometric structure between the realistic human respiratory airway model used in this research and the simplified models, as well as differences in particle transport models and computational setups for numerical simulations. However, these disparities do not affect the fundamental results and analysis of aerosol transport and deposition in the realistic human respiratory airway model. Therefore, the numerical simulation method employed in this study is deemed reliable for simulating aerosol dynamics in the human respiratory airway.
3.3. Airflow Field
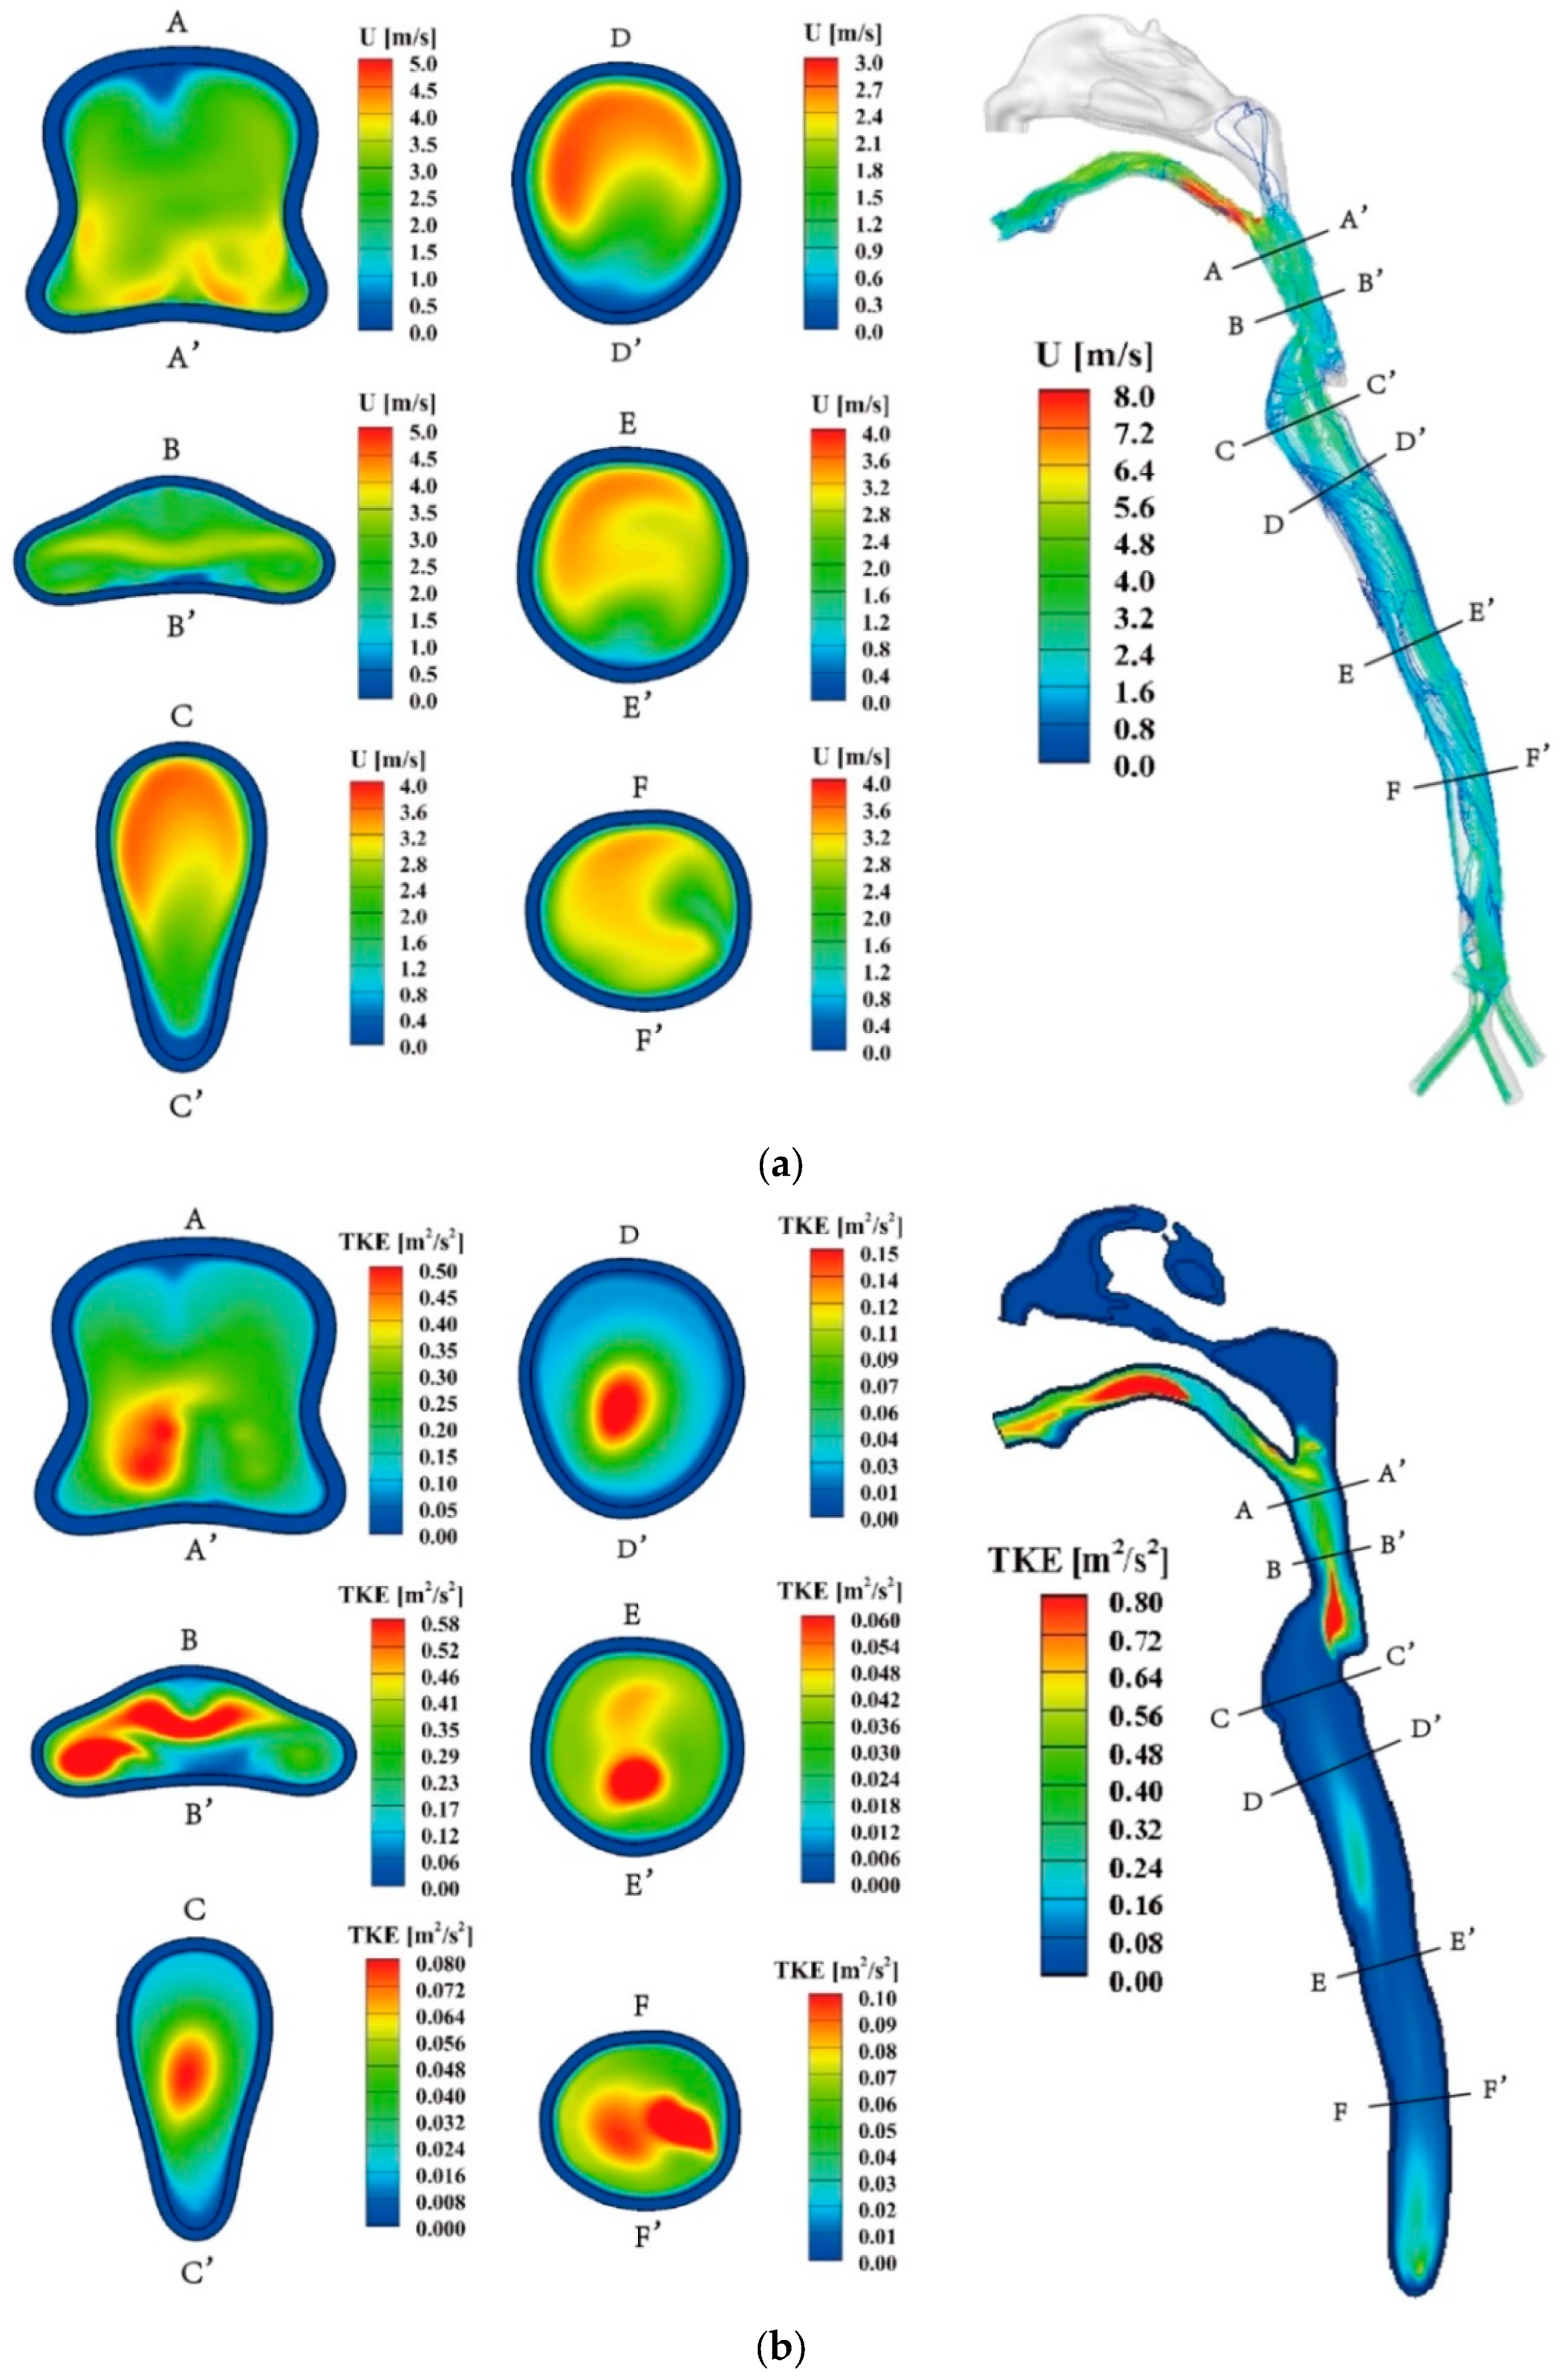
Figure 4(a) displays the velocity characteristics of exhaled air during the expiration process at
Q= 30 L/min (hereafter), wherein the air enters the bronchus and exits through the mouth. The airflow in the trachea region is relatively uniform due to its relatively regular structure. A long and narrow recirculation region forms on the front side of the trachea (section FF' to DD'). Upon passing through the glottis, the primary airflow gradually shifts from the posterior side to the central region of the respiratory airway (section CC' to BB'). In the throat, a high-speed airflow region emerges in front of the throat (section CC' to BB') and flow separation occurs near the rear side wall. The oropharynx region experiences an increased degree of airflow mixing, and flow separation becomes apparent in the front side wall of this region. The spatial distribution of airflow velocity and turbulent kinetic energy (TKE) within the human respiratory airway exhibits distinct differences, as depicted in
Figure 4(a) and (b). The maximum airflow velocity is observed at the end of the oropharynx region, indicating localized high-speed airflow. On the other hand, TKE peaks are observed in both the throat and mouth regions, suggesting greater turbulence in these areas. Furthermore, the front region of the trachea exhibits higher TKE values.
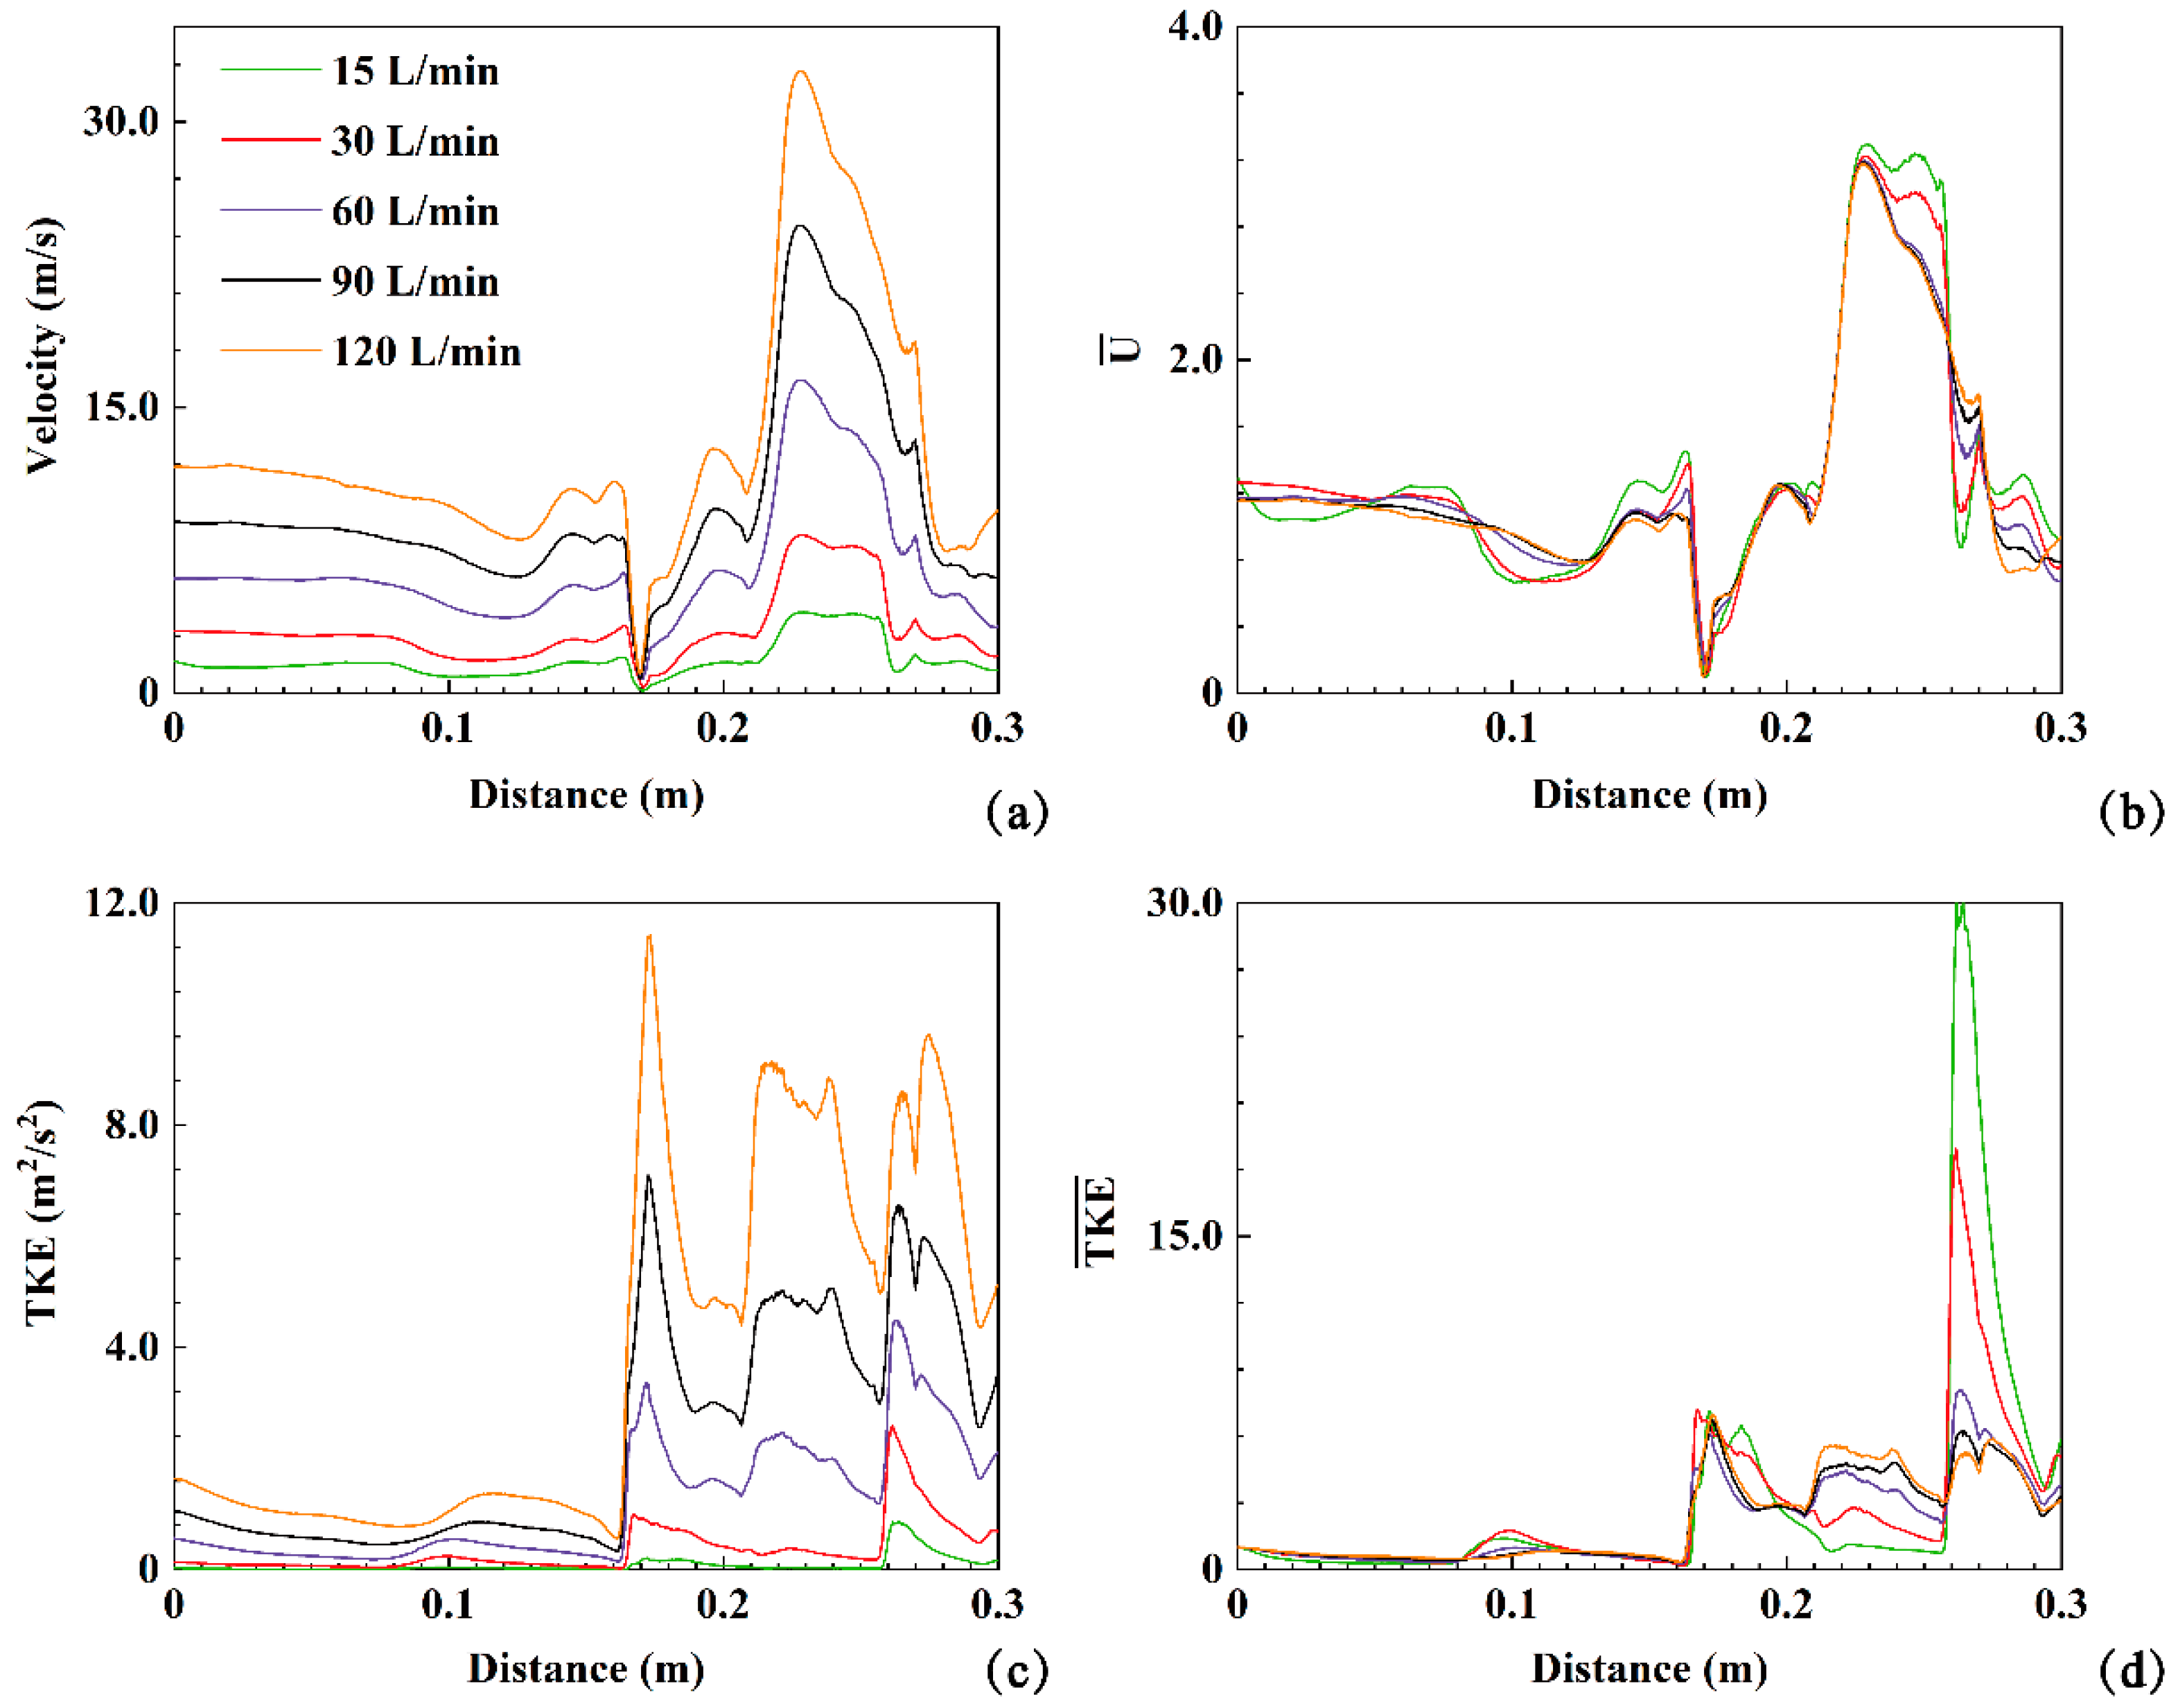
The velocity, turbulent kinetic energy (TKE), dimensionless velocity (
), and dimensionless turbulent kinetic energy (
) are employed to quantitatively analyze the effect of expiratory intensity on airflow dynamics within the human respiratory airway (20). These values along the polylines in the respiratory airway at five expiratory intensities (
Q=15, 30, 60, 90, 120 L/min) are plotted in
Figure 5. As depicted in
Figure 5(a), a stagnation point is observed (indicated in the back of the throat region and at a distance of 0.17 m in
Figure 5(a)). After the stagnation point, the airflow velocity increases sharply in the oropharyngeal region and gradually decreases after reaching its peak (
Figure 4(a)). Similarly, three peaks along the TKE profiles are observed in
Figure 5(c). Furthermore, the airflow TKE reaches its maximum value of 12 m
2/s
2 under
Q=120 L/min, corresponding to the red region in the TKE contours between the B-B' and C-C' cross-sections in
Figure 4(b). The airflow TKE decreases after the B-B' section. The second peak of TKE occurs after passing through the A-A' section and entering the oropharynx region, followed by the third peak of TKE in the front region of the mouth. The expiratory intensity directly influences the airflow velocity and TKE. Higher expiratory intensity results in higher airflow velocity and TKE. For example, at
Q=15 L/min, the maximum airflow velocity and TKE are approximately 4.24 m/s and 0.86 m
2/s
2, respectively. Under
Q=120 L/min, these values increase to approximately 32.68 m/s and 11.42 m
2/s
2. The maximum values of velocity and TKE under
Q=120 L/min are approximately 7.71 and 13.28 times higher than those at
Q=15 L/min, respectively (
Figure 5(a, c)). The peaks of
and
fluctuate noticeably along the extracted polylines for the five different expiratory intensities, with maximum values close to 3.5 and 30, respectively. This indicates that changes in expiratory intensity do not significantly affect the overall airflow characteristics within the respiratory airway, but strongly impact local velocity distribution and turbulence.
3.4. The Destinations of Exhaled Aerosol from Bronchus
As depicted in
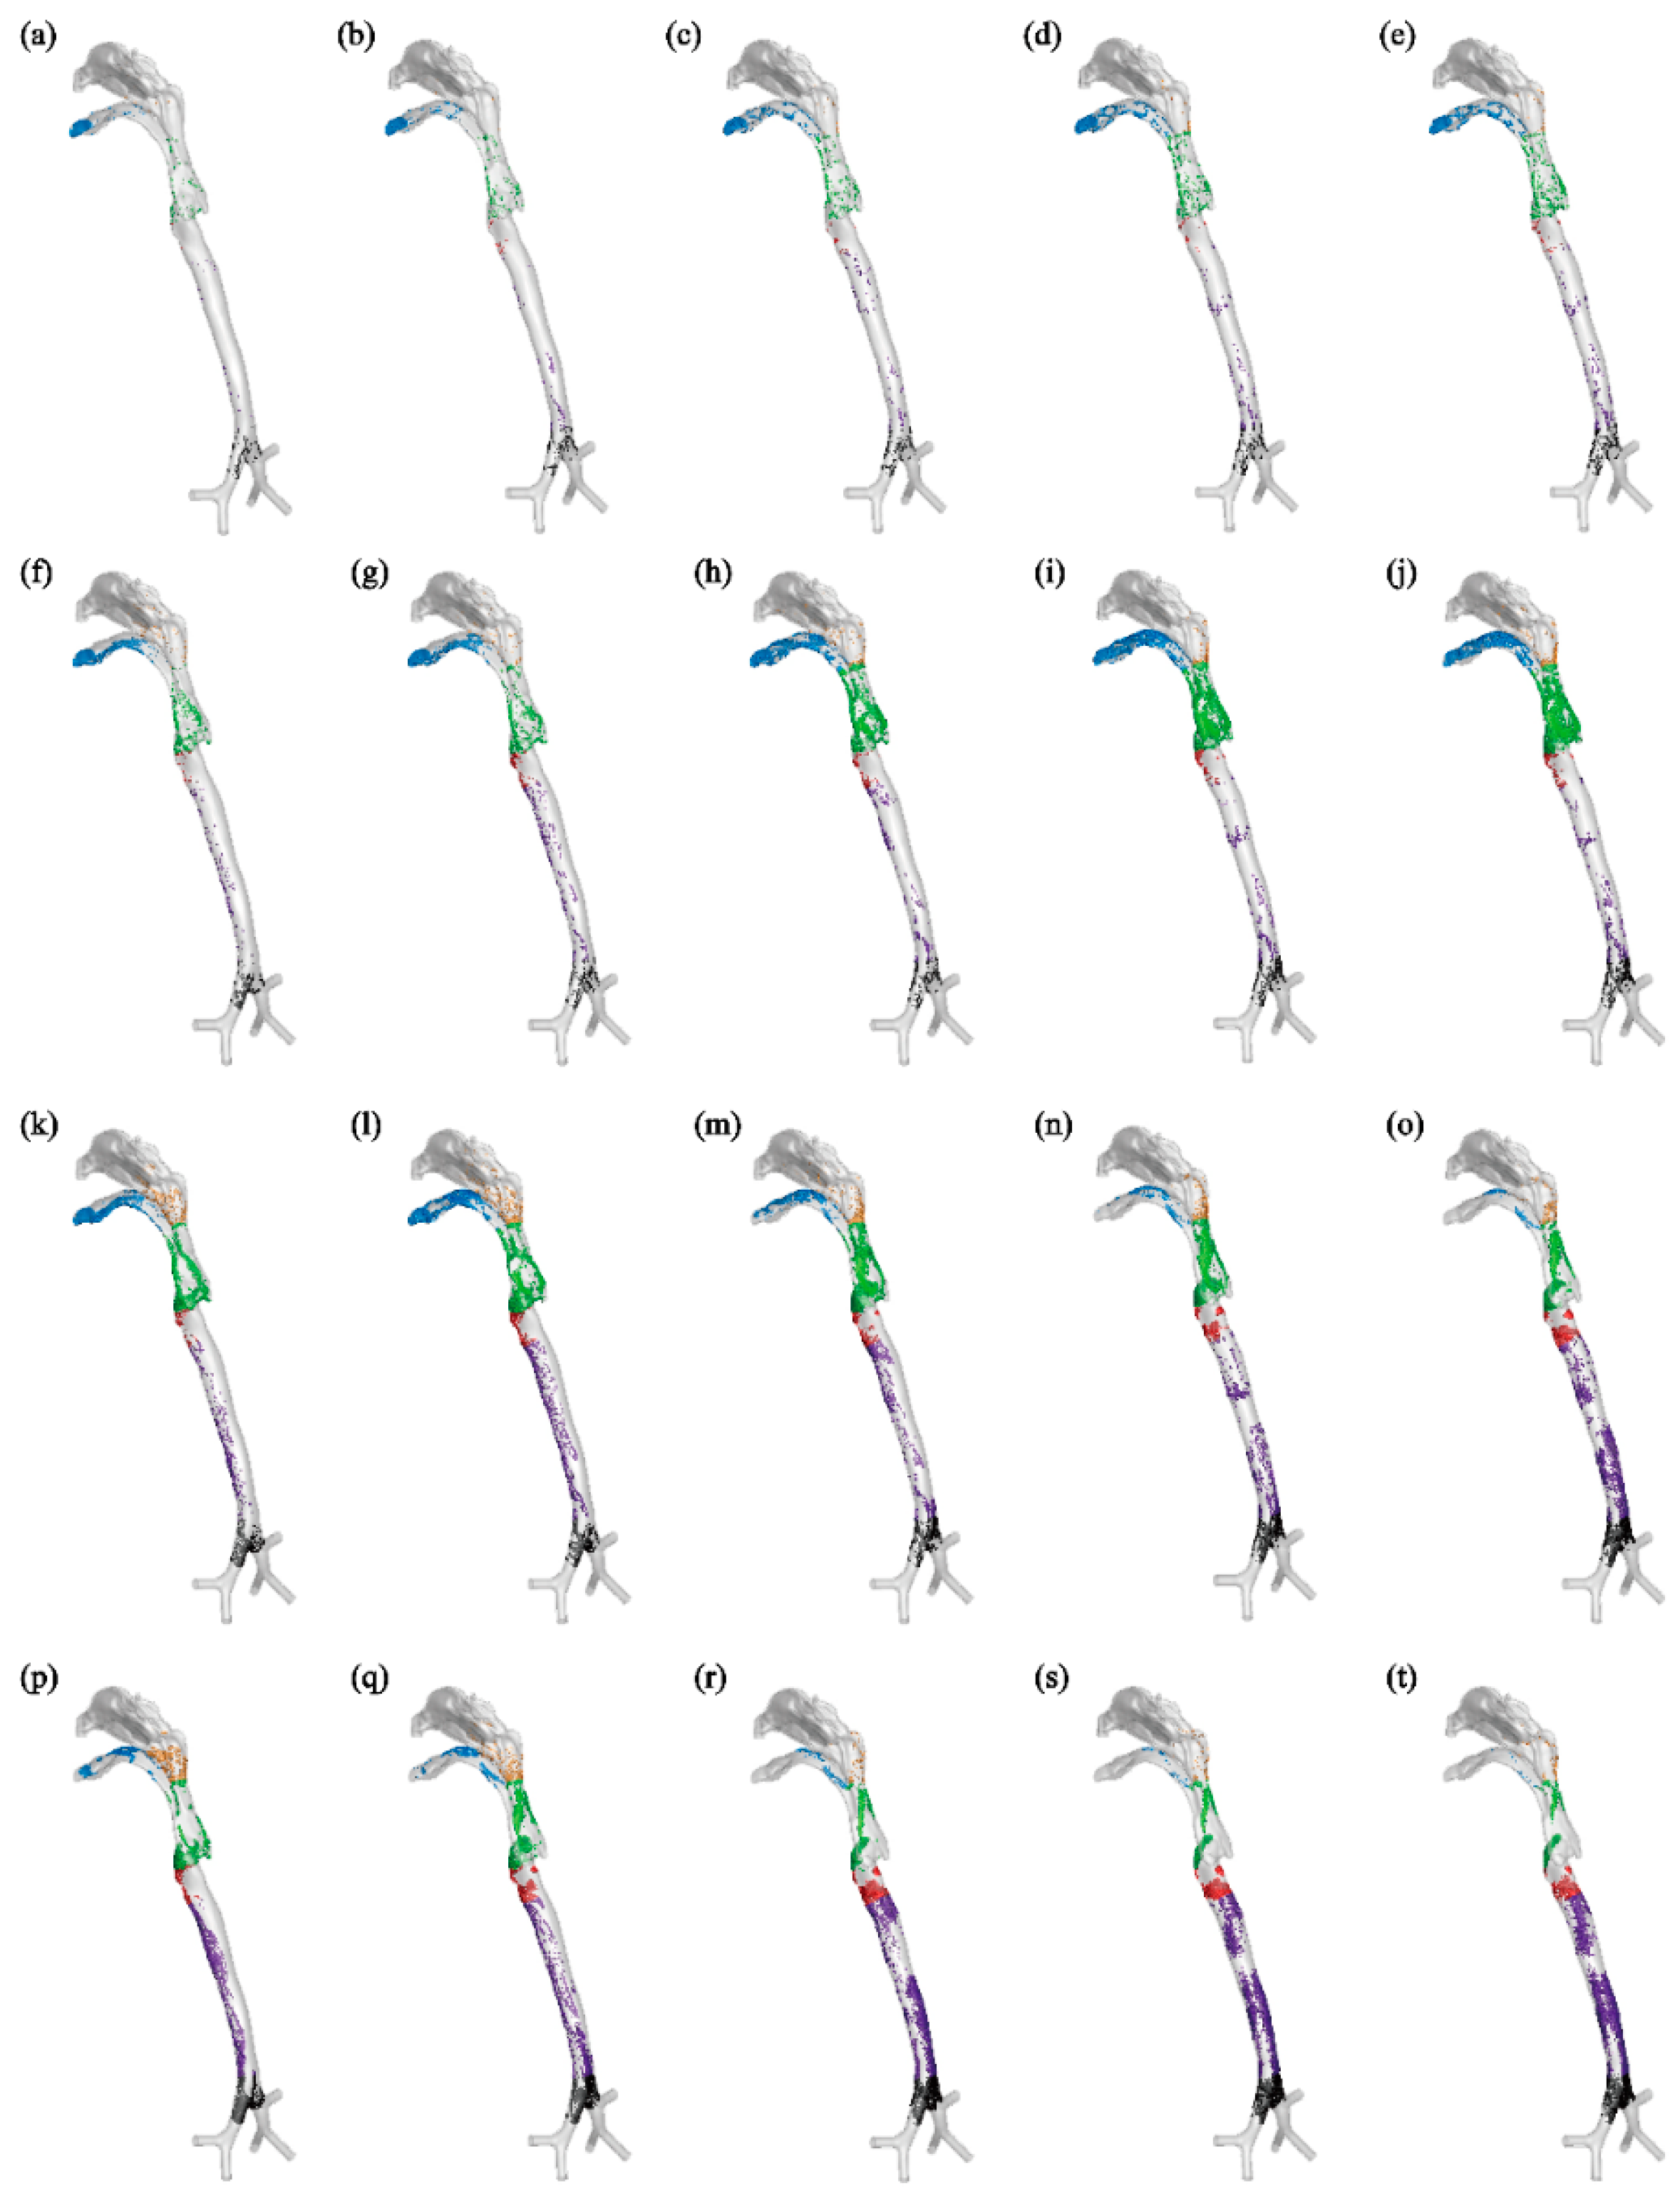
Figure 6, aerosols are carried forward by the airflow once they are released in the bronchus. Some of these aerosols deposit in the pharynx and larynx region, while more tend to deposit in the mouth cavity. A smaller amount of aerosols deposit in the terminal region of the nasopharynx, as the airflow entering the nasal cavity is minimal. For example, aerosols with diameters of 1 or 5 μm under
Q=15 or 30 L/min generally deposit in the upper region of the respiratory airway, such as the mouth and pharynx, and a majority of them can be exhaled into the external environment. Conversely, aerosols with diameters of 10 or 20 μm under
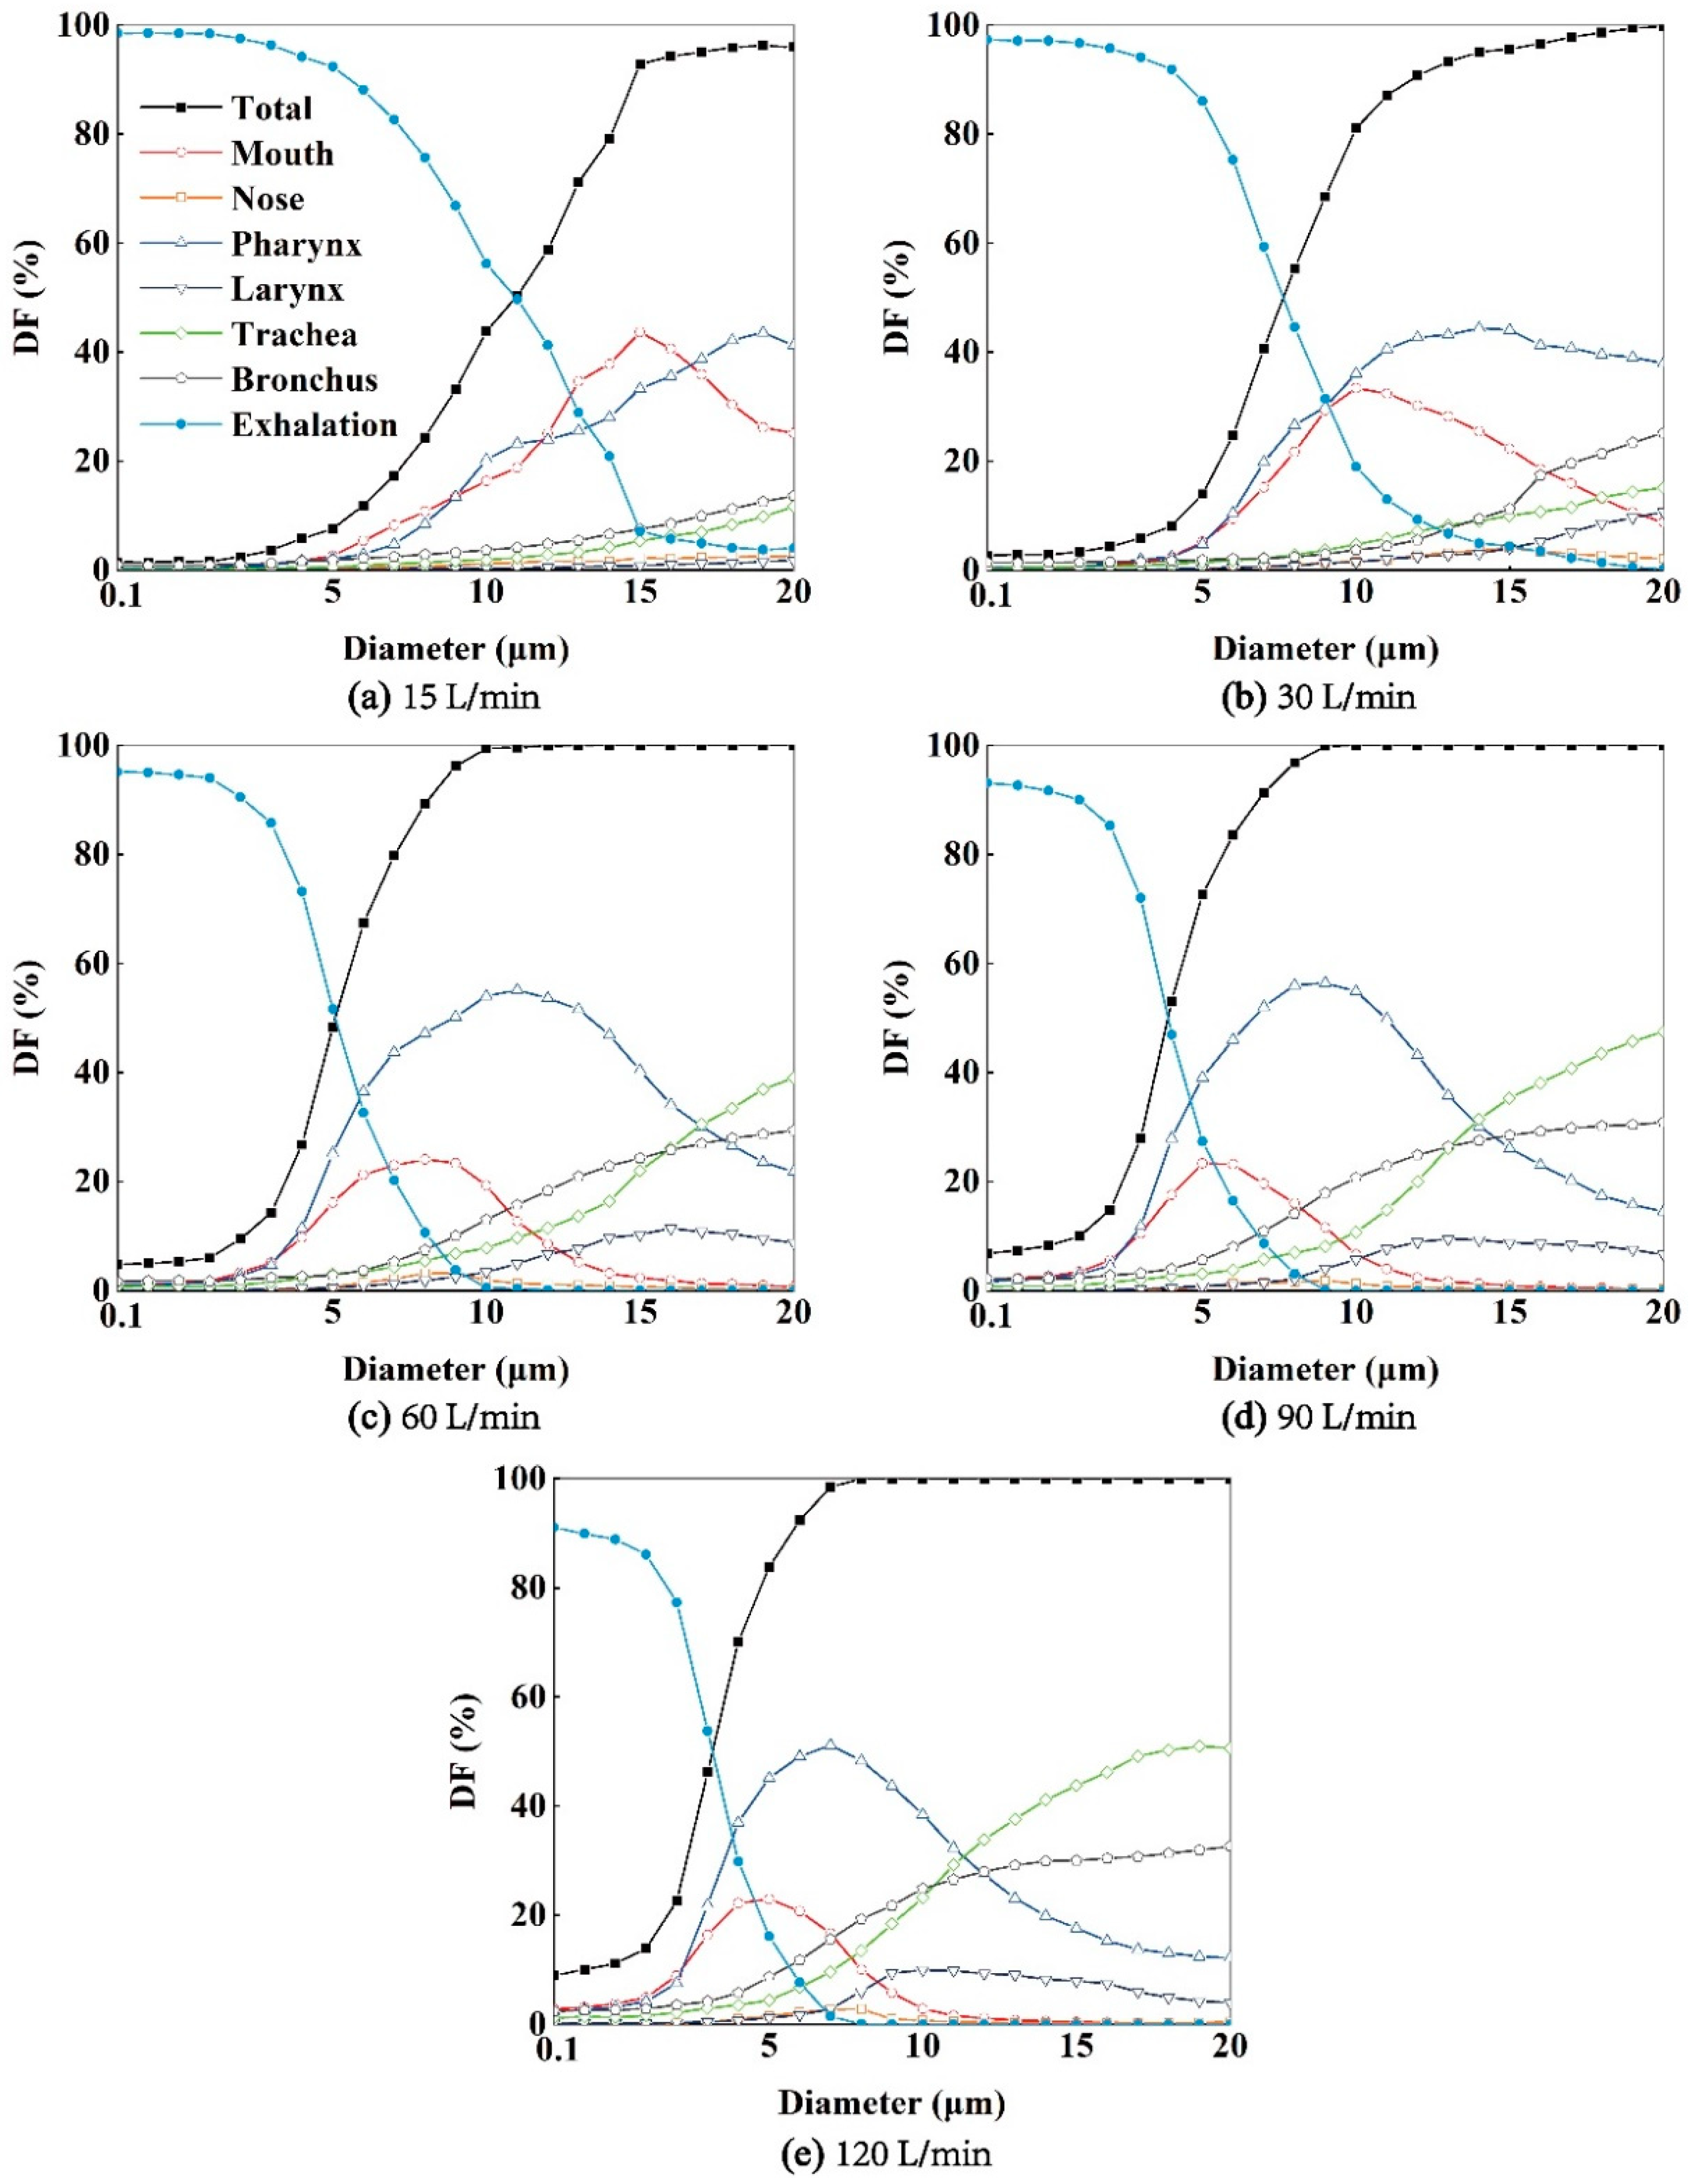
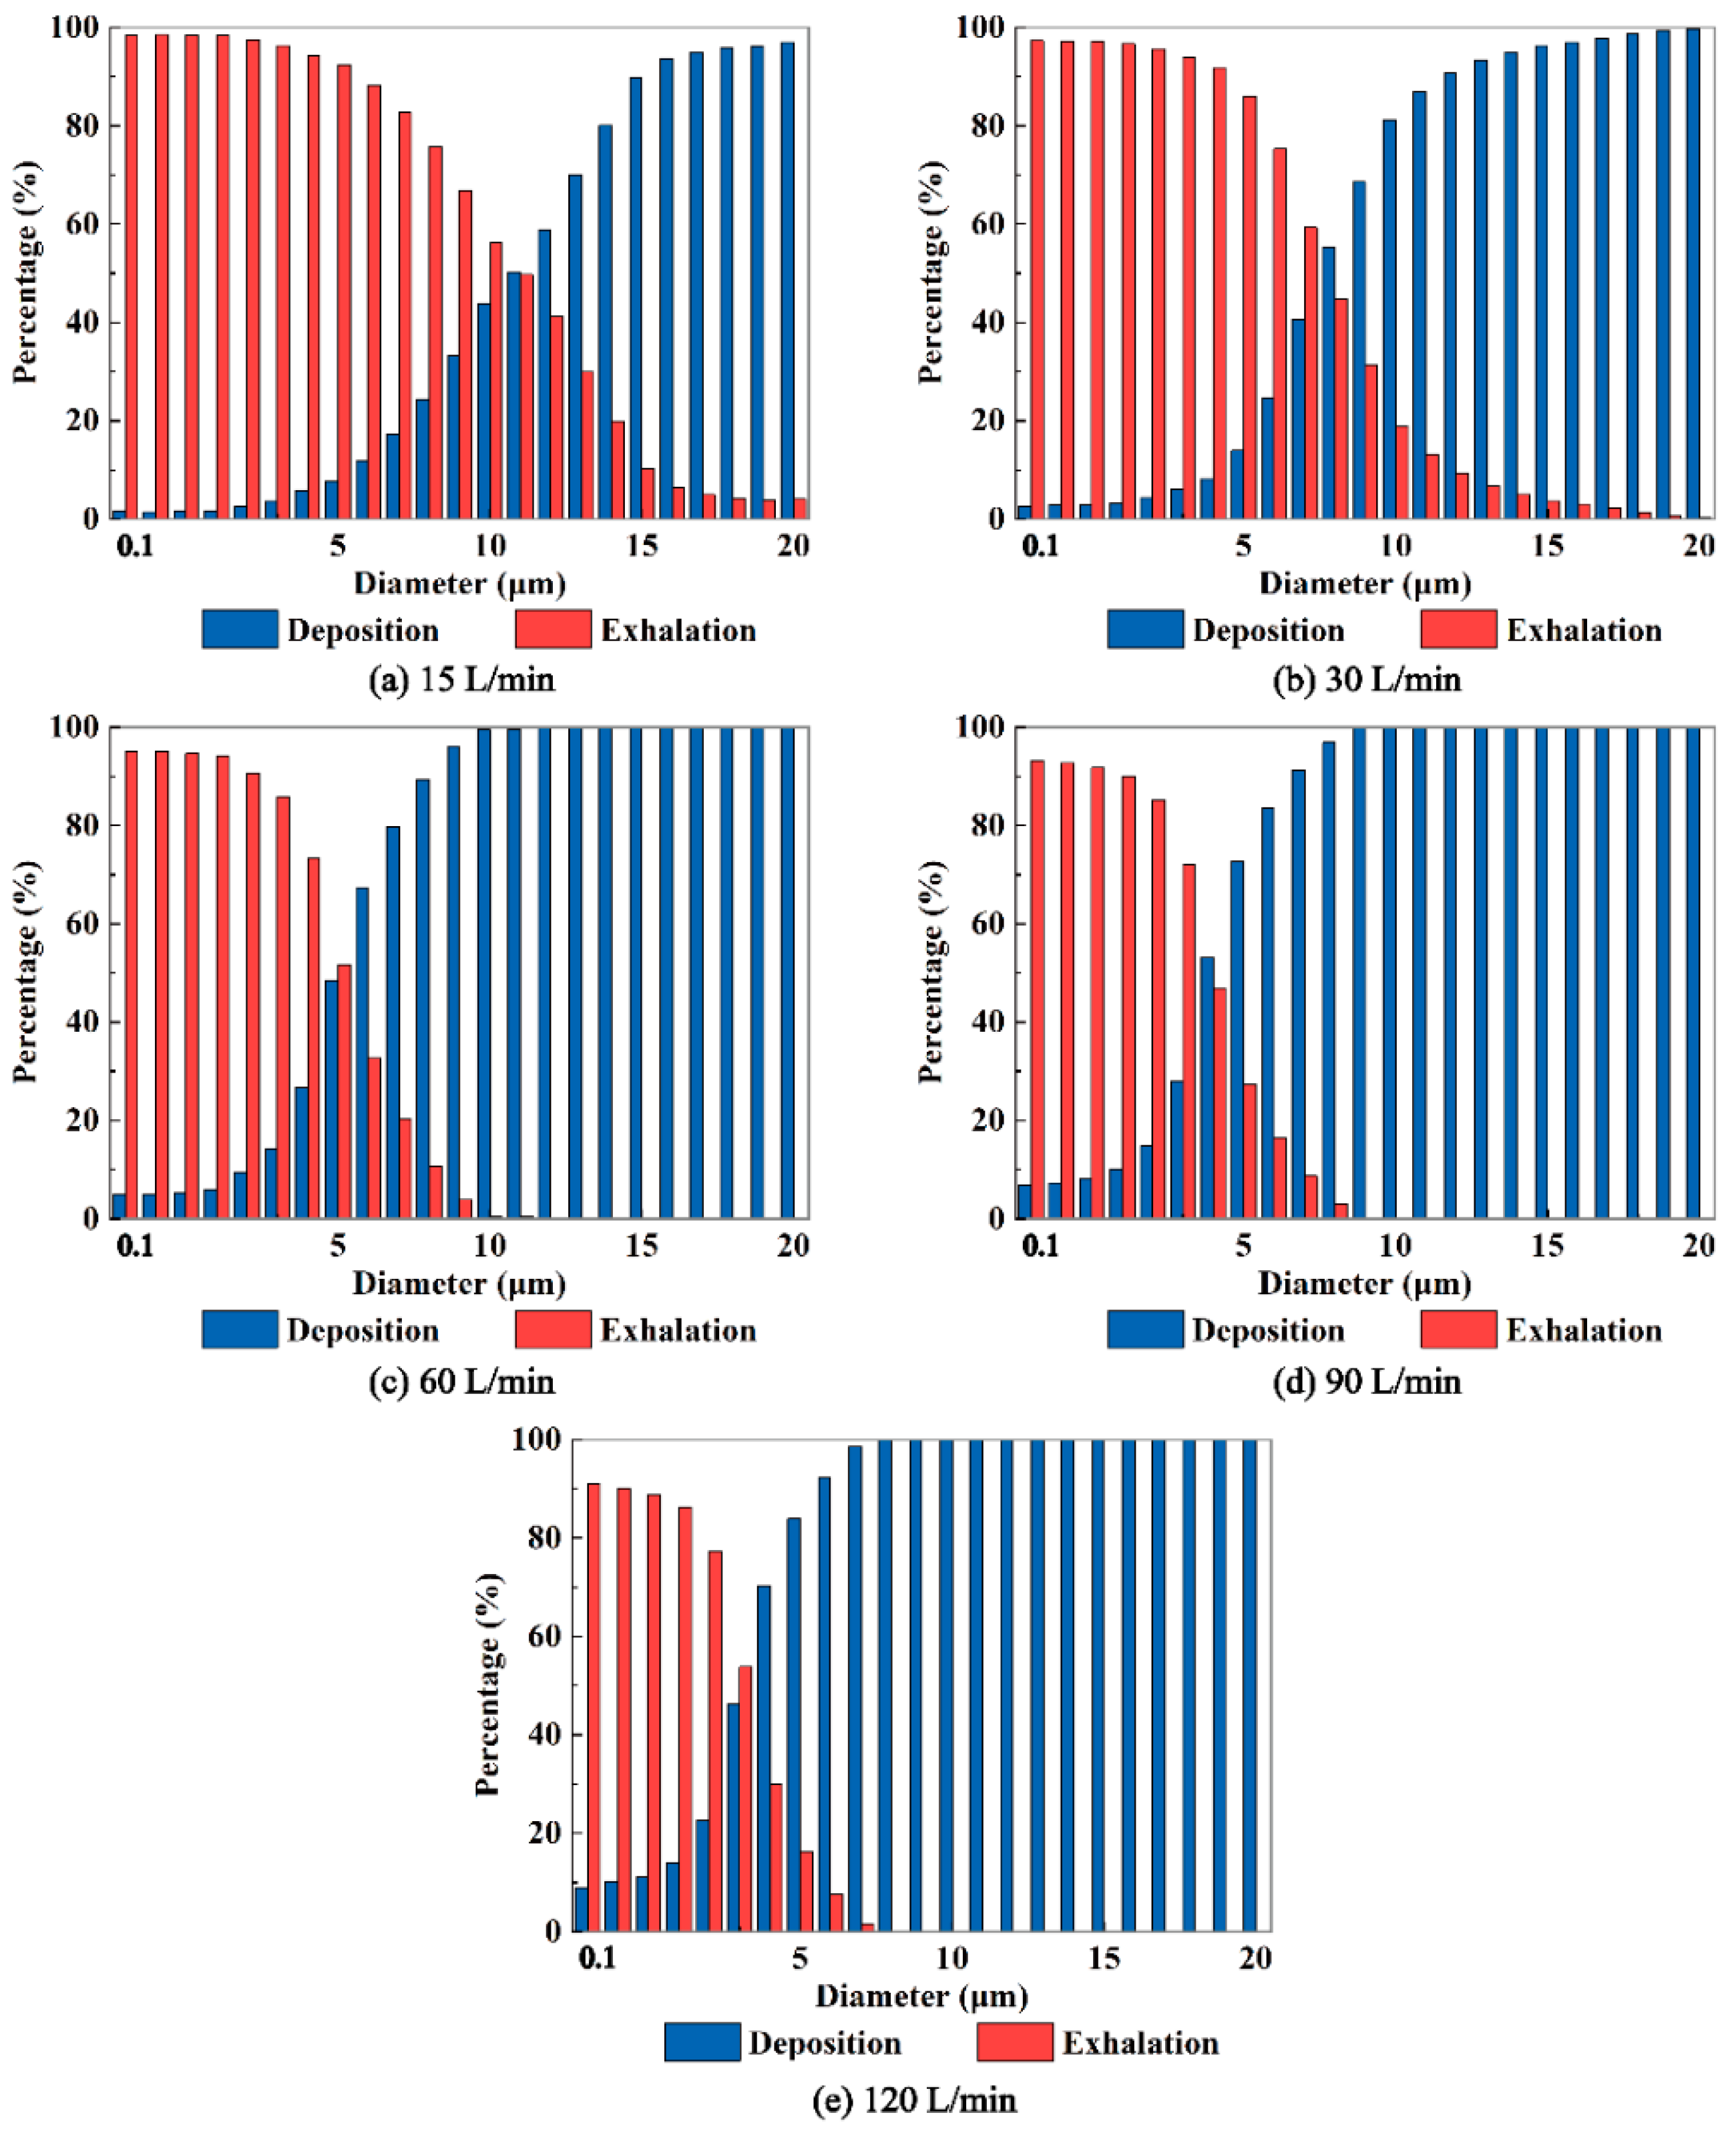
Q=60, 90, or 120 L/min have a tendency to deposit in the lower part of the human respiratory airway, such as the trachea and bronchus. With increasing expiratory intensity, more aerosols deposit within the respiratory airway, and fewer aerosols can be exhaled into the environment (
Figure 7). Specifically, as expiratory intensity increases, smaller aerosols are more likely to deposit on the airway wall and less likely to be exhaled. For instance, at
Q=60 L/min, aerosols with a diameter of 10 μm reach a 100% deposition fraction (
DF) (
Figure 7(c)), while at
Q=120 L/min, this occurs with aerosols of 8 μm in diameter (
Figure 7(e)).
The regional deposition fraction (DF) of aerosols in the larynx, trachea, and bronchus increases monotonically with their diameter. Additionally, higher expiratory flow intensity leads to increased regional DF in the larynx, main trachea, and bronchus. Furthermore, the regional aerosol DFs in the mouth and pharynx exhibit a downward parabolic shape, initially rising and then declining, with a peak DF. The peak DF occurs at different aerosol diameters depending on the expiratory flow intensity. In the mouth, the maximum DFs correspond to aerosol diameters of 15 μm, 10 μm, 8 μm, 5 μm, and 5 μm under Q=15, 30, 60, 90, 120 L/min, respectively. In the pharynx, the maximum DFs occur at diameters of 19 μm, 14 μm, 11 μm, 9 μm, and 7 μm, respectively. This indicates that expiratory flow intensity influences the aerosol diameters that correspond to the peak regional aerosol DFs in the mouth and pharynx.
In addition,
Figure 8 demonstrates that higher expiratory intensity results in increased deposition of aerosols with smaller diameters on the airway wall and a decrease in the number of aerosols entering the external environment through the mouth. Conversely, lower expiratory intensity leads to less deposition of aerosols within the respiratory airway and a greater number of aerosols entering the external environment through the mouth. Of particular importance is the identification of a "critical diameter" for aerosols when the expiratory intensity surpasses 30 L/min. This critical diameter signifies the size at which aerosols are able to effectively exit the respiratory airway and potentially pose a risk of transmission. Aerosols larger than the critical diameter deposit within the respiratory airway, preventing them from entering the external environment through the mouth. Notably, a stronger expiratory intensity correlates with a smaller critical diameter. For example, at expiratory intensities of 60, 90, and 120 L/min, the critical diameters of exhaled aerosols from the bronchus are determined to be 12, 10, and 8 μm, respectively. Understanding the critical diameter of virus-laden aerosols exhaled from the human respiratory airway is crucial in assessing the transmission risk associated with viral diseases. By unveiling the critical diameter, we can gain valuable insights into the mechanisms underlying the exhalation process of virus-loaded aerosols. This knowledge can significantly aid in the prevention and control of respiratory infectious epidemics.
3.5. The Destinations of Aerosols Exhaled from Larynx
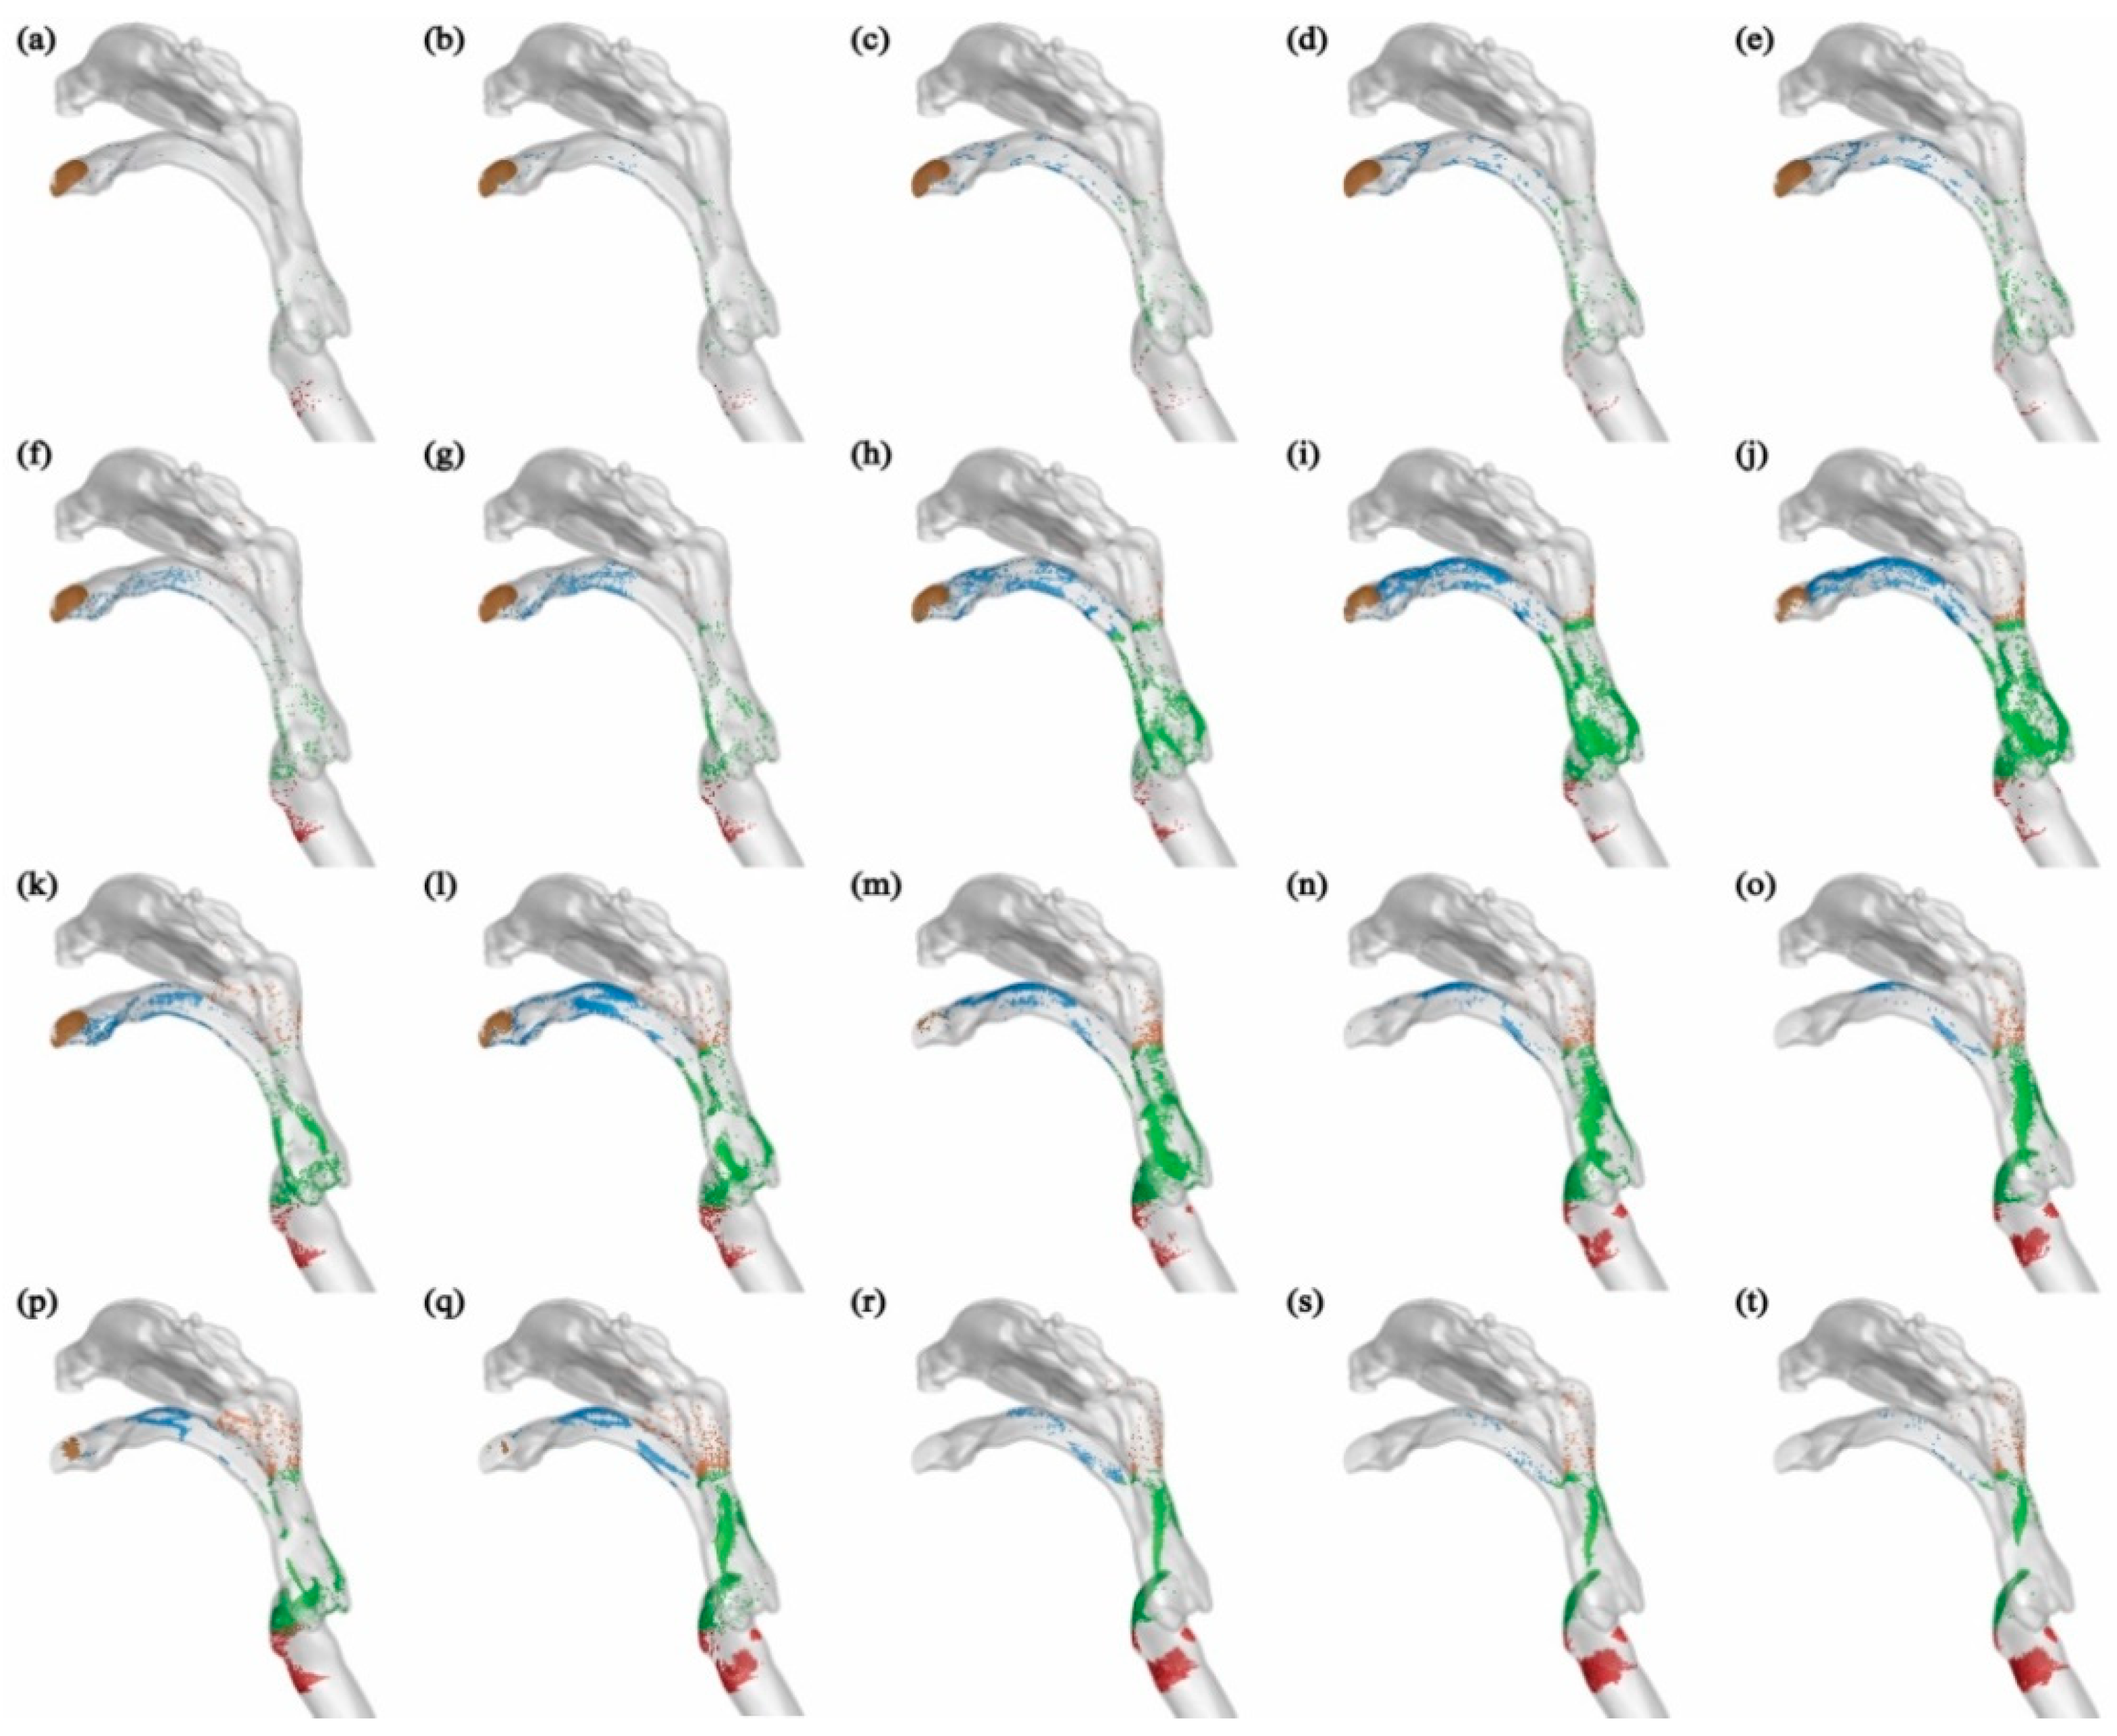
Since the initial location of aerosols is at the end of the larynx, they are unable to reach the lower respiratory airway such as the trachea and bronchus, as depicted in
Figure 9. In general, the deposition patterns of aerosols on the upper airway wall are consistent in this scenario and when aerosols are released from the bronchus. For example, aerosols with a diameter smaller than 5 μm do not deposit on the respiratory airway wall at an expiratory flow rate of 30 L/min, and the majority of these aerosols are exhaled into the external environment. As the aerosol diameter increases, deposition occurs in the mouth, pharynx, and larynx. At an expiratory flow rate of 120 L/min, the deposition patterns in the pharynx and larynx become more concentrated due to the inertial impact of the airflow. The majority of aerosols deposit at the back of the pharynx and the front of the larynx.
In some cases, both larger aerosol diameter and stronger expiratory intensity lead to more concentrated deposition, such as observed for aerosols with dp=10 μm at Q=60 L/min (
Figure 9(m)), and aerosols with dp=20 μm at Q=120 L/min (
Figure 9(t)). Moreover, the influence of expiratory intensity on the deposition patterns of aerosols varies. For example, aerosols with a diameter of 1 μm can be effectively exhaled into the external environment by the airflow, regardless of the expiratory intensity. On the other hand, aerosols with a diameter of 5 μm tend to deposit in the mouth, pharynx, and larynx regions under stronger expiratory intensities. In the case of aerosols with a diameter of 10 μm, the deposition in the mouth initially increases and then decreases as the expiratory intensity increases.
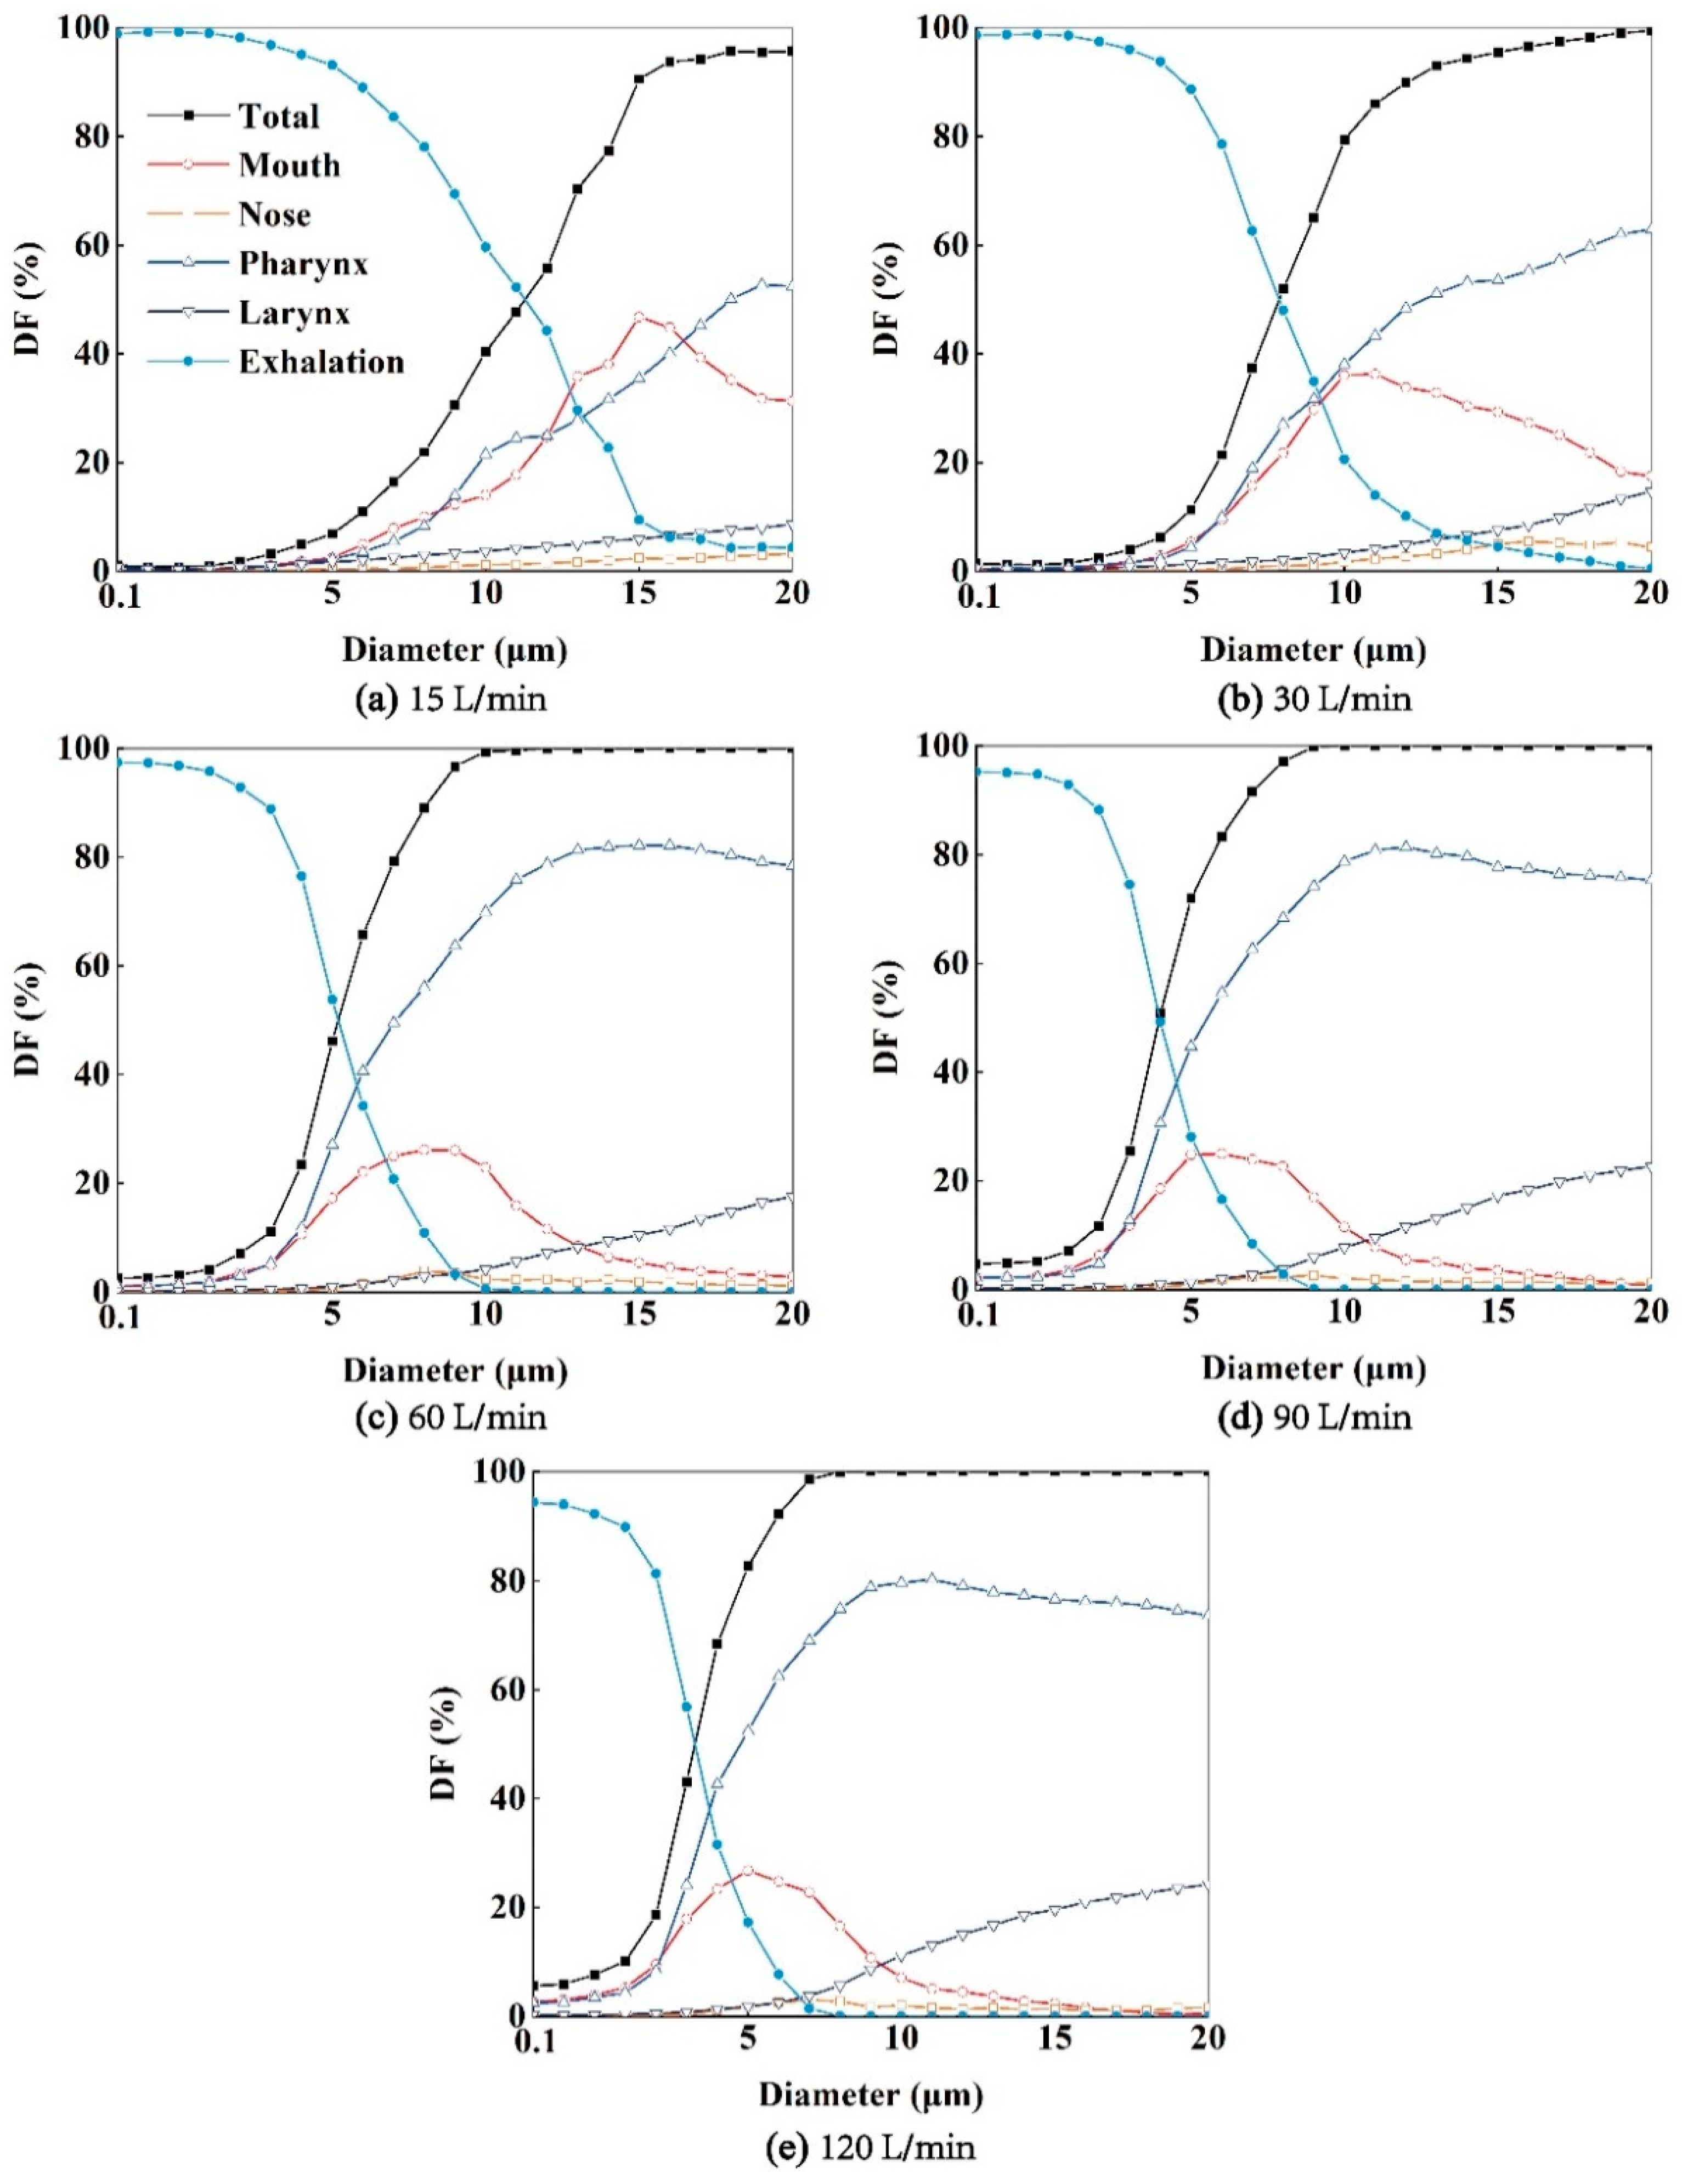
As depicted in
Figure 10, higher expiratory intensities correspond to higher aerosol
DFs, and the profiles of aerosol
DFs exhibit steeper slopes. Moreover, expiratory intensity also influences the regional aerosol
DFs in each region of the respiratory airway. For instance, the
DFs in the throat region increase with aerosol diameters. Additionally, higher expiratory intensities result in a higher proportion of aerosol deposition in the laryngeal region. At an expiratory intensity of
Q=120 L/min, the maximum
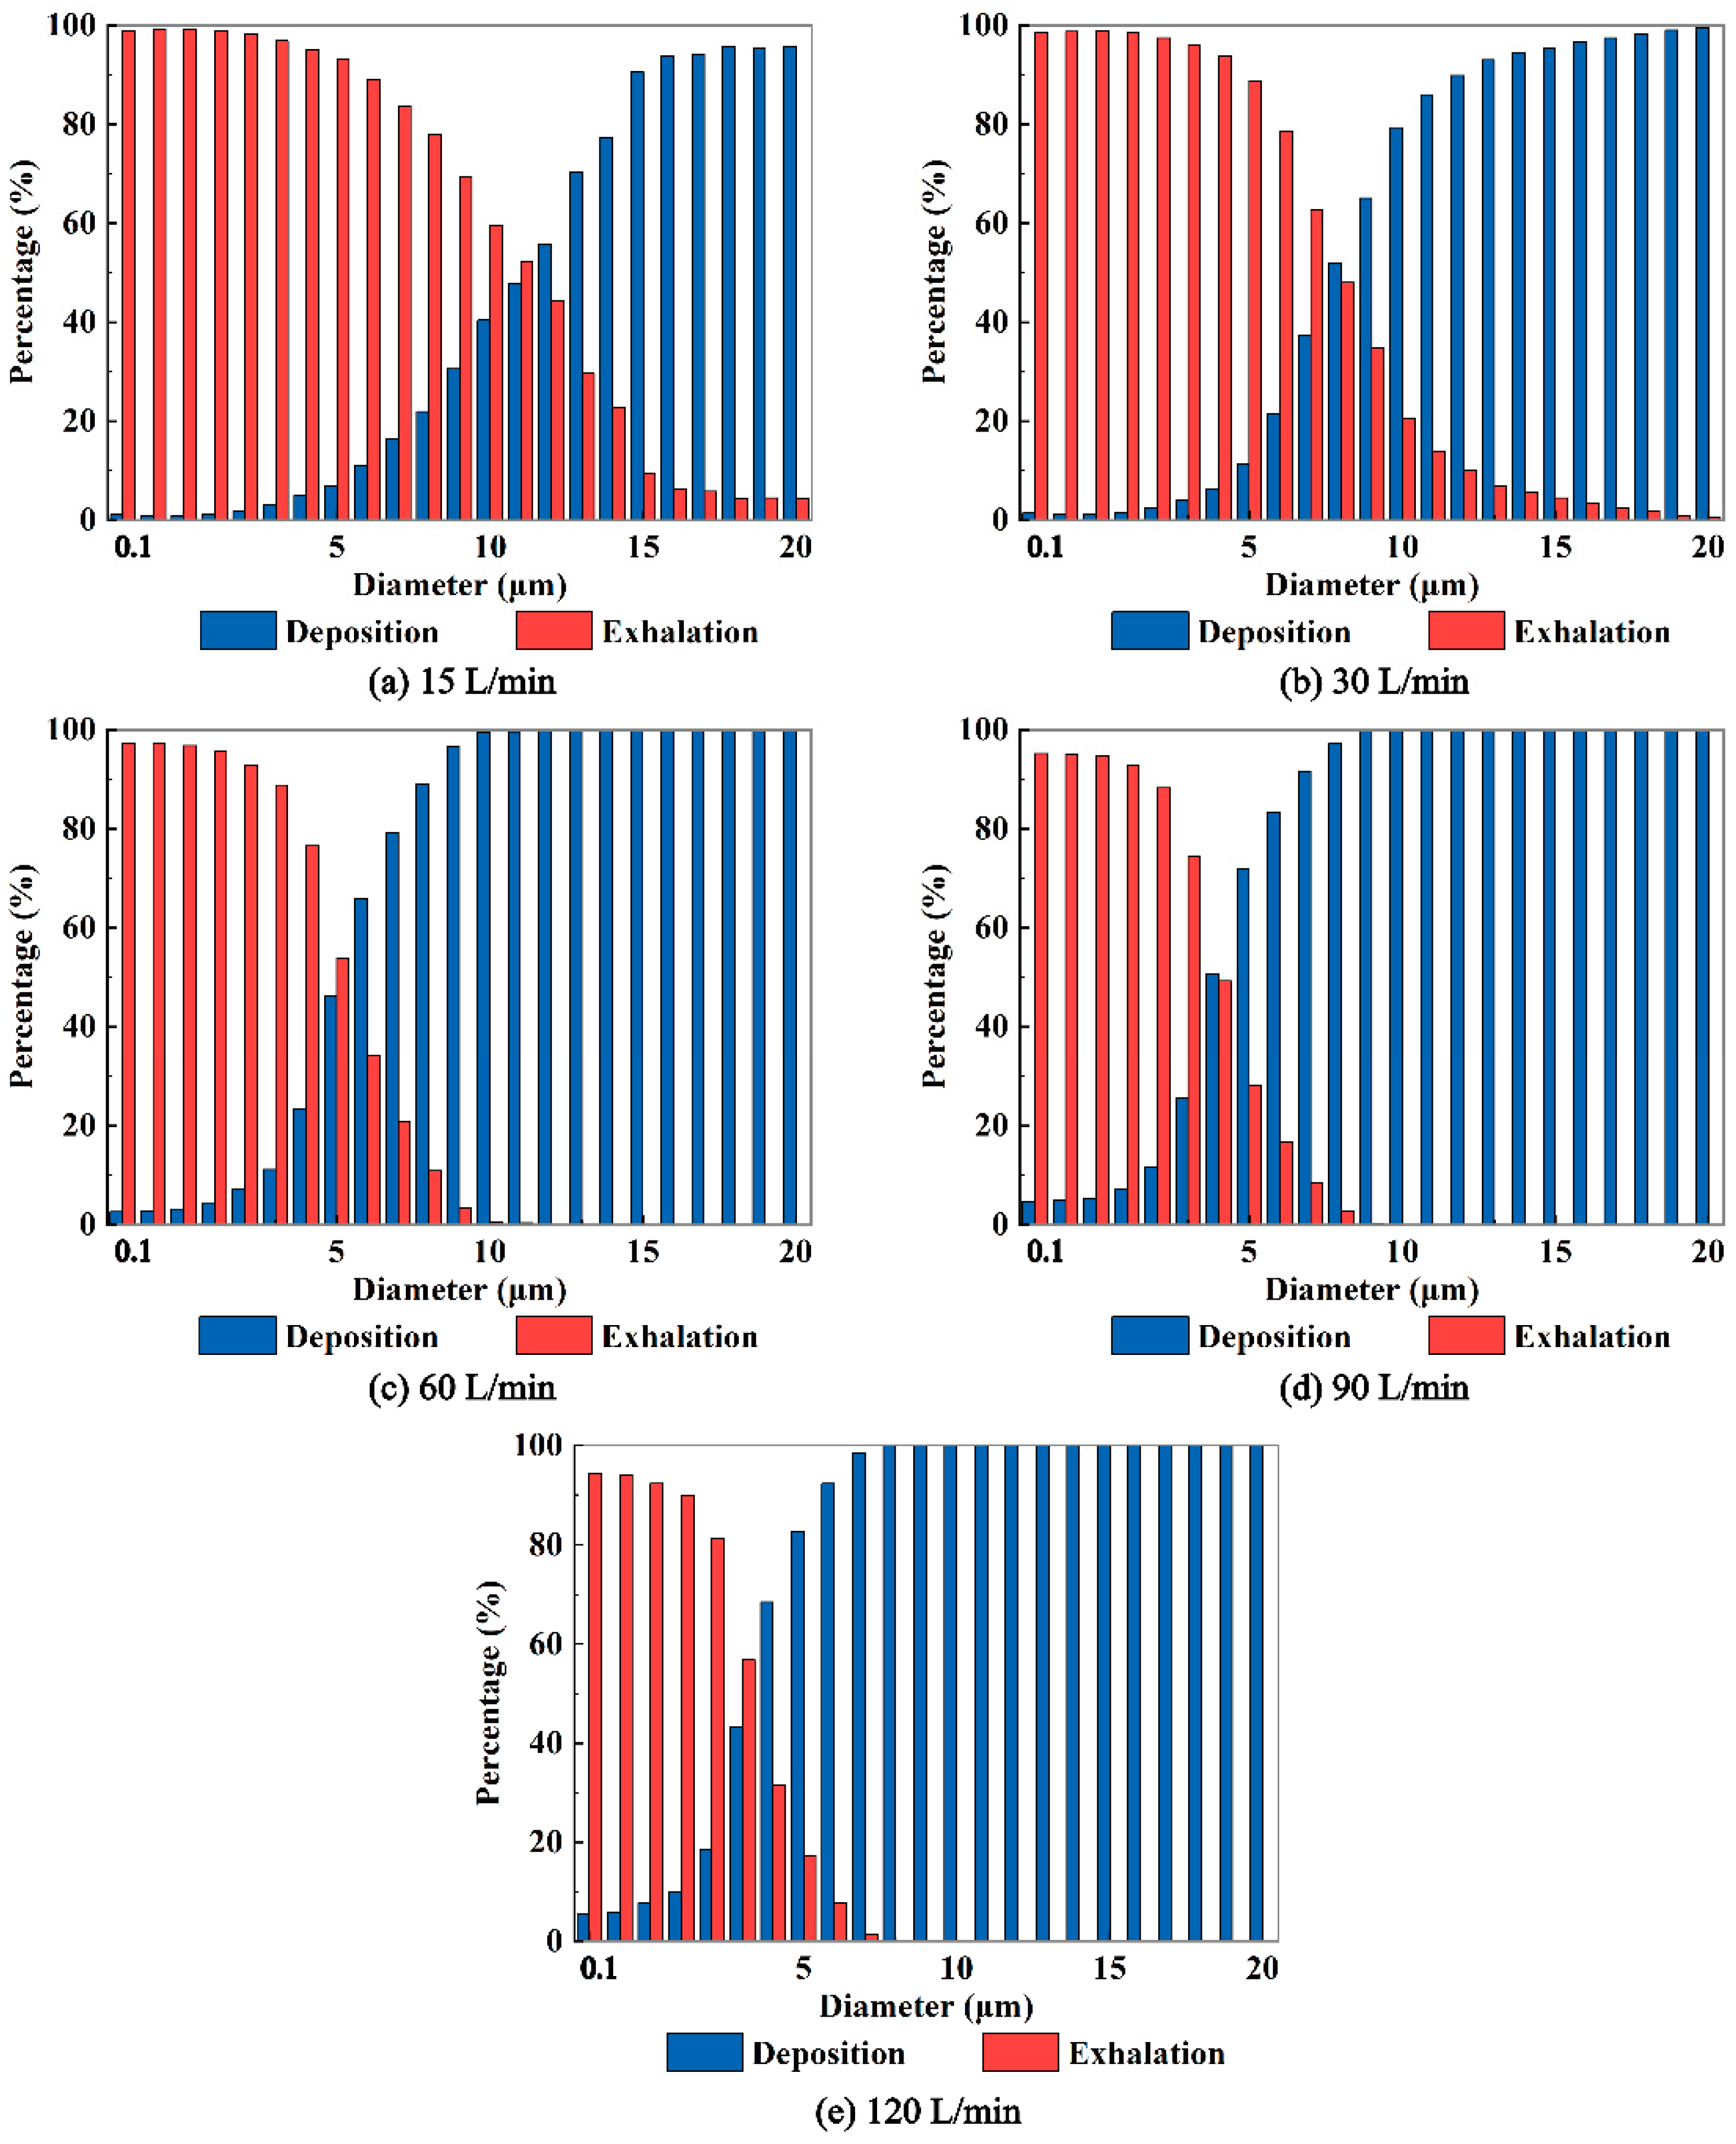
DFs in the laryngeal region can exceed 20%. Furthermore, as demonstrated in
Figure 11, as the aerosol diameter increases, more particles deposit on the airway wall, resulting in fewer aerosols entering the external environment. Similar to the scenario of aerosols exhaled from the bronchus, a "critical diameter" is observed in this case when the expiratory intensity exceeds 30 L/min. Specifically, the critical diameters are 12, 10, and 8 μm under
Q=60, 90, and 120 L/min, respectively. These values are consistent with the critical diameters observed when the aerosols are exhaled from the bronchus.
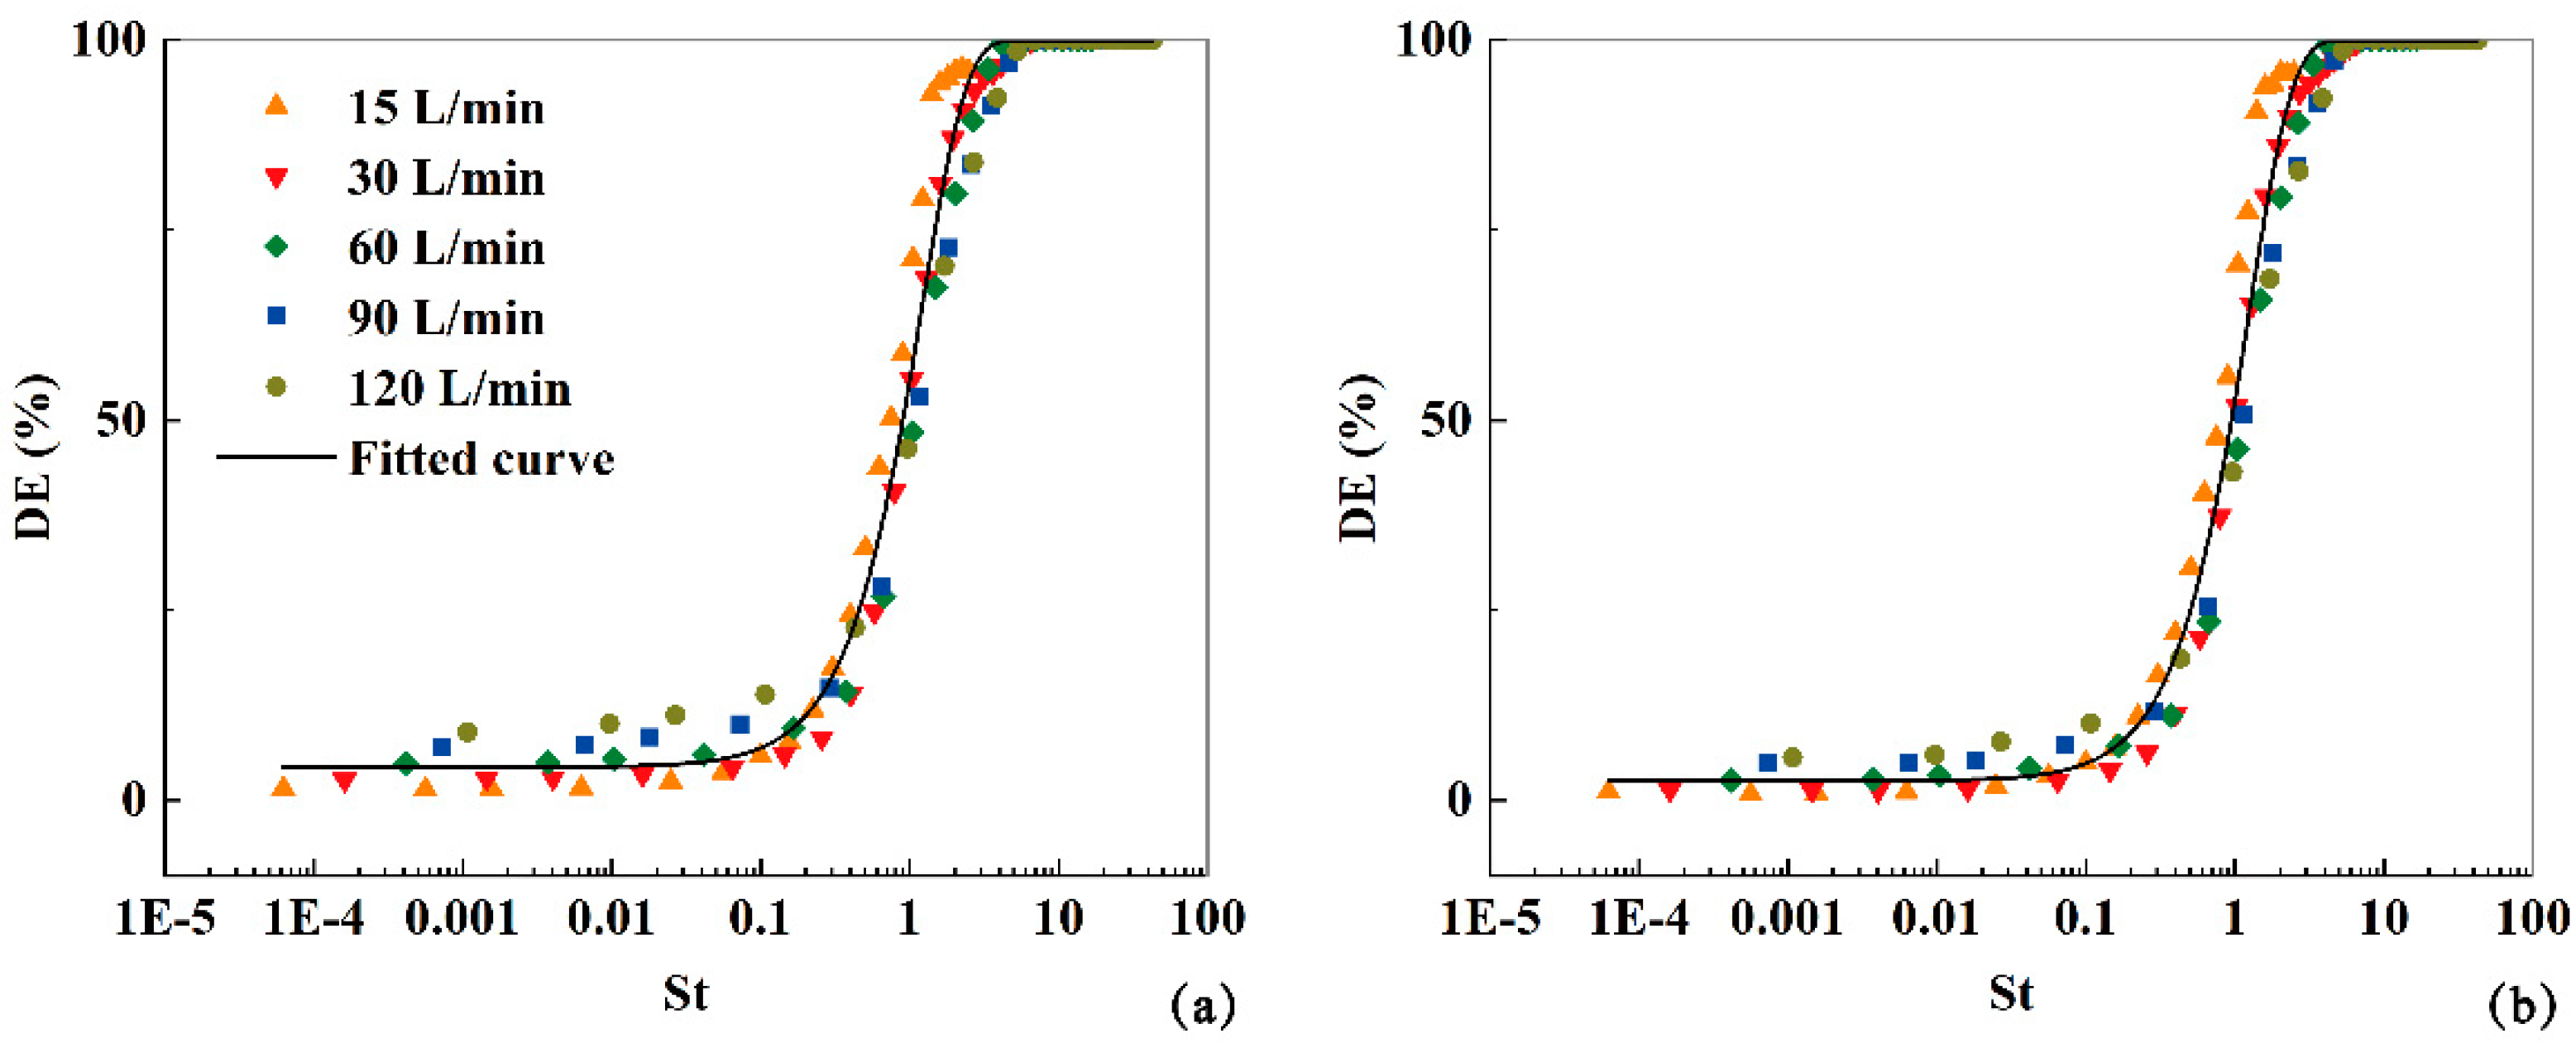
In the current study, the Stokes number (
) is utilized as an indicative parameter to fit the total aerosol deposition fractions (
DFs) of virus aerosols exhaled from both the bronchus and larynx at different expiratory intensities (
Q=15, 30, 60, 90, 120 L/min). Here, L represents the characteristic diameter of the mouth inlet, and the other variables are the same as previously mentioned. The
DFs of the aerosols exhaled from the bronchus within the airway model can be expressed as:
And then the exhaled aerosol fractions will be:
And the
DFs of aerosols exhaled from larynx can be fitted as:
And then the exhaled aerosol fractions will be:
As depicted in
Figure 12, these functions effectively predict the deposition and exhalation of aerosols, regardless of whether they are initially released from the bronchus or the larynx.
4. Conclusion
In this study, we numerically investigate the characteristics of aerosols exhaled from the bronchus or larynx considering various aerosol diameters and expiratory intensities. The key findings are as follows:
1. The expiratory airflow is very complex including flow separations, jet-flow, and vortex structures. While the overall airflow characteristics remain unchanged with increasing expiratory intensity, the local airflow characteristics are impacted.
2. The deposition properties of exhaled aerosols from the bronchus or larynx demonstrate similarities across the five expiratory intensities. However, there are noticeable differences in local deposition characteristics.
3. As the aerosol diameters increase and the expiratory intensity strengthens, the deposition of aerosols within the respiratory airway increases, resulting in fewer aerosols being exhaled into the external environment through the mouth.
The critical diameters of aerosols exhaled into the environment are the same under the identical expiratory intensity, regardless of their initial release location in the bronchus or larynx.
4. Regardless of whether the exhaled aerosols are released from the bronchus or the larynx, the fractions of exited and deposited aerosols can be effectively described by functions related to the Stokes number.
Overall, the findings presented in this study are of significant importance in formulating effective strategies to mitigate the transmission of respiratory viruses. Moving forward, it is crucial to consider factors such as the virus species, evaporation, fragmentation, and aggregation of virus-loaded aerosols.
Author Contributions
Conceptualization, Y.-N. F. and X.-G. C.; Methodology, Y.-N. F., J.-T. W. and X.-G. C.; Software, Y.-N. F. and J.-T. W.; Validation, Y.-N. F.; Formal Analysis, Y.-N. F. and X.-G. C.; Investigation, Y.-N. F.; Resources, Y.-N. F.; Data Curation, J.-T. W; Writing – Original Draft Preparation, Y.-N. F.; Writing-Review & Editing, Y.-N. F. and X.-G. C.; Visualization, Y.-N. F.; Supervision, X.-G. C.; Project Administration, X.-G. C.; Funding Acquisition, X.-G. C.
Data Availability Statement
The data that support the findings of this study will be available upon reasonable request.
Acknowledgments
The authors would like to express their heartfelt appreciation to the anonymous reviewers for their valuable comments to improve the quality of the paper.
Conflicts of Interest
The authors declare no conflicts of interest.
References
- World health organization. Q & A on coronaviruses (COVID-19): What is COVID-19. Available online: https://www.who.int/emergencies/diseases/novel-coronavirus-2019/question-and-answers-hub/q-a-detail/coronavirus-disease-covid-19 (accessed on 20 November 2023).
- Middle east respiratory syndrome coronavirus (MERS-CoV). Available online: https://www.who.int/news-room/fact-sheets/detail/middle-east-respiratory-syndrome-coronavirus-(mers-cov) (accessed on 20 November 2023).
- Influenza (seasonal). Available online: https://www.who.int/news-room/fact-sheets/detail/influenza-(seasonal) (accessed on 20 November 2023).
- Who coronavirus (COVID-19) dashboard. Available online: https://covid19.who.int/ (accessed on 20 November 2023).
- Johnson, G. R.; Morawska, L. The mechanism of breath aerosol formation. J. Aerosol. Med. Pulm. D 2009, 22, 229–237. [CrossRef]
- Bourouiba, L.; Dehandschoewercker, E; Bush, J. M. Violent expiratory events: On coughing and sneezing. J. Fluid Mech. 2014, 745537–563. [CrossRef]
- European centre for disease prevention and control. Q & A on COVID-19. Available online: https://www.ecdc.europa.eu/en/covid-19/questions-answers (accessed on 20 November 2023).
- U.S. centers for disease control and prevention. Scientific brief: SARS-COV-2 transmission. Available online: https://www.cdc.gov/coronavirus/2019-ncov/science/science-briefs/sars-cov-2-transmission.html (accessed on 20 November 2023).
- Liu, L.; Wei, J.; Li, Y.; Ooi, A. Evaporation and dispersion of respiratory droplets from coughing. Indoor Air. 2017, 27, 179–190. [CrossRef]
- Li, H. Y.; Kuga, K.; Ito K. SARS-CoV-2 dynamics in the mucus layer of the human upper respiratory tract based on host–cell dynamics. Sustainability 2022, 14, 3896. [CrossRef]
- Wang, C. C.; Prather, K. A.; Sznitman, J.; Jimenez, J. L.; Lakdawala, S. S.; Tufekci, Z.; Marr, L. C. Airborne transmission of respiratory viruses. Science 2021, 373, 981. [CrossRef]
- Cowling, B. J.; Ip, D. K. M.; Fang, V. J.; Suntarattiwong, P.; Olsen, S. J.; Levy, J.; Uyeki, T. M.; Leung, G. M.; Peiris, J. S. M.; Chotpitayasunondh, T.; et al. Aerosol transmission is an important mode of influenza A virus spread. Nat. Commun 2013, 4, 1935. [CrossRef]
- Jarvis, M. C. Aerosol transmission of SARS-CoV-2: Physical principles and implications. Front. Public Health 2020, 8, 1-8. [CrossRef]
- Kutter, J. S.; Spronken, M. I.; Fraaij, P. L.; Fouchier, R. A.; Herfst. S. Transmission routes of respiratory viruses among humans. Curr Opi Viro 2018, 28,142–151. [CrossRef]
- Guo, W. Q.; Fu, Y. Y; R, J,; Guo, Z. D.; Su, C.; Li, J. M.; Zhao, X. G.; Jin, Y. F.; Li, P. H.; Fan, J. B. Visualization of the infection risk assessment of SARS-Cov-2 through aerosol and surface transmission in anegative-pressure ward. Environ Int. 2022, 162,107153. [CrossRef]
- Xu, X.Y. Study on the transport pattern and injury mechanism under fire smoke in human respiratory airways. Doctoral degree, Tsinghua University, China, 2019.
- Hofer, S.; Hofstätter, N.; Duschl, A.; Himly, M. SARS-CoV-2-laden respiratory aerosol deposition in the lung alveolar-interstitial region is a potential risk factor for severe disease: A modeling study. J. Pers. Med 2021, 11, 431. [CrossRef]
- Cui, X. G.; Song, W.; Xue, Y.; Guan, H. X.; Zhang, J. H.; He, X. X.; Ma, H. L.; Lei, M.; Wang, J. T.; Li, Y. C. Numerical investigations of the micro lunar dust particles deposition in the human oral respiratory airway. J. Membr. Sci 2023, 448, 130886. [CrossRef]
- Jing, H.; Ge, H. W.; Wang, L.; Zhou, Q. Z.; Chen, L.; Choi, S. H.; Cui, X. G. Large eddy simulation study of the airflow characteristics in a human whole-lung airway model. Phys. Fluids 2023, 35, 071903. [CrossRef]
- Feng, Y. N.; Cui, X. G. Effects of Ambient Temperature on Particle Deposition in Human Respiratory Tract. J. Med. Biomech 2023, 38, 670-676.
- Cui, X.G.; Li, R.F. Computational fluid and particle dynamics in the human respiratory system, 1st ed.; Harbin Engineering University Press, Harbin, China, 2021.
- Inthavong, K.; Das, P.; Singh, N.; Sznitman, J. In silico approaches to respiratory nasal flows: A review. J Biomech 2019, 97,109434. [CrossRef]
- Feng, Y.; Zhao, J. N.; Hayati, H.; Sperry, T.; Yi, H. Tutorial: Understanding the transport, deposition, and translocation of particles in human respiratory systems using Computational Fluid-Particle Dynamics and Physiologically Based Toxicokinetic models. J Aerosol Sci 2021, 151, 105672. [CrossRef]
- Mortazavi, H.; Beni, H. M.; Aghaei, F.; Sajadian, S. H. SARS-CoV-2 droplet deposition path and its effects on the human upper airway in the oral inhalation. Comput Methods Programs Biomed 2020, 200, 105843. [CrossRef]
- Beni, H. M.; Mortazavi, H.; Aghaei, F.; Kamalipour, S. Experimental tracking and numerical mapping of novel coronavirus micro-droplet deposition through nasal inhalation in the human respiratory system. Biomech Model Mechan. 2021, 20, 1087-1100. [CrossRef]
- Wedel, J.; Steinmann, P.; Štrakl, M.; Hriberšek, M.; Ravnik, J. Can CFD establish a connection to a milder COVID-19 disease in younger people? Aerosol deposition in lungs of different age groups based on Lagrangian particle tracking in turbulent flow. Comput Mech 2021, 67, 1497-1513. [CrossRef]
- Guo, Y.; Wei, J. J.; Ou, C. Y.; Liu, L.; Sadrizadeh, S.; Jin, T.; Tang, L. L.; Zhang, Y. P.; Li, Y. G. Deposition of droplets from the trachea or bronchus in the respiratory tract during exhalation: A steady-state numerical investigation. Aerosol Sci Technol 2020, 54, 869-879. [CrossRef]
- Ren, S.; Cai, M. L.; Shi, Y.; Luo, Z. J.; Wang T. Influence of cough airflow characteristics on respiratory mucus clearance. Phys. Fluids 2022, 34, 041911. [CrossRef]
- Milton, D. K.; Fabian, M. P.; Cowling, B. J.; Grantham, M. L.; McDevitt, J. J. Influenza virus aerosols in human exhaled breath: Particle size, culturability, and effect of surgical masks. PLOS Pathog. 2013, 9, e1003205. [CrossRef]
- Wölfel, R.; Corman, V. M.; Guggemos, W.; Seilmaier, M.; Zange, S.; Müller, M. A.; Niemeyer, D.; Jones, T. C; Vollmar, P.; Rothe, C.; et al. Virological assessment of hospitalized patients with COVID-2019. Nature 2020, 581, 465-469. [CrossRef]
- Hui, K. P. Y.; Ho, J. C. W.; Cheung, M. C.; Ng, K. C.; Ching, R. H. H.; Lai, K. L.; Kam, T. T.; Gu, H. G.; Sit, K. Y.; Hsin, M. K. Y. SARS-CoV-2 Omicron variant replication in human bronchus and lung ex vivo. Nature 2022, 603, 715-720. [CrossRef]
- Feng, Y.; Kleinstreuer, C.; Castro, N.; Rostami, A. Computational transport, phase change and deposition analysis of inhaled multicomponent droplet-vapor mixtures in an idealized human upper lung model. J Aerosol Sci 2016, 96, 96-123. [CrossRef]
- Chen, X. L.; Feng, Y.; Zhong, W. Q.; Kleinstreuer, C. Numerical investigation of the interaction, transport and deposition of multicomponent droplets in a simple mouth-throat model. J Aerosol Sci 2017, 105, 108-127. [CrossRef]
- Li, D. B.; Xu, Q. S.; Liu, Y. M.; Yin, L. B.; Jun, J. Numerical simulation of particles deposition in a human upper airway. Adv. Mech. Eng. 2014, 207938. [CrossRef]
- Narayanan, J. K.; Lin, J.; Feng, Y. N.; Cui, X. G. Numerical study on the impact of mucus layer and inlet air-temperatures on the particle deposition in a highly idealized mouth-throat model using LES. Powder Technol. 2021, 395,455-475. [CrossRef]
- Xu, C.; Zheng, X.; Shen, S. F. A numerical study of the effects of ambient temperature and humidity on the particle growth and deposition in the human airway. Environ. Res. 2021, 200, 111751.
- Liu, W.Q. Numerical study on gas-particle two-phase flow in the upper respiratory tract of human body. Doctoral degree, Harbin Institute of Technology, China, 2020.
- Ghahramani, E.; Abouali, O.; Emdad, H.; Ahmadi, G. Numerical analysis of stochastic dispersion of micro-particles in turbulent flows in a realistic model of human nasal/upper airway. J Aerosol Sci 2014, 67, 188-206. [CrossRef]
- Chen, X. L.; Zhou, X. G.; Xia, X. Y.; Xie, X. J.; Lu, P.; Feng, Y. Modeling of the transport, hygroscopic growth, and deposition of multi-component droplets in a simplified airway with realistic thermal boundary conditions. J Aerosol Sci 2021, 151, 105626. [CrossRef]
- Zhang, Z.; Kleinstreuer, C.; Kim, C. S. Micro-particle transport and deposition in a human oral airway model. J Aerosol Sci 2002, 33, 1635-1652. [CrossRef]
- Zhang, Y.; Chia, T. L.; Finlay, W. H. Experimental measurement and numerical study of particle deposition in highly idealized mouth-throat models. Aerosol Sci Technol 2006, 40, 361-372. [CrossRef]
- Heenan, A. F.; Matida, E.; Pollard, A.; Finlay, W. H. Experimental measurements and computational modeling of the flow field in an idealized human oropharynx. Exp Fluids 2003, 35, 70-84. [CrossRef]
Figure 1.
(a) Schematic diagram of the geometric structure of the realistic human respiratory airway model containing mucus layer; (b) Initial positions of the exhaled aerosol; (c) Mucus layer and the mesh on the surface.
Figure 1.
(a) Schematic diagram of the geometric structure of the realistic human respiratory airway model containing mucus layer; (b) Initial positions of the exhaled aerosol; (c) Mucus layer and the mesh on the surface.
Figure 2.
The velocity profiles along the extracted polylines located at the mid-plane (a) and cross-sections B-B' (b), D-D' (c) and F-F' (d).
Figure 2.
The velocity profiles along the extracted polylines located at the mid-plane (a) and cross-sections B-B' (b), D-D' (c) and F-F' (d).
Figure 3.
Variation of deposition fraction with the impact parameter from present study and data in literature [
33,
40,
41,
42].
Figure 3.
Variation of deposition fraction with the impact parameter from present study and data in literature [
33,
40,
41,
42].
Figure 4.
(a) The streamlines inside the whole model and velocity contours at several key cross-sections (Q=30 L/min). (b) The turbulent kinetic energy contours at the mid-plane and several key cross-sections (Q=30 L/min).
Figure 4.
(a) The streamlines inside the whole model and velocity contours at several key cross-sections (Q=30 L/min). (b) The turbulent kinetic energy contours at the mid-plane and several key cross-sections (Q=30 L/min).
Figure 5.
The profiles of velocity (a), dimensionless velocity (b), turbulent kinetic energy (c) and dimensionless turbulent kinetic energy (d) along the polyline at the mid-plane inside the human respiratory airway at Q=15, 30, 60, 90 and 120 L/min.
Figure 5.
The profiles of velocity (a), dimensionless velocity (b), turbulent kinetic energy (c) and dimensionless turbulent kinetic energy (d) along the polyline at the mid-plane inside the human respiratory airway at Q=15, 30, 60, 90 and 120 L/min.
Figure 6.
The deposited aerosol distributed on airway wall for aerosols exhaled from bronchus with diameters dp=1, 5, 10, 20 μm at Q=15,30,60,90,120 L/min. The blue, yellow, green, red, purple and black particles represent aerosols deposited in mouth, nose, pharynx, larynx, main trachea and bronchus, receptively.
Figure 7.
The DFs of exhaled aerosols released from bronchus in mouth, nose, pharynx, larynx, trachea and bronchus regions at Q=15 (a), 30 (b), 60, 90, 120 L/min, respectively.
Figure 7.
The DFs of exhaled aerosols released from bronchus in mouth, nose, pharynx, larynx, trachea and bronchus regions at Q=15 (a), 30 (b), 60, 90, 120 L/min, respectively.
Figure 8.
The fractions of aerosols deposit in the airway and exhaled out the airway to the environment for aerosols released from the bronchus at Q=15, 30, 60, 90, 120 L/min.
Figure 8.
The fractions of aerosols deposit in the airway and exhaled out the airway to the environment for aerosols released from the bronchus at Q=15, 30, 60, 90, 120 L/min.
Figure 9.
The deposited aerosol distributed on airway wall for aerosols exhaled from larynx with diameters dp=1, 5, 10, 20 μm at Q=15,30,60,90,120 L/min. The blue, yellow, green, red, purple and black particles represent aerosols deposited in mouth, nose, pharynx, larynx, main trachea and bronchus, receptively.
Figure 10.
The DFs of exhaled aerosols released from larynx in mouth, nose, pharynx and larynx regions, and the exhaled fractions to the environment airway at Q=15 (a), 30 (b), 60, 90, 120 L/min, respectively.
Figure 10.
The DFs of exhaled aerosols released from larynx in mouth, nose, pharynx and larynx regions, and the exhaled fractions to the environment airway at Q=15 (a), 30 (b), 60, 90, 120 L/min, respectively.
Figure 11.
The fractions of aerosols deposit in the airway and exhaled out the airway to the environment for aerosols released from the larynx at Q=15, 30, 60, 90, 120 L/min.
Figure 11.
The fractions of aerosols deposit in the airway and exhaled out the airway to the environment for aerosols released from the larynx at Q=15, 30, 60, 90, 120 L/min.
Figure 12.
The fitted deposition fractions against St under expiratory intensities Q=15, 30, 60, 90, 120 L/min for aerosols released from bronchus and larynx.
Figure 12.
The fitted deposition fractions against St under expiratory intensities Q=15, 30, 60, 90, 120 L/min for aerosols released from bronchus and larynx.
|
Disclaimer/Publisher’s Note: The statements, opinions and data contained in all publications are solely those of the individual author(s) and contributor(s) and not of MDPI and/or the editor(s). MDPI and/or the editor(s) disclaim responsibility for any injury to people or property resulting from any ideas, methods, instructions or products referred to in the content. |
© 2023 by the authors. Licensee MDPI, Basel, Switzerland. This article is an open access article distributed under the terms and conditions of the Creative Commons Attribution (CC BY) license (http://creativecommons.org/licenses/by/4.0/).
