1. Introduction
The population is recognized as a driver of the land system and environmental change [
1,
2]. It has long been believed that population growth is potentially exponential while the growth of the food supply from the land is linear. Therefore, if the population increase is uncontrolled, this will lead to social or environmental catastrophes such as land degradation, hunger, and conflict [
3]. The population bomb also painted a gloomy future: overpopulation would cause some people not to be fed by the limited land and hundreds of millions of people would face food insecurity [
4]. However, in most cases, the population is considered as a single, one-dimensional variable, other population numbers or population density, is used as a variable to explore the population-environment nexus. The multi-dimensional structure of the population, such as household number and size, aging population, and divorce rates, was not fully explored [
5]. A thorough understanding of regional and national household dynamics can benefit ecological conservation, real estate development, land use planning, and resource allocation. There are significant implications to proposing a broader perspective about the demographic characteristics of environmental issues.
Population growth and its impacts on environmental issues have been studied intensively [
6,
7], however, the household is a basic unit in many decision makings, such as the demand of rooms in a house, use of agricultural land, and consumption of water, energy and food, the role of household for resource demand was not fully understood. The Land Use and Land Cover Change (LUCC) and its following Global Land Project (GLP) community have examined the relationship between population growth and land-use change in detail. The rising population will increase the residential and agricultural land, which further causes deforestation and loss of other natural habitats [
2]. However, many of these studies have neglected the household dynamics, which have more direct impacts on land-use change [
8,
9]. Even in some countries with decreasing population size, the number of households increased substantially which raising the demand for residential areas and other land uses [
5].
Household dynamics are influenced by population migration, education, socioeconomic change, cultural change, and many other factors [
10], and it can further cause land use changes. Studies have explored the impacts of divorce and the aging population on land-use change [
11,
12], housing development and their impacts on biodiversity [
13,
14], carbon emission [
15,
16], wildland-urban interface wildfire risk [
17], deforestation [
18], and protected areas [
17,
19] in the U.S, and most of these studies are also concentrated at a local scale [
20]. However, similar research in other countries is very limited because of data availability.
The change in household number and size has major implications for land use and environmental Variations. For example, large-scale rural out-migration within the past 40 years has reduced household size and rural population, however, because of the household registration system, many migrated workers still keep houses in rural areas, or even enlarge the rural housing area for security when they are aging, which further increased rural settlement areas [
21,
22], and forming many hollowing villages in China [
23]. On the other side, increasing the urban population and improving living conditions have largely increased urban housing areas. The average housing area per person changed from 3.6 m
2 to 40.8 m
2 in Chinese cities from 1978 to 2018, and in rural areas, it increased from 8.1m
2 to 48.9m
2 during the same period. With nearly every household having at least one suit house in China, the increasing household numbers in China have largely increased the construction land, reducing fertile agricultural land and bringing cascading effects to other land-use transitions [
24]. However, related studies are very limited regarding this issue.
Exploring the household dynamics and its impacts on land-use change has great implications for urban and rural land use planning, food, water, and energy demand, and also contributes to environmental conservation and protection. Here, we use the data from the Chinese statistics yearbook, China’s population census, and land use survey and remote sensing, to examine the household dynamics of China in the past four decades, understand how that has affected land use change in China, provide quantitative approaches to address the negative impacts of household dynamics on land-use change and navigate the sustainable land management under the changing household dynamics. This study provides a theoretical basis for sustainable development and utilization of land resources and helps formulate future land-use policies. The proposed analytic framework can also help to understand the relationship between household dynamics and land-use change in other developing countries and beyond, thus promoting sustainable land-use management.
2. Data Sources
The Chinese census defines a household as family members who live together in the same house and are related by blood, marriage, or adoption [
25]. Therefore, the household in this study only refers to the family household and does not include the collective household which belongs to a certain work unit. In addition, household dynamics refers to the changing number, structure, and composition of the household, including household age structure, household size, household type, and so on. Here we focus on household size and numbers when we mention household dynamics, because of data availability and the patterns of change in the number and size are clear, it is easier to help understand the impact of changes in household structure on land use. Household dynamics are also influenced by multi factors, including the birth rate, divorce rate, aging rate, population migration, etc [
26]. Therefore, we selected these variables as the influence factor of household dynamics. The data sources used in this paper are shown in
Table 1.
The birthrate data from 1953 to 2009 are collected from existing studies [
27], and data from 2010 to 2020 are based on China Statistical Yearbook. The household housing size depends on the household's economic status, but Per capita housing area depends on the household size. Per capita housing area is used to reflect the housing demands of residents, it can show residential area change because of household dynamics and socio-economic development. Before 1990, there don’t have Hainan and Chongqing in China. Since Chongqing was separated from Sichuan Province as a municipality in 1997, China's statistics were divided into 30 provinces or regions before 2000 and 31 after 2000. Due to data limitations, household dynamics in Taiwan, Macao, and Hong Kong were not analyzed.
3. Results
3.1. Household dynamics in China
3.1.1. Changing of household number
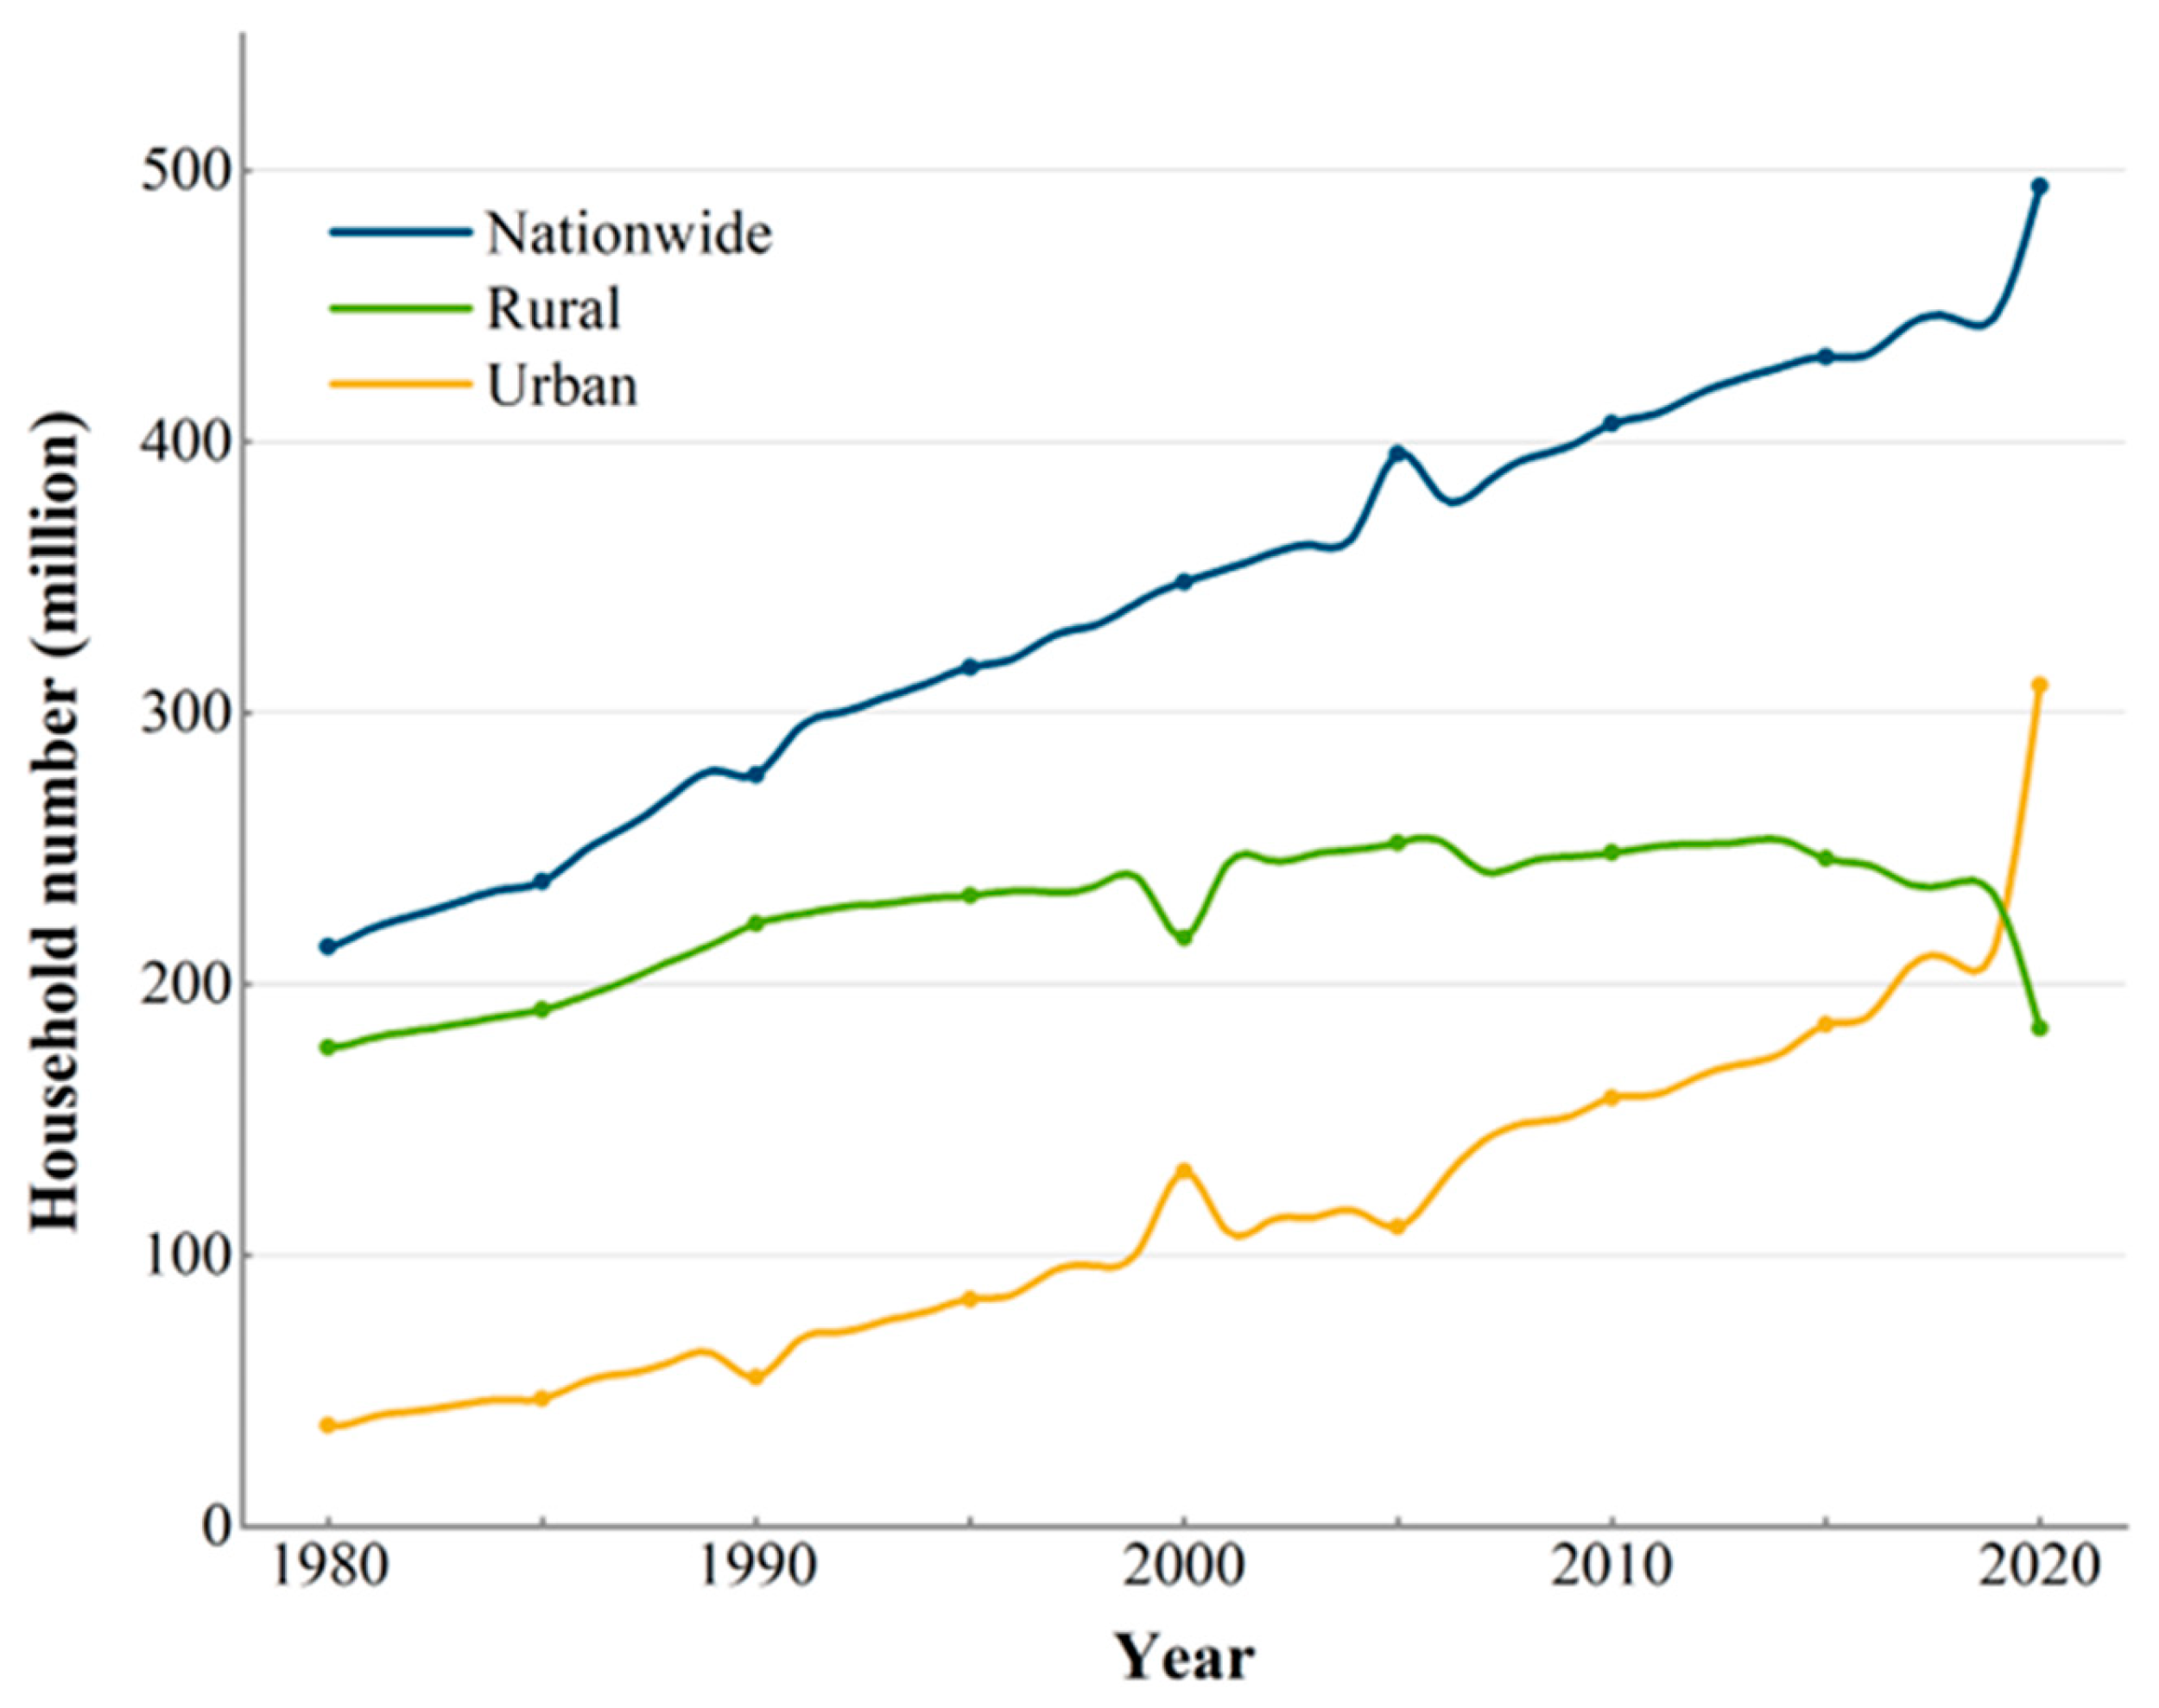
The population has grown over the last forty years, from 987.05 million in 1980 to 1409.78 million in 2020. Comparatively, the household number has increased from 213.96 million to 494.16 million. By comparison, the population increased 42.83%, while the number of households increased dramatically faster, reaching 130.95% between 1980 and 2020. According to
Table 2, the proportion of family households and collective households in China by year, with fewer households and more collective households in 1982 than in 1990. Between 1990 and 2020, there was a general decline in the number of households while there was an increase in the number of collective homes.
The trend of changing the household number in urban and rural areas is different. In 1980, there were 176.73 million households in rural areas and only 37.23 million in urban areas. The number of households in urban regions climbed to 310.38 million in 2020, compared to 183.77 million in rural areas (
Figure 1). More households now reside in cities, resulting from rapid urbanization and population movement from rural to urban areas.
Although the number of households in urban and rural areas has an increasing trend, the rate in urban is much faster than that in rural areas. In the past four decades, in rural, except for 2000, the number of households increased slowly, reaching a maximum of 253.13 million in 2014, with only a 3.98% increase in 2020 than 1980. While the number of households in urban peaked at 348.30 million in 2000 and increased 733.63% in 2020, approximately 8.33 times higher than that in 1980. As projected, the urbanization rate will increase by 70% in 2030, and 80% in 2050 since continuous rural-to-urban migration [
28]. The household number in urban areas will increase and that in rural areas will continue to decrease in the following several decades.
3.1.2. Changing of household size
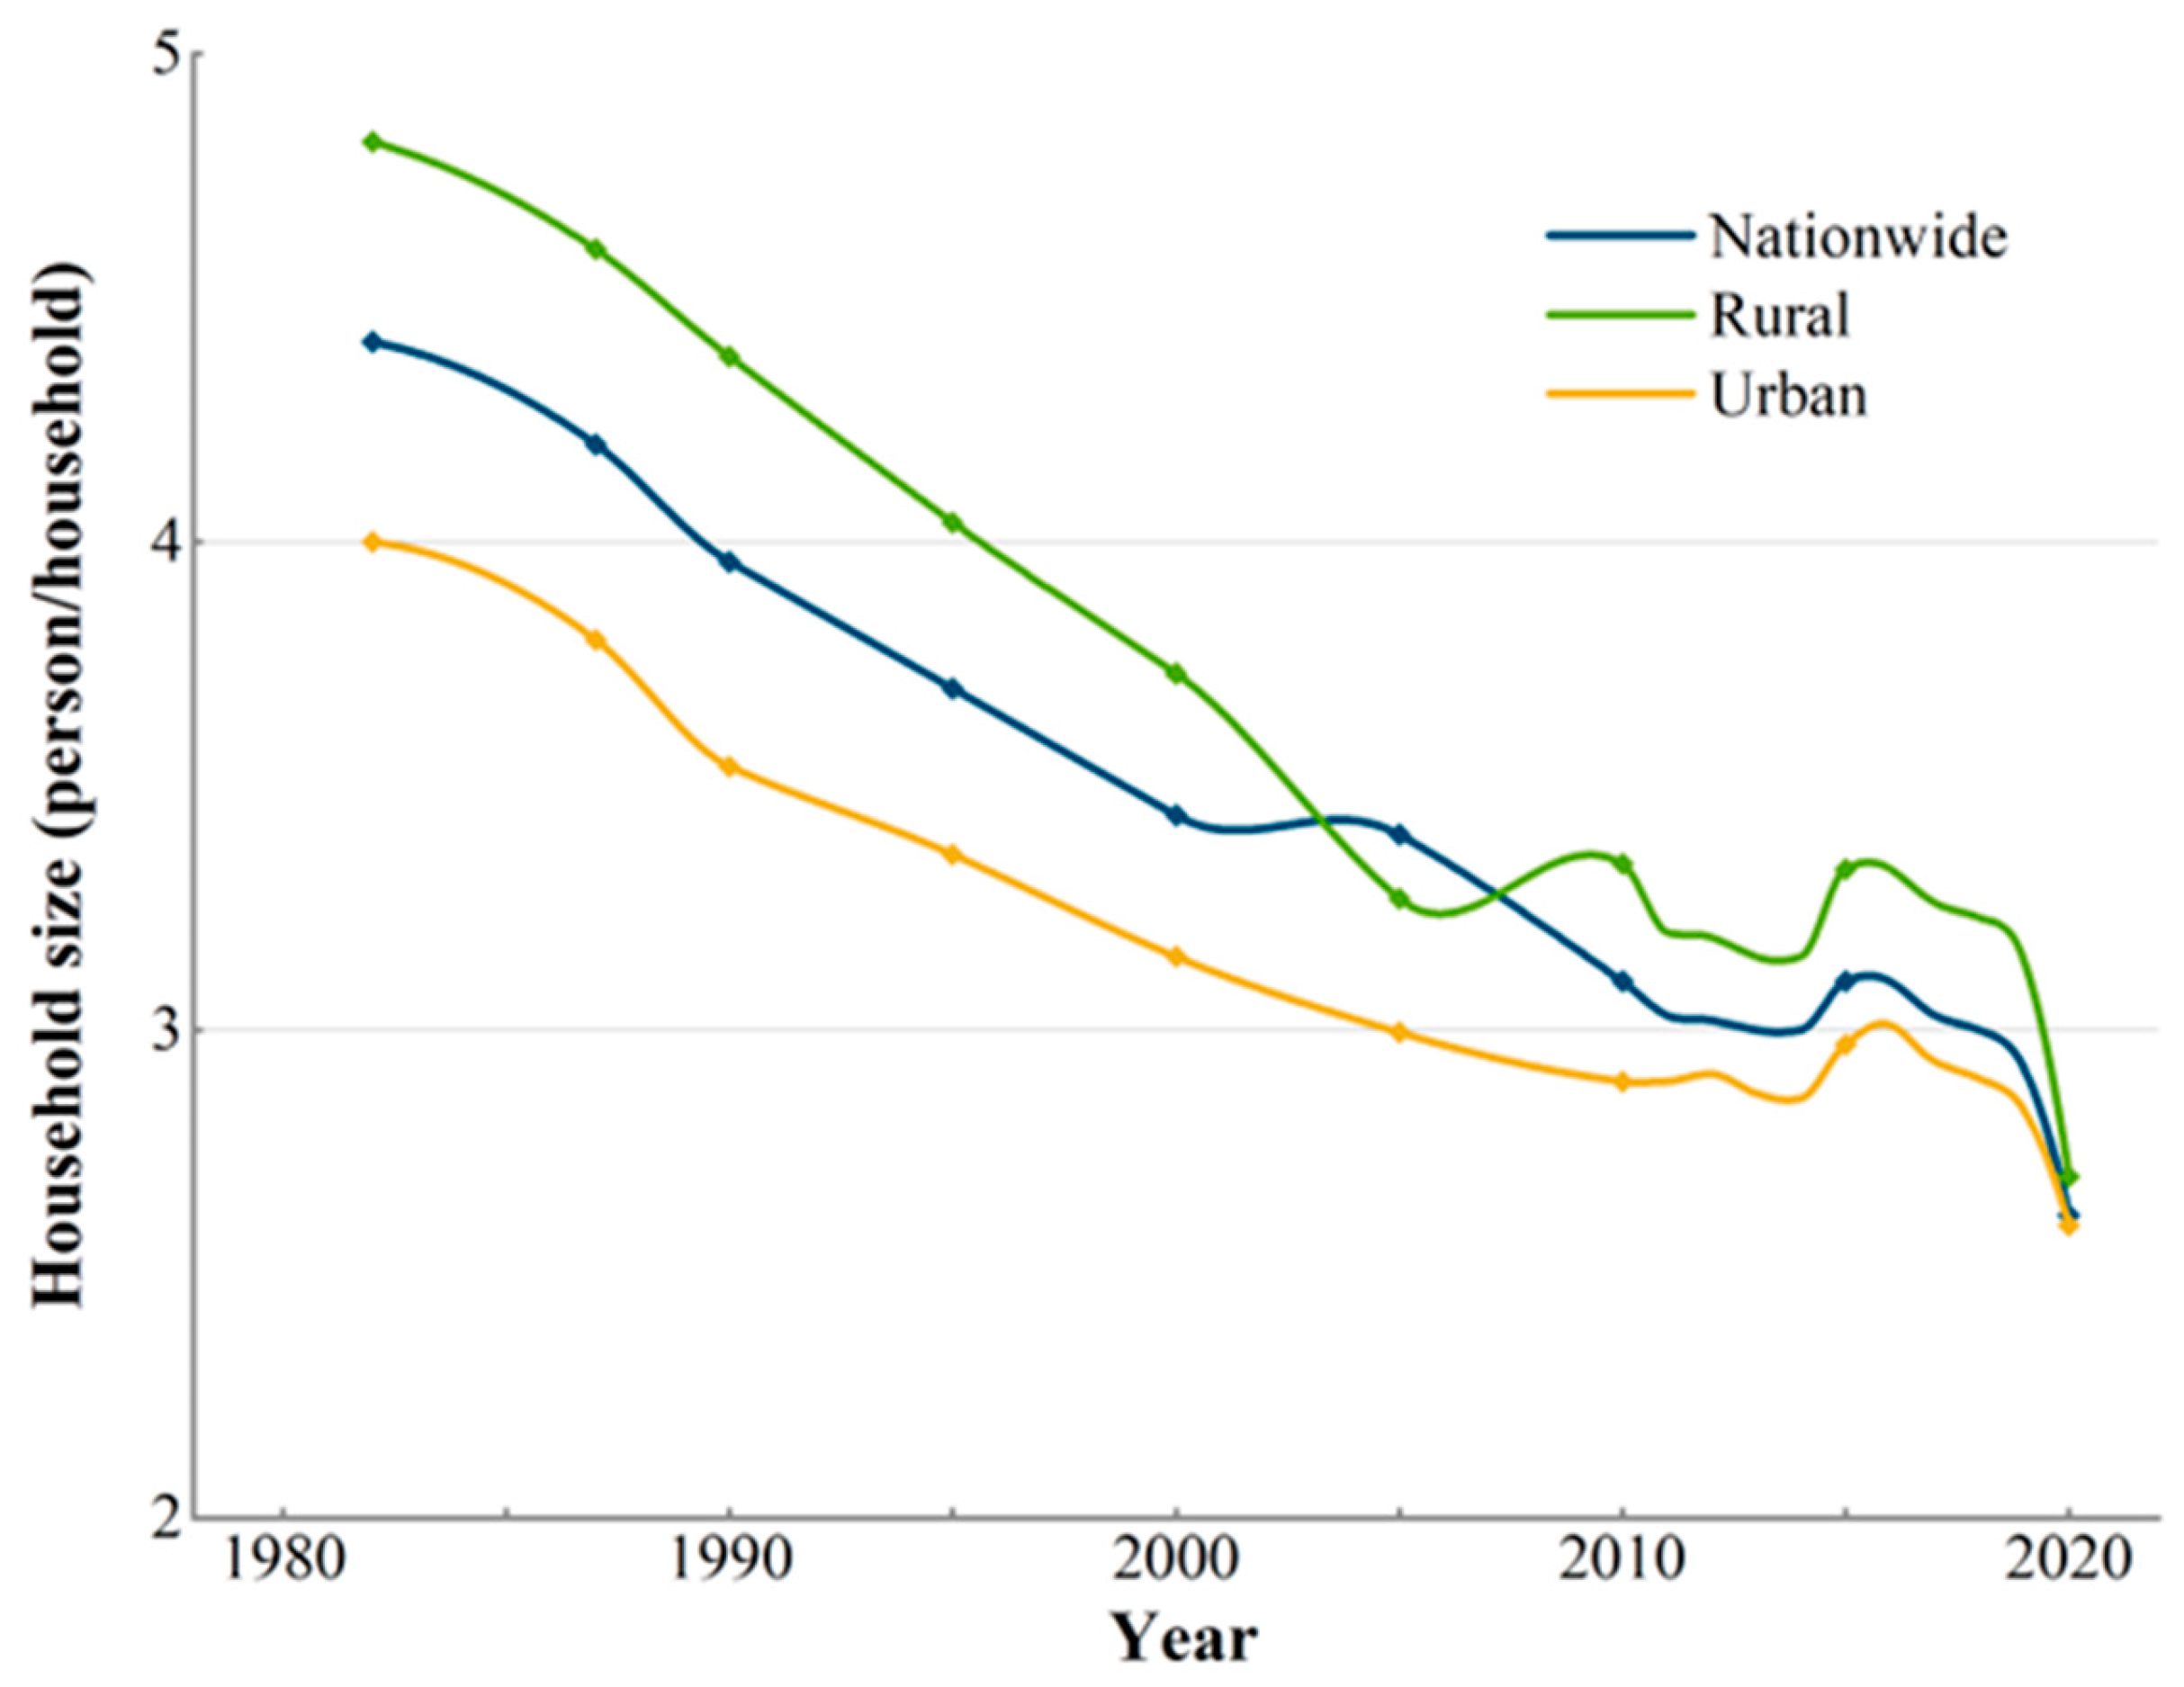
Over the past four decades, the size of Chinese households has gradually decreased. The national household size fell to 2.62 in 2020 from 4.41 in 1982, when the third population census was taken. The number of "three-person families" is the minimum threshold, the household size has declined in 2019 and less than three for the first time (
Figure 2).
Although household size has a diminishing trend in both rural and urban settings, the decline is not the same in each (
Figure 2). The size of rural households can vary more than urban ones. Until 2016, the household size in rural has always had more than four members, while urban household size only had four members in 1982 and have never had more than four members thereafter. The size in rural areas declined from 4.82 in 1982 to 2.7 in 2020. Urban household sizes decreased from 4.00 to 2.60 during the same period. According to the data, only in 2015, the national household size was larger than the rural one, for the remaining years, the household size was highest in rural areas, second highest nationally, and lowest in urban areas. With a high difference of 0.41 in 1982 and a range of only 0.02-0.07 in 2020, the disparity in household size between areas is at its lowest in 2020.
In addition, changes in household structure are not only in the number size but also in the intergenerational structure. From 1982 to 2020, the generations in a single family underwent a significant shift. Only 13.77% of families in 1982 had only one generation, whereas 67.46% of households had two generations. However, in 2020, nearly half of the families only had one generation, and only 36.72% of families have two generations. The families that have three or more generations also changed a lot, it decreased from 18.76% in 1982 to only 13.78% in 2020, the size of the household tends to decrease. The number of households with only one generation rapidly increased in China, with only 50.50% of families having two generations or above in 2020(
Table 3).
3.1.3. Household size variation among provinces of China
The household size is diverse in various provinces in China. From 1990 to 2020, household size declined in all provinces; in 1980, Yunnan had the highest household size in China (5.17 people per family), while Shanghai had the lowest household size (3.6). By 2020, Heilongjiang is the smallest province in China, with only 2.22 people living in each family, below the national average, and Tibet Autonomous Region is the largest, with 3.19 people living in each household. The biggest shift in household size between 1980 and 2020 occurred in Ningxia, while the smallest shift occurred in Shanghai.
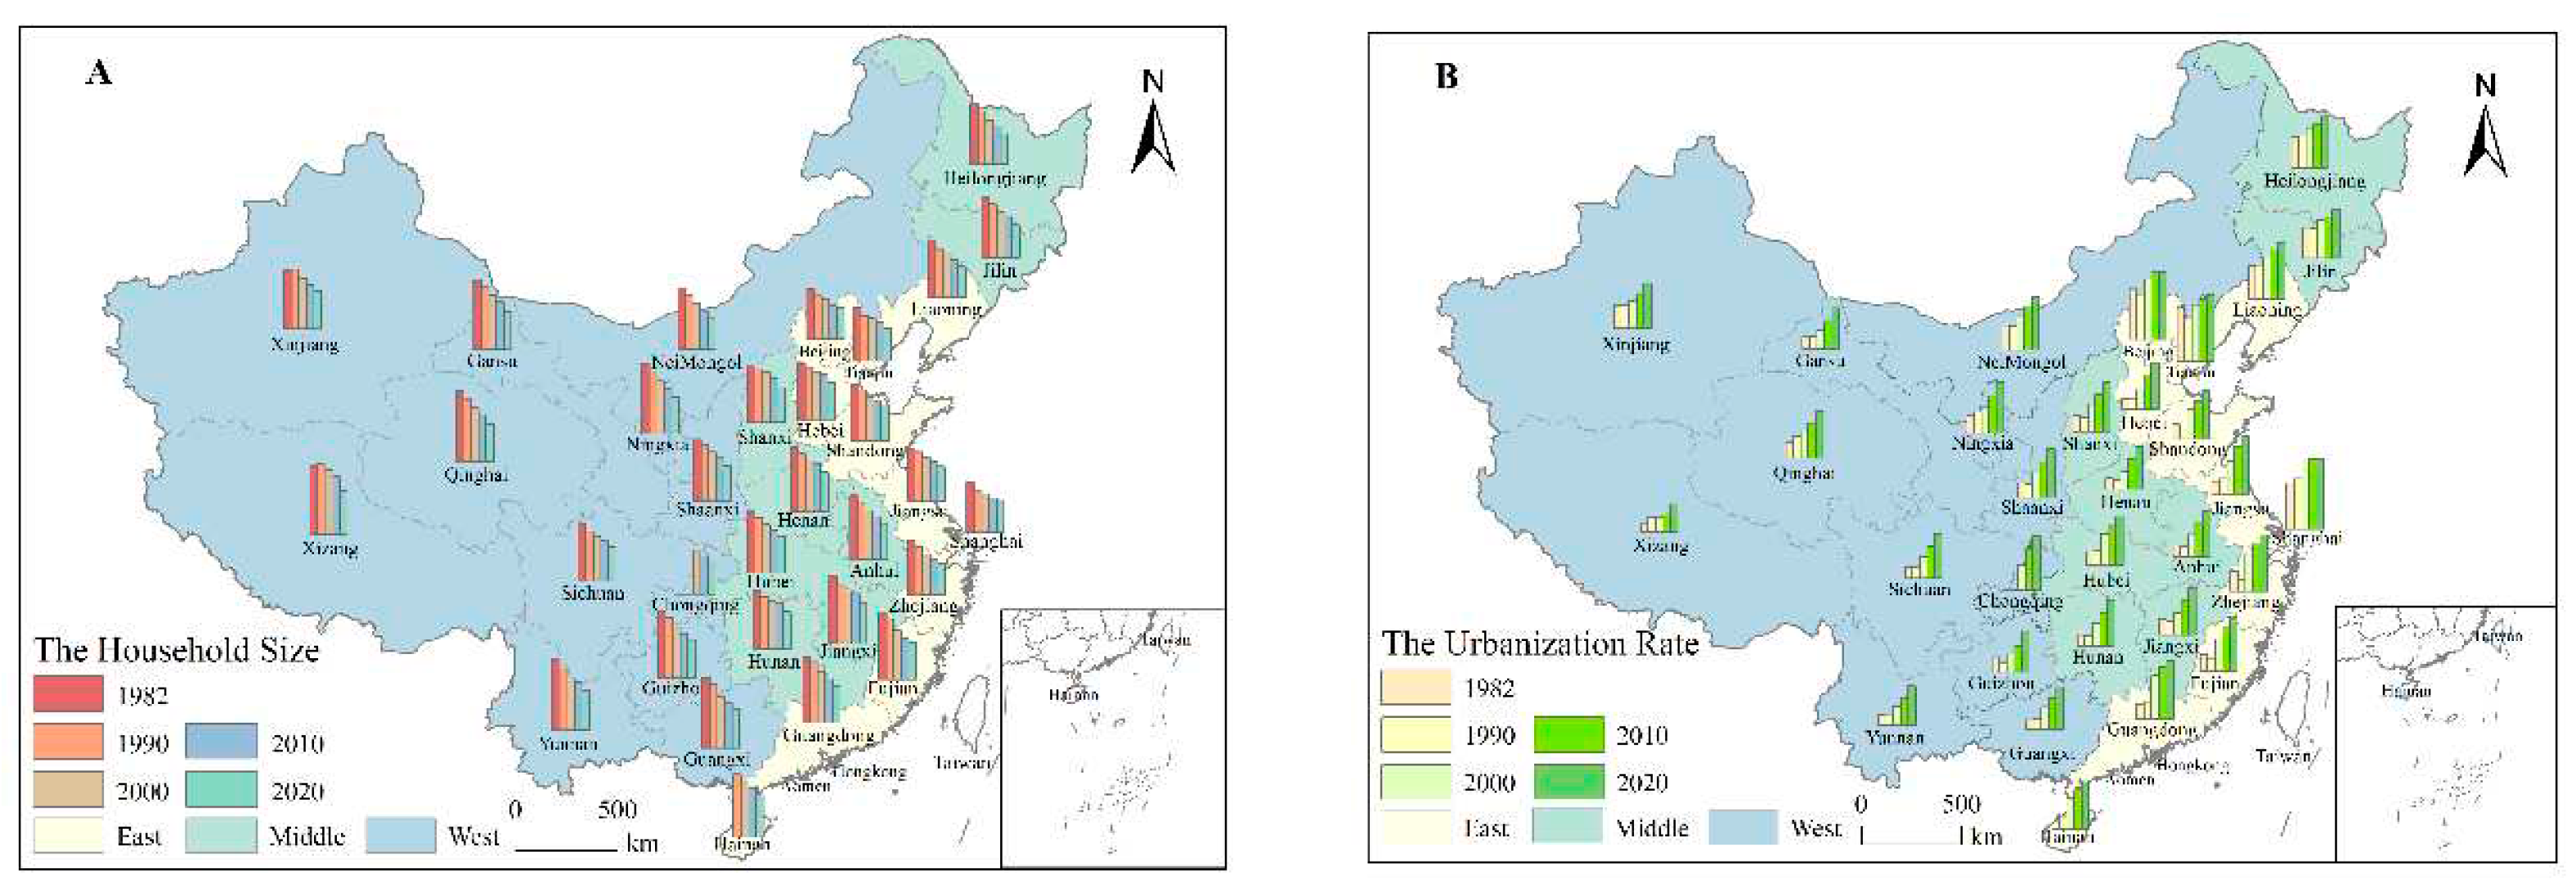
The spatial distribution of household size in China from 1982 to 2020 is shown in
Figure 3A, Combined with the economic level zoning (According to the economic zone division Rules of 2000, China is divided into three regions: East, Central and west), reveals that the household size in the eastern region is the smallest, while that in the western region is the largest. In the eastern regions, the household sizes in Shanghai, Beijing, and Tianjin are much smaller than in others. In the western regions, Tibet, Qinghai, and Yunnan always have larger household sizes than the other provinces. It shows that the economic level influences the size of the household.
As the urbanization rate is one of the indicators to assess the level of economic development, the urbanization rate of each province in China from 1980 to 2020 was calculated (
Figure 3B). By comparing the rate of urbanization and household size among provinces, it can be shown that the rate of urbanization is inversely connected to the change in household size, meaning that while the size of households is dropping, the rate of urbanization is rising. Household sizes are smaller in areas with higher urbanization rates, such as Beijing, Tianjin, and Shanghai. Greater household sizes can be found in areas like Yunnan, Guizhou, and Guangxi, which have lower rates of urbanization. However, not all provinces follow this pattern. For instance, Heilongjiang province, which has an urbanization rate of only 65.61% in 2020, has the lowest household size at 2.22, suggesting that the urbanization rate is not the only factor affecting household size.
3.1.4. Demographic drivers for household structure in China
The household is an integral unit of the population, the change in the household structure is influenced by changes in the population structure, such as the birth rates, divorce rates, aging populations, and migration, all of which have various effects.
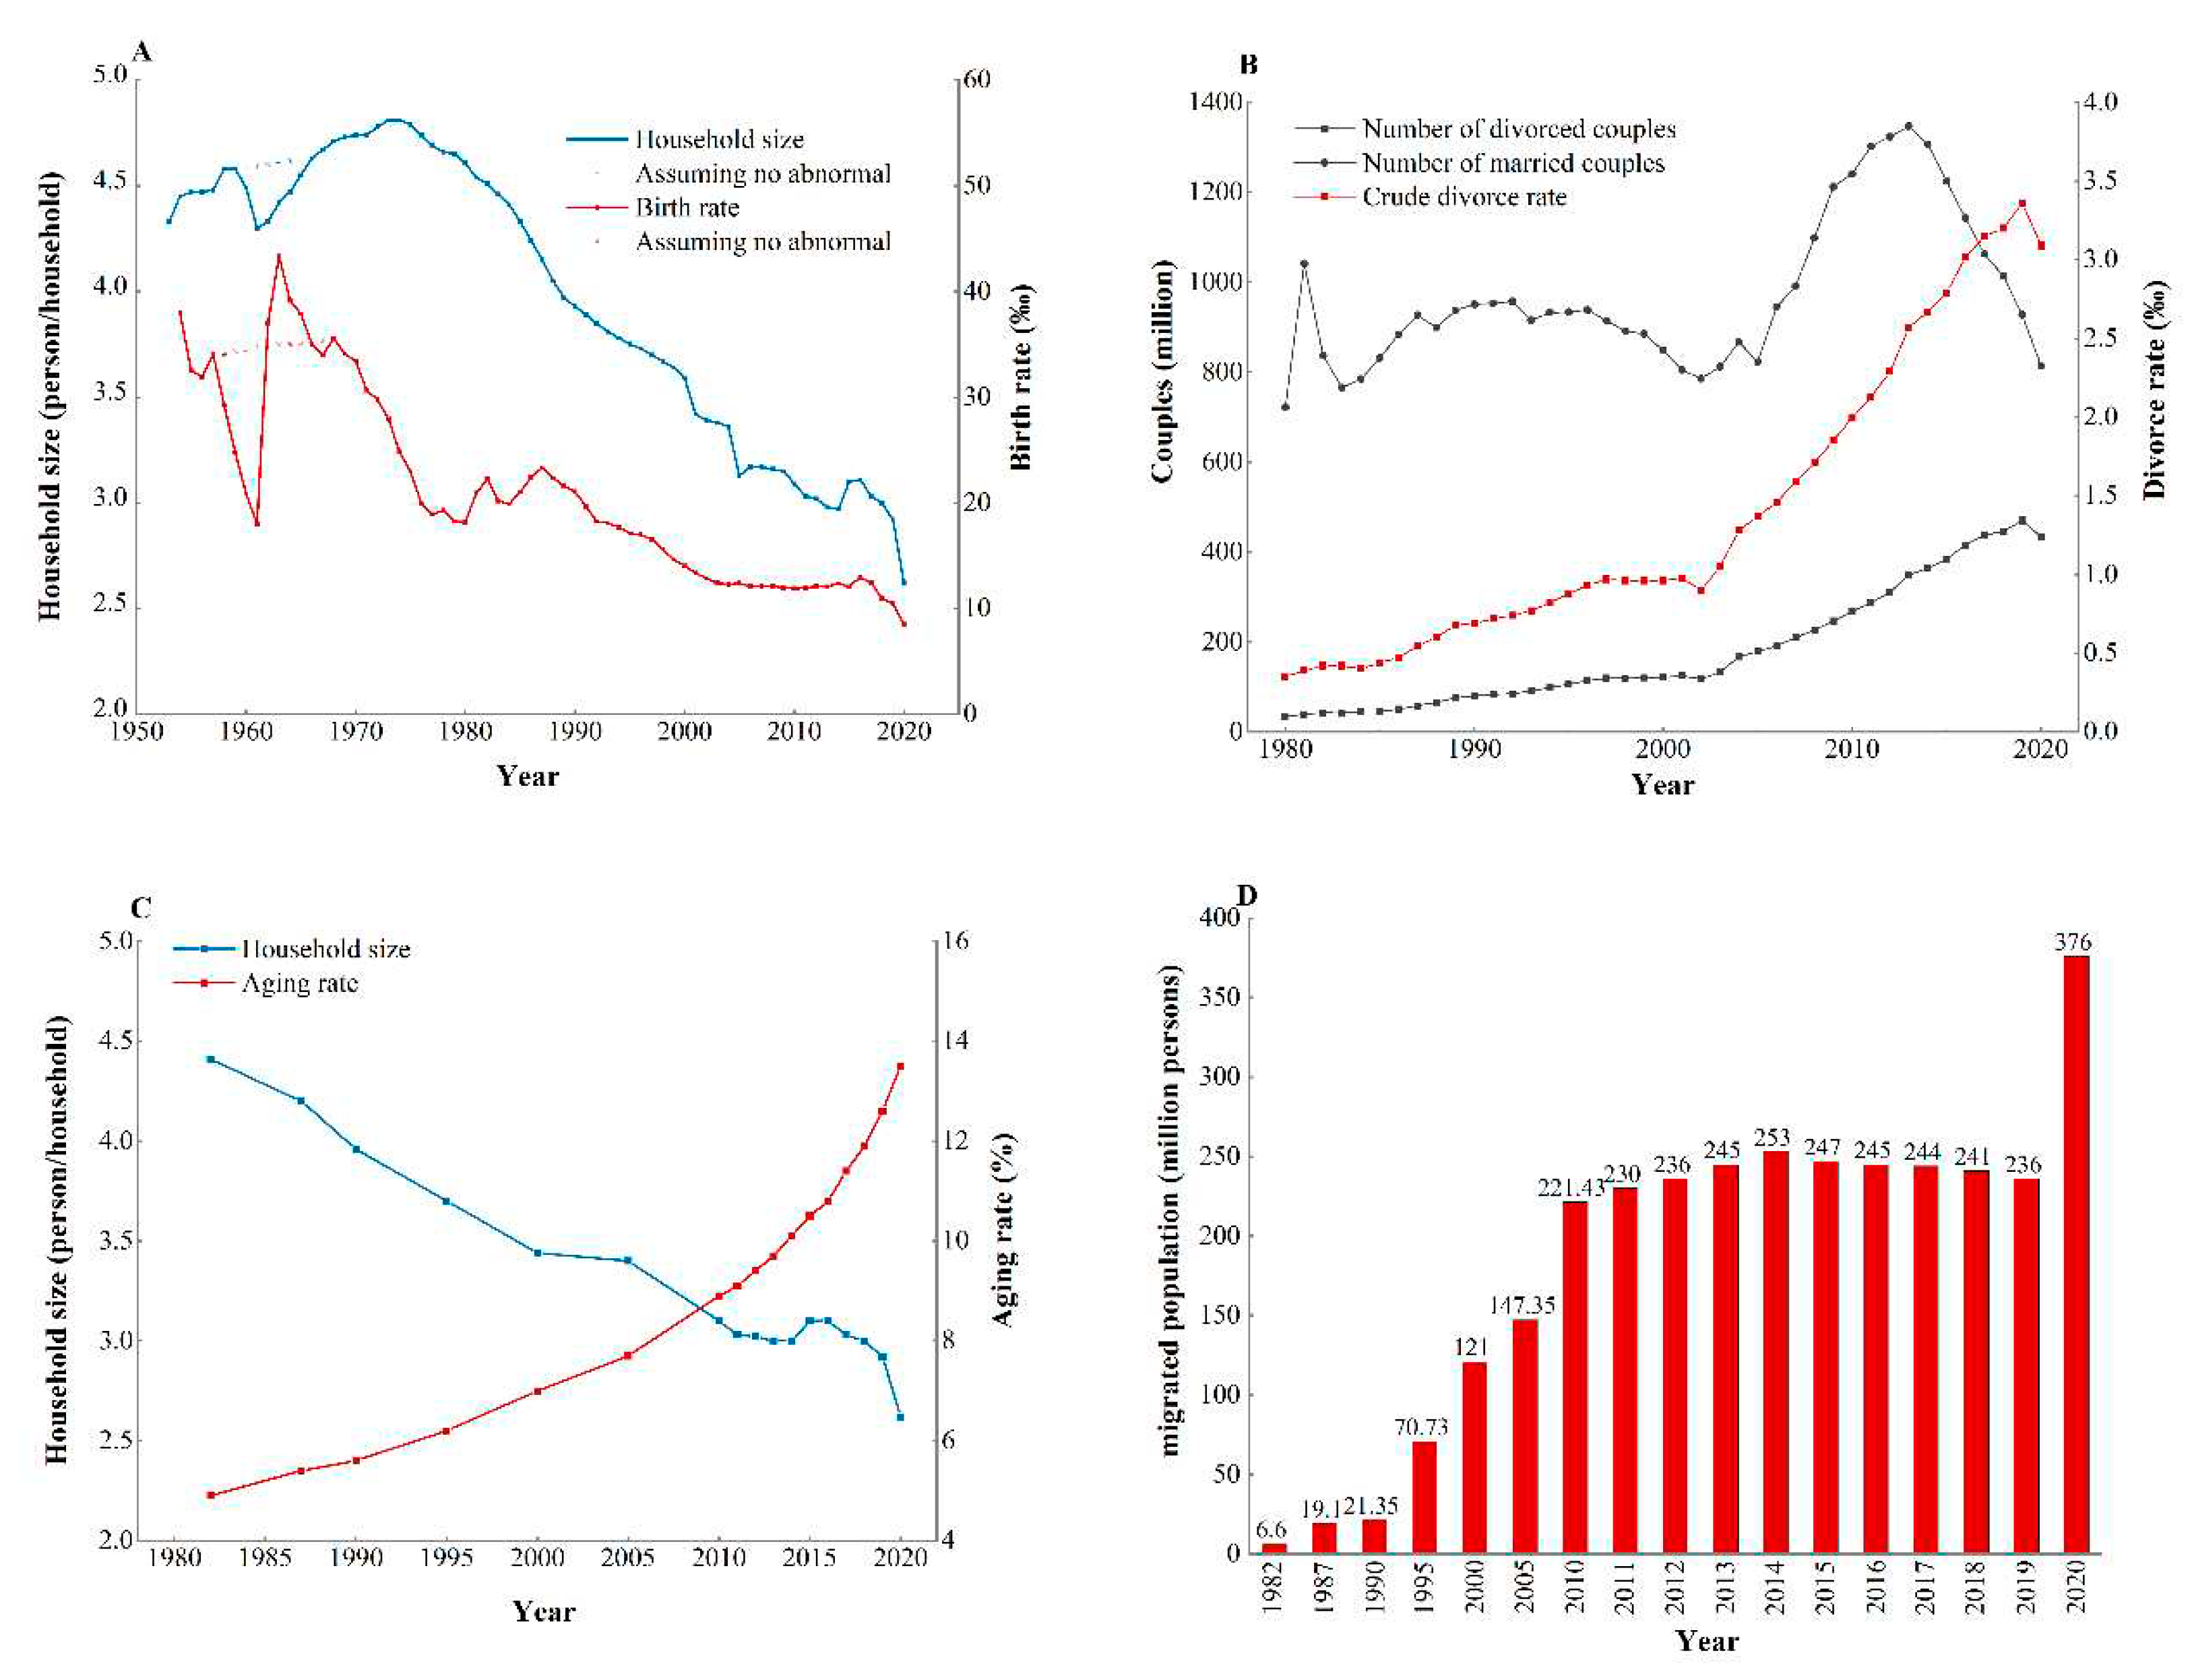
Comparing China's household size and birth rate (
Figure 4A), the trends of change are similar. The birthrate in China declined from 40‰ in the 1960s to less than 10‰ in 2020, and the household size shrunk from 4.62 in the 1960s to 2.62 in 2020. The birth rate implies the birth of a new child, if only considered the birth rate, an increase in the birth rate would indicate that new family members are being added into the household, corresponding to an increase in the size of the household, indicating that the birth rate contributes to the size of the household.
The divorce rate always affects household numbers and size. Generally, marriage will reduce the household number and increase household size, but divorce will increase the household number and reduce household size. Before a couple of divorces, they belong to the same household with their children, but after the divorce, they will be separated into two new households, which is a process of reducing the household number and increasing the household size. The divorce rate increased from 0.35‰ in 1980 to 3.09‰ in 2020, nearly rising nine times (
Figure 4B). There were only 0.34 million couples divorced in 1980, and it increased to 4.34 million in 2020, yet, the number of couples married only increased from 7.21 million to 8.14 million couples.
Population aging is another indirect driving force of household size change. The percentage of the aging population older than 65 years increased from 4.9% in 1982 to 13.5% in 2020 (
Figure 4C). There was only 49.28 million aging population in 1982, it increased to 190.64 million in 2020, with a total increase of 287% over the past 40 years. In many families, the old generation and the young generation are not living together, as shown in
Table 3, the number of one-generation families is rapidly increasing and two- or three-generation families are declined in the past several decades.
Migration can also significantly affect household size and number. In 1982, there were 6.6 million migrated people, which increased to 376 million in 2020 (
Figure 4D). Around a quarter of people are migrated people, or floating population in China now. With the rapid development of the urban economy, a growing gap between rural and urban incomes shows a continuously increasing trend, which drives more labor migration flows into metropolitan areas. When these people have new families in urban areas, the original household size in rural areas decreases, increasing the total household number.
3.2. Changes in housing demand and land use during the past 40 years in China
3.2.1. The changing of per capita housing area in urban and rural areas
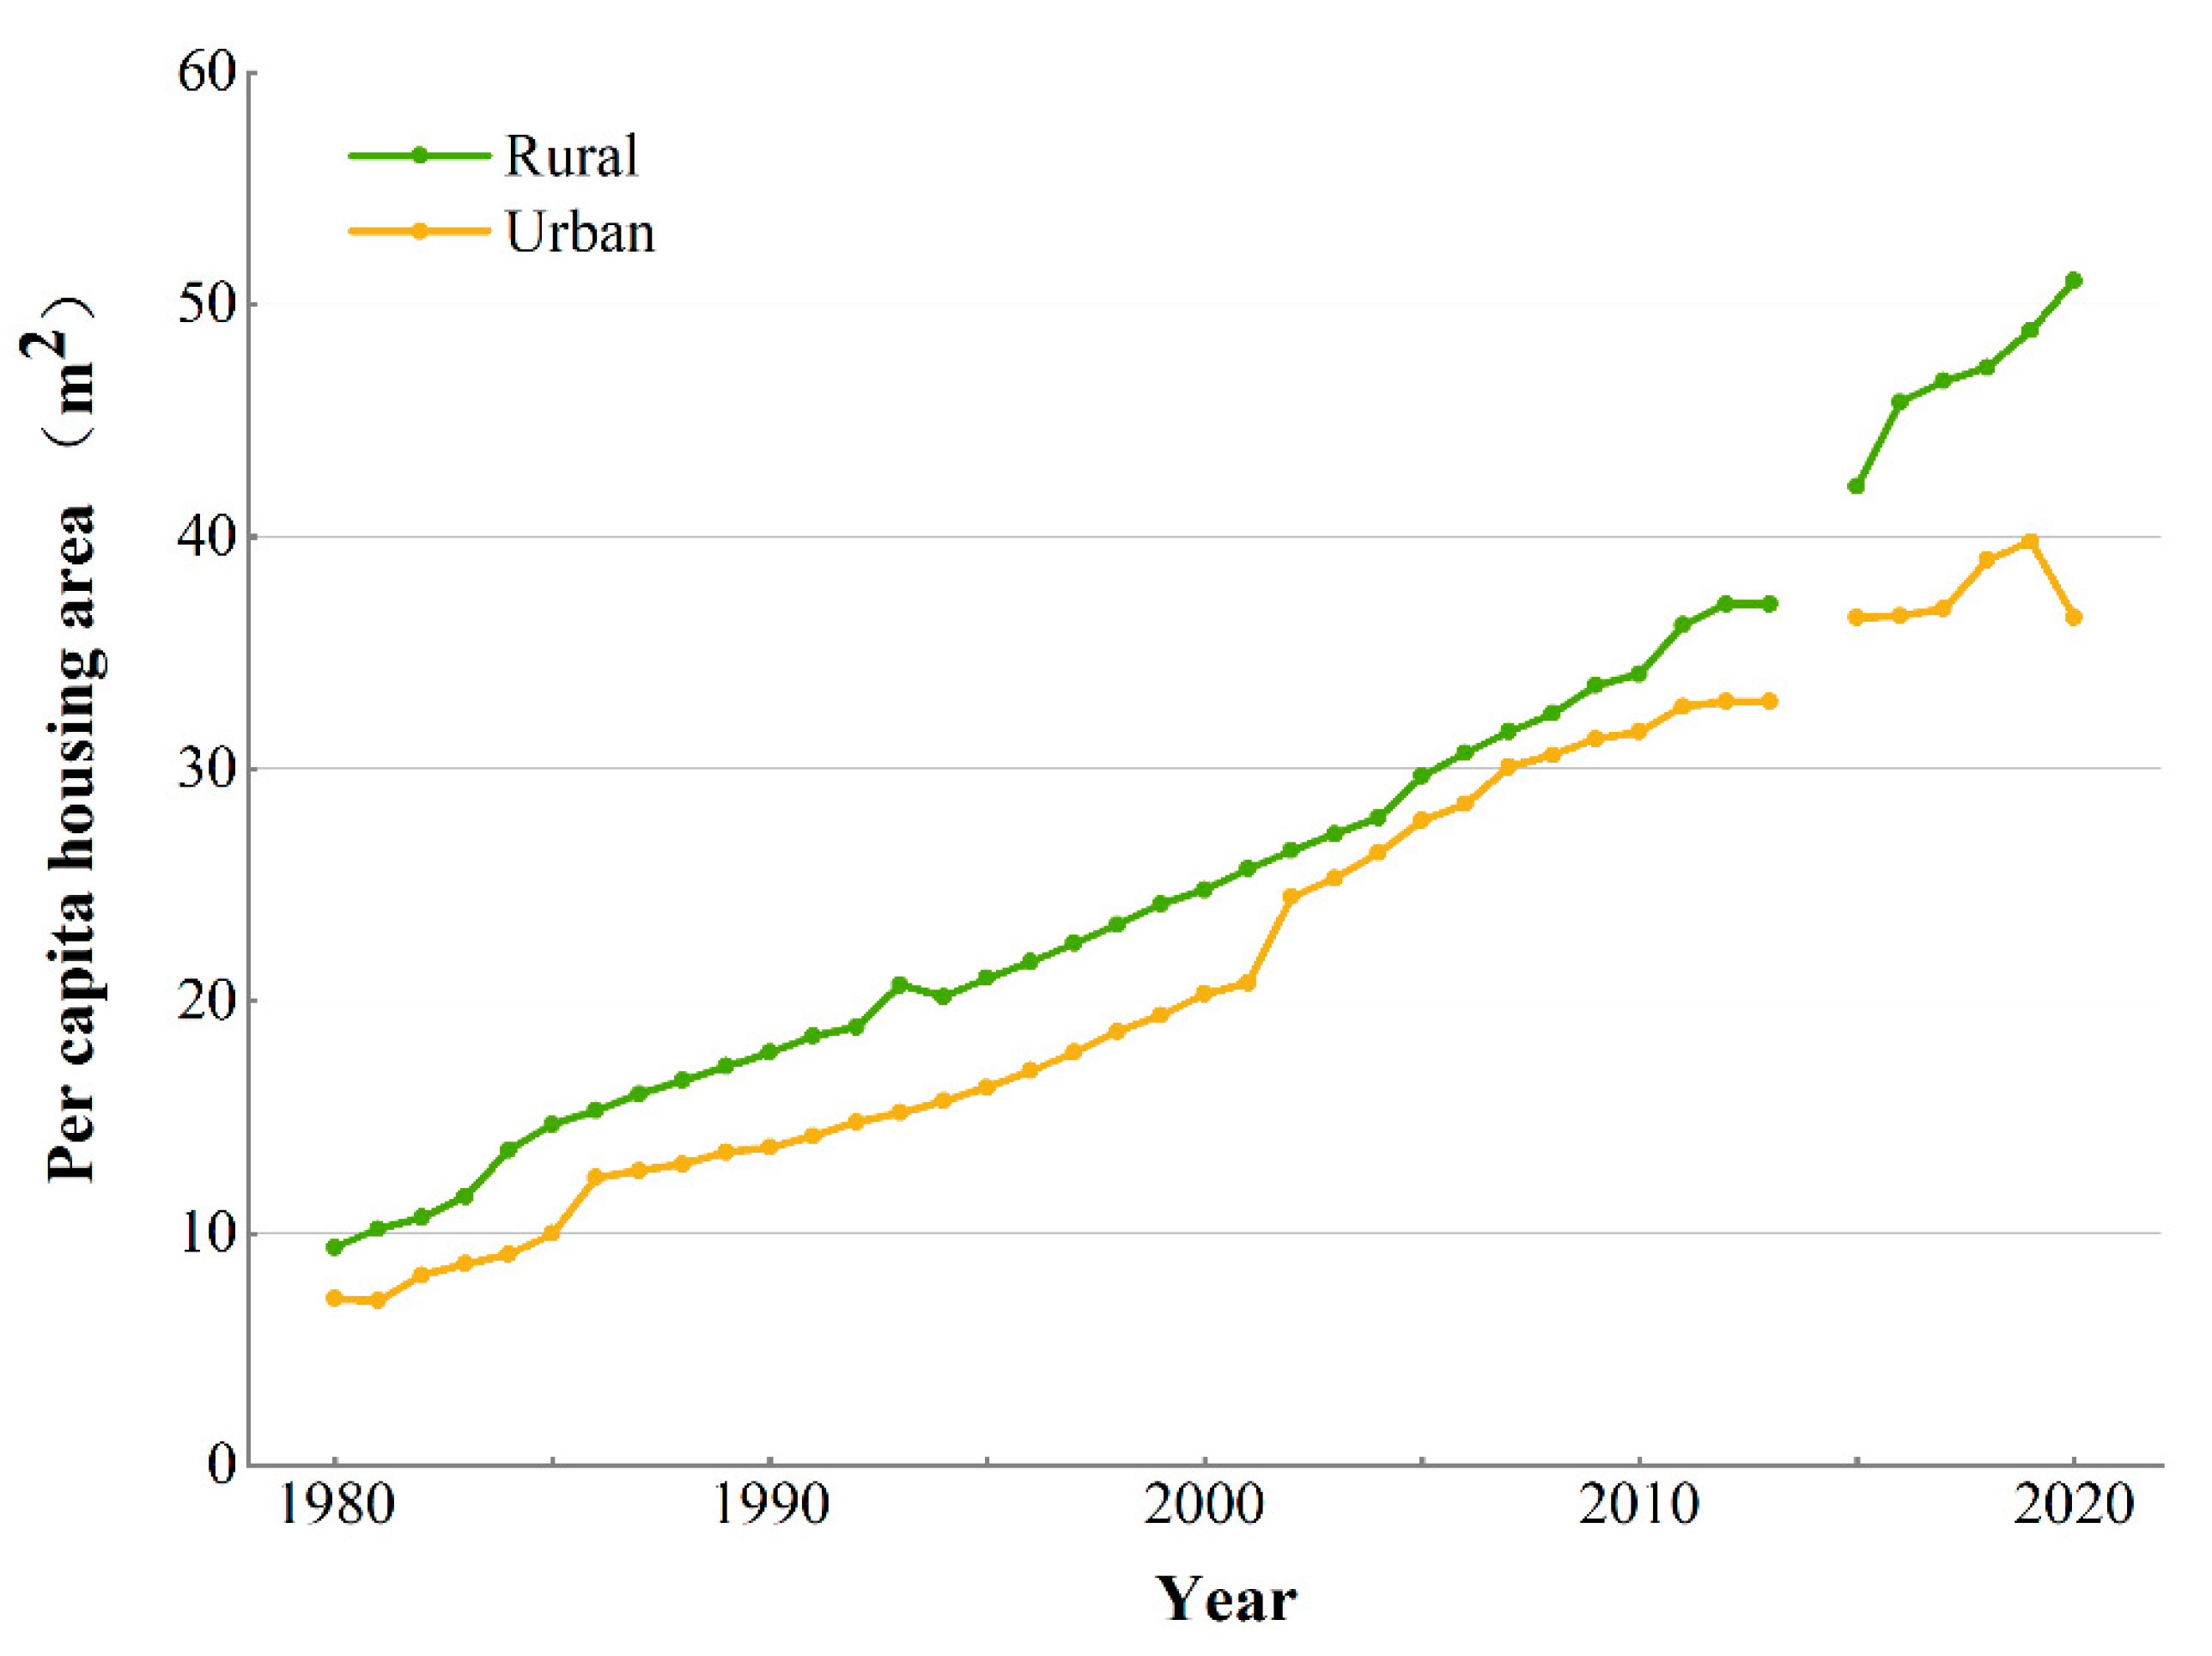
The per capita housing area reflects the demand for housing of the residents. The per capita housing area has increased both in urban and rural areas. Specifically, the per capita housing area in urban areas was7.2 m
2 in 1980, then increased to 36.52 m
2 in 2020, while in rural areas, it changed from 9.4 m
2 in 1980 to 51.03 m
2 in 2020 (
Figure 5). The per capita housing area in rural areas was always larger than that in urban areas. With the increase in the number of households and the per capita housing area, the demand for housing promotes a surge in construction land.
Combined with China's rural and urban populations, the total housing area can be roughly estimated. According to national statistics, China's urban population is 902.20 million, and the rural population is 509.92 million by the end of 2020. The total housing area is 32,948.34 million m2 in urban areas and about 26,021.22 million m2 in rural areas. To meet the housing needs of residents, China needs at least 58,969.56 million m2 of housing space. As the household number was 494.16 million in 2020, the average living area of each household was about 119.3 m2.
3.2.2. The changing of construction and completion area in China
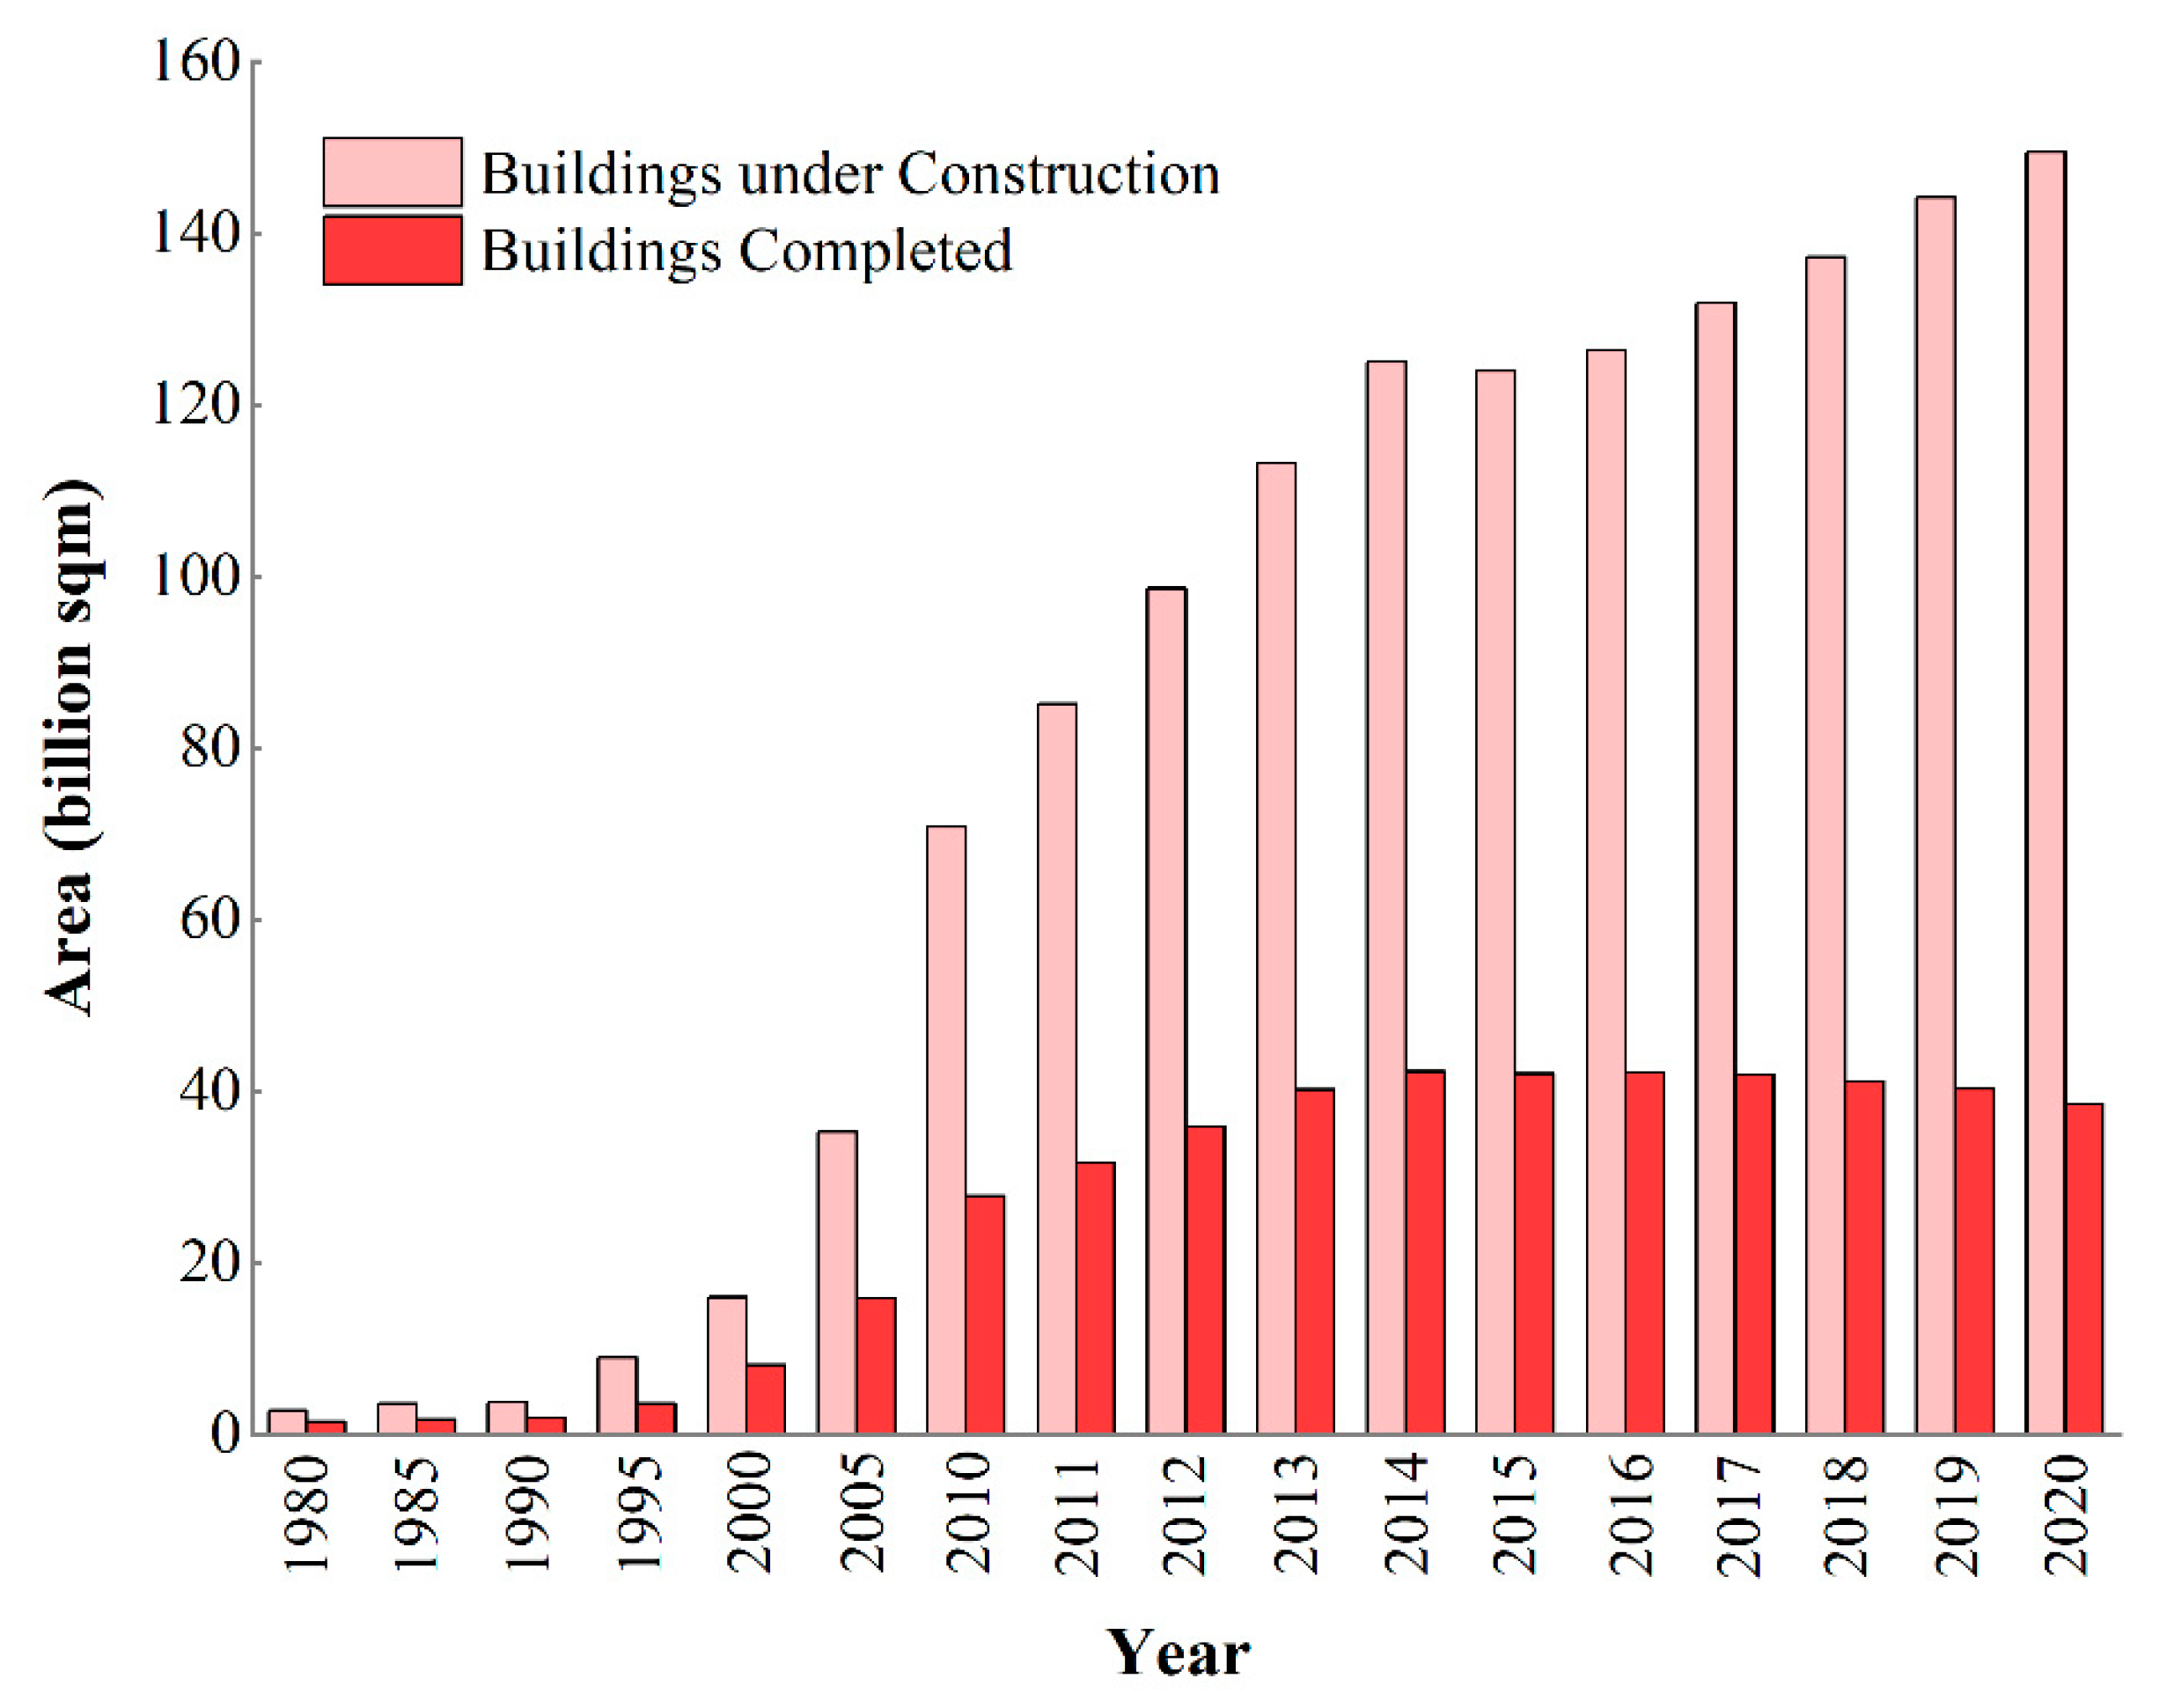
The construction and housing completed areas can also reflect the residents' demand for housing. The data show that (
Figure 6). construction area (Building under Construction) has been increasing, indicating that residents' demand for housing has been growing, with a faster rate of growth between 2014 and a slower but unabated increase in floor area after 2014, with only 275 million m
2 of housing area under construction in 1980 and 14,947 million m
2 in 2020.
In this study, the housing area consists of new construction in the current year and unfinished projects from previous years, making it difficult to estimate the total floor area. As a result, the housing completed area (Building Completed) is calculated each year, and the housing area completed shows a similar growth trend, with 45,653 million m2 of housing area completed from 1980 to 2020. less than the 58,969.56 million m2 minimum dwelling area that China was previously thought to require.
3.2.3. Changes in the land use change in China during the past 40 years
Based on the land use data [
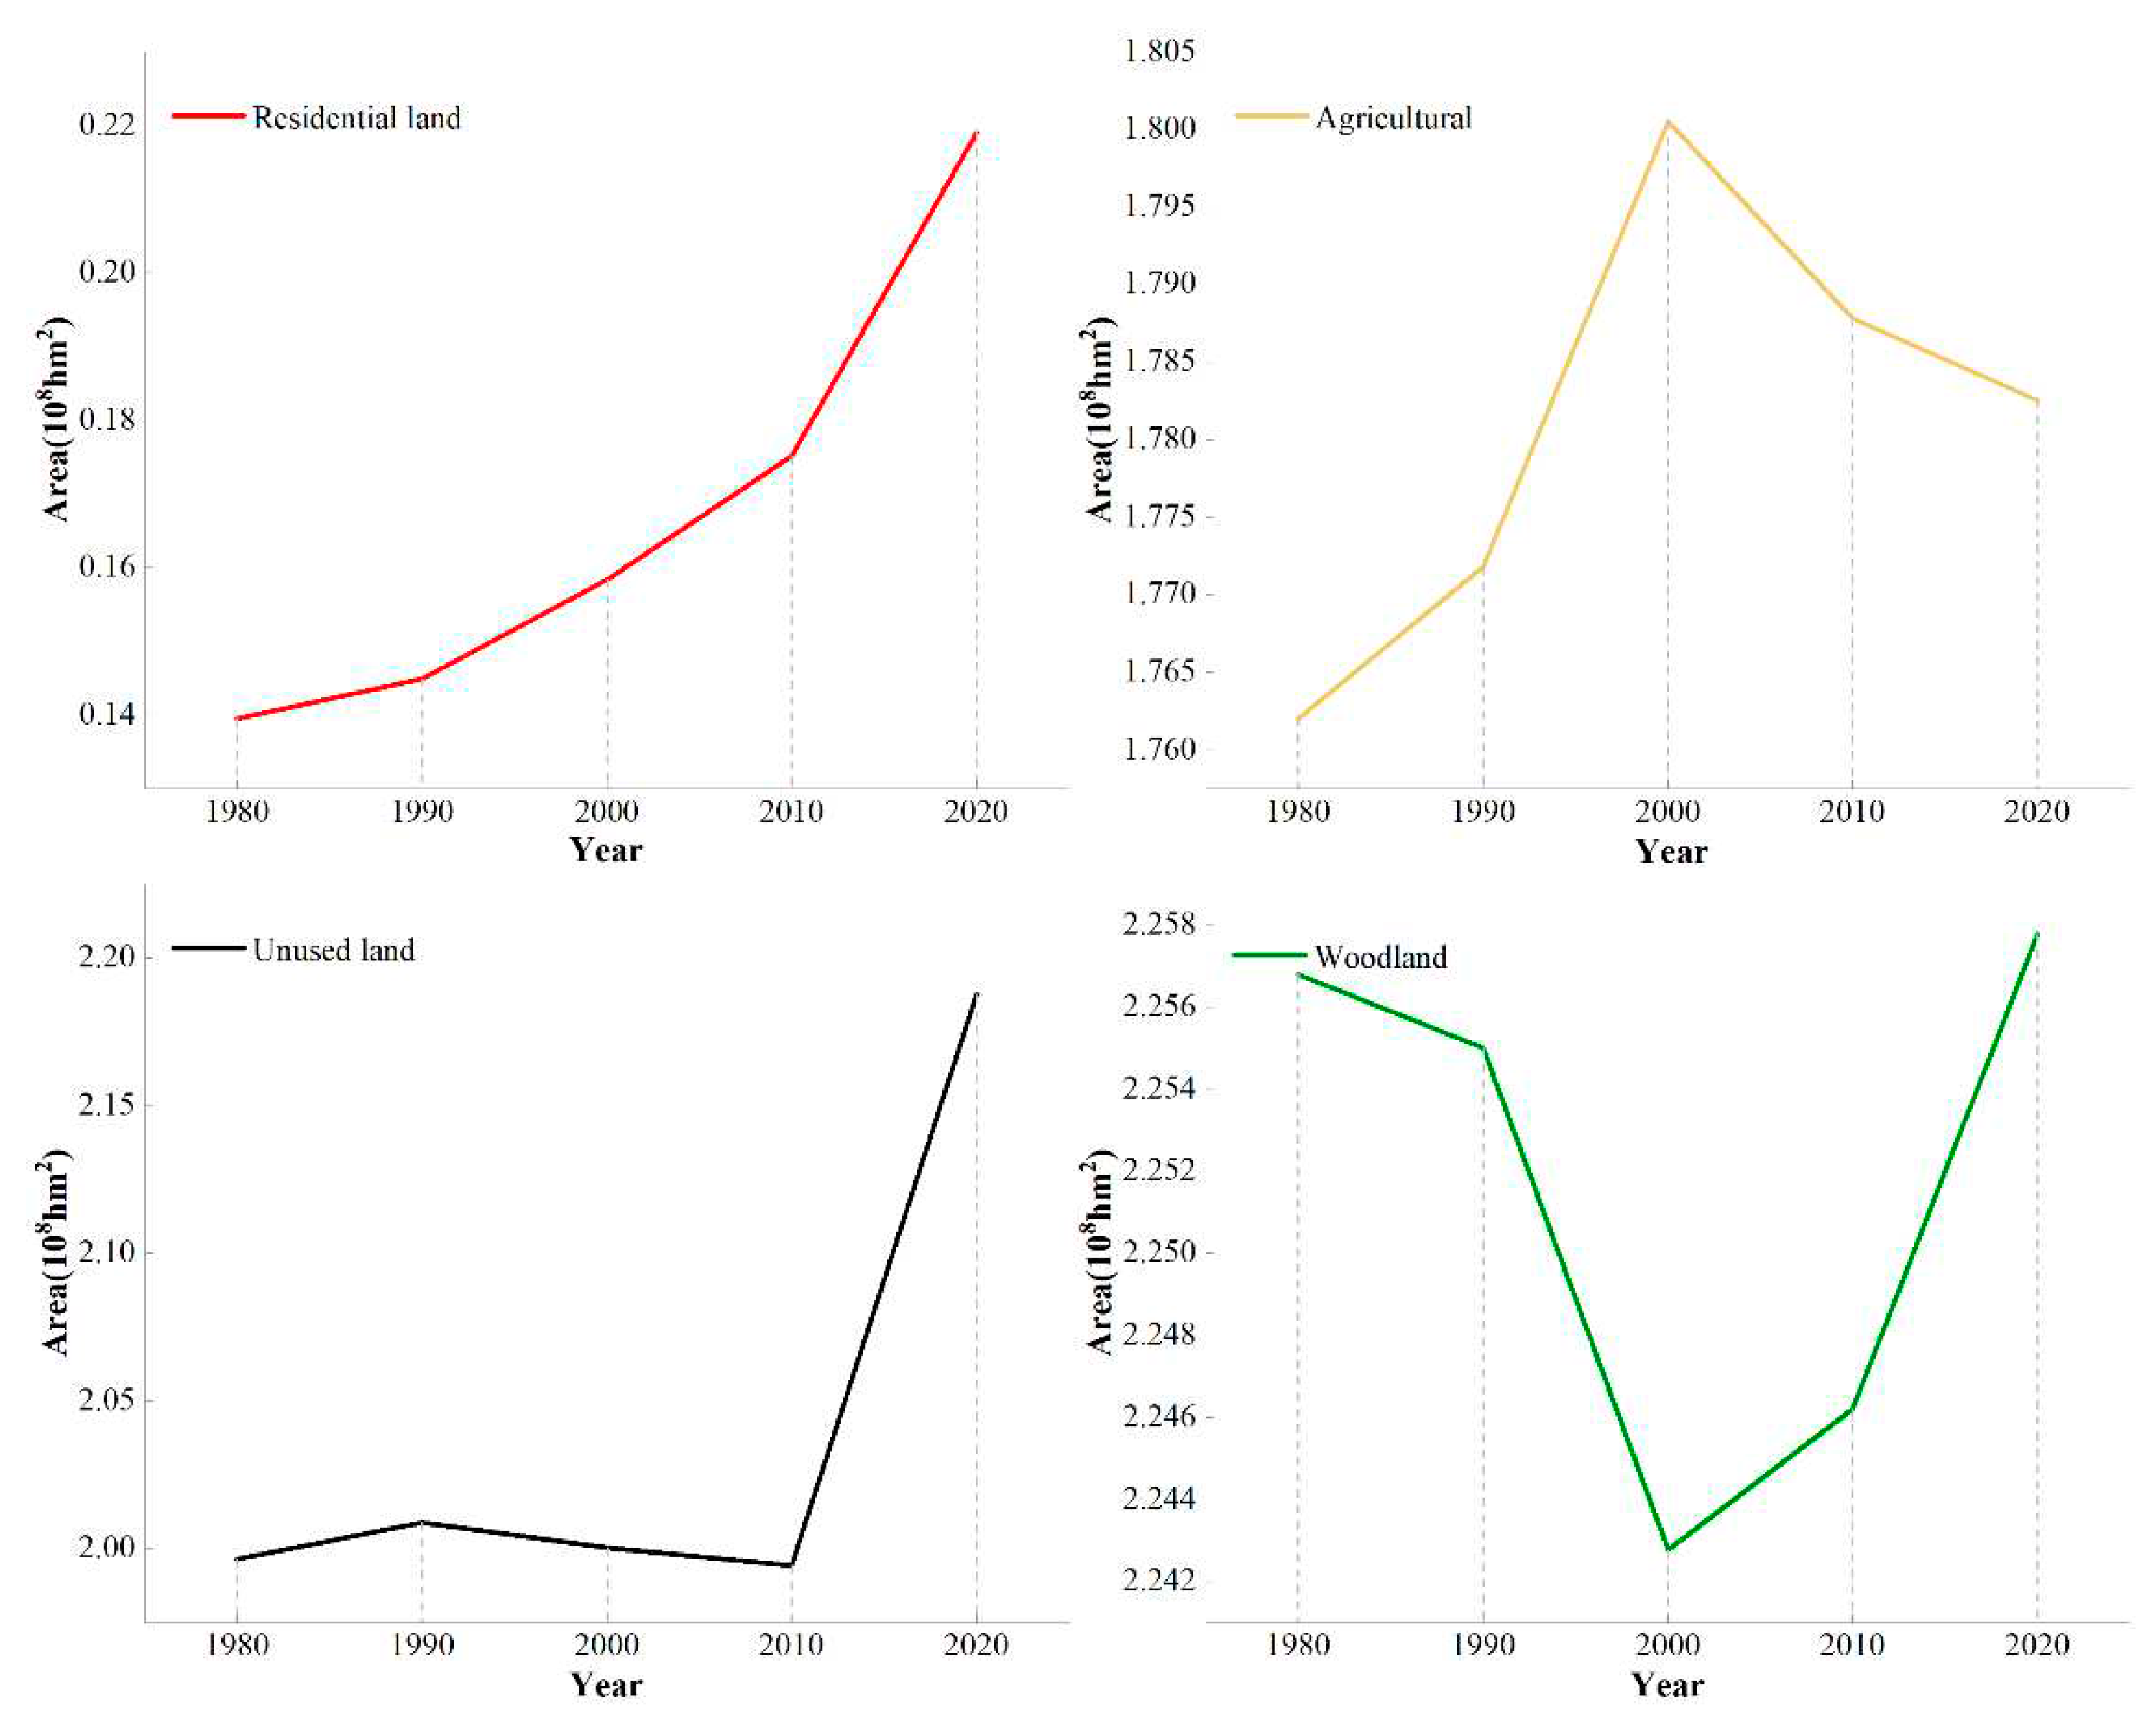
29], we conducted a long time-series analysis of land use change from 1980 to 2020 (
Figure 7). The analysis focuses on four land types, The reasons for selecting the corresponding land type are indicated in parentheses. Including Agricultural (the household structure of rural residents directly affects the amount of Agricultural), Woodland (policies such as "returning farmland to the forest" affect changes in the area of Woodland and Agricultural), Unused land (changes in household structure may lead to an increase in the area of abandoned land) and Residential land (the area that may be occupied by urban land is considered to include only urban land and rural settlements, excluding construction lands such as industrial, mining and transport) to facilitate understanding of the links between changes in land use and changes in household structure.
The area of each land type has changed over time, as shown in
Figure 7, with woodland remaining the largest and Residential land the smallest of the four land types. In 2020, the areas of Agricultural, woodland, Residential land, and unused land were 1.78*10
8 hm
2, 2.26*10
8 hm
2, 0.21*10
8 hm
2, and 2.19*10
8 hm
2, respectively. The area of unused land reached its maximum in 2020 and increased by 0.19*10
8 hm
2 compared with 1980. Agricultural showed an increase and then a decrease in area, reaching a maximum of 1.80*10
8 hm
2 in 2000. woodland showed a decrease and then an increase, reaching a minimum of 2.24*10
8 hm
2 in 2020. Residential land showed a trend of year-on-year increase, and urban residential land's area differed from rural land's. The area of urban land is different from that of rural land.
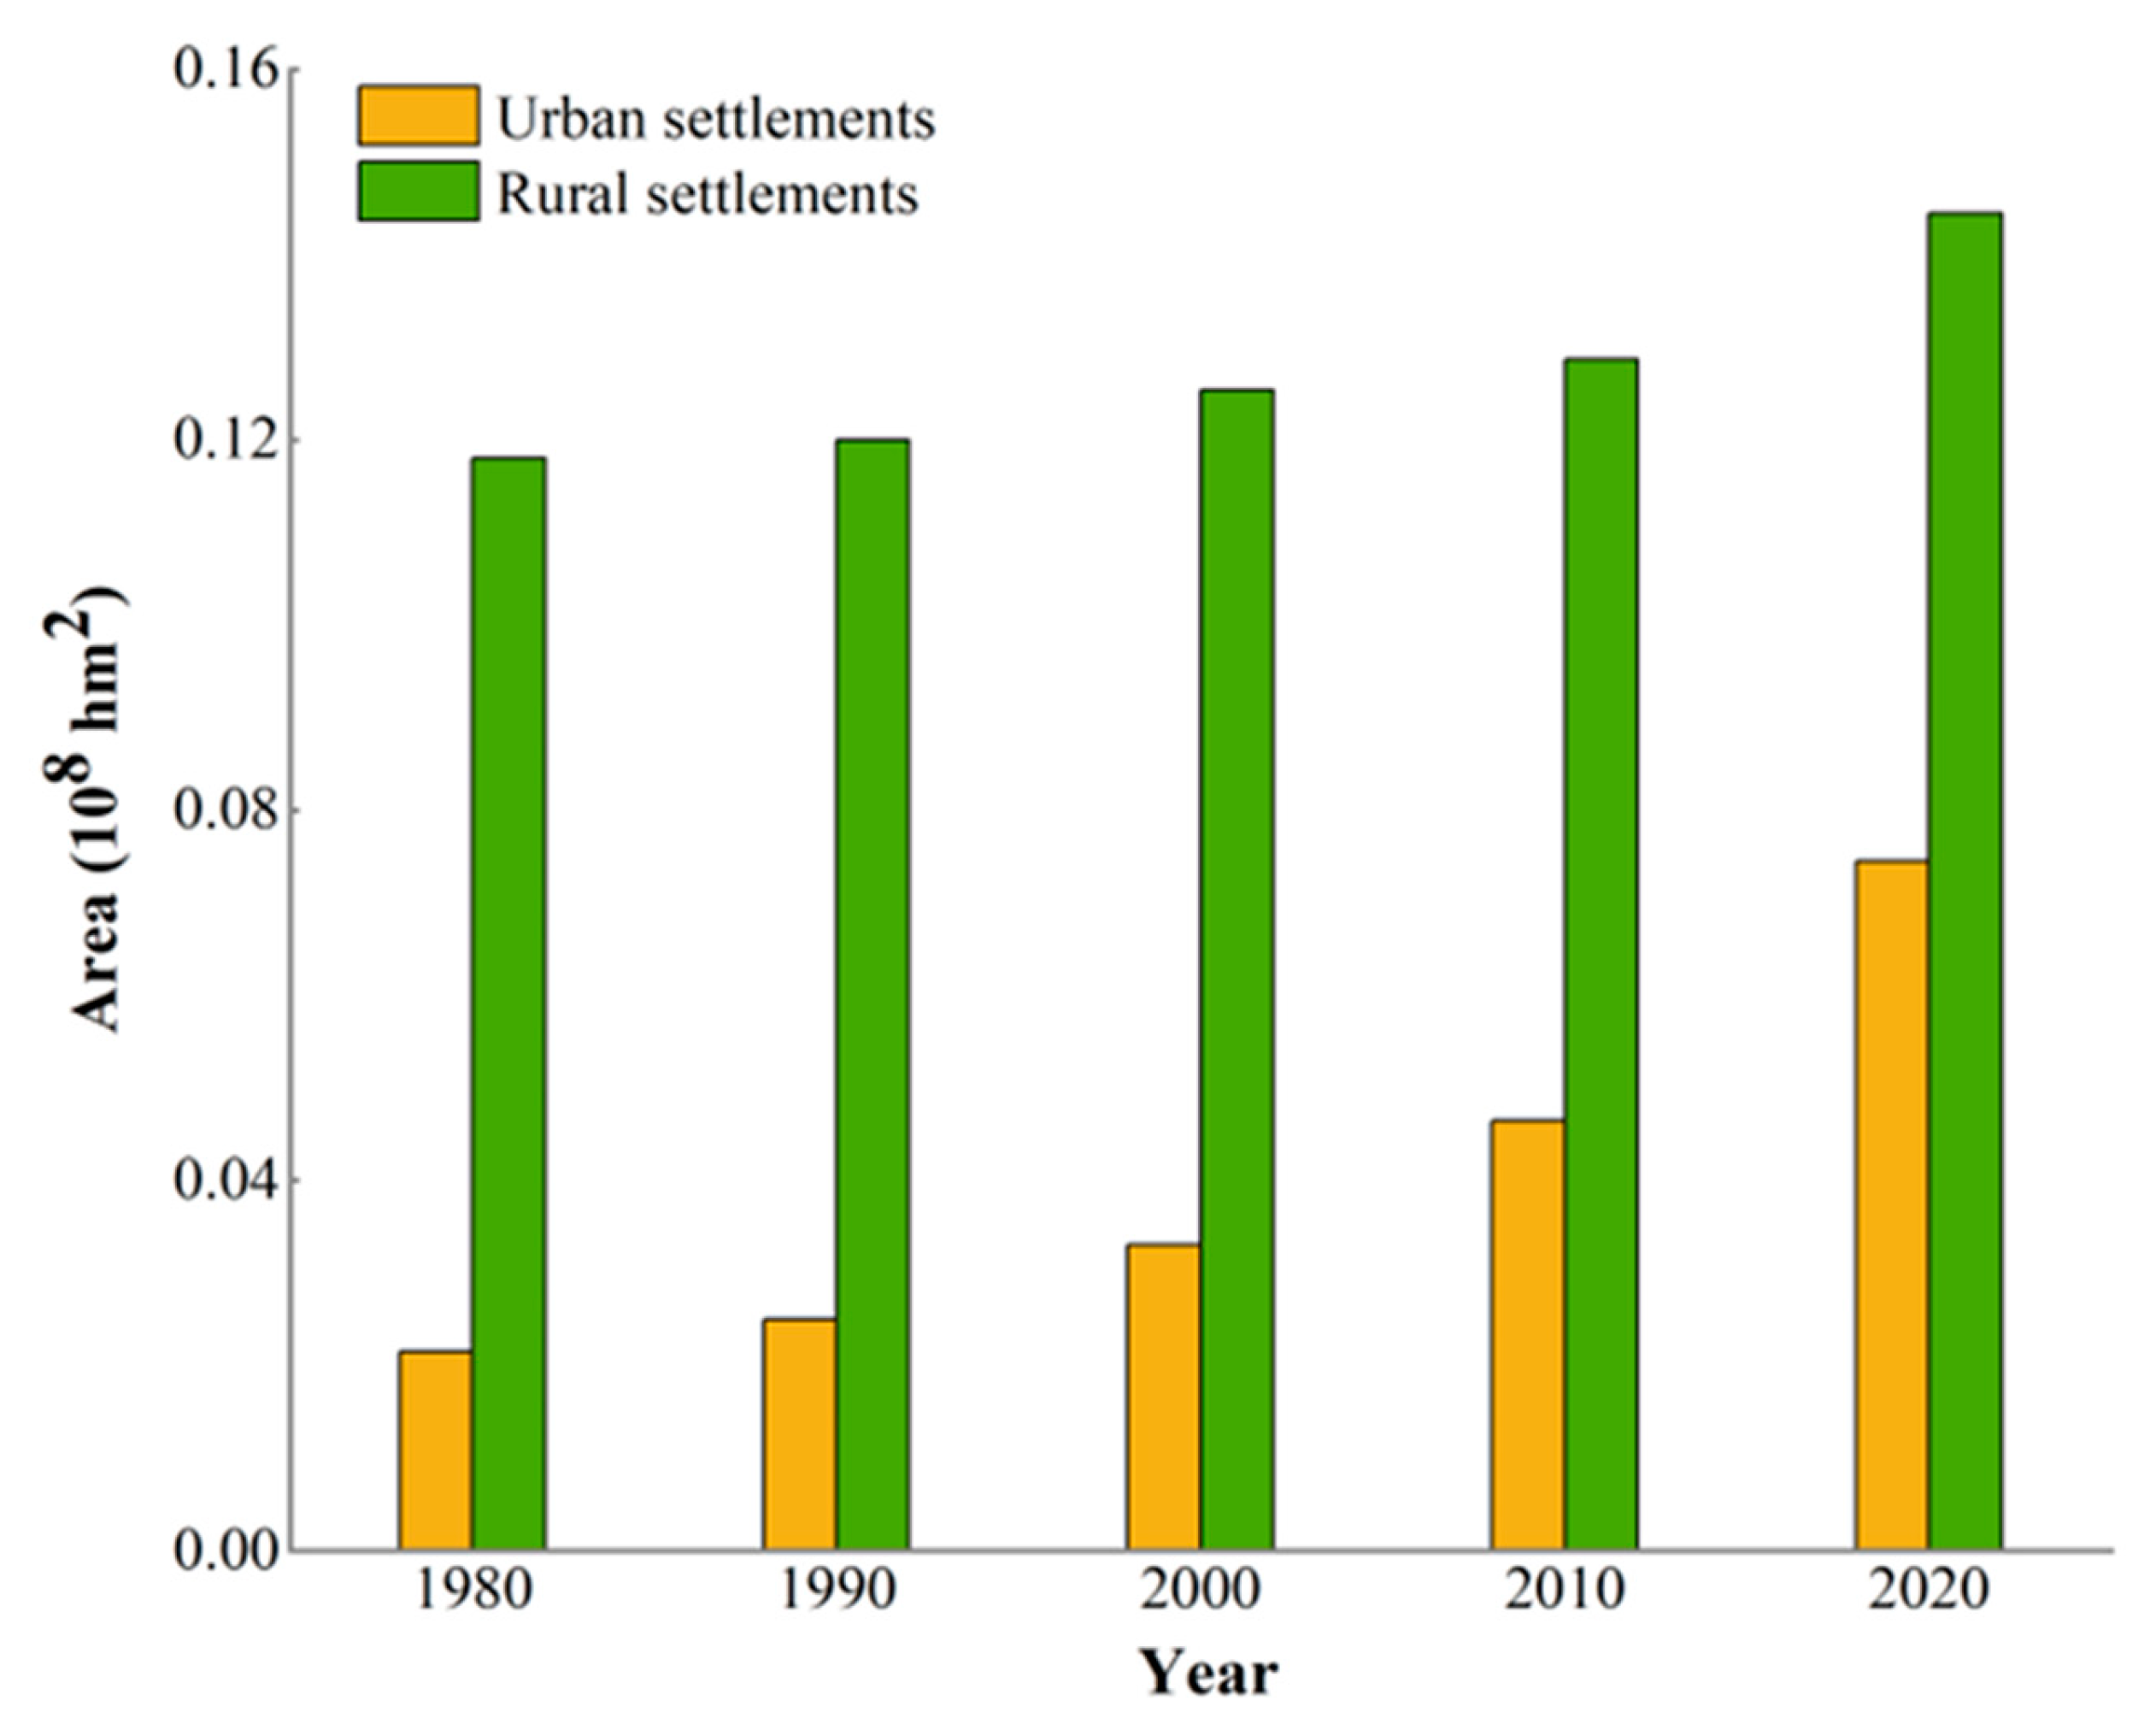
It shows the change in urban land and rural settlements, with urban settlements being smaller than rural settlements (
Figure 8). In 1980, China's urban settlements were 0.02*10
8 hm
2, and rural settlements were 0.12*10
8 hm
2. By 2020, urban land increased to 0.07*10
8 hm
2, an increase of 250% compared to 1980. This result is closely related to rapid urbanization and population movement, with rapid urban development and more and more people moving to cities, increasing urban construction land.
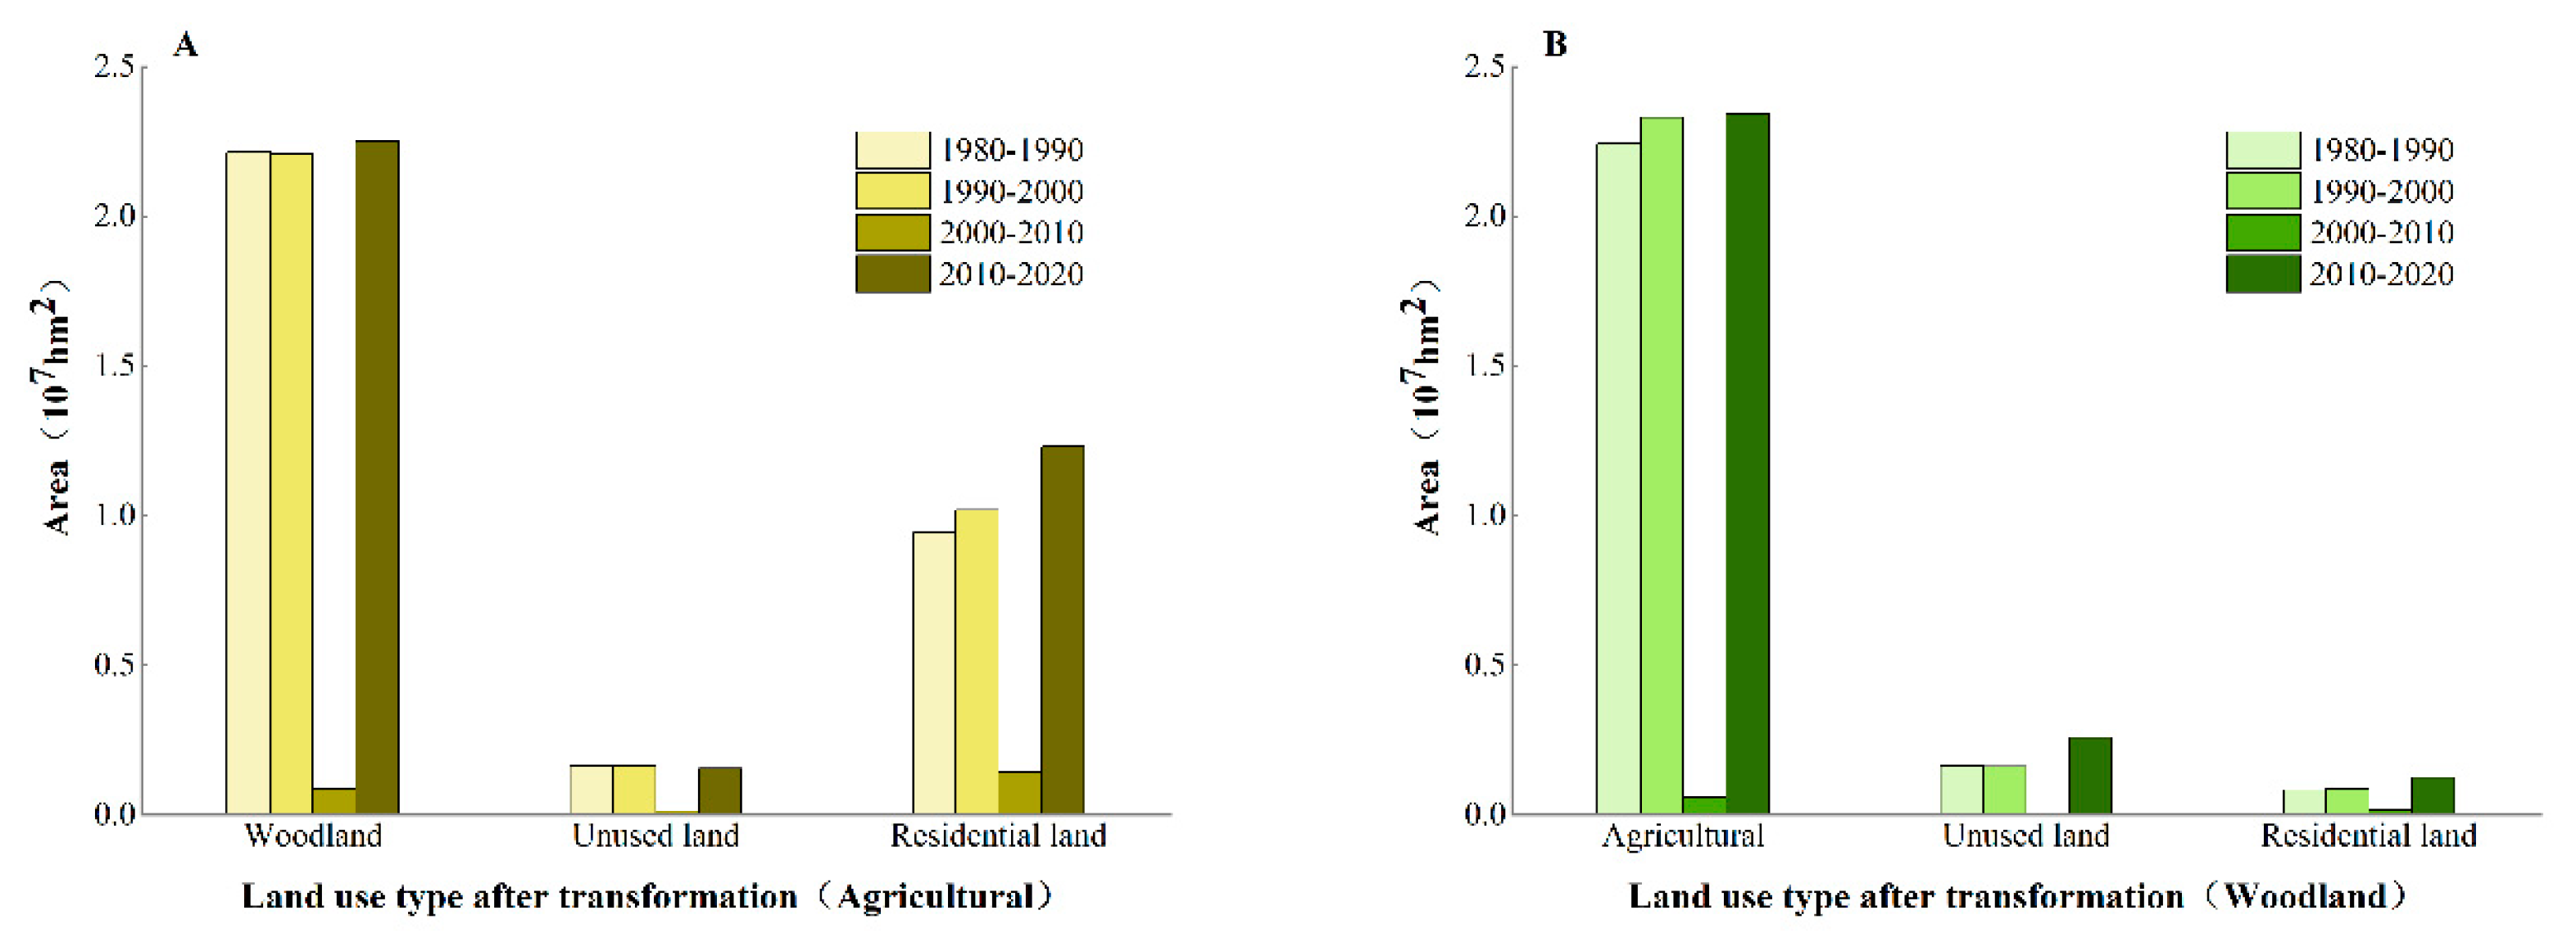
The transformation between land types is analyzed by counting the changes between agricultural and woodland, and the area converted to Unused land and Residential land in different periods, reflecting the results of various influencing factors (
Figure 9). The results indicate that between 2010 and 2020, the most agricultural and woodland land was changed to other land use types, while between 2000 and 2010, the least agricultural and woodland land was converted. In addition, agricultural land was mainly converted to woodland, with an area greater than 2.20*10
8 hm
2 in all periods except the 2000-2010 period. The area of agricultural land occupied as urban land was more than 0.94*10
8 hm
2, and the area converted to unused land was greater than 0.15*10
8 hm
2. The area of woodland converted to unused land was greater than 0.16*10
8 hm
2, and the area converted from 2010 to 2020 amounted to 0.26*10
8 hm
2, and the area occupied for the construction of Residential land was 0.12*10
8 hm
2.
4. Discussion
4.1. demographic transition and household dynamics
This paper used long time-series demographic data in China to understand the dynamics of household numbers, size, and driving factors. Throughout human history, family, once a dense cluster of many siblings and extended kin, would separate into ever smaller and more fragile forms [
30]. The number of nuclear families has increased while the number of extended families has significantly decreased. Nowadays, families become diversified and new forms of families such as single-parent and dink families (double income without any kid). Corresponding to the demographic transition that happened in developed countries, China’s household dynamics are following the same path, along with urbanization and rural outmigration, the household number is increasing while the size is decreasing. However, the change in household size is much faster than that in developed countries like the U.S. and the U.K. In the U.S., The household size decreased from 3.33 people per household in 1960 to 2.53 in 2020, with a 24.02% decrease in the past half-dozen-decade years [
31]. In the U.K., the mean household size in 1901 was 4.62, and it decreased to 2.4 in 2020, with a 48.05% decrease in 120 years [
32]. In China, the household size decreased from 4.65 in 1979 to 2.62 in 2020, a 43.66% decrease in 40 years.
Many demographic factors affected the changes in household size and number. The decreasing birthrate has a positive relationship with household size, especially because of China's one-child policy, which started in 1980 and ended in 2015. Urbanization causes large-scale rural-to-urban migration, further resulting in a household size decline. Besides, aspiration for nuclear family and independence, the increasing aging population and divorce rate also contribute to household size decline. The divorce rate can reflect the changes in household size, however, it is more complex as the divorced couple may marry again later. The effect of urbanization rate on household size is nonlinear, for example, provinces like Heilongjiang and Liaoning have household sizes of 2.22 and 2.29, smaller than Shanghai which is 2.32, however, their urbanization rate is much lower than Shanghai. The urbanization rate in Heilongjiang and Liaoning is 65.61% and 72.14% in 2020, compared to 89.30% in Shanghai in the same year. On the national scale, the urbanization rate also follows the same trend, the household size in the U.S., U.K., and China are 2.53, 2.4, and 2.62, but the urbanization rate is 82.66%, 83.90%, and 63.89% in 2020.
The change in family planning policy in China affects the household size, however, the significance still needs to be observed. Even after the one-child policy was changed in 2015, the birth rate declined and reached 8.52‰ in 2020, the lowest since 1978. Furthermore, with Chinese society becoming an aging population structure, household size may also be affected, so the long-term trend of household size needs to be considered.
4.2. Impact of household dynamics on land use change in China
Changing household numbers and sizes have significant impacts on the environment [
5,
9], however, how the household dynamics affect land use is only explored at a local scale [
33] have examined the effects of increasing family size on the expansion of land under cultivation and intensification, but research on decreasing household size on rural and urban land use was scarce. Lambin and others (2008) found that declining household size will increase the demand for more housing units, and typically these units will spread horizontally across the landscape, contributing to urban sprawl [
34]. Considering this, the households (H) instead of individuals should be recognized as the consuming unit of land (i.e., I= HAT instead of I= PAT), as MacKellar and colleagues proposed, where environmental impact (I) is seen as the product of factors: population (P); household (H); affluence (A); and technological efficiency (T) [
35]. This paper is the first attempt to understand the relationship between household dynamics and land-use change at the national scale, not only for urban areas but also for rural areas.
Urbanization, rural-to-urban migration, and decreasing household size have contributed to increasing housing units in urban areas in China. However, even with the decreasing population in rural areas, the housing area, or its total settlement areas is continually increasing in China. Benefits from the household registration system in China, many people still keep their houses and cultivated land in rural areas, even enlarging the houses to ensure they have places to live when they are too old to find jobs in the cities. This has created many hollowed villages in China, with many properties being abandoned throughout the settlement [
24,
36].
The per capita housing area has largely increased with the rising affluence associated with economic development and the transition from agricultural to urban-industrial societies. In the past four decades, per capita, urban and rural housing area has increased from 7.2 m
2 and 9.4 m
2 in 1980 to 36.52 m
2 and 51.03 m
2 in 2020, respectively. Besides, with the rising affluence, people also tend to have multiple homes in different locations. According to a report published in 2020, the average housing unit per household is 1.5 [
37]. Data shows that 96.0% of households in urban areas have houses. About 58.4% of households only have one suit of the house, while 31.0% of households have two suits of house, and 10.5% have three or more suits of house.
The effects of household dynamics on rural cultivated land and ecological land are complex. Increasing household numbers and decreasing household size will result in fragmentation of cultivated land if rural outmigration is limited. However, as more younger people moved to cities for off-farm jobs, some of the cultivated lands were abandoned, or transferred to others for large-scale operations. The outmigration in remote rural areas or mountainous areas caused many villages to be abandoned, not only the cultivated land but also the whole settlement. The rural villages decreased from 37.73 million to 23.63 million in 40 years, with more than 80 villages diminishing each day. From a land-use perspective, the increasing household number and decreasing household size will reduce cultivated land, increase urban and rural housing areas, and result in land abandonment and low-efficiency land use. More housing area usually leads to more demand for building materials, which also translates into less efficient use of various resources [
33]and an increase in CO
2 emission and waste generation [
38]. Policies should encourage people to live in extended families.
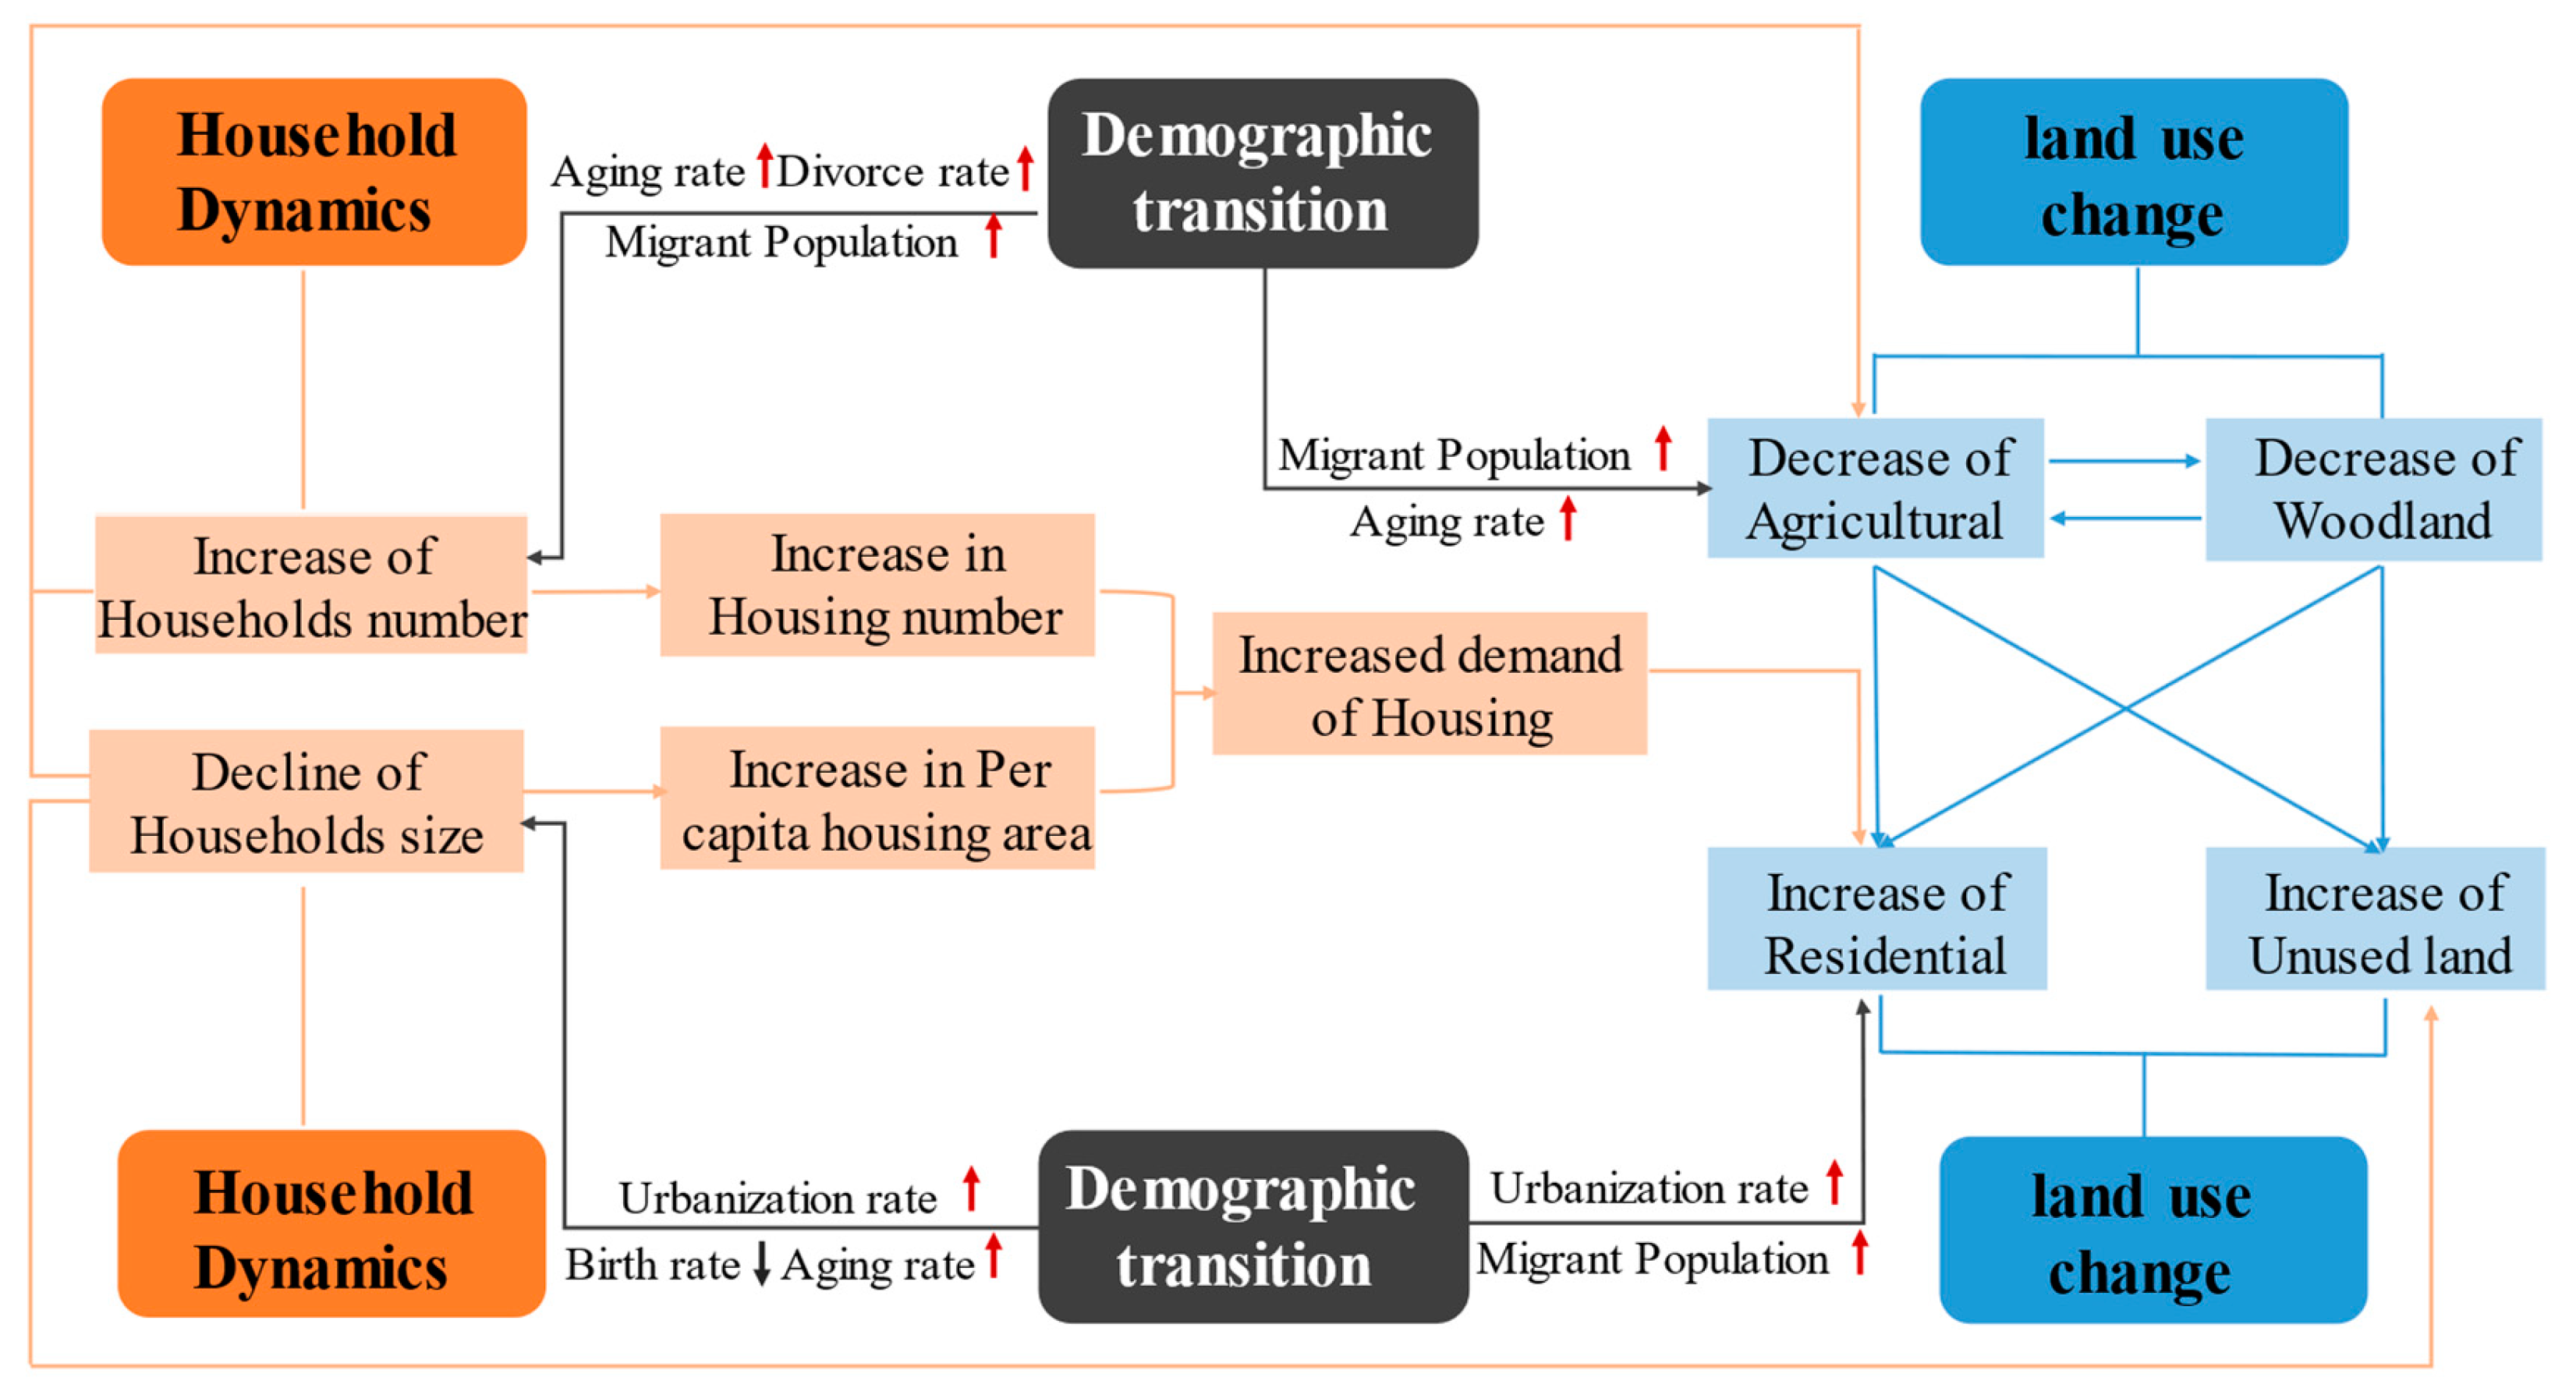
While family structure affects land use change, Land-use policies can also influence the household structure (
Figure 10). For instance, the national policy of "returning farmland to the forest” or the “grain for green” policy, has returned sloping lands to forest land for restoration with some incentives, which reduced the cultivated land and encouraged the rural people to move to cities as migrant workers. This further promoted population mobility, and facilitated the change in household dynamics.
The data in this paper is mostly from national statistics, these data can help to understand the trend of household dynamics, and also the relationship with land-use change, however, spatially explicit data are not consistent. Subsequent research can combine remote sensing and statistical data to explore the effects further. Meta-analysis can also be used to integrate the case studies to understand the relationship comprehensively.
5. Conclusions
This paper examines the long time-series changing household number and sizes, and their impacts on land use change in China. It attempts to understand the complex relationship and helps to address the challenges. Data from statistical yearbooks over the past 40 years shows that household numbers are rapidly increasing, and the size of households is gradually declining. The driving forces of household dynamics are diverse and complex, including decreasing birth rates, increasing migration, rising divorce rates, and aging populations. The relationship between urbanization and household size is nonlinear. Although the decline in household size is a global phenomenon, the speed in China is much more rapid because of certain policies, such as the one-child policy and the green for grain policy.
The change in household number and size has a large impact on land-use change. The declining household size and rising affluence will increase the demand for more housing units, contributing to urban sprawl and rural settlement sprawl. In this regard, decreasing household size will result in the loss of fertile cultivated land in the suburbs and the countryside. Besides, outmigration of the rural population also leads to village hollowing and cultivated land abandonment, which reduces land-use efficiency. The impacts of household dynamics on land-use change should be considered in future policymaking.
Author Contributions
Conceptualization, Yaxue Luo and Ruishan Chen; formal analysis, Yaxue Luo; investigation, Yaxue Luo; resources, Ruishan Chen; data curation, Yaxue Luo; writing—original draft prepara-tion, Yaxue Luo and Ruishan Chen; writing—review and editing, Bo Xiong. Nan Jia. Xiaona Guo. Chenglong Yin; visualization, Yaxue Luo and Wen Song; project administration, Ruishan Chen; funding acquisition, Ruishan Chen; All authors have read and agreed to the published version of the manuscript.
Funding
This study was conducted with the support of the National Social Science Fund of China [grant number 20ZDA085], the National Natural Science Foundation of China [grant number 41771119], the Research Fund of the Geological Mineral Resources and Environmental Exploration Program [DD20190427], China Postdoctoral Science Foundation: 2022M722055 & 2022TQ0205 and funding from Shanghai Jiao Tong University.
Data Availability Statement
The data supporting the results of this study can be obtained on public websites, The CNLUCC is available at
http://www.resdc.cn/.
Conflicts of Interest
The authors declare no conflict of interest.
References
- Bilsborrow, R.E.; Okoth-Ogendo, H.W.O. Population-Driven Changes in Land Use in Developing Countries. Ambio. Stockholm 1992, 21, 37–45.
- National Research Council Population, Land Use, and Environment: Research Directions; National Academies Press, 2005.
- Malthus, T.R.; Winch, D.; James, P. An Essay on the Principle of Population; Cambridge texts in the history of political thought; Cambridge University Press: Cambridge [England]; New York, NY, USA, 1992; ISBN 978-0-521-41954-3.
- Ehrlich, P.R. The Population Bomb; Ballantine Books, 1978.
- Liu, J.G.; Daily, G.C.; Ehrlich, P.R.; Luck, G.W. Effects of Household Dynamics on Resource Consumption and Biodiversity. Nature 2003, 421, 530–533. [CrossRef]
- Meyer, W.B.; Turner, B.L. Human Population Growth and Global Land-Use/Cover Change. Annual Review of Ecology and Systematics 1992, 23, 39–61. [CrossRef]
- Saka, A. Population Growth and Carbon Dioxide Emission: An Investigation of the Africa Perspective. East Asian Journal of Business Economics (EAJBE) 2014, 2, 1–8. [CrossRef]
- Li, A.; Liu, J.G.; Ouyang, Z.Y.; Linderman, M.; Zhou, S.Q.; Zhang, H.M. Simulating Demographic and Socioeconomic Processes on Household Level and Implications for Giant Panda Habitats. Ecological Modelling 2001, 140, 31–49. [CrossRef]
- Bradbury, M.; Peterson, M.N.; Liu, J.G. Long-Term Dynamics of Household Size and Their Environmental Implications. Popul Environ 2014, 36, 73–84. [CrossRef]
- Ellsworth-Krebs, K. Implications of Declining Household Sizes and Expectations of Home Comfort for Domestic Energy Demand. Nat Energy 2019, 5, 20–25. [CrossRef]
- Götmark, F.; Cafaro, P.; O’Sullivan, J. Aging Human Populations: Good for Us, Good for the Earth. Trends in Ecology & Evolution 2018, 33, 851–862. [CrossRef]
- Yu, E.; Liu, J.G. Environmental Impacts of Divorce. Proceedings of the National Academy of Sciences 2007, 104, 20629–20634. [CrossRef]
- Pejchar, L.; Reed, S.E.; Bixler, P.; Ex, L.; Mockrin, M.H. Consequences of Residential Development for Biodiversity and Human Well-Being. Frontiers in Ecology and the Environment 2015, 13, 146–153. [CrossRef]
- Seto, K.C.; Güneralp, B.; Hutyra, L.R. Global Forecasts of Urban Expansion to 2030 and Direct Impacts on Biodiversity and Carbon Pools. Proc. Natl. Acad. Sci. U.S.A. 2012, 109, 16083–16088. [CrossRef]
- Romero-Lankao, P.; Gurney, K.R.; Seto, K.C.; Chester, M.; Duren, R.M.; Hughes, S.; Hutyra, L.R.; Marcotullio, P.; Baker, L.; Grimm, N.B.; et al. A Critical Knowledge Pathway to Low-carbon, Sustainable Futures: Integrated Understanding of Urbanization, Urban Areas, and Carbon. Earth’s Future 2014, 2, 515–532. [CrossRef]
- Underwood, A.; Zahran, S. The Carbon Implications of Declining Household Scale Economies. Ecological Economics 2015, 116, 182–190. [CrossRef]
- Radeloff, V.C.; Stewart, S.I.; Hawbaker, T.J.; Gimmi, U.; Pidgeon, A.M.; Flather, C.H.; Hammer, R.B.; Helmers, D.P. Housing Growth in and near United States Protected Areas Limits Their Conservation Value. Proc. Natl. Acad. Sci. U.S.A. 2010, 107, 940–945. [CrossRef]
- Kramer, D.B.; Urquhart, G.; Schmitt, K. Globalization and the Connection of Remote Communities: A Review of Household Effects and Their Biodiversity Implications. Ecological Economics 2009, 68, 2897–2909. [CrossRef]
- Mockrin, M.H.; Reed, S.E.; Pejchar, L.; Jessica, S. Balancing Housing Growth and Land Conservation: Conservation Development Preserves Private Lands near Protected Areas. Landscape and Urban Planning 2017, 157, 598–607. [CrossRef]
- Castro-Prieto, J.; Martinuzzi, S.; Radeloff, V.C.; Helmers, D.P.; Quiñones, M.; Gould, W.A. Declining Human Population but Increasing Residential Development around Protected Areas in Puerto Rico. Biological Conservation 2017, 209, 473–481. [CrossRef]
- Long, H.L.; Li, Y.R.; Liu, Y.S.; Woods, M.; Zou, J. Accelerated Restructuring in Rural China Fueled by ‘Increasing vs. Decreasing Balance’ Land-Use Policy for Dealing with Hollowed Villages. Land Use Policy 2012, 29, 11–22. [CrossRef]
- Sun, H.; Liu, Y.S.; Xu, K.S. Hollow Villages and Rural Restructuring in Major Rural Regions of China: A Case Study of Yucheng City, Shandong Province. Chin. Geogr. Sci. 2011, 21, 354–363. [CrossRef]
- Li, Y.R.; Liu, Y.S.; Long, H.L. Spatio-Temporal Analysis of Population and Residential Land Change in Rural China. Journal of Natural Resources 2010, 10, 1629–1638.
- Long, H.L.; Li, T.T. The Coupling Characteristics and Mechanism of Farmland and Rural Housing Land Transition in China. J. Geogr. Sci. 2012, 22, 548–562. [CrossRef]
- Census Office of the State Council. 2010 Population Census Of China; China Statistical Publishing House, 2012.
- Wang, Y.S. An Analysis of Changes in the Chinese Family Structure between Urban and Rural Areas: On the Basis of the 2010 National Census Data. Social Sciences in China 2014, 35, 100–116. [CrossRef]
- Cui, Z.W. Population Change and People’s Livelihood; China Population Publishing House, 2012.
- Bren d’Amour, C.; Reitsma, F.; Baiocchi, G.; Barthel, S.; Güneralp, B.; Erb, K.-H.; Haberl, H.; Creutzig, F.; Seto, K.C. Future Urban Land Expansion and Implications for Global Croplands. Proc. Natl. Acad. Sci. U.S.A. 2017, 114, 8939–8944. [CrossRef]
- Xu, X.; Liu, J.; Zhang, S.; Li, R.; Yan, C.; Wu, S. China’s Multi-Period Land Use Land Cover Remote Sensing Monitoring Data Set (CNLUCC) 2018.
- Brooks, D. The Nuclear Family Was a Mistake. The Atlantic 2020, 325, 54–69.
- Blake, J. Ideal Family Size among White Americans: A Quarter of a Century’s Evidence. Demography 1966, 3, 154–173. [CrossRef]
- Laslett, P. Size and Structure of the Household in England over Three Centuries. A Journal of Demography 1969, 23, 199–223. [CrossRef]
- Rindfuss, R.R.; Turner, B.L.; Entwisle, B.; Walsh, S.J. Land Cover/Use and Population. Land Change Science: Observing, monitoring and understanding trajectories of change on the Earth’s surface 2004, 351–366. [CrossRef]
- Lambin, E.F.; Geist, H.J. Land-Use and Land-Cover Change:Local Processes and Global Impacts; Springer Science & Business Media, 2008.
- MacKellar, L.; Lutz, W.; Prinz, C.; Goujon, A. Population, Households, and CO2 Emissions. Population and Development Review 1995, 849–865, https://www.jstor.org/stable/2137777.
- Wang, D.G.; Zhu, Y.J.; Zhao, M.F.; Lv, Q.Y. Multi-Dimensional Hollowing Characteristics of Traditional Villages and Its Influence Mechanism Based on the Micro-Scale: A Case Study of Dongcun Village in Suzhou, China. Land Use Policy 2021, 101, 105146. [CrossRef]
- He, S. The Central Bank’s Survey Shows: Two Suites in 30% of Urban Households with Average Household Assets of 3.18 Million. China Economic Weekly 2020, 36–37.
- MacKellar, L.; W. Lutz; R.E. Munn; L. Wexler; Wexler; B. O’Neill; A. McMichael; A. Suhrkre Population and Global Warming. Book Manuscript. Laxenburg, Austria: International Institute for Applied Systems Analysis. 1996.
|
Disclaimer/Publisher’s Note: The statements, opinions and data contained in all publications are solely those of the individual author(s) and contributor(s) and not of MDPI and/or the editor(s). MDPI and/or the editor(s) disclaim responsibility for any injury to people or property resulting from any ideas, methods, instructions or products referred to in the content. |
© 2023 by the authors. Licensee MDPI, Basel, Switzerland. This article is an open access article distributed under the terms and conditions of the Creative Commons Attribution (CC BY) license (http://creativecommons.org/licenses/by/4.0/).
