Preprint
Article

Validation of an IoT System Using UHF RFID Technology for Goose Growth Monitoring

Altmetrics

Downloads

85

Views

21

Comments

0

A peer-reviewed article of this preprint also exists.

Submitted:

08 December 2023

Posted:

11 December 2023

You are already at the latest version

Alerts
Abstract
Regular weight measurement is important in fattening geese to assess their health status. Failure to gain weight may indicate a potential illness. Standard weight gain analysis involves direct contact with the animal, which can cause stress to the animal, resulting in overall negative impacts on animal welfare. The focus of this study was to design a smart solution for monitoring weight changes in the breeding of farm animals. The proposed IoT system with a weighing device equipped with RFID technology for animal registration aimed to minimise the negative aspects associated with measuring in contact with humans. The designed system aims to incorporate modern approaches in animal husbandry and utilise the acquired data for the potential development of breeding approaches for various animal breeds. The system consisted of three main components: a data acquisition system, a weighing system with RFID, and an environmental monitoring system. In this study, the RFID system accuracy for detecting geese in the weighing system environment was assessed. The entire system evaluation yielded a sensitivity of 93.87%, specificity of 99.94%, accuracy of 99.85%, and precision of 95.09%. Regression analysis revealed a good correlation between observed feeding and RFID registrations with a determination coefficient of R2 = 0.9813.
Keywords: 
Subject: Engineering  -   Other

1. Introduction

The goal of precision agriculture in livestock farming is to meet the needs of farmed animals and, consequently, satisfy the requirements of breeders, suppliers, and consumers [1]. Monitoring the condition and growth conditions of animals [2] offers the possibility to discover properties that would not be possible to ascertain through conventional breeding methods. Changes in animal behaviour can be utilised to identify their health and welfare. An accurate monitoring system allows for gathering information about individual animals and the social behaviour of individuals and the entire herd [3]. Systems focusing on online animal behaviour monitoring are often aimed at large livestock, especially cows and pigs [4,5,6]. However, research has also been conducted on small animals such as poultry [7,8,9]. Most of these studies are centred around hens and broilers, which are often housed indoors.
It is common for animals to experience stress during the measurement of certain physiological and qualitative parameters. Stress factors include manual animal handling, weighing the animal, or measuring the animal's temperature using manual probes. Automated monitoring of goose behaviour using non-invasive measurement methods, i.e., non-invasive sensors, improves the welfare of livestock [10], including both large livestock (e.g., dairy cows) and small ones (e.g., geese). These sensors can be used to measure various parameters of individual animals, including behavioural parameters.
Modern digital technologies enable intelligent automation of operations in poultry farming, leading to easier and cost-effective poultry production [8]. To ensure suitable conditions for efficient poultry production, [7]. To provide appropriate conditions for efficient poultry production, Lahlouh et al. In 2020 [7] developed a system with 97.00% accuracy for controlling hygrothermal parameters such as temperature, relative humidity, and contaminating gases. Proper monitoring of environmental parameters like temperature, humidity, ventilation, and the farming environment is essential to ensure optimal farming conditions. Additionally, controlling these parameters can lead to increased productivity and reduced energy consumption [11].
Various technologies have been developed for determining and monitoring the position and movement, including satellite systems [12], magnet-based systems, Inertial Navigation Systems (INS), and radio frequency-based systems [13]. However, many of these methods are not suitable for animal localisation, especially for small animals housed indoors. For instance, due to the external walls of buildings, the Global Positioning System (GPS) cannot localise indoor objects [14], INS may be susceptible to errors requiring sophisticated filtering techniques such as the Kalman filter [15] and highly precise magnetic technology is sensitive to conductive and ferromagnetic materials at low frequencies [16].
The introduction of modern technical systems with IoT has brought significant effects to crop cultivation and livestock farming [2]. The growing popularity of Internet of Things (IoT) technology in recent decades has led to the rapid development of systems based on radio frequencies. Among these systems suitable for indoor localisation is frequency modulation technology [17], ZigBee [18], Wi-Fi [19], Bluetooth [20], radio frequency identification (RFID) [9], and LoRa [21].
RFID technology is a useful means for creating predictive models for the health and well-being of animals, as well as for comparing the impact of different housing systems on animal behaviour [22]. For monitoring purposes, LF, HF, and UHF RFID technology can be used [22].
Using RFID technology, it is possible to monitor animal behaviour during feeding [23]. Brown-Brandl et al. in 2018 and Maselyne et al. in 2016 [5,24] found that the HF RFID system developed in their study could be used to measure the feeding patterns of growing pigs in a commercial or simulated commercial setting. Given that automatic RFID measurements provide reliable information about actual feeding patterns, they demonstrated that RFID systems have the potential to be used for future research purposes in animal monitoring.
The performance of a system utilising RFID technology can be verified through video recordings and image analysis. By comparing video recordings with RFID registrations, parameters indicating the system's performance can be determined. These parameters include sensitivity, specificity, accuracy, and precision [5,25,26]. In the HF RFID system presented by Maselyne et al. (2016) [5], the use of values per minute led to a sensitivity of 99.3%, specificity of 96.1%, and accuracy of 77.6%. In Adrion et al. (2018) [25], the average UHF RFID sensitivity was 49.7%, specificity was 99.0%, and accuracy was 97.9%. The highest achieved average sensitivity was 79.7%.
The aim of this article was to propose an IoT system that utilised non-invasive methods to monitor behavioural and physiological changes in geese. The cornerstone of the IoT system was the use of RFID technology. The main goal of the study was to validate the effectiveness of using UHF RFID technology within the IoT system, enabling the detection of weight changes in individual geese. Furthermore, environmental changes were monitored using a weather station to assess the impact of the environment on goose behaviour.

2. Materials and Methods

2.1. Animals and field of experiment
The study was conducted concurrently with the research by Krunt et al. (2022) [27]. The measurements were carried out from June to August 2021, specifically in Prague Horoměřice at GPS coordinates 50.1147819N, 14.2174647E. The length of the day was approximately 16 hours, and that of the night was 8 hours at this location. Moreover, the average temperatures were as follows: 17.9°C in June, 18.9°C in July, and 20.3°C in August. As part of the monitoring, we addressed the role of smaller animal breeding concerning their use in systems with multiple animals. Measurements commenced with goslings of domestic geese (Anser anser domesticus) at five weeks of age and concluded at 12 weeks of age. The measurements were conducted using a fully autonomous measuring and evaluation system, which monitored and alerted to anomalies during the growth of individual animals. In addition to regular one-week health checkups for the animals, the study aimed to monitor the animals without direct interaction.
Feeding was provided ad libitum through a pelleted diet containing 20% CP and 11.2 MJ/kg ME. Throughout the monitoring period, the geese had unrestricted access to water provided in the form of a water pond, which was part of the housing [27].
Measurements using the IoT system were conducted at two levels. The first and primary level focused solely on monitoring changes in physiological and behavioural parameters of geese using RFID technology, with the most important parameter being the monitoring of individual weight gain. At this level, observation of geese using a webcam is also possible to add. The second and secondary level monitored environmental changes using a weather station and sensors to monitor environmental parameters.
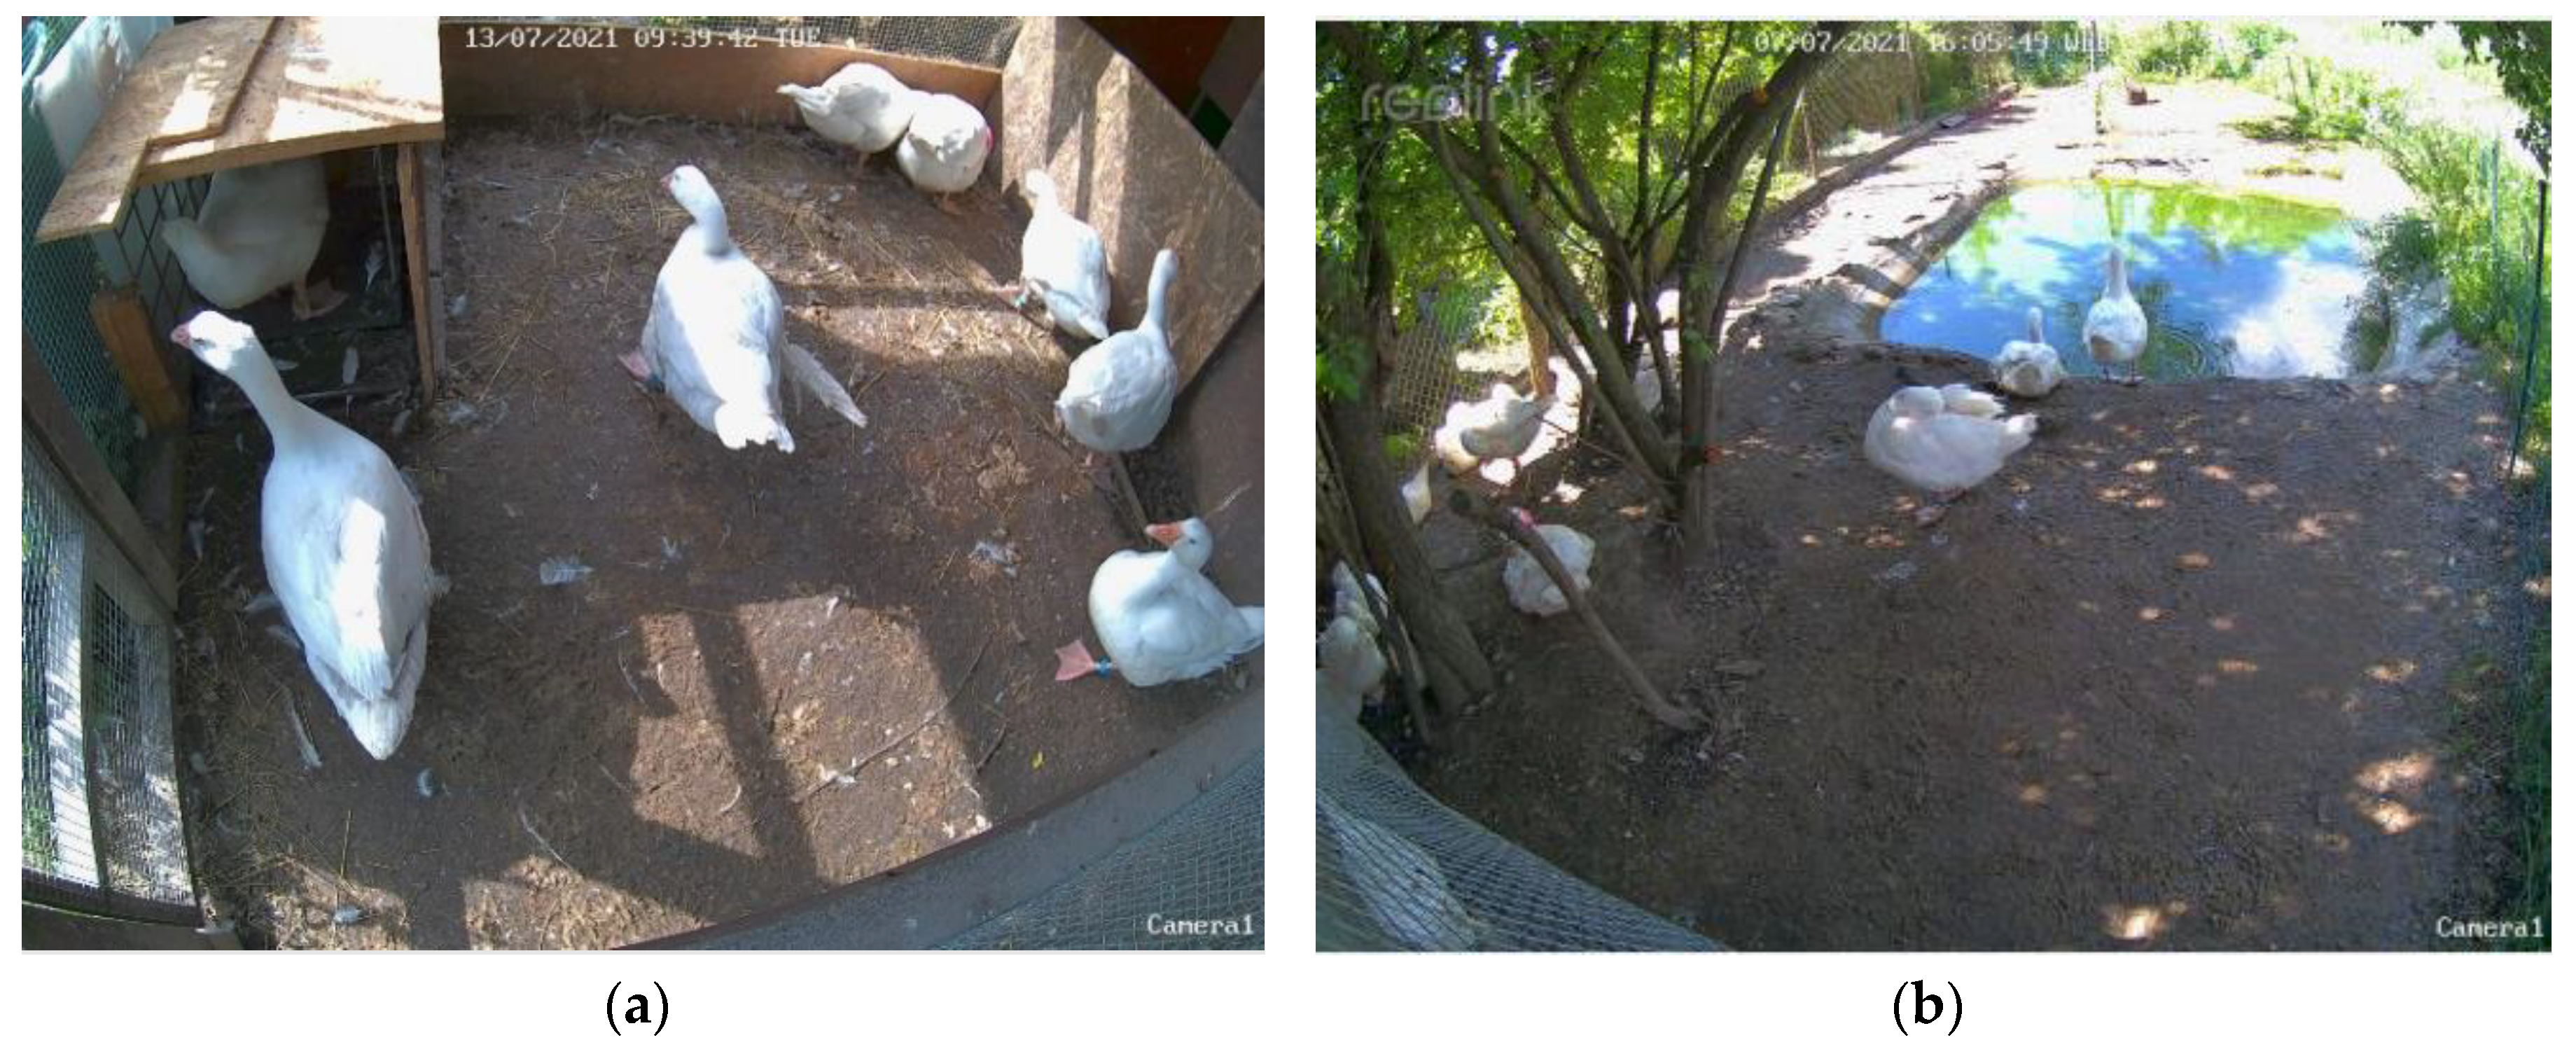
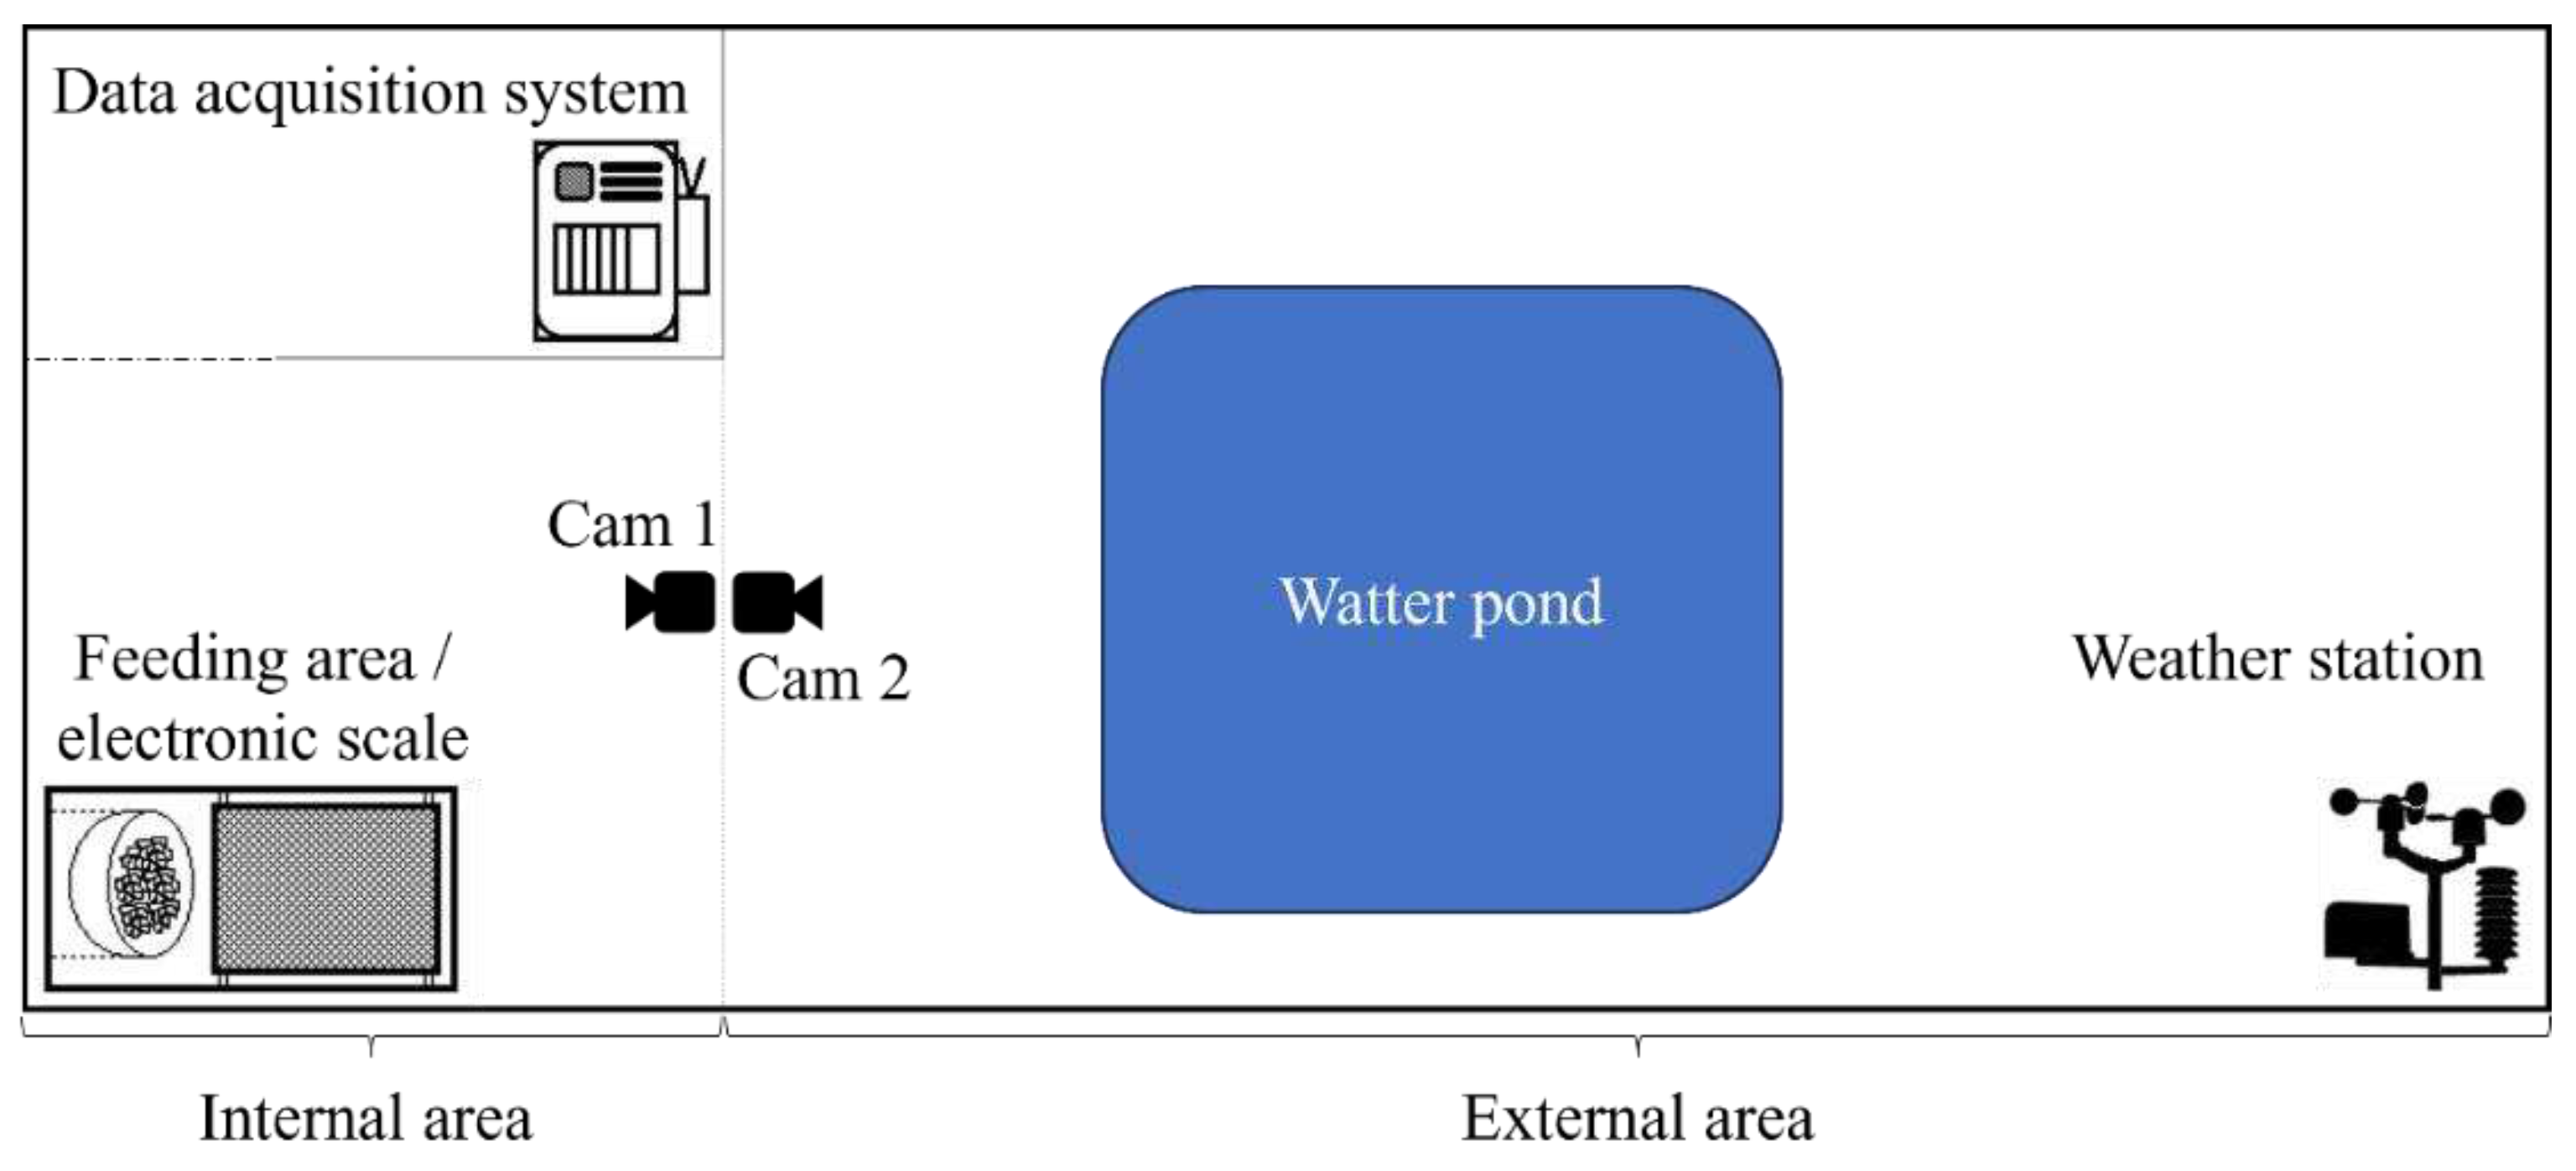
The monitoring of geese encompassed the entire lodge, with the lodge dimensions of 5 x 13 m. The block diagram illustrating the monitored area of goose movement is depicted in Figure 1. This image is complemented by a webcam view (Figure 2) of the outdoor goose enclosure (a) and the covered part of the enclosure (b). The locations of the webcams are outlined in the block diagram. The covered part of the enclosure is marked as the "Feeding area / electronic scale" in Figure 2 (a), and the camera location is denoted as "Cam 1". The outdoor enclosure is indicated in Figure 2 (b) as the area with the "Water pond and Weather Station," and the camera location is marked as "Cam 2".
Figure 1. Monitored goose movement area with main sections, apparent internal and external enclosures.
Preprints 92765 g001
Figure 1. (a) Camera view of the covered part of the enclosure; (b) Camera view of the outdoor area of the enclosure.
Preprints 92765 g002

2.2. Measurement system – hardware equipment

2.2.1. IoT system
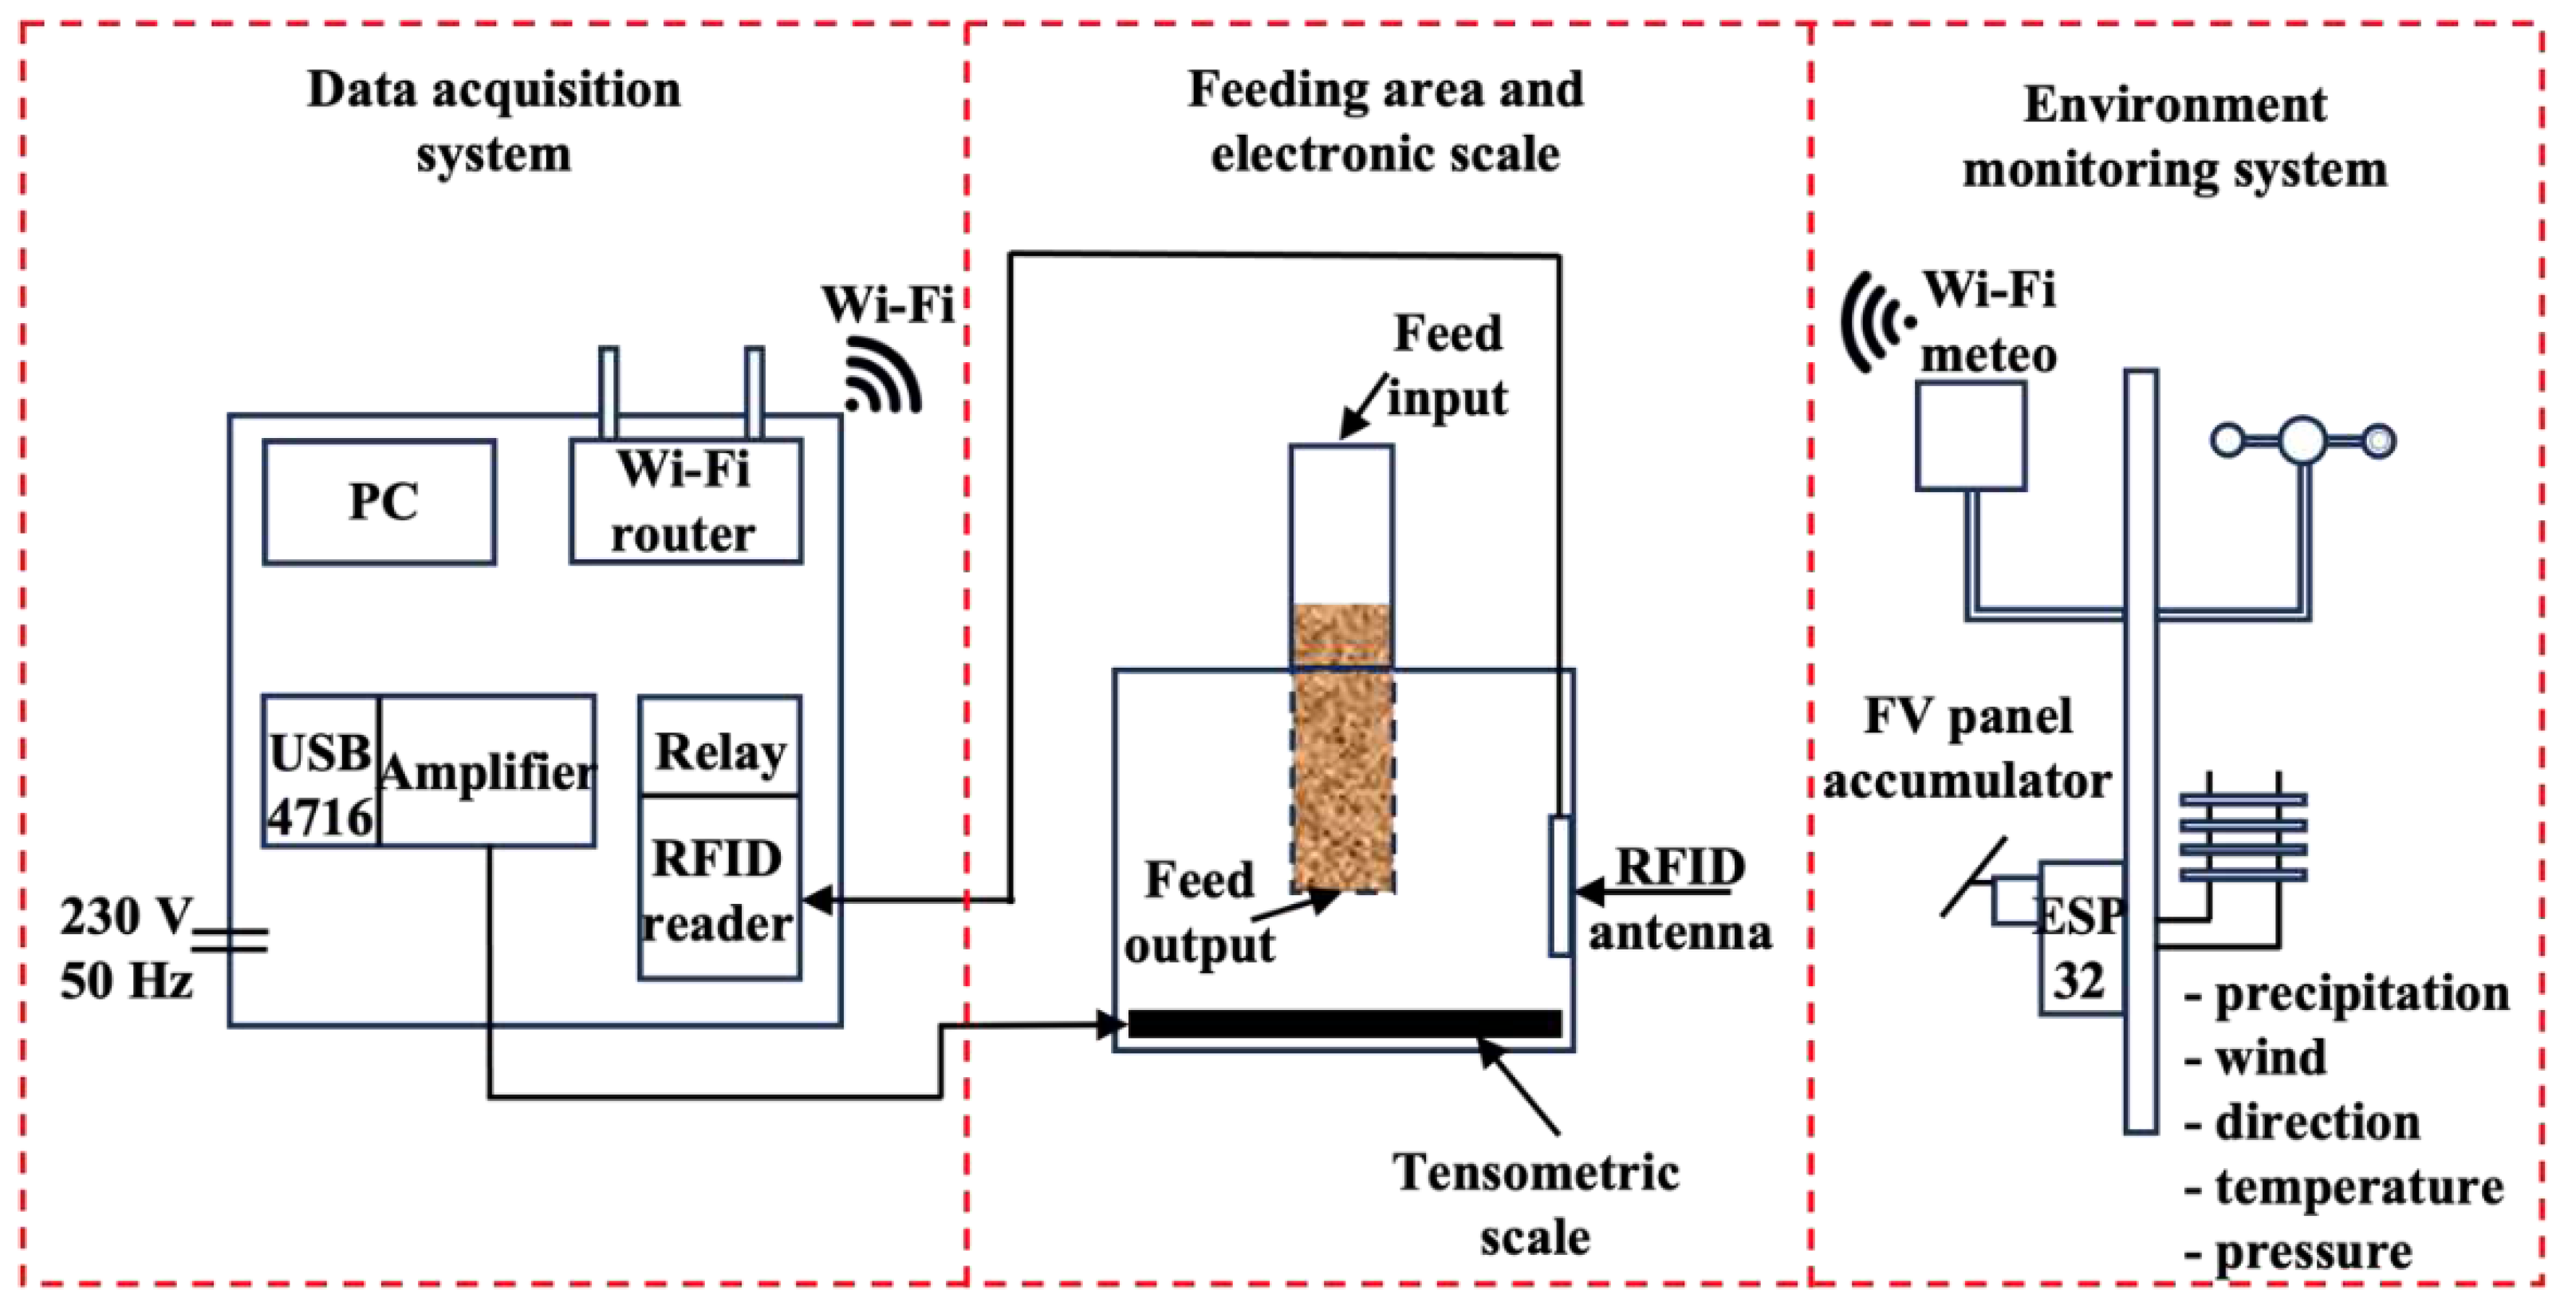
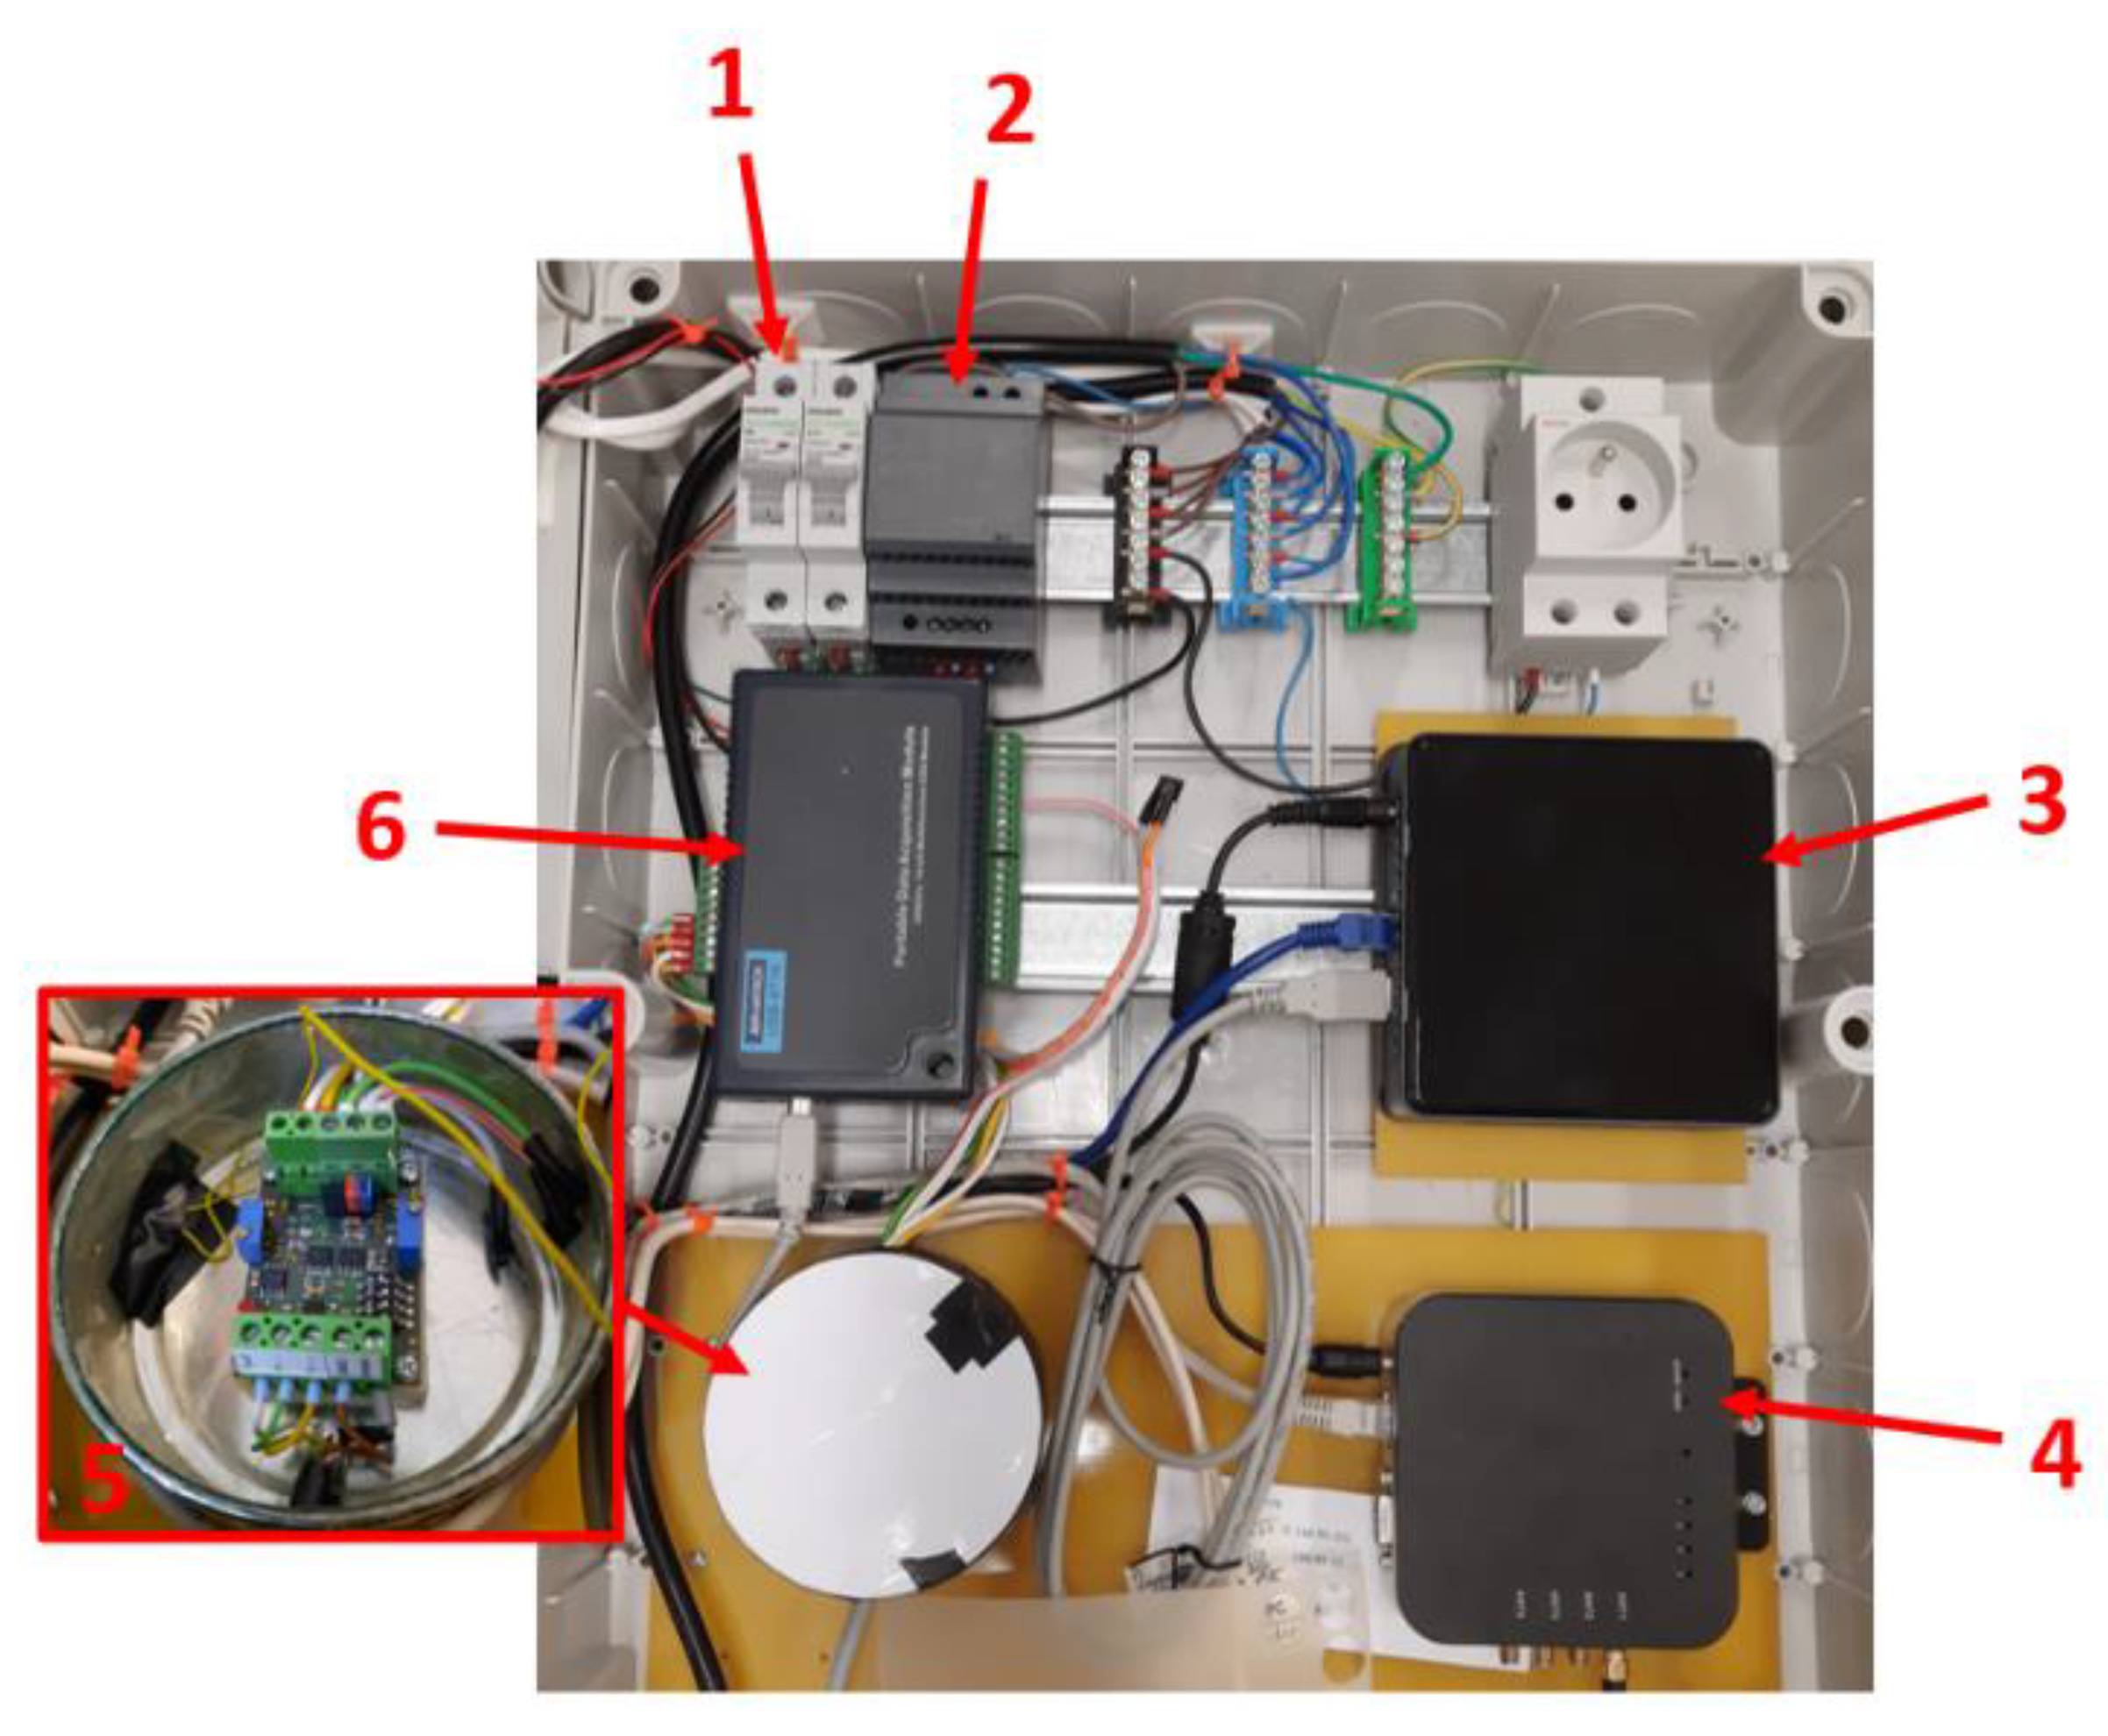
The system was built on wireless data transmission using the Wi-Fi standard between individual main data collection nodes. The Wi-Fi signal was distributed across the area using an LTE router, which also served as a tool for remote control of the measurement system. The goose monitoring system was designed as a modular platform consisting of three main parts: a Data acquisition system for data collection and evaluation, a Feeding area and an Electronic Scale for monitoring the weight change during the consumption of the feed ration on individual measurement days, and finally, the Environmental monitoring system, which was tasked with monitoring environmental parameters. The block diagram of the individual parts of the entire IoT system is shown in Figure 3. A picture of the distribution board as part of the Data acquisition system is shown in Figure 4, the feeding area and electronic scale are shown in Figure 5, and a picture of the weather station as part of the Environmental monitoring system is shown in Figure 7.
Figure 2. Block diagram of the proposed monitoring system.
Preprints 92765 g003

2.2.2. Data acquisition system

The data acquisition system consisted of a TP-Link Wi-Fi router and a distribution board. The system was powered by a 230 V power supply. Figure 4 shows the distribution board, which consisted of circuit breakers (1), a 12 V source (2), a computer (3), an RFID module (4), an amplifier (5), and a measurement card (6). The 12 V source (2) powered the amplifier (5). Data were measured using an Advantech USB 4716 (6) 16-bit measurement card with a sampling rate of 200 ksps. The measurement card was connected via USB to the computer (3). The measurement card was utilised to measure the voltage from the strain gauge system for weighing animals. The ambient light intensity sensor was also connected to the card, and a relay for restarting the RFID module was connected to the digital output. The data were processed in a minicomputer (3) with an Intel Core i5 8259U Coffee Lake 3.8 GHz processor, Intel Iris Plus Graphics 655, 8 GB of RAM, and a 256 GB SSD. The computer was connected to the internet via Wi-Fi. The software that recorded and processed data from individual devices ran on the computer. The activation of the created software occurred when the operating system started. The distribution board also contained an RFID module (4) with an RFID reader, which was connected via Ethernet to the system. The amplifier (5) was placed in a shielded box.
Figure 3. Distribution board of the data acquisition system.
Preprints 92765 g004

2.2.3. Feeding area and electronic scale
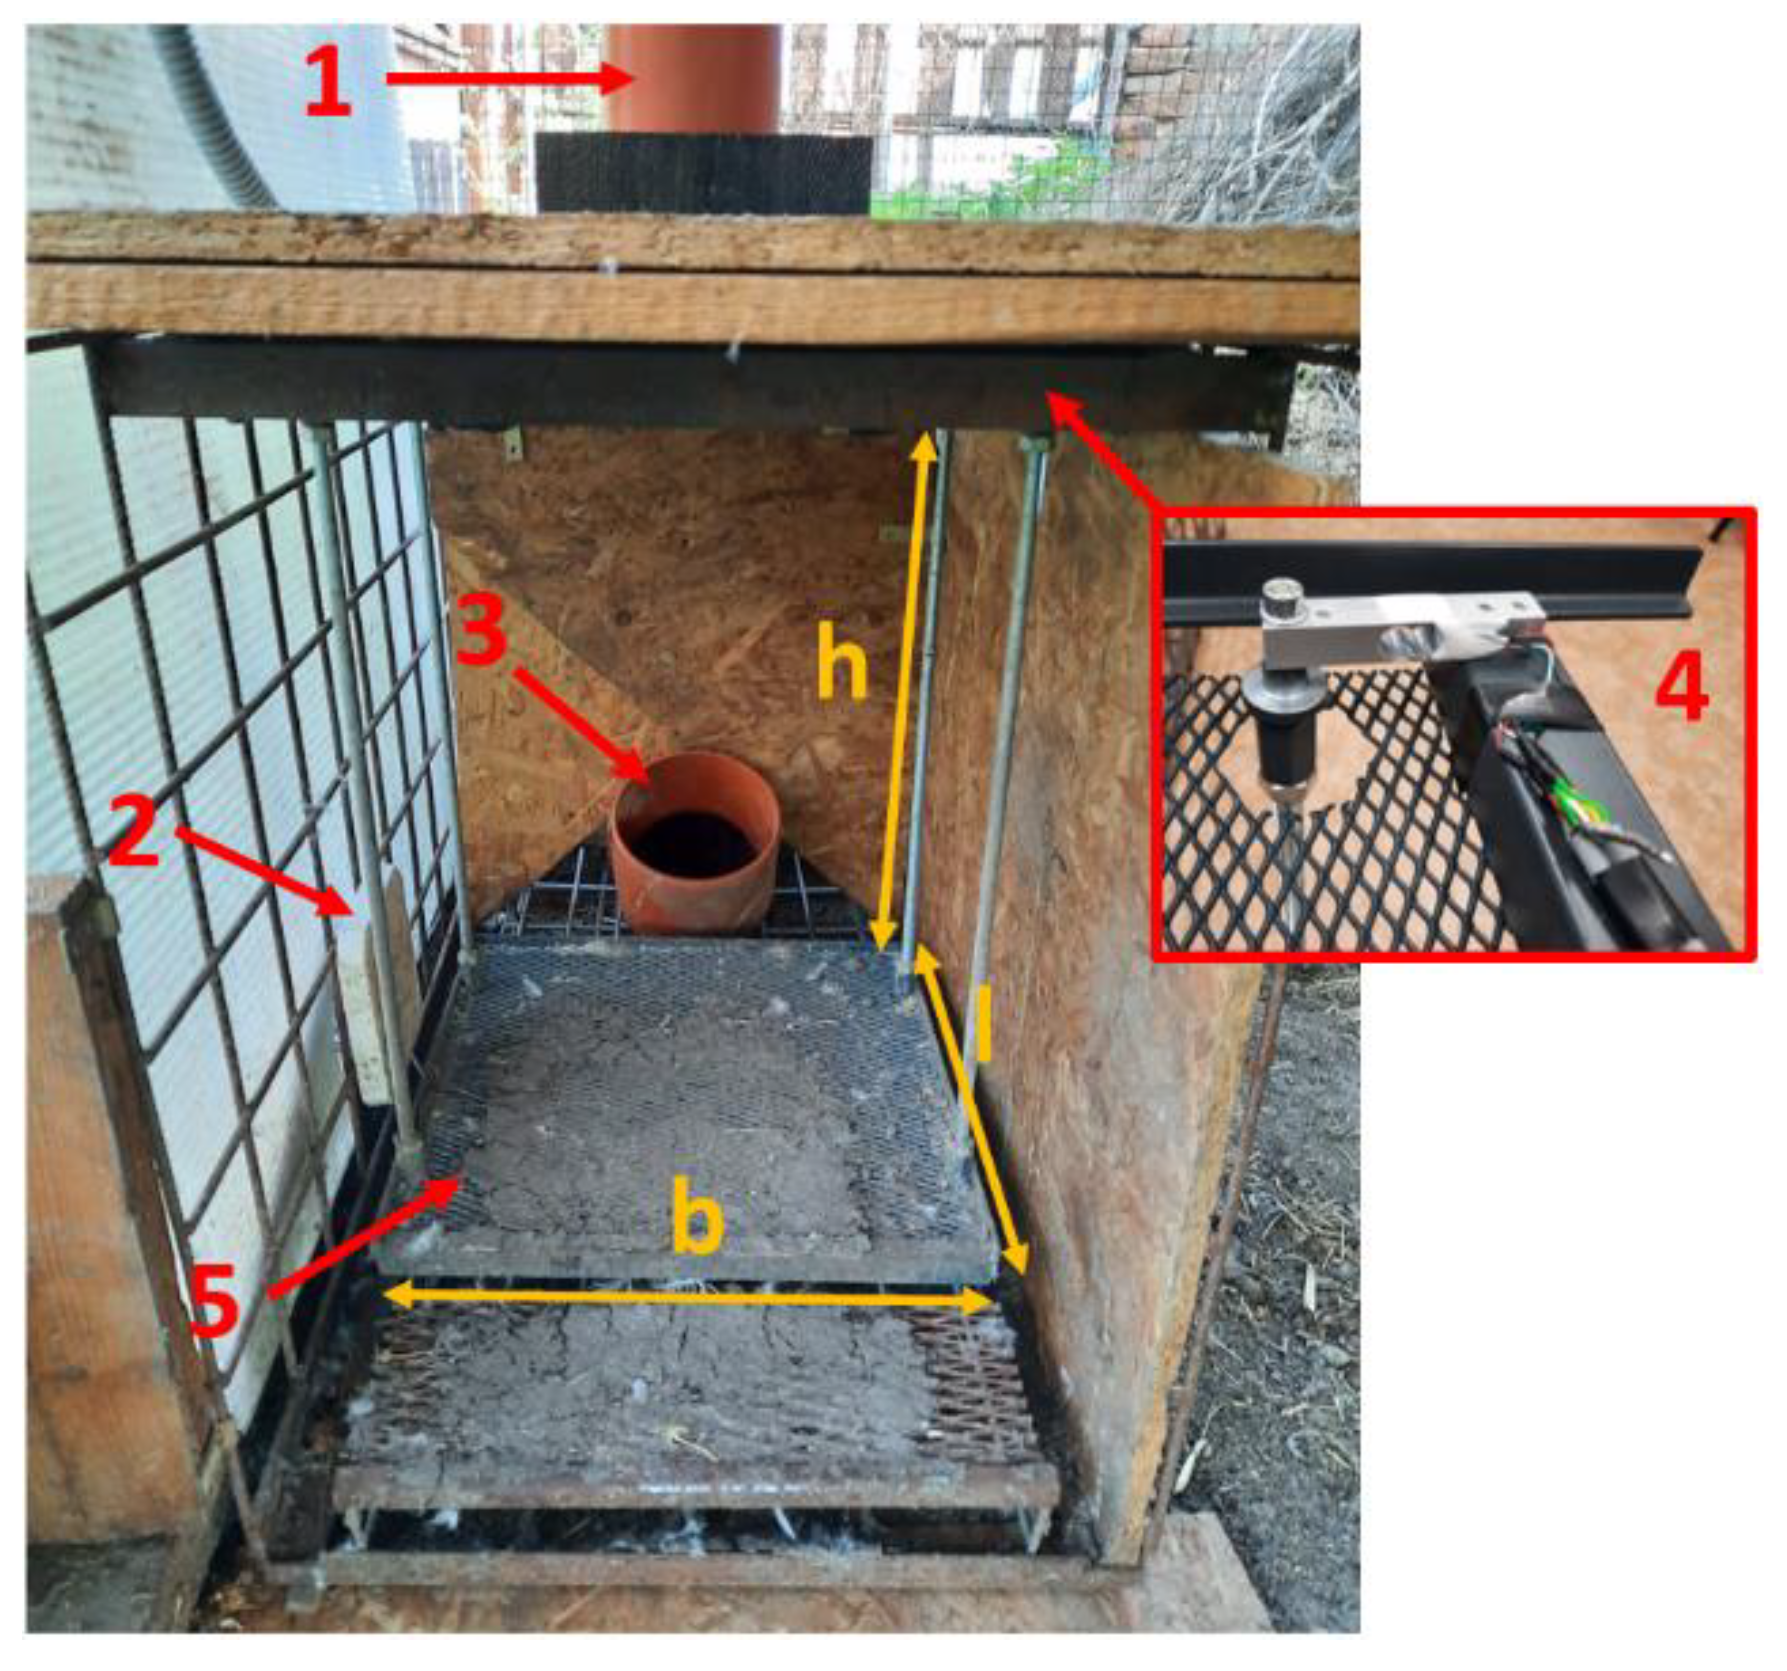
The feeding area and electronic scale, which is shown in Figure 5, consisted of a feed reservoir with a feed inlet (1), an RFID antenna (2), a feed outlet from a feed reservoir (3), and a weighing system consisting of strain gauges (4) and a weighing plate (5). The weighing system allowed the weight of small animals up to 10 kg to be determined. The dimensions of the weighing chamber were b = 360 mm in width, h = 500 mm in height and l = 420 mm in length. The dimensions are given under the same designation in Figure 5. The chamber of the weighing system was attached to the main frame using deformation members in the shape of beams set with strain gauges connected to the full bridge (4). A total of four deformation members were used, which were placed in the upper corners of the weigh chamber. Each strain gauge was designed for a maximum weight of 5 kg. The strain gauge sensors were connected in parallel to one amplifier, which allowed the elimination of incorrect weighing. The amplifier amplified the input signal and gave the strain gauge bridge power with a constant current source. The constant current source was selected at 7 mA with regard to the load of the current source and its maintenance at the setting value. The change in load was determined on the basis of the voltage drop according to the change in resistance of the strain gauges under load. The signal was then amplified and recorded using an Advantech USB 4716 measurement card. A photoresistor for measuring light intensity and a temperature and humidity sensor were placed in the upper part of the feeding area so that it was out of reach of the geese. The temperature and humidity of the environment were measured using the TH2E IP temperature and humidity sensor.
Figure 4. Feeding area and electronic scale.
Preprints 92765 g005
The weight gain analysis system was designed for the detection of individual animals using wireless UHF RFID technology. For detection, a 4-channel UHF RFID reader module, Chainway UR4, with an integrated Impinj R2000 circuit was utilised. This module allows communication via a serial line RS-232 or via Ethernet RJ45, following the communication standard EPC C1 GEN2 / ISO18000-6C. It can optimally read up to 700 RFID tags per second, featuring four channels and an antenna connection via an SMA connector. The antenna used was a 5dBi UHF RFID antenna.
Moreover, an RFID tag made of ABS material was employed, enabling communication on three different frequency types: Low Frequency (LF) with a working frequency of 125 Hz, High Frequency (HF) with a working frequency of 13.56 MHz, and ultrahigh-frequency (UHF) with a working frequency range in Europe of 865-868 MHz and in the USA and Canada of 902-928 MHz. UHF with a fixed reader read range of 1 m was used for measurement. The RFID reading module was connected via Ethernet to the LTE router, to which the measuring PC was also connected. This approach allowed the creation of more extensive measuring systems by connecting several RFID readers.
Each goose was assigned an RFID tag with a unique serial number, which was then recorded in the created database. The system recorded the current weight during feeding along with the corresponding time and associated it with the individual RFID tag serial number. Additionally, other measured values, like light intensity, could also be assigned to these numbers. One RFID channel was dedicated to measurement, while the other three channels remained unoccupied.
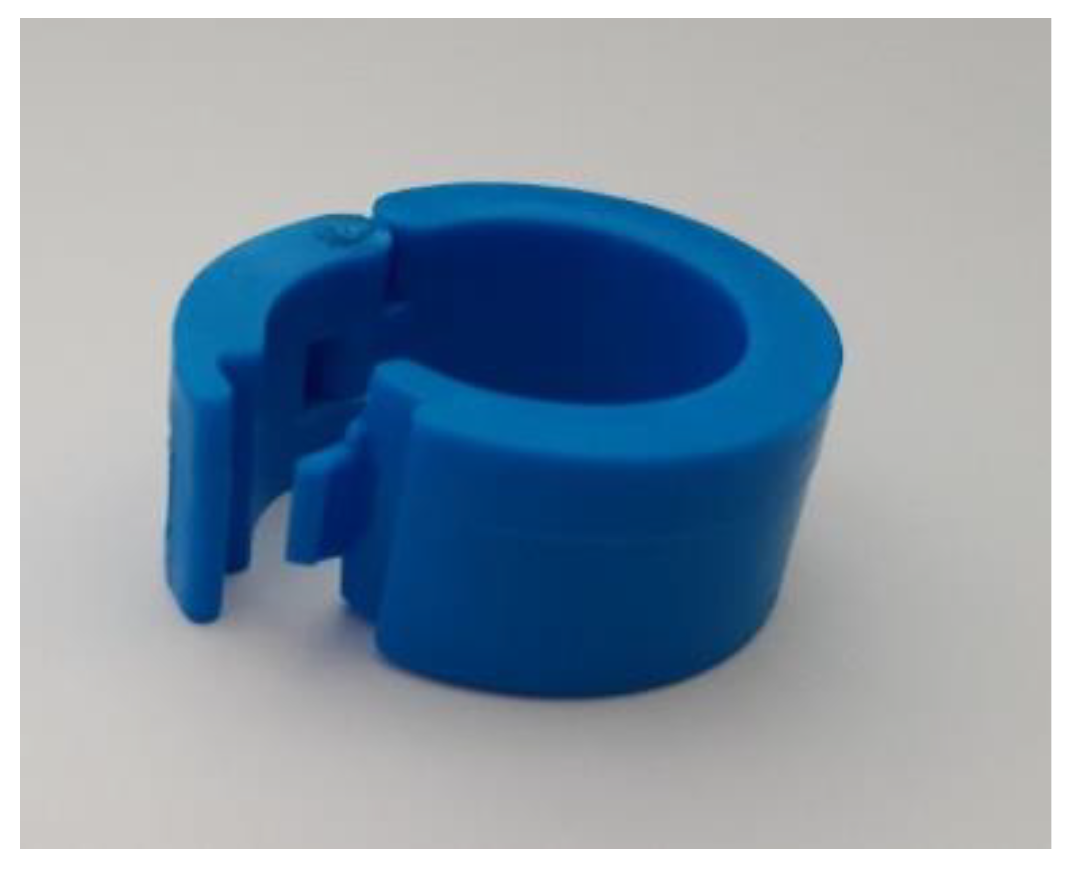
In Figure 6, a detail of the UHF RFID tag attached to the animal's left leg is shown. The location of the tag, in the form of a ring, was chosen for the left leg, as the antenna was mounted on the left side, preventing possible signal shielding by the goose's body. The feeding area and electronic scale were equipped with a feeding section, allowing each animal to enter the weighing chamber with the correct body orientation and be identified individually. The goose feed served as an incentive for regular visits to the weighing area. The antenna was configured to measure only on the weighing system, and it had a small transmission power of 5 dBi. The antenna was shielded from the other side by the cage structure of the feed box. Therefore, only those geese on the weighing system were detected.
Figure 5. Detail of the used RFID tag with a working frequency of 865-868 MHz.
Preprints 92765 g006

2.2.4. Environment monitoring system

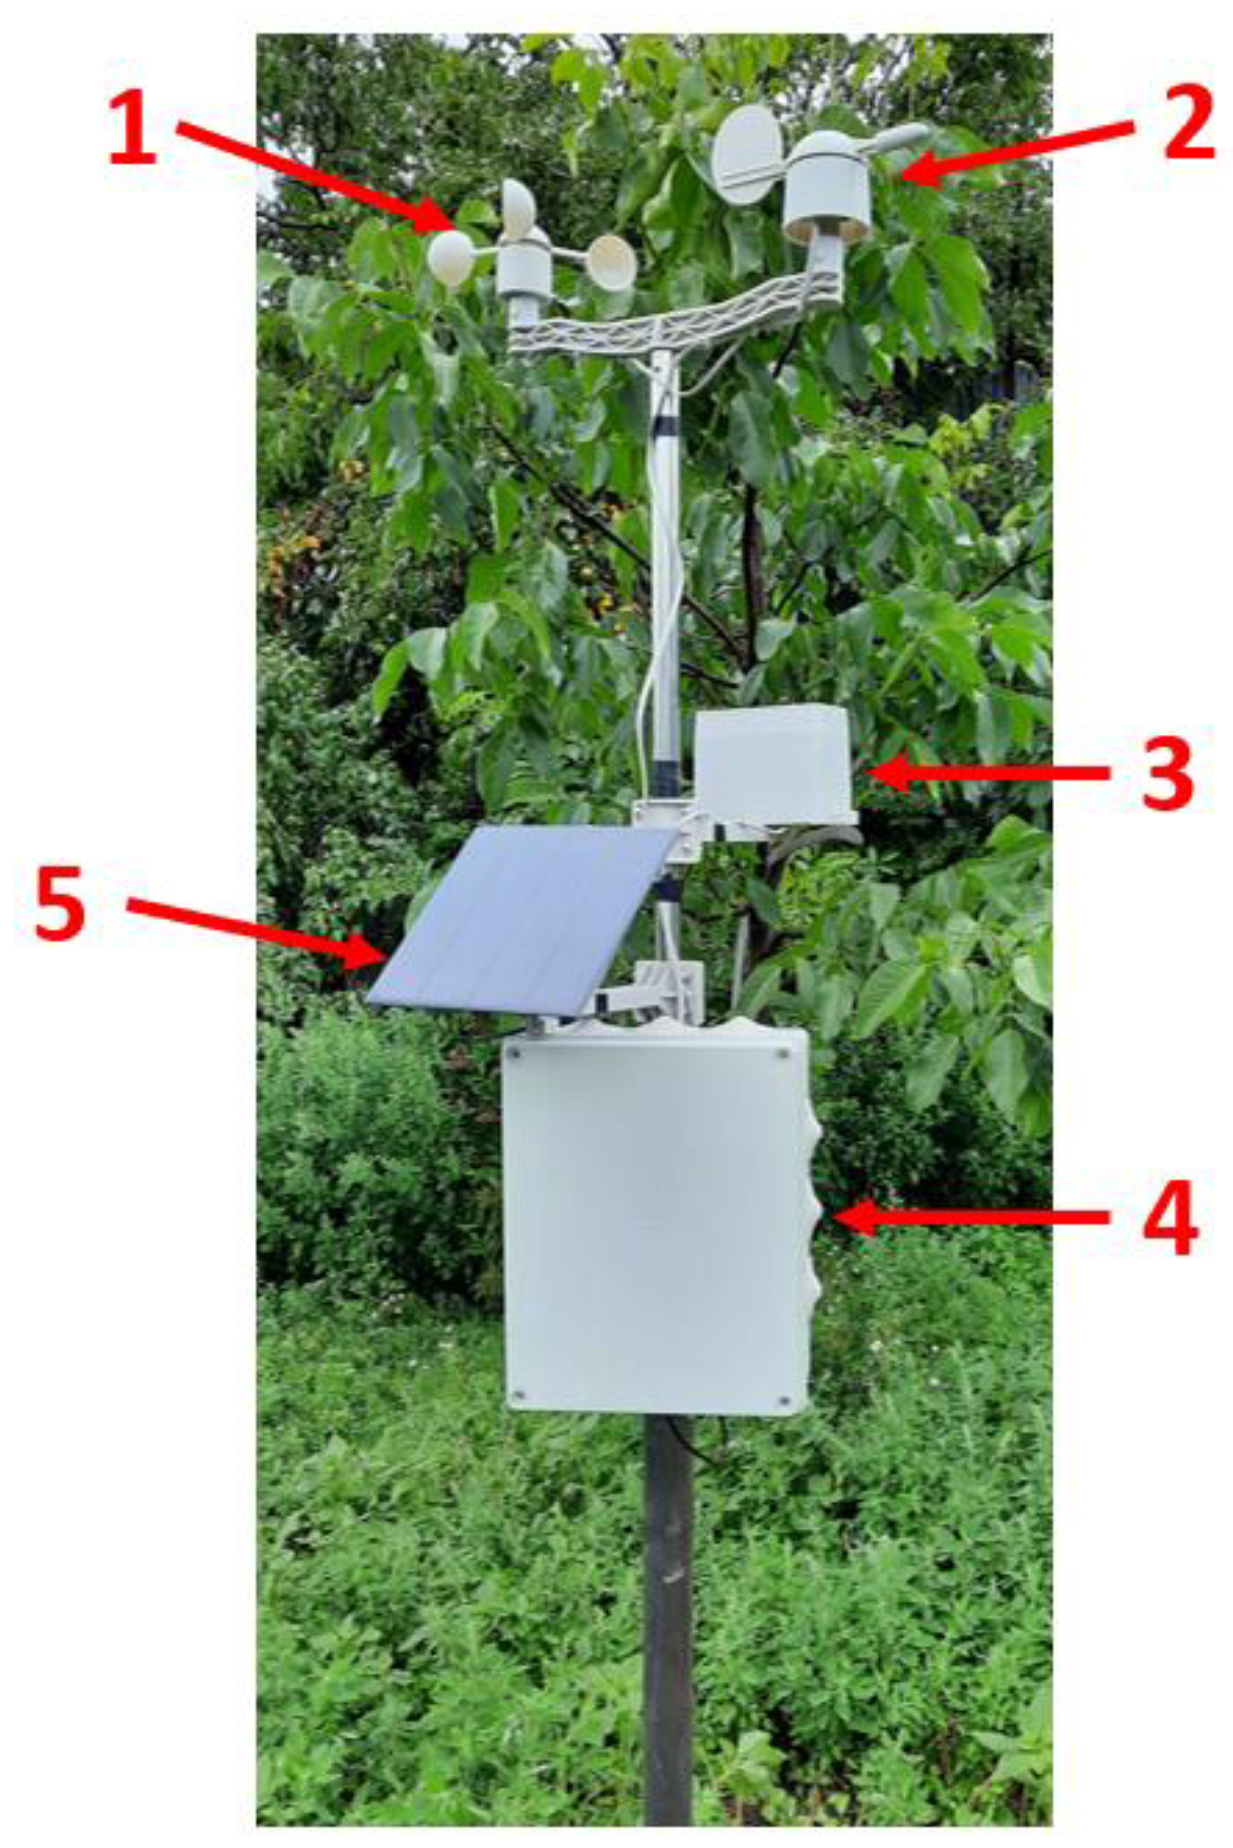
The environmental monitoring system comprised a weather station and separate sensors. The weather station (Figure 7) included an anemometer (1), an anemoscope (2), a rain gauge (3), a distribution board with the electronics of the weather station (4), and a photovoltaic panel (5). The mechanical anemometer (1) utilised a WH-SP-WS01 wind speed sensor to detect wind speed. The sensor's revolutions were detected non-contactly using a magnetic reed contact. The anemoscope (2), made up of a WH-SP-WD wind direction sensor, was designed to detect wind direction. The sensor contained eight magnetic switches connected to a resistor with varying resistance values, allowing for a total of 16 different rotation positions to be indicated, as the vane magnet could switch two switches simultaneously. The rain gauge MS-WH-SP-RG (3) employed the principle of self-emptying for measuring rainfall using a tilting rainwater collector. The distribution board (4) with the weather station electronics housed a battery, thermometer, barometer, regulator, and a microprocessor with a communication module. An ESP-WROOM microprocessor with a communication module was utilised, and a DS18B20 digital sensor served as the temperature sensor. The module also included sensors for air quality, temperature, pressure, and humidity: BMP280 pressure sensor, CCS811 eCO2 sensor, and Si7021 module for temperature and humidity. The weather station was designed as an independent system and was powered by a photovoltaic panel (6) with a peak power output of 4.5 W, using a Samsung ICR18650-26J, 2600mAh, Li-Ion battery. Additionally, the system integrated a flip module for measuring precipitation, a pulse system for wind speed measurement, and a resistance system for wind direction measurement.
The interior and exterior areas of the enclosure were additionally equipped with temperature, humidity, and photoresistor sensors. This information was crucial for spatial arrangements, considering that one section of the breeding area was shaded by a roof while the other was not.
A Reolink RLC-522-5MP IP web camera was used to monitor the enclosure. Recording the enclosure with animals using the camera enables analysis of their behaviour and activities throughout the day, helping to tailor the breeding system accordingly. Not all activities can be deduced from feeding analysis alone. The camera, coupled with image processing, facilitates the analysis of the animals' movement activities during the day or over a specific observation period. This includes tracking their movements during rest and feeding. The IoT camera also served to verify the geese's feeding on the weighing system. While RFID registrations provide information about the goose's presence near the antenna, they do not capture the animal's behaviour at the site. Therefore, the camera allows for analysing geese' behaviour at the feeding place, particularly during RFID tag readings.

2.3. Measurement system – software equipment
The software utilised in the Intel Core i5 8259U mini computer was Windows 10. To handle data measurement and recording, a custom application named "Husa v. 1.2.0.0" was developed using Visual Studio 2019. For data post-processing, open-source software Scilab 6.1.0 was employed. The software was designed to extract data from the RFID module, the IP device for measuring temperature and humidity, and the Advantech USB-4716 measuring card.
The RFID module could accommodate 4 antennas. The application allowed the selection of any connected antenna to sense the proximity of the RFID tag. It was capable of functioning in an autonomous mode. The principle was based on triggering an event when the presence of an RFID tag was detected within the antenna's range. Upon reading the RFID tag, the information from the tag was cross-referenced with the record of the measured animals, each assigned a specific RFID tag number. This ensured that only intended tags meant for measurement were recorded. Consequently, measurement occurred only if information was successfully read from the RFID tag of the geese. Upon event activation, individual data such as voltage from the weighing device using the Advantech card (converted to weight), current temperature, humidity, and ambient light intensity were loaded. During weight measurement, five measurements were repeated, and the average data was saved.
Figure 6. The weather station for monitoring environmental parameters.
Preprints 92765 g007
Upon launching the application, establishing communication with the RFID module via Ethernet was made possible. After connecting to the device, a request was sent for the hardware (HW) information of the RFID module, including details about the firmware version, hardware version, module number, temperature, and the set RFID frequency standard. This command acted as a watchdog in the program, triggering a device restart if no response was received. After connecting to the RFID module, the corresponding USB measuring card was selected, and the input channel number was configured. Subsequently, the number of channels of the RFID module could be chosen. As part of the measurement, one antenna was connected to the first channel. Once set up, measurement could be initiated when the RFID module sent a signal and awaited the reaction of the RFID tags. After the response, a comparison was made with the stored identification numbers. A record was created with the measured weight, ambient temperature, and ambient lighting if a match was found.
In addition to data measurement and processing, the application facilitated sending notifications, results, and anomalies regarding the condition of the animals during feeding. The system dispatched them every day at a set time, either via email or as an SMS message. Among the measured anomalies were, for instance, low attendance at the feeding place by animals or the mutual interaction of animals during feeding, leading to more than one RFID registration.

2.4. Measurement Algorithm

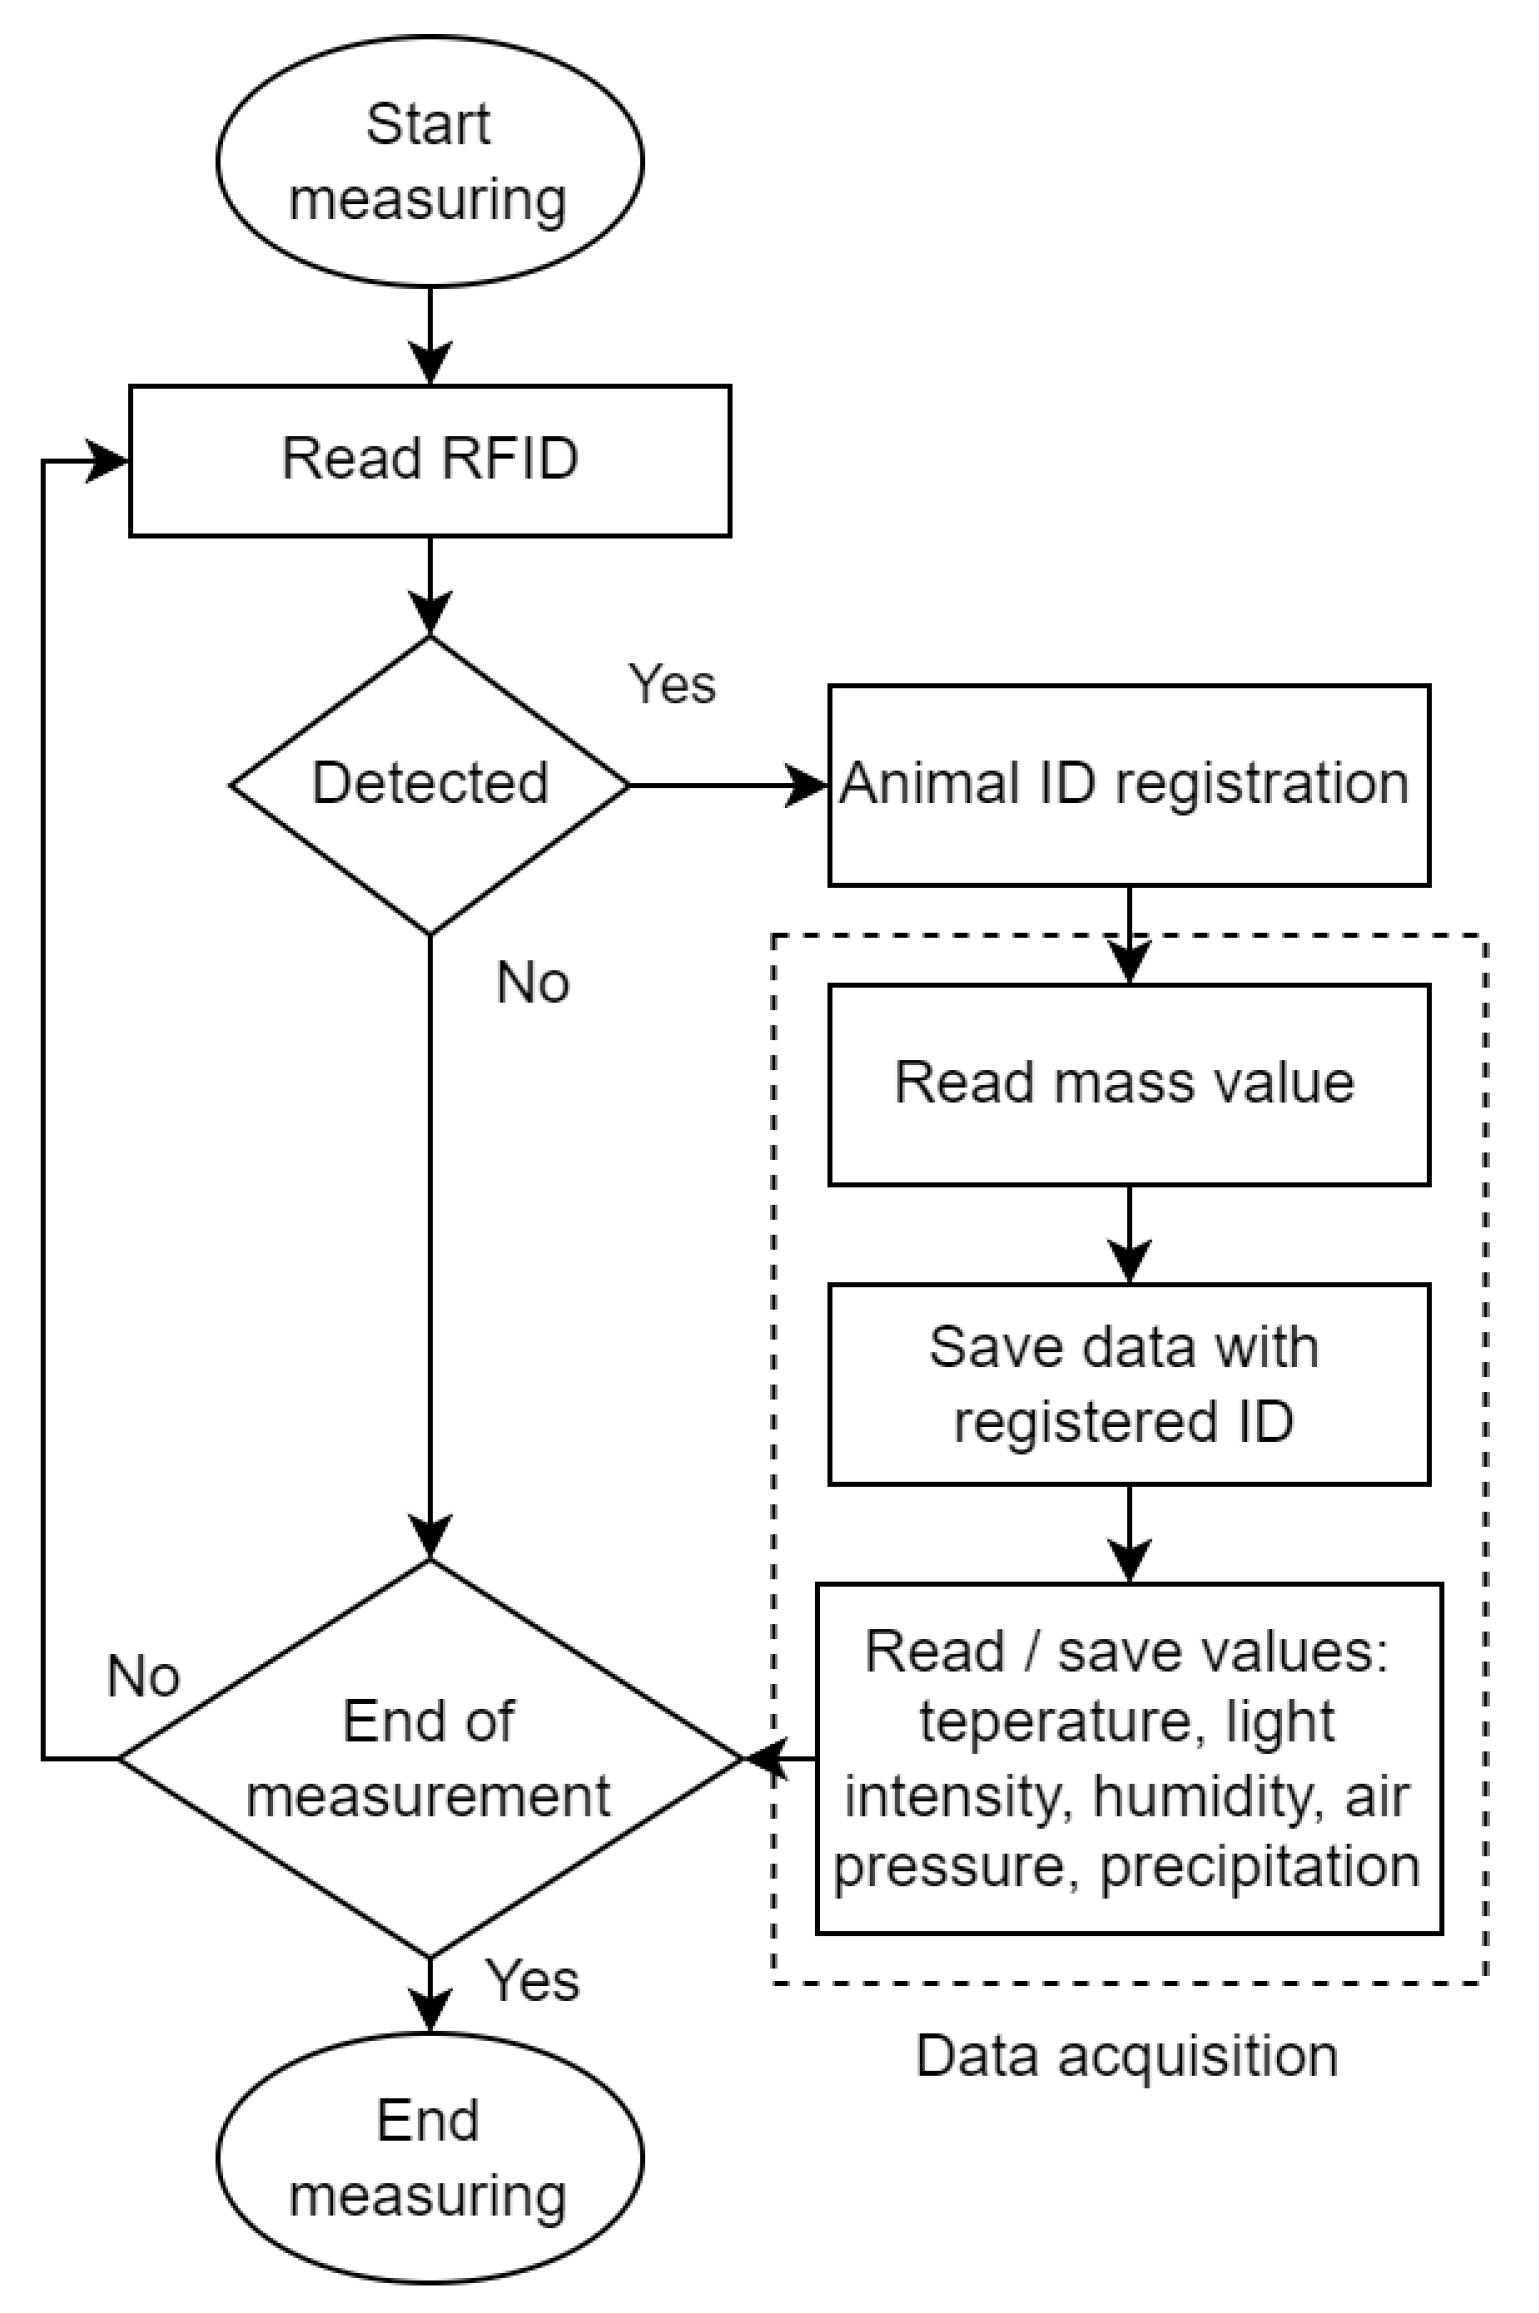
The flowchart illustrating the data measurement algorithm is presented in Figure 8. Upon the goose's arrival at the designated measuring point with the assigned RFID tag, the RFID tag is read. A valid code is identified in the database if the RFID tag is successfully read. This is followed by recording the goose's serial number, date, and time. Subsequently, the weight of the goose is recorded multiple times, and data from the external environment (temperature, pressure, precipitation, humidity, light intensity) are stored. All data is associated with a single time record and the animal's presence. If the RFID tag is not initially read, the system will make repeated attempts until a valid code is found in the database.
Figure 7. The algorithm of the measurement.
Preprints 92765 g008

2.5. Calculation of the measurement accuracy of the RFID system

With reference to [5], the performance measures of raw data from RFID registrations were determined. Based on the following formulas, the sensitivity, specificity, accuracy, and precision of the RFID system for detecting feeding geese were calculated:
S e n s i t i v i t y = T P P
S p e c i f i c i t y = T N N
A c c u r a c y = T P + T N P + N
P r e c i s i o n = T P T P + F P
Where,
  • TP is the number of true positives, representing the instances when RFID registration was obtained and, at the same time, the video confirmed its correctness;
  • TN is the number of true negatives, indicating instances when RFID registration was not obtained and, simultaneously, the video confirmed its correctness;
  • P is the number of positives, signifying the times when the goose was standing on the scale;
  • N is the number of negatives, representing the times when the goose was not standing on the scale;
  • FP is the number of false positives, indicating instances when the goose was not present on the scale, but RFID registration occurred;
  • FP is the number of false positives. The number of sampling points (s) when the goose was not present on the scale, but the RFID registration occurred.

3. Results

This section may be divided by subheadings. It should provide a concise and precise description of the experimental results, their interpretation, as well as the experimental conclusions that can be drawn.

3.1. System Validation and Monitoring Results
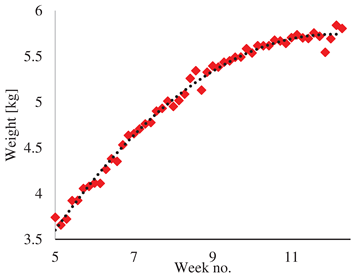
The observation period was from 20/06/2021 to 11/08/2021, totalling 52 days. This period corresponded to the fifth to twelfth week of the goose's life. Weight data linked to a specific code were transmitted during RFID registrations. In Table 1, the left column presents a graph evaluating the average weight values of goose number 4 per day. The X-axis displays the age of the goose in weeks, and the Y-axis indicates the weight value in kilograms. The graph clearly shows weight decreases during the rearing period. These declines were caused by medical checkups conducted once a week. This interaction was a stressful factor for the geese, resulting in reduced food intake and, consequently, weight loss. Weight loss, attributed to moulting, was also observed during the eighth week of life. From the ninth week onwards, a decline in the weight gain slope is evident. The weight gain could be described by the equation (5) With the determination coefficient of R2 = 0.9916.
y = 0.0428 x 2 + 1.0329 x 0.4953
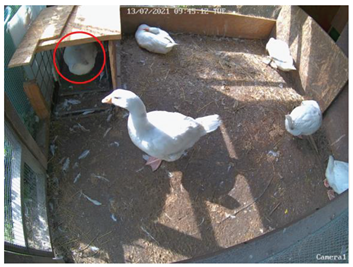
The left column also displays the RFID code for goose number 4. In the right column, goose number 4 is presented in an image, marked at the moment it was on the weighing system, i.e., when it was detected by the RFID antenna. The right column also indicates the time and date of the given image.
From the collected data, the percentage of registrations occurring during monitored visits to the feeding system was calculated. Throughout the observation period, there were a total of 323 678 RFID registrations for geese that had just entered the weighing system, with an average of 15 804 ± 3 809 (mean ± SD) registrations per goose. As the RFID tag of goose number 6 broke on 06/08/2021, goose number 6 was prematurely removed from the experiment. Therefore, it was also omitted from evaluating the average measurement value.
A web camera was utilised to validate RFID registrations. With the assistance of the web camera, it was possible to ascertain whether the goose was actually present in the weighing system at a specific time. In evaluating the entire system, the sensitivity was 93.87%, specificity 99.94%, accuracy 99.85%, and precision 95.09%. The indicated data were obtained from one monitored day 13/07/2021 from 9:00:00 to 17:00:00.
The resulting sensitivity, specificity, accuracy, and precision values for individual geese are presented in Table 2. The table also includes a comparison of the initial weight, final weight for individual geese, and their weight gain during the monitored period. Subsequently, the table shows the number of RFID registrations for the observed period and the percentage of time from the total monitored period that the goose spent on the weighing system.
The number of RFID registrations made it possible to determine the time spent on the weighing system by multiplying the number of registrations by the length of the time step, which was 3 s. By multiplying these values for goose number six, it was found that the total time spent on the weighing system was 22 794 s. In contrast, goose number 13, which had the most RFID registrations, spent 73 554 s on the weighing system. Overall, goose number six spent the least time on the weighing system. The compared time spent on the weighing system was from 20/06/2021 to 04/08/2021.
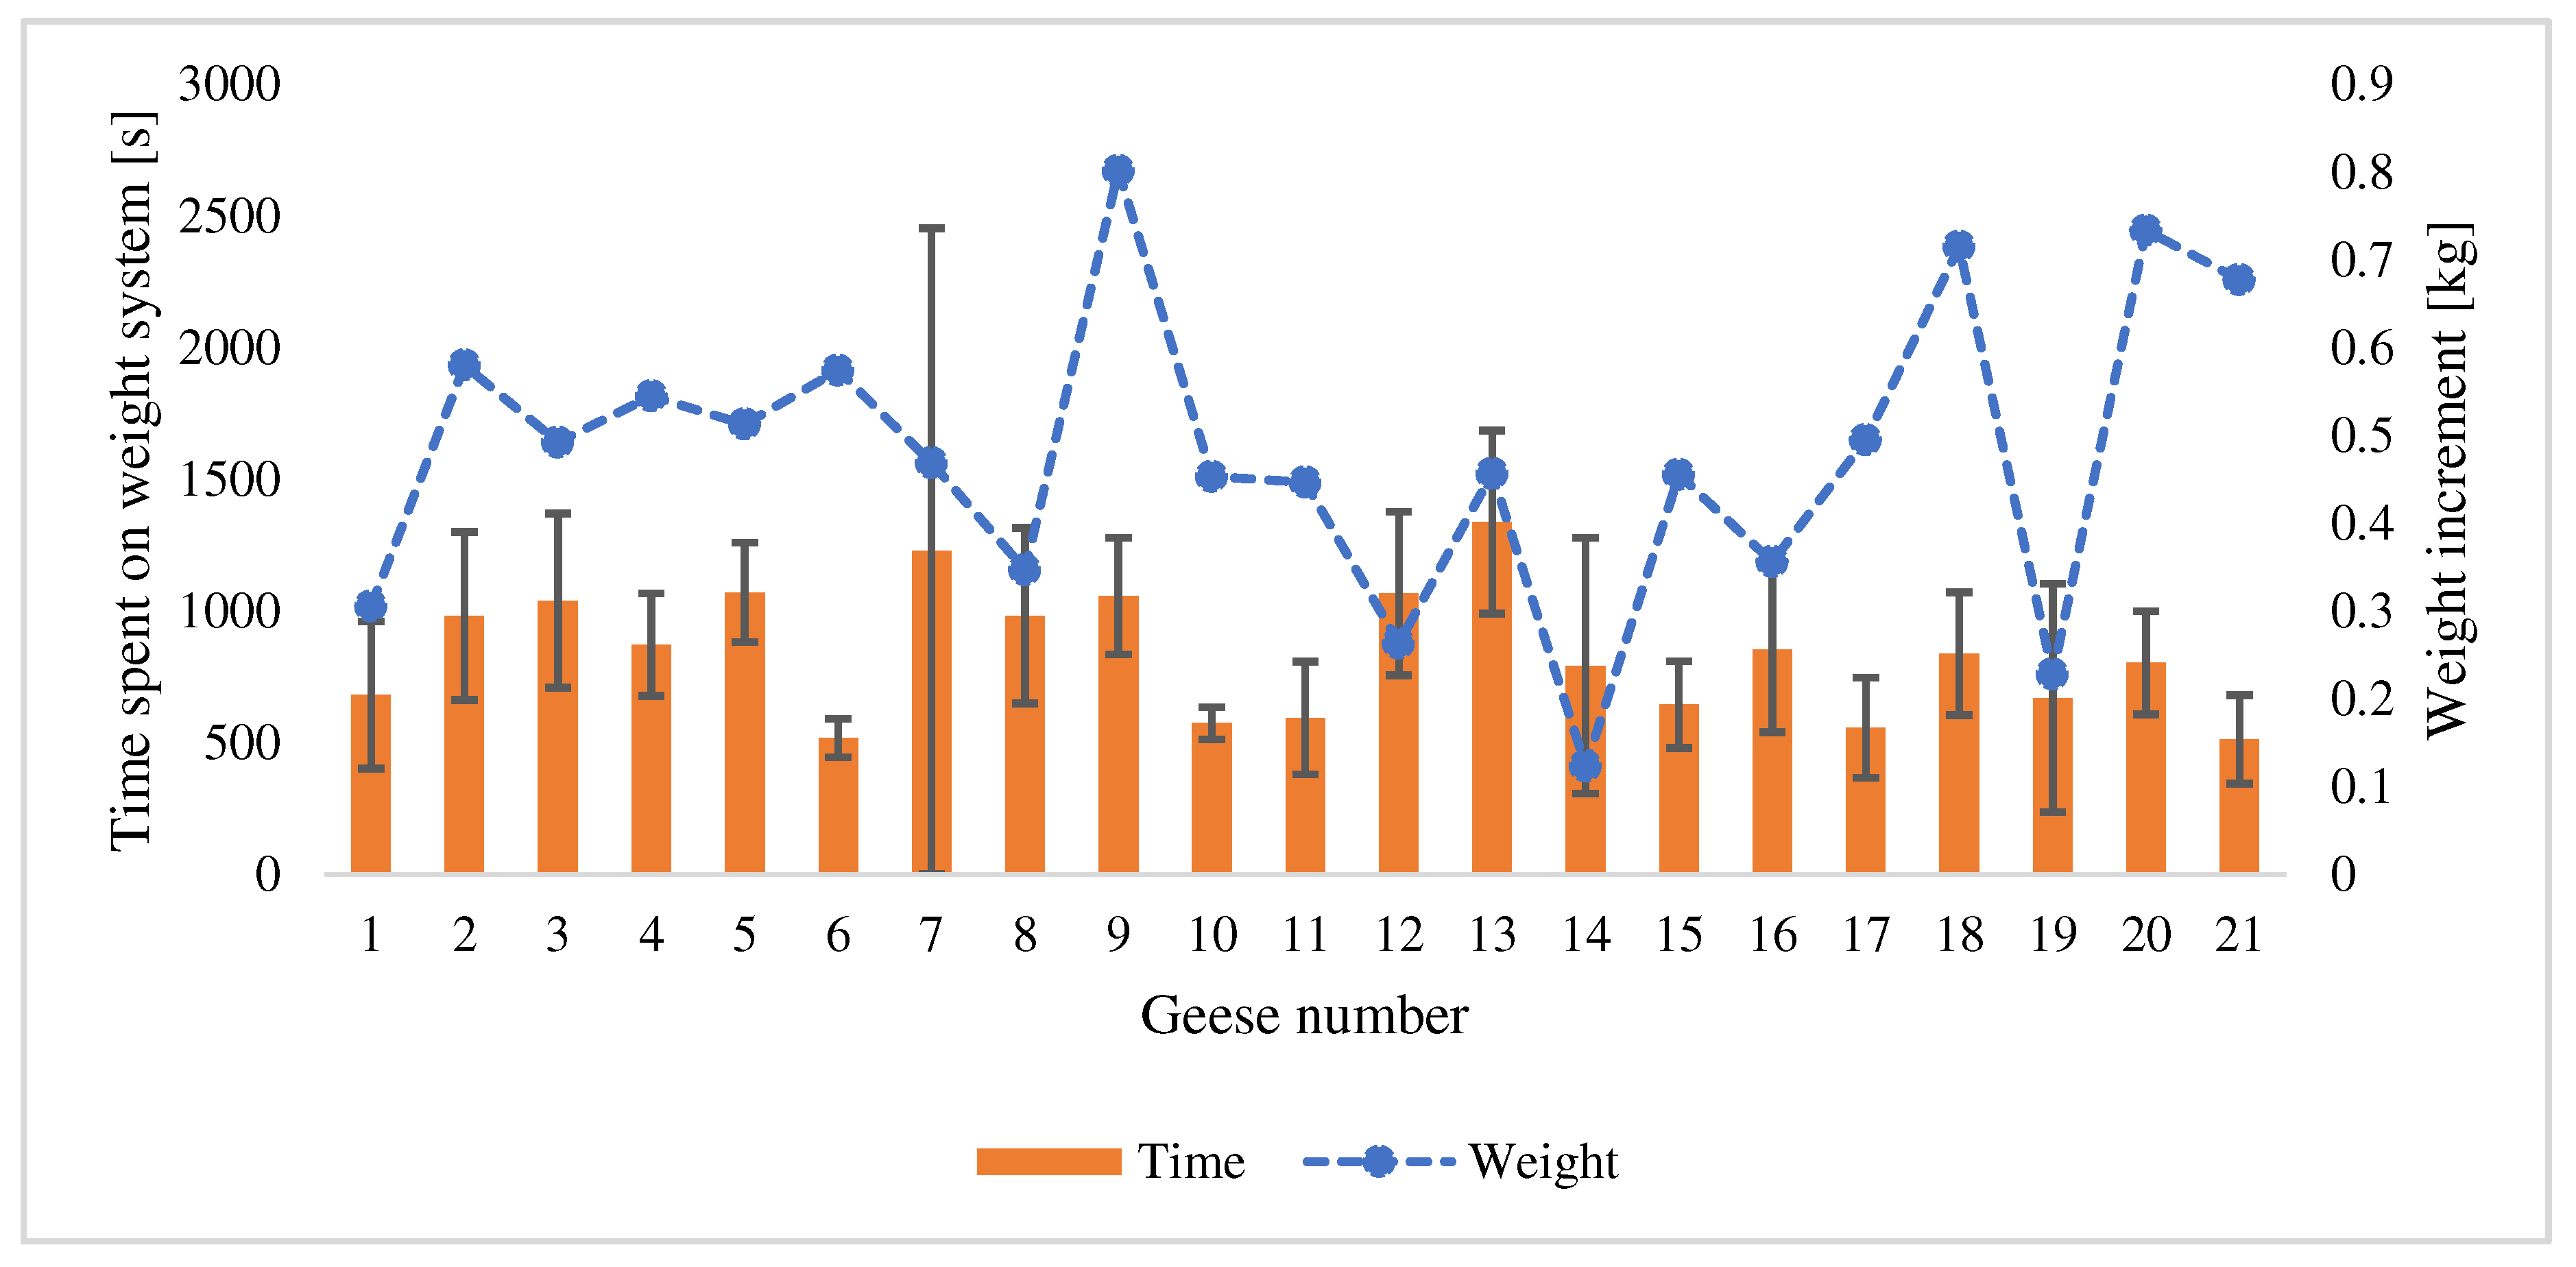
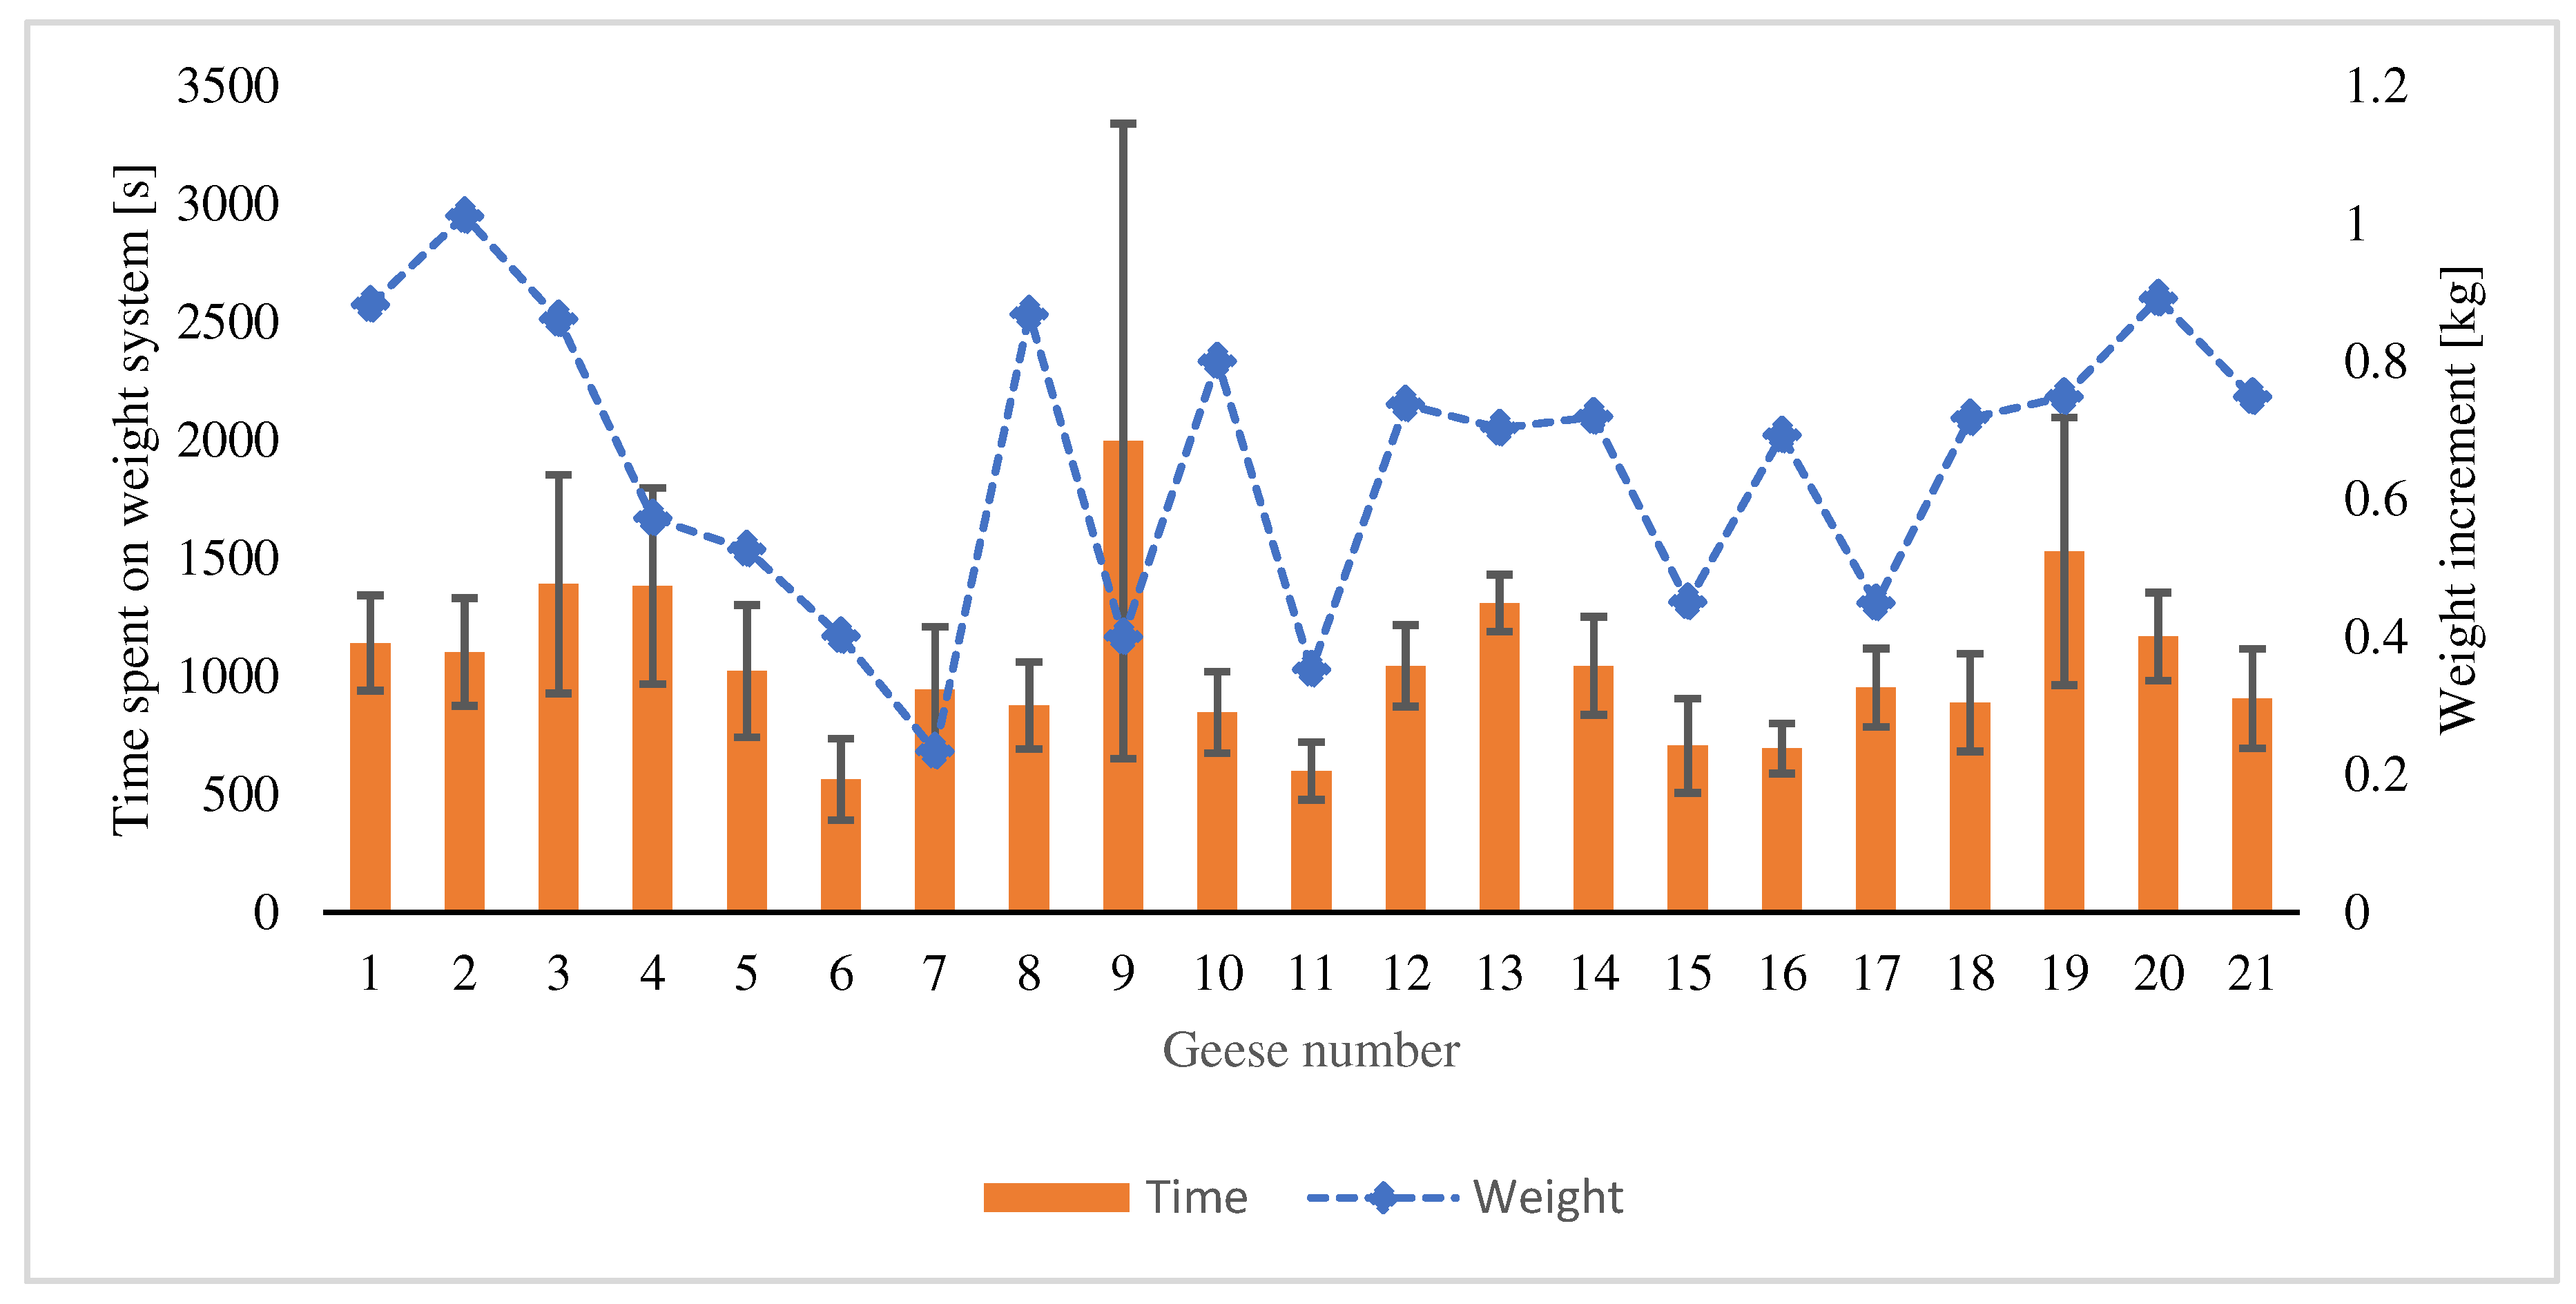
Figure 9 and 10 show a graph comparing the average time that geese spent on the weighing system each day. All twenty-one geese were compared over two chosen weeks. The first chosen week was in the period from 21/06/2021 to 27/06/2021, from the second day of observation. This was chosen because some geese started feeding on the second day, likely due to the stress caused by transportation and a new environment. The total time the geese spent on the weighing system on the first day of observation, 20/06/2021, was only 11 754 s. In comparison, they spent 22 704 s on the weighing system on the second day. Figure 9 shows the comparison of the average daily time spent on the weighing system during the first week. The X-axis shows the goose number, and the Y-axis shows the time the goose spent on the weighing system. The standard deviations for individual geese are also indicated in the graph. It is evident from the graph that goose number 6 spent the least time on the weighing system. This goose spent an average of 562 s with a standard deviation of 172 s, and its weight gain was 0.401 kg. Although her frequency on the scale was the lowest, her weight gain did not correspond. The lowest value of weight gain was for goose number 7, with a value of 0.234 kg; its average time spent on the scale was 942 s, and its standard deviation was 264 s. The highest weight gain was for goose number 2, which was 1.011 kg; this goose had an average time of 1102 s and a standard deviation of 278 s. Thus, the low value of RFID registrations for goose number 6 could be due to a faulty RFID tag or less need to spend time on the weighing system without the intention of feeding. The most time was spent on the weighing system by goose number 9, which spent an average of 1995 s. The weight gain of this goose was 0.399 kg, which was a relatively lower value compared to other geese. The goose could spend time on the scale even without her needing to feed. Goose number 9 shows a significant standard deviation value (σ = 1345 s). This was due to significant variations in the time spent on the weighing system during the week. The shortest time a goose spent on the weighing system was 612 s on 26/06/2021. The longest time a goose spent here was 4368 s on 27/06/2021. The smallest standard deviation was for goose number 16 (σ = 105 s). The shortest time spent was 573 s on 26/06/2021. The longest time a goose spent was 864 s on 21/06/2021. The average time goose number 16 spent on the weighing system was 693 s.
Figure 8. The average daily time spent on the weighing system during the week from 21/06/2021 to 27/6/2021.
Preprints 92765 g009
The second chosen week for comparing the average time geese spent on the weighing system was the period from 29/07/2021 to 04/08/2021, which was approximately the sixth week of monitoring. This period was chosen because the RFID tag of one of the geese (Goose number 6) broke on 05/08/2021. From Figure 10, it is evident that goose number 13 spent the most time on the weighing system, averaging 1337 s with a standard deviation of 347 s. The weight gain of goose number 13 was 0.465 kg. The lowest was 729 s, and its standard deviation was 484 s. The highest weight gain was for goose number 9, 0.801 kg; this goose had an average time of 1056 s and a standard deviation of 220 s. Goose number 21 spent the least time here. This goose spent an average of 513 s on the weighing system, and its weight gain was 0.677 kg. The graph shows that the lowest standard deviation was for goose number 7, with a value of σ = 1225 s. The average time spent on the weighing system was 1227 s. The shortest duration a goose spent here was 480 s on 01/08/2021. The longest time was 4194 s on 03/08/2021. The smallest standard deviation was for goose number 10 (σ = 61 s). The shortest time spent on the weighing system was 483 s on 04/08/2021. The longest time a goose spent on the weighing system was 660 s on 29/07/2021. The average time was 574 s.
Figure 9. Average daily time spent on the weighing system in the week from 29/07/2021 to 04/08/2021.
Preprints 92765 g010
In the week from 29/07/2021 to 04/08/2021, there was 19.99% less time spent on the weighing system compared to the week from 21/06/2021 to 27/06/2021. The difference in frequency was determined by comparing the total time spent by all geese in the first week and the total time spent in the week at the end of the monitoring period. The total time in the week from 21/06/2021 to 27/06/2021 was 154 668 s. The total time in the week from 29/07/2021 to 04/08/2021 was 123 744 s. This difference could be attributed to the fact that the geese no longer needed to be fed as they were at the beginning of the breeding, corresponding to the observation that the weight of geese in this period was not increasing as rapidly as up to the ninth week of breeding (Table 1). Furthermore, it was an open breeding, allowing the geese to freely graze on available vegetation.

3.2. Comparison of video duration and RFID registrations
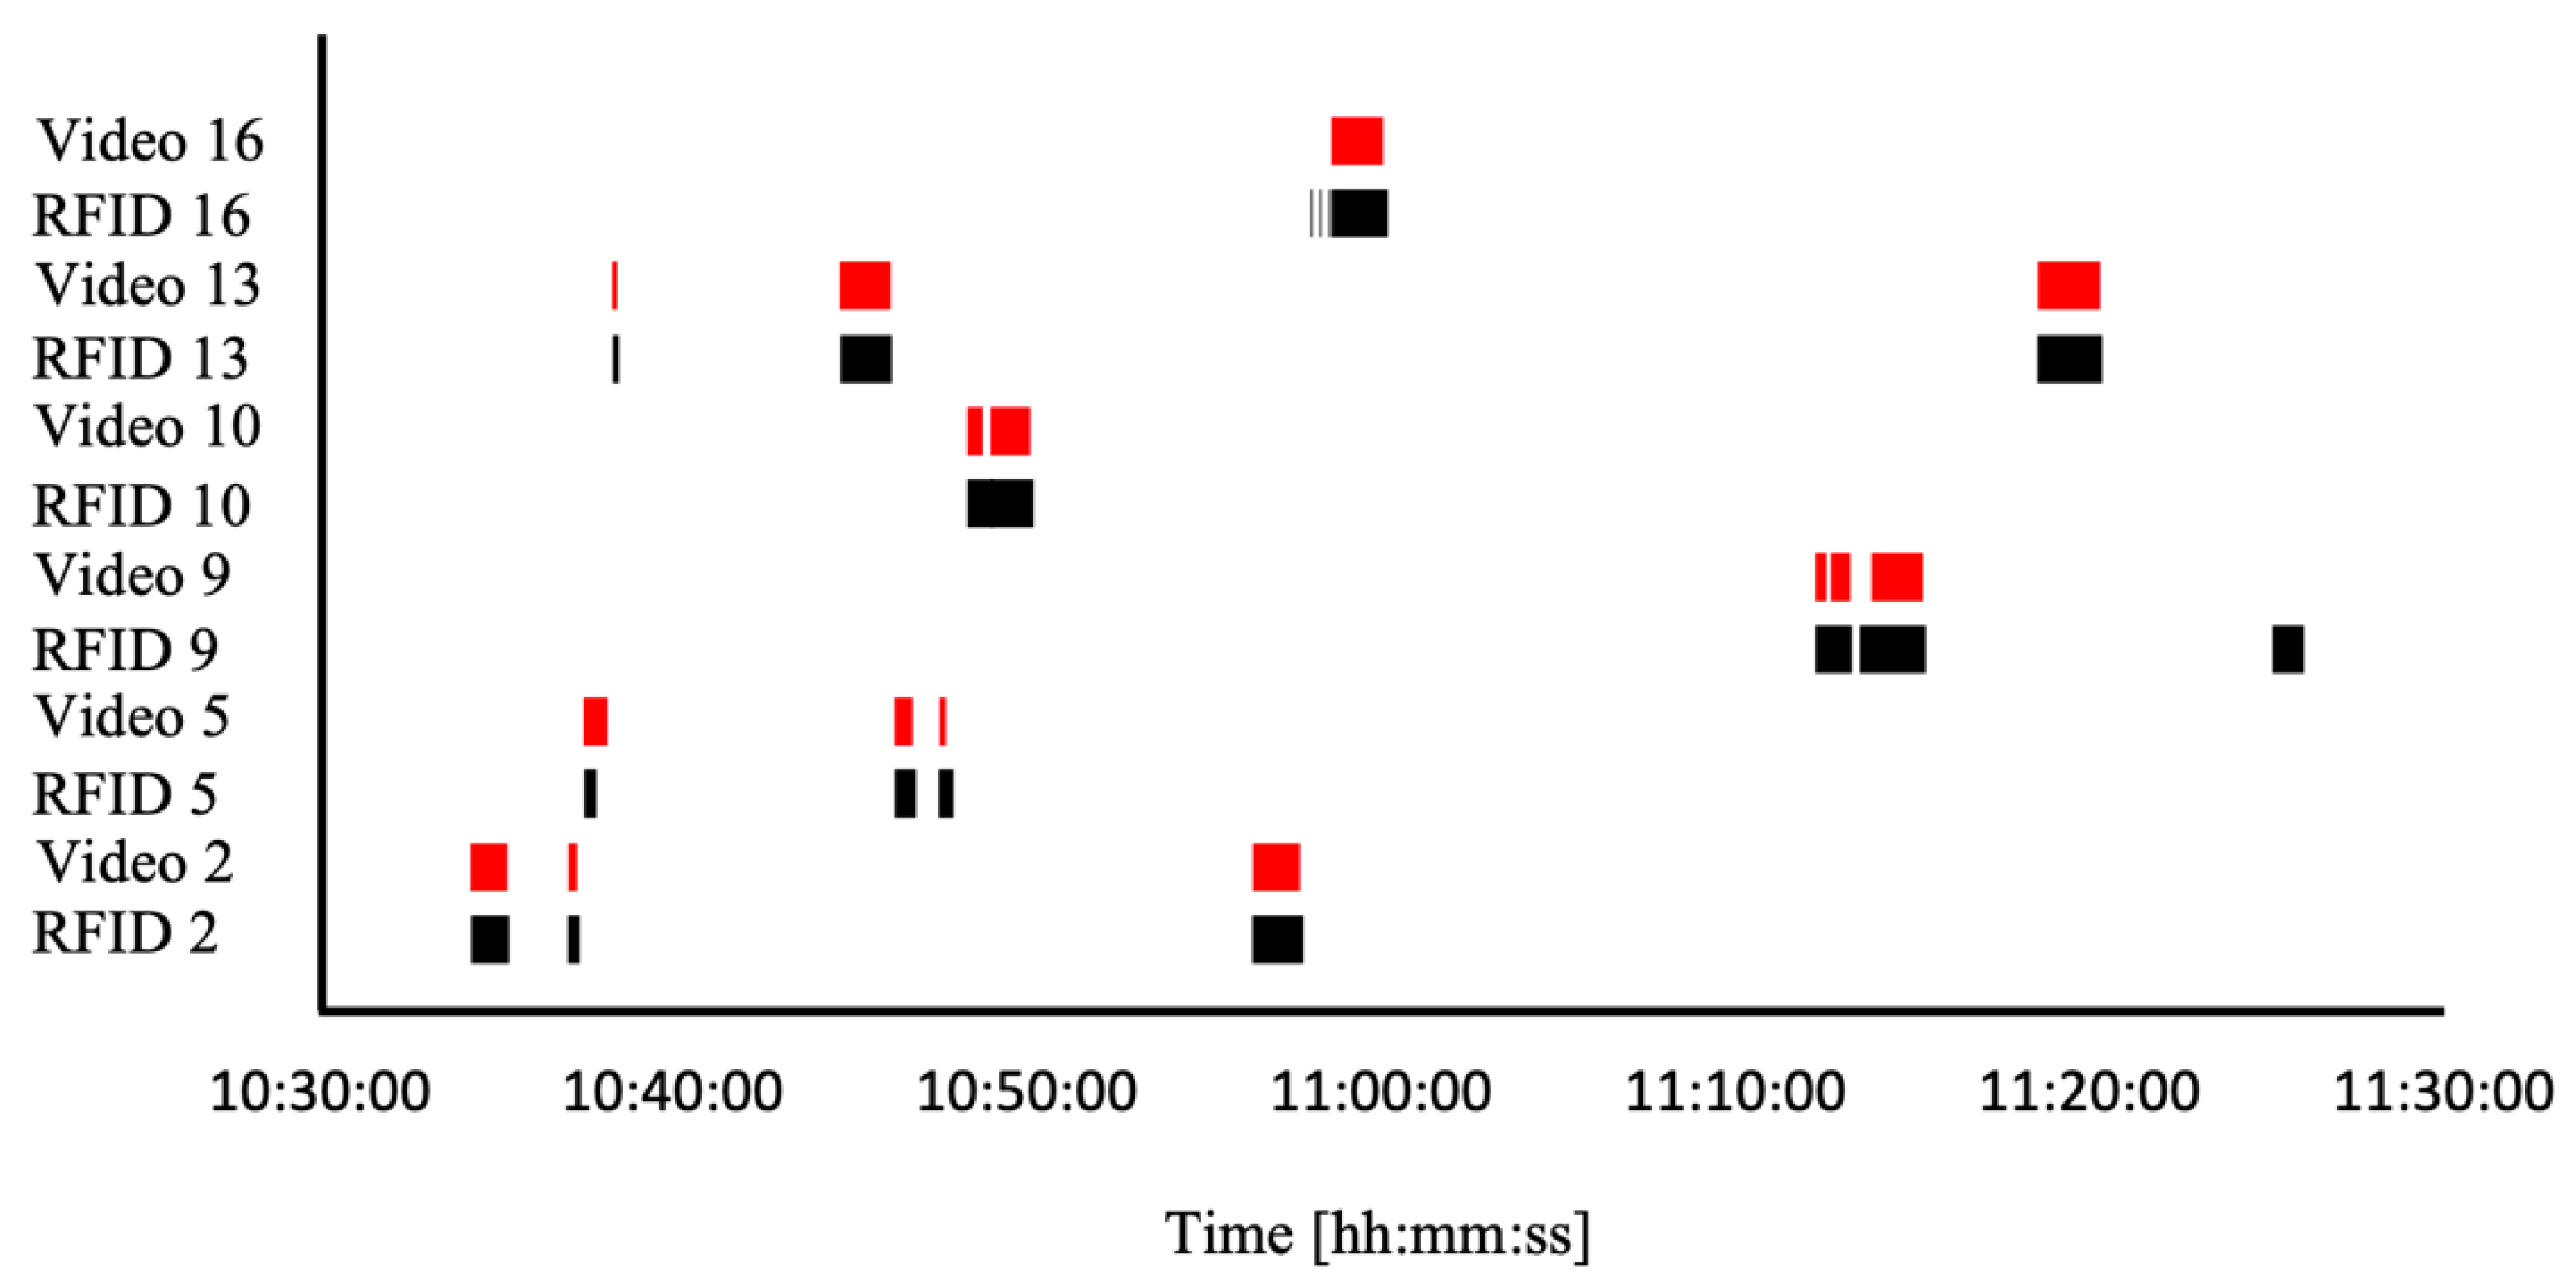
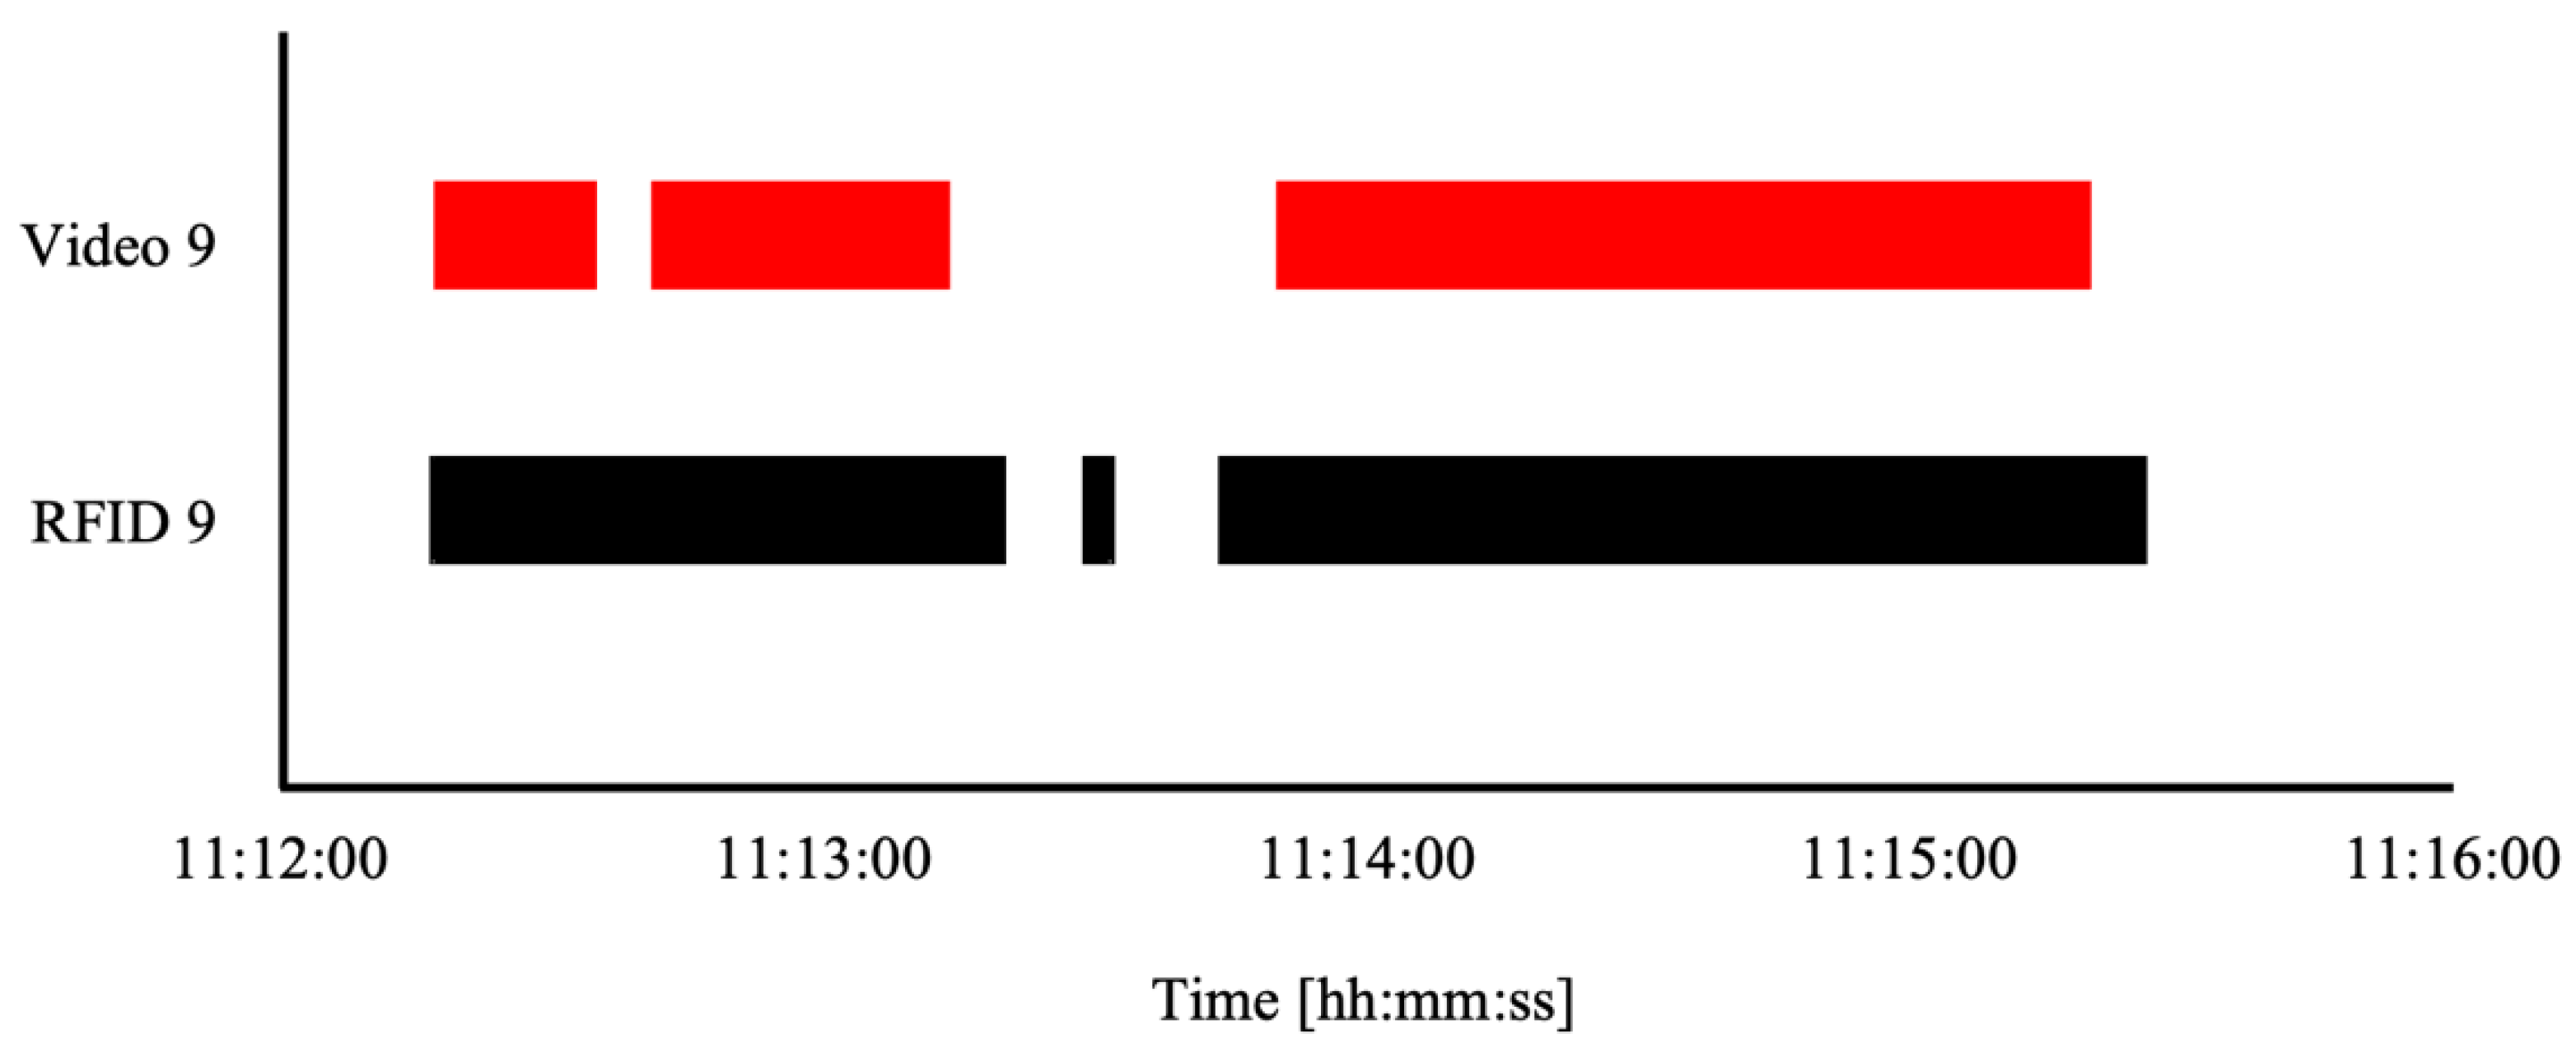
Figure 11 shows a comparison of how RFID registrations correspond to actual goose presence on the weighing system. Based on these comparisons, values for sensitivity, specificity, accuracy, and precision were calculated. The occurrences detected from the video recording are indicated in red in the graph, while the RFID registrations are indicated in black. For illustration, a time interval of 1 hour from 10:30:00 to 11:30:00 on 13/07/2021 was chosen for geese 3, 5, 10, 9, 13, and 16. In the video evaluation, only instances where the goose stood with both feet on the weighing board were considered positive results. This caused falsely positive results in RFID registration, for example, when the goose stood on the weighing board with only one foot. This case occurred, for example, with goose number 10, where it is evident that the goose left the weighing chamber at 10:48:44 and returned at 10:48:57. Nevertheless, the RFID antenna continued to register her absence for 13 s. The opposite case occurred with goose number 5, who, according to the video recording, arrived at the weighing board at 10:37:27 and left at 10:38:07. According to RFID registrations, the goose arrived at the weighing board at 10:37:28 and left at 10:37:46. It is evident that the goose was on the weighing board; however, the RFID antenna did not detect it. This case could have occurred due to shading, manufacturing quality, or incorrect placement of the RFID tag.
Figure 10. Comparison of correlation between RFID registrations and actual goose presence on the weighing system for geese 3, 5, 9, 10, 13, and 16.
Preprints 92765 g011
Figure 12 provides a detailed comparison of RFID registrations and actual occurrences from the video recording of goose number 9. It is evident from the graph that, although the goose left the weighing system twice, the RFID antenna continued to detect its RFID tag. The RFID antenna detected the tag because the goose was standing at the edge of the weighing chamber. However, the recorded weight results using the software after reading the RFID tag did not correspond to reality. This incorrect result can subsequently be eliminated by removing weight values that are not realistic for the specific age of the goose.
Figure 11. Detail comparison of correlation between RFID registrations and actual goose presence on the weighing system for goose number 9.
Preprints 92765 g012
Figure 13 shows linear regression for the dependence of RFID registrations on the time the geese spent on the weighing system. The time the geese spent on the weighing system is deduced from the video recording. The values were obtained from the monitored period from 9:00:00 to 17:00:00 on 13/07/2021. The total number of RFID registrations was 1 110. The coefficient of determination for all geese was R2 = 0.9813 with the regression equation of y = 0.3272 x .
Figure 12. The linear regression for the dependence of the number of RFID registrations on the time the geese spent on the weighing system with the coefficient of determination of R2 = 0.9813 and the regression equation of y = 0.3272 x .
Preprints 92765 g013

3.3. The weather station

The Husa v. 1.2.0.0 software allowed for recording data upon detection of a goose's RFID tag when it approached the weighing system. Table 3 presents the data collection results for a single RFID registration for goose number 1 on 09/08/2023 at 12:36:31. On 09/082023, goose number 1 approached the weighing system five times. One of the visits occurred from 12:36:10 to 12:37:04. The time 12:36:31 was selected from this visit for illustration purposes. The table is divided into two parts. The first part displays the data obtained from the weighing system, which were saved as soon as the RFID tag of the goose was detected. The second part presents data from the weather station, saved every 5 s throughout the monitoring period.
From the table, it is evident that the data did not correspond temporally at that moment, as the time from the weighing system was recorded at 12:36:31, and the time gained from the weather station was at 12:36:28. The recorded time from the weighing system was within a five-second interval, during which the state of the surrounding environment was recorded, i.e., 12 : 36 : 28 12 : 36 : 31 < 12 : 36 : 33 . Each recorded data from the weighing system included the registration date, registration time, goose RFID code, the average weight value from 15 measurements taken every 0.2 s, and the voltage from the photoresistor. The photoresistor was connected to the circuit as a voltage divider. Therefore, the obtained data were in voltage values. The photoresistor was calibrated based on its wiring before being implemented into the experiment under laboratory conditions. After calibration, a calibration curve was determined, enabling light intensity calculation from the obtained voltage. The equation of the calibration curve was:
E = 295.81 · U 2.55
From the table, it is clear that on 09/08/2021 at 12:36:31, goose number 1 was detected using the RFID code E2 80 11 60 60 00 02 07 86 ED E8 5D, with an average weight of 7.279 kg. At that moment, the voltage from the photoresistor, located in the sheltered part of the enclosure, was measured at 0.481 V, corresponding to a light intensity of 1912.24 lux. This RFID registration was associated with a record from the weather station on 09/08/2021 at 12:36:28, with a measurement ID of 13375. According to the record, there was no precipitation. In case of rain, data from the rain gauge would accumulate based on the number of tip-overs. The anemometer determined a wind speed of 4.16 m/s, and the anemoscope's direction was 270°. The initial position of the anemoscope (0°) was directed north. Therefore, a direction of 270° corresponded to the anemoscope's orientation towards the west. The air humidity was 57.8%, the dew point was 14.5°C, and the temperature was 22.5°C.

4. Discussion

In this study, an IoT system was developed to monitor growth characteristics and physiological changes in individual geese in a non-invasive manner. The key element of the IoT system was the use of RFID technology, which is often aimed at large livestock, especially cows [28,29] and pigs [5,23,25,30]. However, research has already been conducted that focused on small livestock. RFID technology has been used to monitor chickens [9], which are given the greatest attention in poultry. In our study, the attendance of the domestic goose at the feeding site was monitored using UHF RFID technology. The designed system demonstrated high efficiency. The effectiveness of the proposed system was determined by parameters such as sensitivity, specificity, accuracy, and precision obtained by comparing RFID registrations with video recordings. Maselyne et al., in 2014 [31], using the HF RFID system, achieved a sensitivity of 88.58% and a specificity of 98.34% in pig breeding, and in 2016, a sensitivity of registrations of 99.3%, a specificity of 96.1% and an accuracy of 77.6%. Adrion et al., (2018) [25] obtained an average sensitivity of 49.7%, specificity of 99.0% and accuracy of 97.9% using UHF RFID in pig breeding. When evaluating the entire system in our study, where, as in Adrion et al., (2018) [25], UHF RFID was used, the sensitivity was 93.87%, specificity was 99.94%, accuracy was 99.85%, and precision was 95.09%. These high-performance parameter values may have been achieved by choosing a good placement of the RFID antenna on the left side of the weighing system and positioning the RFID tag on the goose's left leg, preventing signal shielding through appropriate tag and antenna placement.
The value added of the proposed system with RFID in our study was the placement of the RFID antenna on the weighing system at the feeding point, thereby determining the weight values that were assigned to the exact goose according to the serial number of the RFID tag. The feedstuff then served as an incentive for the geese to regularly visit the area of the weighing system. The advantage of this system was that, according to the radio frequency identification, the goose was easily recognised, and its weight was subsequently assigned to the recognised goose. This system made it possible to detect weight gains in individual geese without the necessary interaction with a human, which results in the elimination of an excessive stress factor, due to which food intake is reduced. From the graph in Table 1, regular slight decreases in weight during the monitored period are evident. These declines appeared after the animal's health checks.
Our study analysed the relationship between the feeding time, i.e., the time when the goose was registered using RFID, and the weight gain. As part of this analysis, two weeks of monitoring were compared, namely the first and approximately the sixth week. The results showed that in both compared weeks, the weight gains did not correspond to the time they spent at the feeding place. In the first week, goose number 2 had the highest weight gain value of 1.011 kg, while the time it spent on the weighing system was 1102. The range of average times for that week was from 562 s to 1995 s with an average value of 1052 s. Therefore, it is possible to say that the time the goose spent on the weighing system was rather average. The lowest value of weight gain was for goose number 7, with a value of 0.234 kg, and its average time spent on the scale was 942 s. Again, it was rather an average value of time. The same conclusions can be drawn from the second week of observation as well. At the same time, the non-relationship between the time spent on the weighing system with feeding and weight gain was supported by the results of the linear regression test for both weeks. In the first monitored week, the coefficient of determination R2 = 0.0242, and in the sixth week R2 = 0.0001 was found. Spending a long time in the feeding and weighing area without significant weight gain could be an indication that the animal was resting on the weighing system. It is also necessary to consider the possible stress that prolongs the feeding process. According to Maselyne, et al. (2016) [5] long visits and also frequent visits could be an indicator of the animal being chased away and the animal being disturbed by other animals.
Intermittent weight changes in the measured animals were observed during data processing. These changes could be attributed to either a measurement system error or the movement of live animals during weighing. Variations in weight could also be caused by stress factors, the goose's daily routine, and the feeding timing. After food intake, the goose's weight might increase abruptly.
Xue et al., (2023) [9] used UHF RFID to locate the exact position of chickens. The study was focused on monitoring within the framework of cage breeding, while the accuracy within a cage with dimensions of 40 x 40 cm was based on 88.74%. In our study, the proposed RFID system did not monitor the movement of geese within the entire housing but was only used to detect geese on the weighing system. A UHF RFID reader module, Chainway UR4, with four channels, was used for RFID detection. In this study, only one channel was utilised. After system expansion, the remaining three channels could be employed to monitor animal movement in specific areas of the rearing space and record passage. The entire system can be conceptualised based on triangulation measurement of animal movement. However, in the UHF RFID concept, it would be necessary to assess the suitability of use due to potential signal suppression by the animal's body and the reason for the dimensions of the stables, which were 5x13 m, within the framework of open breeding.
A precise rearing system was employed in this study, providing information about the farm's benefits and enabling the provision of comfort for the reared animals. These aspects lead to improved animal welfare with possible prediction and diagnosis of potential animal illnesses. There are many studies with significant results that are situated in indoor or cage farms [9]. The created IoT system was able to monitor physiological changes in animals and, at the same time, changes in the surrounding environment in open outdoor breeding. The results obtained from the IoT system for monitoring changes in the surrounding environment enable predictions of the need to replenish water and feed based on precipitation levels. For instance, if there were insufficient rainfall, potentially leading to drought and subsequent vegetation loss, the geese would be unable to graze. Consequently, the geese's feed quantities would need to be increased. In this study, it was observed that the time spent on the weighing system with feeding in the seventh week of monitoring was 19.99% lower compared to the first week of monitoring, corresponding to the fifth week of the goose's life. The developed IoT system allows farmers to monitor and provide information about feeding frequency in relation to the goose's age.

5. Conclusions

In this study, an IoT system was developed, capable of contactless monitoring growth characteristics and physiological changes in individual geese. The created monitoring system allows for the observation of geese feeding behaviour and growth parameters while at the same time monitoring changes in the surrounding environment. The proposed system allowed for non-stressful monitoring of weight changes in geese, enabling the prediction of health issues in animals. A system designed in this way can lead to breeding that allows an even increase in the animal's weight without excessive weight fluctuations caused by stress factors. When evaluating the UHF RFID system, the results showed a sensitivity of 93.87%, specificity of 99.94%, accuracy of 99.85%, and precision of 95.09%. Regression analysis revealed a good correlation between observed feeding and RFID registrations at the monitored time with a determination coefficient of R2 = 0.9813. The study's outcome was a smart farm aligned with the production and technical cycles of food production in a circular economy within Agriculture 4.0.

Author Contributions

Conceptualization, R.CH.; methodology, M.L.; software, M.L.; validation, M.L, J.K. and B.Č.; formal analysis, M.L., J.K. and B.Č.; investigation, M.L. and J.K.; resources, O.K.; data curation, B.Č. and J.K.; writing—original draft preparation, B.Č., J.K., M.L. and M.H.; writing—review and editing, B.Č, J.K., M.H. and O.K.; visualization, B.Č. and M.H.; supervision, R.CH. project administration, R.CH. and M.L.; funding acquisition, J.K., M.L., M.H. All authors have read and agreed to the published version of the manuscript.

Funding

This research was funded by internal grant agency of Faculty of Engineering, grant number IGA 2021: 31160/1312/3116 and IGA 2022: 31160/1312/3112 Czech University of Life Sciences Prague.

Institutional Review Board Statement

The whole study was carried out in harmony with the guidelines of Act No. 246/1992, which directs the protection against animal cruelty.

Data Availability Statement

The data presented in this study are available by reasonable request from the corresponding author.

Conflicts of Interest

The authors declare no conflict of interest. The funders had no role in the design of the study; in the collection, analyses, or interpretation of data; in the writing of the manuscript; or in the decision to publish the results.

References

  1. Bortoň, L.; Štolcová, M. Tools of Precision Agriculture in Dairy Cattle Farms (Nástroje Precizního Zemědělství v Chovech Dojeného Skotu). 2019.
  2. Zhang, Y.; Ge, Y.; Yang, T.; Guo, Y.; Yang, J.; Han, J.; Gong, D.; Miao, H. An IoT-Based Breeding Egg Identification and Coding System for Selection of High-Quality Breeding Geese. Animals 2022, 12. [Google Scholar] [CrossRef] [PubMed]
  3. Vázquez Diosdado, J.A.; Barker, Z.E.; Hodges, H.R.; Amory, J.R.; Croft, D.P.; Bell, N.J.; Codling, E.A. Classification of Behaviour in Housed Dairy Cows Using an Accelerometer-Based Activity Monitoring System. Anim. Biotelemetry 2015, 3. [Google Scholar] [CrossRef]
  4. Brahim, A.; Malika, B.; Rachida, A.; Mustapha, L.; Mehammed, D.; Mourad, L. Dairy Cows Real Time Behavior Monitoring by Energy-Efficient Embedded Sensor. In Proceedings of the 2020 2nd International Conference on Embedded and Distributed Systems, EDiS 2020; Institute of Electrical and Electronics Engineers Inc., November 3 2020; pp. 21–26. [CrossRef]
  5. Maselyne, J.; Saeys, W.; Briene, P.; Mertens, K.; Vangeyte, J.; De Ketelaere, B.; Hessel, E.F.; Sonck, B.; Van Nuffel, A. Methods to Construct Feeding Visits from RFID Registrations of Growing-Finishing Pigs at the Feed Trough. Comput. Electron. Agric. 2016, 128, 9–19. [Google Scholar] [CrossRef]
  6. Tran, D.N.; Nguyen, T.N.; Khanh, P.C.P.; Tran, D.T. An IoT-Based Design Using Accelerometers in Animal Behavior Recognition Systems. IEEE Sens. J. 2022, 22, 17515–17528. [Google Scholar] [CrossRef]
  7. Lahlouh, I.; Rerhrhaye, F.; Elakkary, A.; Sefiani, N. Experimental Implementation of a New Multi Input Multi Output Fuzzy-PID Controller in a Poultry House System. Heliyon 2020, 6, e04645. [Google Scholar] [CrossRef] [PubMed]
  8. Ojo, R.O.; Ajayi, A.O.; Owolabi, H.A.; Oyedele, L.O.; Akanbi, L.A. Internet of Things and Machine Learning Techniques in Poultry Health and Welfare Management: A Systematic Literature Review. Comput. Electron. Agric. 2022, 200, 107266. [Google Scholar] [CrossRef]
  9. Xue, H.; Li, L.; Wen, P.; Zhang, M. A Machine Learning-Based Positioning Method for Poultry in Cage Environments. Comput. Electron. Agric. 2023, 208, 107764. [Google Scholar] [CrossRef]
  10. Hewson, C.J. What Is Animal Welfare? Common Definitions and Their Practical Consequences. Can. Vet. J. = La Rev. Vet. Can. 2003, 44, 496–499. [Google Scholar]
  11. Sitaram, K.A.; Ankush, K.R.; Anant, K.N.; Raghunath, B.R. IoT Based Smart Management of Poultry Farm and Electricity Generation. 2018 IEEE Int. Conf. Comput. Intell. Comput. Res. ICCIC 2018 2018. [CrossRef]
  12. Obeidat, H.; Shuaieb, W.; Obeidat, O.; Abd-Alhameed, R. A Review of Indoor Localization Techniques and Wireless Technologies. Wirel. Pers. Commun. 2021, 119, 289–327. [Google Scholar] [CrossRef]
  13. Denis, S.; Berkvens, R.; Weyn, M. A Survey on Detection, Tracking and Identification in Radio Frequency-Based Device-Free Localization. Sensors 2019, 19, 5329. [Google Scholar] [CrossRef] [PubMed]
  14. Nirjon, S.; Liu, J.; DeJean, G.; Priyantha, B.; Jin, Y.; Hart, T. COIN-GPS: Indoor Localization from Direct GPS Receiving. In Proceedings of the MobiSys 2014 - Proceedings of the 12th Annual International Conference on Mobile Systems, Applications, and Services; 2014; pp. 301–314. [CrossRef]
  15. Hu, G.; Zhang, W.; Wan, H.; Li, X. Improving the Heading Accuracy in Indoor Pedestrian Navigation Based on a Decision Tree and Kalman Filter. Sensors 2020, 20, 1578. [Google Scholar] [CrossRef]
  16. Diaz, E.M.; Ahmed, D.B.; Kaiser, S. A Review of Indoor Localization Methods Based on Inertial Sensors. Geogr. Fingerprinting Data Position. Navig. Syst. Challenges, Exp. Technol. Roadmap, 2018; 311–333. [Google Scholar] [CrossRef]
  17. Popleteev, A. Indoor Localization Using Ambient FM Radio RSS Fingerprinting: A 9-Month Study. IEEE CIT 2017 - 17th IEEE Int. Conf. Comput. Inf. Technol. 2017, 128–134. [CrossRef]
  18. Kimoto, R.; Ishida, S.; Yamamoto, T.; Tagashira, S.; Fukuda, A. MuCHLoc: Indoor ZigBee Localization System Utilizing Inter-Channel Characteristics. Sensors 2019, 19, 1645. [Google Scholar] [CrossRef] [PubMed]
  19. Xie, T.; Jiang, H.; Zhao, X.; Zhang, C. A Wi-Fi-Based Wireless Indoor Position Sensing System with Multipath Interference Mitigation. Sensors 2019, 19, 3983. [Google Scholar] [CrossRef]
  20. Bloch, V.; Pastell, M. Monitoring of Cow Location in a Barn by an Open-Source, Low-Cost, Low-Energy Bluetooth Tag System. Sensors 2020, 20, 3841. [Google Scholar] [CrossRef]
  21. Ingabire, W.; Larijani, H.; Gibson, R.M.; Qureshi, A.-U.-H. LoRaWAN Based Indoor Localization Using Random Neural Networks. Information 2022, 13, 303. [Google Scholar] [CrossRef]
  22. Brown-Brandl, T.M.; Maselyne, J.; Adrion, F.; Kapun, A.; Hessel, E.F.; Saeys, W.; Van Nuffel, A.; Gallmann, E. Comparing Three Different Passive RFID Systems for Behaviour Monitoring in Grow-Finish Pigs. In Proceedings of the Precision Livestock Farming 2017 - Papers Presented at the 8th European Conference on Precision Livestock Farming, ECPLF 2017; 2017; pp. 622–631.
  23. de Bruijn, B.G.C.; de Mol, R.M.; Hogewerf, P.H.; van der Fels, J.B. A Correlated-Variables Model for Monitoring Individual Growing-Finishing Pig’s Behavior by RFID Registrations. Smart Agric. Technol. 2023, 4, 100189. [Google Scholar] [CrossRef]
  24. Brown-Brandl, T.M.; Adrion, F.; Gallmann, E.; Eigenberg, R. Development and Validation of a Low-Frequency RFID System for Monitoring Grow-Finish Pig Feeding and Drinking Behavior.; American Society of Agricultural and Biological Engineers (ASABE), September 21 2018.
  25. Adrion, F.; Kapun, A.; Eckert, F.; Holland, E.M.; Staiger, M.; Götz, S.; Gallmann, E. Monitoring Trough Visits of Growing-Finishing Pigs with UHF-RFID. Comput. Electron. Agric. 2018, 144, 144–153. [Google Scholar] [CrossRef]
  26. Li, L.; Zhao, Y.; Oliveira, J.; Verhoijsen, W.; Liu, K.; Xin, H. A UHF RFID System for Studying Individual Feeding and Nesting Behaviors of Group-Housed Laying Hens. Trans. ASABE 2017, 60, 1337–1347. [Google Scholar] [CrossRef]
  27. Krunt, O.; Kraus, A.; Zita, L.; Machová, K.; Chmelíková, E.; Petrásek, S.; Novák, P. The Effect of Housing System and Gender on Relative Brain Weight, Body Temperature, Hematological Traits, and Bone Quality in Muscovy Ducks. Anim. 2022, Vol. 12, Page 370 2022, 12, 370. [Google Scholar] [CrossRef]
  28. Adrion, F.; Keller, M.; Bozzolini, G.B.; Umstatter, C. Setup, Test and Validation of a UHF RFID System for Monitoring Feeding Behaviour of Dairy Cows. Sensors (Switzerland) 2020, 20, 1–19. [Google Scholar] [CrossRef]
  29. Hammer, N.; Pfeifer, M.; Staiger, M.; Adrion, F.; Gallmann, E.; Jungbluth, T. Cost-Benefit Analysis of an UHF-RFID System for Animal Identification, Simultaneous Detection and Hotspot Monitoring of Fattening Pigs and Dairy Cows. Landtechnik 2017, 72, 130–155. [Google Scholar] [CrossRef]
  30. Kapun, A.; Adrion, F.; Gallmann, E. Case Study on Recording Pigs’ Daily Activity Patterns with a Uhf-Rfid System. Agric. 2020, 10, 1–14. [Google Scholar] [CrossRef]
  31. Maselyne, J.; Saeys, W.; De Ketelaere, B.; Mertens, K.; Vangeyte, J.; Hessel, E.F.; Millet, S.; Van Nuffel, A. Validation of a High Frequency Radio Frequency Identification (HF RFID) System for Registering Feeding Patterns of Growing-Finishing Pigs. Comput. Electron. Agric. 2014, 102, 10–18. [Google Scholar] [CrossRef]
Table 1. Results of weight gain for goose number 4 during monitoring and relevant data from the indicated occurrence.
Geese number 4 Date: 13/07/2021 (8th week)
RFID tag code: E2 80 11 60 60 00 02 07 86 ED 9B 1C Time: 09:45:12
Preprints 92765 i001 Preprints 92765 i002
Table 2. The results from the weighing system and the results of validation parameters for individual geese.
Geese number Initial weight Final weight Weight gain Number of registrations Percent ** Sensitivity Specificity Accuracy Precision
1 3.45 7.40 3.96 15 348 1.02% 100.00% 99.94% 99.94% 96.36%
2 3.90 7.83 3.93 18 885 1.26% 82.40% 99.90% 99.46% 80.33%
3 4.23 8.01 3.78 19 170 1.28% 96.42% 99.95% 99.90% 97.00%
4 3.97 5.88 1.91 19 339 1.29% 99.72% 99.97% 99.97% 98.50%
5 4.40 7.55 3.15 18 462 1.24% 70.14% 99.96% 99.57% 92.50%
6 2.95 4.84 * 1.89 7 598 0.49% 100.00% 99.96% 99.96% 92.47%
7 3.30 6.14 2.85 18 276 1.22% 100.00% 99.96% 99.96% 94.72%
8 3.87 8.35 4.48 15 740 1.06% 92.51% 99.90% 99.79% 92.70%
9 4.03 7.96 3.93 20 764 1.38% 98.44% 99.85% 99.81% 93.92%
10 3.68 7.49 3.82 11 709 0.78% 99.70% 99.94% 99.94% 94.57%
11 3.39 5.97 2.58 10 772 0.72% 96.87% 99.99% 99.93% 99.36%
12 3.56 7.95 4.39 19 980 1.33% 93.74% 99.95% 99.77% 98.11%
13 3.73 7.85 4.13 24 518 1.64% 78.03% 99.99% 99.49% 99.48%
14 3.97 6.69 2.71 11 372 0.75% 96.04% 99.95% 99.91% 94.79%
15 3.76 6.21 2.45 10 417 0.69% 99.38% 99.93% 99.92% 95.41%
16 3.50 6.95 3.46 13 406 0.90% 100.00% 99.96% 99.96% 97.44%
17 3.10 6.49 3.39 12 249 0.81% 99.31% 99.96% 99.95% 97.30%
18 3.70 7.02 3.32 13 028 0.87% 87.94% 99.94% 99.80% 94.25%
19 2.72 5.82 3.10 13 984 0.93% 98.45% 99.96% 99.94% 96.95%
20 3.31 7.42 4.11 15 027 1.00% 98.51% 99.95% 99.93% 97.55%
21 3.34 6.48 3.14 13 633 0.91% 99.31% 99.92% 99.91% 94.49%
* The RFID tag of goose number 6 broke on 06/08/2021. ** The percentage of time spent on the weighing system during the monitored period.
Table 3. Data recorded and processed in Husa v. 1.2.0.0 software, obtained after RFID registration.
Weighing system
Date [dd.mm.yy] Time [hh:mm:ss] RFID code number Average mass [kg] Photoresistor [V] Illumination intensity [lux]
09/08/2021 12:36:31 E2 80 11 60 60 00 02 07 86 ED E8 5D 7.279 0.481 1912.24
Weather station
Date [dd.mm.yy] Time [hh:mm:ss] Measurement ID Precipitation [mm] Wind   velocity   [ m s ] Direction [°] Humidity [%] Dew point [°C] Temperature [°C]
09/08/2021 12:36:28 13375 0 4.16 270 57.8 14.5 22.5
Disclaimer/Publisher’s Note: The statements, opinions and data contained in all publications are solely those of the individual author(s) and contributor(s) and not of MDPI and/or the editor(s). MDPI and/or the editor(s) disclaim responsibility for any injury to people or property resulting from any ideas, methods, instructions or products referred to in the content.
Copyright: This open access article is published under a Creative Commons CC BY 4.0 license, which permit the free download, distribution, and reuse, provided that the author and preprint are cited in any reuse.
Prerpints.org logo

Preprints.org is a free preprint server supported by MDPI in Basel, Switzerland.

Subscribe

© 2024 MDPI (Basel, Switzerland) unless otherwise stated