1. Introduction
Focal adhesions (FAs) represent subcellular organelles that tether cells to their extracellular matrix. Among their constituents, integrin proteins assume a prominent role. The extracellular domain of integrin engages various matrix proteins, such as collagens and laminins, while its intracellular segment interacts with a diverse array of adaptor proteins such as talin. Consequently, the integrin complex serves a conduit for sensing extracellular cues and transducing these signals into the cell, ultimately orchestrating cytoskeletal rearrangements for effective cell adhesion [
1]. While originally observed in the context of two-dimensional cell culture systems, loss-of-function studies in animal models underscore the critical role of FAs in vascular integrity. For instance, the inactivation of αv or β8 integrin subunits in mice [
2,
3], or the knockdown of talin in zebrafish, leads to cerebral hemorrhage [
4]. Furthermore, endothelial-specific depletion of FA kinase (FAK) is implicated in brain hemorrhage [
5]. Despite the wealth of research on FA biogenesis, our understanding of the regulatory mechanisms governing FA turnover remains limited.
Emerging evidence indicates that autophagy, an intracellular self-digestion system, contributes to the degradation of FAs. Under various stress conditions, autophagy is induced, initiating the formation of autophagosomes—double-membrane organelles that engulf cargo and subsequently fuse with lysosomes for cargo degradation [
6]. Intriguingly, in breast cancer cells, autophagy supports cell migration by facilitating the degradation of FA complexes [
7,
8,
9]. Notably, distinct molecular mechanisms were uncovered in different cell lines, suggesting that autophagy-mediated FA turnover is context-dependent. However, our understanding of how autophagy degrades FAs in primary cells, particularly in primary human brain endothelial cells, where FAs are recognized as pivotal regulators of vascular integrity, remains largely unexplored. Bridging this knowledge gap is critical for identifying potential therapeutic targets in the context of cerebrovascular diseases due to the loss of endothelial integrity.
Multiple rare variants in the THSD1 gene have been identified in patients with intracranial aneurysms, a cerebrovascular disorder. Loss of THSD1 led to cerebral hemorrhage in both murine and zebrafish models [
10], supporting its role in vascular integrity maintenance. Our group has further characterized THSD1 as a novel FA-associated protein, predominantly expressed in endothelial cells while being scarcely detectable in vascular smooth muscle cells [
10,
11]. However, the precise mechanisms by which THSD1 regulates endothelial FA stability have remained elusive. Our work reveals that THSD1 functions as a negative regulator of autophagy, with its loss inducing autophagy-mediated turnover of FAs in primary human brain endothelial cells. Consistently, blockade of autophagy restores FA stability, along with FA-associated cell spreading and attachment. Mechanistically, FAK, a master focal adhesion kinase, acts downstream of THSD1. Loss of THSD1 leads to reduced FAK activity, relieving its inhibitory effects on the complex formation between Beclin 1 and ATG14—a crucial event known to activate the autophagy cascade.
2. Results
Our previous investigations have established a physical interaction between THSD1 and Talin, a critical component of the integrin complex localized at FA sites [
11]. To further confirm this observation, we conducted experiments in human brain microvascular endothelial cells (HBEMCs), an
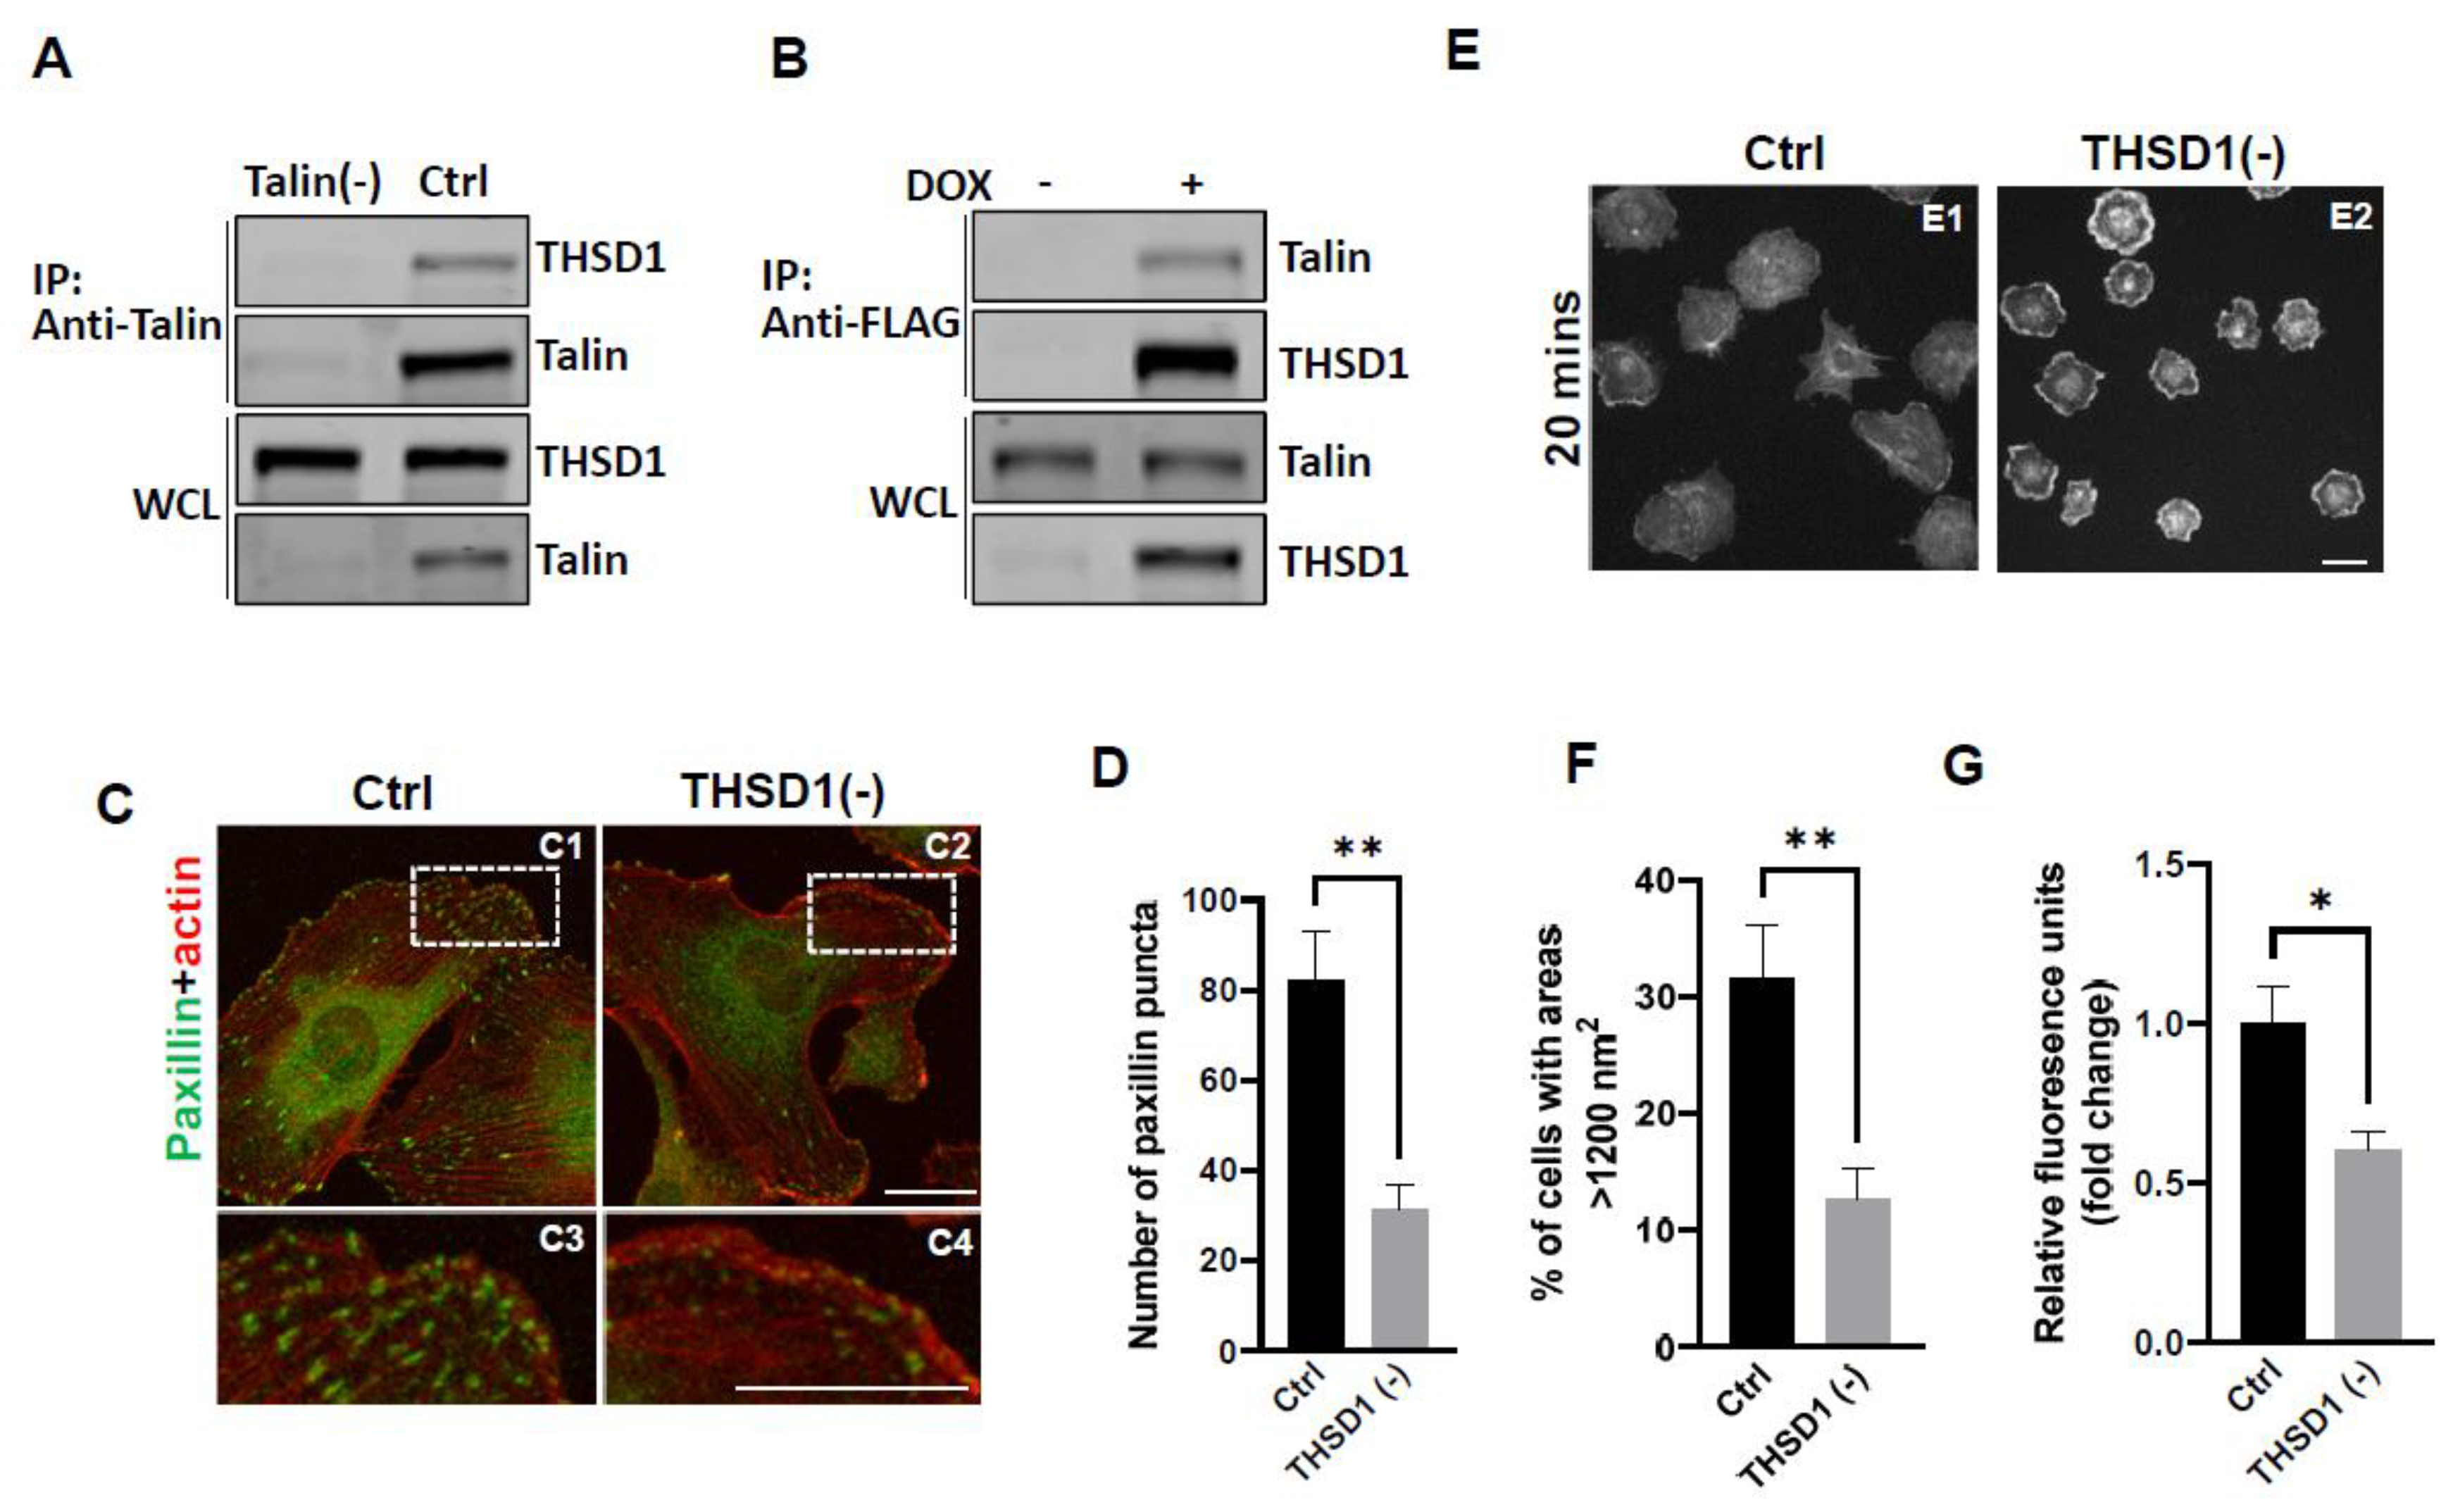
in vitro model with physiological relevance to cerebrovascular pathology. Endogenous THSD1 was detected in immunoprecipitates pulled down by anti-Talin antibody but was absent in Talin-deficient cells (as shown in the first and second lane of
Figure 1A). Likewise, we performed a reciprocal co-immunoprecipitation, demonstrating that Talin could be pulled down by anti-FLAG antibody only when THSD1-FLAG was expressed (
Figure 1B). These findings support our hypothesis that THSD1 modulates the stability of FAs in brain endothelial cells. To further test this hypothesis, we conducted loss-of-function analyses using small interfering RNAs (siRNAs). Depletion of THSD1 resulted in a significant reduction in the number of FAs, as indicated by immunofluorescent staining with paxillin antibodies (shown in green) in HBMECs (
Figure 1C, comparing C3 to C4, and grey to black bars in
Figure 1D). Similar results were observed when using zyxin, another marker predominantly identifying mature FAs (
Supplemental Figure S1A-B). The diminished stability of FAs is often associated with impaired cell spreading, as this process relies on interactions between FAs and the extracellular matrix [
12]. Indeed, our results demonstrated compromised cell spreading in THSD1-deficient endothelial cells, with a notable reduction in the percentage of cells exhibiting an area exceeding 1200 nm
2 within 20 minutes after reseeding (
Figure 1E, and comparison of grey to black bars in
Figure 1F). Additionally, we observed a significant reduction in cell attachment ability in THSD1-deficient cells, as assessed by relative fluorescence units correlated with the total number of cells remaining attached to the pre-coated collagen IV matrix (
Figure 1G). Collectively, these data suggest that THSD1 negatively modulates FA stability, cell spreading, and attachment.
To elucidate the mechanisms through which THSD1 downregulates FAs, we performed quantitative polymerase chain reaction (qPCR) analyses on the mRNA level of paxillin and zyxin. As shown in
Supplemental Figure S2, there were no discernible changes in the mRNA levels of paxillin or zyxin following THSD1 depletion, indicating that THSD1 may not directly regulate the transcription of these FA genes in brain endothelial cells. Given that paxillin and zyxin mRNA levels remained unchanged after THSD1 knockdown, we investigated how THSD1 impacts their protein stability. It is well-established that both autophagy and the ubiquitin-proteasome system play crucial roles in regulating protein stability by influencing turnover rates [
13,
14,
15]. To assess the involvement of THSD1 in these degradation pathways, we conducted autophagy flux analyses based on GFP-LC3 puncta formation, along with protein ubiquitination assays as we did previously [
16]. LC3 serves as an autophagosomal marker, and GFP-LC3 can be used to monitor autophagic activity. Under conditions of starvation, we observed an increased number of GFP-LC3 puncta (comparison of A2 to A1 in
Supplemental Figure S3A, and black bars in
3B). This effect was mitigated upon the knockdown of the essential autophagy gene, ATG5 (comparison of A4 to A2 in
Supplemental Figure S3A, and grey to black bars in
3B). These data validated the sensitivity and specificity of brain endothelial cells in response to autophagy stimuli.
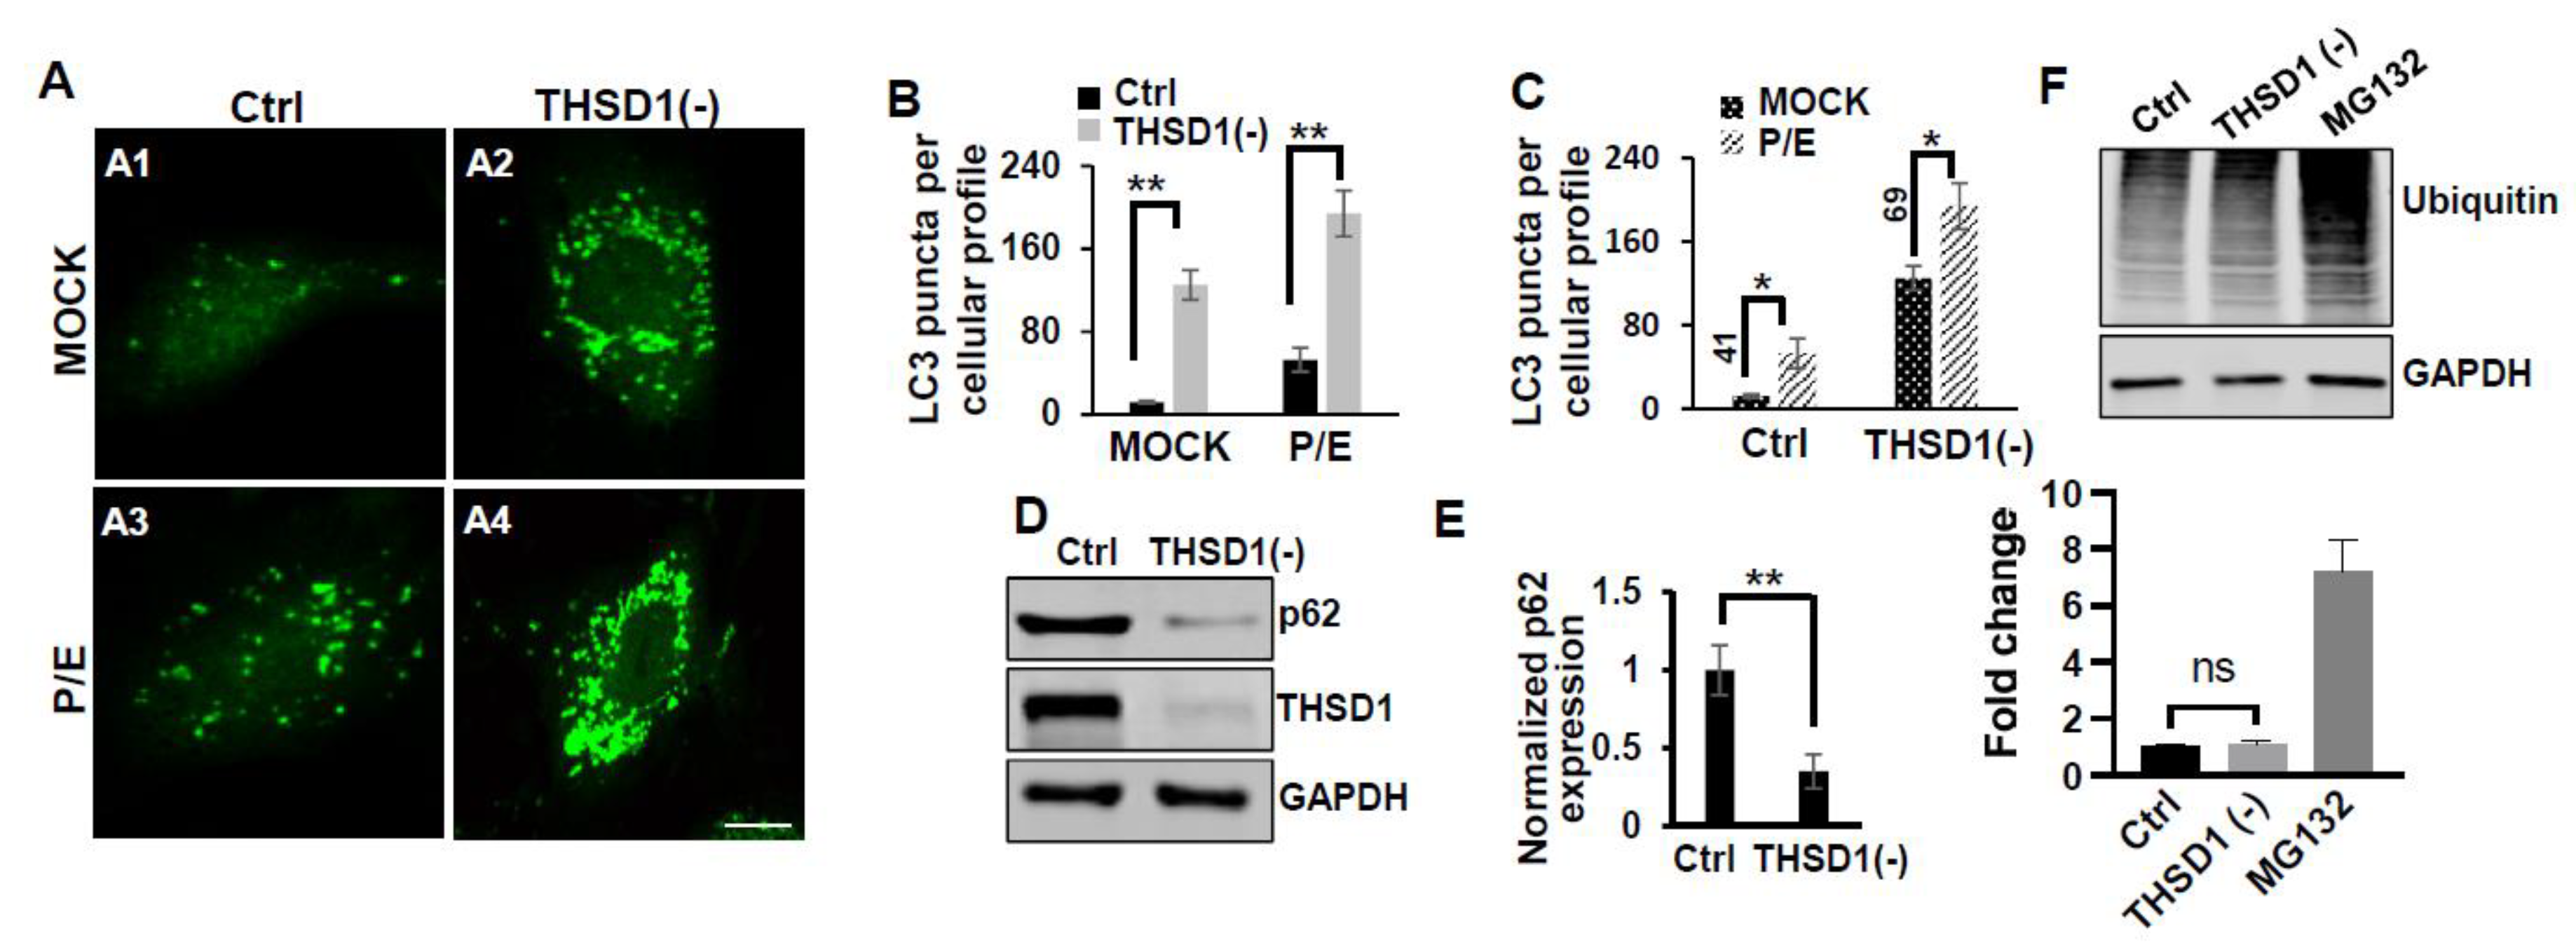
Notably, THSD1 knockdown resulted in an increased number of green puncta in this reporter cell line (comparison of A2 to A1 in
Figure 2A and grey to black bars in 2B). This phenotype may result from either autophagy induction or compromised autophagic degradation that is otherwise indicative of reduced autophagic flux. To distinguish between these possibilities, we conducted standard flux analyses using Pepstatin/E-64D (P/E), two protease inhibitors commonly used to prevent cargo degradation within autolysosomes [
17]. Our results indicated that autophagic degradation remained unimpaired, as evidenced by a further increase in the number of GFP-LC3 puncta with P/E treatment in both control and THSD1-deficient cells (comparison of A3 to A1, and A4 to A2 in
Figure 2A, quantification depicted in
Figure 2B,C). In line with these findings, a cargo-based endpoint autophagy assay revealed a significant reduction in the level of p62, a bona-fide autophagy substrate, in THSD1-deficient cells (
Figure 2D-2E). Altogether, our data compellingly support the notion that THSD1 exerts a negative regulatory influence on autophagy in endothelial cells. Conversely, the overall level of protein ubiquitination remained unaltered following THSD1 knockdown, in comparison with the significant accumulation of ubiquitinated substrates in cells treated with MG132, a well-established proteasome inhibitor (
Figure 2F).
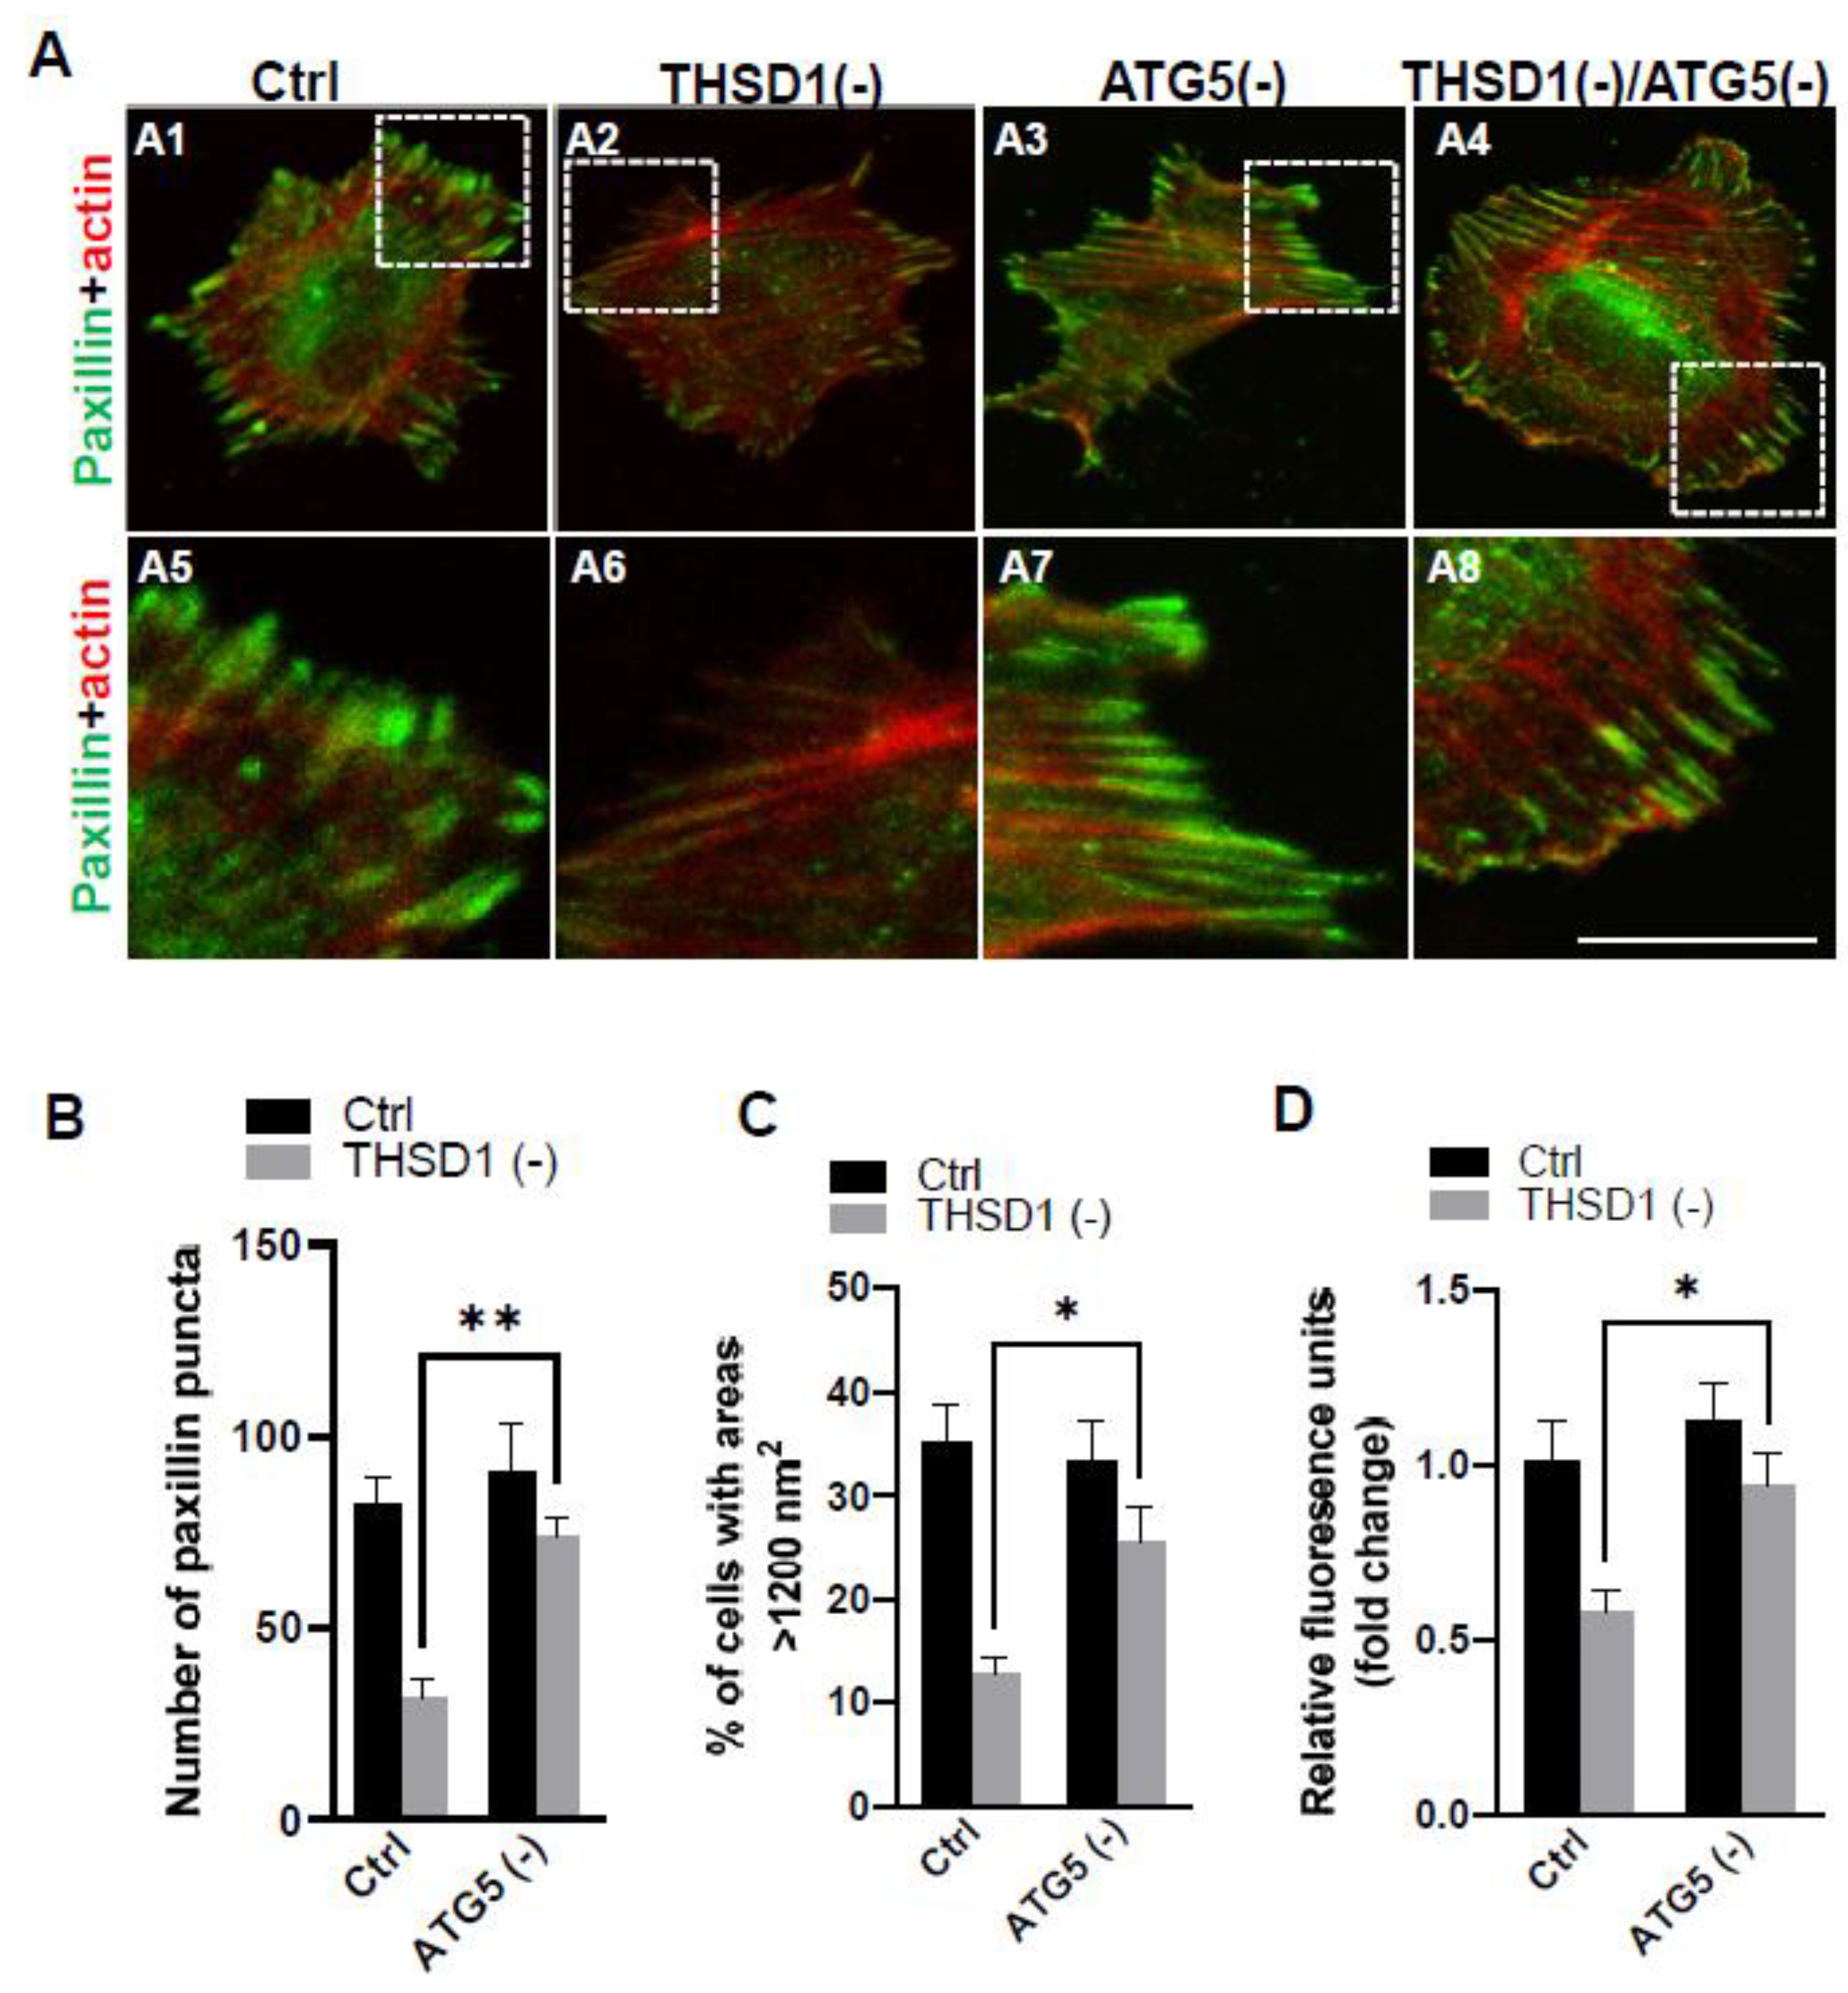
To investigate whether THSD1-mediated autophagy contributes to FA stability, we subsequently knockdown ATG5 in both control and THSD1-deficient cells, followed by a FA assay. Our results revealed that ATG5 knockdown effectively rescued defective FAs in THSD1-deficient cells (comparison of the number of green puncta in A4 to A2, or A8 to A6 in enlarged pictures, as well as the grey bars in
Figure 3B). Consistently, ATG5 knockdown also restored cellular spreading efficiency and attachment ability in THSD1-deficient cells (comparison of grey bars in
Figure 3C-3D). The knockdown effectiveness of ATG5 and THSD1 was confirmed by Western blot (
Supplemental Figure S4). In contrast, proteasome system inhibition via knockdown of the essential proteasome subunit 2 (PSMB2) failed to restore these phenotypes (
Supplemental Figure S5), implying a lack of involvement of the ubiquitin proteasome system.
To examine the mechanisms underlying THSD1-mediated autophagy activation, we conducted a series of signaling pathway analyses. Prior literature suggests that downregulation of mTOR kinase, a central nutrient sensor, or upregulation of AMPK, a principal energy sensor, can potentiate autophagy under conditions of starvation [
18,
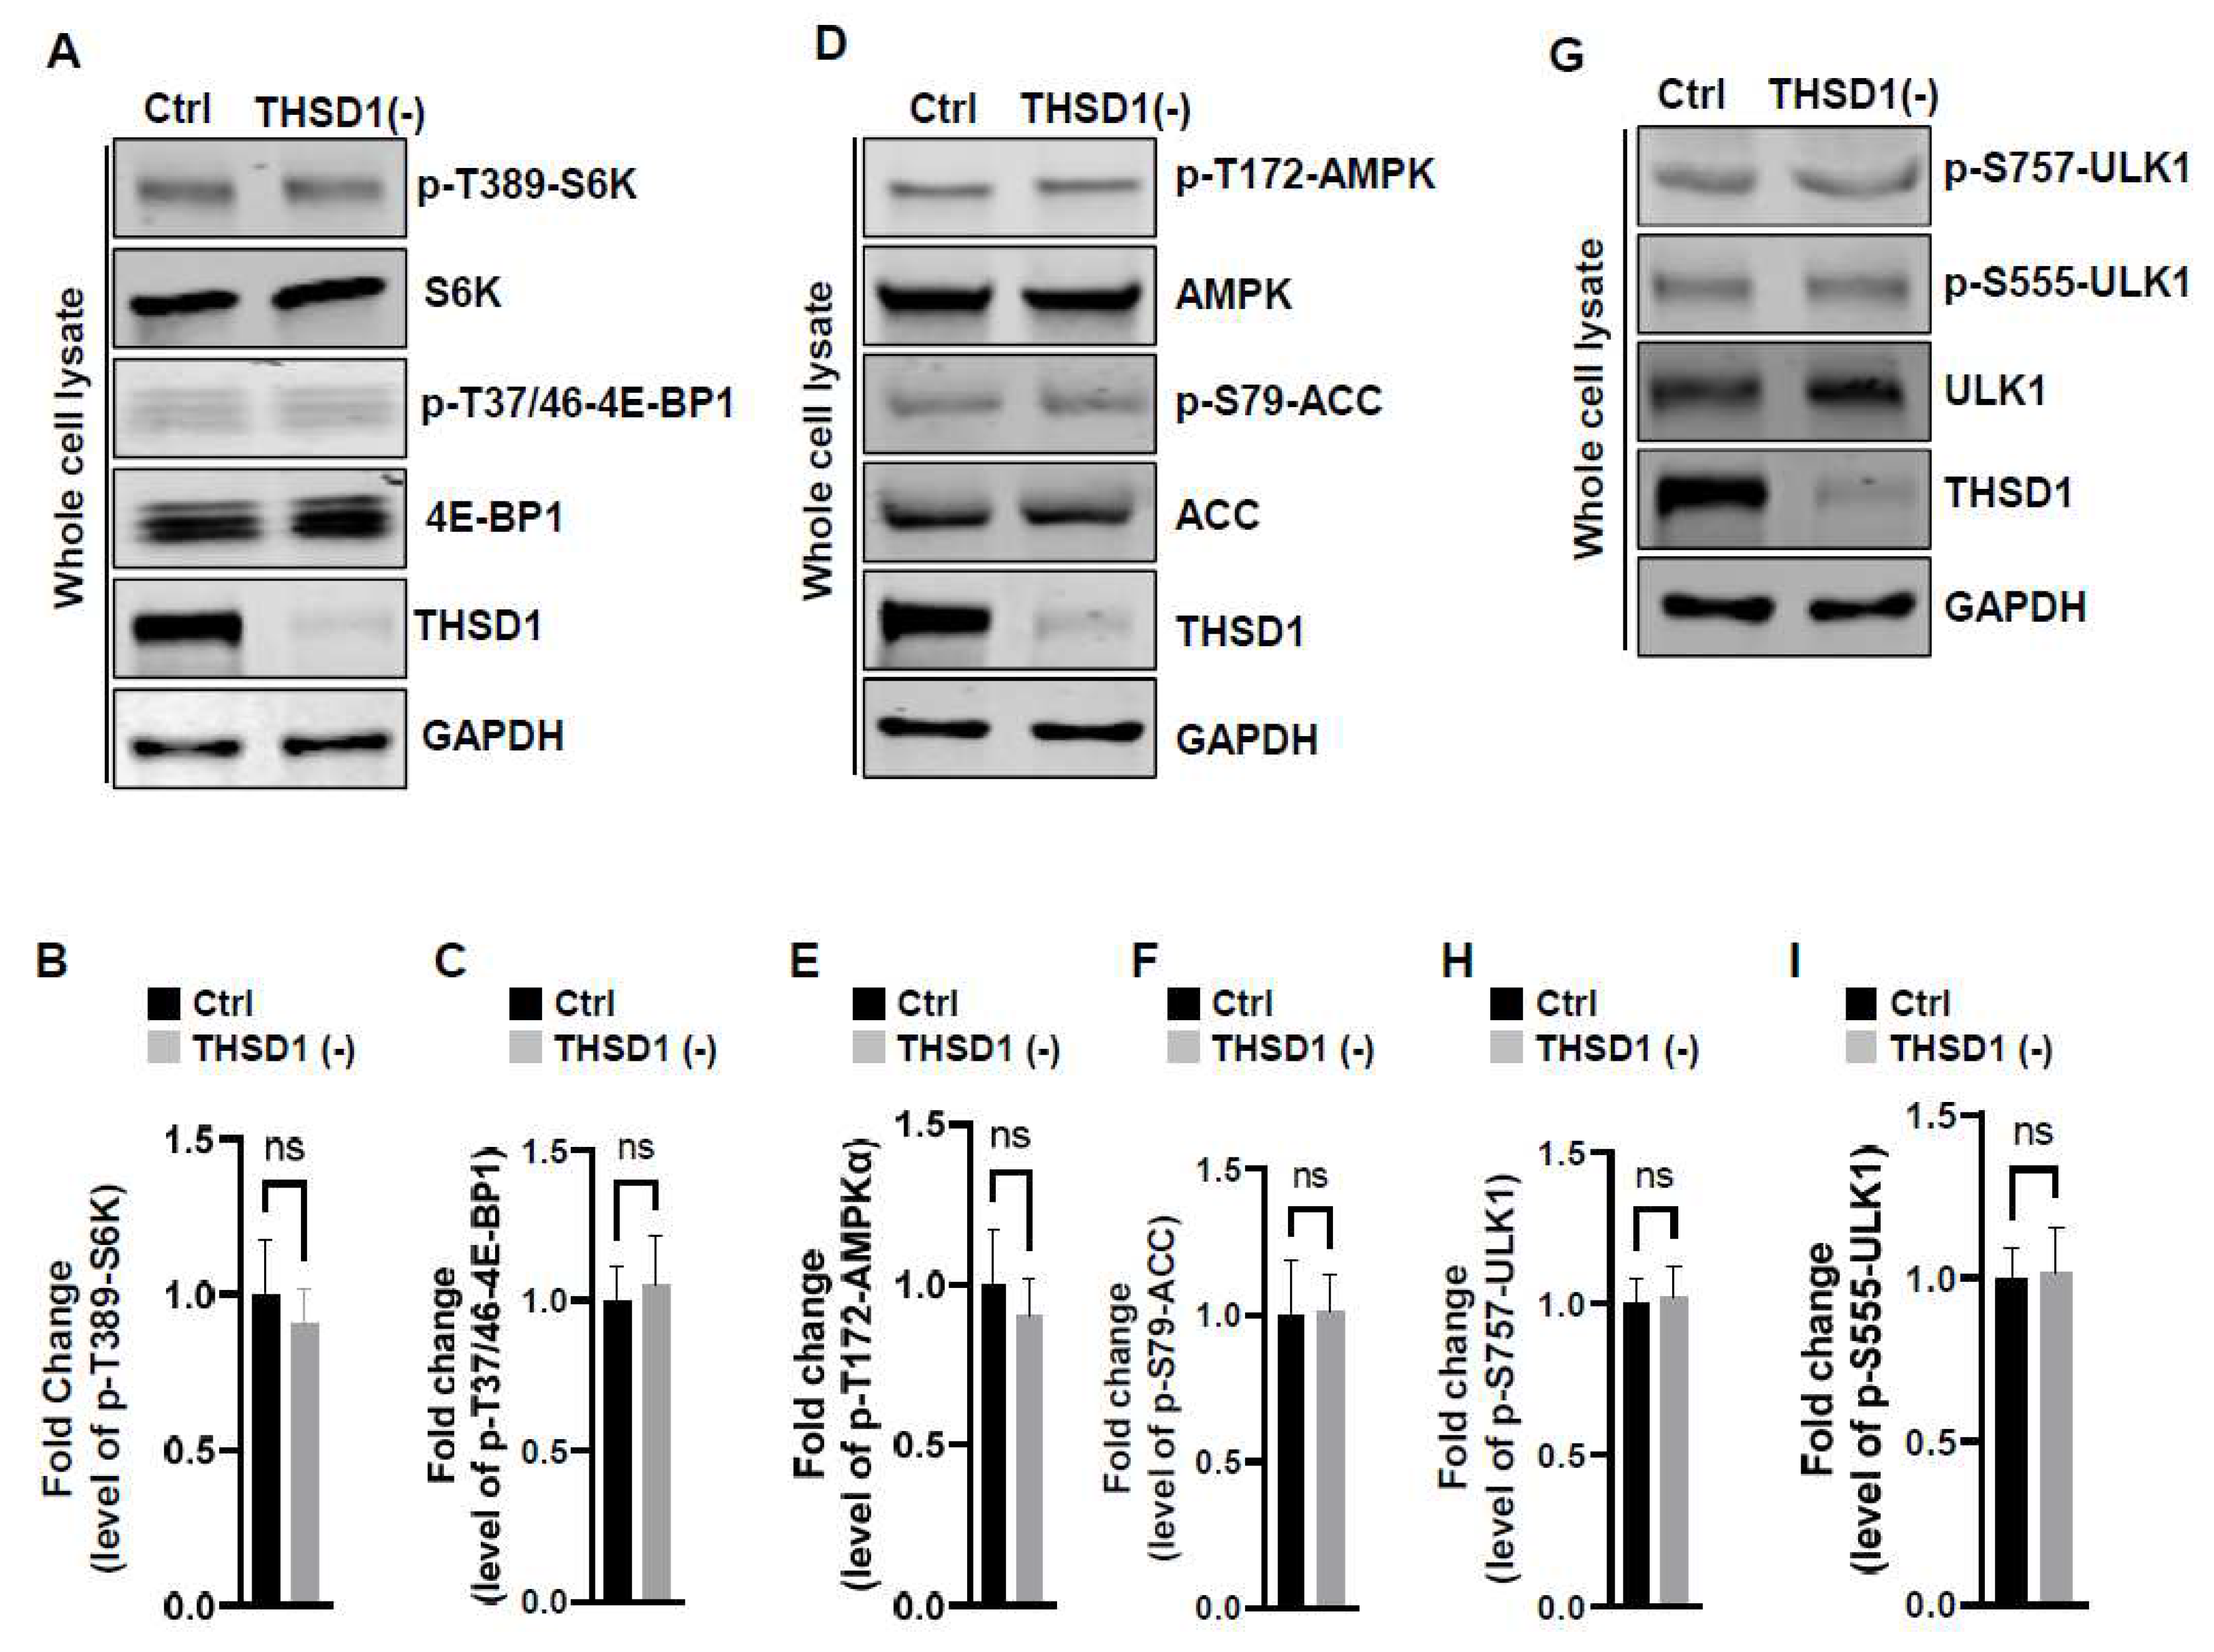
19]. To assess mTOR activity, we conducted immunoblotting to assess the phosphorylated levels of S6K and 4E-BP1, two canonical substrates of mTOR kinase. Intriguingly, THSD1 knockdown had no discernible effect on either of these readouts in terms of p-T389-S6K and p-T37/46-4E-BP1 (
Figure 4A-4C). Similarly, we did not observe any alterations in AMPK activation, as evidenced by the levels of p-T172-AMPK and p-S79-ACC (
Figure 4D-4F). ULK1, downstream of mTOR and AMPK, undergoes phosphorylation in response to autophagy induction [
20,
21]. We assessed the levels of phosphorylated ULK1 at Ser 757 (a target of mTOR) and at Ser 555 (a target of AMPK) but did not observe any discernible changes (
Figure 4G-4I). These data collectively suggest that THSD1-mediated autophagy operates independently of both mTOR and AMPK.
In light of these results, ULK1 was ruled out as a contributor to THSD1-mediated autophagy. We explored the possibility of other downstream molecules or signaling pathways being activated following THSD1 depletion. Beclin 1, an essential and sufficient component for autophagy induction, is positioned downstream of ULK1 within the autophagy pathway. In response to autophagic stimuli, Beclin 1 forms a complex with ATG14 to activate autophagy [
22,
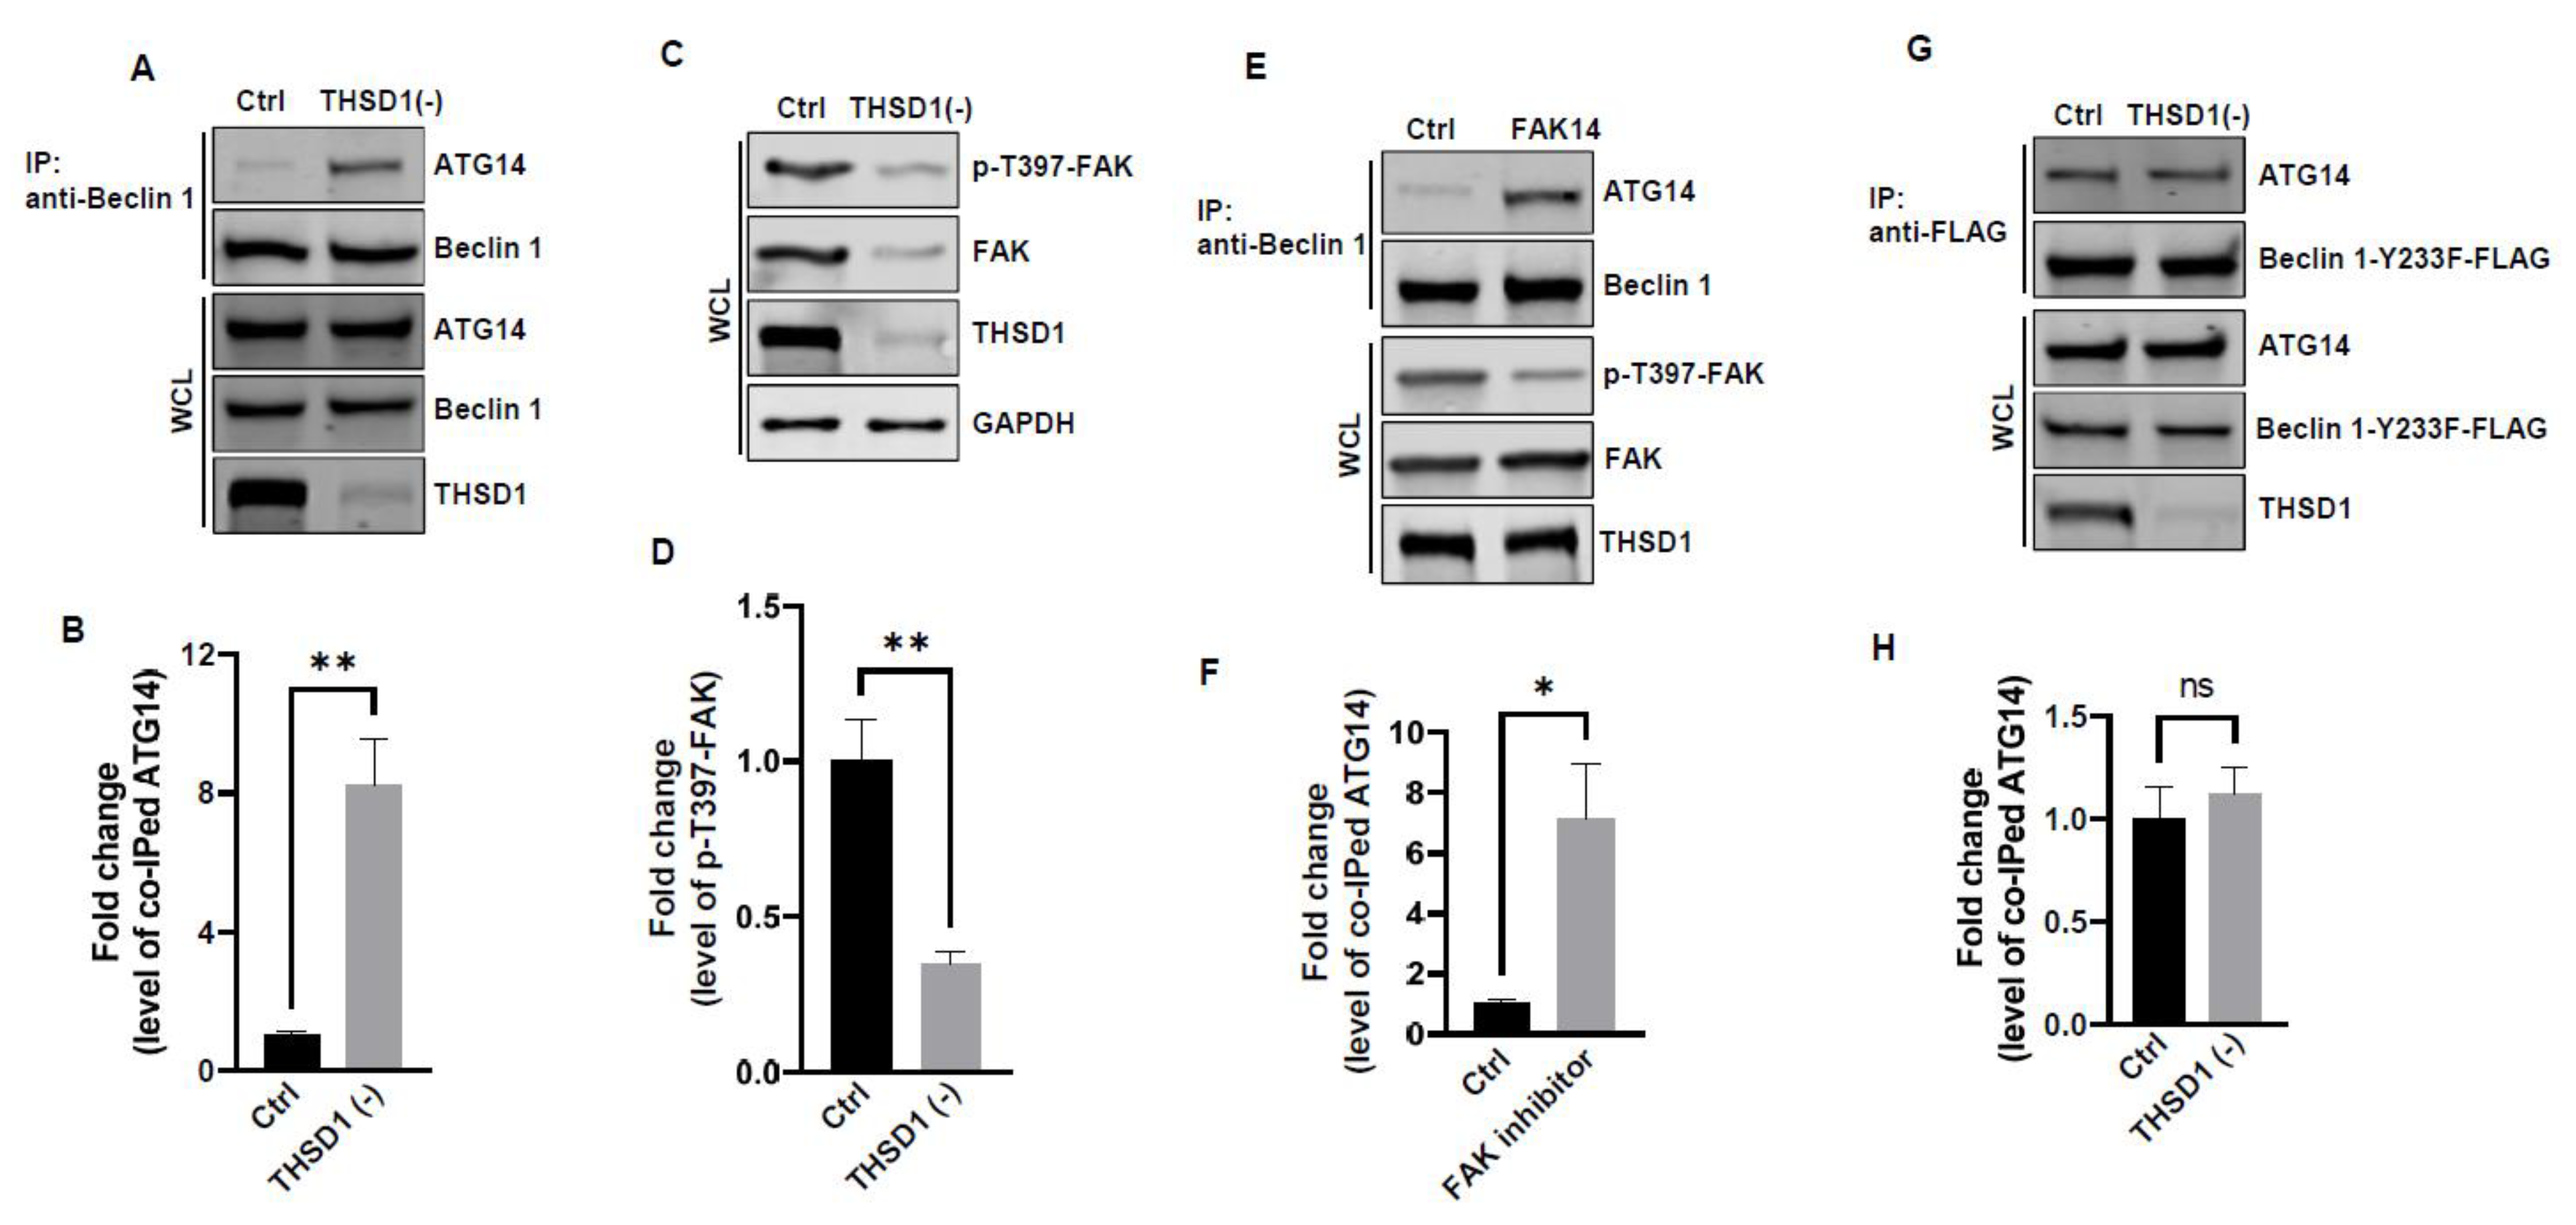
23]. Interestingly, we observed a significant enhancement in the physical interaction between Beclin 1 and ATG14 in THSD1-deficient endothelial cells (
Figure 5A-5B). This suggests that THSD1 negatively regulates the formation of the Beclin-ATG14 complex. Notably, FAK has been reported to phosphorylate Beclin 1 at Y233, a modification that impedes Beclin 1 binding to ATG14 [
24]. Our data revealed that THSD1 knockdown resulted in reduced levels of both FAK and phosphorylated FAK at T397 (
Figure 5C-5D). As such, we propose that THSD1 modulates the FAK/Beclin 1 pathway, which, in turn, regulates autophagy. To examine the role of FAK in Beclin 1-ATG14 protein complex formation, we treated HBMECs with FAK inhibitor 14 which inhibits FAK kinase activity (reduced phosphorylation of T397) without affecting the protein expression of FAK. Indeed, reduced FAK kinase activity augmented the interaction between Beclin 1 and ATG14 in brain endothelial cells (
Figure 5E-5F). Importantly, a Beclin 1 mutant (Beclin 1-Y223F), resistant to FAK phosphorylation, consistently bound to ATG14 in both control and THSD1-deficient endothelial cells (
Figure 5G-5H). These findings suggest that the loss of THSD1 reduces FAK activity, thereby relieving its inhibitory influence on Beclin 1-ATG14 complex formation, a pivotal step in the cascade of autophagy activation.
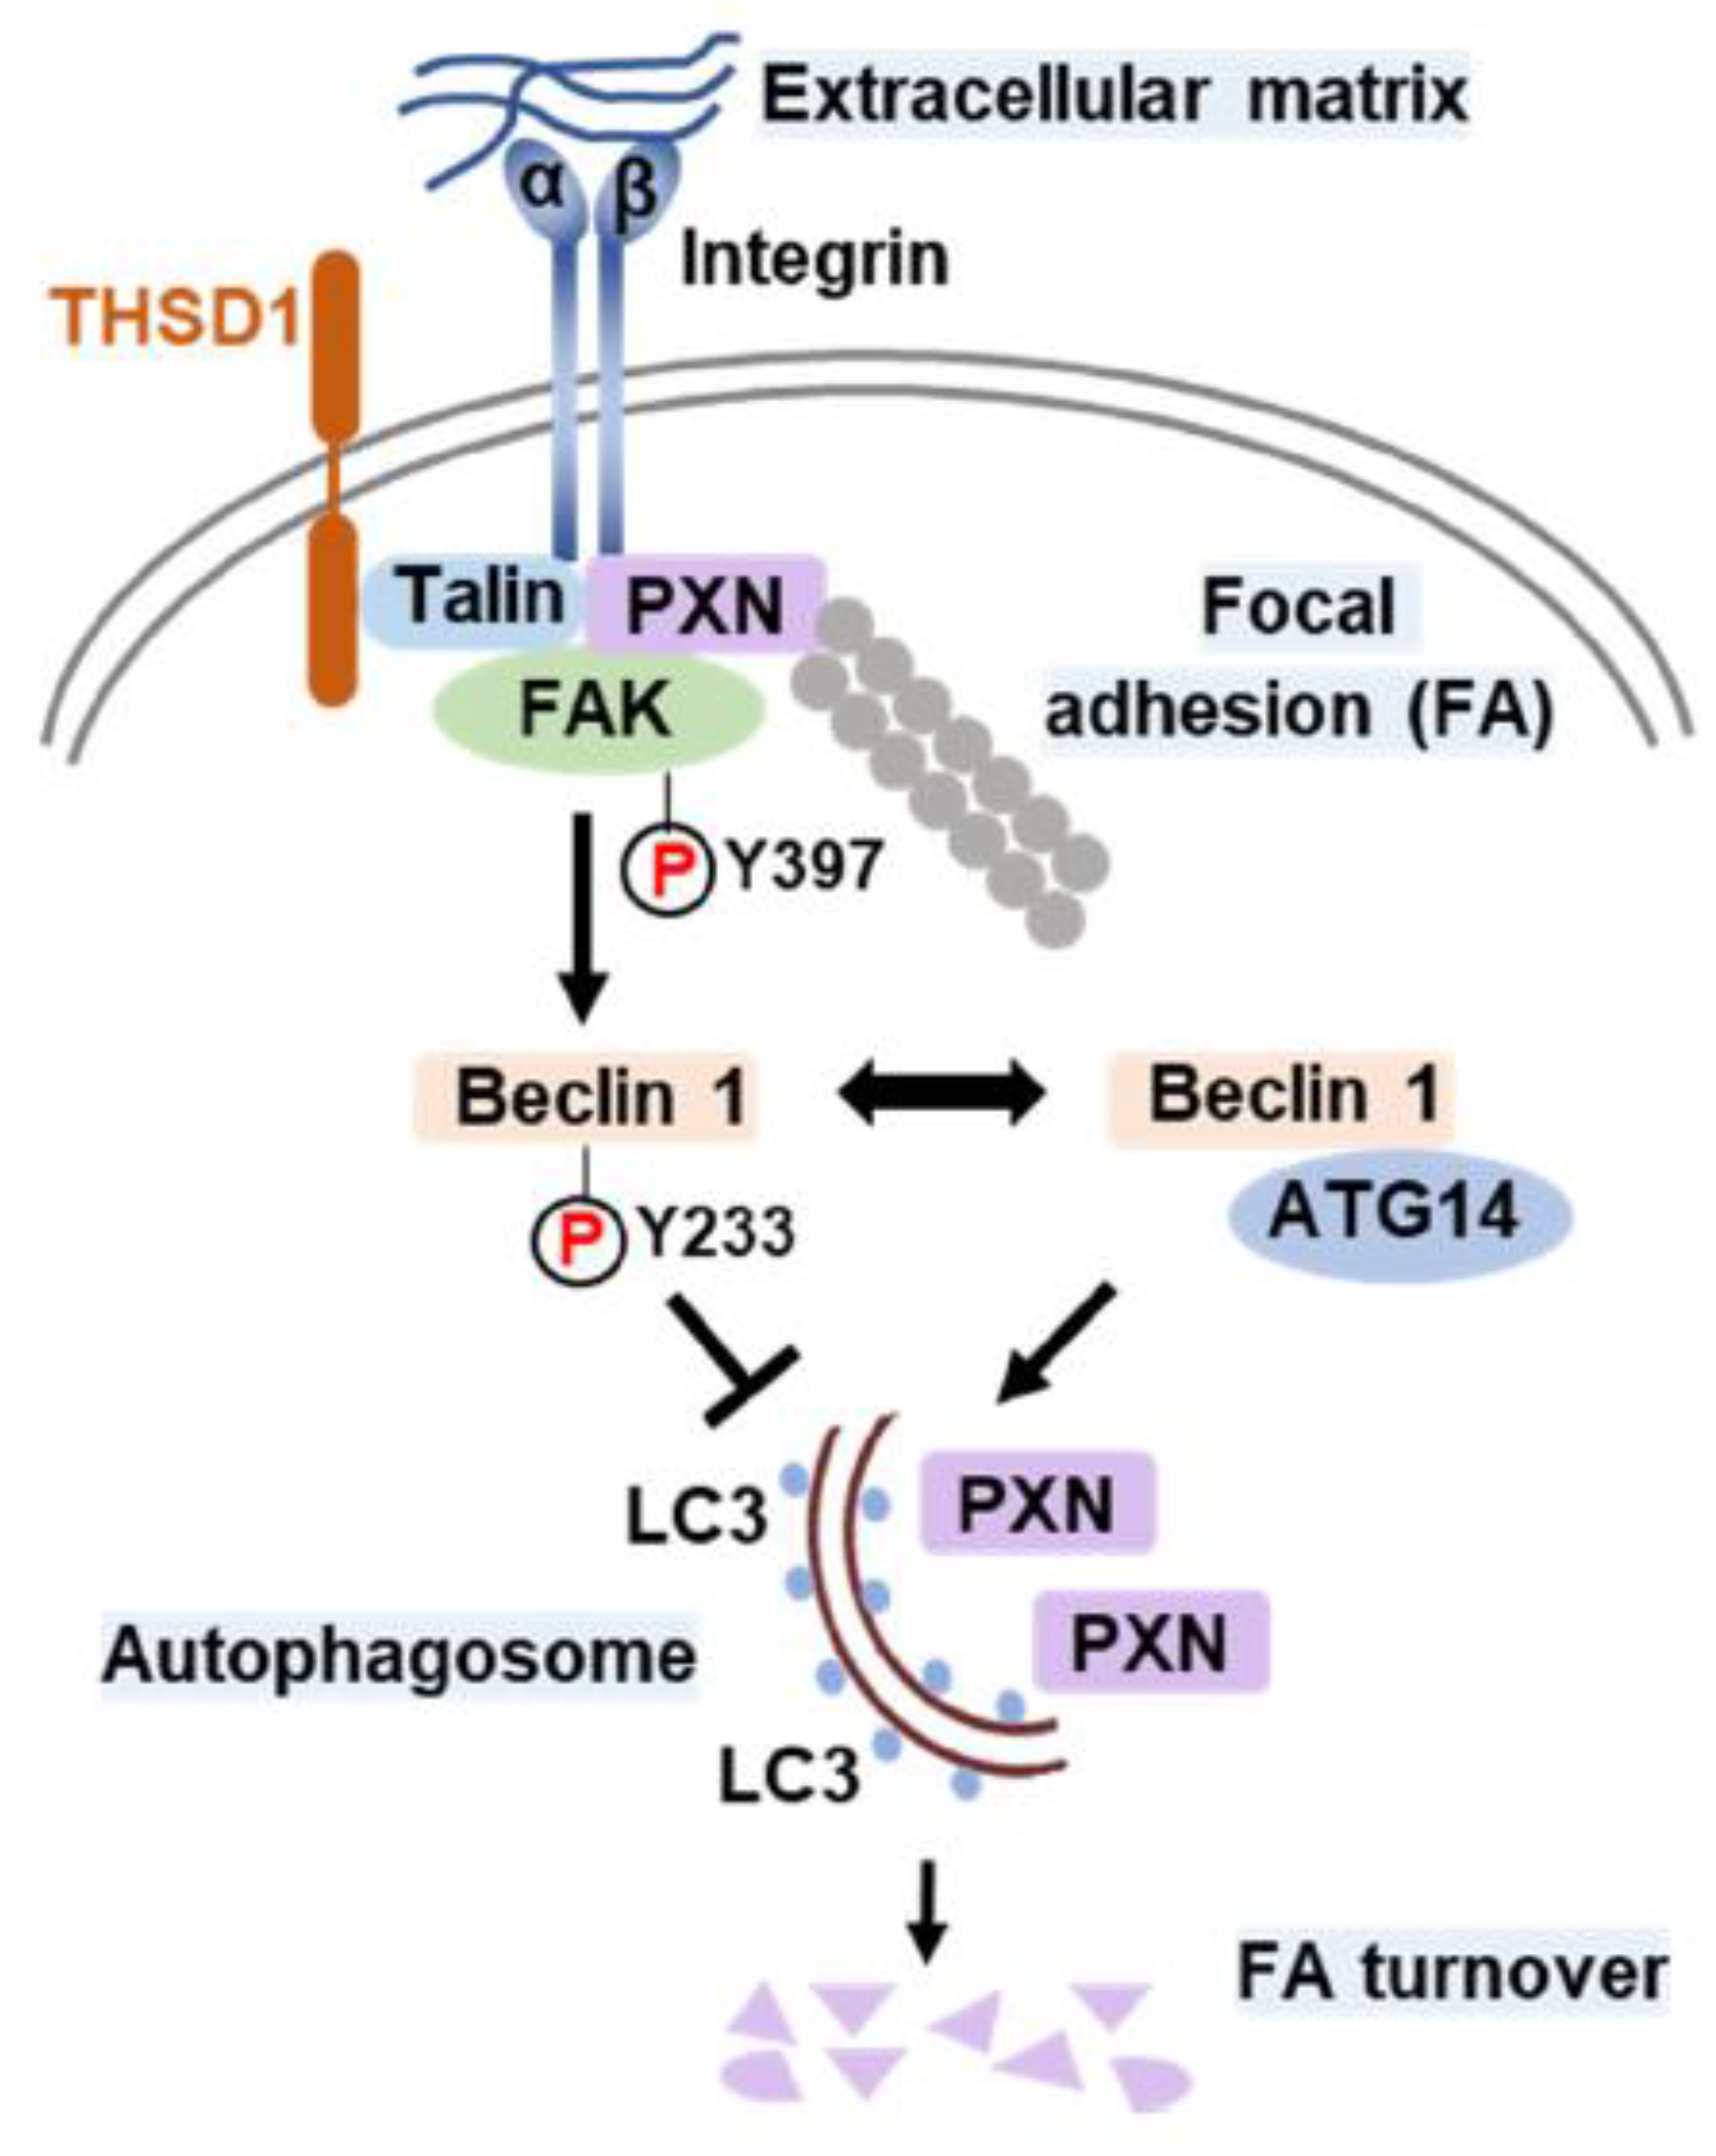
Based on the cumulative findings described above, we propose a model delineating the role of THSD1 in the regulation of autophagy and FAs. In endothelial cells, FAs encompass the integrin complex, which engages with the extracellular matrix on one end and interacts with adaptor proteins, such as talin and paxillin, on the other. FAK, a critical focal adhesion kinase, is dynamically recruited to FAs through its interaction with paxillin. Under physiological conditions, THSD1 resides within FAs, stabilizing FAK activity via complex formation. FAK phosphorylates the autophagy essential scaffold protein Beclin 1 at Y233, preventing its binding to ATG14 and thereby inhibiting autophagy. However, under pathological conditions, the loss of THSD1 destabilizes FAK, leading to increased binding between Beclin 1 and ATG14. Consequently, Beclin 1-mediated autophagy degrades FAs, contributing to functional deficits in endothelial cells, such as impaired cell spreading and attachment, which may ultimately compromise endothelial integrity and contribute to vascular diseases.
4. Materials and Methods
4.1. Plasmids
The pLVX-TetOne-Puro vector was obtained from Takara Inc and subsequently modified to incorporate a new polylinker with several 8-cutter sites, including PacI and NotI, to facilitate cloning. This customized vector was referred to as pLTO-PANBR. Full-length THSD1-FLAG and Beclin 1-Y223F-FLAG were cloned into the pLTO-PANBR vector using the PacI and NotI restriction sites through standard PCR protocols. The constructs were verified by Sanger sequencing as previously reported[
16]. The pBabepuro-GFP-LC3 plasmid was sourced from Addgene (#22405).
4.2. siRNAs
All stealth small interfering RNAs (siRNAs) were purchased from ThermoFisher Scientific and included siRNAs targeting talin (HSS110804 and HSS186350), thsd1 (HSS148179 and HSS148180), atg5 (HSS114103 and HSS114104), and psmb2 (HSS108676 and HSS108677). The effectiveness of each siRNA in knockdown experiments was validated through Western blotting.
4.3. Antibodies
S6K (9202), p-S6K-T389 (9205), 4E-BP1 (9452), p-4E-BP1-T37/46 (9459), AMPK-α (2532), p-AMPKα-T172 (2535), Acetyl-CoA Carboxylase/ACC (3662), p-ACC-S79 (3661), ULK1 (8054), p-ULK1-S757 (14202), p-ULK1-S555 (5869), ATG14 (5504), Beclin 1 (3495), FAK (3285), p-FAK-T397 (3283), p62 (8025) from Cell Signaling Technology; THSD1 (Novus Biological, NBP1-86930); Paxillin (BD Biosciences, 612405); Zyxin (Millipore, MAB2610); Ubiquitin (Millipore, 04-262); GAPDH ( Santa Cruz Technology, sc-32233); Anti-FLAG antibody (Sigma, F1804).
4.4. Cell Culture
Human brain microvascular endothelial cells (HBMECs), obtained from Cell Systems (ACBRI 376), were cultured in endothelial cell medium (#1001, ScienCell Research Laboratories). Inducible gene expression in HBMECs was achieved through lentiviral infection. Lentiviruses were generated in HEK293T cells with the assistance of two other plasmids, pMD2.G (#12259, Addgene) and psPAX2 (#12260, Addgene). For siRNA-mediated knockdown experiments, siRNAs were introduced into HBMECs using standard electroporation techniques (Neon Transfection System, Invitrogen). Autophagy was induced by treating HBMECs with Earle’s Balanced Salt Solution (EBSS) for 2 hours, followed by LC3 puncta or p62 turnover assays. All chemicals, including pepstatin/E-64D, MG132, and FAK inhibitor 14, were purchased from Cayman Chemical.
4.5. Quantitative RT-PCR
Total mRNA was isolated from HBMECs using TRIzol (15596026, ThermoFisher Scientific) and quantified following the Fast SYBR green protocol. The primer sequences are provided below.
paxillin: 5’- CTGATGGCTTCGCTGTCGGATT /5’- GCTTGTTCAGGTCAGACTGCAG
zyxin: 5’- TTCCACATCGCCTGCTTCACCT /5’- CGCAGGTGTTACACTTCTCCAG
4.6. Western Blot
HBMECs were subjected to siRNA or compound treatments in 60-mm dishes and lysed in Triton X-100 lysis buffer, as previously described [
26]. The lysates were sonicated briefly and centrifuged at 13,000 rpm for 30 minutes at 4°C. Total cell lysates were supplemented with 2X SDS sample buffer and then subjected to SDS-PAGE analysis. The proteins were subsequently transferred onto nitrocellulose membranes using a Bio-Rad mini transfer apparatus. Following this, the membranes were blocked with 5% non-fat milk, and primary and secondary antibodies were applied at dilutions of 1:1000 and 1:10000, respectively. The Odyssey Imager system (LI-COR Biosciences) was used to detect fluorescence signals.
4.7. Immunoprecipitation (IP)
HBMECs treated with siRNAs or compounds in 60-mm dishes were lysed in an IP-lysis buffer, as previously described [
26]. The cell lysate was briefly sonicated and then centrifuged at 13,000 rpm for 30 minutes at 4°C. Endogenous or exogenous proteins were immunoprecipitated from the cell lysate using either anti-THSD1 or anti-FLAG antibody in combination with protein A/G Plus agarose beads (Santa Cruz Biotechnology, sc-2003). The immunoprecipitates and whole cell lysates (WCL) were subjected to standard Western blotting.
4.8. Immunostaining
HBMECs treated with siRNAs were reseeded onto 8-well chamber slides at appropriate cell concentrations. After fixation with 4% paraformaldehyde and permeabilization with Triton X-100, the cells were blocked with 10% normal goat serum for 1 hour at room temperature. Next, the cells were incubated with primary antibodies at 4°C overnight and subsequently stained with Alexa-594 or Alexa-488 conjugated secondary antibodies (Invitrogen). The stained samples were mounted in Prolong Gold solution (Invitrogen), and images were captured using a Leica TCS SP5 confocal microscope.
4.9. Cell Spreading Assay
HBMECs treated with various siRNAs were trypsinized and then inactivated by endothelial cell medium before resuspension in 1X PBS. The cells were immediately reseeded onto 8-well chamber slides pre-coated with Collagen-IV. After 20 minutes, the cells were fixed with 4% paraformaldehyde in PBS, and the overall morphology was highlighted by immunostaining against the cytoskeleton protein actin using Alexa 594-phalloidin, as previously reported [
11]. Widefield images were acquired using a Leica DM4 microscope with a cMOS camera, and at least 9-12 different fields were chosen from each chamber. Cell areas were measured using ImageJ, and data were analyzed by Student
t-test.
4.10. Cell Adhesion Assay
To evaluate cell adhesion, HBMECs subjected to various siRNA treatments were assessed using the CytoSelect Cell Adhesion Assay Kit (MBS168514, Cell Biolabs). Cells were trypsinized and resuspended in serum-free endothelial cell medium before adding 150 µl of the cell suspension to each well of a 96-well plate pre-coated with collagen IV. Following a 1-hour incubation in a cell culture incubator, the culture medium was removed, and the adherent cells were washed three times with 1X PBS. The remaining adherent cells on the well bottoms were lysed using the 1X Lysis Buffer/CyQuant Dye provided in the kit. Subsequently, a 150 µl aliquot of the lysate was transferred to a 96-well plate, and fluorescence signals were measured using a plate reader at an excitation wavelength of 480 nm and an emission wavelength of 520 nm.
4.11. LC3 Puncta Formation and p62 Turnover Assays
The LC3 puncta formation and p62 turnover assays were conducted following established protocols [
16]. To assess LC3 puncta formation, cells were initially fixed using 4% paraformaldehyde, followed by permeabilization with 50 µg/ml digitonin. The primary antibody utilized was anti-GFP (GFP-1020, Aves Labs), and the secondary antibody was Alexa-488 anti-chicken IgG (Invitrogen). For each assay condition, puncta profile data were calculated by averaging the total number of GFP-LC3-positive puncta per cell, drawing from approximately 30–50 representative cells. In the p62 turnover assay, HBMECs treated with various siRNAs for 48 hours were harvested in Triton lysis buffer. Western blot analysis was then carried out to determine the protein levels of p62.
4.12. Statistics Analysis
Statistical analysis was conducted using GraphPad Prism 6. p-values were calculated using the Student’s t-test or one- or two-way ANOVA, with Bonferroni correction applied for multiple comparison tests between selected pairs. Data are presented as mean ± standard error of the mean (s.e.m.). A significance level of p < 0.05 was considered statistically significant.
