Submitted:
08 December 2023
Posted:
11 December 2023
You are already at the latest version
Abstract
Keywords:
1. Introduction
2. Assessment of the selected literature results
2.1. Could NTQ of a given phosphor be well reproducible?
2.2. Could the associated data of a specific NTQ phosphor be in line with the law of conservation of energy?
2.3. Could NTQ of a given phosphor be demonstrated in prototype WLED device?
3. Discussion
4. Summary
Institutional Review Board Statement
Informed Consent Statement
Data Availability Statement
Acknowledgments
Conflicts of Interest
References
- Viswanath, N. S. M.; Fang, M.-H.; Huu, H. T.; Han, J. H.; Liu, R.-S.; Im, W. B. Correlated Na+ ion migration invokes zero thermal quenching in a sodium superionic conductor-type phosphor. Chem. Mater. 2022, 34, 107–115. [Google Scholar] [CrossRef]
- Kim, Y. H.; Arunkumar, P.; Kim, B. Y.; Unithrattil, S.; Kim, E.; Moon, S.-H.; Hyun, J. Y.; Kim, K. H.; Lee, D.; Lee, J.-S.; Im, W. B. A zero-thermal-quenching phosphor. Nat. Mater. 2017, 16, 543–551. [Google Scholar] [CrossRef] [PubMed]
- Li, N.; Zhang, S.; Zhao, J.; Pan, Q.; Du, Y.; Xing, B.; Li, J.; Qu, W. Red shifts, intensity enhancements and abnormally thermal quenching of Ba9Lu2Si6O24:Ce3+ emission by nitridation. J. Lumin. 2019, 214, 116587. [Google Scholar] [CrossRef]
- Shi, X.; Xue, Y.; Mao, Q.; Pei, L.; Li, X.; Liu, M.; Zhang, Q.; Zhong, J. Eu3+ single-doped phosphor with antithermal quenching behavior and multicolor-tunable properties for luminescence thermometry. Inorg. Chem. 2023, 62, 893–903. [Google Scholar] [CrossRef] [PubMed]
- Wang, X.; Zhao, Z.; Wu, Q.; Wang, C.; Wang, Q.; Yanyan, L.; Wang, Y. Structure, photoluminescence and abnormal thermal quenching behavior of Eu2+-doped Na3Sc2(PO4)3: a novel blue-emitting phosphor for n-UV LEDs. J. Mater. Chem. C 2016, 4, 8795–8801. [Google Scholar] [CrossRef]
- Liu, Z.; Zhou, T.; Yang, C.; Chen, J.; Agrawal, D. K.; Mao, Z.; Wang, D. Tunable thermal quenching properties of Na3Sc2(PO4)3:Eu2+ phosphors tailored by phase transformation details. Dalton Trans. 2020, 49, 3615–3621. [Google Scholar] [CrossRef] [PubMed]
- Yan, J.; Zhang, Z.; Milićevića, B.; Li, J.; Liang, Q.; Zhou, J.; Wang, Y.; Shi, J.; Wu, M. The enhancement of emission intensity and enlargement of color gamut by a simple local structure substitution with highly thermal stability preserved. Opt. Mater. 2019, 95, 109201. [Google Scholar] [CrossRef]
- Xian, Y.; Li, J.; Wen, D.; Xie, F.; Xu, Y.; Xu, P.; Zhang, Q.; Chen, Z.; Yan, J. Cation sites modification enhanced luminescence and thermal quenching characteristic in the blue light-emitting Na3Sc2-xZnx(PO4)3:0.03Eu2+ phosphors. J. Lumin. 2020, 228, 117615. [Google Scholar] [CrossRef]
- Qiao, J.; Ning, L.; Molokeev, M. S.; Chuang, Y.-C.; Liu, Q.; Xia, Z. Eu2+ site preferences in the mixed cation K2BaCa(PO4)2 and thermally stable luminescence. J. Am. Chem. Soc. 2018, 140, 9730–9736. [Google Scholar] [CrossRef]
- Hu, T.; Gao, Y.; Ji, X.; Xia, Z.; Zhang, Q. Thermal quenching properties of narrow-band blue-emitting MBe2(PO4)2:Eu2+ (M = Ca, Sr) phosphors towards backlight display applications. Inorg. Chem. Front. 2020, 7, 2685–2691. [Google Scholar] [CrossRef]
- Tang, J.; Si, J.; Li, G.; Zhou, T.; Zhang, Z.; Cai, G. Excellent enhancement of thermal stability and quantum efficiency for Na2BaCa(PO4)2:Eu2+ phosphor based on Sr doping into Ca. J. Alloys Compd. 2022, 911, 165092. [Google Scholar] [CrossRef]
- Zhong, Y.; Xia, M.; Chen, Z.; Gao, P.; Hintzen, H.T.; Wong, W.-Y.; Wang, J.; Zhou, Z. Pyrophosphate phosphor solid solution with high quantum efficiency and thermal stability for efficient LED lighting. iScience 2020, 23, 100892. [Google Scholar] [CrossRef]
- Wei, Y.; Gao, Z.; Liu, S.; Chen, S.; Xing, G.; Wang, W.; Dang, P.; Kheraif, A. A. A.; Li, G.; Lin, J. Highly efficient green-to-yellowish-orange emitting Eu2+-doped pyrophosphate phosphors with superior thermal quenching resistance for w-LEDs. Adv. Optical Mater. 2020, 8, 1901859. [Google Scholar] [CrossRef]
- Leng, Z.; Zhang, D.; Bai, H.; He, H.; Qing, Q.; Zhao, J.; Tang, Z. A zero-thermal-quenching perovskite-like phosphor with an ultra-narrow-band blue-emission for wide color gamut backlight display applications. J. Mater. Chem. C 2021, 9, 13722–13732. [Google Scholar] [CrossRef]
- Ding, X.; Wang, Y. Commendable Eu2+-doped oxide-matrix-based LiBa12(BO3)7F4 red broad emission phosphor excited by NUV light: electronic and crystal structures, luminescence properties. ACS Appl. Mater. Interfaces 2017, 9, 23983–23994. [Google Scholar] [CrossRef]
- Li, G.-H.; Wu, P.-F.; Ye, B.; Cai, G.-M. Enhancement of Eu2+ photoluminescence behavior in NaBaB9O15 based on the K+ doping. J. Lumin. 2022, 243, 118613. [Google Scholar] [CrossRef]
- Zhuo, Y.; Hariyani, S.; Zhong, J.; Brgoch, J. Creating a green-emitting phosphor through selective rare-earth site preference in NaBaB9O15:Eu2+. Chem. Mater. 2021, 33, 3304–3311. [Google Scholar] [CrossRef]
- Wu, X.; Shi, R.; Zhang, J.; Wen, D.; Qiu, Z.; Zhang, X.; Zhou, W.; Yu, L.; Lian, S. Highly efficient and zero-thermal-quenching blue-emitting Eu2+-activated K-beta-alumina phosphors. Chem. Eng. J. 2022, 429, 132225. [Google Scholar] [CrossRef]
- Piao, S.; Wang, Y.; Zhou, X.; Geng, W.; Zhang, J.; Zhang, X.; Wu, D.; Cao, Y.; Li, X.; Chen, B. Defect engineering in a Eu2+-doped β Al2O3 structure blue phosphor and its controllable zero-thermal quenching luminescence. ACS Sustainable Chem. Eng. 2021, 9, 7882–7890. [Google Scholar] [CrossRef]
- Shao, Q.; Lin, H.; Dong, Y.; Fu, Y.; Liang, C.; He, J.; Jiang, J. Thermostability and photostability of Sr3SiO5:Eu2+ phosphors for white LED applications. J. Solid State Chem. 2015, 225, 72–77. [Google Scholar] [CrossRef]
- Fan, X.; Chen, W.; Xin, S.; Liu, Z.; Zhou, M.; Yu, X.; Zhou, D.; Xu, X.; Qiu, J. Achieving long-term zero-thermal-quenching with the assistance of carriers from deep traps. J. Mater. Chem. C 2018, 6, 2978–2982. [Google Scholar] [CrossRef]
- Zhang, M.; Xia, Z.; Liu, Q. Thermally stable KxCs1-xAlSi2O6:Eu2+ phosphors and their photoluminescence tuning. J. Mater. Chem. C 2017, 5, 7489–7494. [Google Scholar] [CrossRef]
- Tu, Y.-Y.; Yang, Z.-H.; Wang, C.-H.; Wang, T.-W.; Lu, F.-C. Synthesis, crystal structure, and anti-thermal quenching performance of Lu2Sr(1−x)Al4SiO12:xEu2+ phosphors. J. Am. Ceram. Soc. 2022, 105, 5240–5251. [Google Scholar]
- Xin, S.; Zhu, G. Enhanced luminescence and abnormal thermal quenching behaviour investigation of BaHfSi3O9:Eu2+ blue phosphor co-doped with La3+–Sc3+ ion pairs. RSC Adv. 2016, 6, 41755–41760. [Google Scholar] [CrossRef]
- Shi, R.; Zhang, X.; Qiu, Z.; Zhang, J.; Liao, S.; Zhou, W.; Xu, X.; Yu, L.; Lian, S. Composition and antithermal quenching of noninteger stoichiometric Eu2+-doped Na-β-alumina with cyan emission for near-UV WLEDs. Inorg. Chem. 2021, 60, 19393–19401. [Google Scholar] [CrossRef] [PubMed]
- Hariyani, S.; Brgoch, J. Advancing human-centric LED lighting using Na2MgPO4F:Eu2+. ACS Appl. Mater. Interfaces 2021, 13, 16669–16676. [Google Scholar] [CrossRef]
- Ma, H.; Tao, S.; Hua, Y.; Zheng, J.; Lou, L.; Ping, Y.; Qiao, P. A study of negative-thermal-quenching (Ba/Ca)AlSi5O2N7:Eu2+ phosphors. Dalton Trans. 2021, 50, 17792. [Google Scholar] [CrossRef] [PubMed]
- Yin, Y.; Yang, W.; Wang, Z.; Zhang, Y.; Zhu, M.; Dou, C.; Che, Y.; Sun, S.; Hu, C.; Teng, B.; Zhao, J.; Lu, J.; Sun, R.; Zhong, D. Achieving zero-thermal quenching luminescence in ZnGa2O4: 0.02Eu3+ red phosphor. J. Alloys Compd. 2022, 898, 162786. [Google Scholar] [CrossRef]
- Ling, S.; Liang, J.; Yan, Y.; Luo, C.; Liao, S.; Huang, Y. A new type of zero thermal quenching red emitting phosphor β-NaYF4:Eu3+ for NUV LED. J. Solid State Chem. 2022, 311, 123099. [Google Scholar] [CrossRef]
- Geng, X.; Xie, Y.; Ma, Y.; Liu, Y.; Luo, J.; Wang, J.; Yu, R.; Deng, B.; Zhou, W. Abnormal thermal quenching and application for w-LEDs: Double perovskite Ca2InSbO6:Eu3+ red-emitting phosphor. J. Alloys Compd. 2020, 847, 156249. [Google Scholar] [CrossRef]
- Ma, X.; Yang, S.; Shao, B.; Lv, Q.; Wang, C.; Wang, C. Defect-induced zero thermal quenching of a bright red-emitting nonlinear optical material. New J. Chem. 2023, 47, 1691–1701. [Google Scholar] [CrossRef]
- Viswanath, N.S.M.; Grandhi, G. K.; Huu, H. T.; Choi, H.; Kim, H. J.; Kim, S. M.; Kim, H. Y.; Park, C.-J.; Im, W. B. Zero-thermal-quenching and improved chemical stability of a UCr4C4-type phosphor via crystal site engineering. Chem. Eng. J. 2021, 420, 127664. [Google Scholar] [CrossRef]
- Wei, Q.; Ding, J.; Wang, Y. A novel tunable extra-broad yellow-emitting nitride phosphor with zero-thermal-quenching property. Chem. Eng. J. 2020, 386, 124004. [Google Scholar] [CrossRef]
- Li, Z.; Tian, T.; Yuan, W.; Cui, Q.; Zhang, Y.; Gong, Z.; Mao, C.; Liu, W.; Yang, B.; Xu, W.; Chu, Y.; Liu, L.; Xu, J. Stable zero-thermal quenching cover wide temperature range achieves in cerium doped KY3F10 ultraviolet luminescent single crystal. J. Alloys Compd. 2022, 908, 164651. [Google Scholar] [CrossRef]
- Li, Q.; Chen, C.; Qiao, Y.; Yu, B.; Shen, B.; Zhang, Y. High thermal stability of green-emitting phosphor NaBaB9O15: Tb3+ via energy compensation. J. Alloys Compd. 2022, 897, 163131. [Google Scholar] [CrossRef]
- Deng, M.; Cao, X.; Tang, Y.; Zhou, Z.; Liu, L.; Liu, X.; Zhang, P.; Chang, L.-Y.; Ruan, H.; Guo, X.; Wang, J.; and Liu, Qn. Gradient defects mediate negative thermal quenching in phosphors. Adv. Photonics 2023, 5, 026001. [Google Scholar] [CrossRef]
- Chen, Y.; Yu, B.; Gou, J.; Liu, S. F. Zero-thermal-quenching and photoluminescence tuning with the assistance of carriers from defect cluster traps. J. Mater. Chem. C 2018, 6, 10687–10692. [Google Scholar] [CrossRef]
- Qian, Y.; Zhu, D.; Pu, Y. A zero-thermal-quenching phosphor Sr3La(AlO)3(BO3)4: Dy3+ for near ultraviolet excitation white-LEDs. J. Lumin. 2022, 243, 118610. [Google Scholar] [CrossRef]
- Wang, R.-R.; Zhang, J.; Liu, Y.-J.; Li, G.-H.; Cai, G.-M. Anti-thermal quenching phosphors based on the new phosphate host Ca3.6In3.6(PO4)6. Dalton Trans. 2023, 52, 5552–5562. [Google Scholar] [CrossRef]
- Geng, X.; Xie, Y.; Chen, S.; Luo, J.; Li, S.; Wang, T.; Zhao, S.; Wang, H.; Deng, B.; Yu, R.; Zhou, W. Enhanced local symmetry achieved zero-thermal-quenching luminescence characteristic in the Ca2InSbO6:Sm3+ phosphors for w-LED. Chem. Eng. J. 2021, 410, 128396. [Google Scholar] [CrossRef]
- Ye, W.; Ma, C.; Li, Y.; Zhao, C.; Wang, Y.; Zuo, C.; Wen, Z.; Li, Y.; Yuan, X.; Cao, Y. Anti-thermal-quenching red-emitting GdNbO4:Pr3+ phosphor based on metal-to-metal charge transfer for optical thermometry application. J. Mater. Chem. C 2021, 9, 15201–15211. [Google Scholar] [CrossRef]
- Long, Z.; Wen, Y.; Qiu, J.; Wang, J.; Zhou, D.; Zhu, C.; Lai, J.; Xu, X.; Yu, X.; Wang, Q. Crystal structure insight aided design of SrGa2Si2O8:Mn2+ with multi-band and thermally stable emission for high-power LED applications. Chem. Eng. J. 2019, 375, 122016. [Google Scholar] [CrossRef]
- Han, J. H.; Viswanath, N. S. M.; Park, Y. M.; Cho, H. B.; Jang, S. Woo J.; Min, W.; Im, W. B. Zero-thermal-quenching layered metal halide perovskite. Chem. Mater. 2022, 34, 5690–5697. [Google Scholar] [CrossRef]
- Wu, L.; Sun, S.; Bai, Y.; Xia, Z.; Wu, L.; Chen, H.; Zheng, L.; Yi, H.; Sun, T.; Kong, Y.; Zhang, Y.; Xu, J. Defect-induced self-reduction and anti-thermal quenching in NaZn(PO3)3:Mn2+ red phosphor. Adv. Optical Mater. 2021, 9, 2100870. [Google Scholar] [CrossRef]
- Huang, D.; Ouyang, Q.; Kong, Y.; Wang, B.; Cheng, Z.; Kheraif, A. A. A.; Lian, H.; Lin, J. Highly efficient yellow emission and abnormal thermal quenching in Mn2+-doped Rb4CdCl6. Dalton Trans. 2023, 52, 5715–5723. [Google Scholar] [CrossRef]
- Zhou, Z.; Zhu, H.; Huang, X.; She, Y.; Zhong, Y.; Wang, J.; Liu, M.; Li, W.; Xia, M. Anti-thermal-quenching, color-tunable and ultra-narrow-band cyan green-emitting phosphor for w-LEDs with enhanced color rendering. Chem. Eng. J. 2022, 433, 134079. [Google Scholar] [CrossRef]
- Beers, W. W.; Cohen, W. E.; Srivastava, A. M. Temperature dependence of Mn4+ emission intensity and lifetime in TriGain® phosphor (K2SiF6:Mn4+). ECS J. Solid State Sci. Technol. 2023, 12, 116002. [Google Scholar] [CrossRef]
- Senden, T.; Dijk-Moes, R. J. A.; Meijerink, A. Quenching of the red Mn4+ luminescence in Mn4+-doped fluoride LED phosphors. Light- Sci. Appl 2018, 7, 8. [Google Scholar] [CrossRef] [PubMed]
- Shao, Q.; Wang, L.; Song, L.; Dong, Y.; Liang, C.; He, J.; Jiang, J. Temperature dependence of photoluminescence spectra and dynamics of the red-emitting K2SiF6:Mn4+ phosphor. J. Alloys Compd. 2017, 695, 221–226. [Google Scholar] [CrossRef]
- Tang, F.; Su, Z.; Ye, H.; Gao, W.; Pan, X.; Xu, S. Large negative-thermal-quenching effect in phonon-induced light emissions in Mn4+-activated fluoride phosphor for warm-white light-emitting diodes. ACS Omega 2018, 3, 13704–13710. [Google Scholar] [CrossRef] [PubMed]
- Zhu, H.; Lin, C. C.; Luo, W.; Shu, S.; Liu, Z.; Liu, Y.; Kong, J.; Ma, E.; Cao, Y.; Liu, R.-S.; Chen, X. Highly efficient non-rare-earth red emitting phosphor for warm white light-emitting diodes. Nat. Commun. 2014, 5, 4312. [Google Scholar] [CrossRef]
- Zhou, Q.; Zhou, Y.; Wang, Z.; Liu, Y.; Chen, G.; Peng, J.; Yan, J.; Wu, M. Fabrication and application of non-rare earth red phosphors for warm white-light-emitting diodes. RSC Adv. 2015, 5, 84821–84826. [Google Scholar] [CrossRef]
- Adachi, S. Investigation on anomalous thermal quenching of Mn4+ luminescence in A2XF6:Mn4+. ECS J. Solid State Sci. Technol. 2021, 10, 076007. [Google Scholar] [CrossRef]
- Adachi, S. Negative thermal quenching of Mn4+ luminescence in fluoride phosphors: effects of the 4A2g → 4T2g excitation transitions and normal thermal quenching. ECS J. Solid State Sci. Technol. 2022, 11, 036001. [Google Scholar] [CrossRef]
- Zhang, D.; Zhou, J.; Cao, X.; Ge, X.; Tang, F.; Zheng, C.; Ning, J.; Xu, S. Manipulation of temperature-dependent luminescence behaviors of Mn4+-activated fluoride phosphors. J. Phys. Chem. Lett. 2023, 14, 6464–6469. [Google Scholar] [CrossRef]
- Deng, T.; Zhang, S.; Zhou, R.; Yu, T.; Wu, M.; Zhang, X.; Chen, K.; Zhou, Y. Defect-related luminescence behavior of a Mn4+ non-equivalently doped fluoroantimonate red Phosphor. Dalton Trans. 2022, 51, 608–617. [Google Scholar] [CrossRef]
- Yang, X.; Liao, C.; Jin, Z.; Wang, Q.; Xie, W.; Yang, P.; Wang, Z. Luminescent properties of Mn4+ in an oxyfluoride complex with ultra-high thermal stability. Mater. Res. Bull. 2022, 150, 111798. [Google Scholar] [CrossRef]
- Wang, C.; Cai, Y.; Zhang, H.; Liu, Z.; Lv, H.; Zhu, X.; Liu, Y.; Wang, C.; Qiu, J.; Yu, X.; Xu, X. Variation from zero to negative thermal quenching of phosphor with assistance of defect states. Inorg. Chem. 2021, 60, 19365–19372. [Google Scholar] [CrossRef] [PubMed]
- Wei, Y.; Yang, H.; Gao, Z.; Yun, X.; Xing, G.; Zhou, C.; Li, G. Anti-thermal-quenching Bi3+ luminescence in a cyan-emitting Ba2ZnGe2O7:Bi phosphor based on zinc vacancy. Laser Photonics Rev. 2021, 5, 2000048. [Google Scholar] [CrossRef]
- Li, H.; Cai, J.; Pang, R.; Zhang, S.; Jiang, L.; Li, D.; Li, C.; Feng, J.; Zhang, H. A strategy for developing thermal-quenching resistant emission and super-long persistent luminescence in BaGa2O4:Bi3+. J. Mater. Chem. C 2019, 7, 13088–13096. [Google Scholar] [CrossRef]
- Ma, Q.; Guo, N.; Xin, Y.; Shao, B. Preparation of zero-thermal-quenching tunable emission bismuth-containing phosphors through the topochemical design of ligand configuration. Inorg. Chem. Front. 2021, 8, 4072–4085. [Google Scholar] [CrossRef]
- Yang, S.; Wu, Y.; Yue, F.; Qi, R.; Jiang, B.; Wu, J.; Shen, Y.; Duan, C.; Shan, Y.; Zhao, Q.; Zhang, Y. MGa2B2O7:Bi3+,Al3+ (M = Sr, Ba) blue phosphors with a quantum yield of 99% and negative thermal quenching. Inorg. Chem. Front. 2021, 8, 4257–4266. [Google Scholar] [CrossRef]
- Wang, Z.; Lin, H.; Zhang, D.; Hong, R.; Tian, Y.; Chen, J.; Zhou, S. Reidinger defects induced thermally stable green emission from Eu2+, Mn2+ co-doped Ba0.75Al11O17.25 transparent ceramics. J. Eur. Ceram. Soc. 2022, 42, 266–273. [Google Scholar] [CrossRef]
- Zhong, J.; Zhou, Y.; Hariyani, S.; Zhao, W.; Zhuang, W.; Brgoch, J. Thermally robust and color-tunable blue-green-emitting BaMgSi4O10:Eu2+,Mn2+ phosphor for warm-white LEDs. Inorg. Chem. 2020, 59, 13427–13434. [Google Scholar] [CrossRef] [PubMed]
- Shi, R.; Cao, S.; Han, Y.; Zhang, J.; Zhang, X.; Liao, S.; Lian, S. Defect and energy transfer induced abnormal thermally stable and highly efficient narrow-band green emission. Appl. Mater. Today 2022, 29, 101625. [Google Scholar] [CrossRef]
- Zhu, H.; Huang, X.; Li, Y.-N.; She, Y.-l.; Wang, J.; Wong, W.-Y.; Liu, M.; Li, W.; Zhou, Z.; Xia, M. Novel ultra-high-temperature zero-thermal quenching plant-protecting type blue-green dual-emission KAl11O17:Eu2+,Mn2+ phosphors for urban ecological lighting. J. Mater. Chem. C 2022, 10, 3461–3471. [Google Scholar] [CrossRef]
- Liu, D.; Wang, T.; Liu, Y.; Wang, C.; Liu, Z.; Zhu, X.; Liu, Y.; Zhang, J.; Teng, Z.; Zhong, Y.; Nikolaevich, Y. A.; Xu, X. Zero-thermal-quenching of LiAl5O8: Eu2+, Mn2+ phosphors by energy transfer and defects engineering. Ceram. Inter. 2023, 49, 10273–10279. [Google Scholar] [CrossRef]
- Liu, Y.; Zhang, G.; Huang, J.; Tao, X.; Li, G.; Cai, G. Daylight-white-emitting and abnormal thermal antiquenching phosphors based on a layered host SrIn2(P2O7)2. Inorg. Chem. 2021, 60, 2279–2293. [Google Scholar] [CrossRef]
- Ling, S.; Qin, X.; Yan, Y.; Chen, C.; Meng, K.; Ming, J.; Liao, S.; Huang, Y.; Hou, L. Crystal defect induced zero thermal quenching β-NaYF4: Eu3+, Sm3+ red-emitting phosphor. RSC Adv. 2023, 13, 534–546. [Google Scholar] [CrossRef] [PubMed]
- Jiao, M.; Dong, L.; Xu, Q.; Zhang, L.; Wang, D.; Yang, C. The structures and luminescence properties of Sr4Gd3Na3(PO4)6F2:Ce3+,Tb3+ green phosphors with zero-thermal quenching of Tb3+ for WLEDs. Dalton Trans. 2020, 49, 49,667–674. [Google Scholar] [CrossRef] [PubMed]
- Liu, D.; Jin, Y.; Lv, Y.; Ju, G.; Wang, C.; Chen, L.; Luo, W.; Hu, Y. A single-phase full-color emitting phosphor Na3Sc2(PO4)3:Eu2+/Tb3+/Mn2+ with near-zero thermal quenching and high quantum yield for near-UV converted warm w-LEDs. J. Am. Ceram. Soc. 2018, 101, 5627–5639. [Google Scholar] [CrossRef]
- Shi, R.; Ning, L.; Wang, Z.; Chen, J.; Sham, T.-K.; Huang, Y.; Qi, Z.; Li, C.; Tang, Q.; Liang, H. Zero-thermal quenching of Mn2+ red luminescence via efficient energy transfer from Eu2+ in BaMgP2O7. Adv. Optical Mater. 2019, 7, 1901187. [Google Scholar] [CrossRef]
- Zhang, B.-B.; Chen, J.-K.; Ma, J.-P.; Jia, X.-F.; Zhao, Q.; Guo, S.-Q.; Chen, Y.-M.; Liu, Q.; Kuroiwa, Y.; Moriyoshi, C.; Zhang, J.; Sun, H.-T. Antithermal quenching of luminescence in zero-dimensional hybrid metal halide solids. J. Phys. Chem. Lett. 2020, 11, 2902–2909. [Google Scholar] [CrossRef] [PubMed]
- Kahmann, S.; Nazarenko, O.; Shao, S.; Hordiichuk, O.; Kepenekian, M.; Even, J.; Kovalenko, M.V.; Blake, G. R.; Loi, M. A. N. egative thermal quenching in FASnI3 perovskite single crystals and thin films. ACS Energy Lett. 2020, 5, 2512–2519. [Google Scholar] [CrossRef]
- Wei, Y.; Yang, H.; Gao, Z.; Liu, Y.; Xing, G.; Dang, P.; Abdulaziz Kheraif, A. A.; Li, G.; Lin, J.; Liu, R.-S. Strategies for designing antithermal-quenching red phosphors. Adv. Sci. 2020, 7, 1903060. [Google Scholar] [CrossRef]
- Yang, C.; Guo, N.; Qu, S.; Ma, Q.; Liu, J.; Chen, S.; Ouyang, R. Design of anti-thermal quenching Pr3+-doped niobate phosphors based on a charge transfer and intervalence charge transfer band excitation-driven strategy. Inorg. Chem. Front. 2023, 10, 4808–4818. [Google Scholar] [CrossRef]
- Xiao, Y.; Hao, Z. Comment on “Zero-thermal-quenching and photoluminescence tuning with assistance of carriers from defect cluster traps’’ by Chen et al., J. Mater. Chem. C, 2018, 6, 10687-10692. J. Mater. Chem. C 2020, 8, 1151–1152. [Google Scholar] [CrossRef]
- Yan, S. Comment on “Tunable thermal quenching properties of Na3Sc2(PO4)3:Eu2+ phosphors tailored by phase transformation details” by Liu et al., Dalton Trans. 2020,49,3915. Dalton Trans. 2020, 49, 11772–11774. [Google Scholar] [CrossRef]
- Yan, S. Comment on “Investigation on anomalous thermal quenching of Mn4+ luminescence in A2XF6:Mn4+” [ECS J. Solid State Sci. Technol. 10, 076007 (2021)]. ECS J. Solid State Sci. Technol. 2021, 10, 120001. [Google Scholar] [CrossRef]
- Yan, S. On the anomalous thermal quenching of Mn4+ luminescence in A2XF6:Mn4+ (A =K, Na, Rb or Cs; X = Si, Ti, Ge, Sn, Zr or Hf). ECS J. Solid State Sci. Technol. 2020, 9, 106004. [Google Scholar] [CrossRef]
- Yan, S. On the validity of the defect-induced negative thermal quenching of Eu2+-doped phosphors. ECS J. Solid State Sci. Technol. 2023, 12, 016001. [Google Scholar] [CrossRef]
- Wang, L.; Wand, X.; Kohsei, T.; Yoshimura, K.-i.; Izumi, M.; Hirosaki, N.; Xie, R.-J. Highly efficient narrow-band green and red phosphors enabling wider color-gamut LED backlight for more brilliant displays. Opt. Express 2015, 23, 28707–28717. [Google Scholar] [CrossRef]
- Senden, T.; Geitenbeek, R. G.; Meijerink, A. Co-precipitation synthesis and optical properties of Mn4+-doped hexafluoroaluminate w-LED phosphors. Materials 2017, 10, 1322. [Google Scholar] [CrossRef]
- Wei, L.-L.; Lin, C. C.; Wang, Y.-Y.; Fang, M.-H.; Jiao, H.; Liu, R.-S. Photoluminescent evolution induced by structural transformation through thermal treating in the red narrow-band phosphor K2GeF6:Mn4+, ACS Appl. Mater. Interfaces 2015, 7, 10656–10659. [Google Scholar] [CrossRef]
- Setlur, A. A.; Radkov, E. V.; Henderson, C. S.; Her, J.-H.; Srivastava, A. M.; Karkada, N.; Kishore, M. S.; Kumar, N. P.; Aesram, D.; Deshpande, A.; Kolodin, B.; Grigorov, L. S.; Happek, U. Energy-efficient, high-color-rendering LED lamps using oxyfluoride and fluoride phosphors. Chem. Mater. 2010, 22, 4076–4082. [Google Scholar] [CrossRef]
- Sun, X.-Y.; He, Z.; Gu, X. Synthesis, deep red emission and warm WLED applications of K2SiF6:Mn4+ phosphors. J. Photochem. Photobiol. A: Chem. 2018, 350, 69–74. [Google Scholar] [CrossRef]
- Hou, Z.; Tang, X.; Luo, X.; Zhou, T.; Zhang, L.; Xie, R.-J. A green synthetic route to the highly efficient K2SiF6:Mn4+ narrow-band red phosphor for warm white light-emitting diodes. J. Mater. Chem. C 2018, 6, 2741–2746. [Google Scholar] [CrossRef]
- Sijbom, H. F.; Joos, J. J.; Martin, L. I. D. J.; Eeckhout, K. V.; Poelman, D.; Smet, P. F. Luminescent behavior of the K2SiF6:Mn4+ red phosphor at high fluxes and at the microscopic level. ECS J. Solid State Sci. Technol. 2016, 5, R3040–R3048. [Google Scholar] [CrossRef]
- Beers, W.W.; Smith, D.; Cohen, W.E.; Srivastava, A.M. Temperature dependence (13–600 K) of Mn4+ lifetime in commercial Mg28Ge7.55O32F15.04 and K2SiF6 phosphors. Opt. Mater. 2018, 84, 614–617. [Google Scholar] [CrossRef]
- Solé, J. G.; Bausá, L.E.; Jaque, D. An introduction to the optical spectroscopy of inorganic solids. 2005 John Wiley & Sons, Ltd, pp.161-170.
- Paschotta, R. Encyclopedia of laser physics and technology, Vol. 1 & 2. Wiley Online Library, 2008, 856.
- Blasse, G.; Grabmeier, B. C. Luminescent materials, 1st ed., Springer, Berlin,1994.
- Ronda, C. Luminescence, Wiley-VCH Verlag GmbH & Co. KGaA, Weinheim,2008.
- Smet, P. F.; Parmentier, A. B.; Poelman, D. Selecting conversion phosphors for white light-emitting diodes. J. Electrochem. Soc. 2011, 158, R37–R54. [Google Scholar] [CrossRef]
- Yan, S. On the origin of temperature dependence of the emission maxima of Eu2+ and Ce3+- activated phosphors. Opt. Mater. 2018, 79, 172–185. [Google Scholar] [CrossRef]
- Bispo-Jr, A. G.; Saraiva, L. F.; Lima, S. A.M.; Pires, A. M.; Davolos, M. R. Recent prospects on phosphor-converted LEDs for lighting, displays, phototherapy, and indoor farming. J. Lumin. 2021, 237, 118167. [Google Scholar] [CrossRef]
- Li, Y.; Deng, D.; Wang, T.; Yu, Y.; Zhong, X.; Wu, D.; Liao, S.; Huang, Y. Negative thermal quenching of K3AlF6:Mn4+@GQDs phosphors caused by enhancement of the conversion of heat energy into light energy. J. Mater. Sci: Mater Electron 2021, 32, 26384–26396. [Google Scholar] [CrossRef]
- Song, E.; Wang, J.; Shi, J.; Deng, T.; Ye, S.; Peng, M.; Wang, J.; Wondraczek, L.; Zhang, Q. Highly efficient and thermally stable K3AlF6:Mn4+ as a red phosphor for ultra-high performance warm-white LEDs, ACS Appl. Mater. Interfaces 2017, 9, 8805–8812. [Google Scholar] [CrossRef] [PubMed]
- Dat, L.Q.; Lan, N. T.; Lien, N.T.K.; Quang, N.V.; Anh, C.V.; Tinh, N.H.; Duyen, N.T.; Thoa, V.T.K.; Hanh, N.T.; Huong, P.T.L.; Tu, N.; Nguyen, D.H. Excellent hydrophobic property of K3AlF6:Mn4+ phosphor by coating with reduction graphene oxide on the surface of materials. Opt. Mater. 2022, 129, 112552. [Google Scholar] [CrossRef]
- Mccamy, C. S. Correlated color temperature as an explicit function of chromaticity coordinates. Color Res. Appl. 1993, 17, 142–144, Erratum in Color Res. Appl. 1993,18,150. [Google Scholar] [CrossRef]
- Shchekin, O. B.; Schmidt, J.; Jin, F.; Lawrence, N.; Vampola, K. J.; Bechtel, H.; Chamberlin, D. R.; Mueller-Mach, R.; Mueller, G. O. Excitation dependent quenching of luminescence in LED phosphors. Phys. Status Solidi RRL 2016, 10, 310–314. [Google Scholar] [CrossRef]
- Jansen, T.; Bohnisch, D.; Justel, T. On the photoluminescence linearity of Eu2+ based LED phosphors upon high excitation density. ECS J. Solid State Sci. Technol. 2016, 5, R91–R97. [Google Scholar] [CrossRef]
- Yan, S. On the origin of diminishing radiative lifetime of Mn4+ in complex fluoride phosphors with temperature. ECS J. Solid State Sci. Technol. 2021, 10, 086005. [Google Scholar] [CrossRef]
- Haar, M. A.; Tachikirt, M.; Berends, A. C.; Krames, M. R.; Meijerink, A.; Rabouw, F. T. Saturation mechanisms in common LED phosphors. ACS Photonics 2021, 8, 1784–1793. [Google Scholar] [CrossRef]
- Bicanic, K. T.; Li, X.; Sabatini, R. P.; Hossain, N.; Wang, C.-F.; Fan, F.; Liang, H.; Hoogland, S.; Sargent, E. H. Design of phosphor white light systems for high-power applications. ACS Photonics 2016, 3, 2243–2248. [Google Scholar] [CrossRef]
- Piquette, A.; Bergbauer, W.; Galler, B.; Mishra, K. C. On choosing phosphors for near-UV and blue LEDs for white light. ECS J. Solid State Sci. Technol. 2016, 5, R3146–R3159. [Google Scholar] [CrossRef]
- Du, F.; Zhuang, W.; Liu, R.; Liu, Y.; Gao, W.; Zhang, X.; Xue, Y.; Hao, H. Synthesis, structure and luminescent properties of yellow phosphor La3Si6N11:Ce3+ for high power white-LEDs. J. Rare Earths 2017, 35, 1059–1064. [Google Scholar] [CrossRef]
- Liu, L.; Fu, L.; Wu, D.; Peng, J.; Wang, R.; Du, F.; Ye, X. Effect of various cerium sources on the emission intensity of Ce3+-doped La3Si6N11 phosphor for high-power white light emitting diodes. Physica B 2021, 603, 412779. [Google Scholar] [CrossRef]
- Ueda, J.; Tanabe, S.; Takahashi, K.; Takeda, T.; Hirosaki, N. Thermal quenching mechanism of CaAlSiN3:Eu2+ red phosphor. Bull. Chem. Soc. Jpn. 2018, 91, 173–177. [Google Scholar] [CrossRef]
- Tsai, Y.-T.; Chiang, C.-Y.; Zhou, W.; Lee, J.-F.; Sheu, H.-S.; Liu, R.-S. Structural ordering and charge variation induced by cation substitution in (Sr,Ca)AlSiN3:Eu phosphor. J. Am. Chem. Soc. 2015, 137, 8936–8939. [Google Scholar] [CrossRef]
- Arjoca, S.; Villora, E. G.; Inomata, D.; Aoki, K.; Sugahara, Y.; Shimamura, K. Temperature dependence of Ce:YAG single-crystal phosphors for high-brightness white LEDs/LDs. Mater. Res. Express 2015, 2, 055503. [Google Scholar] [CrossRef]
- Robbin, D. J. The effects of crystal field and temperature on the photoluminescence excitation efficiency of Ce3+ in YAG. J. Electrochem. Soc. 1979, 126, 1550–1555. [Google Scholar] [CrossRef]
- Wittlin, A.; Przybylińska, H.; Berkowski, M.; Kamińska, A.; Nowakowski, P.; Sybilski, P.; Ma, C.-G.; Brik, M.G.; Suchocki, A. Ambient and high pressure spectroscopy of Ce3+ doped yttrium gallium garnet. Opt. Mater. Exp. 2015, 5, 1868–1880. [Google Scholar] [CrossRef]
- Seto, T.; Kijima, N.; Hirosaki, N. A new yellow phosphor La3Si6N11:Ce3+ for white LEDs. ECS Trans. 2009, 25, 247–252. [Google Scholar]
- Chen, L.; Fei, M.; Zhang, Z.; Jiang, Y.; Chen, S.; Dong, Y.; Sun, Z.; Zhao, Z.; Fu, Y.; He, J.; Li, C.; Jiang, Z. Understanding the local and electronic structures toward enhanced thermal stable luminescence of CaAlSiN3:Eu2+. Chem. Mater. 2016, 28, 5505–5515. [Google Scholar] [CrossRef]
- Song, Z.; Zu, R.; Liu, X.; He, L.; Liu, Q. Analysis on stability and consistency of intensity measurement of white light emitting diode phosphors. Optik 2016, 127, 2798–2801. [Google Scholar] [CrossRef]
- Würth, C.; Grabolle, M.; Pauli, J.; Spieles, M.; Resch-Genger, U. Relative and absolute determination of fluorescence quantum yields of transparent samples. Nature Protocols 2013, 8, 1535–1550. [Google Scholar] [CrossRef] [PubMed]
- Huang, K.; Deng, T.; Yan, S.; Hu, J. Effect of strontium and phosphorus source on the structure, morphology and luminescence of Sr5(PO4)2SiO4:Eu2+ phosphor prepared by solid-state reaction. Ceram. Inter. 2013, 39, 6713–6720. [Google Scholar] [CrossRef]
- Tsai, Y.-T.; Huang, Y. S.; Majewsk, N.; Mahlik, S.; Muchlis, A. M. G.; Huang, Y.-K.; Huang, Y. L.; Lin, B.-H.; Su, C.; Lin, C. C. Shielding effect and compensation defect study on Na3Sc2(PO4)y:Eu2+,3+ (y = 2.6–3.0) phosphor by anion-group-induced phase transition. J. Mater. Chem. C 2022, 10, 15044–15050. [Google Scholar] [CrossRef]
- Rohwer, L. S.; Martin, J. E. Measuring the absolute quantum efficiency of luminescent materials. J. Lumin 2005, 115, 77–90. [Google Scholar] [CrossRef]
- Leyre, F. S.; Coutino-Gonzalez, E.; Joos, J. J.; Ryckaert, J.; Meuret, Y.; Poelman, D.; Smet, P. F.; Durinck, G.; Hofkens, J.; Deconinck, G.; Hanselae, P. Absolute determination of photoluminescence quantum efficiency using an integrating sphere setup, Rev. Sci. Instrum. 2014, 85, 123115. [Google Scholar] [CrossRef] [PubMed]
- Würth, C.; Grabolle, M.; Pauli, J.; Spieles, M.; Resch-Genger, U. Comparison of methods and achievable uncertainties for the relative and absolute measurement of photoluminescence quantum yields. Anal. Chem. 2011, 83, 3431–3439. [Google Scholar] [CrossRef]
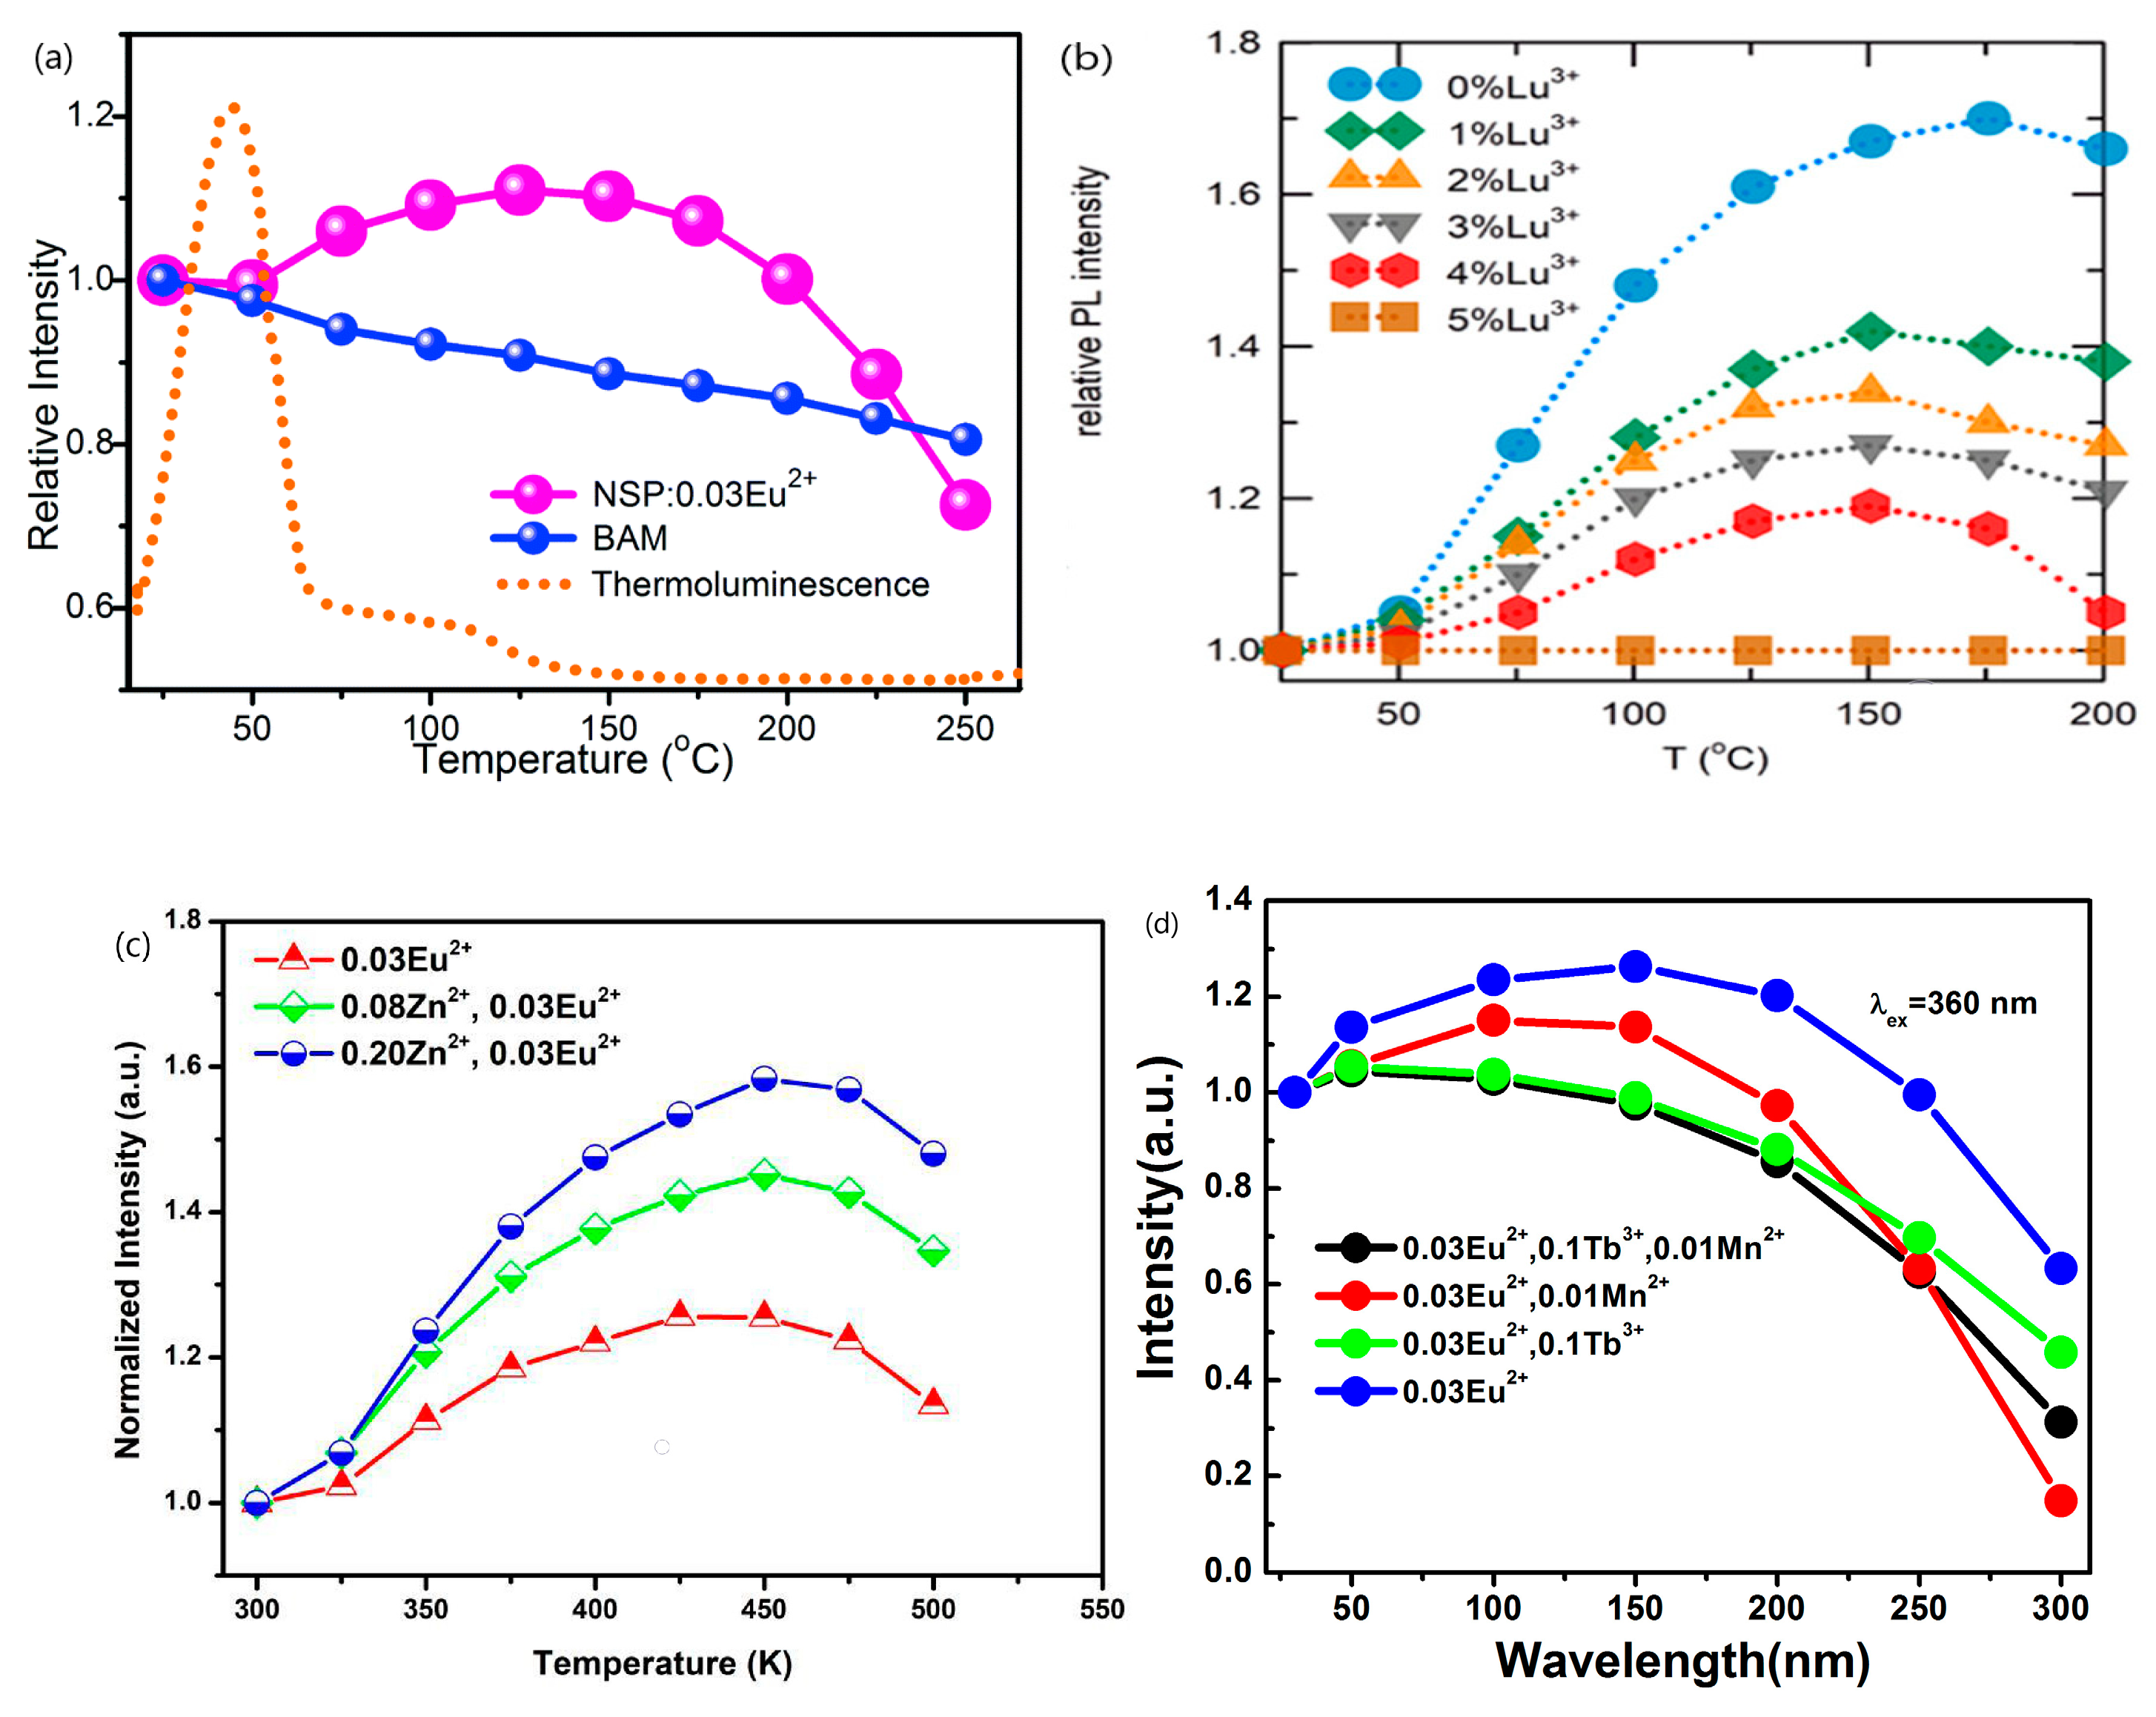
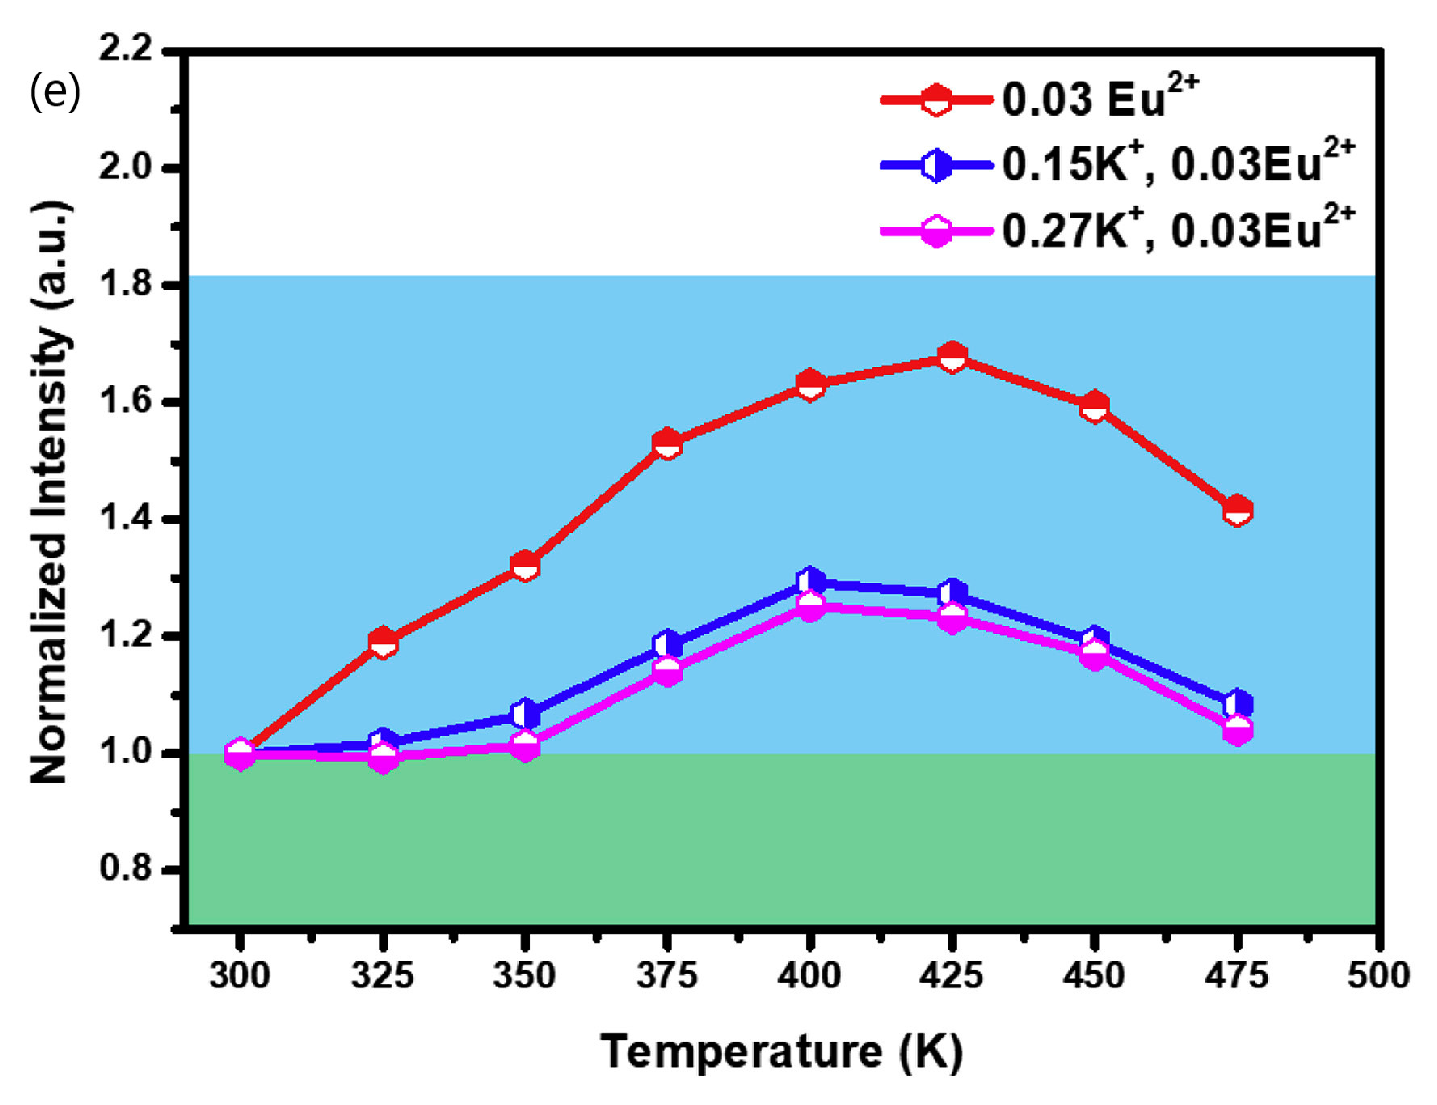
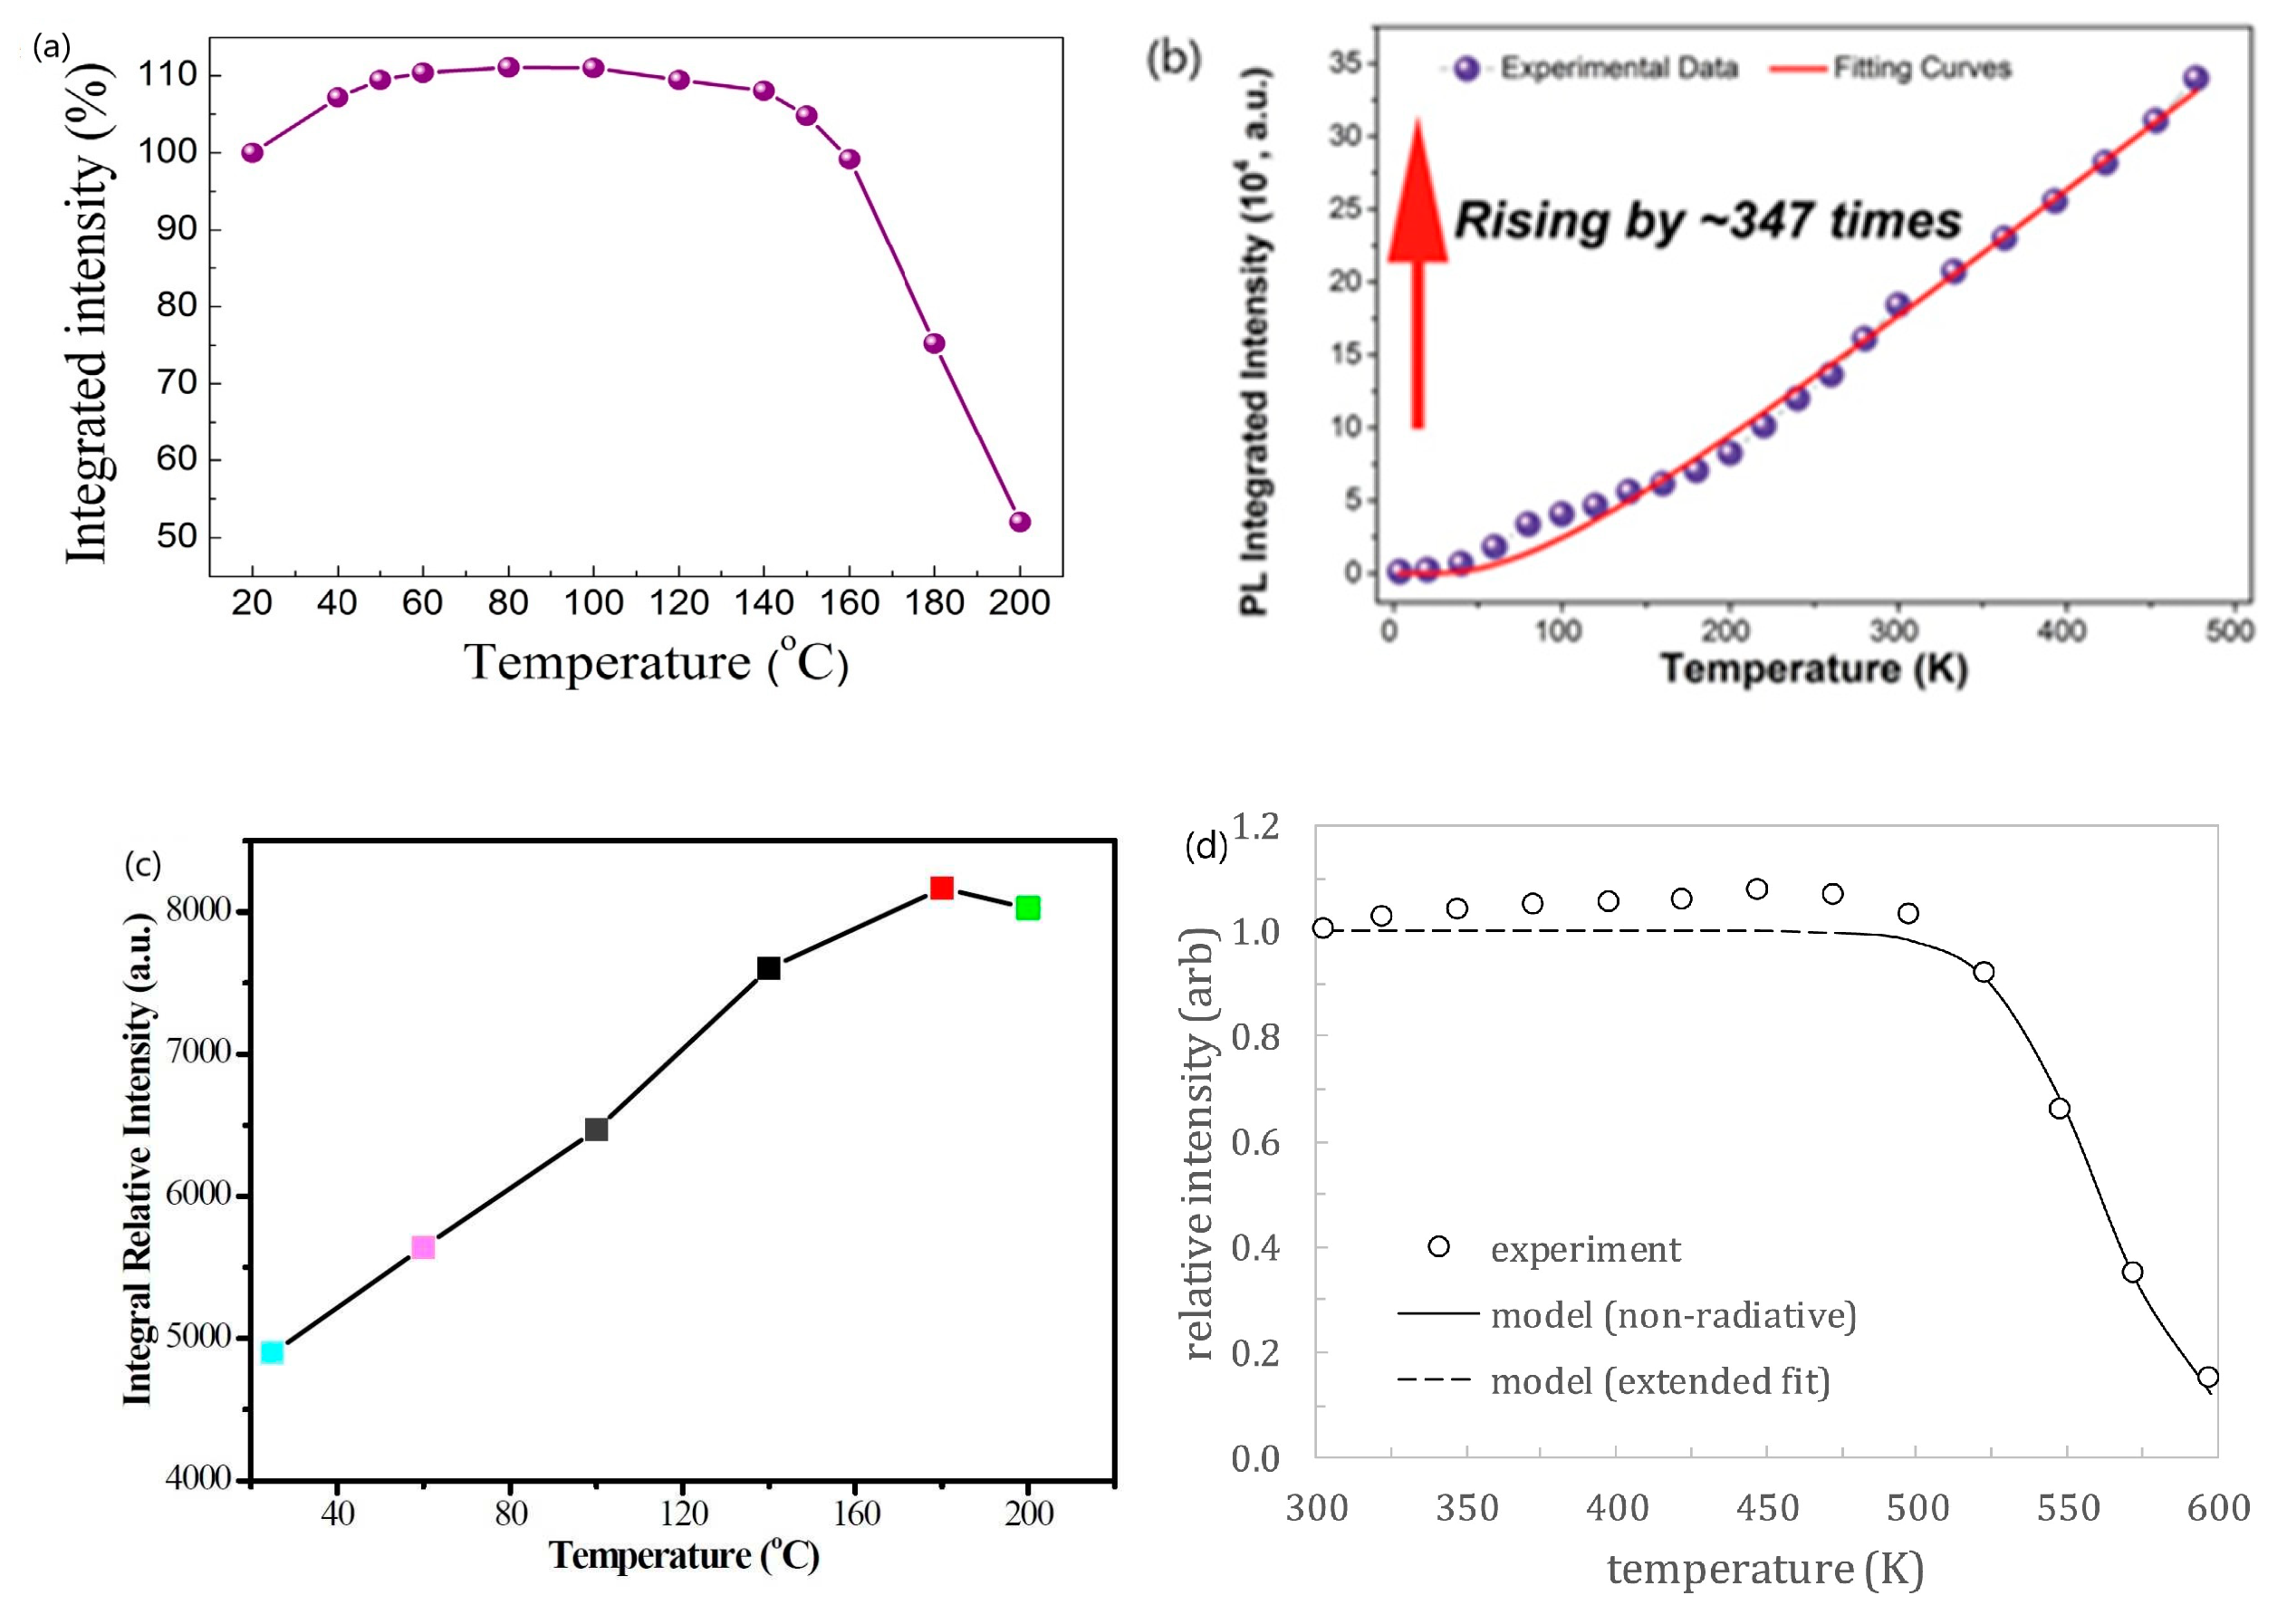
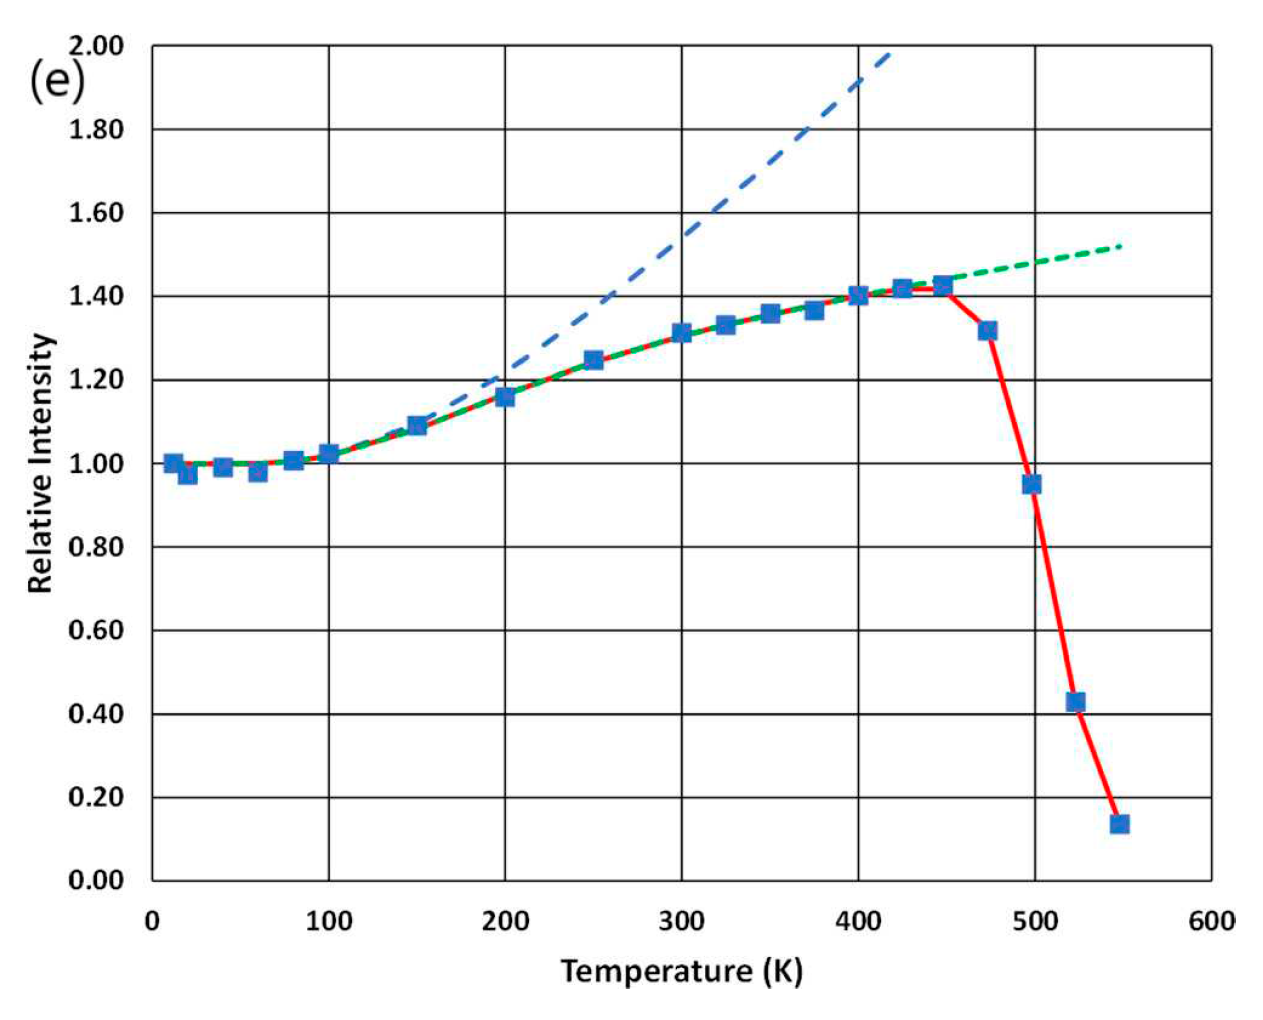
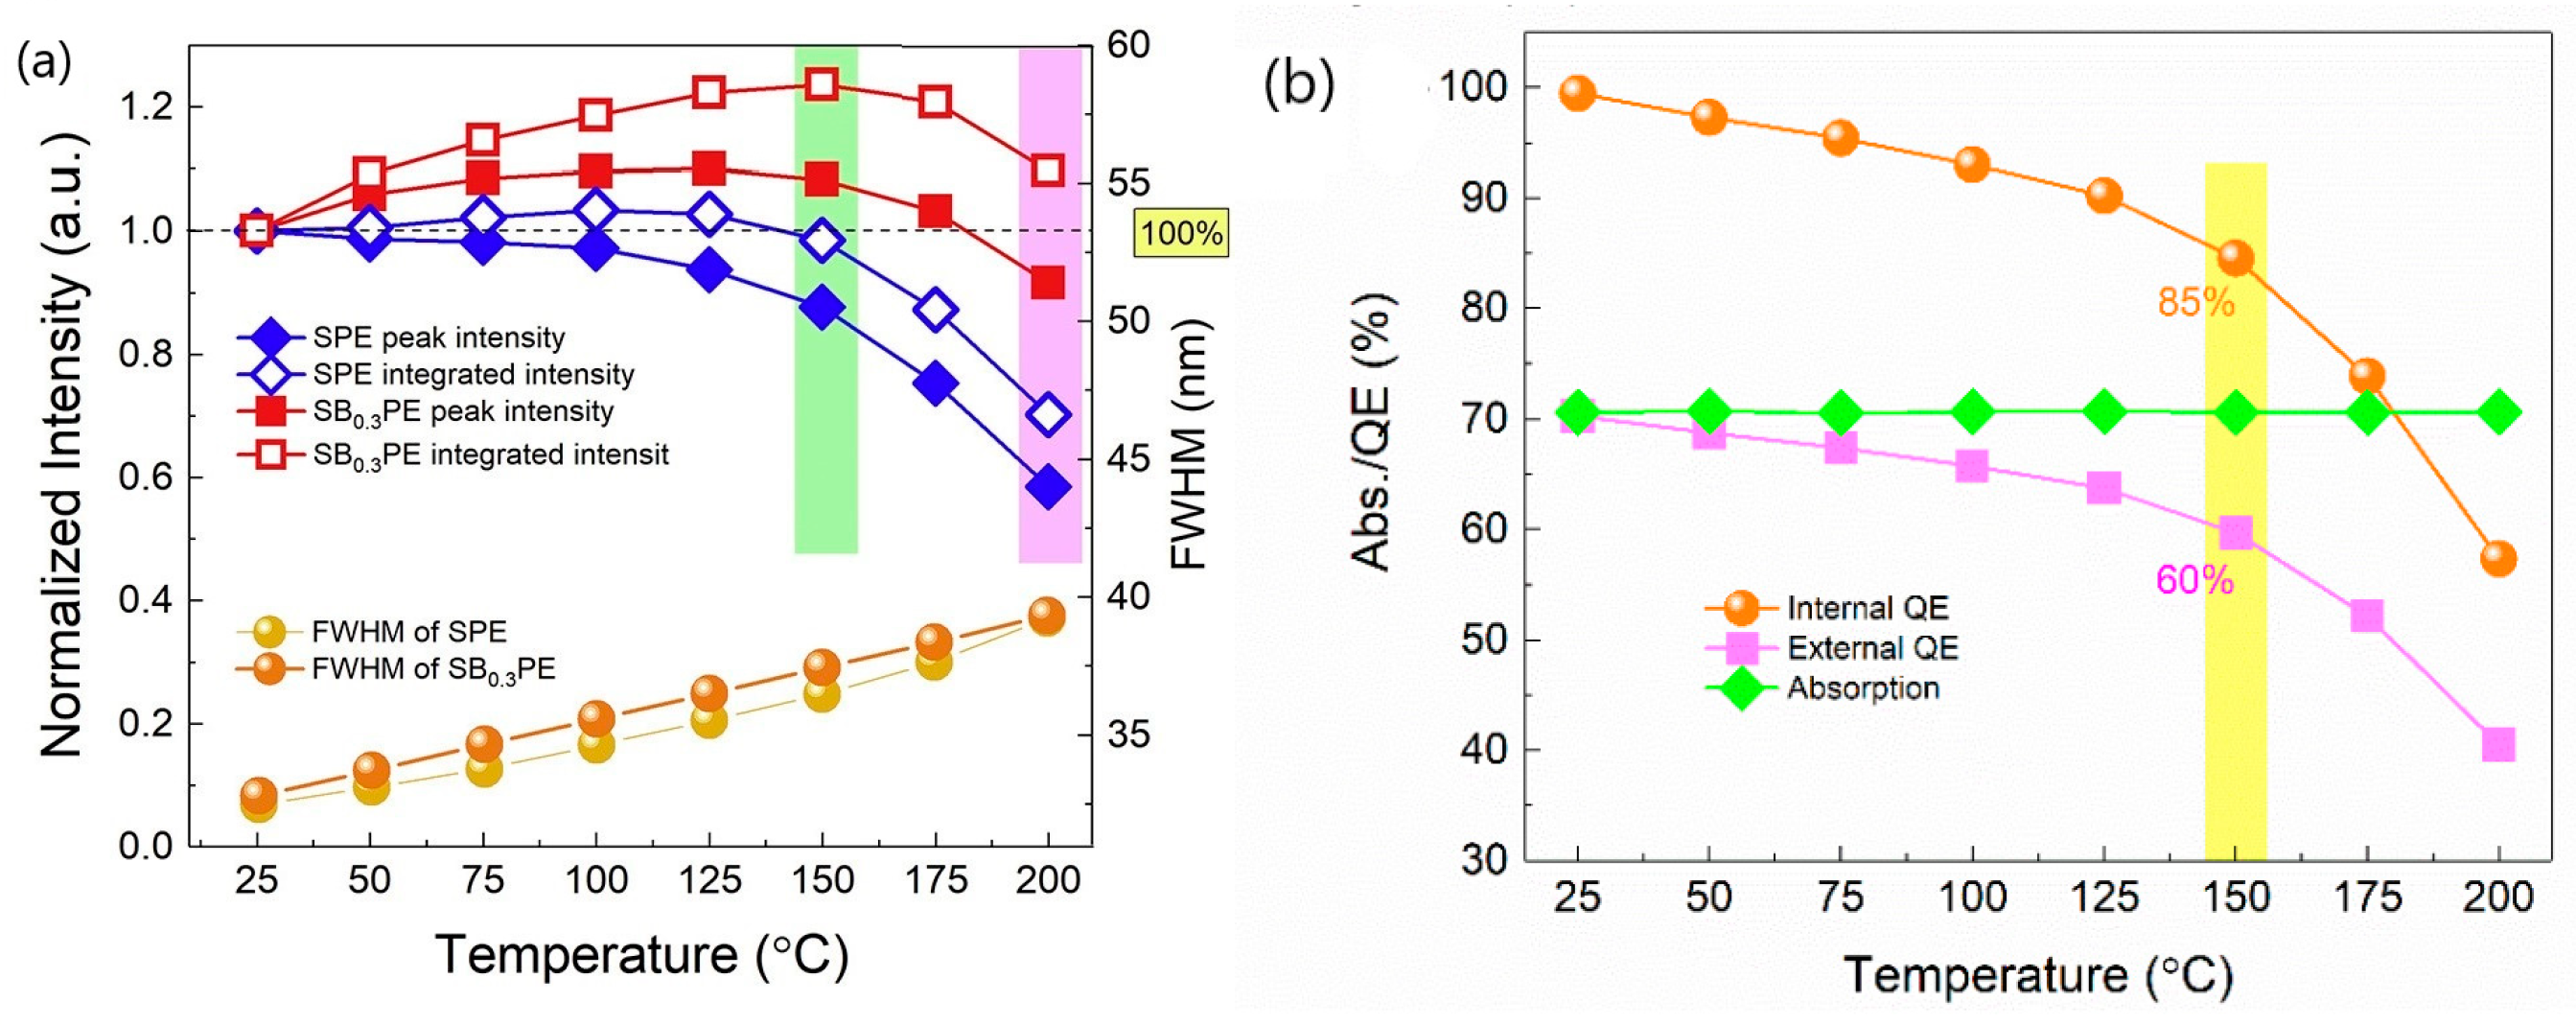
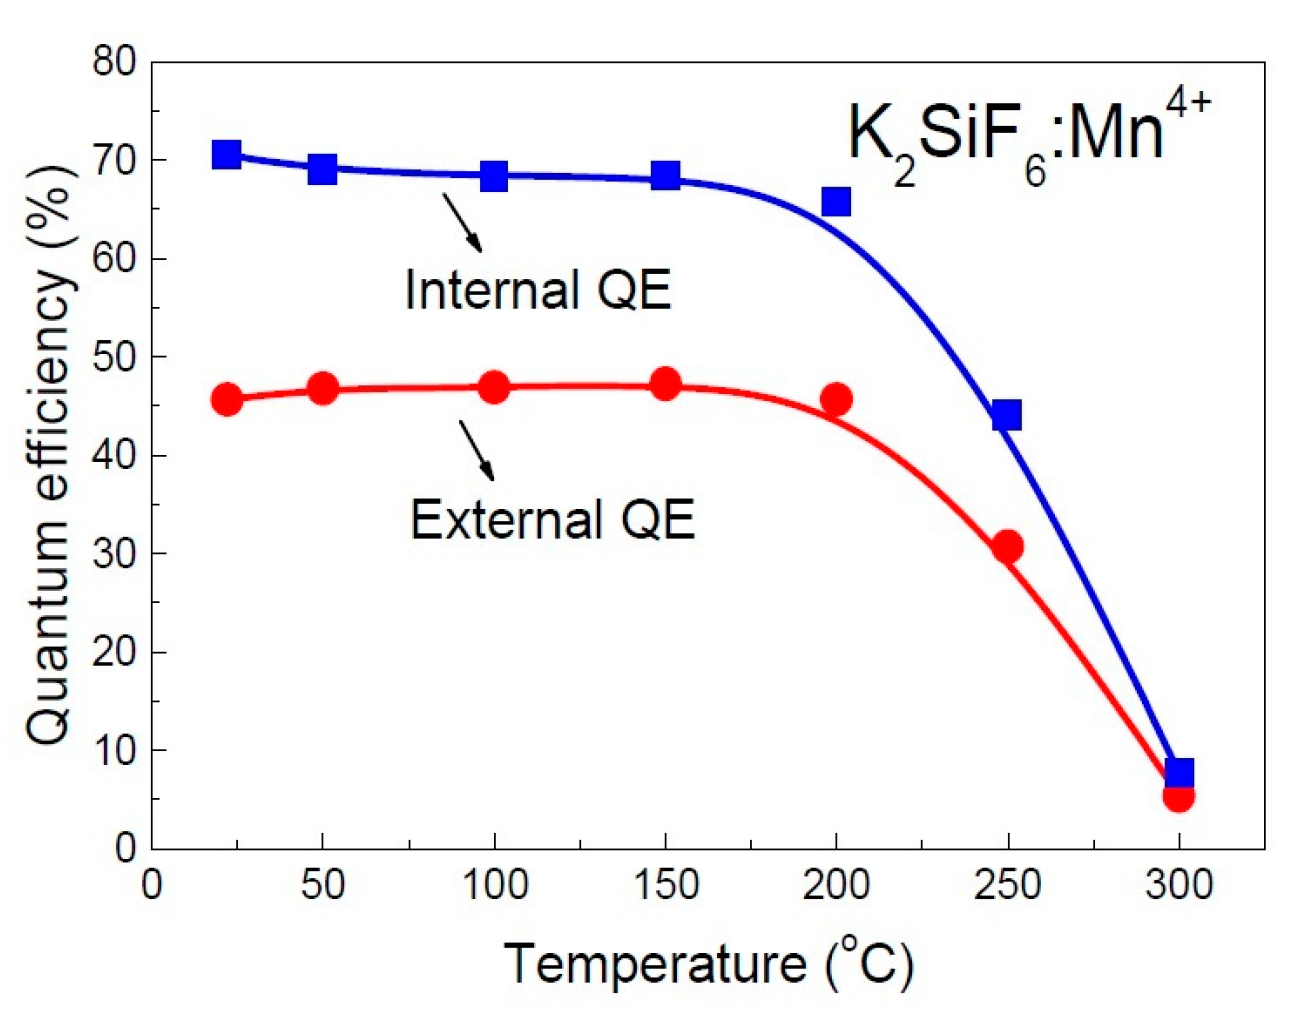
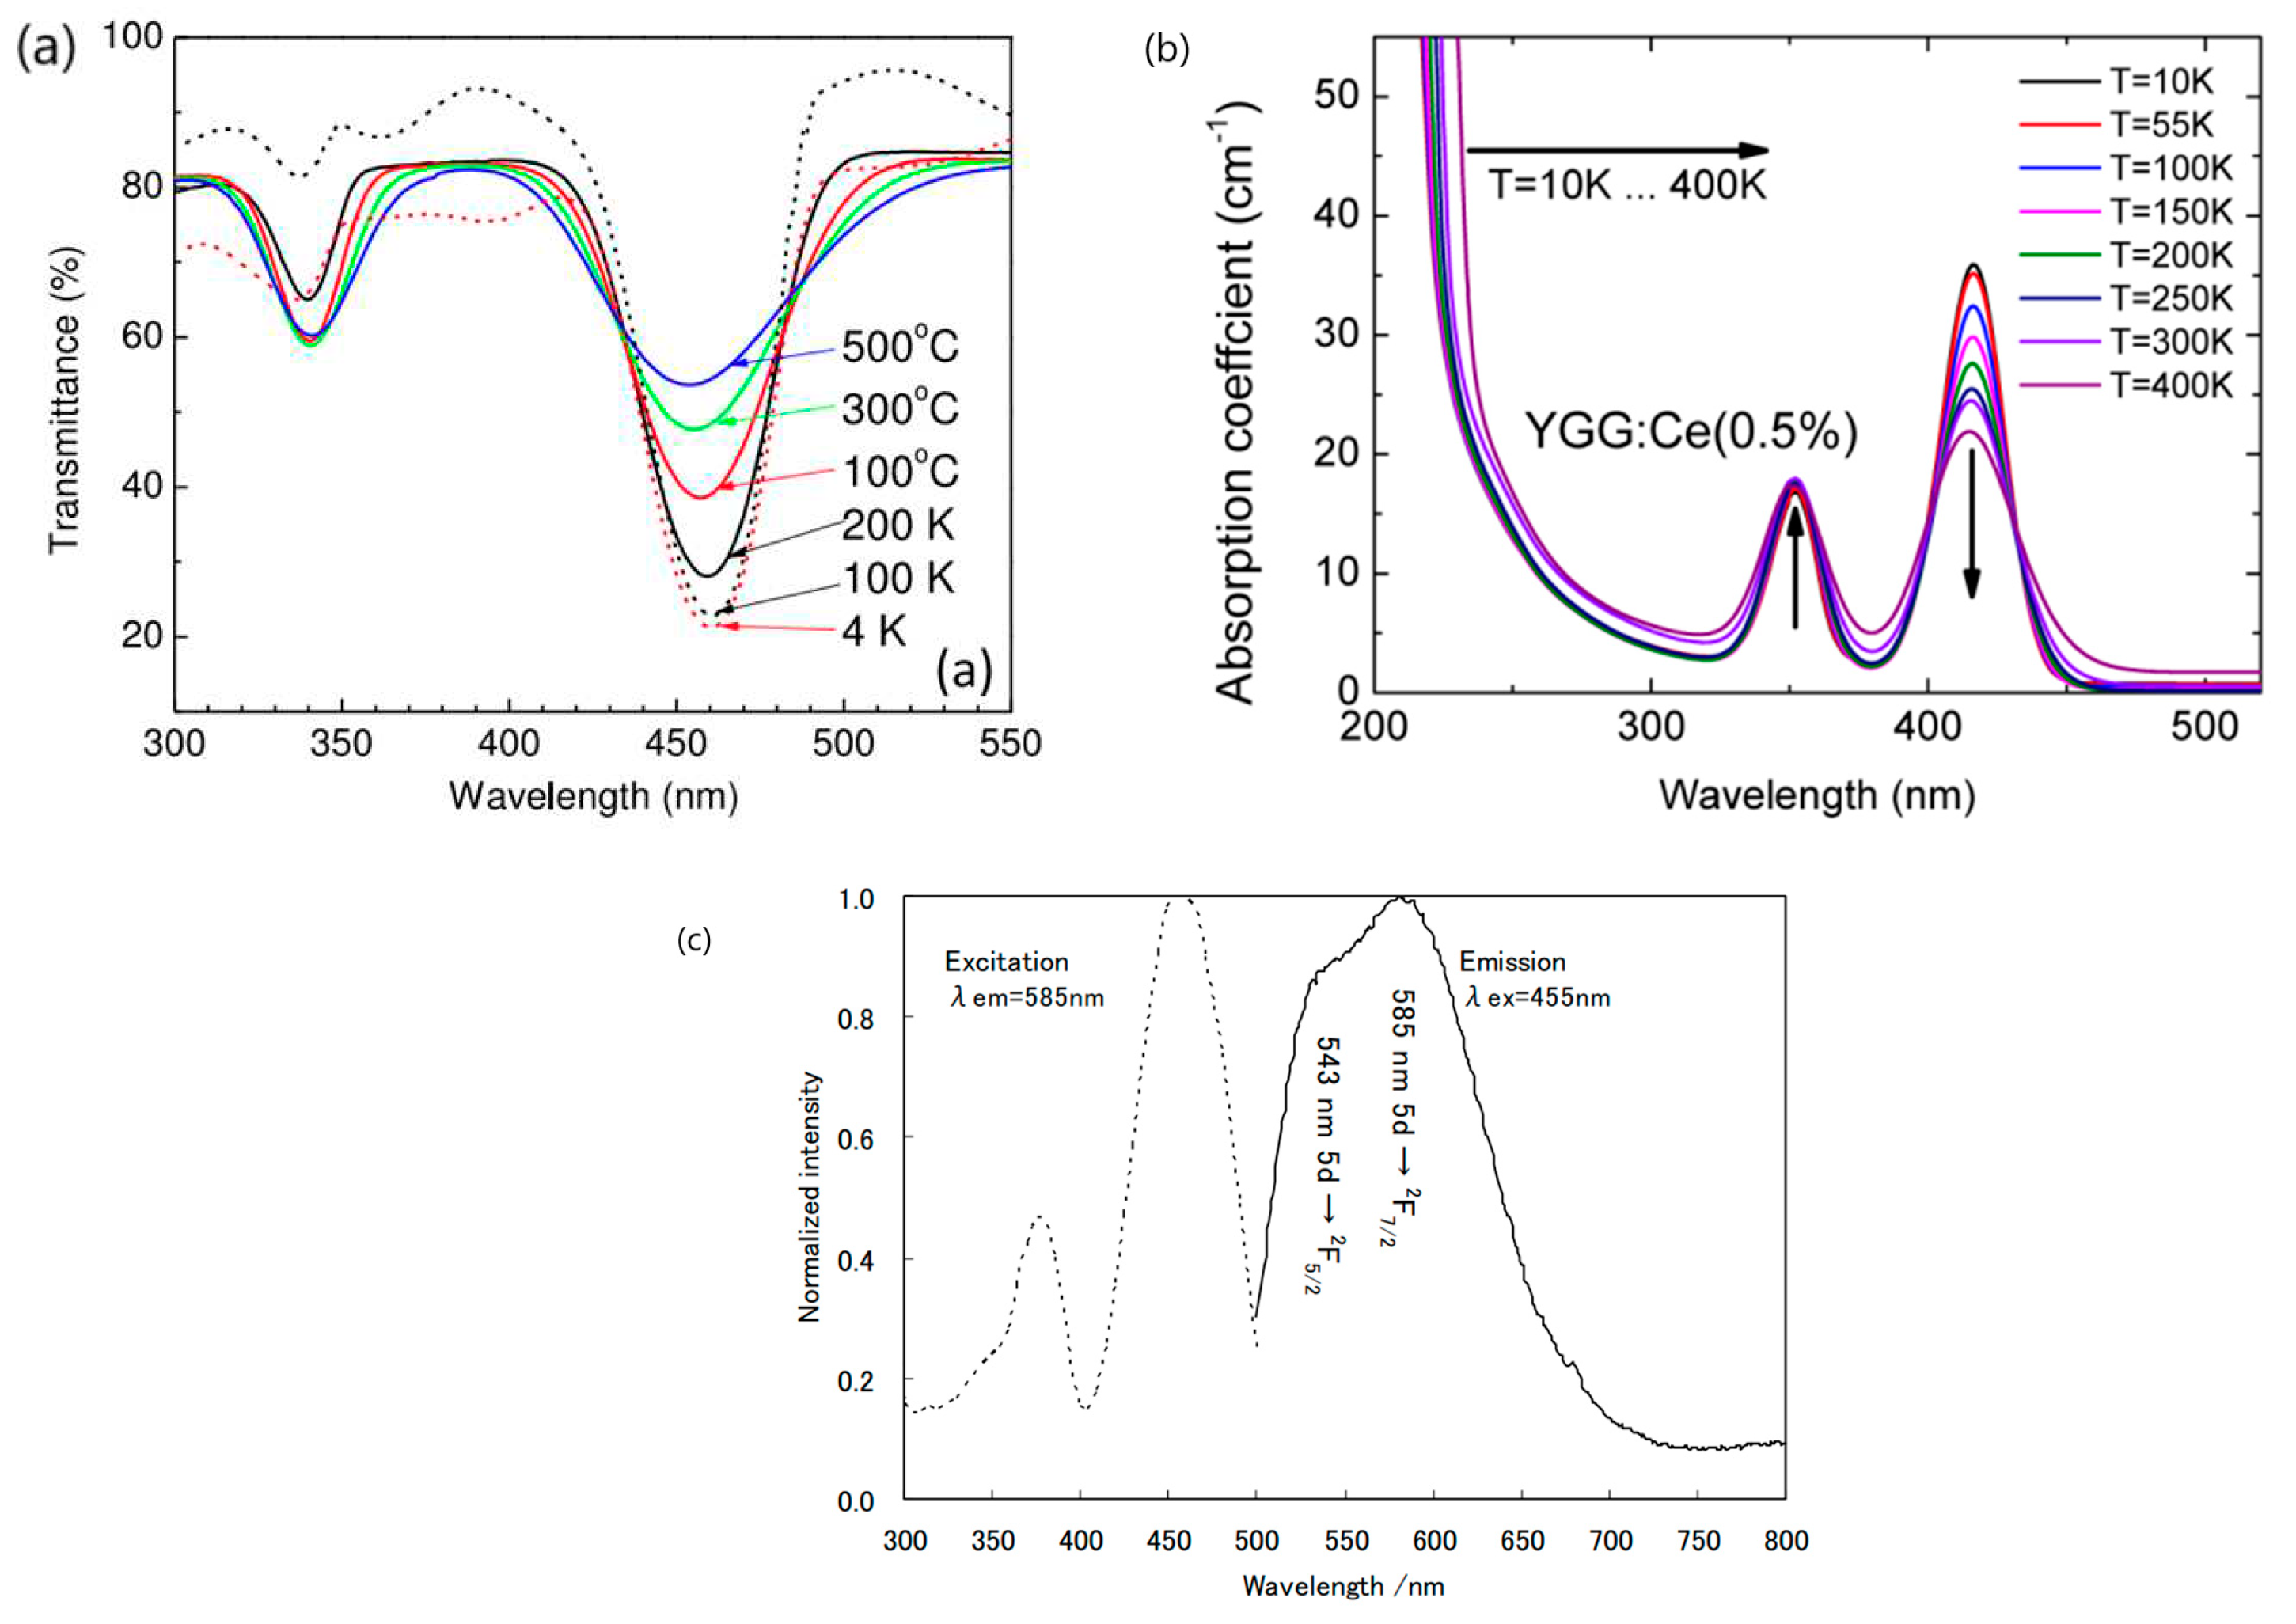
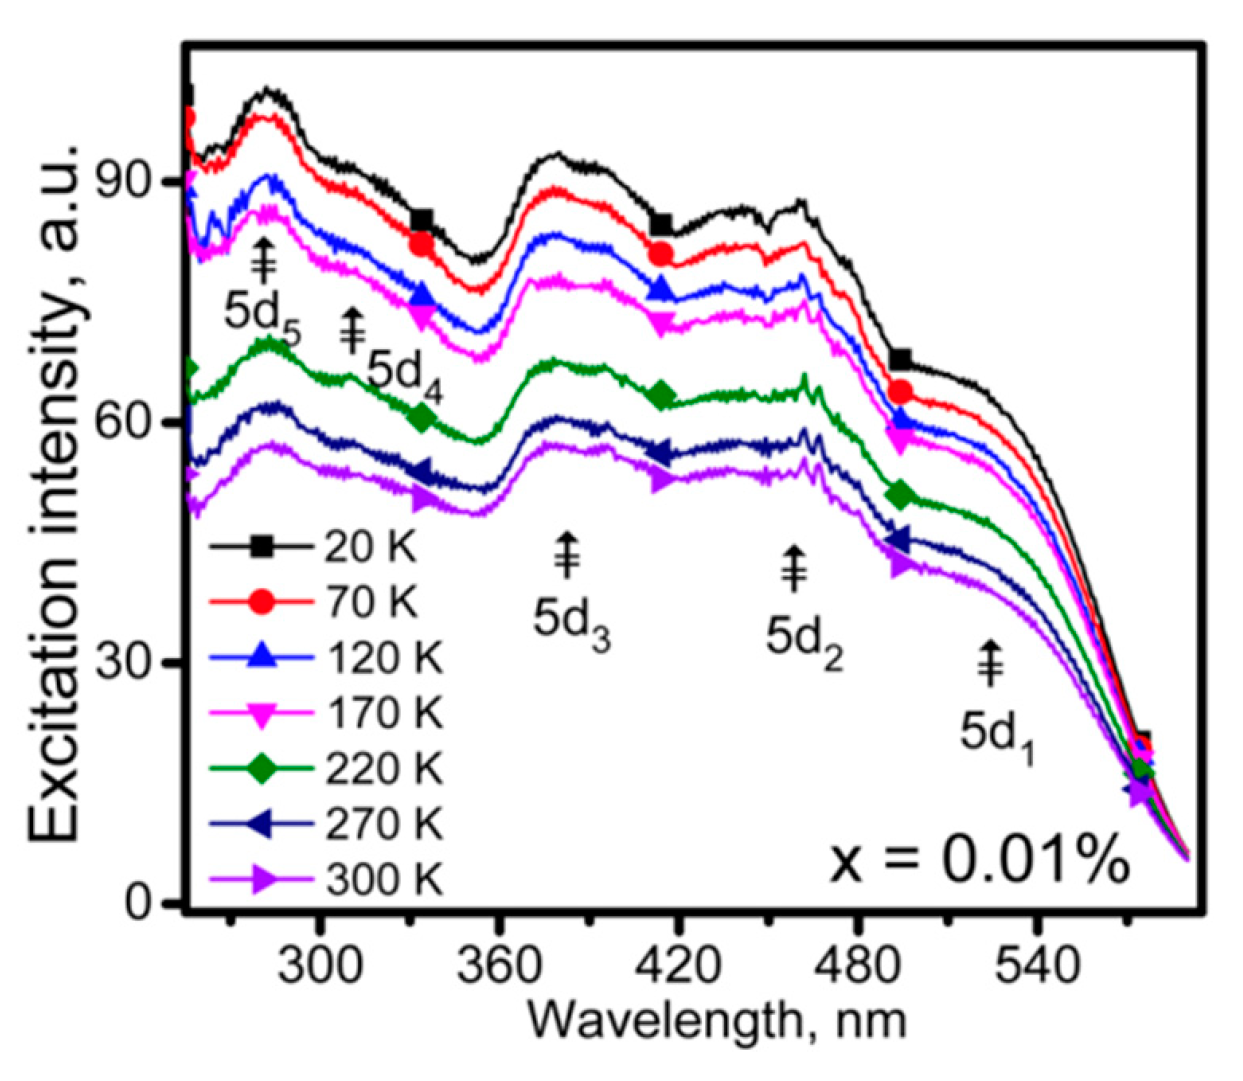

| No | Composition of WLED | Drive current/mA | Chromaticity coordinate | CCT/K | Ref. | |
|---|---|---|---|---|---|---|
| x | y | |||||
| 1 | Blue chip (λ=455nm) + YAG 04 + K2TiF6:Mn4+ |
20 | 0.4575 | 0.4124 | 2748 | 51 |
| 40 | 0.4588 | 0.4160 | 2757 | |||
| 60 | 0.4569 | 0.4158 | 2783 | |||
| 80 | 0.4539 | 0.4152 | 2821 | |||
| 100 | 0.4550 | 0.4172 | 2820 | |||
| 120 | 0.4534 | 0.4158 | 2833 | |||
| 2 | Blue chip + YAG:Ce3+ (0.1g) + K3AlF6:Mn4+ (0.4g) |
40 | 0.4208 | 0.4014 | 3270 | 98 |
| 120 | 0.4178 | 0.3951 | 3275 | |||
| 240 | 0.4142 | 0.3874 | 3284 | |||
| 300 | 0.4127 | 0.3832 | 3278 | |||
| 3 | UV chip (λ=365 nm) + Na3Sc2(PO4)3:0.03Eu2+ + La3Si6N11:Ce3+ + (Sr,Ca)AlSiN3:Eu2+ |
100 | 0.2989 | 0.3502 | 7041b | 2 |
| 200 | 0.2968 | 0.3531 | 7116 | |||
| 300 | 0.2958 | 0.3574 | 7121 | |||
| 400 | 0.2952 | 0.3602 | 7121 | |||
| 500 | 0.2953 | 0.3617 | 7101 | |||
| 600 | 0.2957 | 0.3625 | 7075 | |||
| 700 | 0.2963 | 0.3632 | 7040 | |||
| 800 | 0.2970 | 0.3633 | 7006 | |||
| 900 | 0.2975 | 0.3639 | 6978 | |||
| 1000 | 0.2982 | 0.3639 | 6945 | |||
| 4 | UV chip (λ=365 nm) + Sr1.38Ba0.6P2O7:0.02Eu2+ + (SrBa)2SiO4:Eu2+ + (Sr,Ca)AlSiN3:Eu2+ |
25 | 0.3958 | 0.4065 | 3831 | 12 |
| 50 | 0.3957 | 0.4050 | 3823 | |||
| 75 | 0.3957 | 0.4036 | 3814 | |||
| 100 | 0.3956 | 0.4028 | 3811 | |||
| 125 | 0.3955 | 0.4019 | 3807 | |||
| 150 | 0.3955 | 0.4008 | 3799 | |||
| 175 | 0.3956 | 0.3997 | 3789 | |||
| 200 | 0.3958 | 0.3984 | 3775 | |||
Disclaimer/Publisher’s Note: The statements, opinions and data contained in all publications are solely those of the individual author(s) and contributor(s) and not of MDPI and/or the editor(s). MDPI and/or the editor(s) disclaim responsibility for any injury to people or property resulting from any ideas, methods, instructions or products referred to in the content. |
© 2023 by the authors. Licensee MDPI, Basel, Switzerland. This article is an open access article distributed under the terms and conditions of the Creative Commons Attribution (CC BY) license (http://creativecommons.org/licenses/by/4.0/).


