Preprint
Article

Feasibility Study on Hydrogen Blending into Tunisian Natural Gas Distributing System

Altmetrics

Downloads

245

Views

97

Comments

0

Submitted:

08 December 2023

Posted:

11 December 2023

You are already at the latest version

Alerts
Abstract
Natural gas plays a significant role in Tunisia's energy mix. Tunisia imports 66% of natural gas (NG) from Algeria (ANG), and the rest is provided by local gas fields mainly Miskar gas (MNG). To counteract this deficit, the Power-to-Gas approach emerges as a promising solution, given Tunisia's abundant renewable energy resources. By blending green hydrogen into the NG network, it is possible to (i) address the current energy crisis, (ii) lower the carbon intensity of the gas grid, and (iii) encourage sector coupling through the use of various renewable energy sources. This study presents an overview of various interchangeability indicators and investigates accordingly the allowable ratios for hydrogen blending with two types of natural gas distributed in Tunisia (ANG and MNG). It also explores the impact of hydrogen injection on the energy content variation and various combustion parameters. The results confirm that both ANG and MNG can withstand a maximum hydrogen blend of up to 20%. The article concludes with recommendations for further experimental testing of the findings and emphasizes the need to look into infrastructure and safety requirements with regards to the Natural gas network in Tunisia. This research serves as a critical step towards harnessing the potential of green hydrogen in Tunisia.
Keywords: 
Subject: Engineering  -   Energy and Fuel Technology

1. Introduction

In the face of the growing energy demand and the imperative to mitigate climate change, the adoption of renewable energies has become indispensable. However, the low energy efficiency and intermittency of renewables restrict their widespread direct usage [1]. Green Hydrogen is recognized for its ability to enable the indirect use of electricity, sector coupling, and long-term storage of electricity from intermittent renewable sources [2,3]. It is therefore a key element in the stability of the energy mix of tomorrow. By converting excess electricity into hydrogen, we can effectively store and utilize renewable energy that would otherwise go to waste. This allows us to decouple energy generation from energy consumption, providing a flexible and scalable solution for intermittent renewable energy sources like solar and wind. Furthermore, when hydrogen is used as an energy source, it produces only water vapor as a byproduct, making it a clean and environmentally friendly option. This can help reduce greenhouse gas emissions and mitigate the impact of climate change. Green hydrogen is increasingly being recognized on a global scale as a clean, carbon-free fuel option that can be used to address climate change challenges [4].

1.1. Hydrogen blending in the gas pipelines

By promoting the uptake of renewables, blending hydrogen into the NG network can contribute to the decarbonization of the energy industry [5]. This Power-to-Gas (PtG) option has many benefits [6]. In addition to addressing the large-scale application issue of the use of hydrogen as an energy source, hydrogen blending also addresses the transmission challenge of hydrogen, making it an effective means of reaching the objective of carbon neutrality.
There is a great deal of literature on the topic of transporting hydrogen-natural gas mixtures without changing the existing pipeline infrastructure [7,8,9,10,11]. Several studies on hydrogen and the ability to blend gas (a mixture gas) from these both sources and adjust its composition according to the end user needs, argued that a 20 % threshold is technically feasible without significant modifications to the pipeline infrastructure [12,13,14].
Since the properties of the gas mixture may differ from those of pure natural gas, injecting hydrogen into natural gas pipelines also poses certain technical and safety issues [8]. Technical challenges include issues related to pipeline materials, gas composition including energy consumption, physicochemical and combustion properties, pressure regulation, and the incompatibility of appliances and equipment with hydrogen [9].
Cavana et al. [15] assessed the impact of hydrogen blending on energy consumption, compressor station operation, and the efficiency of energy transport. The study considers four blending scenarios with hydrogen shares of 5%, 10%, 15%, and 20%, while preserving the same energy content as natural gas. According to the study, compressor stations use more energy when hydrogen is present in gas mixtures. Even at a 5% hydrogen blend, the pressure drops under the minimum required value. The presence of hydrogen increases the operating hours of compressors and overall gas consumption, and the compression costs may increase by as much as 32.5%. Despite higher compression costs, the impact on transport efficiency is negligible, with only a 0.2% increase in energy consumption for gas transport.
Vaccariello et al. [16] stated that the blending of hydrogen affects the steady-state fluid dynamics of the gas grids and assesses the compliance with gas quality regulations. The study explores gas quality issues associated with hydrogen integration and concludes that quality violations occur when hydrogen admixture levels exceed 9% vol, with specific gravity being the most stringent constraint.
Countries may have different pipeline infrastructures, characteristics, natural gas compositions and regulations that may affect the feasibility and safety of injecting hydrogen into natural gas pipelines. Therefore, it is necessary to investigate the technical, economic, and regulatory aspects of hydrogen injection in natural gas pipelines in each country to ensure safe and efficient operations and to identify any potential barriers or opportunities for this technology [10,11,12].
In the technical report published by the National Renewable Energy Laboratory (NREL) , Melaina et al. [12] reviewed several studies of hydrogen blending and provided an evaluation specific to the natural gas pipeline system in the US. The report discusses the most important challenges of adding hydrogen to natural gas pipeline networks, including the impact on the end-use System. They stated that injecting hydrogen into natural gas pipeline networks at low concentrations, 5%–15% by volume, appears to be allowable with minimal changes to existing distribution systems or end-use appliances and that this method has the potential to support the integration of renewable energy capacities in the near term.
In the UK, researchers investigated the potential for hydrogen injection in the country’s gas distribution networks and found that injecting a 20 % hydrogen blend is technically feasible [13]. According to a Fraunhofer IEE report [14] studying the limitations of hydrogen blending in the European Gas Grid up to 20 Vol-% of H2-blending seems to be technically feasible.
Ambitions moved beyond research to include demonstration projects aiming to provide practical evidence about the safety and feasibility of hydrogen blending. The HyDeploy project [17], for instance, is UK's First Hydrogen Blending Deployment Project. The project was designed to enable a hydrogen blend of up to 20 % (by volume) to be delivered to customers without resorting to major changes to appliances and the eventual disruption [18,19]. In the UK, achieving a 20% hydrogen blend may prevent 6 million tonnes of CO2 emissions annually.
Another demonstration project is GRHYD aiming to test the injection of hydrogen into the natural gas distribution grid in the region of France, without modification of appliances [20]. The project involved two phases of demonstration. During the first phase, ENGIE injected up to 6% hydrogen by volume into the natural gas grid in Dunkirk, France. During the second phase, the hydrogen blend was increased to up to 20% by volume. The project is another proof of the technical feasibility and safety of blending hydrogen with natural gas [21].

1.2. Gas mixture properties

The goal of this research is to study the feasibility of injecting hydrogen into a natural gas pipeline. However, some crucial gas qualities must be established first before hydrogen may be blended with natural gas.
First, it is crucial to keep in mind that when NG's composition changes, its physicochemical qualities and combustion characteristics alter as well, causing the variation of various properties. This variation in the properties of the NG represents an enormous challenge to provide safe utilisation and ensure efficient combustion. Indeed, combustion equipment is designed to operate within a particular range of gas specifications. Operating beyond this range may induce problems of incomplete combustion and damage to equipment, among others. The concept of interchangeability, which is the ability to substitute one gaseous fuel for another without affecting the operation of gas burning appliances or equipment, is then deemed indispensable for the gas industry.
The first gas mixture property is specific gravity (SG) which refers to the density of gas in relation to the air density at some common reference point. The SG of the gas mixture can be determined by the linear mixing rule shown in the following equation:
S G M i x t u r e = 1 x %     ρ N G + x %     ρ H 2 ρ a i r
where x% is the volumetric percent of hydrogen in the gas mixture. 𝜌𝑁G, 𝜌H2 and 𝜌𝐴𝑖𝑟 are the density of natural gas, hydrogen, and air, respectively.
The second gas mixture property is the higher heating value (HHV), a measure of the amount of thermal energy produced by the complete combustion of a fuel.
The HHV considers the latent heat of vaporization of water in the form of vapor present in the combustion products. The HHV of the gas mixture is as follows:
H H V M i x t u r e = 1 x % H H V N G + x %   H H V H 2
where 𝑥% is the volumetric percent of hydrogen in the gas mixture. 𝐻𝐻𝑉𝑁G and 𝐻𝐻𝑉𝐻2 are the HHV of natural gas and hydrogen, respectively. The heating value can be considered to estimate the efficiency of the fuel; however, this property is not the most important parameter in practical combustion applications [22].
The last but most important gas mixture property is the Wobbe Index (WI). All gases that have the same WI will supply the same amount of energy. In this way, the WI is a simple indicator, easy to use and provides a good generic description of interchangeability [20].
W I M i x t u r e = H H V M i x t u r e 1 x %     ρ N G + x %     ρ H 2 ρ a i r  
The WI allows the comparison of the energy output of different gases during combustion, and whose range determines the gas group. The classification of gases in terms of gas groups is based on their operating characteristics. Each gas group is composed of a reference gas that the appliance operates under during nominal conditions, as well as limit gases that represent extreme variations in the usable gases' characteristics. Additionally, test pressures are used as representatives of the extreme variations of the appliance supply conditions [24].
Although the WI is a crucial interchangeability parameter, ISO 13686:2013 [25] states that it should frequently be used in conjunction with other complementary combustion parameters. Examples of these parameters include the potential of flashback, which is the tendency for the flame to constrict towards the burner port and for combustion to occur there, lifting, which occurs when the burning surface expands to the point where burning shifts from occurring at the port to occurring above it, and yellow tipping, which is an incomplete combustion parameter that may result in the formation of excess hydrocarbons, unacceptable levels of carbon monoxide, and soot deposition [23].
Different gas composition analysis methods and criteria are available and are generally related to a country or region regulations [26]. The French approach known as Delbourg [27] focuses on the definition of indices that indicate the limits of gas combustion. The occurrence of an appliance defect such as incomplete combustion, flame lift, flashback or sooting under reference conditions corresponds to a certain index value.
The Dutton criteria were developed by B.C. Dutton of British Gas [28]. They make it possible to examine interchangeability in Great Britain based on three indices which are the incomplete combustion factor, the lifting index, and the soot index. The criteria assess the tendency of the equivalent mixture towards appliance malfunction by calculating these indices and comparing their values with agreed limit values.
The Weaver multi-index method developed in the USA [29], uses six indices to account for the heating rate of the gas, the feed of combustion air, as well as lifting, flashback, incomplete combustion, and yellow tipping, following the exchange of two gases. The American Gas Association technique (AGA method) [30], which is similar to Weaver's method, makes use of three interchangeability indices to reflect the dynamics and unique characteristics of flame, specifically the degree of "yellowness," lifting, and flashback.
The Knoy factor [31], which provided an early way for measuring the interchangeability degree [27], is another approach worth considering. It uses a single index, with calorific power and specific density serving as the primary determinants of gas interchangeability. The Knoy coefficient has consequently became an equivalent of the Wobbe index (WI).
Table 1 summarizes the different methods applied to determine interchangeability, keeping in mind that these techniques are limited to low pressure burners.

1.3. Tunisian context

According to a study by the Wuppertal Institute [32], Tunisia is one of the countries with a significant potential for the generation of green hydrogen since it plans to have a capacity of 3451 MW and a 35% RE share in the energy mix by 2030. The exploitable onshore and offshore wind energy potential in Tunisia are projected to be 10 GW and 250 GW, respectively [33]. It is estimated that solar PV in the country's central and southern regions have a gross potential of about 840 GWp.
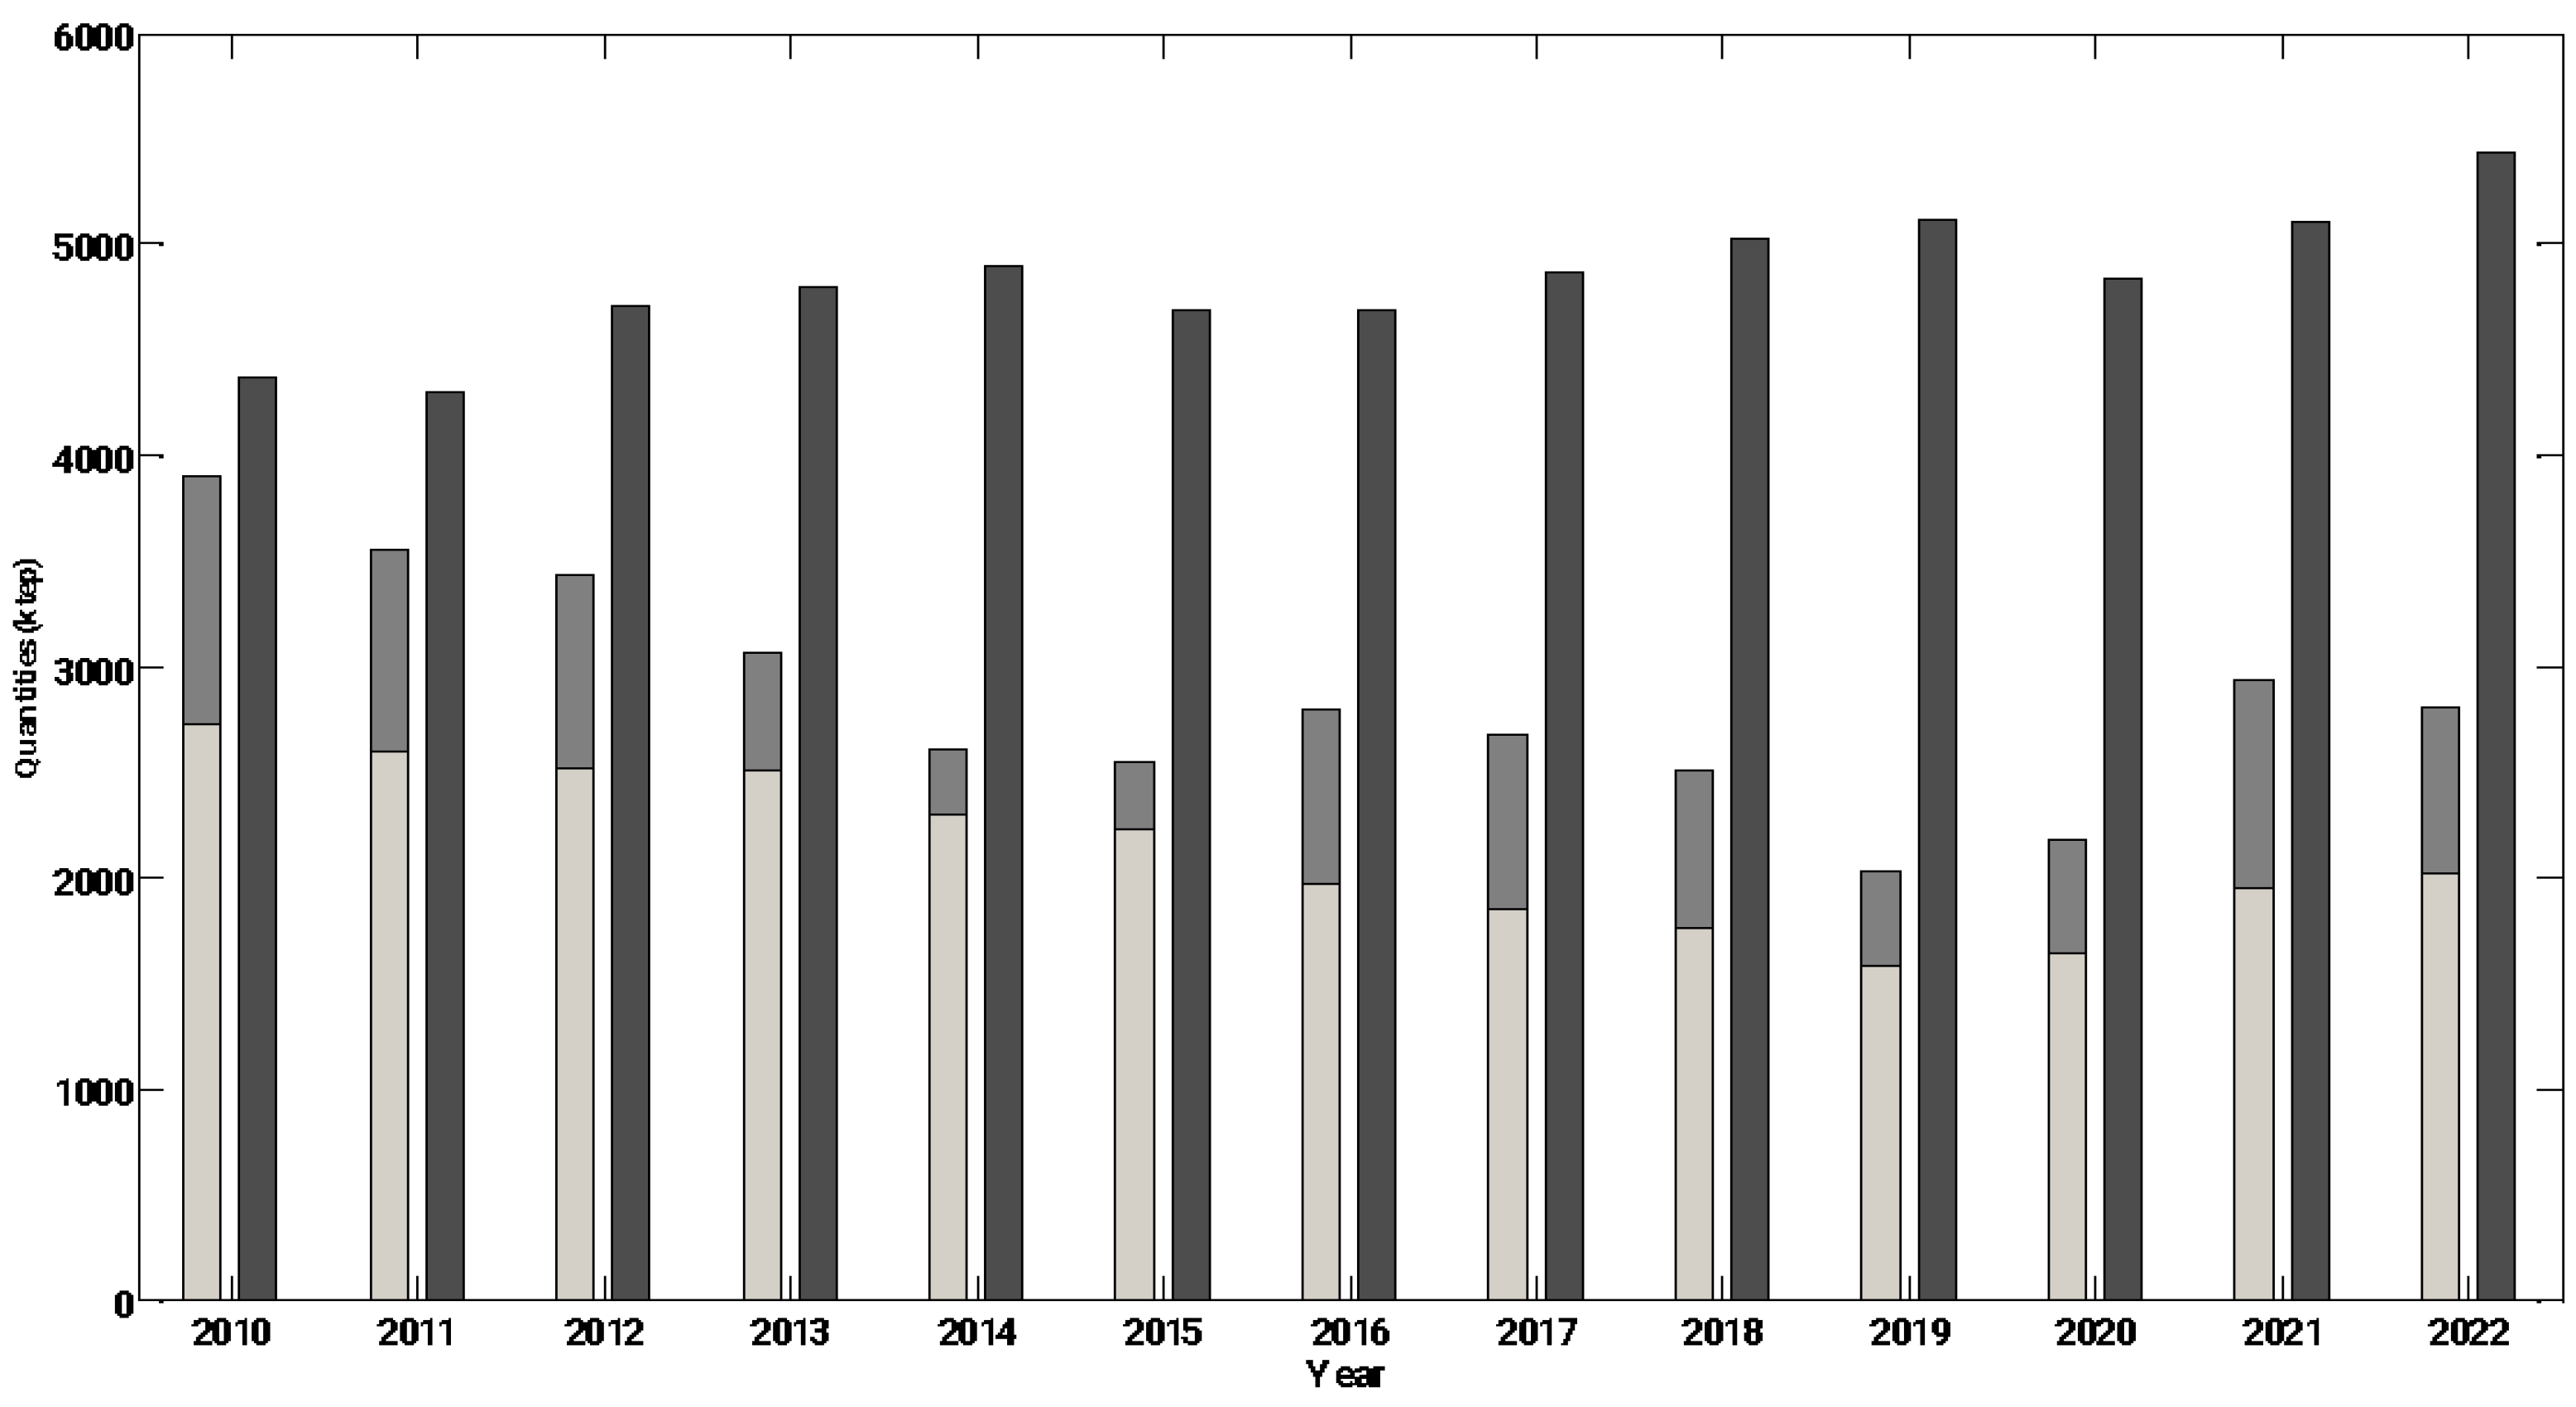
According to the annual report of the Tunisian Company of Electricity and Gas (STEG) [34], NG has endured as the domestic fuel of choice. The country's NG balance since 2010 is shown in Figure 1. Domestic NG production has experienced a decline. Tunisia generates royalties from the gas transported through a pipeline that traverses the country, linking the Algerian gas reserves to Sicily in Italy. Two-thirds of the country’s needs are covered by imports from Algeria, which poses a threat to the security of its energy supply. Even with the recent commencement of operations at new gas fields like the Nawara site, this reliance remains a substantial hurdle for Tunisia’s energy balance.
Notably, Tunisia has an extensive distribution network that encompasses most major cities and industrial hubs. According to the latest report from the national electricity and gas company, STEG, this network is continuously expanding. As of 2020, the gas transportation grid spans 3,000 kilometres, while the distribution network covers an extensive 17,000 kilometres demonstrating the country’s commitment to enhancing its energy infrastructure. The Algerian gas is mainly distributed in the north of the country, and it is mixed with national gas provided by Miskar and Nawara gas fields, to be distributed in the south of Tunisia [35].
The existing pipelines of the Tunisian natural gas network offer several noteworthy advantages. These include extensive coverage and interconnectivity, substantial capacity, a robust maintenance and control framework, firmly established security protocols, and effective network management and operational strategies [36,37]. This approach might address one of the key challenges to achieving a hydrogen economy, namely the development of a hydrogen distribution network. The construction of a new pipeline system for the distribution of hydrogen is an expensive and time-consuming endeavour [13].
To harness renewable energy potential and improve the energy balance, Tunisia’s gas infrastructure investments will focus on creating a low-carbon energy system. This system will integrate renewable electricity and gas networks, facilitating sector coupling via green hydrogen carriers [38]. Tunisia possesses substantial potential for green hydrogen production, thanks to its renewable energy sources, positioning it to become a global producer of this energy vector.
Blending green hydrogen into the NG pipelines will be a chance to address the energy shortfall in Tunisia considering the aforementioned special circumstances and the country's current energy crisis. The question is how much hydrogen should be blended in and at what ratio. This paper discusses the potential for mixing green hydrogen with NG by defining quality and quantity with respect to various interchangeability techniques. The main purpose of this paper is to determine the hydrogen to NG ratio that ensures interchangeability. The study investigations are based on the NG compositions distributed in Tunisia.

3. Results and discussion

In this paper, we study both the Miskar (MNG) and Algerian (ANG) natural gases. The volumetric compositions of the main constituents of both gases are given in Table 2. Some characteristics and combustion parameters of the studied natural gases are given Table 3. All volumetric quantities are quoted in units of energy per “normal cubic meter” (denoted Nm3), which corresponds to a cubic meter of gas at a temperature of 0°C and a pressure of 1 atm.

3.1. Preliminary analysis

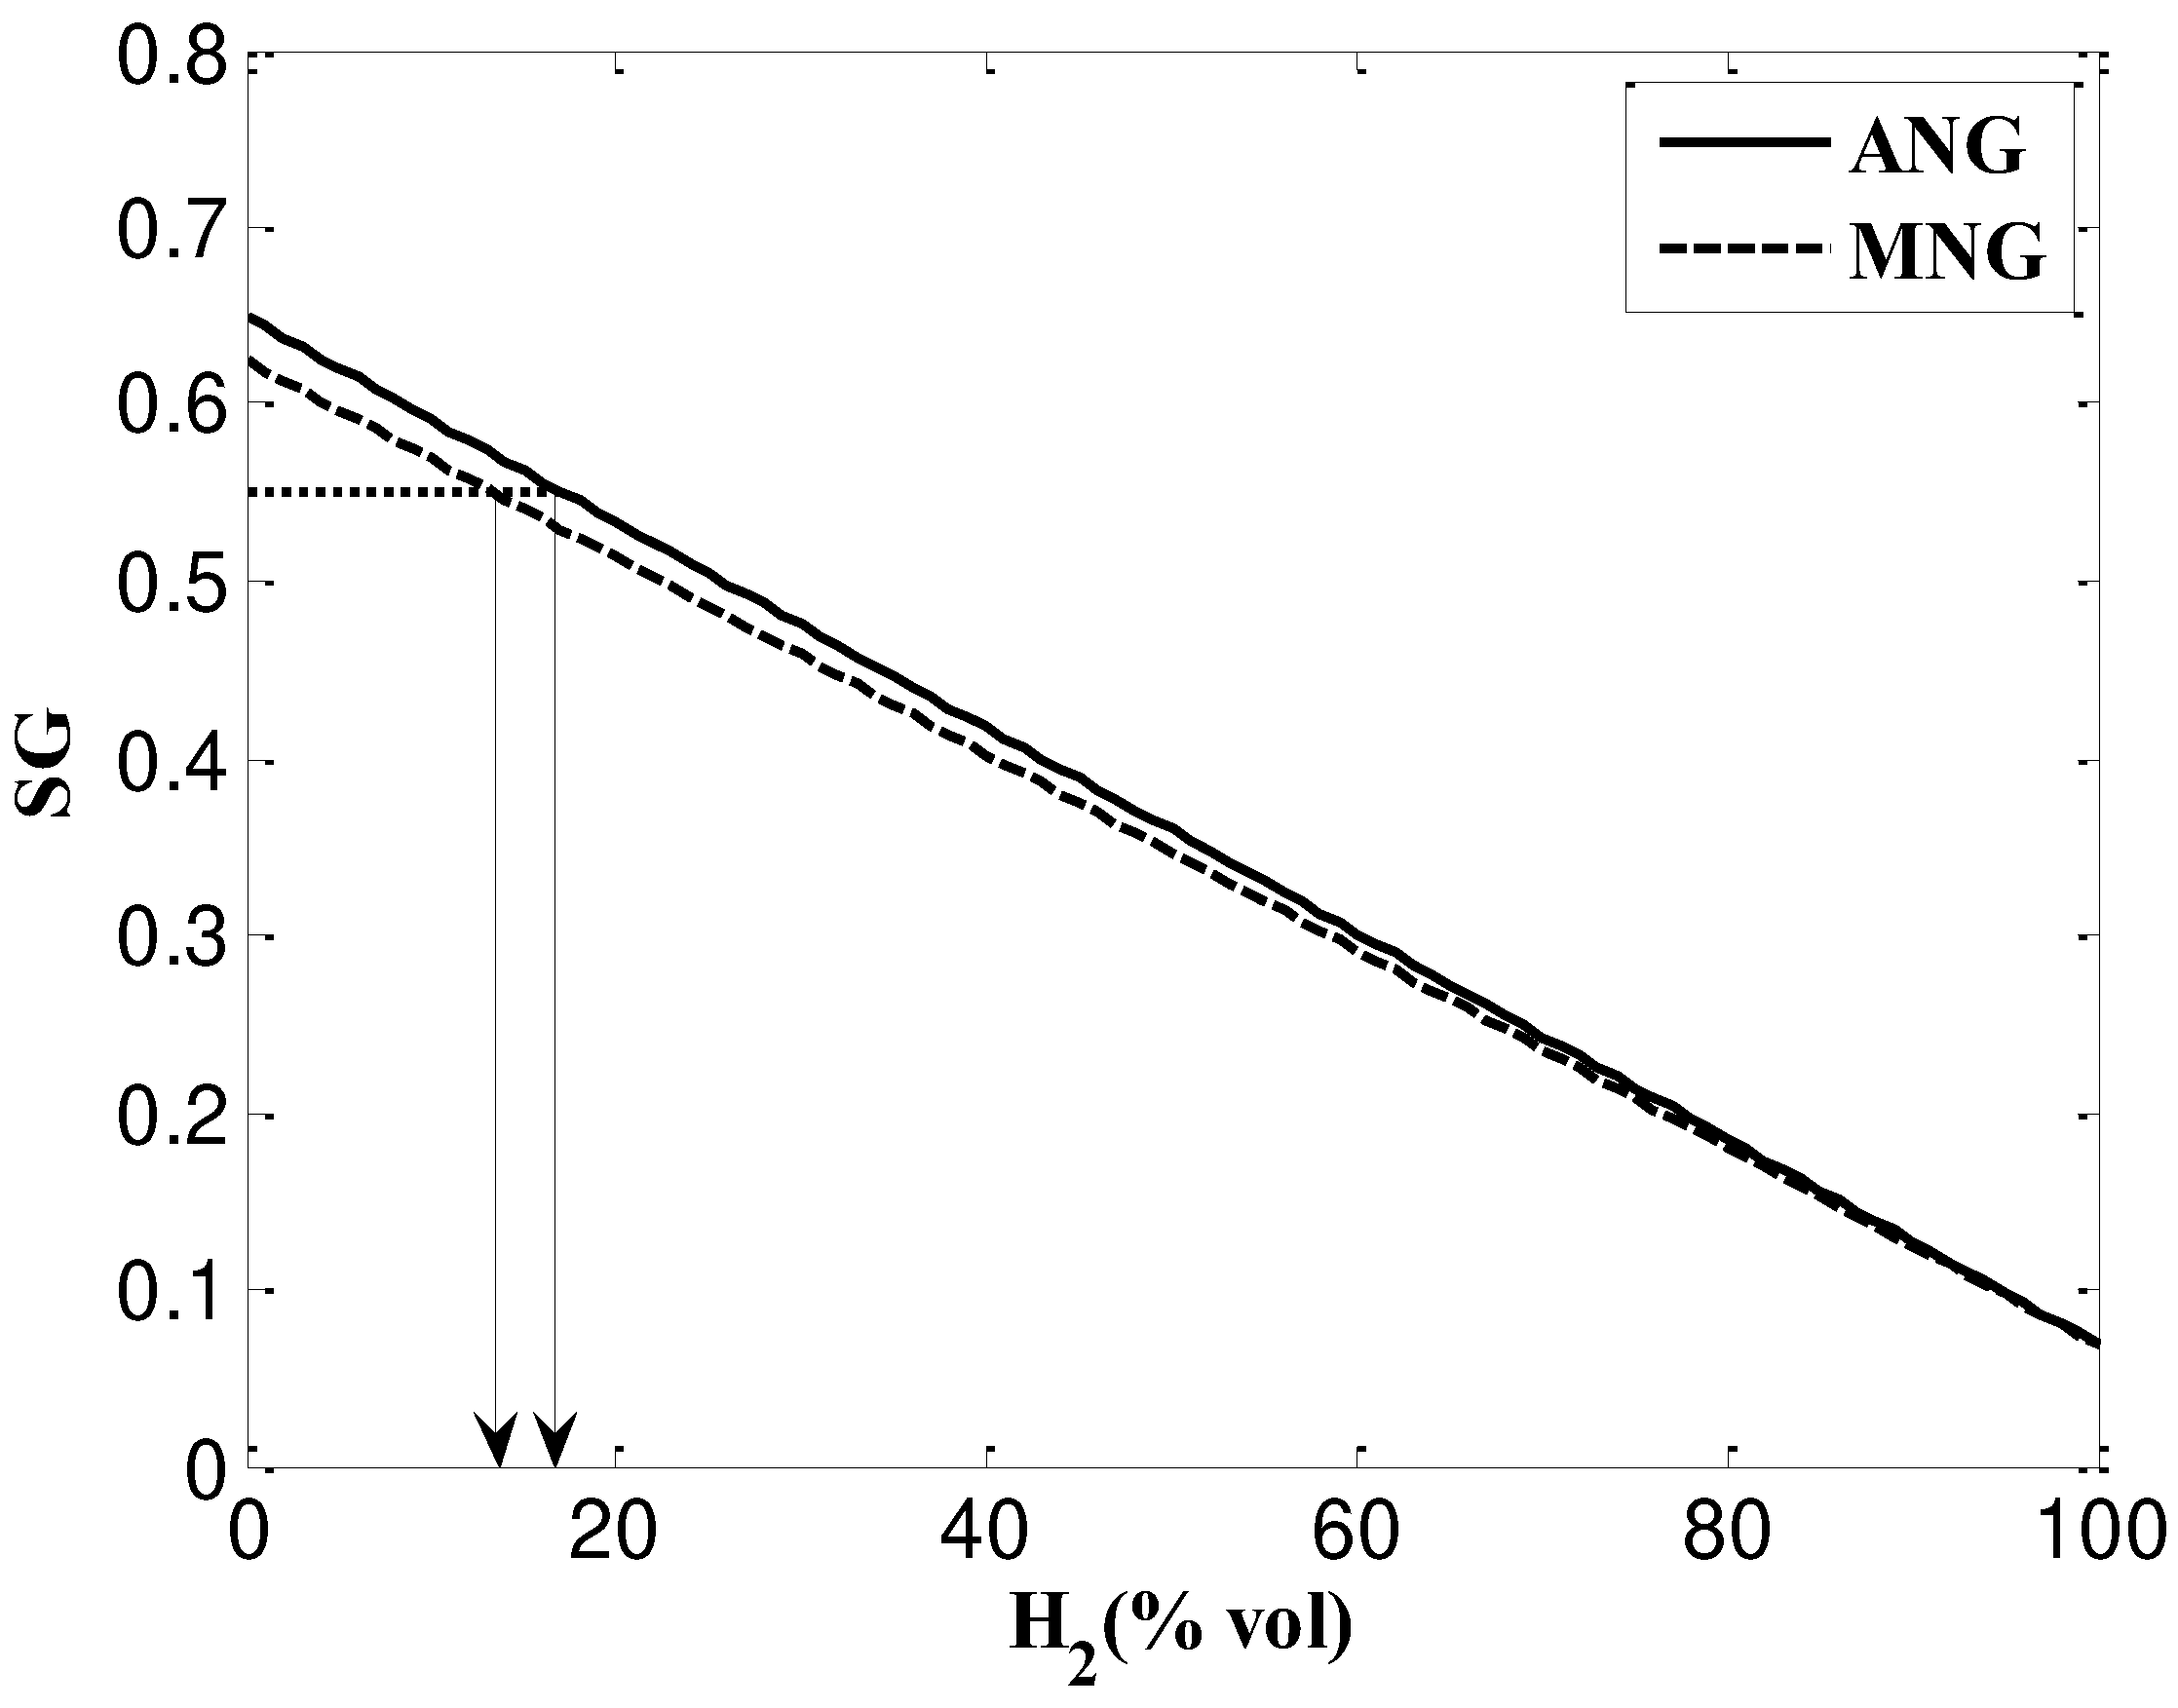
It is interesting to consider the relative density to have a general understanding of the impacts of adding hydrogen. This is shown in Figure 2 for both gases. Hydrogen causes a linear decrease in the specific gravity (SG). The lines start with the hydrogen free gas.
Referring to EASEE-gas [39], a European Natural Gas standard which states that the SG range limits are 0.5548 to 0.70, and based on Figure 2, adding hydrogen to the ANG or MNG up to 17% vol and 13% vol respectively would still be allowed.
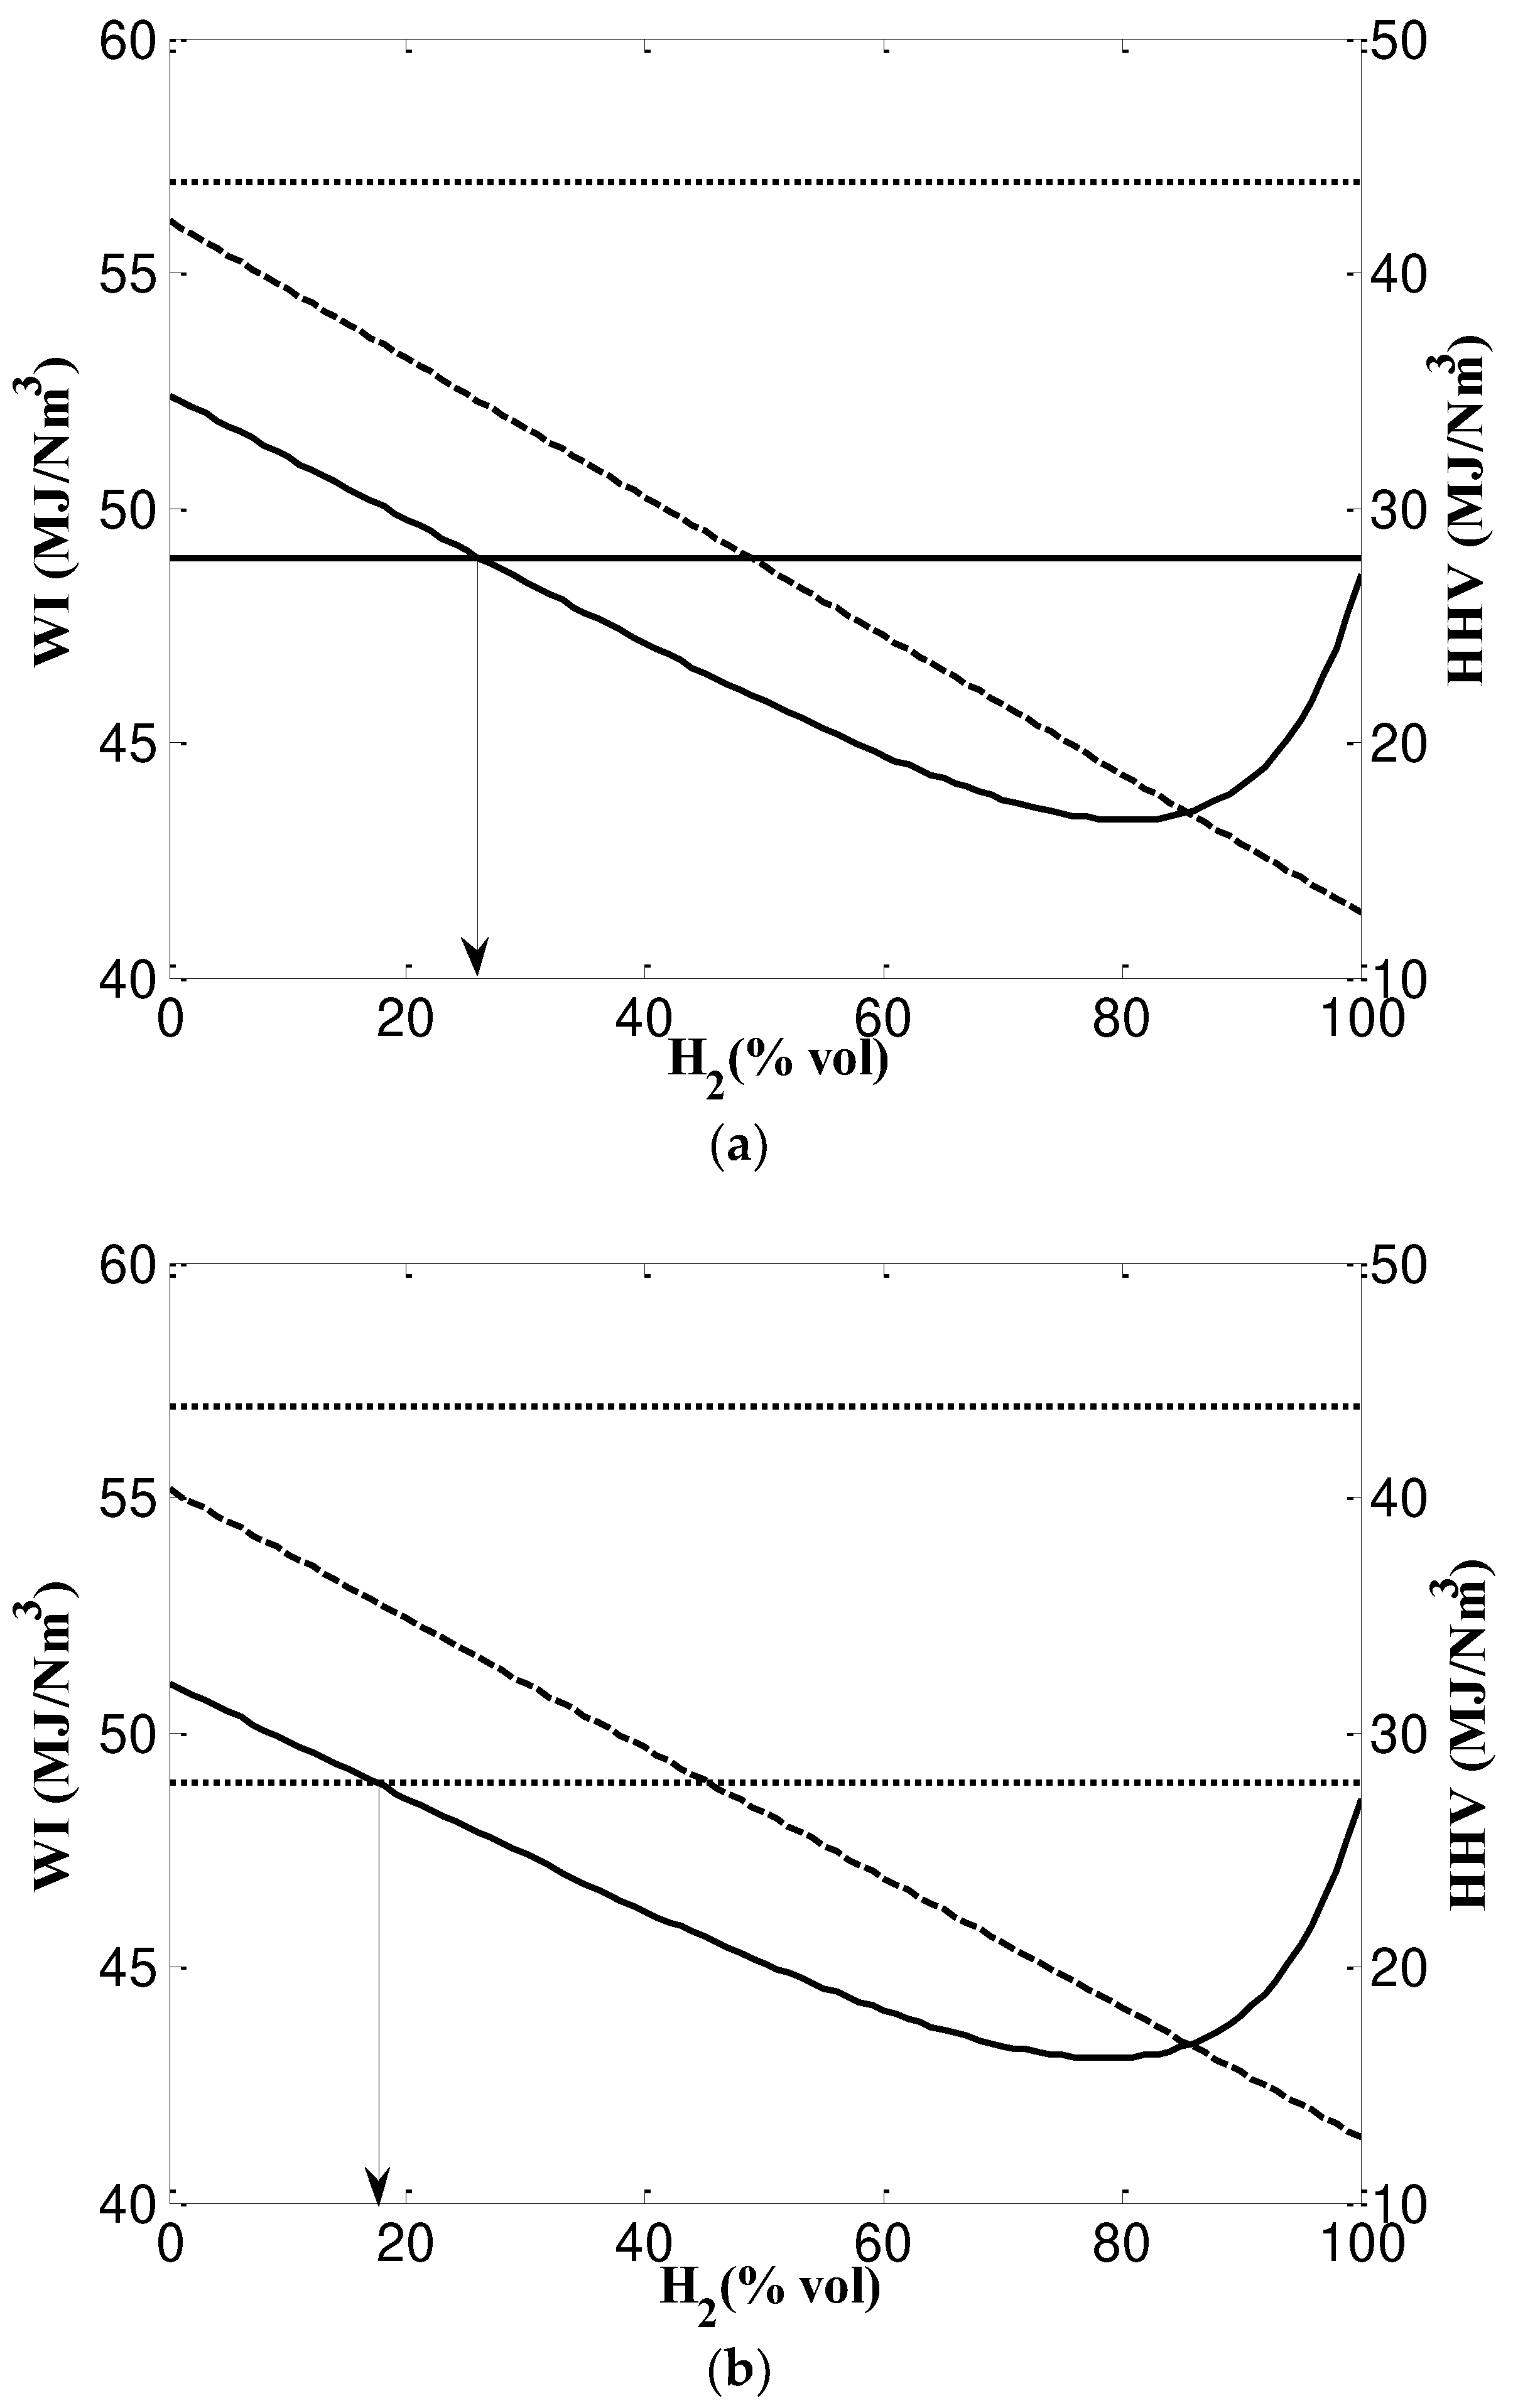
The Wobbe Index and the heating value are plotted in Figure 3. The solid and dashed lines represent the gas mixture properties (Wobbe Index, Higher Heating Value) , and the top and bottom dotted lines are the Wobbe Index value range recommended by the EASEE-gas standard (48.9-56.91) which is commonly used for methane rich natural gas [10]. The lower limit exists to avoid eventual flame blow-off in the case of unblended natural gas, but it is possible to further lower this limit, thanks to the flame stabilizing effect of hydrogen enrichment.
Hydrogen addition causes a decrease in the higher heating value HHV and the Wobbe index WI. The higher heating value shows a linear trend with a negative slope of -0.28 MJ/m3 and -0.3 MJ/ m3 for MNG and ANG respectively. The latter underscores the trade-off between energy content and hydrogen content in the gas mixture.
The Wobbe Index does, however, decline with hydrogen content, reaching a low value at 85 vol% hydrogen and increases thereafter. Due to this nonlinear character of the variation, pure hydrogen has the same Wobbe Index as 20% and 30% hydrogen contents in MNG and ANG respectively. The addition of hydrogen up to 24 % vol to ANG and up to 17 % vol to MNG would still be acceptable according to the EASEE-gas specification for Wobbe Index, as seen in Figure 3.
As hydrogen has a wider window of flammability and lower minimum ignition energy, hydrogen admixtures are more unstable with higher hydrogen contents [40]. Their flame speeds and temperatures increase [41,42] and emissions are subsequently affected by the effect’s temperature, resulting in the release of more nitrogen oxides (NO). Gas explosivity limits are case-dependent and depend on additional conditions such as ignition location, ignition strength, and confinement [43].
These results highlight the importance of carefully managing the HHV and Wobbe index when blending hydrogen into natural gas. It demonstrates that while hydrogen injection can reduce the energy content (HHV) and alter the Wobbe index, these changes can be controlled to keep the mixture within acceptable limits for safe and efficient use, maintaining compatibility with existing gas infrastructure and appliances.

3.2. Analysis of interchangeability criteria

In 1926, Wobbe introduced Wobbe Indices (WI), which represent specific gravity and calorific value as the two parameters controlling gas quality. This marked the beginning of the study of gas interchangeability. Two gases with the same Wobbe Index may behave significantly differently since the Wobbe Index does not account for impacts on flame speed or chemical kinetics. Therefore, in order to determine the interchangeability of fuels, it is required to consider other indices as well. In 1946, the American Gas Association (AGA) presented its indices determination method, which includes three exchange indexes. This method was later re-corrected by the American Gas Institute (GRI) in the 1980s. In 1951, Elmer R. Weaver [27] took the combustion speed into consideration and published the Weaver index method which includes six determination indexes. The interchangeability coefficient, which Knoy established in 1953, indicates that specific density and calorific power are important factors for gas interchangeability. Delbourg [24] established the graphical determination method of interchangeability and proposed the concept of "combustion potential (CP)" in 1971 based on many experiments. In 1984, Dutton [25] presented British Gas with his approach for comparing the interchangeability of gases, which is based on the idea that various gas mixtures should be analysed based on their composition. For comparison, a simplified or equivalent composition is utilized because natural gas might have more than twenty elements. Even with all the research done over the years, these conventional approaches remain the most widely used and fundamental.

3.2.1. Knoy index J ( K )

This is an old technique for figuring out whether two gases can be used interchangeably [31,44]. The correlation is analogous to the equation for the Wobbe Index (WI). The parameter can be identified based on the following equation :
J ( K ) = H H V 0.65   10 7 S G M i x t u r e
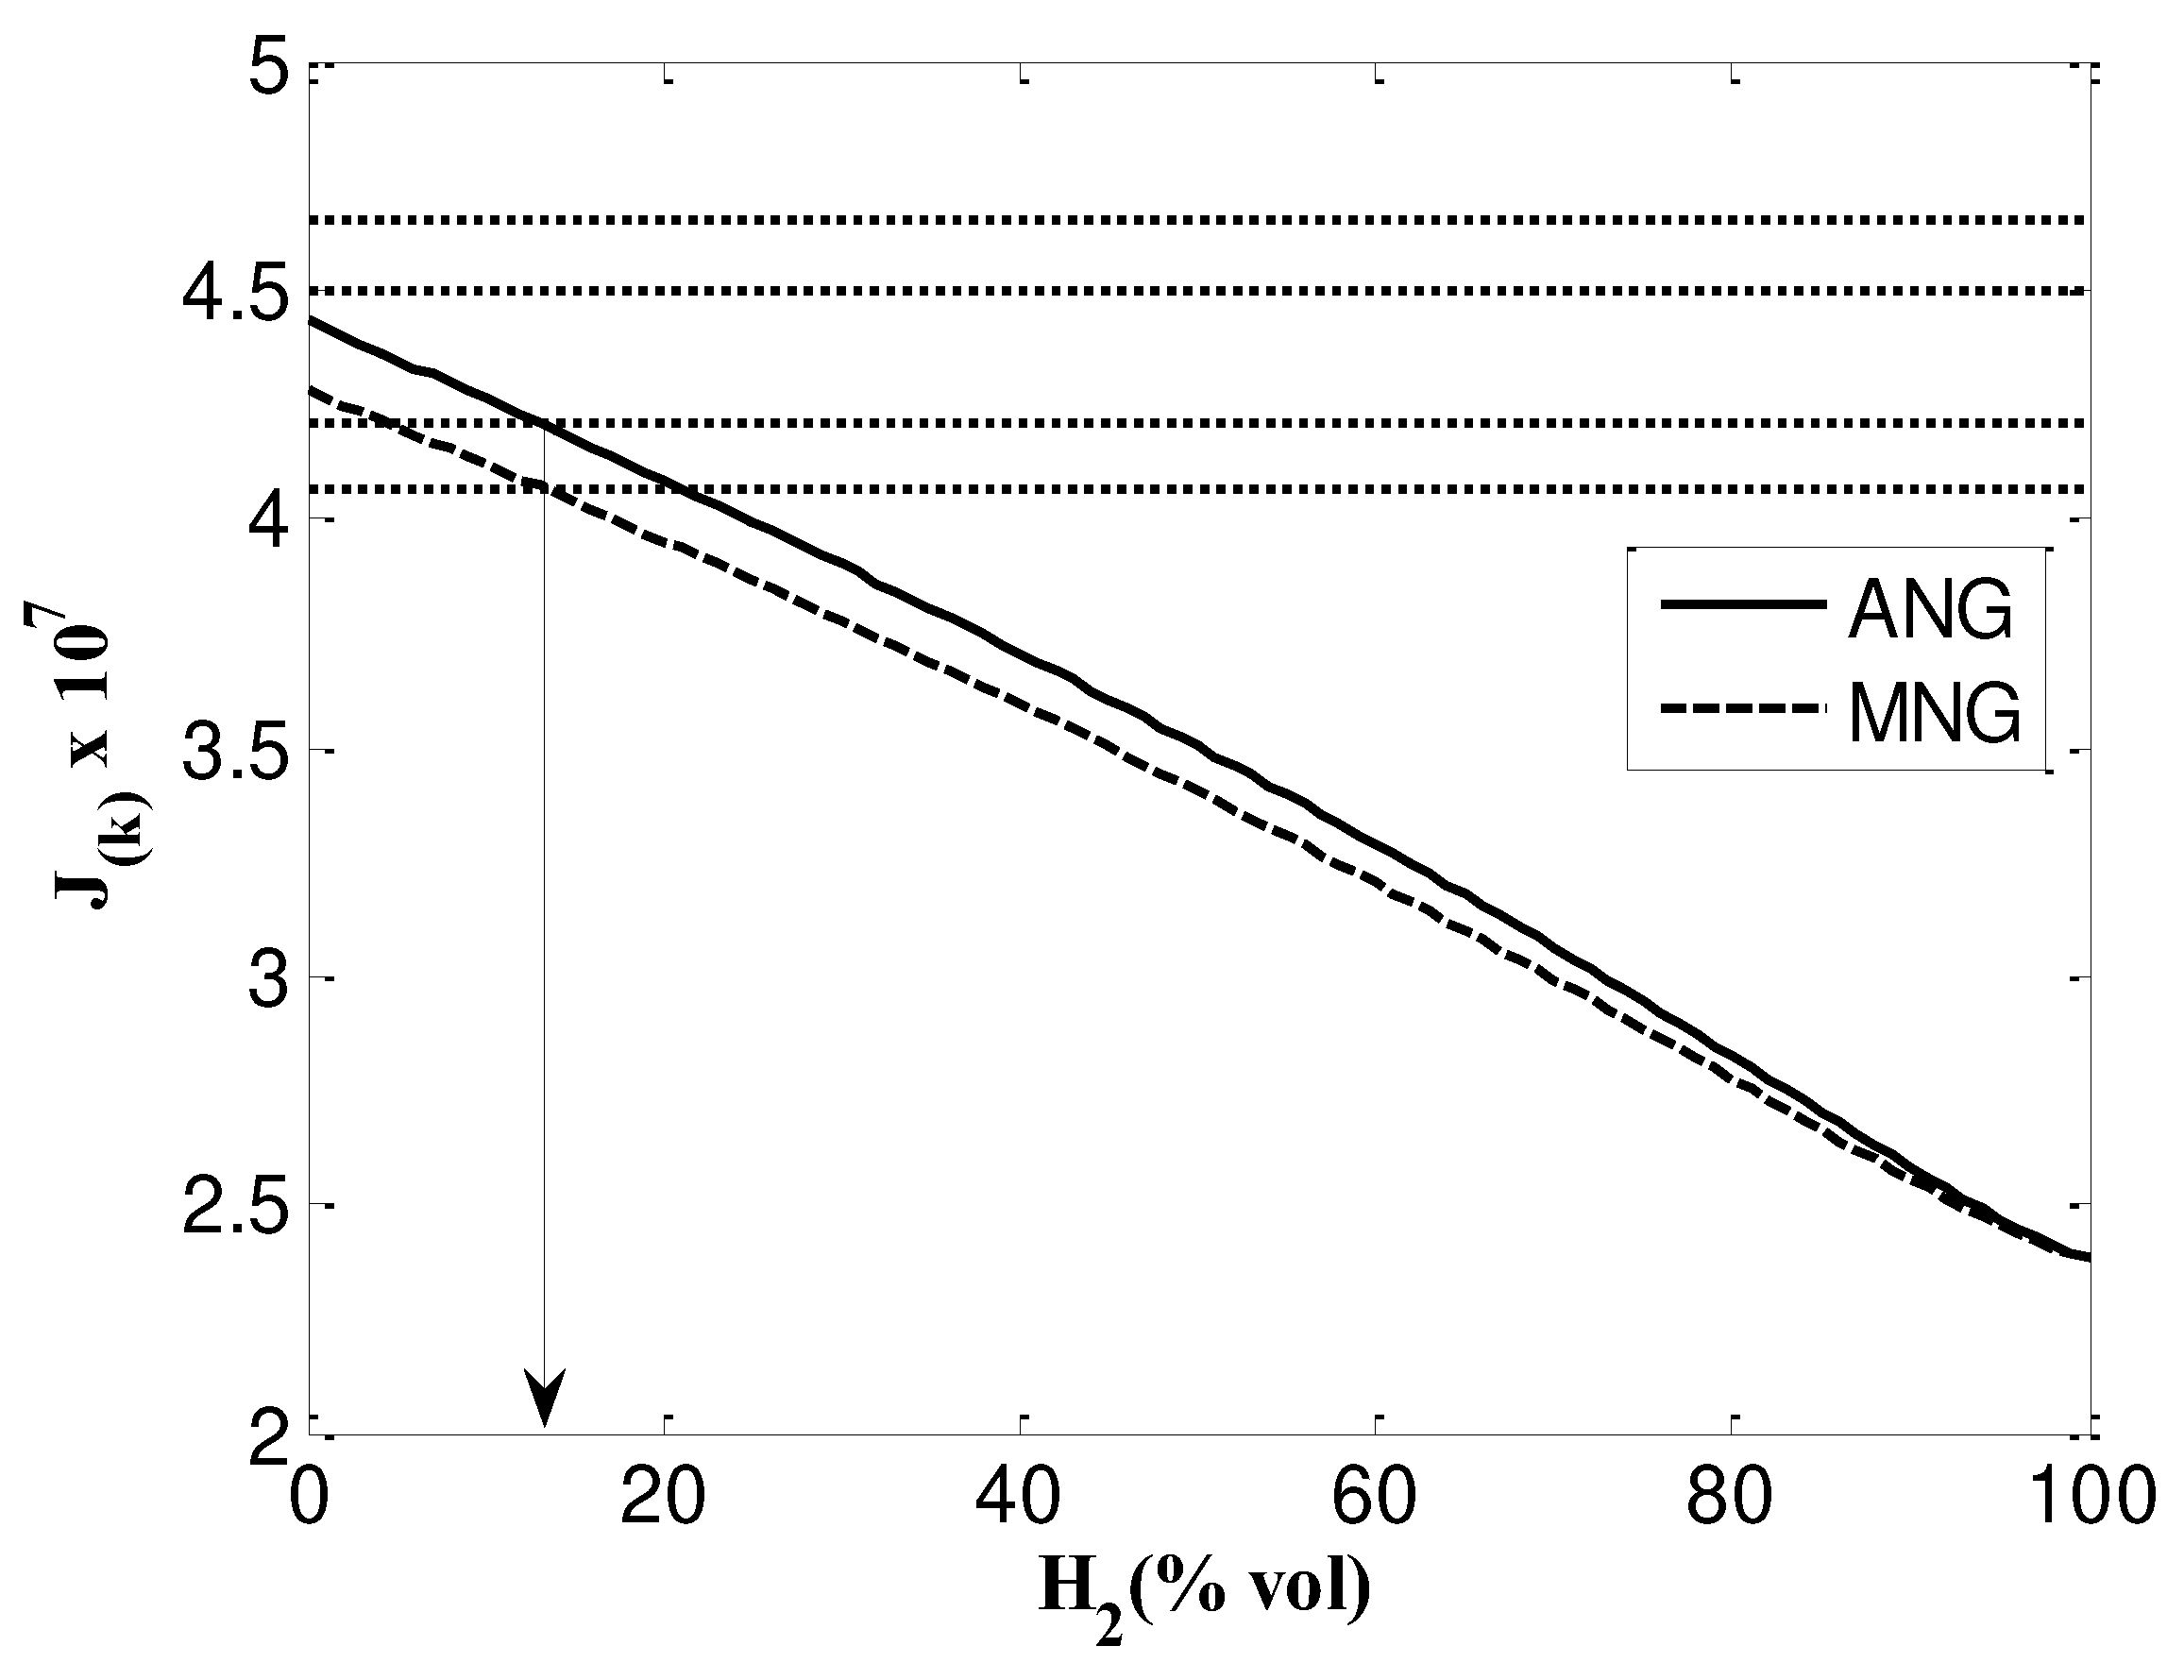
J ( K ) deviation to ± 5% in comparison to the replaced gas is required for adequate interchangeability. Values more than 5% indicate that the equipment is operating improperly [45]. Calculations based on equation (4) are illustrated in the Figure 4. Constant value line’s serve as indicators for the deviations for both studied natural gases. The knoy index decreases as the hydrogen content of the mixture increases. A deviation of -5% occurs when hydrogen share reaches 14% for both gases mixtures.

3.2.2. Dutton factors

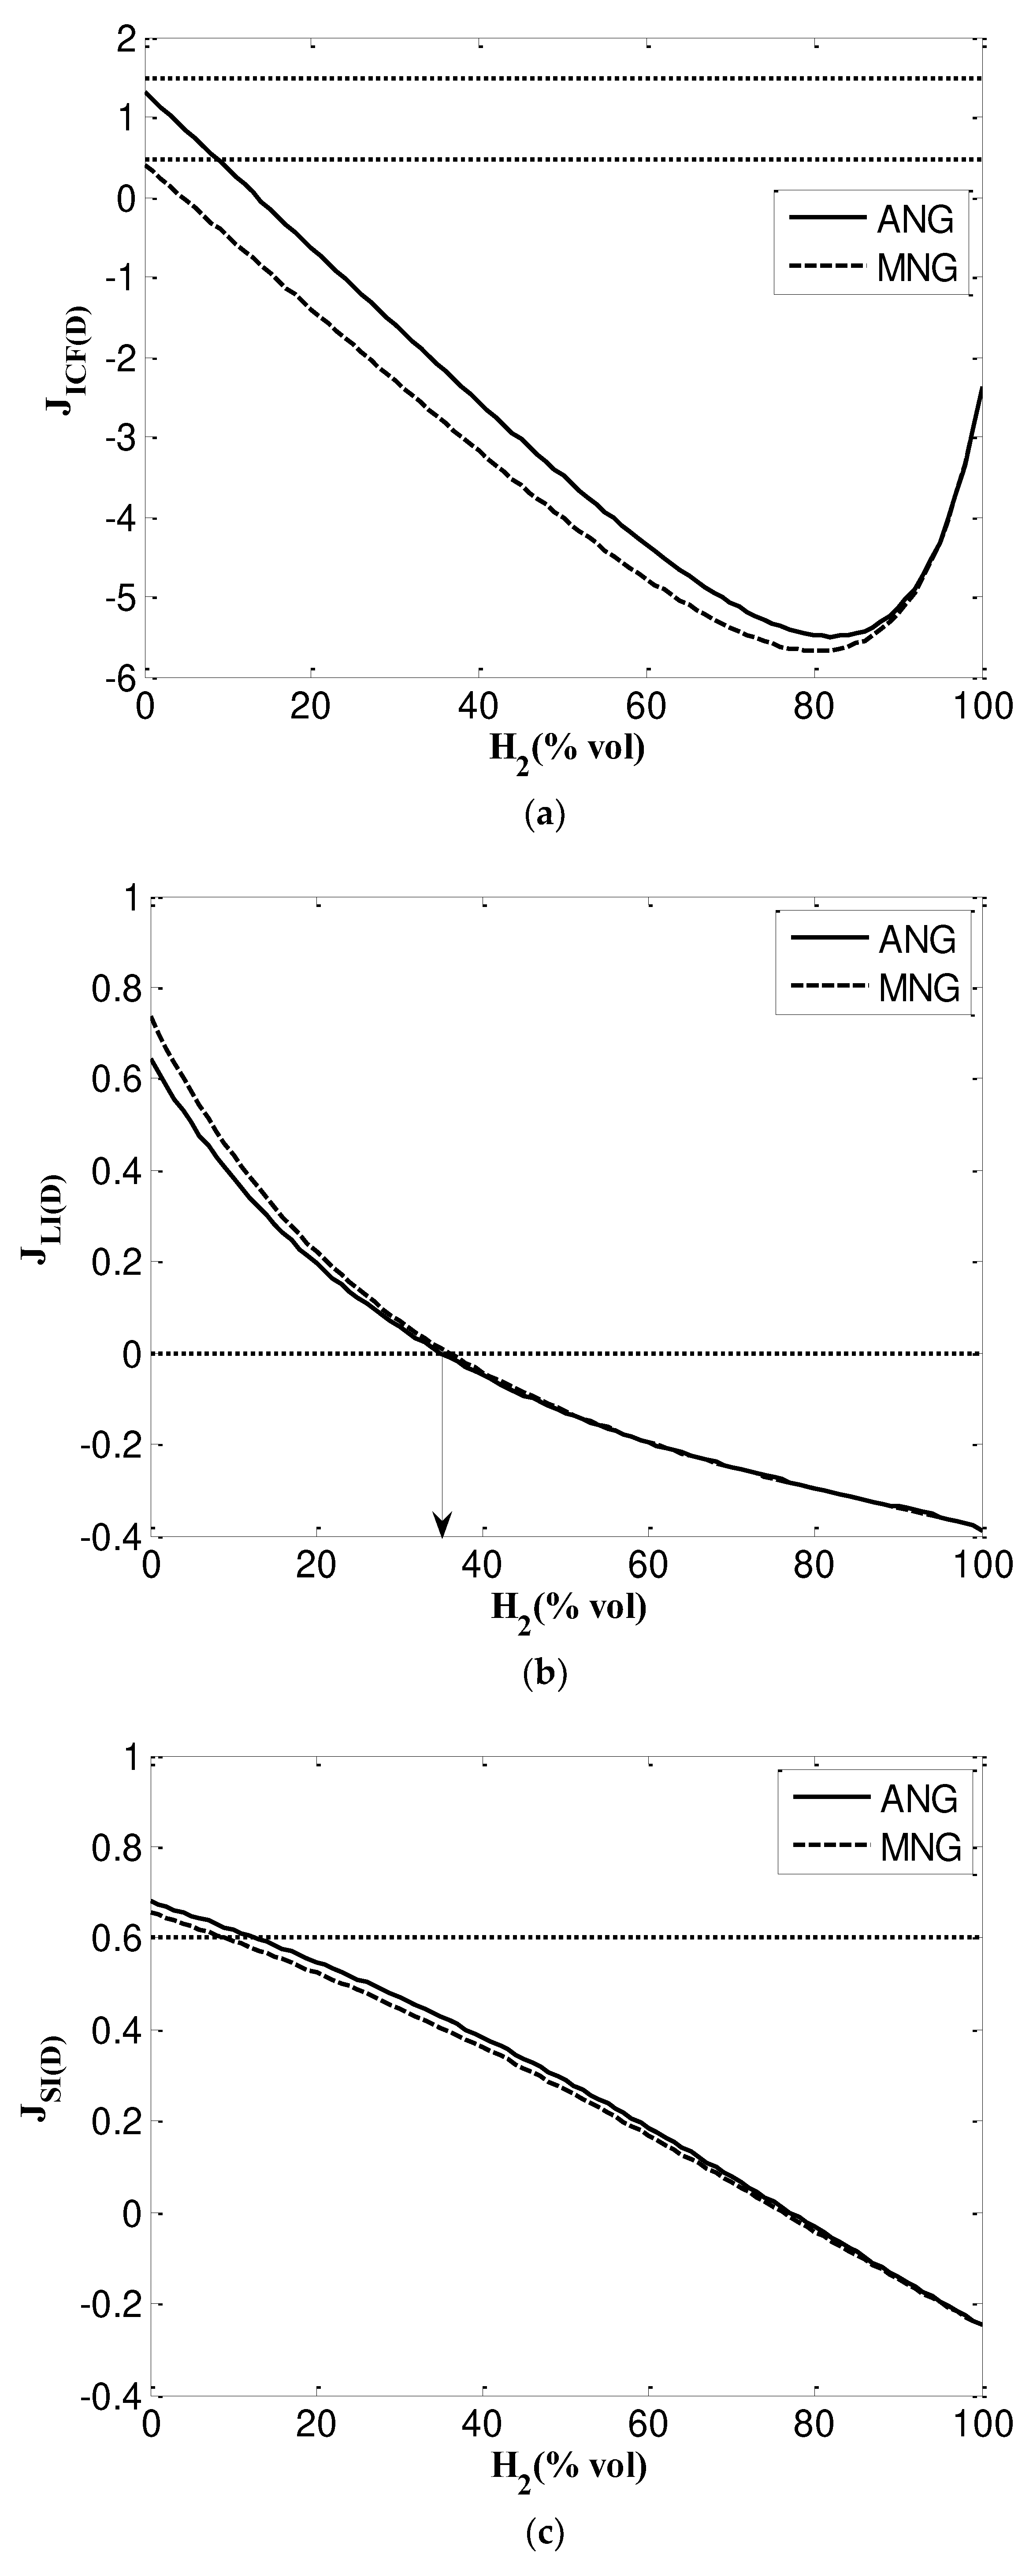
This technique primarily applies to natural gases, although it also works with similar mixtures and gases containing hydrogen. Calculating the following additional interchangeability parameters is necessary for the Dutton's method: Incomplete Combustion Factor, Sooting Index, and flame lift [28,46].
a) 
Incomplete combustion factor ( J I C F ( D )
The number of times the CO/CO2 ratio of NG must be doubled to match that of the weighted alternative gas is indicated by the J I C F ( D ) factor. The following is a mathematical expression of the incomplete combustion factor [47]:
J I C F ( D ) = W I 50.73 + 0.03   E P N 1.56 Ω H 2 100
where WI is the Wobbe index, MJ/m3, Ω H 2 indicates the volume proportion of hydrogen in the gas and E P N stands for the volume fraction of nitrogen and propane (C3H8+N2) in the stoichiometric mixture. For details concerning E P N see, for example [48].
The tests that served as the foundation for Eq. (5) were conducted on water heaters since these are the combustion sources that are most susceptible to incomplete combustion [49]. Because the CO content is not taken into account by this method, gases containing CO are excluded. This also holds true for the lift index J L I ( D ) and soot index J S I ( D ) factors discussed below.
Currently, the Gas Safety (Management) Regulations (GS(M)R) [50], applicable in the UK, mandate that the index J L I ( D ) should be lower than 0.48, with an ‘‘extreme” limit of 1.48, in order to prevent incomplete combustion. If natural gas mixtures greatly exceed the limit, CxHy emissions will be released into the atmosphere and the operational efficiency of combustion equipment will decrease.
Figure 5a shows the results of this factor's calculations using Eq. (5) for both natural gas mixtures with varying H2 content. Calculations reveal that an increase in the H2 content causes a decrease in the mixture's hydrocarbon content and a rise in the J I C F ( D )   factor, both of which work to prevent incomplete combustion. Consequently, natural gases and their hydrogen-containing mixtures are interchangeable at any hydrogen content in terms of incomplete combustion factor.
b) 
Lift Index ( J L I ( D ) )
The LI index can be used to forecast a fuel gas propensity for flame lift. Cooktops were utilized in this instance to evaluate the empirical relationship's derivation since they had the highest lifting susceptibility and required a very stable flame. The J L I ( D ) index can be calculated by referring to [49]:
J L I ( D ) = 3.25 2.41   t a n 1 { 0.122 + 0.0009   Ω H 2 . W I 36.8 0.0019   E P N + 0.775 0.118   E P N 1 / 3   Ω H 2 } .
The lift index assesses interchangeability in terms of combustion stability related to flame detachment from the burner’s base and the light back phenomena and its optimal value ranges from 0 to 6. When J L I ( D ) is zero, there is no visible detachment of the flame base from the burner, whereas at values higher than 6, lifting happens.
The results of J L I ( D ) index calculations under Eq. (6) are shown in Figure 5.b. The indicator is not critical until the plots intersect with the x-axis ( J L I ( D ) = 0 ), which corresponds to a Hydrogen content of approximately 36% for both ANG and MNG. It should be noted that the limit content is shifted up to 40% when a slight lift index deviation from zero is taken into account. However, the possibility of light back ( J L I D < 0 ) should be considered : the flame can then travel back to the injector which will result in the emission of carbon monoxide at high levels.
c) 
Soot Index ( J S I ( D ) )
The Dutton's Soot Index J S I ( D ) evaluates the likelihood of soot particles forming and turning the flame yellow. Dutton employed radiant gas fires as test appliances to investigate sooting. J S I ( D ) values can be derived from the following equation [47,49] :
J S I ( D ) = 0.896   t a n 1 0.0255   E P N 0.0091   Ω H 2 + 0.617    
Plots of the J S I ( D ) index calculations under Eq. (7) are given in Figure 5.c and results are conform to the UK GS (M) R guideline ( J S I D 0.6   ) which means that no danger of sooting for the substitute gas enriched with hydrogen.
According to Dutton’s criteria, up to a 40% vol hydrogen concentration, natural gas and its mixture can be substituted with its hydrogen mixture, due to light back.

3.2.3. Delbourg method (used in Europe)

The Delbourg diagram is used to demonstrate identical heat input, effective combustion, and flame stability after the interchange of two fuels. The burners and combustion equipment used in Europe are represented in this type of diagram. The combustion potential (CP) and the corrected WI values (WI') are the evaluation factors. The basic Wobbe number is directly used to calculate the corrected Wobbe number, as shown in [51]:
W I ' = K 1   K 2   W I
Two factors, K1 and K2, are used to adjust the WI values. The first factor considers the total heat of combustion of the hydrocarbon, which makes up a bigger portion of the process gas than methane; the second factor considers the heat of combustion as well as the concentrations of CO, CO2, and O2. The graphic dependences K1 and K2 on given parameters can be found for example in [20].
The stability and speed of combustion (i.e., flame lifting and flame flashback) are associated with the combustion potential parameter (CP). The evaluated gas type, as well as the composition and relative specific weight of the tested gas, all influence the final CP value. The following provides the mathematical expression of CP [23]:
C P = u D   1 S G     Ω H 2 + 0.3   Ω C H 4 + 0.7   Ω C O + ν ( D ) i     a i ( D ) Ω i  
Where:
Ω H 2 , Ω C H 4 , Ω C O , Ω i are the content of each combustible constituent (in %) (i : all hydrocarbons except CH4), a i ( D ) is the correction factor of individual hydrocarbons and u D   , ν ( D ) are the gas type factors. The necessary values for all factors are given in [51].
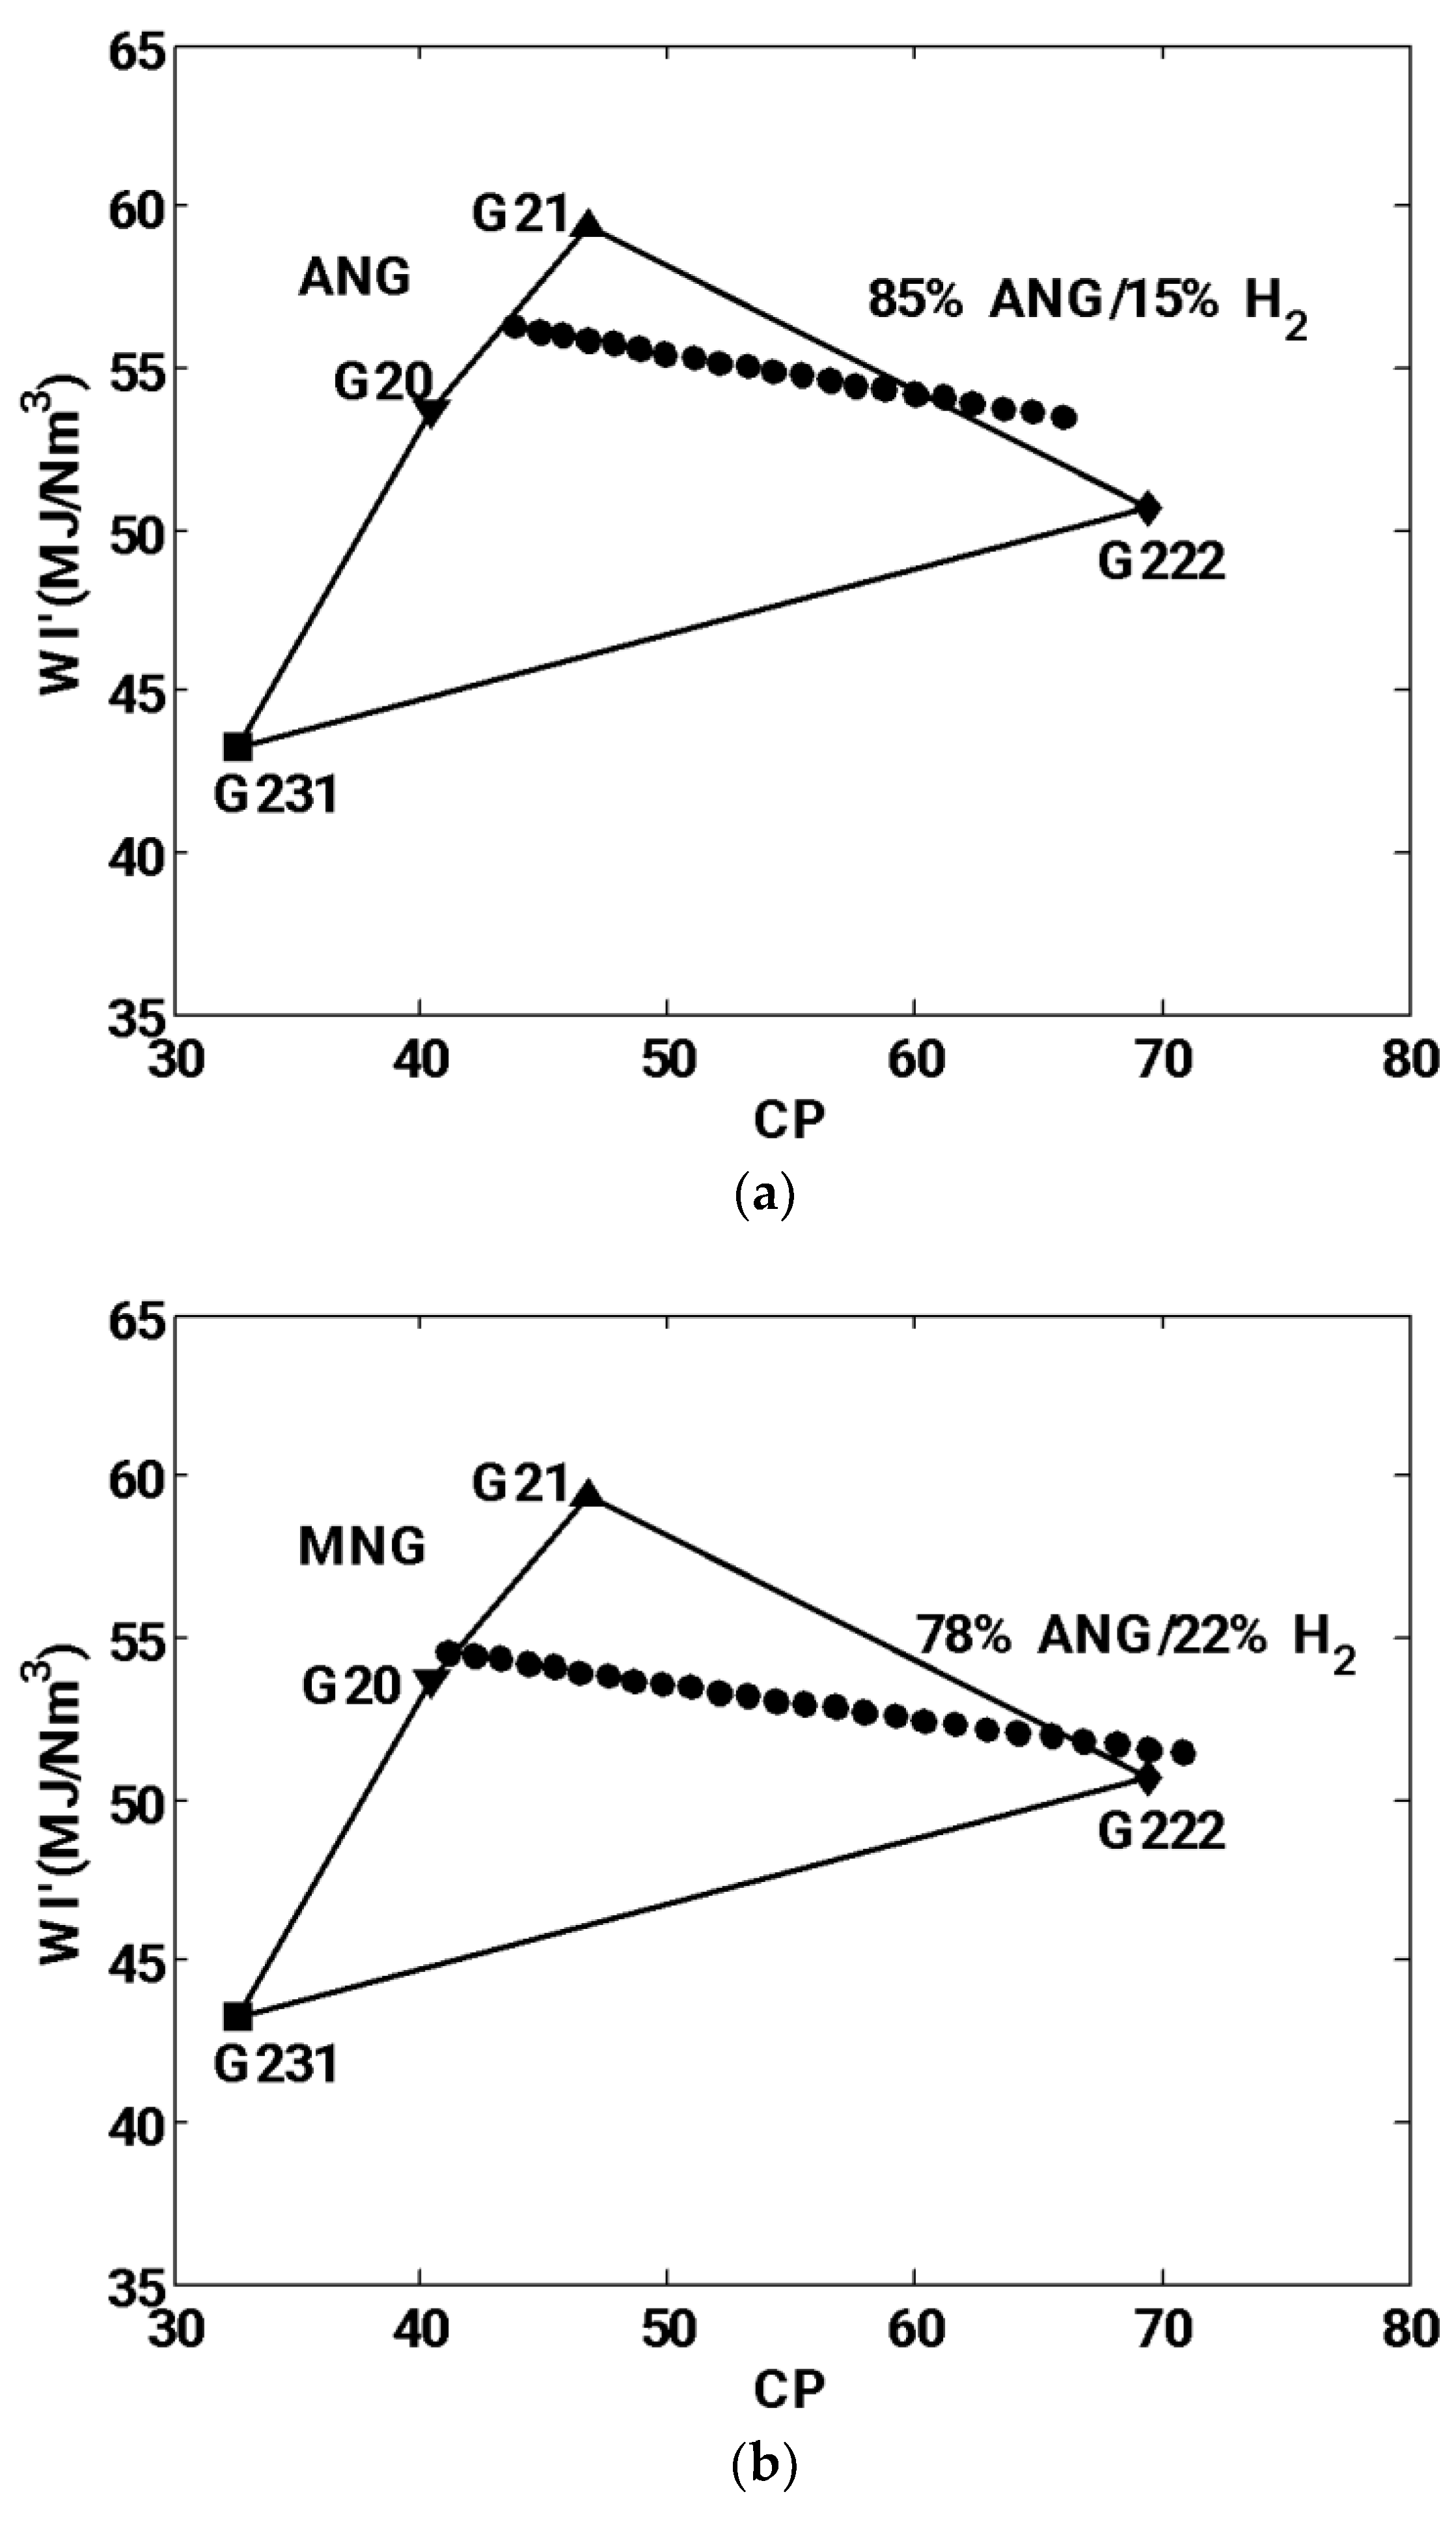
The corrected Wobbe index variations in function of the combustion potential are plotted in Figure 6. Four patterns representing the various reference gases given in Table 4 are also added to the chart to delimit the interchangeability region of mixtures. The limits show the range within which all appliances will function satisfactorily.
The analysis of the diagrams reveals that as the hydrogen concentration rises, the combustion potential also rises and the characteristic mixture point shifts to the diagram's right side, implying the possibility of flame flashback. This risk exists when the characteristic point lies outside the interchangeability borders diagram. This means that the maximum allowable content of hydrogen blending with ANG and MNG is 15% and 22% respectively. These values provide insight into the maximum hydrogen concentration that can be injected within the context of hydrogen blending without requiring changes to the burner equipment.

3.2.4. Weaver method (used in USA)

The Weaver indices is a set of non-dimensional indices that examines the potential for interchangeability in a more complex and broader context. The principles of the Weaver’s method are empirically derived indices that include mainly the flame speed parameter [52]. Since Weaver method is more precise and it combines AGA’s indicators, only the Weaver method is investigated here.
Table 5 provides calculation formulas and limit values of the six Weaver's indices that affect the stability of the flame and the effectiveness of the combustion process. These relationships are generated from tests on low-pressure gas burners. Extended description of Weaver’s indices may be found in references [45,25–54] among others.
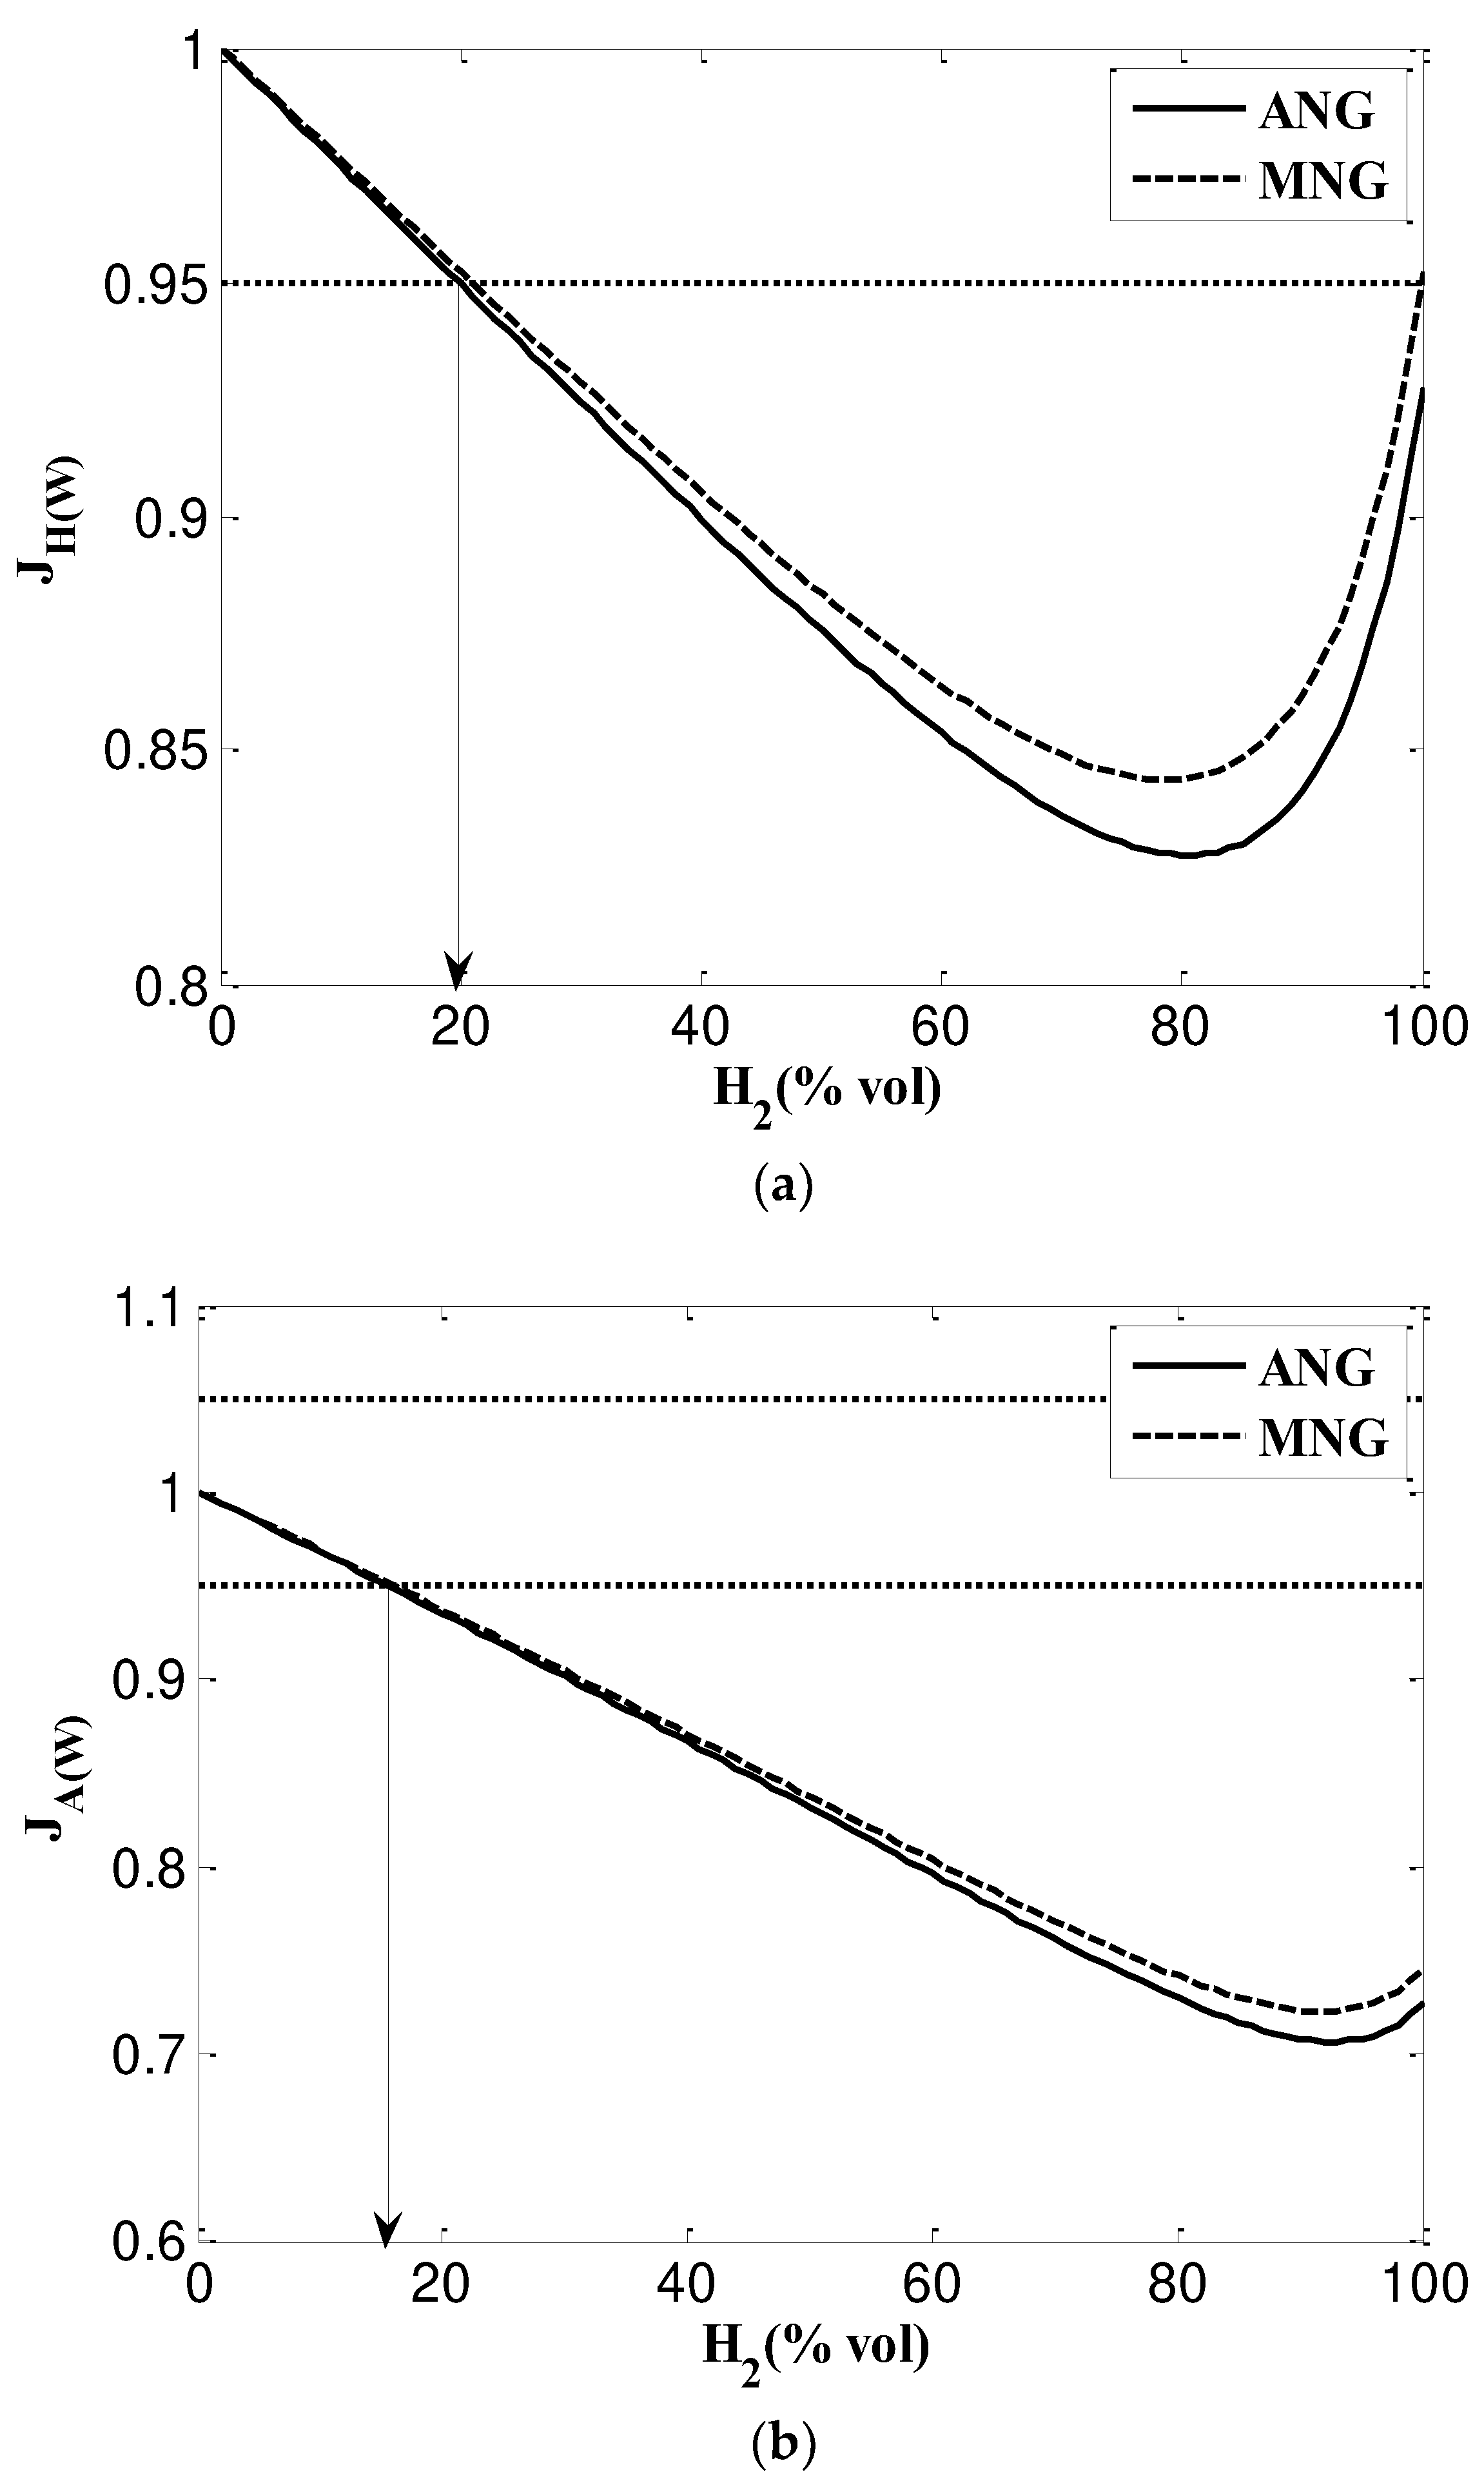
The calculation results of Weaver indices and possibilities of substituting the NG with NG/H2 mixtures are given in Figure 7. Weaver’s index of interchangeability with respect to the rate at which produces or releases heat is illustrated in Figure 7.a. The interchangeability condition is J H W = 1 . A content of 20% vol represents a limit to be inside the acceptable range values for the NG/H2 mixtures of both ANG and MNG. The primary air ratio variation is given in Figure 7.b. When J A W = 1 , the total amount of air required to burn each gas is the same. The index variations are similar for both mixture ANG/H2 and MNG/H2. With the tolerance of a deviation up to ± 5 % against natural gases, the maximum allowable mixing percentage of hydrogen into NG is approximately 17%.
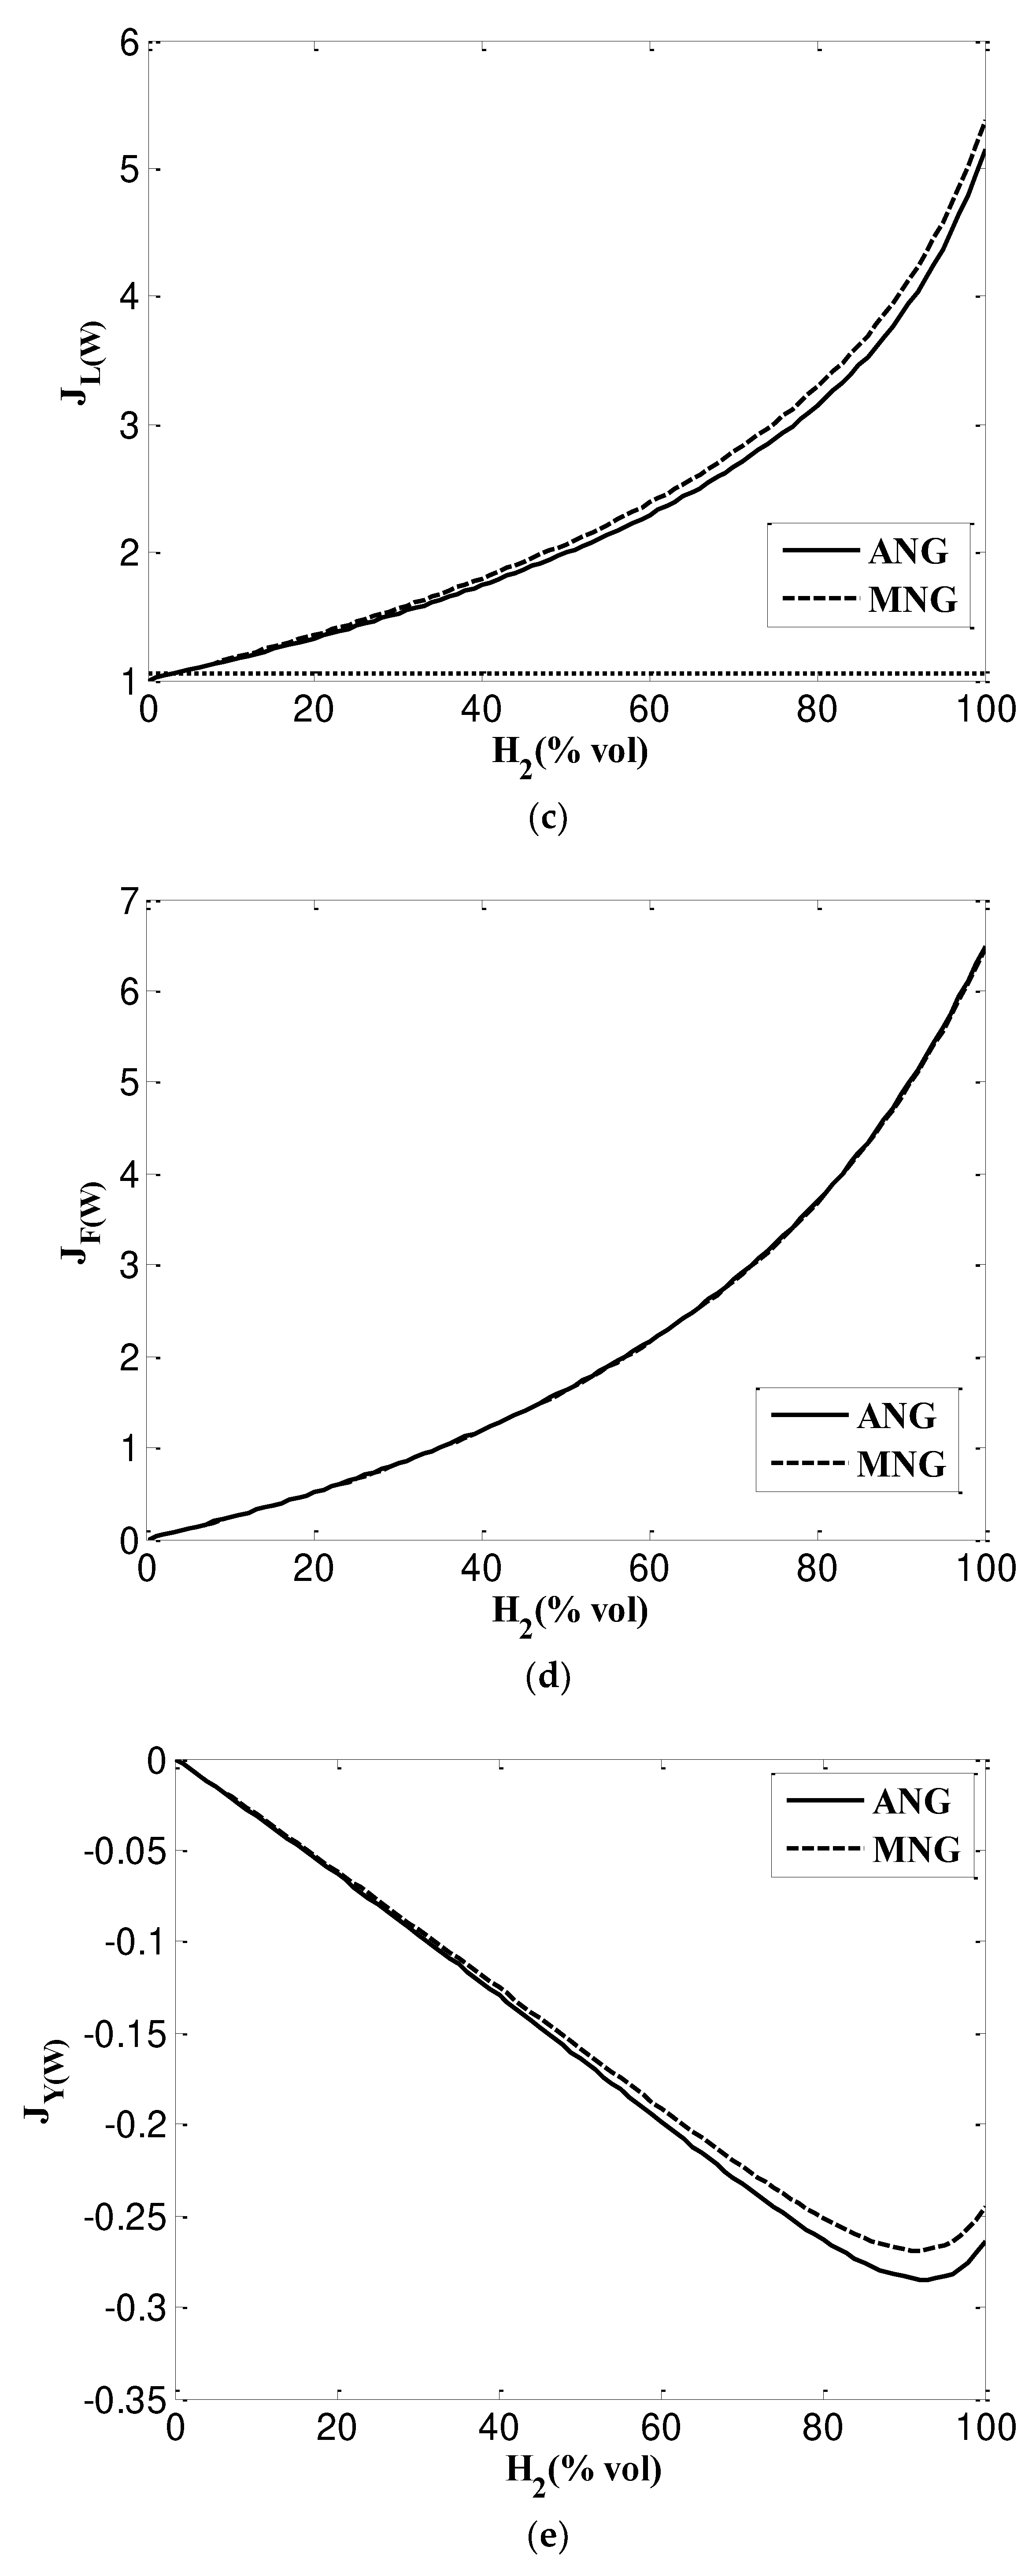
The limiting value for the lifting index J L W is again 1. Gases with J L W   of more than 1 show a higher susceptibility to lifting from the burner front. Figure 7.c shows that when the value of hydrogen content increases, J L W value’s increases exponentially. The probability of lifting also becomes higher. The primary cause of the high J L W values of the gases mixtures is the high hydrogen contents, which needs 4 times less air for combustion than methane, or a high combustion velocity, which is directly proportional to the Weaver index. The problems of flashback are very likely to occur after the replacement of the gas. This assumption is also confirmed by the results obtained using the Weaver index J F W plotted in Figure 7.d. The burning of more hydrogen results in a greater susceptibility to flashback if J F W > 0 .   Any hydrogen content is also accompanied by the danger of an adverse effect on burners.
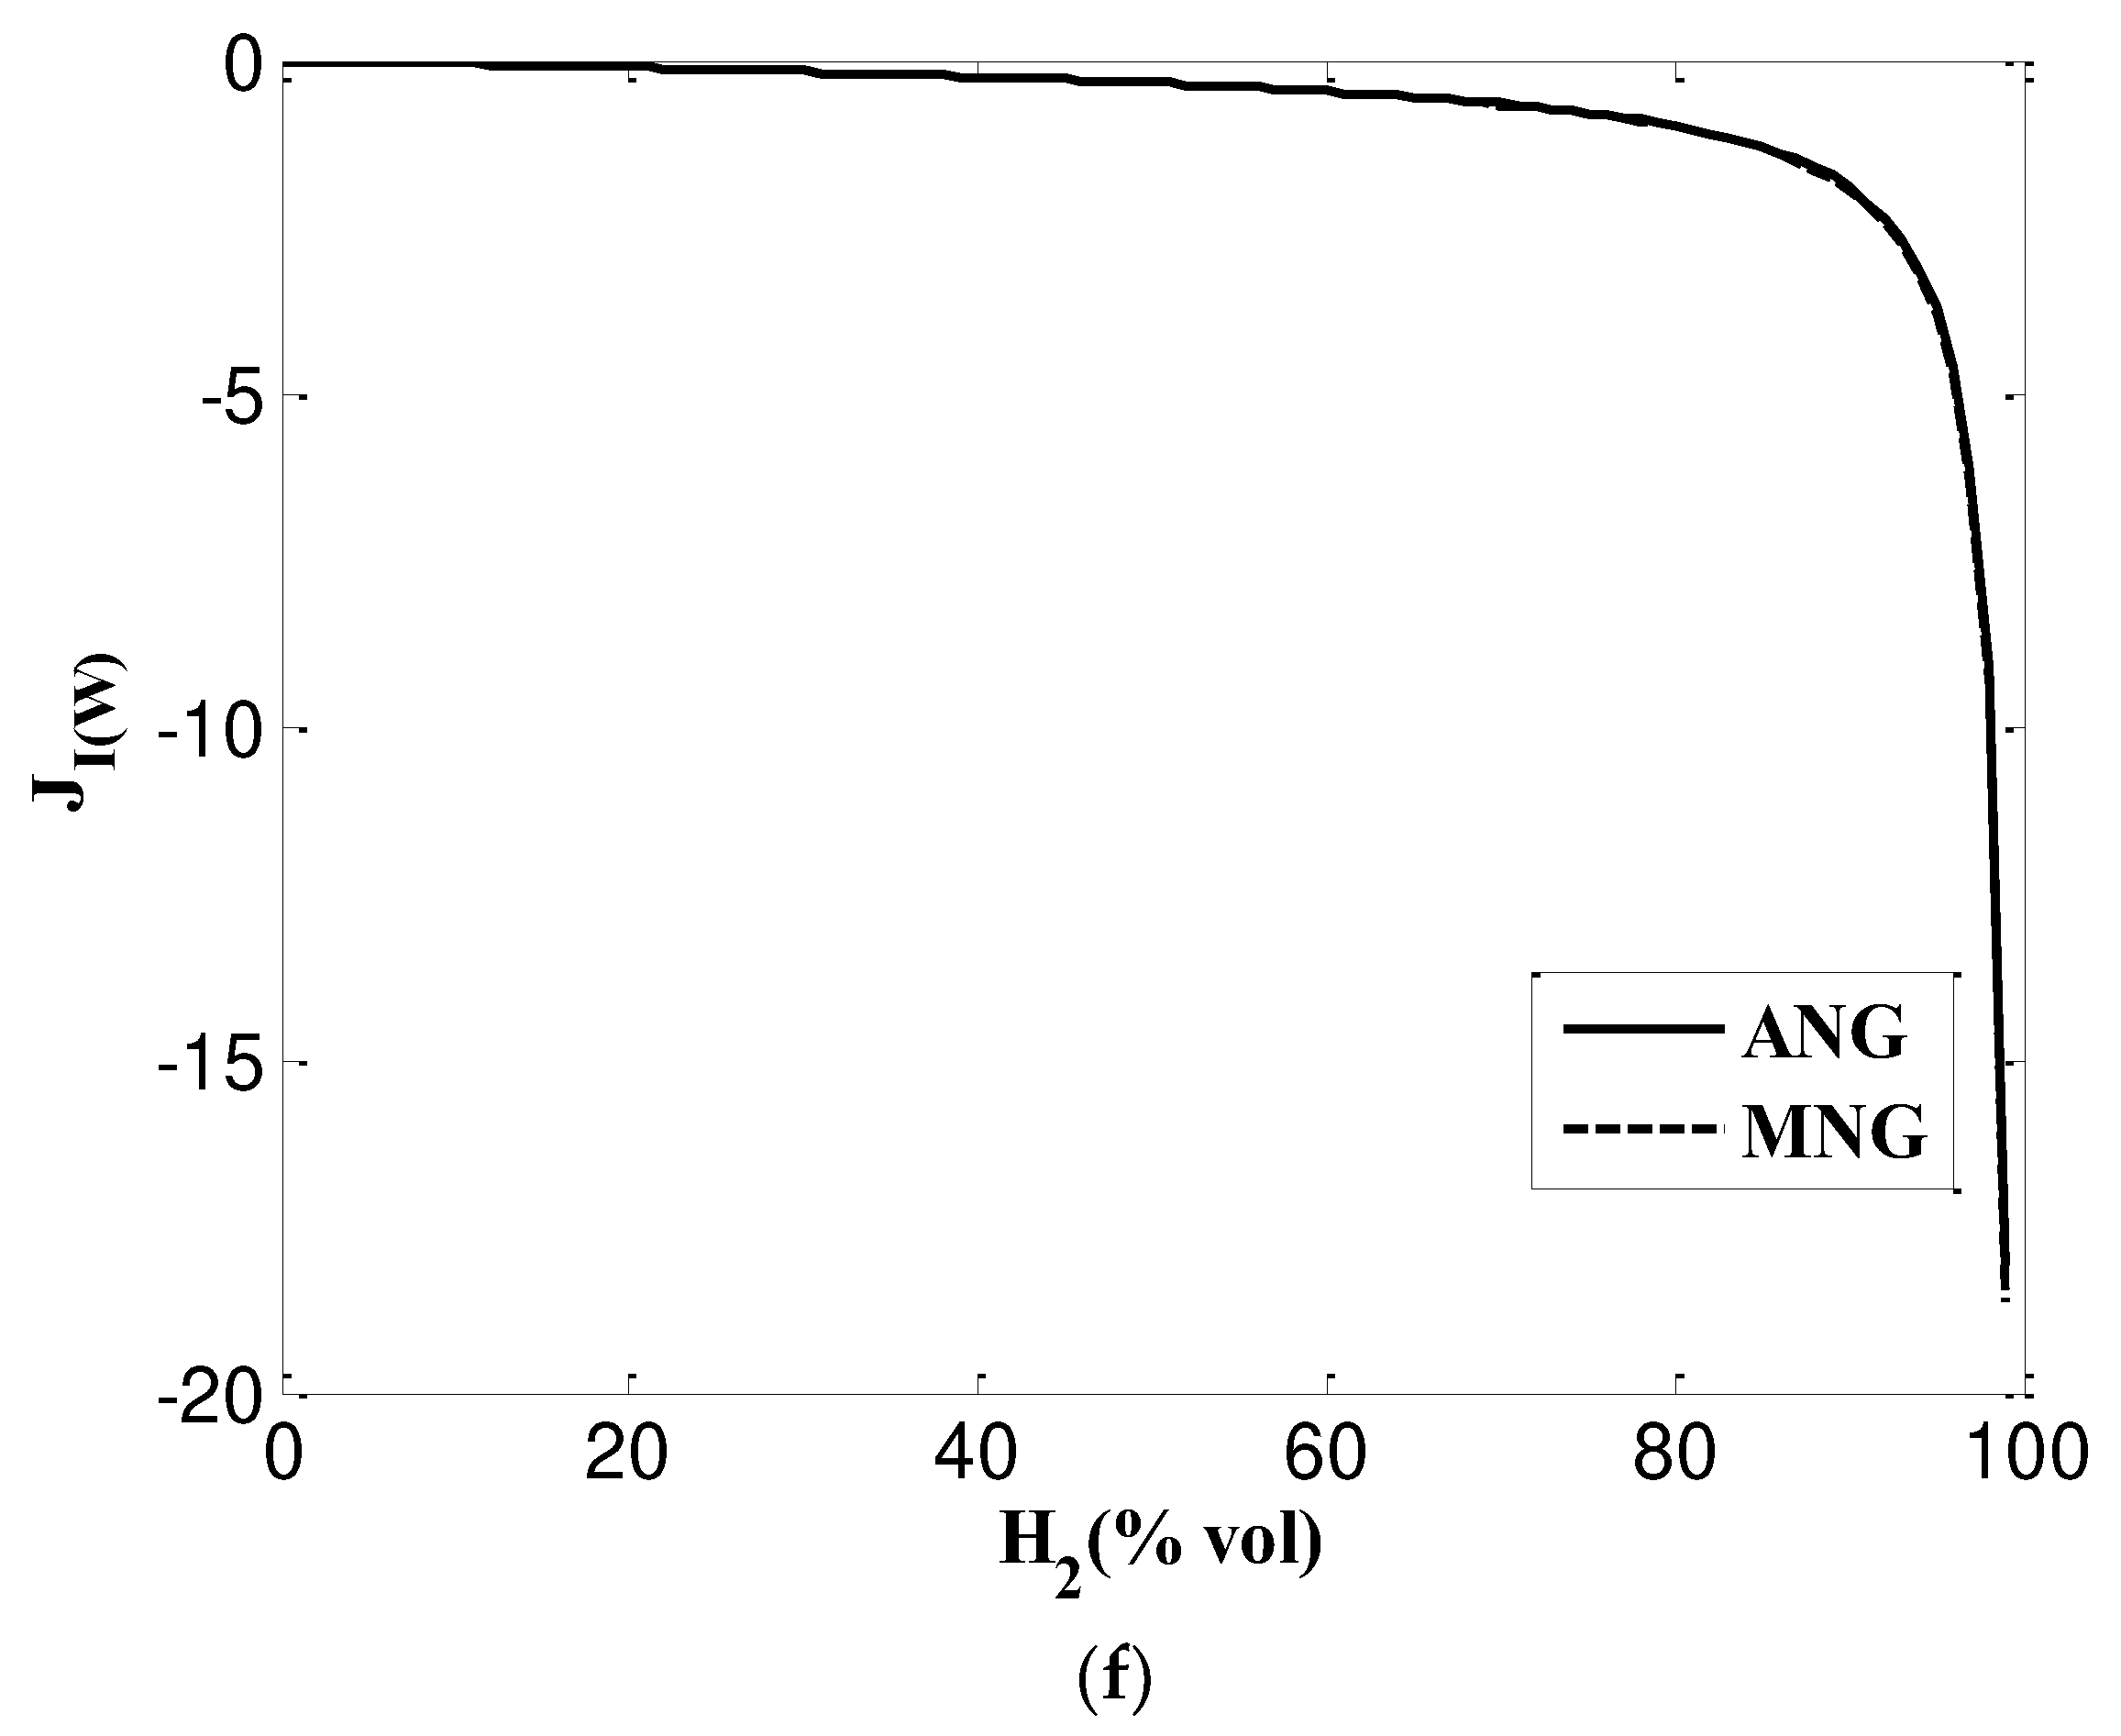
Based on the last Weaver interchangeability criteria, i.e., the yellow tipping index J Y W and the incomplete combustion index J I W , plotted in Figures 7.e and 7.f, any hydrogen content in a mixture with natural gas always meet the requirements of interchangeability and does not lead to any phenomena that would affect the combustion process or unit safety.

Conclusions

The following conclusions are drawn by taking into consideration various interchangeability indices when hydrogen is blended with two types of natural gas (ANG, MNG) distributed in Tunisia.
1)
Based on SG, NG and NG/H2 mixtures are interchangeable and the maximum mixing percentage of hydrogen content to ANG is 17% and to MNG is 13%. However, when considering WI these values grow up to 24% and 17% for ANG and MNG respectively. According to SG, NG and NG/H2 mixtures can be used interchangeably with a maximum hydrogen concentration of 17% for ANG and 13% for MNG. However, when WI is taken into account, ANG and MNG's values increase to 24% and 17%, respectively.
2)
According to the Knoy method, the maximum allowable mixing content of hydrogen is 14%.
3)
Dutton indices predict that the maximum hydrogen content is more than 36%.
4)
Graphical Delbourg diagrams illustrates maximum blending ratio up to 15% and 22% into ANG and MNG respectively.
5)
Weaver index method have been testing American gas appliances, which impose stricter requirements on WI and CP. Maximum hydrogen content mixing percentages for ANG and MNG are 20% and 17%, respectively, according to calculation results. However, when hydrogen content increases, there is a greater risk of flame lift and light back phenomena. Equipment for flame stabilization will then be needed.
The feasibility evaluation methods investigated by this study confirms the general tendency to accept a hydrogen blending percentage up to the range 15%-20% vol. Maximum hydrogen content mixing percentages for ANG and MNG are 20% and 17%, respectively, according to calculation results. Hydrogen blending may prevent more than 1 million tonnes of carbon dioxide emissions annually. However, when hydrogen content increases, there is a greater risk of flame lift and light back phenomena. Equipment for flame stabilization will then be needed.
It is crucial to consider infrastructure and safety requirements when blending hydrogen into natural gas to ensure a seamless and secure transition towards a low-carbon energy future. The distinct physical and chemical properties of hydrogen necessitate a thorough evaluation of the existing NG infrastructure in Tunisia, requiring potential upgrades to materials and systems for compatibility. Safety considerations are paramount, given hydrogen's flammable nature, requiring the implementation of rigorous safety measures, specialized leak detection systems, and adherence to regulatory standards.

Funding

This research did not receive any specific grant from funding agencies in the public, commercial, or not-for-profit sectors.

References

  1. Price, A. (2015). The exploitation of renewable sources of energy for power generation. In Electrochemical energy storage for renewable sources and grid balancing (pp. 3-12). Elsevier.
  2. Tang, D. , Tan, G. L., Li, G. W., Liang, J. G., Ahmad, S. M., Bahadur, A.,... & Bououdina, M. (2023). State-of-the-art hydrogen generation techniques and storage methods: A critical review. Journal of Energy Storage, 64, 107196.
  3. Taibi, E., Miranda, R., Vanhoudt, W., Winkel, T., Lanoix, J. C., & Barth, F. (2018). Hydrogen from renewable power: Technology outlook for the energy transition.
  4. EU Commission. A Hydrogen Strategy for a Climate Neutral Europe. 2020. Available online: https://ec.europa.eu/energy/sites/ener/files/hydrogen_strategy.pdf (accessed on 16 February 2023).
  5. Cheli, L., Guzzo, G., Adolfo, D., & Carcasci, C. (2021). Steady-state analysis of a natural gas distribution network with hydrogen injection to absorb excess renewable electricity. international journal of hydrogen energy, 46(50), 25562-25577.
  6. Vidas, L., Castro, R., & Pires, A. (2022). A review of the impact of hydrogen integration in natural gas distribution networks and electric smart grids. Energies, 15(9), 3160.
  7. Gaz, R. D. F. G., Storengy, F., Reseau, G. D. S., & Syndicat, P. D. E. G. N. (2019). Technical and economic conditions for injecting hydrogen into natural gas networks-Final report June 2019.
  8. Shirvill, L. C. , Roberts, T. A., Royle, M., Willoughby, D. B., & Sathiah, P. (2019). Experimental study of hydrogen explosion in repeated pipe congestion–Part 2: Effects of increase in hydrogen concentration in hydrogen-methane-air mixture. International Journal of Hydrogen Energy, 44(5), 3264-3276.
  9. Raju, A. S. , Martinez-Moralez, A., Lever, O., & Asiedu-Akrofi, L. (2022). Hydrogen blending impacts study. California Public Utilities Commission.
  10. Gondal, I. A. (2019). Hydrogen integration in power-to-gas networks. International journal of hydrogen energy, 44(3), 1803-1815.
  11. Guzzo, G. , Cheli, L., & Carcasci, C. (2022). Hydrogen blending in the Italian scenario: Effects on a real distribution network considering natural gas origin. Journal of Cleaner Production, 379, 134682.
  12. Melaina, M. W. , Antonia, O., & Penev, M. (2013). Blending hydrogen into natural gas pipeline networks: a review of key issues.
  13. Topolski, K. , Reznicek, E. P., Erdener, B. C., San Marchi, C. W., Ronevich, J. A., Fring, L.,... & Chung, M. (2022). Hydrogen blending into natural gas pipeline infrastructure: review of the State of technology.
  14. https://www.iee.fraunhofer.de/content/dam/iee/energiesystemtechnik/en/documents/Studies-Reports/FINAL_FraunhoferIEE_ShortStudy_H2_Blending_EU_ECF_Jan22.
  15. Cavana, M., Mazza, A., Chicco, G., & Leone, P. (2021). Electrical and gas networks coupling through hydrogen blending under increasing distributed photovoltaic generation. Applied Energy, 290, 116764.
  16. Vaccariello, E., Trinchero, R., Stievano, I. S., & Leone, P. (2021). A statistical assessment of blending hydrogen into gas networks. Energies, 14(16), 5055.
  17. HyDeploy (2020). Gas Network Innovation Competition. Available at https://hydeploy.co.uk/.
  18. Hall, J. E. , Hooker, P., & Jeffrey, K. E. (2021). Gas detection of hydrogen/natural gas blends in the gas industry. International Journal of Hydrogen Energy, 46(23), 12555-12565.
  19. Edwards, R. L. , Font-Palma, C., & Howe, J. (2021). The status of hydrogen technologies in the UK: A multi-disciplinary review. Sustainable Energy Technologies and Assessments, 43, 100901.
  20. Storage, E. P2G, 2018. GRHYD project inaugurates first P2G demonstrator in France, 9-10.
  21. The GRHYD demonstration project: https://www.engie.com/en/businesses/gas/hydrogen/power-to-gas/the-grhyd-demonstration-project.
  22. Zhao, Y., McDonell, V., & Samuelsen, S. (2019). Influence of hydrogen addition to pipeline natural gas on the combustion performance of a cooktop burner. International Journal of Hydrogen Energy, 44(23), 12239-12253.
  23. DESCHAMPS, Y. (1984). Combustibles gazeux. Utilisation et combustibilité des gaz. In Généralités: sciences fondamentales, génie industriel.
  24. Euro-Asian Council for Standardization, Metrology and Certification (2012). ЕN 437: 2012. Test gases. Test pressures. Appliance categories. Minsk: Euro-Asian Council for Standardization, Metrology and Certification.
  25. https://www.iso.org/fr/standard/53058.html.
  26. Honus, S. , Kumagai, S., & Yoshioka, T. (2016). Replacing conventional fuels in USA, Europe, and UK with plastic pyrolysis gases–Part II: Multi-index interchangeability methods. Energy conversion and management, 126, 1128-1145.
  27. Delbourg, P. , & Lafon, J. (1971). Interchangeabilité des gaz. Energy economics, 731, 44.
  28. Dutton, B. C. , & Wood, S. W. (1984). Gas interchangeability: prediction of soot deposition on domestic gas appliances with aerated burners. J. Inst. Energy;(United Kingdom), 57(432).
  29. Weaver, E. R. (1951). Formulas and graphs for representing the interchangeability of fuel gases. Journal of Research of the National Bureau of Standards, 46(3), 213-245.
  30. NGC+ Interchangeability Work Group. (2005). White paper on natural gas interchangeability and non-combustion end use. Federal Energy Regulatory Commission.
  31. Knoy, M. F. (1953). Graphic approach to the problem of interchangeability. AGA Proceedings, 938-947.
  32. GIZ, Study on the opportunities of “Power-to-X” in Tunisia. Available at : https://www.giz.de/en/downloads_els/GIZ%20PtX%20Tunisia%20report-Web.pdf.
  33. GIZ (2019). Renewable energy projects in Tunisia – Guide summary, available at: http://www.tunisieindustrie.gov.tn/upload/ENR/Guide_Summary_RE_ Tunisia_mai2019.pdf.
  34. STEG 2022 annual report. Available at : ttps://www.steg.com.tn/fr/institutionnel/publications.html.
  35. Tunisian Open Data Platform, https://data.gov.tn.
  36. Related safety issues the injection of hydrogen into natural gas transport and distribution networks: current situation and prospects; Ref.: INERIS-DRA-19-178263-01884B.
  37. Gaz, R. D. F. G., Storengy, F., Reseau, G. D. S., & Syndicat, P. D. E. G. N. (2019). Technical and economic conditions for injecting hydrogen into natural gas networks-Final report June 2019.
  38. BRIEF, I. L. (2019). RENEWABLE POWER-TO-HYDROGEN.
  39. El-Mahallawy, F., & Habik, S. D. (2002). Fundamentals and technology of combustion. Elsevier.
  40. Turns, S. R. (1996). Introduction to combustion (Vol. 287, p. 569). New York, NY, USA: McGraw-Hill Companies.
  41. Ren, F., Chu, H., Xiang, L., Han, W., & Gu, M. (2019). Effect of hydrogen addition on the laminar premixed combustion characteristics the main components of natural gas. Journal of the Energy Institute, 92(4), 1178-1190.
  42. Korobeĭnikov, V. P. (1976). Problems in the theory of point explosion in gases (No. 119). American Mathematical Soc.
  43. Briggs, T. (2014). The combustion and interchangeability of natural gas on domestic burners. Combustion, 4(3), 67-87.
  44. Honus, S. , Kumagai, S., & Yoshioka, T. (2016). Replacing conventional fuels in USA, Europe, and UK with plastic pyrolysis gases–Part II: Multi-index interchangeability methods. Energy conversion and management, 126, 1128-1145.
  45. Alexander, S., Anatolii, K., & Vitalii, T. (2022). Interchangeability and Standardization of the Parameters of Combustible Gases When Using Hydrogen. Architecture and Engineering, 7(1), 33-45.
  46. Lander, D. (2002). UK situation regarding gas quality. Presentation to Marcogaz Gas Quality WG.
  47. Union, I. G. (2011). Petroleum B. guidebook to gas interchangeability and gas quality.
  48. Britain, G. (1996). A Guide to the Gas Safety (Management) Regulations 1996: Guidance on Regulations. HSE Books.
  49. Fík, J. (1998). Combustion of gaseous fuels and gas burners. GAS Ltd.
  50. Ortíz, J. M. (2014). Fundamentos de la intercambiabilidad del gas natural. Ciencia, 6-15.
  51. Alexander, S., Anatolii, K., & Vitalii, T. (2022). Interchangeability and Standardization of the Parameters of Combustible Gases When Using Hydrogen. Architecture and Engineering, 7(1), 33-45.
  52. Ferguson, D. H. , Straub, D. L., Richards, G. A., & Robey, E. H. (2007). Impact of fuel interchangeability on dynamic instabilities in gas turbine engines (No. DOE/NETL-IR-2007-102). National Energy Technology Laboratory (NETL), Pittsburgh, PA, Morgantown, WV, and Albany, OR (United States).
Figure 1. Balance of NG in Tunisia  [31]: Preprints 92796 i001 demand Preprints 92796 i002 national production Preprints 92796 i003 royalties ANG [35].
Preprints 92796 g001
Figure 2. Specific gravity for natural gas / hydrogen mixtures.
Preprints 92796 g002
Figure 3. Wobbe index (solid line) and High Heating Value (dashed line) variations of hydrogen natural gases mixtures (a) ANG (b) MNG. Also shown is the legal threshold of WI imposed by EASEE-gas standard plotted in dotted line.
Preprints 92796 g003
Figure 4. Knoy index for MNG/H2 and ANG/H2 mixtures.
Preprints 92796 g004
Figure 5. Dutton’s criteria for natural gases / hydrogen mixtures (a) Incomplete combustion factor (b) lift index and (c) soot index.
Preprints 92796 g005
Figure 6. Delbourg’s chart of interchangeability (a) ANG (b) MNG.
Preprints 92796 g006
Figure 7. Variation of interchangeability Weaver index with the blending proportion of H2.
Preprints 92796 g007aPreprints 92796 g007bPreprints 92796 g007c
Table 1. Summary of the applied interchangeability methods [26].
Method or index Country Controlled parameters
Knoy index Europe HHV
Delbourg method Europe S, Y
Dutton’s criteria UK/AUS I, L, S
AGA method USA F, L, Y
Weaver method USA F, I, L, S, Y, HHV
F – Flashback, I – Incomplete combustion, L – Lifting, HHV – Unit heat rate, S – Sooting, Y –Yellow tipping I – Incomplete combustion.
Table 2. Composition of the natural gases.
Components CH4 C2H6 C3H8 nC4H10 iC4H10 nC5H12 iC5H12 C6H14 CO2 N2 He
ANG (% vol) 83.42 7.77 1.95 0.45 0.25 0.10 0.09 0.12 0.25 5.42 0.18
MNG (% vol) 87.04 4.70 1.23 0.27 0.29 0.06 0.07 0.04 0.02 6.28 0.00
Table 3. Some characteristics of the studied natural gases.
Combustion parameters High Heating Value (kJ/Nm3) Density
(kg/m3)
SG Wobbe index (kJ/Nm3) Combustion Potential
ANG 42 213 0.84 0.65 52 388 43.75
MNG 40 325 0.80 0.62 50 892 41.15
Table 4. The limits of the interchangeability diagram.
Gas reference Composition Wobbe Index (kJ/Nm3) Combustion Potential Comment
G20 100% CH4 53685 40.37 Reference’s gas
G21 13% C3H8 /87%CH4 59365 46.70 Limit of incomplete combustion
G222 23% H2 / 77% CH4 50673 69.42 Limit of flame flashback
G231 15% N2 / 85% CH4 43264 32.53 Limit of flame lifting
Table 5. Interchangeability indices according to the Weaver method.
Indices definition Calculation Formula Condition of interchangeability
Heat rate ratio Ratio between the Wobbe index for the substitute gas (“s” index) and the Wobbe index for the replaced or adjustment gas (“a” index) J H W = W I s W I a J H W = 1.0   ( ± 5 % )
Primary air ratio Ratio between the theoretical required air for combustion for each gas J A W = V a s ρ m i x , a V a a ρ m i x , s J A W = 1.0   ( ± 5 % )
Lifting index Includes the flame speed (S) of both gases as well as the volume fraction of oxygen Ω O 2 in them J L W = J A W S s S a 100 Ω O 2 s 100 Ω O 2 a J L W = 1.0   ( ± 5 % )
Flashback index Includes the flame speed (S) of both gases as well as primary air ratio J F W = S s S a 1.4   J A W + 0.4 J F W 0
yellow tipping index Includes the total content of hydrogen atoms in molecule of gas (Nc) and primary air ratio J Y W =   J A W + N C s N C a 110 1 J Y W 0
Incomplete combustion index Calculated using the ratio of the number of hydrogen and carbon in molecules (RH/C)of compared gases J I W =   J A W 0.36 R H / C s R H / C a 0.634 J I W 0
Disclaimer/Publisher’s Note: The statements, opinions and data contained in all publications are solely those of the individual author(s) and contributor(s) and not of MDPI and/or the editor(s). MDPI and/or the editor(s) disclaim responsibility for any injury to people or property resulting from any ideas, methods, instructions or products referred to in the content.
Copyright: This open access article is published under a Creative Commons CC BY 4.0 license, which permit the free download, distribution, and reuse, provided that the author and preprint are cited in any reuse.
Prerpints.org logo

Preprints.org is a free preprint server supported by MDPI in Basel, Switzerland.

Subscribe

© 2024 MDPI (Basel, Switzerland) unless otherwise stated