Preprint
Article

A Case Study to Evaluate the Horticultural Performance of Greenhouse Cherry Tomatoes Based on Progressive Growth Report (PGR), Productivity and Nutritional Composition.

Altmetrics

Downloads

144

Views

123

Comments

0

Submitted:

08 December 2023

Posted:

11 December 2023

You are already at the latest version

Alerts
Abstract
The dynamic process of plants’ growth is primarily influenced by interconnected biochemical and physiological activities that operate throughout different growing phases. These processes respond to environmental conditions, affecting plant development and productivity. The present studies were carried out to investigate greenhouse conditions' impact on winter-grown cherry tomatoes (Cheramy F1) in terms of growth, yield, and nutritional composition.Data was collected on various dates during the period extending from December 2022 to March 2023. The greenhouse temperature varies from 22°C to 25.47°C (avg. 21.20°C) during plant growth and from 20°C to 23.85°C during fruit-bearing. Average CO2 concentration was 349.19 ppm; average light was 240.93 w/m2. Measured growth parameters include plant height, leaf growth, stem diameter, leaf spacing, leaf count, leaf area, and inflorescence count per plant. The key results of this study revealed the progressive growth report (PGR), which predicted the daily potential growth rate of plants: plant height, 2.86 to 3.81 cm/day; growth rate of mature old leaf: 0.003988 m2/day; middle younger leaf: 0.008733 m2/day; top Nascent leaf: 0.010722 m2/day; three to five leaves per week; and one inflorescence per week. In our accidental observation, we observed that plants with different orientations and growing spots within the greenhouse responded differently in view of their growth parameters. A exceedingly significant interaction among the inflorescence was found in view of length of inflorescence, number of fruits inflorescence, total fruit mass inflorescence, average fruit mass inflorescence, fruit dry matter inflorescence, fruit height inflorescence, and fruit diameter inflorescence. A non-significant interaction was found between the fruit keeping quality (Shelf days), fruit size, and inflorescence number. Inflorescence with a high, lower leaf area appeared to have high productivity. The nutritional composition of fruit was also different among the inflorescences.. The study's goal is to investigate and gather data to test the hypothesis that changes in greenhouse conditions and the adoption of green management practices will directly influence plant growth attributes, productivity, and fruit quality. The findings of this research could be valuable for optimizing greenhouse operations to enhance crop yields and quality while also promoting environmental sustainability.
Keywords: 
Subject: Biology and Life Sciences  -   Agricultural Science and Agronomy

1. Introduction

To combat unpredictable climate swings (threats) in the agriculture sector, it’s now paramount for horticulturalists to propose a sustainable environment for the growth of plants. In current times, the role of greenhouse structures in the growth of economically oriented crops is inevitable. To cultivate crops in a sustainable way, knowledge of greenhouse management techniques and optimal growing conditions such as temperature, humidity, and light is highly recommended. Therefore, in the present study, we studied the impact of greenhouse microclimate conditions on the growth, productivity, and nutritional profile of the local cherry tomato cultivar (Cheramy F1). The cherry tomato (Solanum lycopersicon var. cerasiforme), also known as "the most popular vegetable fruit,” belongs to the extremely large night shade plant family, the Solanaceae [1]. Cherry tomato is renowned for its rich nutritional content, offering essential vitamins (A, C, and K), minerals (potassium, calcium, and phosphorus folate), and antioxidants such as carotenoids (β-carotenoids and lycopene) [2,3,4]. Their consumption contributes to a balanced and healthy diet, promoting overall well-being and disease prevention [5]. Many ailments, especially chronic ones, can be cured with cherry tomatoes. [6]. Cherry tomatoes are adaptive to multiple growing substrates and environmental conditions, making them a high-demand vegetable throughout the world for many gardeners and growers. [7]. Tomato is the most important crop, with an annual production of 33. 414 million tons from 3.14 million acres [8]. There is a wide variety of modern uses for tomatoes, ranging from baking, boiling, and grilling them raw in salads, soups, stews, casseroles, salsa, on sandwiches, and many others [9]. The term "greenhouse" refers to a covered experimental setup that can offer optimally managed microclimate growth conditions to growing plants and allow growers to extend the growing season. It is not only attributed to structural and mechanical elements but also to climatic and nutritional elements [1]. Greenhouse technology offers an adaptive approach for the sustainable growth of vegetable plants [10]. One of the most popular vegetables cultivated in greenhouses around the world is the cherry tomato [11]. To meet the growing demand, modern farming practices have declared greenhouse cultivation an efficient and sustainable method for cherry tomato production. Tomato plants favor different climatic conditions, from moderate to warm. Adverse greenhouse conditions can damage the growth, biochemical, and physical attributes of plants. Greenhouses provide a controlled environment where temperature, pressure, light, CO2 concentration, and humidity can be regulated to create optimal growing conditions [12].
The synergistic effects of greenhouse environmental conditions on cherry tomato plant productivity have only been the subject of a very small amount of research. Temperature and carbon dioxide are two crucial climate variables that interact and have an impact on tomato plants [13]. It has been reported that carbon dioxide levels, in combination with other environmental factors, significantly affect the nutritional quality and concentration of chemical components, total antioxidants, soluble sugar, flavonoids, and soluble solids in various vegetables, including potatoes, tomatoes, and lettuce [14]. The net photosynthetic rates of plants and, consequently, their growth and yield can be enhanced by elevated CO2 [15]. Currently, carbon dioxide (CO2) is employed as a gaseous fertilizer because of its capacity to improve plant resilience to the stress of climate change in the cultivation of greenhouse vegetables [16,17]. On the contrary, the concentration of Co2 at the levels of 500 and 700 ppm decreased the concentration of titratable acidity, flavonoids, and phenols [18]. High temperatures have a significant impact on various physiological and biochemical processes in tomato plants, which ultimately lead to a significant reduction in plant productivity. Enhancing plant productivity within the controlled environment of a greenhouse hinges on the critical capacity to consistently modulate both temperature (T) and relative humidity (RH) in response to diverse indoor and outdoor conditions [12]. Increases in air temperature directly influence leaf and truss initiation [19]. The number of fruits per plant, fruit development, and the time duration of fruit set and ripening decreased in response to high temperatures [20,21]. Increasing temperature patterns affect the fruit setting process, which results in low yield production in tomato plants. [22].
Daylight, as the primary source of light energy for plants, plays a pivotal role in various aspects of their growth and development. It is instrumental in facilitating essential processes such as photosynthesis, plant maturation, flowering and fruit production, nutrient absorption, and photoperiodic responses [23]. The duration and intensity of daylight have a direct impact on plant physiology, particularly regarding the production of flowering hormones. Plants that receive an optimal amount of light exhibit traits such as robust stems, dense foliage, and an enhanced ability to resist pests and diseases. Crops grown in greenhouses show slow growth with lower quality during long, harsh winters with little exposure to sunlight [24]. Previously, it was observed that an increased concentration level of light (ambient + 100 µmol m2 s¯¹) and CO2 (900 µmol mol¯¹) could enhance the yield of the tomato crop by 15% [25]. Likewise, humidity also affects the growth of plants; it increases the photosynthesis rate by lowering water stress and enhancing stomatal conductance. [26]. It has been reported that high relative humidity enhances the yield of tomato plants grown in greenhouses. [27,28]). A high humidity level in a greenhouse with a low temperature is not favorable for the growth of tomatoes, as it lowers the yield [29].
Cultivating vegetables within a regulated structure, commonly known as controlled environment agriculture (CEA) or greenhouse farming, offers several advantages, particularly in colder regions of Europe. Greenhouse cultivation allows for precise control over environmental factors such as temperature, humidity, and light. This control can result in optimized growing conditions for various crops, especially tomatoes, leading to increased yield and improved crop quality [30]. Comprehensive knowledge of greenhouse technology is crucial for optimizing crop production within controlled environments. Extending this idea, current studies attempt to investigate more intricate elements, such as the interaction of various microclimate parameters and their possible impact on the local cherry tomato variety, “Cheramy F1." The underlying hypothesis of the study was that changes in greenhouse conditions and management practices would have a direct impact on plant growth characteristics, yield, and fruit quality. The underlying hypothesis of the study was that changes in greenhouse conditions and management practices would have a direct impact on plant growth characteristics, yield, and fruit quality. The results might help the growers to estimate the growing time and yield potential of cherry tomatoes and manage their production according to market demands.

2. Results

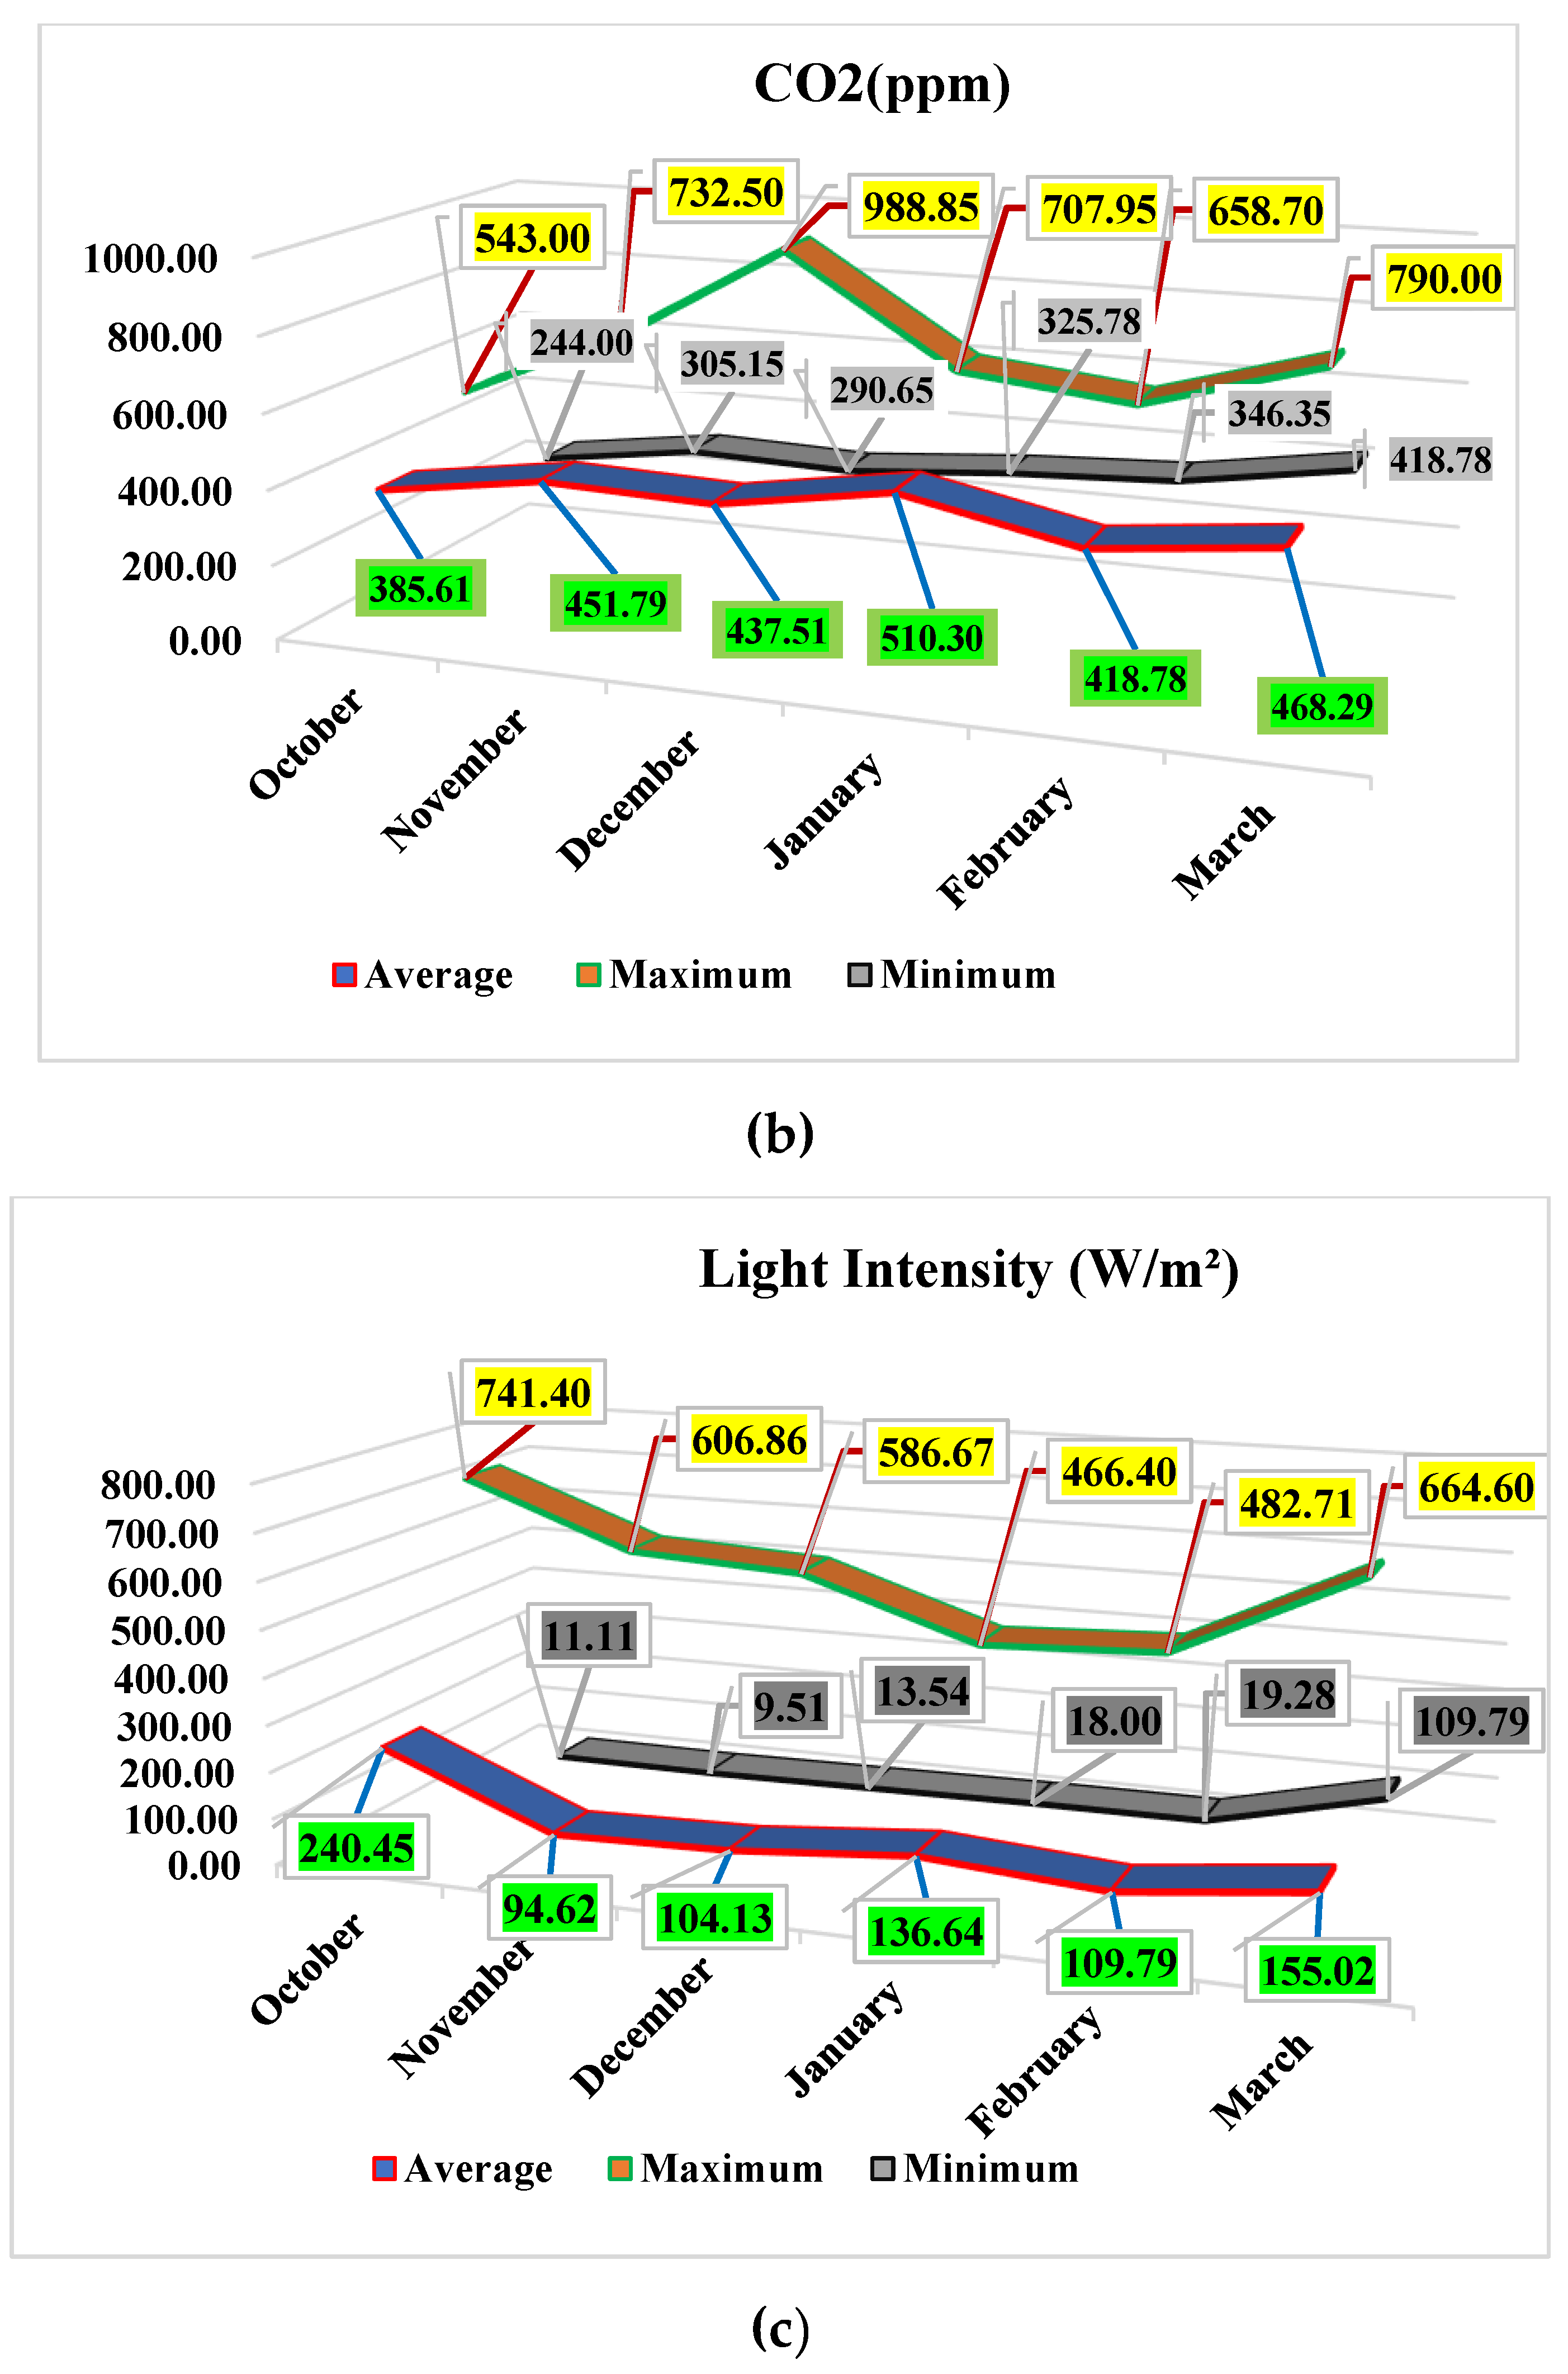
Figure 1 displays the average monthly data for greenhouse microclimate parameters, carbon dioxide, sunlight, humidity, and the highest and lowest air temperatures throughout the tomato-growing winter season, extended from October 2022 to March 2023. Microclimatic conditions significantly influence plant development. Variations in greenhouse conditions can significantly influence the photosynthesis process and overall plant health. During the plant's growth phase in October and November, the greenhouse experiences a maximum air temperature of 31.5− 41.3 °C and a minimum air temperature in the range of 8.2−10.5°C with an overall average temperature of 18.98−21.22 °C. During the fruit-bearing and fruit-ripening stages in December and January, the average temperature was recorded in the range of 18.35–20.77 °C.
The average carbon dioxide (CO2) concentration and light amount in the growing compartment while plants were in early vegetative growth stages were recorded within the range of 385.61−451.79 parts per million (ppm) and 94.62−240.45 watts per square meter (W/m²), respectively. The average carbon dioxide (CO2) concentration and light amount in the growing compartment, while plants were in the fruit-bearing and fruit-ripening phases were recorded at 437.51−510.30 ppm and 104.13−136.64 W/m², respectively. The availability of optimum ranges of temperature, light, and CO2 is highly recommended for the optimal growth of cherry tomatoes. Tomatoes Plants can grow at their fastest rate within the optimum range of day duration and light intensity [25]. In the present study, plants showed a maximum growth rate at the end of January and March. The available average growing conditions during these months were: temperature, 20.77−25.06°C; CO2 468.29−510.30 ppm. Light: 136.64−155.02 W/m². These results are consistent with previous findings [1,31].

2.1. Vegetative Growth Parameters

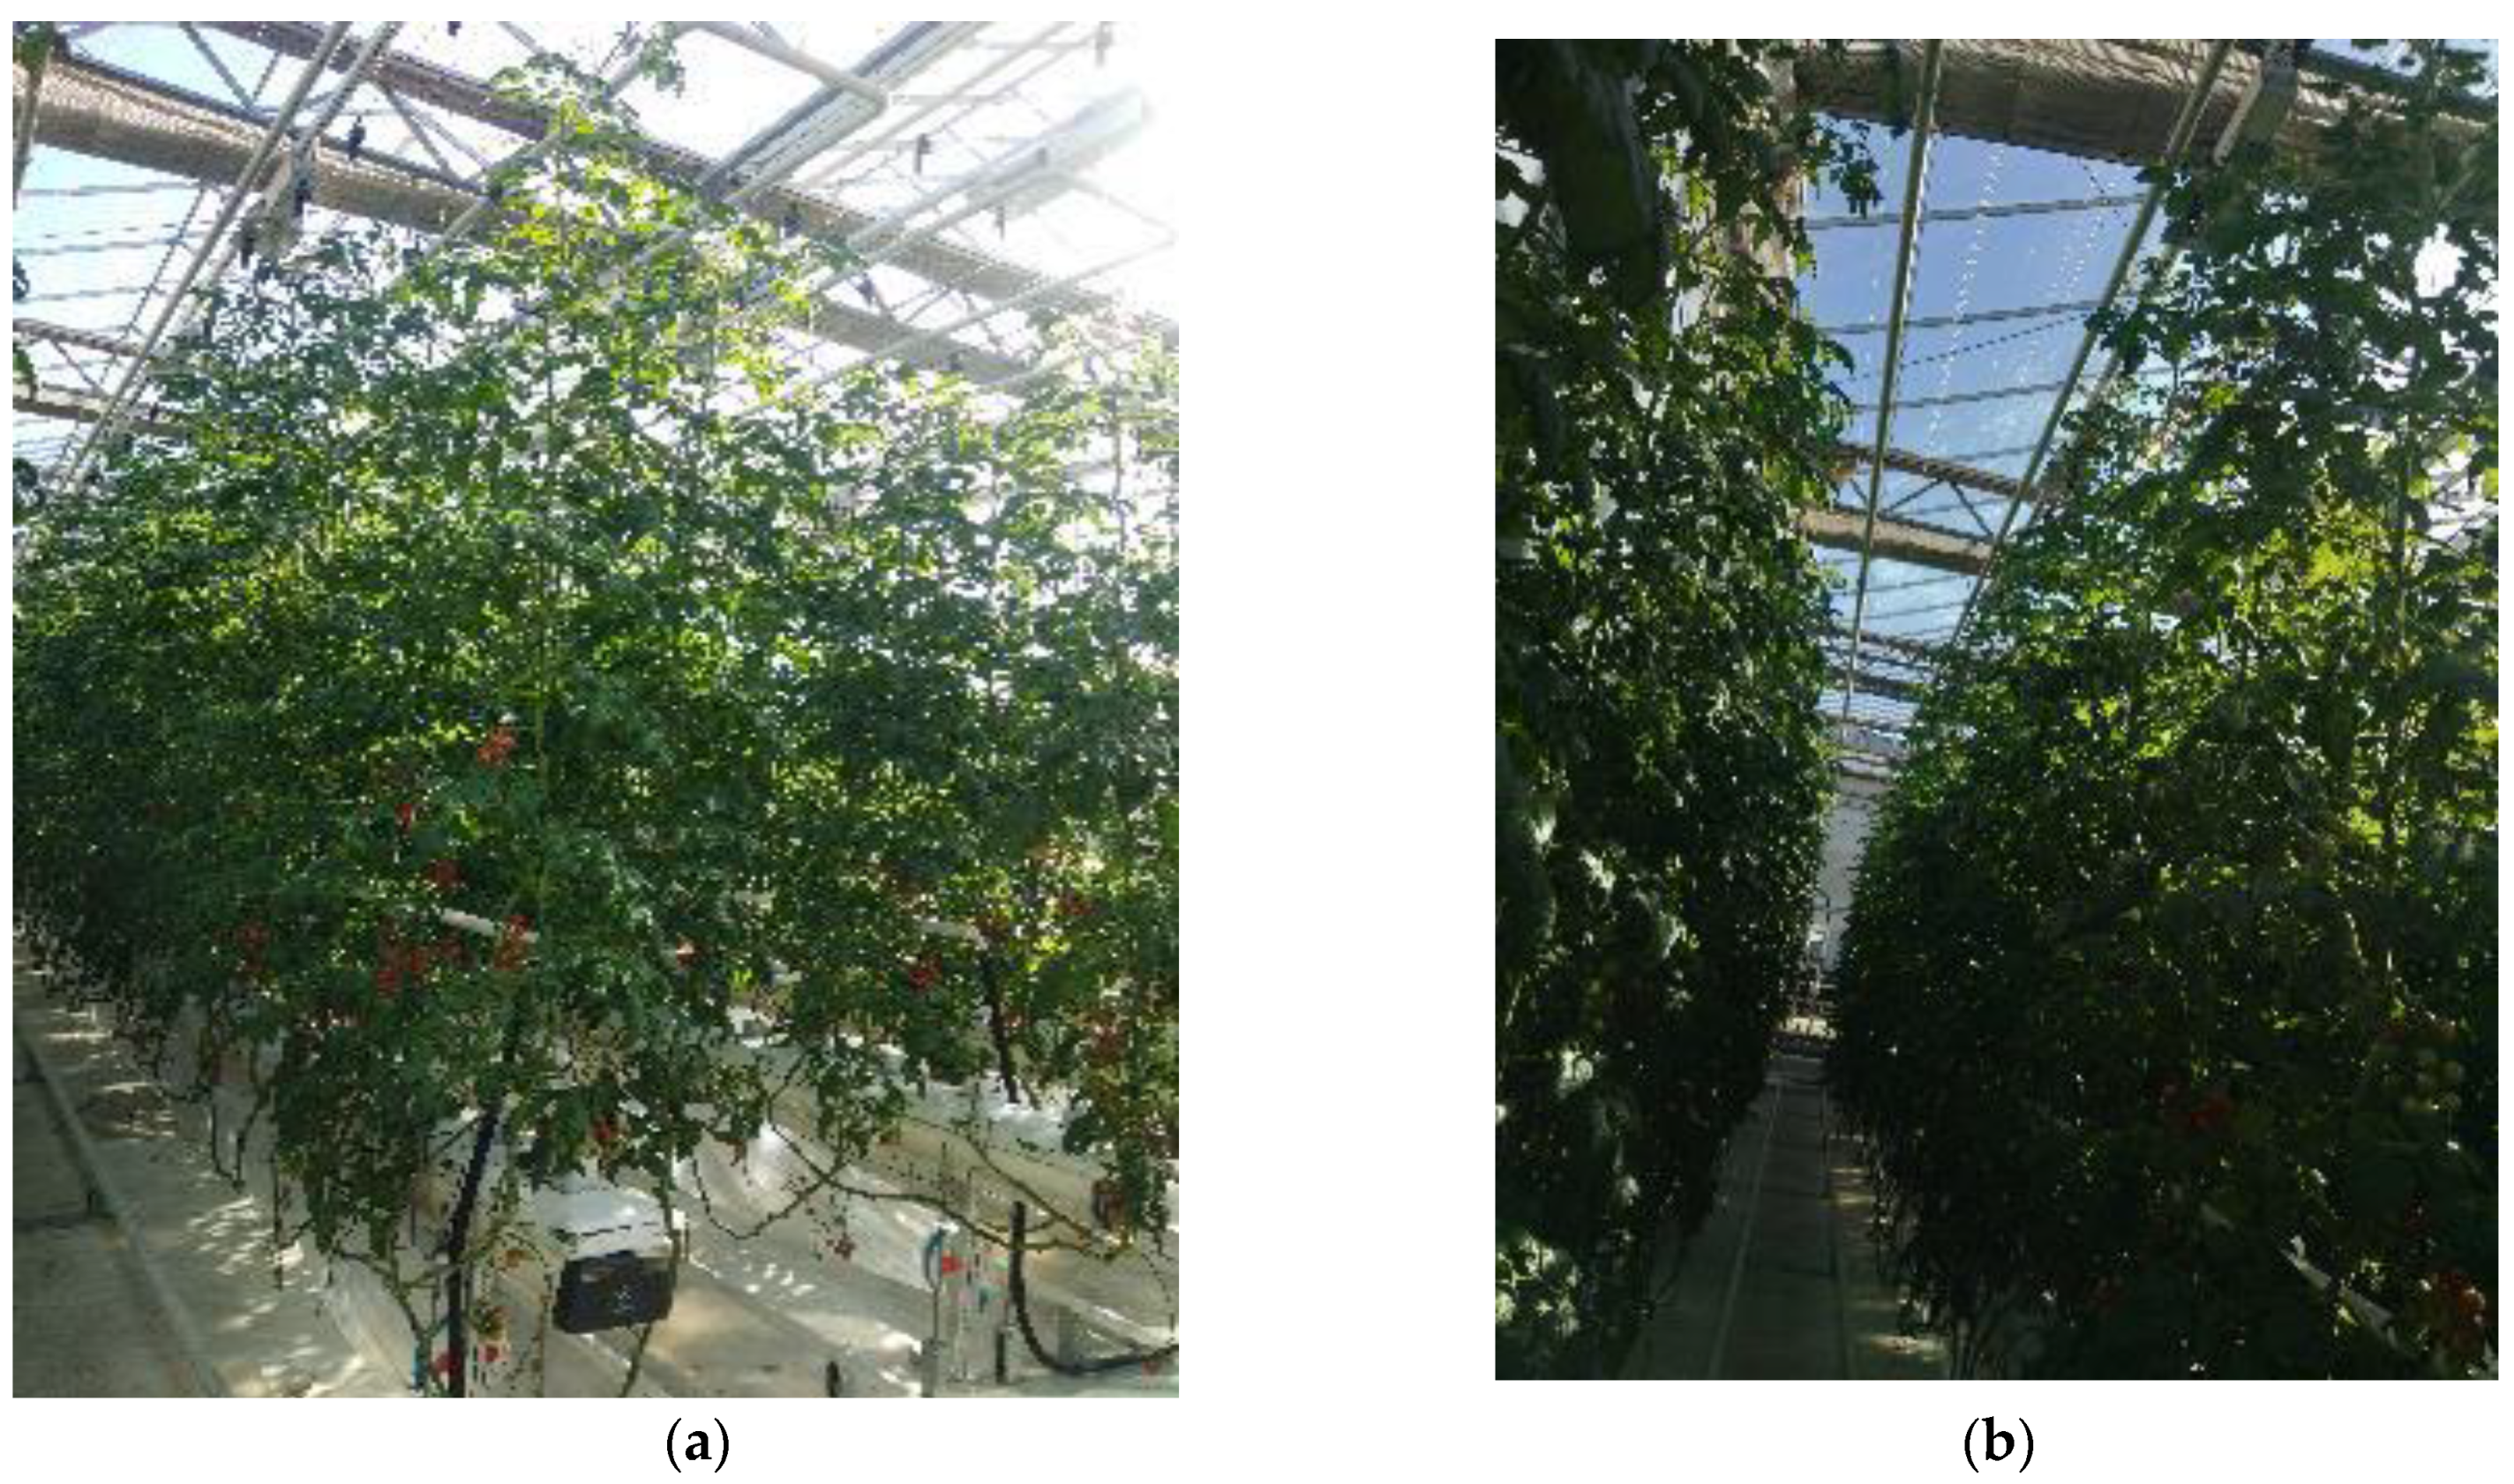
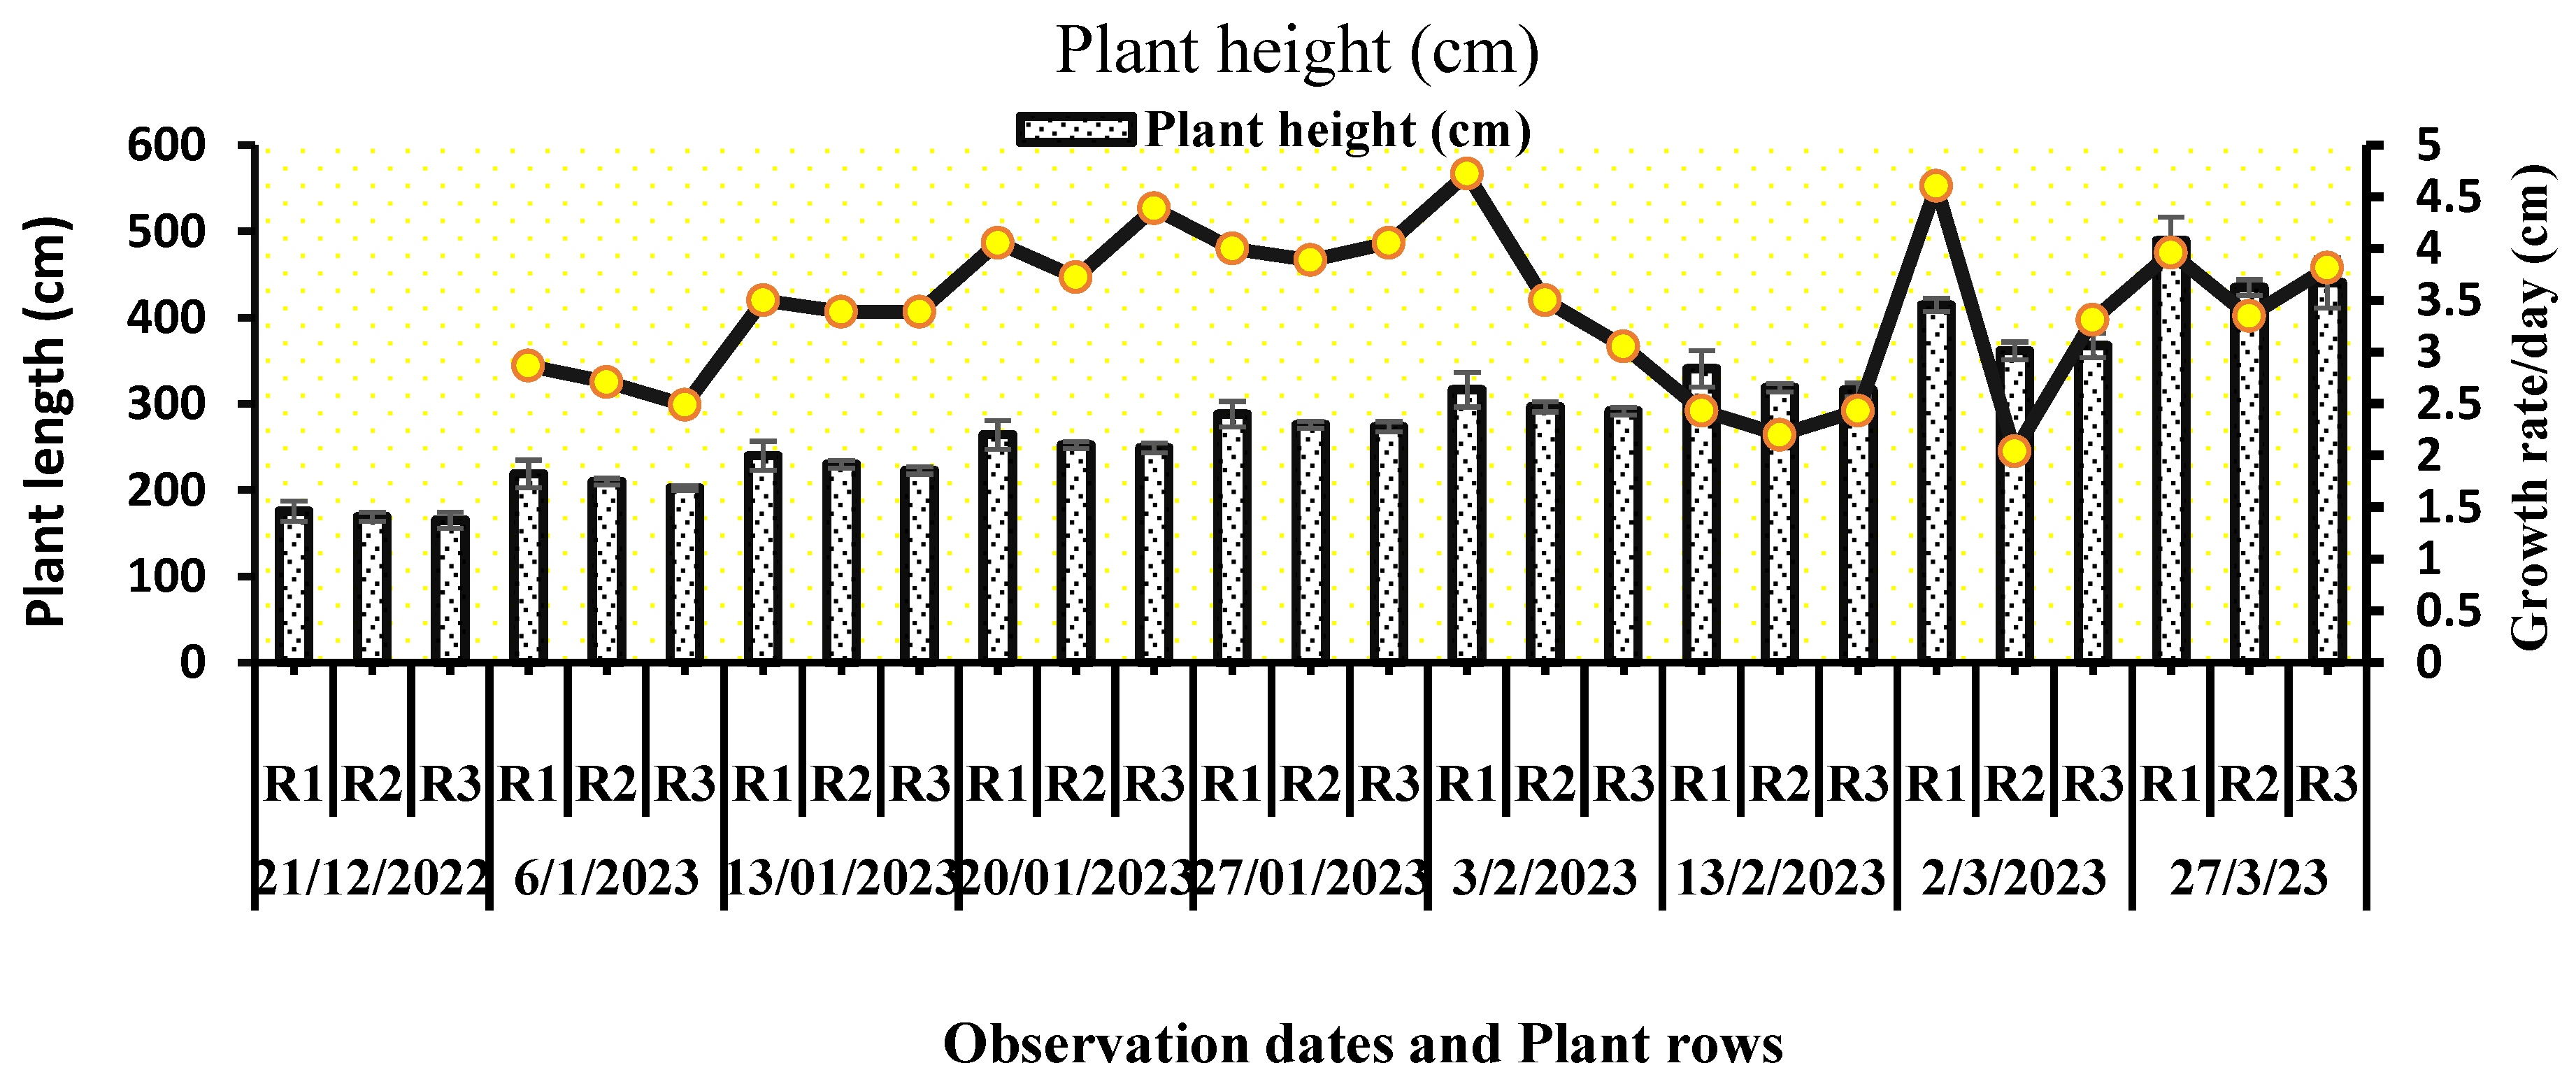
All the representative plants in each row showed an exceedingly significant interaction (P<0.001) between the total plant growth parameters and the observation dates (Table 1). The graphical representation, labeled Figure 2, illustrates the cumulative plant height per row and the daily growth rate variation. On the 148th day following the transplantation of tomato plants into the greenhouse experimental chamber, the average plant heights in rows 1, 2, and 3 were much higher—4.72 cm per day—at the start of February, when the average temperature inside the greenhouse was 21.32 °C and day length was about 10 h. A sudden decrease in plant growth rate was observed in the middle of February, when the average 10-day temperature was 17.98 °C, CO2 was 402 ppm, and light intensity was 134 W/m2. It might also be the hot outdoor weather conditions that reduced the daytime light exposure. The total number of leaves per plant was significantly different on each observation date. An average of 3 to 5 leaves emerges every week on each plant. The total number of leaves varied in relation to the change in total height of the plant and plant orientation in the greenhouse. Plants in the western section (anterior part) of the greenhouse exhibited low height, and as a result, they appeared with a smaller number of leaves (Figure 4). The progressive rise in the cumulative leaf count exhibited sustained constancy throughout the entire duration of the observation period, persisting until the final day of examination.
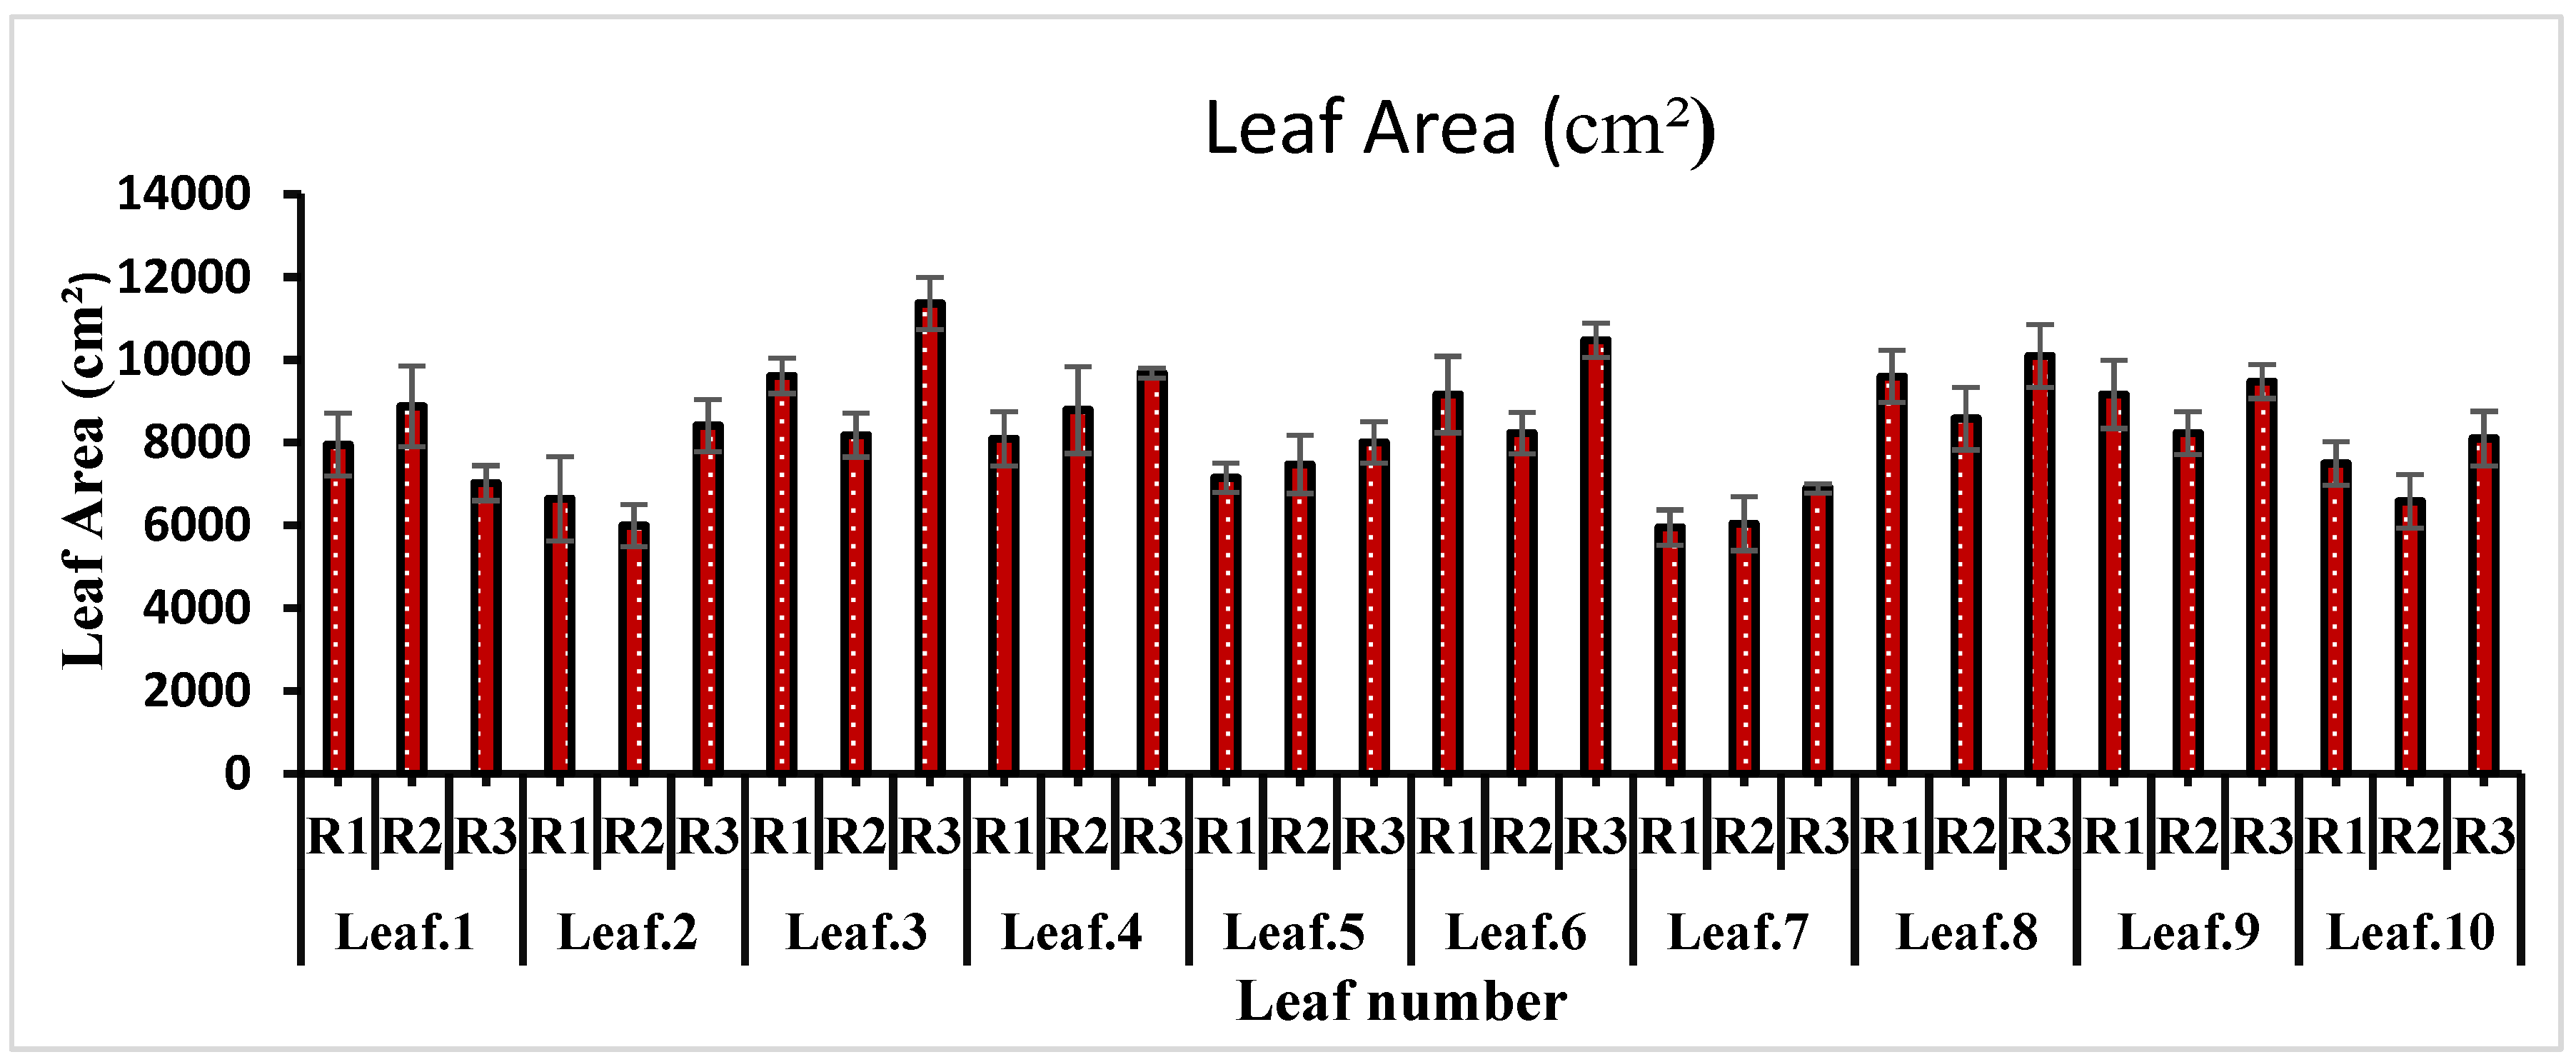
Leaf area is an important indicator of plant growth and productivity. It has been found that plants with a large leaf area produce more fruit. In the present study, the leaf below each inflorescence was brought under observation. The results showed a direct relationship between productivity and leaf area. The leaf area was significantly different among the observed leaves (P = 0.02). The 3rd leaf showed the highest leaf area, followed by leaf numbers 8th and 9th. The 7th leaf appeared with the lowest leaf area, followed by the 2nd and 1st (Figure 3). Leaves in the range of two to four were found between two successive inflorescences.
Row 3 plants in the southeastern section of the greenhouse, where the plants received ample exposure to early morning sunlight and generally remained under consistent solar irradiance, exhibited a comparatively shorter stature and a higher leaf count in comparison to other rows' plants. Row 3 plants appeared with the maximum number of total leaves per plant, with an average of 80 leaves per plant, followed by Row 1 and Row 2, which exhibited mean total leaf counts of 76 and 75 leaves per plant, respectively, on the final day of observation.
Figure 4. (a) Plants growth in the anterior section of compartment (western side); (b) Plants growth in the middle and posterior section of compartment (Eastern side).
Preprints 92799 g004
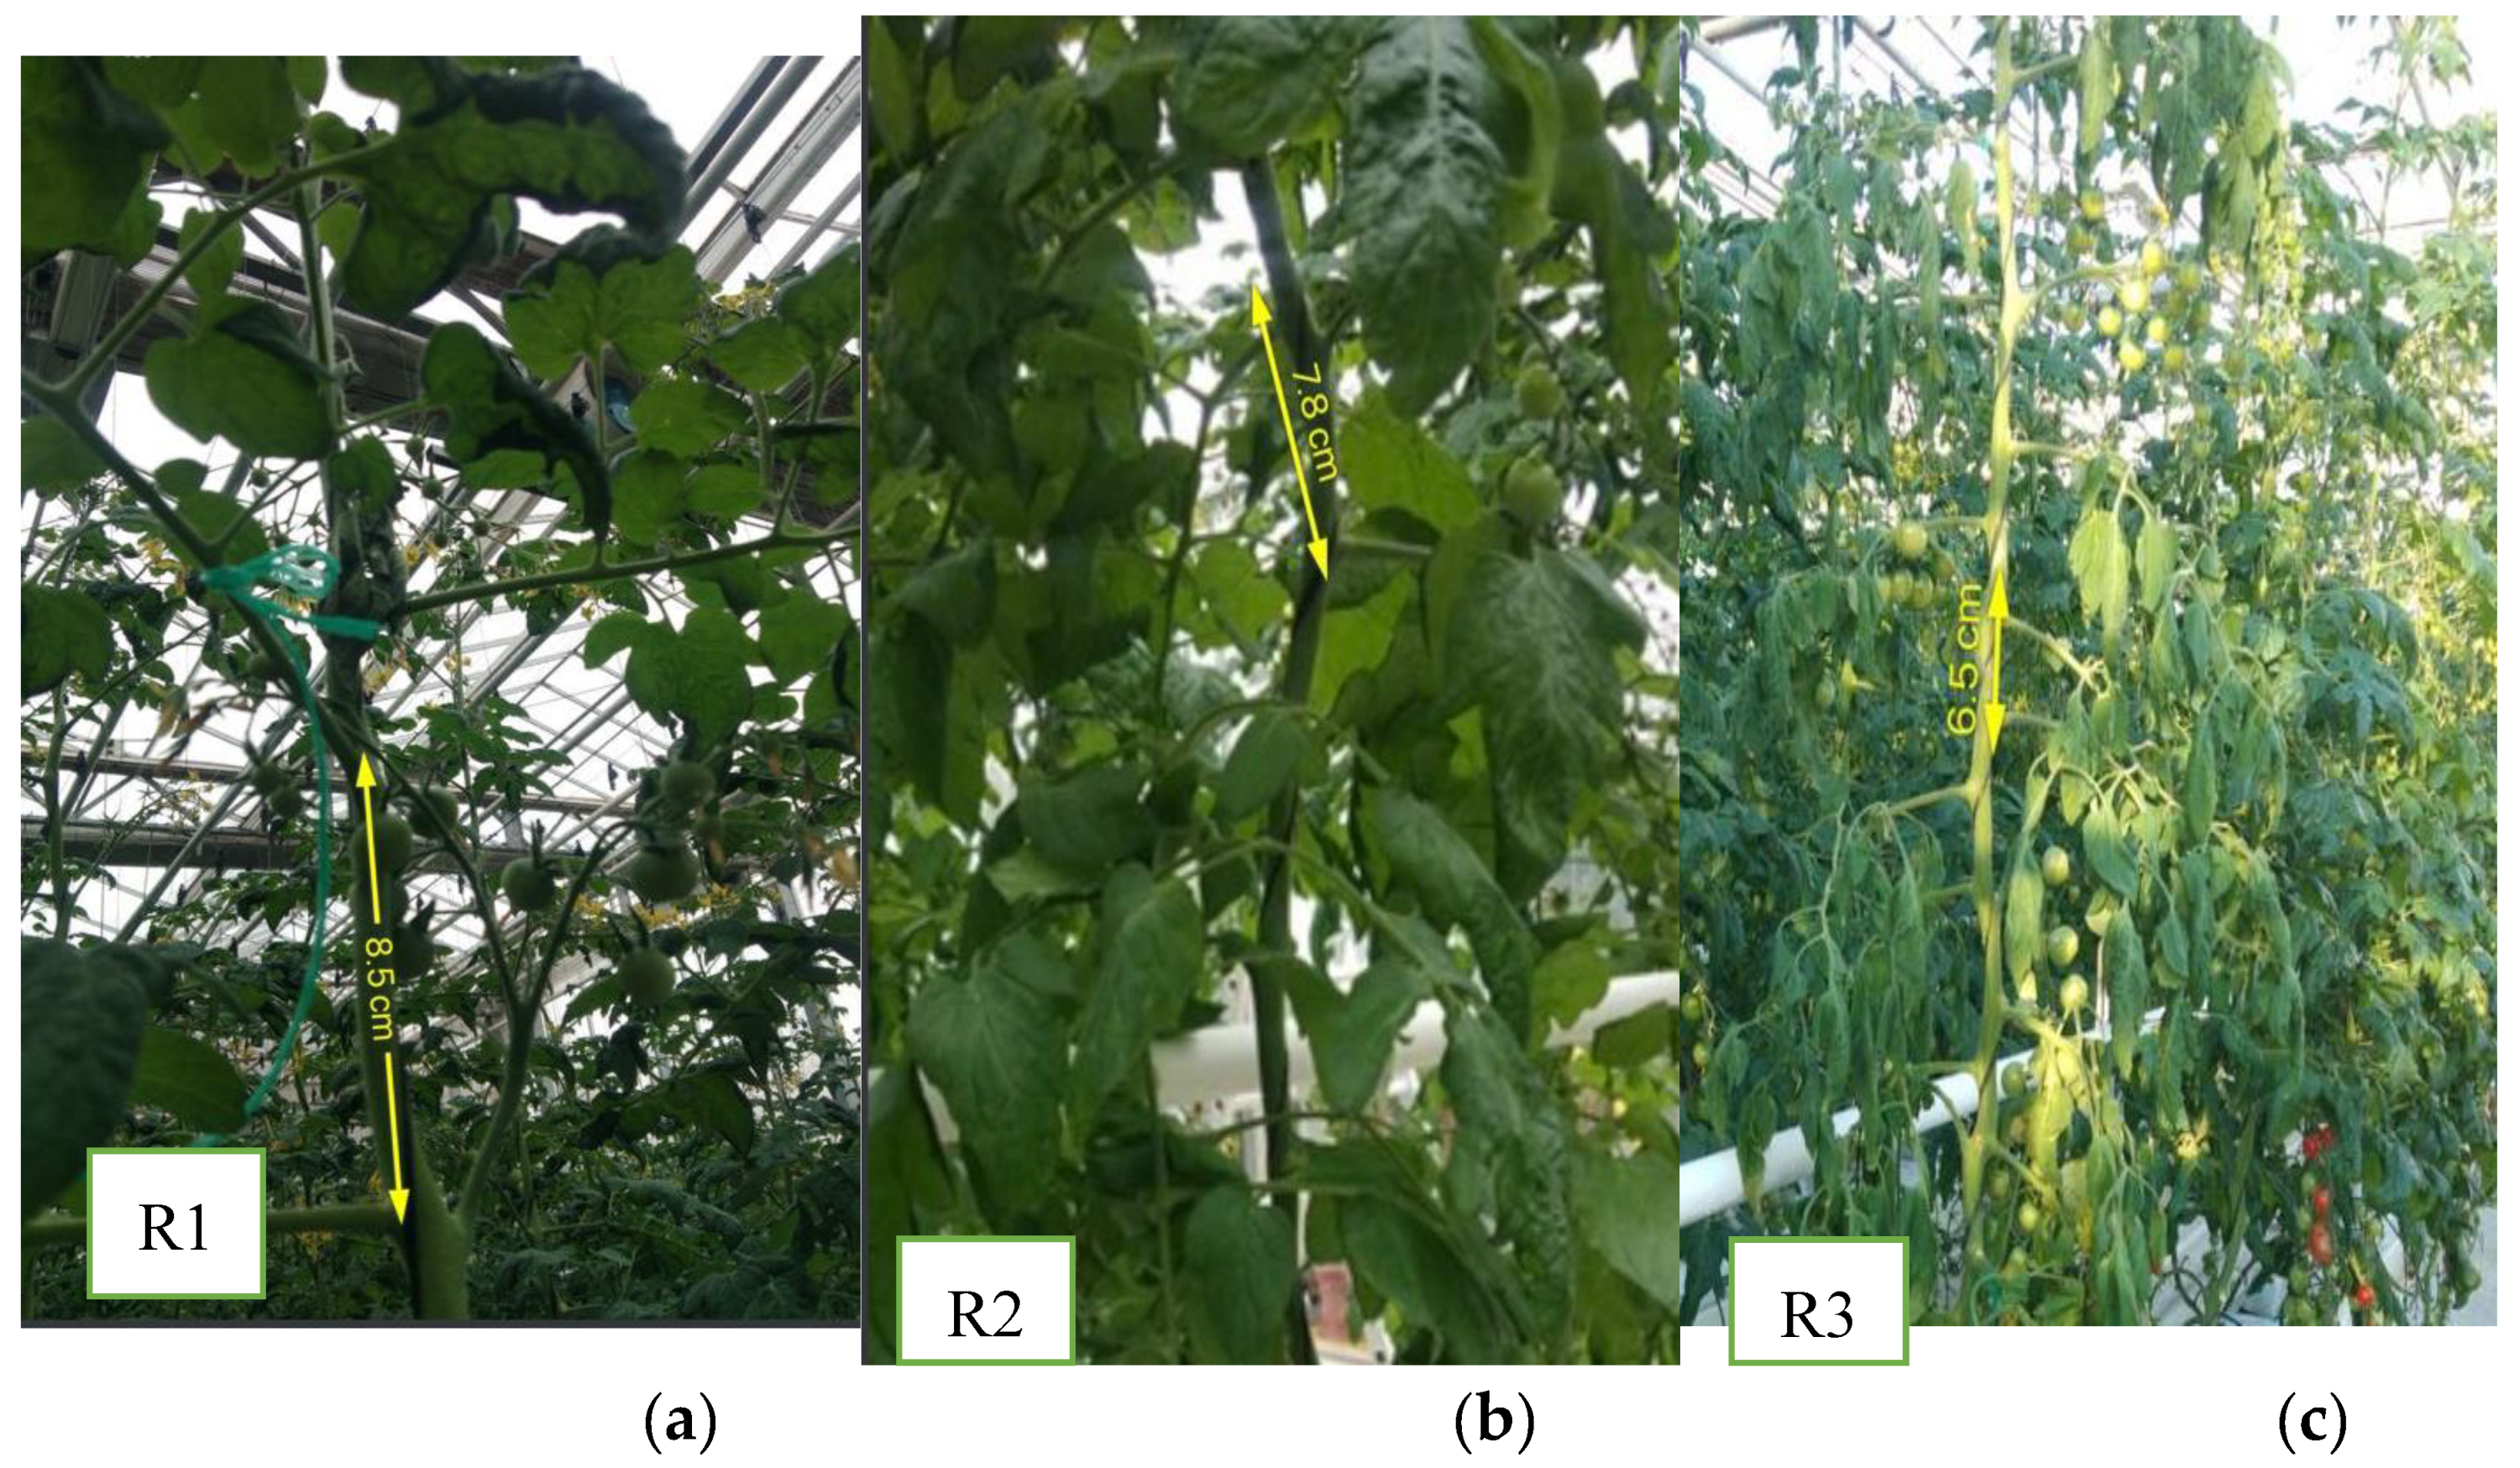
The average distance between the two leaves was low in the case of Row 3 plants (6.5 cm) as compared to Row 1 and Row 2 (8.5 cm and 7.8 cm, respectively). The interstitial spacing between the two nascent upper leaves was greater as compared to the middle-young and older leaves close to the root. (Figure 5).
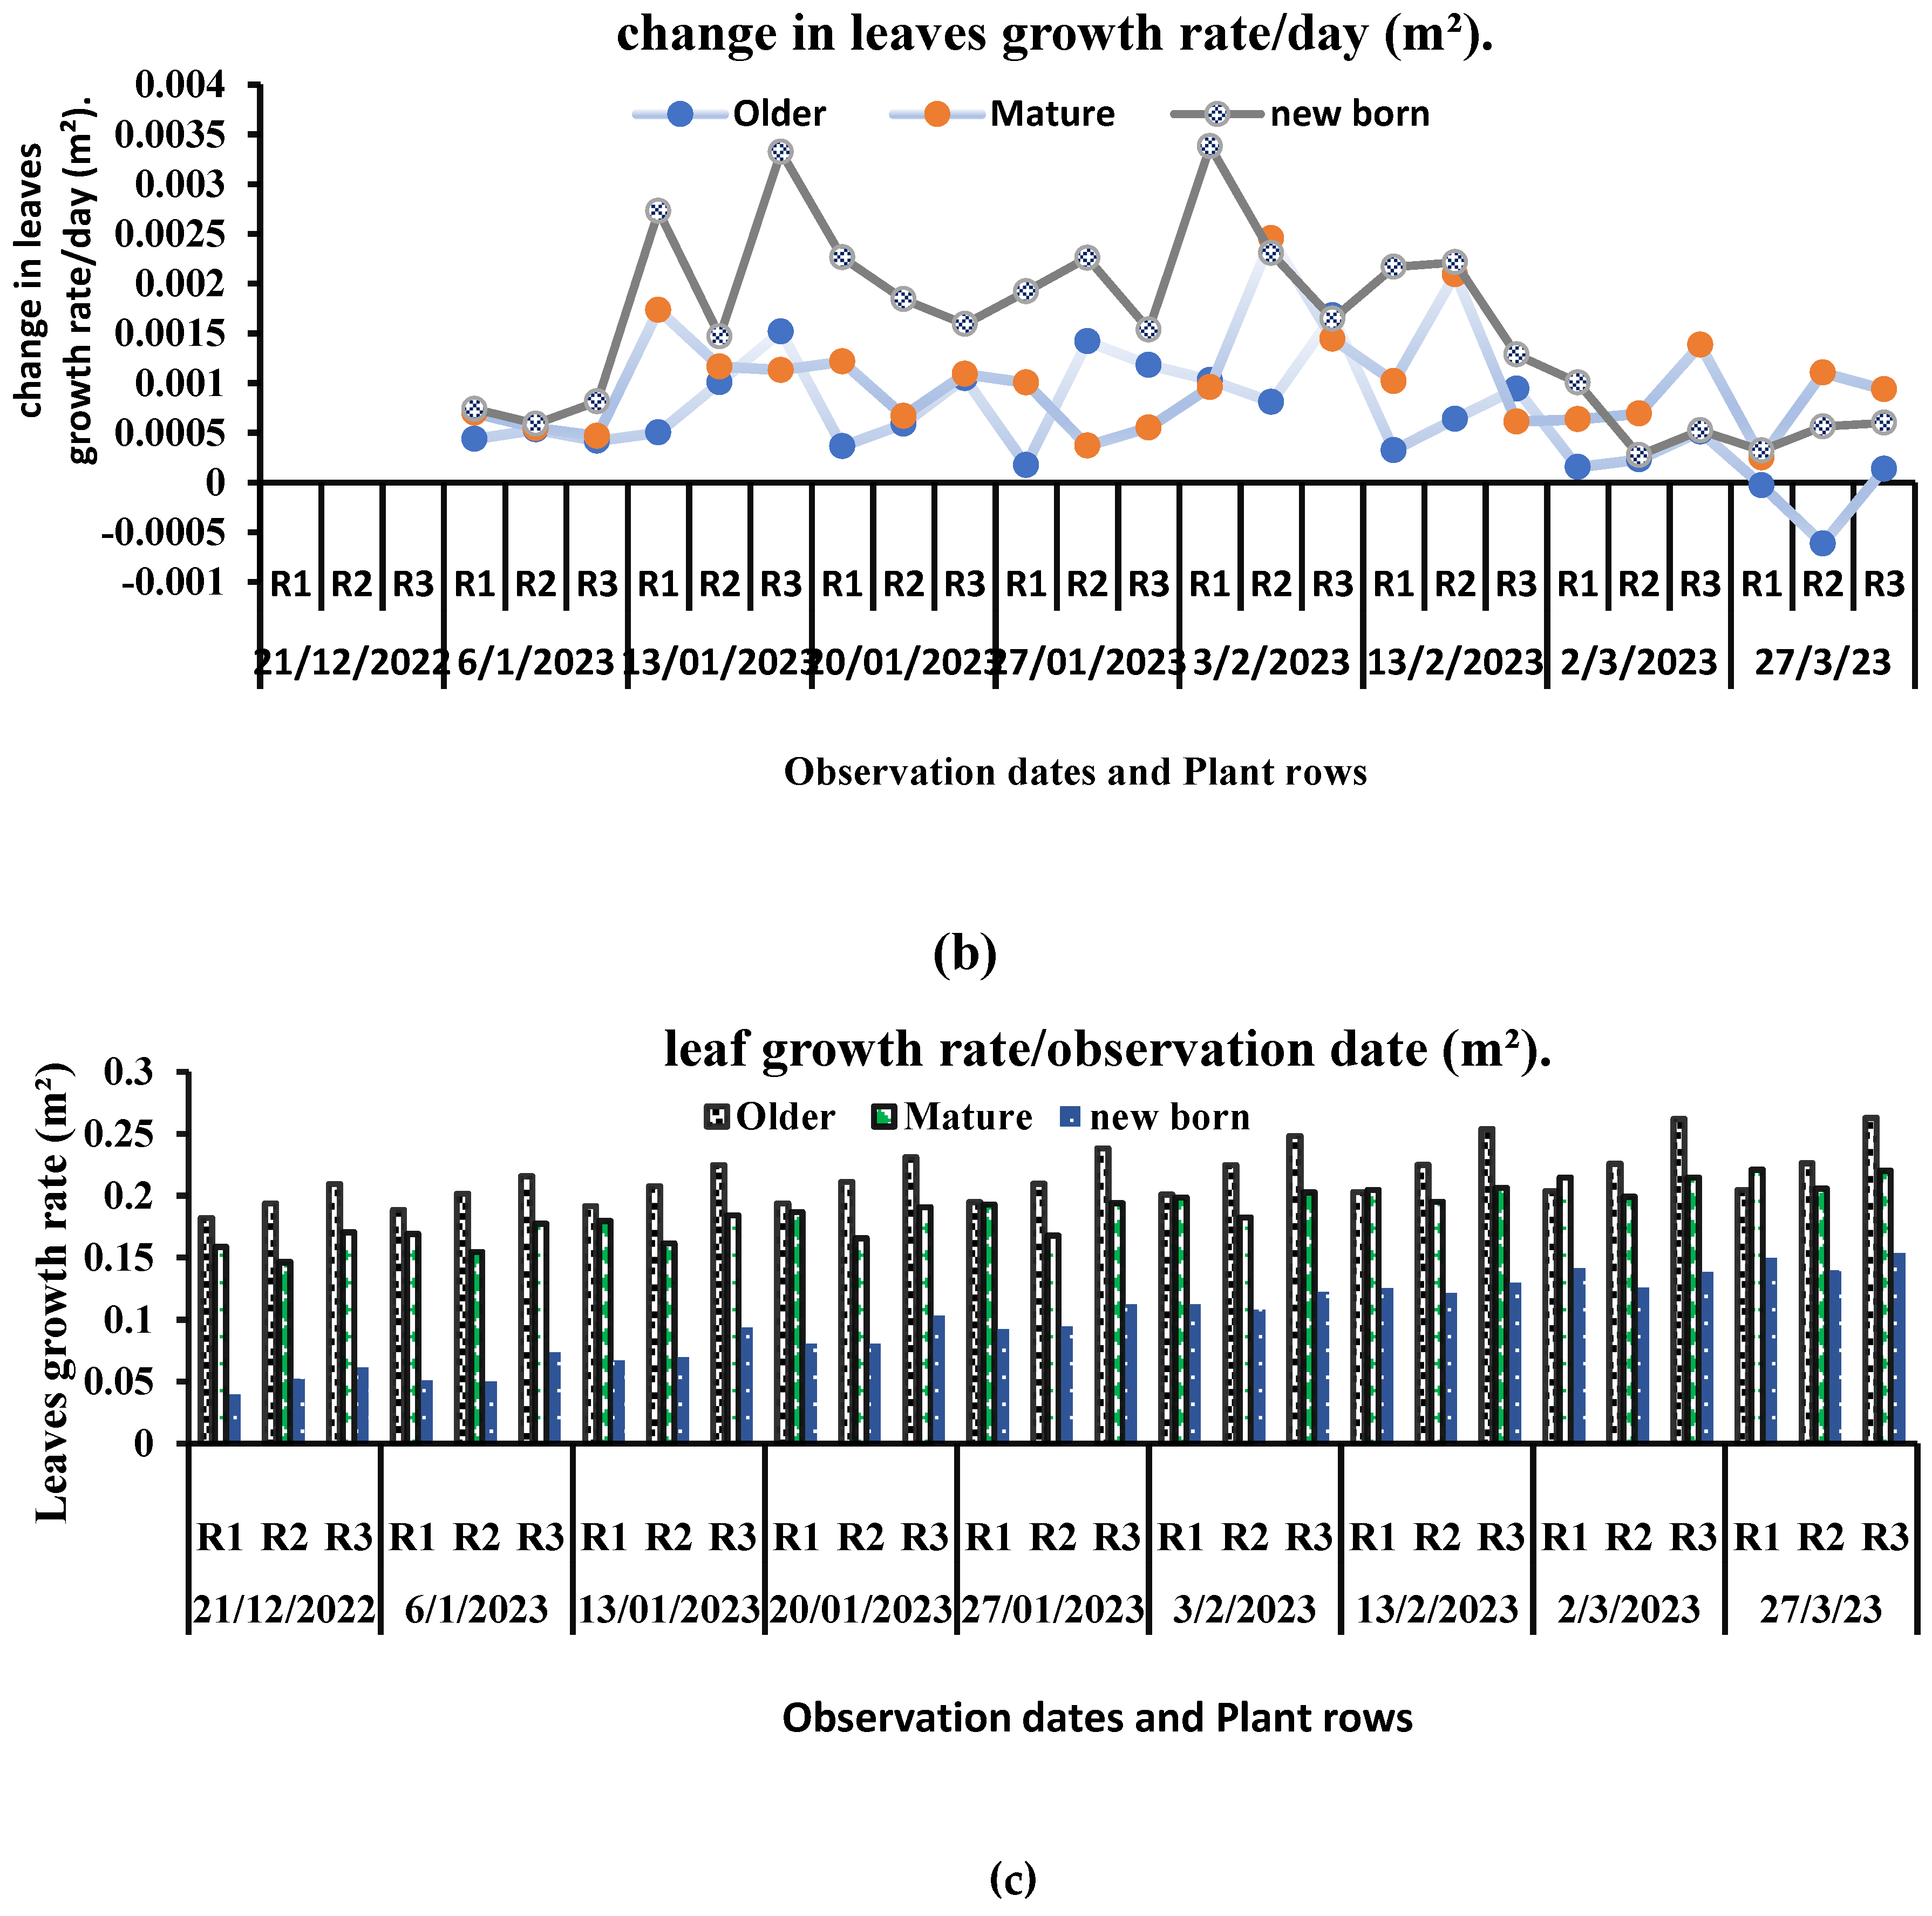
A non-significant (P = 0.626) interaction between the growth rate of mature-older leaves in each row and observation dates was found. While a significant change in the growth rate of middle-young and upper nascent leaves was found (P<0.009, P<0.012, respectively), it was observed that older leaves, which have attained the length of 40 cm, show a slow growth rate as compared to newly emerged upper leaves (10–15 cm) and leaves at intermediate growth stages (15–30 cm). The observed growth rates of the older mature leaf, middle young leaf, and newly emerged upper leaf were recorded as follows: mature leaf: 0.003988 m2/day; middle leaf: 0.008733 m2/day; top newborn leaf: 0.010722 m2/day (Figure 6). An inconsistent change in leaf growth rate on each observation date was observed. Different leaf morphological responses have also been observed throughout the study. Leaves exhibited wilting due to reduced temperatures and diminished light intensity in the months of January and February. Leaves exposed to low temperatures displayed signs of wrinkling and damage to their cuticles. All the plants showed indistinctive stem diameter growth (Table 1). A significant change was observed in the stem diameter of plants at their top, middle, and base sections across various observation dates, with corresponding p-values of P<0.012, P=0.028, and P<0.001, respectively. The measured stem diameter on the top was in the range of 9.32mm to 13.43 mm, while in the middle part and close to the base, it was in the range of 10.48mm to 16.62mm and 5.52 mm to 10.39 mm, respectively.

2.2. Plants Productivity Parameters.

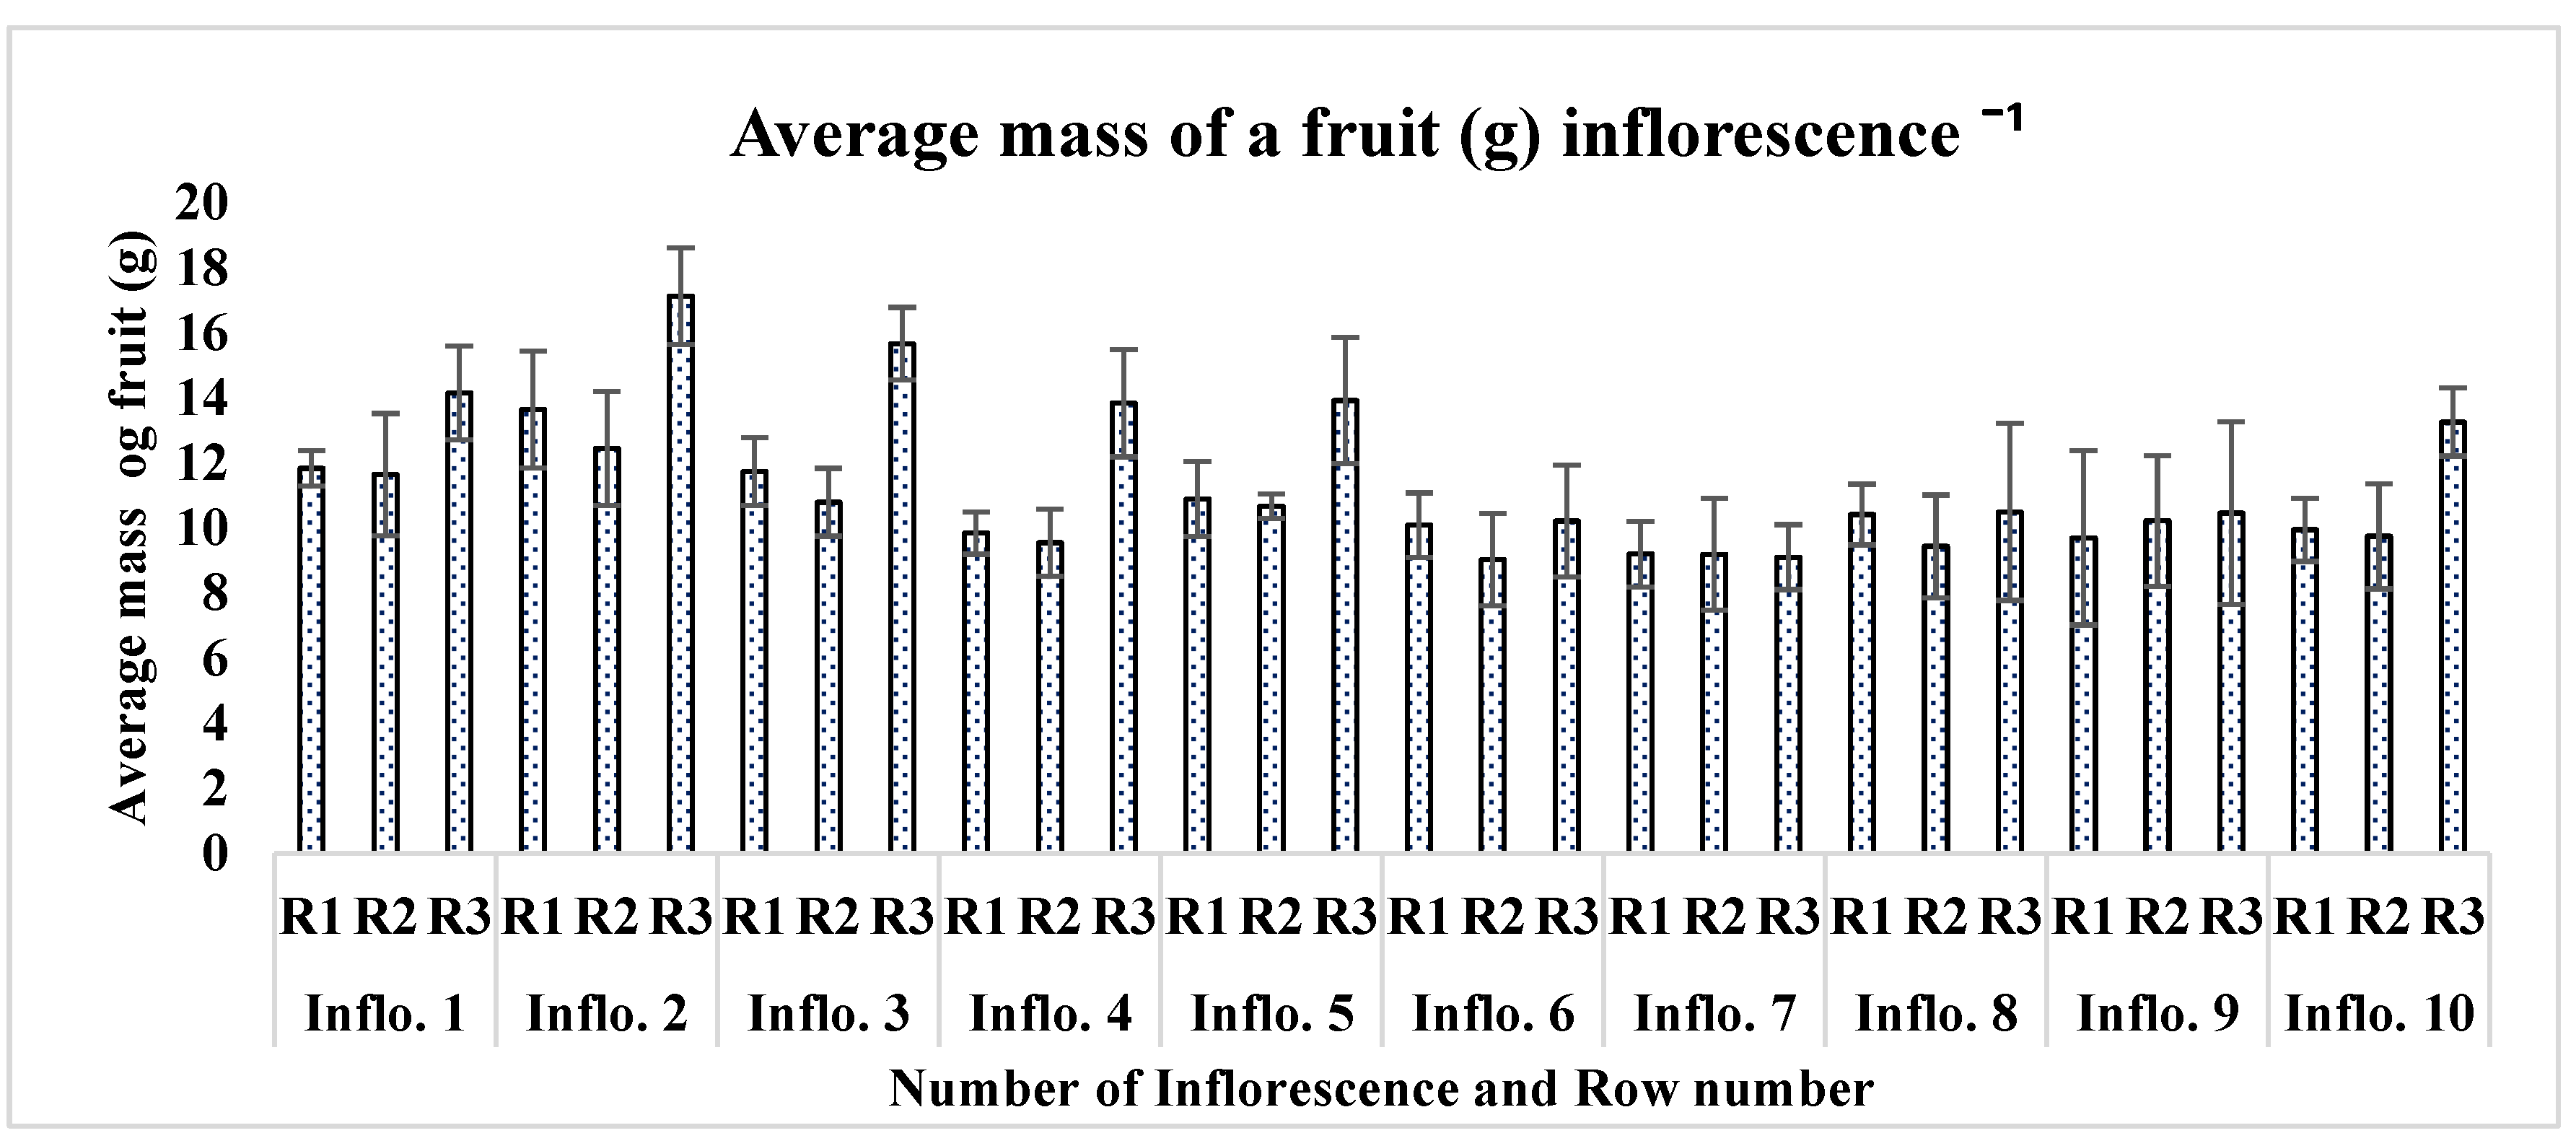
In the present study, tomato plants showed a distinctive productivity behavior in response to greenhouse conditions (Table 2). The difference among the plants on number of inflorescences, length of inflorescence, number of fruits per inflorescence, average fruit mass per inflorescence, fruit dry matter per inflorescence, fruit height per inflorescence and fruit diameter per inflorescence. was highly significant. A direct influence of greenhouse conditions on inflorescence length, number of fruits, and total mass per inflorescence was observed. High temperature fluctuations during the fruiting setting stages have greatly influenced the yield potential of each inflorescence. Inflorescence, which received an exceedingly optimum temperature, appeared to have maximum yield potential. A non-significant difference was observed between total fruit mass per inflorescence and average fruit mass per inflorescence (Table 2). In terms of productivity parameters, there was also a great difference between and among the plants in each row (Figure 7). The experimental results showed a non-significant difference among the plants in each row in terms of the total number of inflorescences per plant.
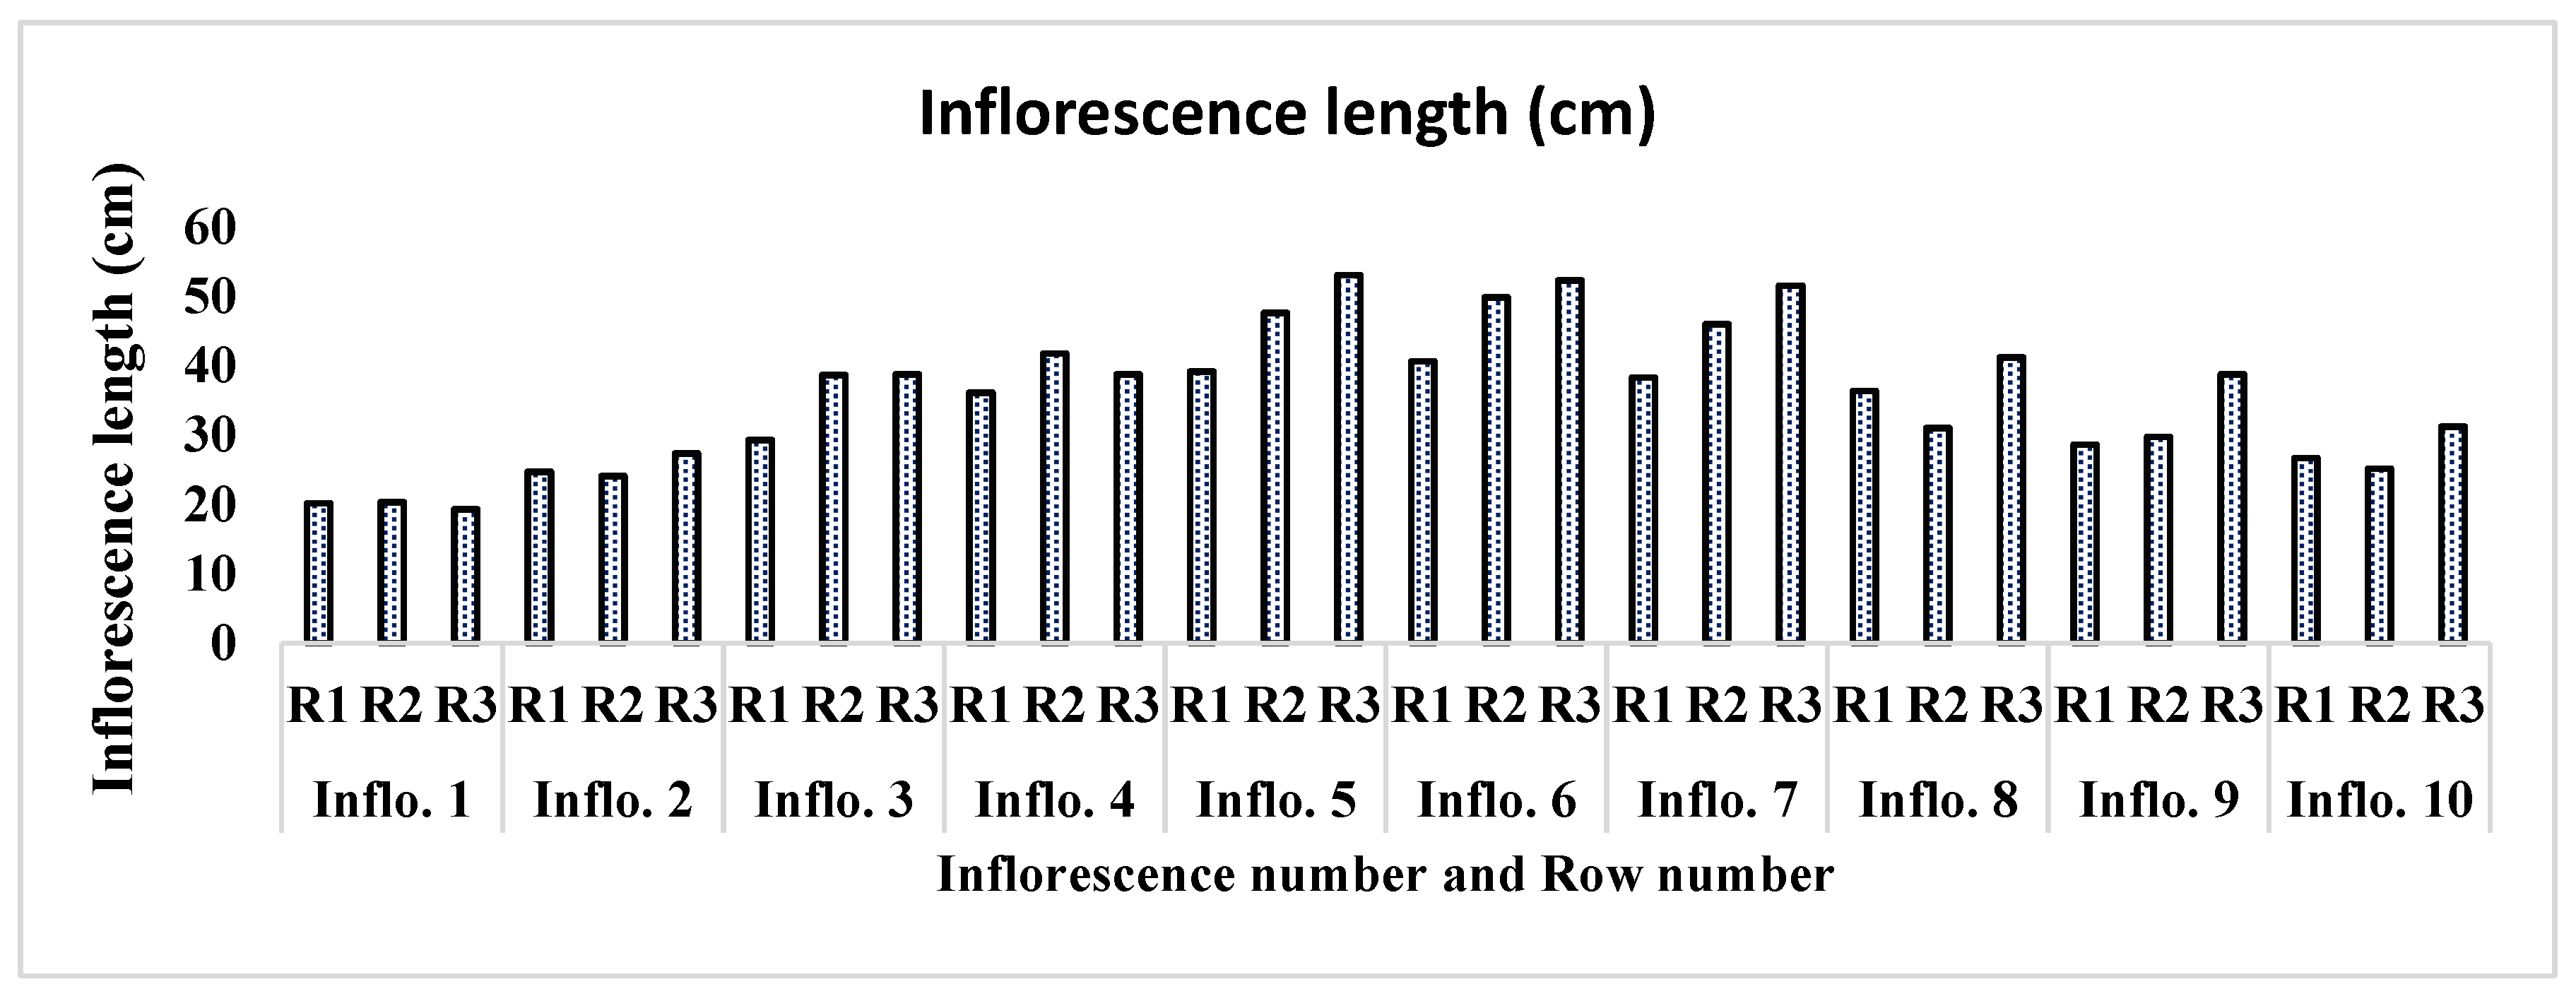
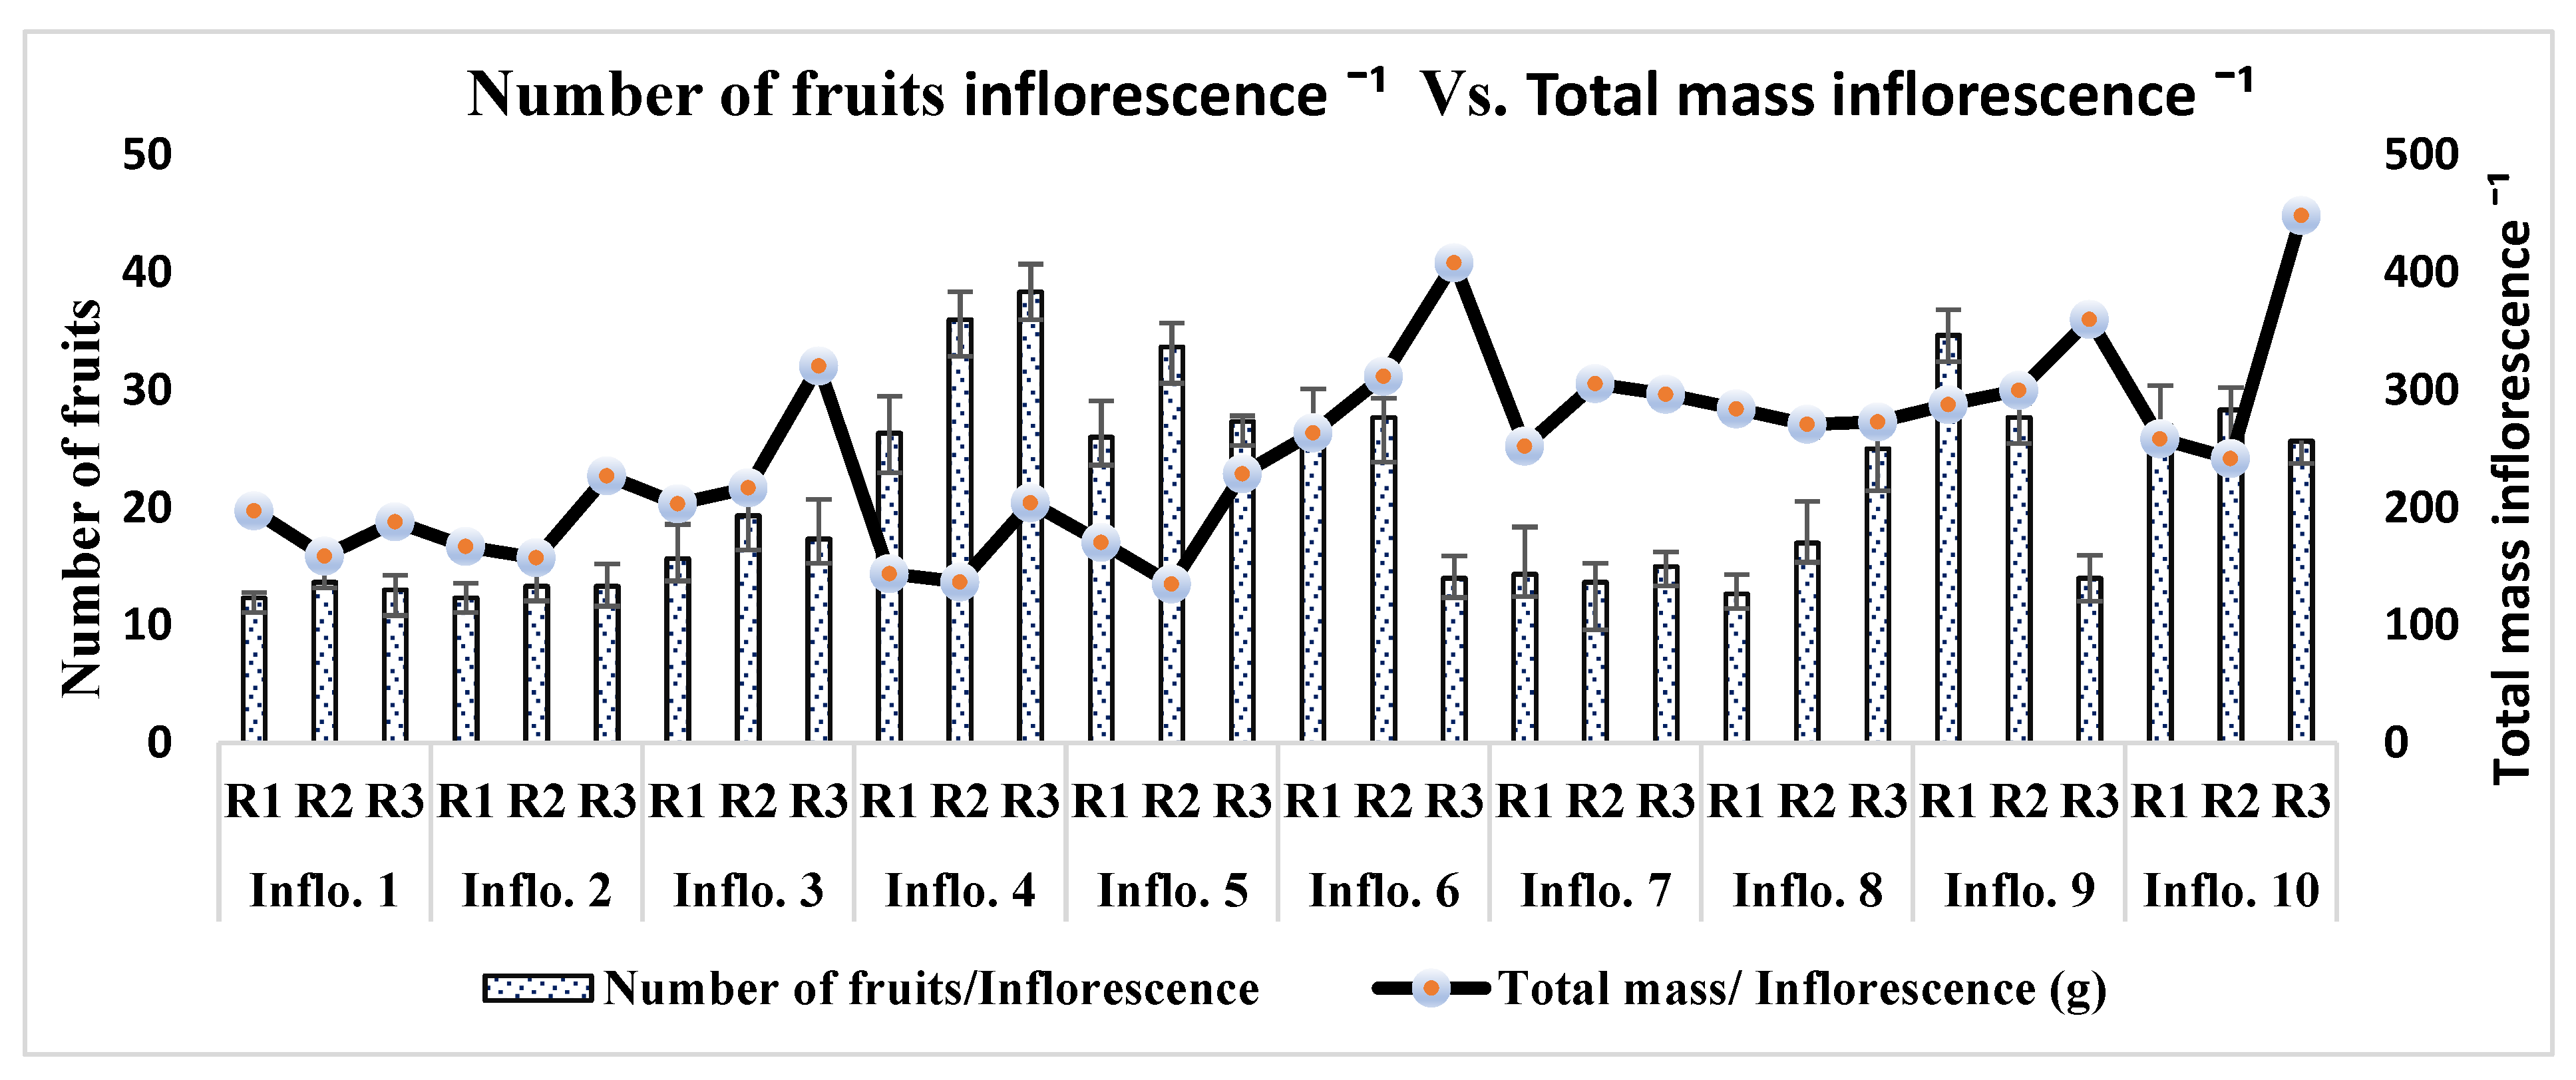
On average, each plant produced one inflorescence in a week. Each plant produced 20 to 22 total inflorescences during its 4-month lifespan. A direct relationship was found between the height of the plant and the total number of inflorescences. The plants with maximum height appeared to have a greater number of inflorescences as compared to other low-height plants. The inflorescence length significantly varied (P<0.001) as the order of inflorescence changed on each plant. Inflorescence number 6 appeared with a maximum average length of 47.54 cm, followed by inflorescence numbers 5 and 7 (46.54 cm, 45.23 cm, respectively). Inflorescence numbers 1 and 2 showed minimum growth, with an average of 19.89 cm and 25.35 cm in all three rows on the last observation day (Figure 8). The number of fruits also significantly differed from inflorescence to inflorescence (P<0.001). Inflorescence number 4 produced the maximum number of fruits, followed by inflorescence numbers 5 and 9, respectively, of all plants ‘rows (Table 2). The lowest number of fruits produced was inflorescence number 2, followed by inflorescence numbers 1 and 7, respectively. The total fruit mass was not significantly different among the inflorescences of each plant's rows (P = 0.296). Inflorescence number 10 had the largest total fruit mass (243 g), followed by inflorescence numbers 6 and 3 (240.27 g and 235.41 g, respectively). Interestingly, the inflorescence with the highest number of fruits (number 4) did not appear with the highest total fruit mass (g); the possible reason behind this was the mass of individual fruit on each truss (Figure 9).
Inflorescence number 2 appeared with the highest average fruit mass (14.40 g), followed by Inflorescence number 1 and Inflorescence number 3 (12.54g, 12.86g). In the present findings, a direct relationship was observed between the fruit attachment order on each truss and fruit mass. On most of the trusses, the first five fruits were large and high in mass and diameter. Fruits in the middle of each inflorescence were mostly medium-sized and had a low diameter and mass.
The fruits of each inflorescence were not significantly different from each other in view of their diameter (P = 0.322). Inflorescence number 2 appeared with the highest fruit diameter (30.23 mm), followed by Inflorescence number 1 and Inflorescence number 3 (28.37 mm and 28.87 mm, respectively). The increase in the size of fruits in terms of their length and size can be attributed to the cooperative influence of phosphorus, potassium, and water. These elements aid in the production of auxins, which play a pivotal role in elongating cells by enhancing their ability to absorb water and osmotic solutes.

2.3. Nutritional Composition of Tomato Fruit.

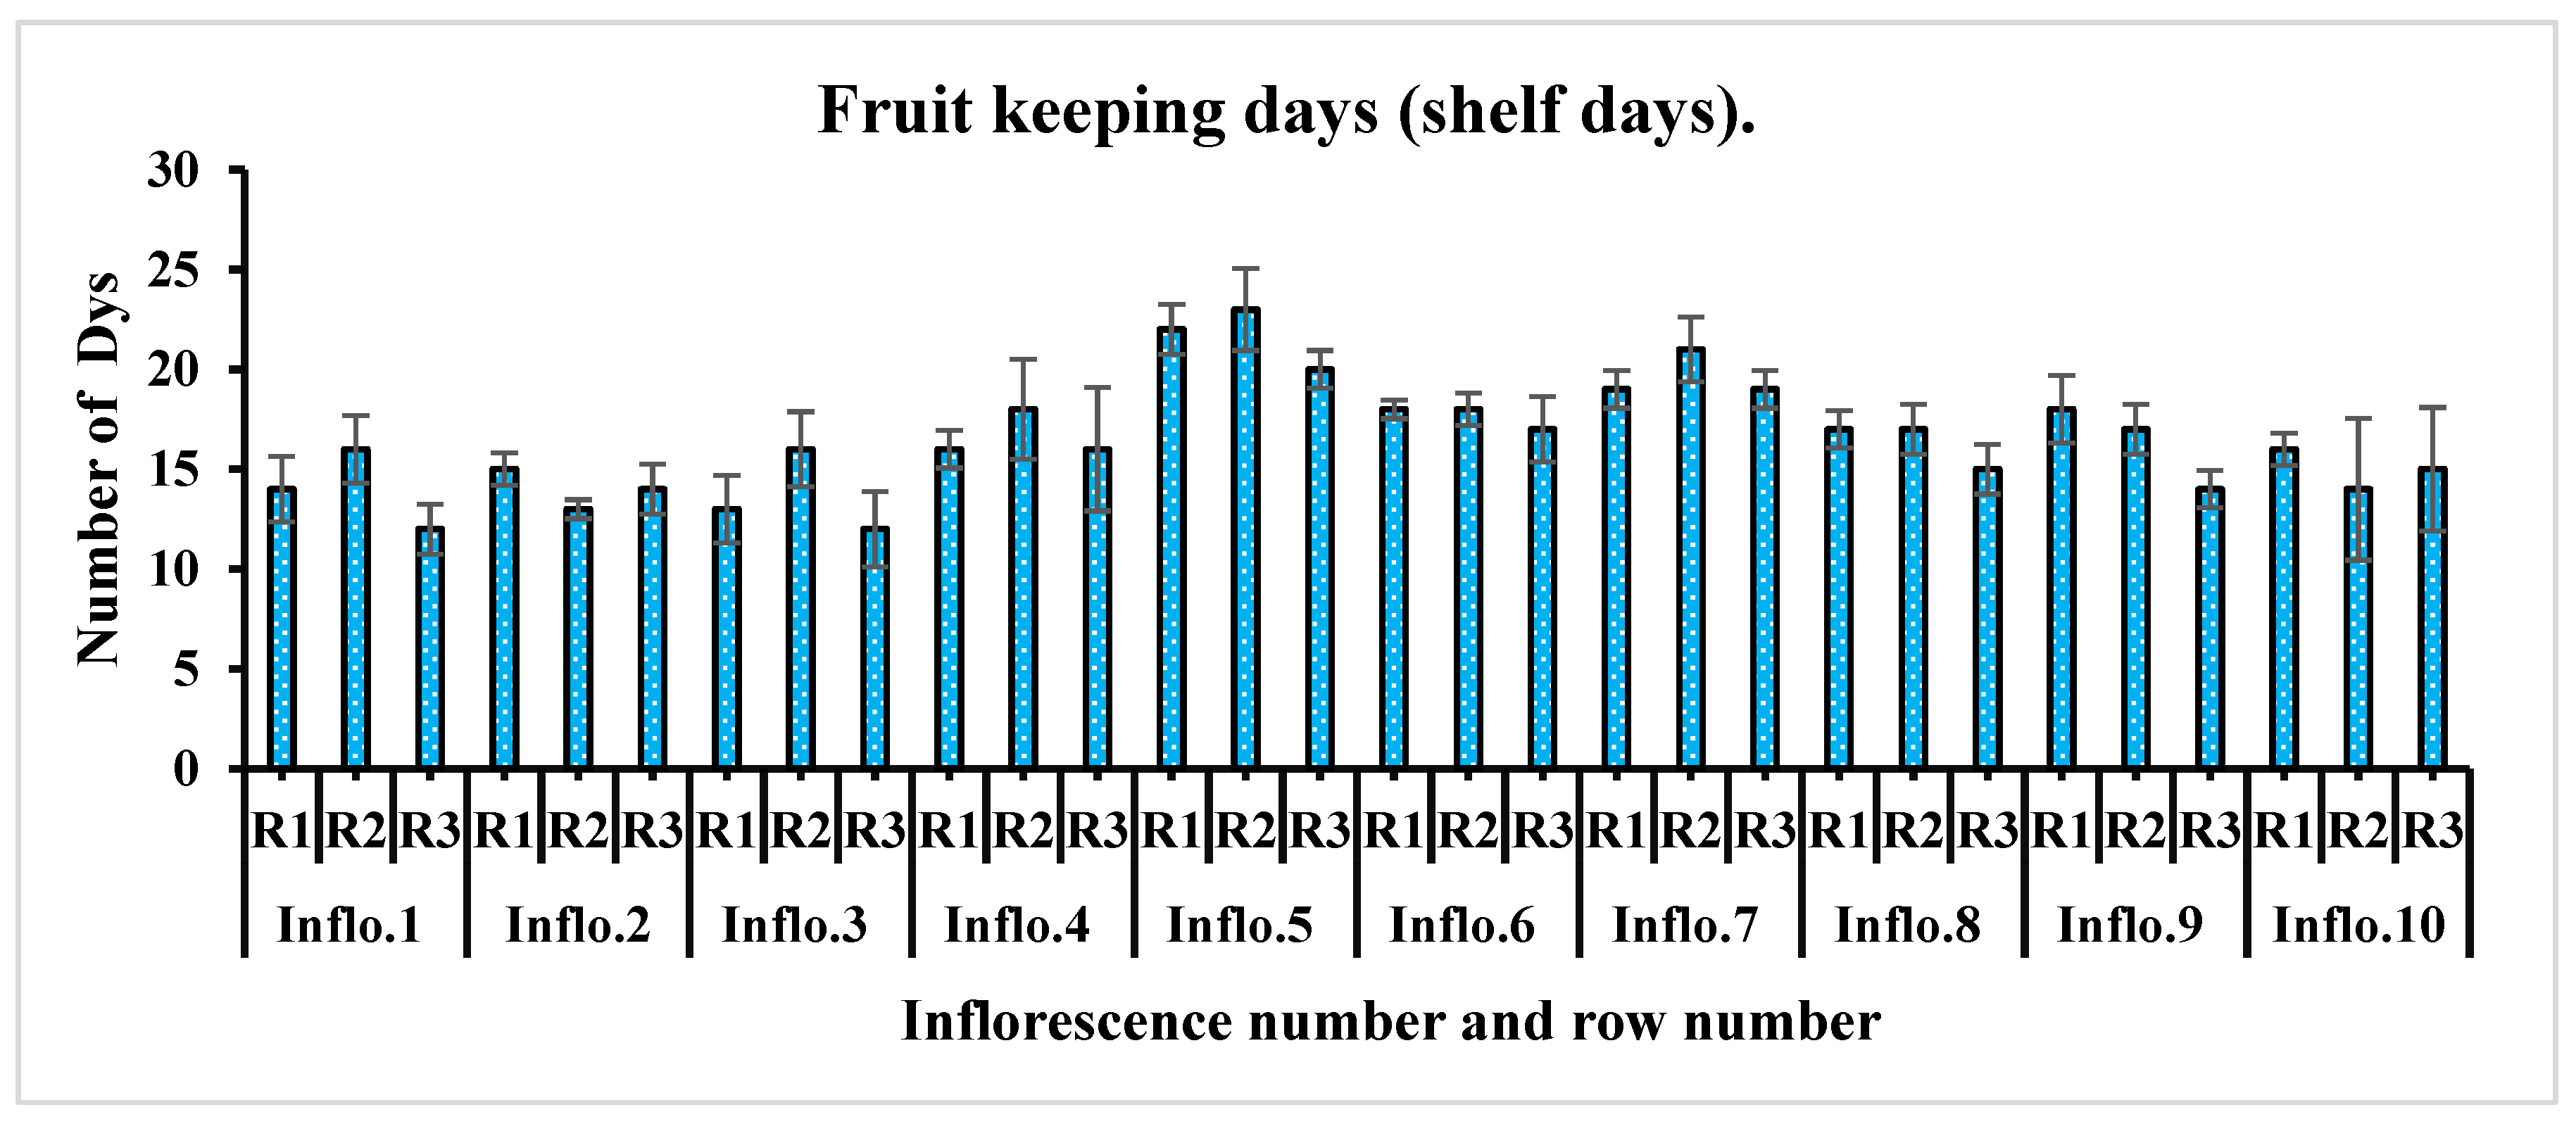
One of the key measures of tomato fruit quality and its suitability for various applications is referred to as dry matter content. The dry matter content of tomato fruit is a crucial quality trait with significant implications for its market value. This attribute primarily refers to the proportion of solid material in the fruit, excluding water content. Present findings found a significant difference in dry matter contents for each inflorescence (Table 3). An inverse relationship has also been investigated between average fruit mass and fruit dry matter (%). Inflorescences with the highest average fruit mass, Inflorescence number 2, followed by 1 and 3, were low in dry matter content (3.16-3.69%). The dry matter contents were high in the case of inflorescence number 5 (13.89%), followed by inflorescence numbers 7 and 6 (11.83% and 11.49%, respectively). In view of shelf days, a non-significant relationship (p = 0.475) was found among the fruits of each inflorescence (Table 3). The 5th inflorescence's fruits (22 days), followed by the 7th and 6th (20 days and 18 days, respectively), survived the maximum number of days at room temperature (Figure 10). In the present study, we found a direct relationship between fruit dry matter contents and the number of fruit-keeping days. Inflorescent fruits with high dry matter content survived a higher number of days in their intact form at room temperature. Fruits containing a significant amount of dry matter exhibit favorable attributes, including enhanced flavor, increased efficiency in processing, improved resilience during transportation, and extended shelf life in storage. In the present study, we found a high brix (%) in inflorescence number 8 (8.85%), followed by inflorescence numbers 7 and 5 (8.22%, 8.10%), respectively. Most of the solid substances in tomato fruits consist of carbohydrates, with the primary ones being sugars that can dissolve in water. Our result on the dry matter contents found a direct relationship between carbohydrate contents and dry matter contents. The contents of various sugars found in cultivated tomatoes are mainly influenced by both genetic traits and the environmental factors under which they are grown. The titratable acidity in the fruits of cultivated cherry tomatoes varies significantly from inflorescence to inflorescence (P = 0.008). The titratable acidity contents were high in inflorescence number 3 fruits (15.81%), followed by inflorescence numbers 6 and 5 fruits (15.64% and 15.63%, respectively).
A low titratable acidity value was observed in inflorescence number 1 (12.76%), followed by inflorescence numbers 10 and 7 (13.21% and 13.73%), respectively. One important measure of tomato quality is firmness, which has a considerable impact. The tomato fruit's maturity process has a direct impact on the content and hardness of its cell wall polysaccharides. The fruit firmness of each inflorescence's fruits was also significantly different in comparison to each other. Inflorescence number 9 fruits appeared with high fruit firmness (7.57 kg/cm), followed by inflorescence numbers 7 and 6 (7.21 kg/cm and 7.15 kg/cm, respectively). Inflorescence number 4 appeared with the lowest fruit firmness (5.40 kg/cm). In view of their importance as a pollutant and a key biochemical element for human health and the environment, nitrate and nitrites are highly investigated food chemical components. Given their significance as environmental pollutants and essential biochemical elements for both human health and the ecosystem, nitrate and nitrite have been the subject of extensive scientific research in the field of food chemistry. The nitrate concentration in cherry tomatoes is a reliable source for finding the nutritional profile. In the present study, inflorescence number 6 fruits were found to be enriched with nitrate contents (8.85 mg/kg), followed by inflorescence numbers 5 and 3 (8.07 mg/kg and 8.03). Fruit nitrate contents were not significantly different among the inflorescences (P = 0.228).

3. Discussion

There are numerous constraints associated with the growth of economically oriented plants in greenhouses. Each plant variety requires different greenhouse conditions at different developmental stages. The growth and development of different crops in greenhouses are directly influenced by the duration of the growing season and the range of environmental conditions. Short-term light exposure in winter affects the growth and biochemical parameters of plants [32,33]. The duration of the winter season, the availability of enough quantities of light, CO2, and temperature directly affect the growth and development of different crops in greenhouses." In our accidental observation, we observed that plants exhibited varied responses in terms of growth and yield parameters based on their different growing positions and postures in greenhouse. The present study evaluated that the time a plant remained exposed to sunlight mainly influenced the growth rate of tomato plants in greenhouses. Greenhouse growers commonly employ photoperiods ranging from 14 to 17 hours for various vegetables. According to a study, differences in plant height and other growth parameters are the result of an unequal distribution of temperature and light [34]. Each plant has an optimum range of day length, light intensity, and light wavelength at which they show maximum growth rate. Beyond this optimal range, the rate of photosynthesis may plateau or decline because the plant cannot effectively utilize the additional light. [35]. Extended day length and low light intensity can positively affect the growth rate of tomato plants in glasshouses. [36]. In the current study, we observe similar pattern, tomato plant growth rate was much higher at the start of February and March (4.72 and 4.60(cm/day, respectively) when the day length was about 10 h and 11hrespectively, and light intensity was 296.38 (W/m²) and 258.13 (W/m²) respectively. The temperature inside the greenhouse was 21.32 ºC and 25.07 ºC, respectively. These findings are in line with earlier research by Suyanto [37], which showed that tomato plants grow more quickly (1.11 cm/day) under 680 nm light than they do under lower wavelength light (480, 550, and 650 nm) at the germination stage. A study reported that the height of tomato plants appears significantly higher under 14-hour photoperiod treatment during the months of the spring season [38]. A source declared that a temperature range of 18.1 to 32.2°C is the optimum air temperature value for the growth of tomatoes in a growing season [39]. In the winter season, short-term light exposure has an impact on a plant's metabolic processes and growth. A study correlated plant height with high productivity and better biomass calculations [40]. According to a research report, the temperature inside a greenhouse without an environment controller exceeds 20–30 °C as compared to the outside temperature [41]. Similar results have been found in our research-based investigation. The same source reported that temperatures above 26°C may reduce plant growth and suggested that temperatures inside greenhouses should not exceed 30-35°C. The recorded average temperature during the winter season was in the range of 23.85°C to 32.37°C. Consistent with the present results, a study reported plant heights of 198.33 cm and 172.33 cm, respectively, in two cherry tomatoes [42]. We found the increase in the total number of leaves remained constant until the last day of observation. A research report addressed an average increase of 3 to 5 leaves per week while evaluating the relation between leaf area and tomato plant vegetative growth [43]. Three to four leaves were found between two consecutive inflorescences. Carbon dioxide and light are key reactants in the process of photosynthesis; they play a crucial role in the growth process. An increased amount of CO2 significantly influenced the height and number of leaves in tomato plants [18]. The number of leaves a plant has determines how effectively it can use sunlight for photosynthesis, which helps the plant increase its productivity and grow efficiently [44]. Discussing the growth rate of juvenile and adults’ leaves [45], we declared the difference in rate of photosynthesis as the driving force that caused the variation in growth rate. The source mentioned a high photosynthesis rate in adult leaves as compared to old leaves. According to a study, the photosynthesis rate is modest in very young leaves; it increases to its maximum as leaves grow to full size and drops as leaves get older [46]. Most plants also stop sending nutrients and water to the bottom leaves as new leaves emerge on top. Different biochemical processes that are mainly responsible for the vegetative growth of plants are dependent on the available concentration of CO2, the intensity of light, and the amount of heat energy. The change in greenhouse conditions directly influences the morphological appearance of plants. In the present study, an inconsistent change in leaf growth rate on each observation date was observed.
Greenhouse technology is now in high demand to meet the demand for food around the world. In the present study, tomato varieties showed distinctive productivity behavior in response to greenhouse conditions. It has been reported that elevated concentrations of CO2 combined with high temperature treatment significantly affect the fruit quality, number of fruits and flowers, size and weight of fruits, and yield of fruits of tomato plants [47]. In our current investigation, we found a direct relationship between the height of the plant and the total number of inflorescences. The plants with maximum height appeared to have a greater number of inflorescences as compared to other low-height plants. Similar to the present findings, [19] reported the rate of truss initiation at approximately one truss per week at an average daytime temperature of 20 ºC. According to [20], it is the high temperatures that lead to the early initiation of truss along with an increase in fruit volume and size. Temperature also directly influences the number of inflorescences. In the context of the transpiration process, the availability of high-quality water assists in the transfer of essential nutrients from the base to the inflorescence, leaves, and other metabolically active regions. As a result, the reproductive parts develop more quickly and subsequently get longer [48]. In view of temperature interaction with productivity, a study reported abnormal and aborted growth of truss with a reduced number of fruits under the temperature of 26 ºC compared to normal growth of truss with a higher number of normal fruits at 25 ºC [38]. According to a study's findings, daylight has a direct impact on the number of fruits and inflorescences produced; supplemental light during wintertime will result in higher fruit production [49]. Comparing the response of cherry tomatoes to two temperature treatments, low temperature (10 ºC) and control temperature (15 ºC), A study mentioned the low number of fruits produced under low temperatures as compared to the control high temperature [50]. The same researchers explained that low temperatures in a greenhouse can cause physiological changes, morphologically abnormal fruits, and flower drops. The number of fruits produced on tomato plants was also influenced by the length of time a plant remained exposed to daylight. A study reported a significant increase in the number of total fruits in plants continuously exposed to light for 5 weeks [51]. The increase in the size of fruits in terms of their length and size can be attributed to the cooperative influence of the phosphorus and potassium uptake processes. These elements aid in the production of auxins, which play a pivotal role in elongating cells by enhancing their ability to absorb water and osmotic solutes. [52].
Different biochemical processes that are mainly responsible for the vegetative growth of plants are dependent on the available concentration of CO2, the intensity of light, and the amount of heat energy. Different research studies related the quality of vegetables to the interactions of certain greenhouse conditions, such as increased CO2 with light, stress, nutrient concentration, salinity, plant species, cultivars, and growth stages [15,25,26,27,28,29,30,31,32,33,34,35,36,37,38,39,40,41,42,43,44,45,46,47,48,49,50,51,52,53]. They assessed the response of different vegetables to elevated levels of CO2, and it was observed that the chemical components, such as flavonoids, fructose, glucose, phenols, and soluble sugar, increased due to high CO2 concentration. Elevated CO2 levels cause a decrease in tomato nutrient contents, i.e., nitrates, protein, magnesium, and iron. It has also been reported that increased atmospheric CO2 not only influences the nutritional value but also improves the yield of different vegetables. Previously a study also reported a negative relation between tomato yield and high temperature treatments [54]. Light is also a key determinant of plant development and growth, as it is directly linked to the absorption and assimilation of CO2, which is a driving force for the process of photosynthesis [55,56]. The dry matter content of tomato fruit is a crucial quality trait with significant implications for its market value. Higher temperatures can lead to increased transpiration and evaporation, causing plants to lose more water. This, in turn, can reduce the dry matter content of the plant since a larger proportion of its weight In contrast to this, in the present study, it was observed that inflorescence fruits developed under low greenhouse temperatures appeared to have low dry matter contents as compared to high-temperature inflorescence fruits. An inverse relationship has also been investigated between average fruit mass and fruit dry matter (%). Fruit dry matter contents also directly affect the number of fruit-keeping days. Inflorescent fruits with high dry matter content survived a higher number of days in their intact form at room temperature. One important measure of tomato quality is firmness, which has a considerable impact. Tomato fruit's cell wall polysaccharide composition and hardness are directly influenced by the fruit's maturity process. In view of their importance as a pollutant and a key biochemical element for human health and the environment, nitrate and nitrites are highly investigated food chemical components.

4. Materials and Methods

4.1. Experimental Site and Greenhouse Management.

The experimental studies were carried out to evaluate the response of cherry tomatoes (Cheramy F1) to greenhouse conditions from September 2022 to April 2023 inside the research Venlo Glass greenhouse (Dutch Standard greenhouses NEN 3859) at the University of Agronomic Sciences and Veterinary Medicine of Bucharest (44.4710° N, 26.0656° E). The greenhouse is a unit of the Research Center for Quality Control of Horticultural Products. The greenhouse framework was consisted of hot-dipped galvanized steel, aluminum system profiles for external cladding, and glass as the covering. The installed cultivating gutter height was 5.30 meters above the soil level. The growing compartment has an area of 160.00 m², while the greenhouse's total covered area is 2.752.00 m². The greenhouse was also equipped with all the advanced data recording devices, along with lighting, drip irrigation, and ventilation systems.

4.2. Biological Material and Procedure.

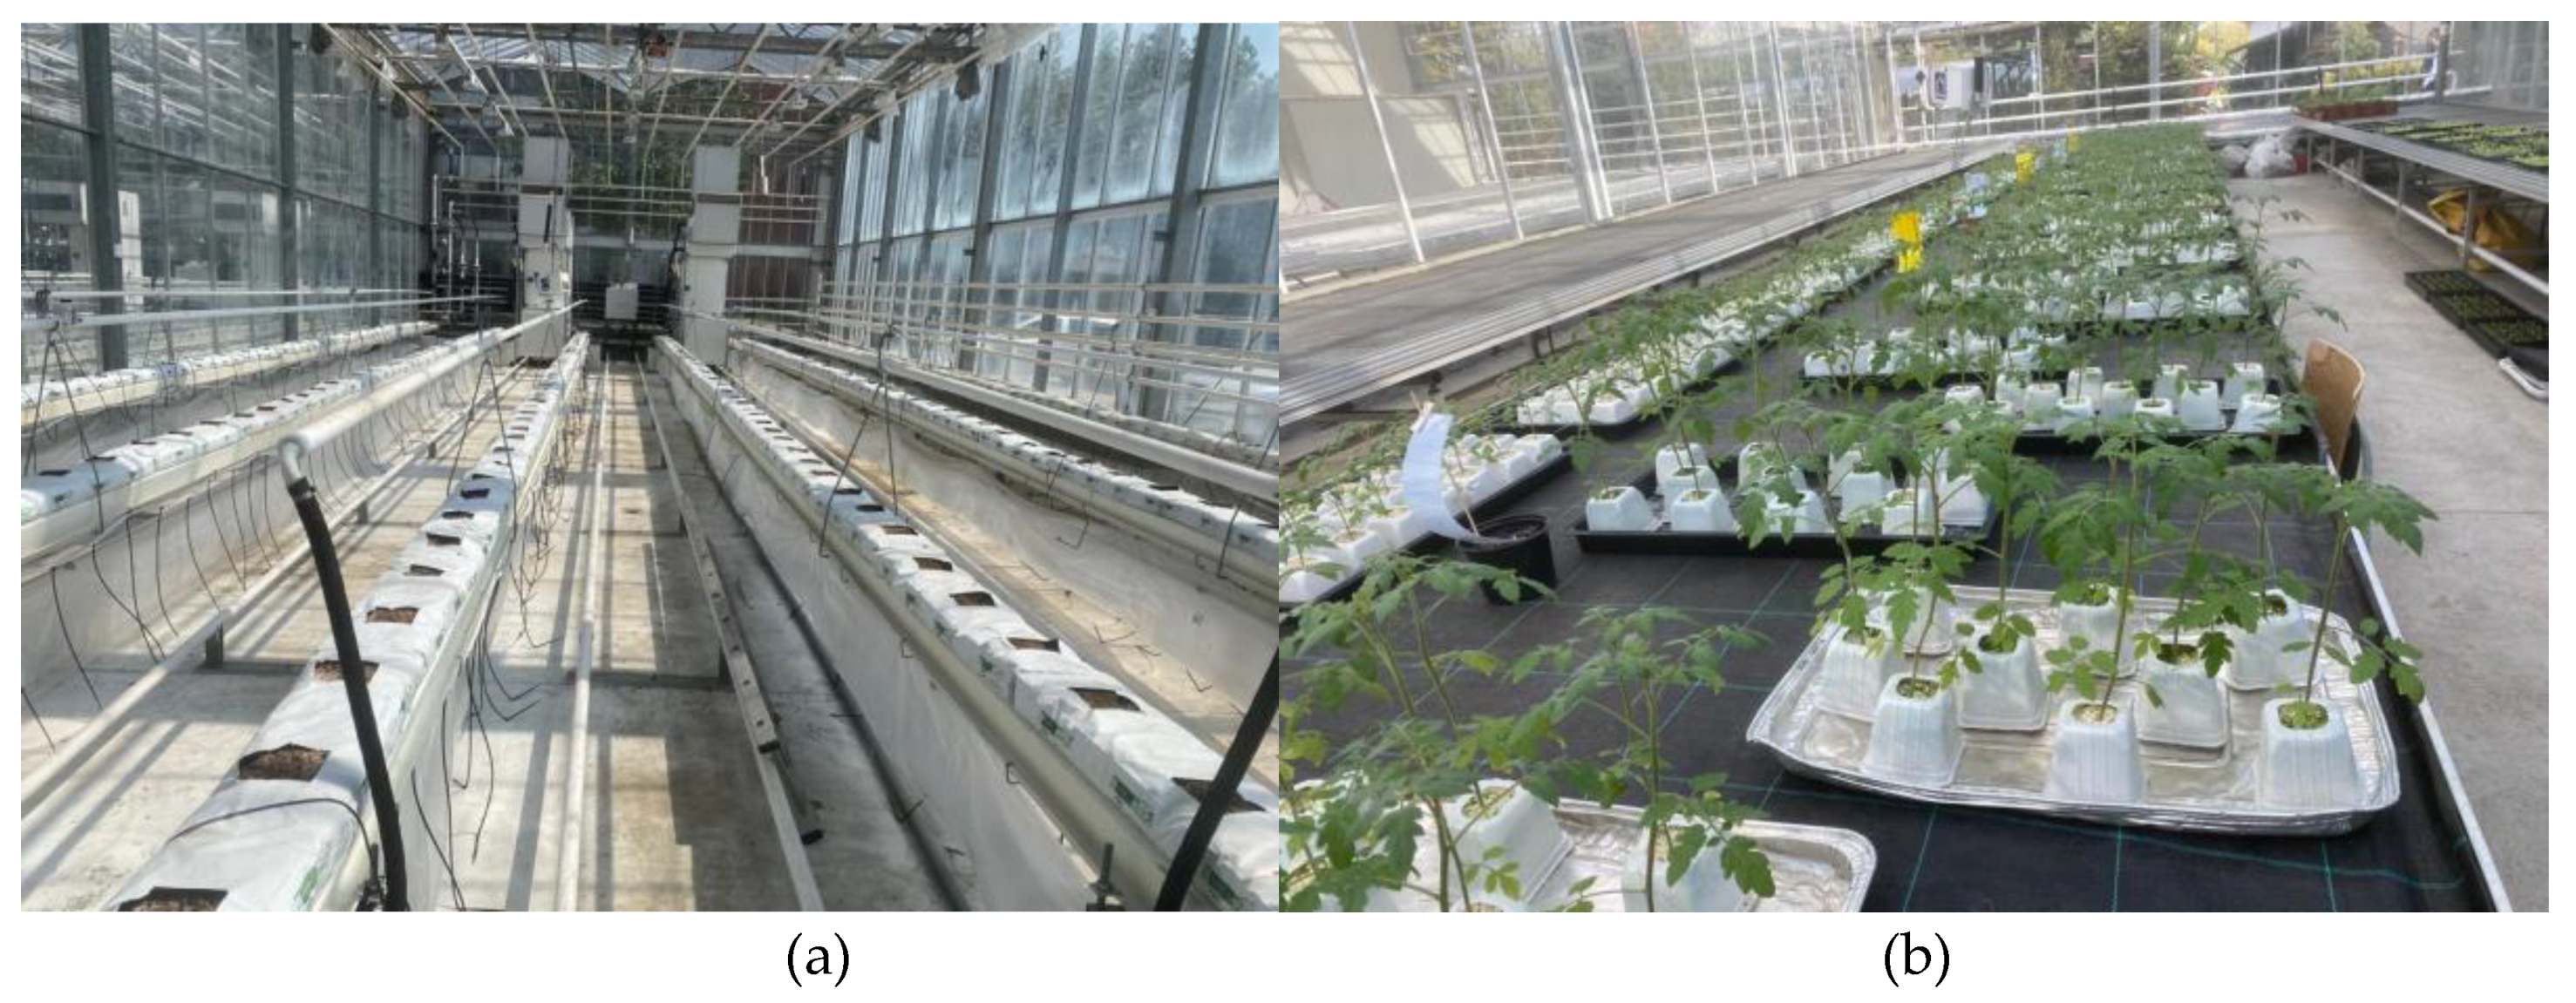
Seeds of Cherry tomatoes (Solanum Lycopersicon var. cerasiforme) cv. “Cheramy F1” were sown to plastic plug trays with 3.5cm deep and 3.5cm wide cells, containing disinfected coco peat growing media (Figure 11). Later, seedlings were transplanted into the perlite pot after 10 days of emergence. The transplanting of 45-day-old seedlings with first inflorescence appeared was carried out on October 30 under controlled conditions in the growing compartment. White cubes containing disinfected hydroponic perlite (2 mm) media as potting material were prepared and placed on coconut slabs in gutters (Figure 11). Nutrient solution was applied in different concentrations at the seedling stage with an Eco of 1.5, during the emergence of the 1st and 2nd inflorescences with an Eco of 2.3, and between the 5th and 9th inflorescences with an Eco of 2.8–3.0 mSiemens with a constant pH of 5.5. Irrigation in both cubes and slabs during the fruiting period was administered 10–12 times per day. The amount of applied nutrient solution was 100–150 ml/Plant. The distance of 30cm between the plants with a density of 3 plants per m² and 1.5 cm between the immoveable benches was maintained. The marketable and unmarketable yields of tomatoes are considerably affected by the interaction effect of inter- and interrow spacing [57],

4.3. Experimental Design and Statistical Analysis.

To carry out biochemical, physical, and growth analysis, we selected three rows as experimental rows, with three random plants selected from each row (denoted as p1, p2, and p3 for Row 1, Row 2, and Row 3, respectively) following the [58] method. Data regarding all the parameters was recorded at different dates during the extended period between December 2022 and March 2023. To find the average growth rate, the measured data was divided by the number of interval days between each date. The growth parameter graphs were generated using a combination of MS Word and Jamvoi software. Subsequently, an analysis of variance (ANOVA) was conducted, followed by the application of the normality test (Shapiro-Wilk) and the homogeneity of variances test (Levene's) at a confidence level of p< 0.05.

4.4. Accidental Observation

Accidental discoveries concerning changes in daylight, temperature, and carbon dioxide concentration are meant to be influences on plant morphology and growing status, most probably the result of uncontrolled differences in greenhouse conditions as the result of dynamic, extreme winter weather conditions. For example, there was a change in plant height, stem diameter, and number of leaves at the end of the greenhouse (which remained exposed to daylight for the maximum time) as compared to the plant in the front. Difference in size, number, and mass of fruits between the plants on the extreme right (eastern side) side of the greenhouse as compared to the middle and left side plants (western side) The only explanation for this that can be offered is the unequal distribution of day length, temperature, and carbon dioxide concentration. Extended photoperiod treatments increased tomato plant yields and shoot fresh weight by 40–57% (P 0.05) and 15–20%, respectively, in comparison to natural light [59]. The duration of time (number of hours) during which plants from each row were exposed to sunlight was also calculated. The time range of sunrise and sunset and the length of day during the months of January, February, March, and April were recorded in the greenhouse. (Table 4).

4.5. Data Collection

4.5.1. Growth Measurements.

The data collection activity commenced when plants were at the flowering and early fruit setting stages from December 21, 2022, to March 27, 2023, with different day intervals. The objective was to assess the growth rate of plants during the maturity stage.

4.5.1.1. Plant Height (cm):

The height of the plants was measured from the base of the plants to the terminal growing point of the main stem with the help of measuring tape. The height of each plant was measured and reported as the average of three plants for each row.

4.5.1.2. Leaf Expansion Rate (m²):

Three leaves from each plant were marked: older (6th leaf from base), mature young (14th leaf from base), and newborn (26th leaf) marked with blue ribbon to estimate leaf expansion rate after one week. The maximum length, distance from the base of the petiole to the distal end (Ls), and maximum width, farthest distance across the petiole (Lw), of each marked leaf were recorded with a measuring ruler.
Ls (cm) × Lw (cm)
L m² = L cm² * 0.0001
The results are expressed in meter square (m²).

4.5.1.3. Leaf Area:

Eight leaves, leaf below each first eight inflorescences of uniform size from each line (24 leaves from 3 lines), were selected for each treatment, spread, and tiled under a scanner (LA2400 Scanner; Regent Instruments for Image Analysis with Software’s). The leaves were scanned (LA2400 Scanner), their images were saved, and using a computer image analysis system, Winfolia Pro 2015 (Regent Instruments), the leaf area was measured (Figure 2 (exemplary)). There are several destructive and non-destructive methodologies to measure the leaf area of vegetables. [60] reported that the use of optical devices is a non-destructive method to measure the leaf area of plants.

4.5.1.4. Total Leaf Count per Observation Date:

On each observation date, the total number of leaves per plant was counted, compared with other plants in other rows, and reported as the average of three plants for each row.

4.5.1.5. Leaf Fresh and Dry Weight:

One representative leaf from each row was collected and chopped with scissors to get small pieces. 1 gram (3 repetitions, 3 g) of chopped fresh material was weighed using an analytical weighing balance in weighing bottles. Latterly weighed samples were put into the oven for 24 hours at 105 °C with a 50% air flap. 4.5.1.6 Stem diameter. The stem diameter of each plant was measured from the base (close to the insertion point), middle (after half the number of leaves), and top (below the newly emerged inflorescence) with the use of a digital caliper and expressed in mm.
Dry matter Calculation Formula (%)
X = A-Z/A-C×100
DM= 100-X
Where A= weighing bottle and sample weight before drying (g);
Z= weighing bottle and sample weight after drying (105° C) (g)
C= Empty weighing bottle weight
The results are expressed inform of percentage (%).

4.5.1.6. Stem Diameter:

The stem diameter of each plant was measured from the base (close to the insertion point), middle (after half the number of leaves), and top (below the newly emerged inflorescence) with the use of a digital caliper and expressed in mm.

4.5.1.7. Average Distance between Two Leaves and Two Inflorescence:

A few leaves and inflorescences from base, middle and top were marked and the distance between those marks was measured with the help of measuring tap and expressed in cm.

4.5.2. Productivity and Chemical Parametors:

The total number of inflorescences on each plant was counted, and the productivity performance of each inflorescence was recorded on the basis of the available data for the number of inflorescences, length of inflorescence, number of fruits inflorescence−1, average fruit mass inflorescence−1, fruit dry matter inflorescence−1, fruit height inflorescence−1, and fruit diameter inflorescence−1. The performance of each inflorescence has been reported on the basis of the cumulative data available from each row. (Table 2).

4.5.2.1. Inflorescence Length and Inflorescence Type:

The length of the first twelve inflorescences was recorded using a measuring tap, compared with mass/inflorescence, and expressed in grams. The type of inflorescence of each plant in a row was observed to indicate a relationship between the type and mass of each inflorescence. The numbers of unparous cyme, biparous cyme, and multiparous cyme were counted. (Inflorescence in tomatoes is cyme or raceme.) Uniparous cyme, biparous cyme.

4.5.2.2. Fruit Keeping Quality:

For every plant, two representative fruits from each inflorescence were put into polythene bags on the day of harvest and kept at room temperature to estimate fruit quality. The number of days tomatoes from each inflorescence survived at room temperature (whenever the fruit's skin softens and crinkles) was counted, and the mean number of days was calculated as described by [44].

4.5.2.3. Fruit Size and Mass of Fruit/Inflorescence:

The fruits harvested from the first twelve inflorescences of each plant were weighed individually on a digital weighing balance. The weighed mass was summed and expressed in yield (g) per inflorescence. (graph The fruit height and diameter of five randomly selected fruits of the first twelve inflorescences or was measured using a digital caliper and expressed in millimeters.

4.5.2.4. Fruit Firmness ((kg /cm²).

A penetrometer (Fruit firmness tester, 600E, Italy) was used to record the data regarding the fruit firmness. Five tomato fruits of equal size and similar physical appearance were taken, and using a peeler, each fruit was peeled off on one side. The pressure was exerted using an 8-mm piston and expressed in kg /cm².

4.5.2.5. Fruit Fresh and Dry Matter:

1 g (3 repetitions, 3g ) of tomato juice extract was measured in a vial using a digital weighing balance. Later on, all the weighed samples were put into an oven at 105 °C with a 50% air flap for 24 hours and expressed in percentages.
Dry matter Calculation Formula (%)
X = A-Z/A-C×100
DM= 100-X
Where: A= weighing bottle and sample weight before drying (g);
Z= weighing bottle and sample weight after drying (105° C) (g)
C= Empty weighing bottle weight
The results are expressed inform of percentage (%).

4.5.2.6. Nitrate Contents (mg / kg) and Sugar contents (Brix %)

The nitrate content was assessed using the portable tester "The Greenest ECO. The sugars in the fruits from inflorescences 1-6 were directly measured in the greenhouse using a portable refractometer with a Brix scale.

4.5.2.7. Titratable Acidity

The titratable acidity was assessed by homogenizing the samples (5g) with distilled water and then titrating them with 0.1 N NaOH until they achieved a pH of 8.1.

5. Conclusions

The study has investigated the implications of greenhouse microclimate variations on the growth, yield, and nutritional characteristics of cherry tomatoes. Fluctuation in microclimate conditions, specifically daily temperature, and light intensity, significantly influenced plant growth and development. The identified optimal conditions for tomato growth were a temperature range of 18 ºC to 25 ºC, a light intensity of 94.62 to 240.45 W/m2, and carbon dioxide 385.61 ppm to 510.30 ppm. The fruiting performance of inflorescence was high during the months of February and March. The reason behind this is supposed to be the available greenhouse conditions and genetic characteristics of the variety. The study established a profound relationship between the nutritional profile of fruits and both recorded greenhouse conditions and the chronological order of inflorescence development. Inflorescences initiating fruit-setting and ripening processes in February and March appeared with high nutritional content. It is worth noting that the fruits with a substantial dry matter content offer advantageous characteristics, such as enhanced flavor, increased efficiency in processing, improved resilience during transportation, and extended shelf life in storage an increase in the daily average temperature and light to the optimum level was found to positively impact the overall plant growth process. In accidental observation, the positioning of plants within the greenhouse and the duration of sunlight exposure were noted as crucial factors influencing the overall performance of tomato plants in the greenhouse.

Author Contributions

Conceptualization, E.M.D., A.A., J.I.O., M.H and N.I.; methodology, E.M.D., A.A., C.S.; software, A.A.,E.M.D.,S.C.,M.H.; validation, J.I.O.,A.A., N.I. and J.I.O.; formal analysis, A.A.,E.M.D., J.O.I. N.I., M.H investigation, A.A.; resources, E.M.D., L.A.B.; data curation, A.A.; writing—original draft preparation, A.A.; writing—review and editing, A.A.,E.M.D.,J.I.O.; visualization, A.A., C.S.; supervision, E.M.D., L.A.B; project administration, J.I.O, L.A.B.; funding acquisition, E.M.D., J.I.O All authors have read and agreed to the published version of the manuscript.

Funding

The research leading to these results has received funding from the NO Grants 2014-2021, under Project contract no. 40/2021.

Data Availability Statement

We encourage all authors of articles published in MDPI journals to share their research data. In this section, please provide details regarding where data supporting reported results can be found, including links to publicly archived datasets analyzed or generated during the study. Where no new data were created, or where data is unavailable due to privacy or ethical restrictions, a statement is still required. Suggested Data Availability Statements are available in section “MDPI Research Data Policies” at https://www.mdpi.com/ethics.

Acknowledgments

The authors acknowledge prof. dr. Adrian Asanica, Dean Faculty of Horticulture, prof. dr. Florin Stanica, head of the department of pomology lab at the University of Agriculture and Veterinary Medicine Bucharest, for technical support. We are also grateful to Petre Andrei-Catalin, Frincu Mihai, Mis, Aurora, Mis, Ana Butcaru for laboratory assistance, and Mis, Simona, Mis, Gina, and Mr. Bogdan for greenhouse management.

Conflicts of Interest

The authors declare no conflict of interest.

References

  1. Shamshiri, Shamshiri, R. R.; Jones, J.W.; Thorp, K.R.; Ahmad, D.; Man, H.C.; Taheri, S. Review of optimum temperature, humidity, and vapour pressure deficit for microclimate evaluation and control in greenhouse cultivation of tomato: A review. Int. Agrophysics 2018, 32, 287–302. [Google Scholar] [CrossRef]
  2. Elbadrawy, E.; Sello, A. Evaluation of nutritional value and antioxidant activity of tomato peel extracts. Arab. J. Chem. 2016, 9, S1010–S1018. [Google Scholar] [CrossRef]
  3. Chaudhary, P.; Sharma, A.; Singh, B.; Nagpal, A.K. Bioactivities of phytochemicals present in tomato. J. Food Sci. Technol. 2018, 55, 2833–2849. [Google Scholar] [CrossRef] [PubMed]
  4. Ramos-Bueno, R.P.; Romero-Gonzalez, R.; Gonzalez-Fernandes, M.J.; Guil-Guerrero, J.L. Phytochemical composition and in vitro anti-tumour activities of selected tomato varieties. J. Sci. Food Agric. 2017, 97, 488–496. [Google Scholar] [CrossRef] [PubMed]
  5. Vats, S.; Bansal, R.; Rana, N.; Kumawat, S.; Bhatt, V.; Jadhav, P.; Deshmukh, R. Unexplored nutritive potential of tomato to combat global malnutrition. Crit. Rev. Food Sci. Nutr. 2022, 62, 1003–1034. [Google Scholar] [CrossRef] [PubMed]
  6. Agarwal, S.; Rao, A.V. Tomato lycopene and its role in human health and chronic diseases. Cmaj 2000, 163, 739–744. [Google Scholar] [PubMed]
  7. Costa, J.M.; Heuvelink, E. Today's worldwide tomato production. Fruit Veg Tech 2007, 2007, 14–16. [Google Scholar]
  8. Branthôme, F.X. Worldwide (total fresh) tomato production exceeds 187 million tonnes in 2020. Tomato news. 2022.
  9. Lenucci, M.S.; Cadinu, D.; Taurino, M.; Piro, G.; Dalessandro, G. Antioxidant composition in cherry and high-pigment tomato cultivars. J. Agric. Food Chem. 2006, 54, 2606–2613. [Google Scholar] [CrossRef]
  10. Ohashi, Y.; Murai, M.; Ishigami, Y.; Goto, E. Light-Intercepting Characteristics and Growth of Tomatoes Cultivated in a Greenhouse Using a Movable Bench System. Horticulturae 2022, 8, 60. [Google Scholar] [CrossRef]
  11. Viuda-Martos, M. , Sanchez-Zapata, E., Sayas-Barberá, E., Sendra, E., Pérez-Álvarez, J.A., Fernández-López, J. Tomato and tomato byproducts. Human health benefits of lycopene and its application to meat products: A review. Crit. Rev. Food Sci. Nutr. 2014, 54, 1032–1049. [Google Scholar] [CrossRef]
  12. Omid, M.; Shafaei, A. Temperature and relative humidity changes inside greenhouse. Int. Agrophysics 2005, 19. [Google Scholar]
  13. Morison, J.I.L.; Lawlor, D.W. Interactions between increasing CO2 concentration and temperature on plant growth. Plant, Cell & Environment, 1999, 22, 659–682. [Google Scholar]
  14. Dong, J.; Gruda, N.; Lam, S.K.; Li, X.; Duan, Z. Effects of elevated CO2 on nutritional quality of vegetables: A review. Front. Plant Sci. 2018, 9, 924. [Google Scholar] [CrossRef] [PubMed]
  15. Long, S.P.; Ainsworth, E.A.; Rogers, A.; Ort, D.R. Rising atmospheric carbon dioxide: Plants FACE the future. Annu. Rev. Plant Biol. 2004, 55, 591–628. [Google Scholar] [CrossRef] [PubMed]
  16. Drake, J.E.; Gallet-Budynek, A.; Hofmockel, K.S.; Bernhardt, E.S.; Billings, S.A.; Jackson, R.B.; Finzi, A.C. Increases in the flux of carbon belowground stimulate nitrogen uptake and sustain the long-term enhancement of forest productivity under elevated CO2. Ecol. Lett. 2011, 14, 349–357. [Google Scholar] [CrossRef]
  17. Bisbis, M.B.; Gruda, N.; Blanke, M. Potential impacts of climate change on vegetable production product quality–a review, J. Clean. Prod. 2018, 170, 1602–1620. [Google Scholar] [CrossRef]
  18. Mamatha, H.; Srinivasa Rao, N.K.; Laxman, R.H.; Shivashankara, K.S.; Bhatt, R.M.; Pavithra, K.C. Impact of elevated CO 2 on growth, physiology, yield, and quality of tomato (Lycopersicon esculentum Mill) cv. Arka Ashish. Photosynthetica 2014, 52, 519–528. [Google Scholar] [CrossRef]
  19. Adams, S.R.; Cockshull, K.E.; Cave CR, J. Effect of temperature on the growth and development of tomato fruits. Ann. Bot. 2001, 88, 869–877. [Google Scholar] [CrossRef]
  20. Qian, T.; Dieleman, J.A.; Elings, A.; De Gelder, A.; Marcelis, L.F.M. Response of tomato crop growth and development to a vertical temperature gradient in a semi-closed greenhouse. J. Hortic. Sci. Biotech. 2015, 90, 578–584. [Google Scholar] [CrossRef]
  21. Pearce, B.D.; Grange, R.I.; Hardwick, K. The growth of young tomato fruit, I. Effects of temperature and irradiance on fruit grown in controlled environments. J. Hortic. Sci. 1993, 68, 1–11. [Google Scholar] [CrossRef]
  22. Ayankojo, I.T.; Morgan, K.T. Increasing air temperatures and its effects on growth and productivity of tomato in South Florida. Plants 2020, 9, 1245. [Google Scholar] [CrossRef] [PubMed]
  23. Blom, T.J.; Ingratta, F.J. The effect of high pressure sodium lighting on the production of tomatoes, cucumbers and roses. III Int. Symp. Energy Prot. Cultiv. 1983, 148, 905–914. [Google Scholar] [CrossRef]
  24. Steinger, T.; Roy, B.A.; Stanton, M.L. Evolution in stressful environments II: Adaptive value and costs of plasticity in response to low light in Sinapis arvensis. J. Evol. Biol. 2003, 16, 313–323. [Google Scholar] [CrossRef]
  25. Fierro, A.; Gosselin, A.; Tremblay, N. Supplemental carbon dioxide and light improved tomato and pepper seedling growth and yield. HortScience 1994, 29, 152–154. [Google Scholar] [CrossRef]
  26. Suzuki, M.; Umeda, H.; Matsuo, S.; Kawasaki, Y.; Ahn, D.; Hamamoto, H.; Iwasaki, Y. Effects of relative humidity and nutrient supply on growth and nutrient uptake in greenhouse tomato production. Sci. Hortic. 2015, 187, 44–49. [Google Scholar] [CrossRef]
  27. Leonardi, C.; Guichard, S.; Bertin, N. High vapour pressure deficit influences growth, transpiration and quality of tomato fruits. Sci. Hortic. 2000, 84, 285–296. [Google Scholar] [CrossRef]
  28. Guichard, S.; Gary, C.; Leonardi, C.; Bertin, N. Analysis of growth and water relations of tomato fruits in relation to air vapor pressure deficit and plant fruit load. J. Plant Growth Regul. 2005, 24, 201–213. [Google Scholar] [CrossRef]
  29. Bakker, J.C. Analysis of humidity effects on growth and production of glasshouse fruit vegetables; Wageningen University and Research: 1991.
  30. Mitova, I.; Patamanska, G.; Gigova, A. analysis of vegetative and reproductive growth of greenhouse tomatoes cultivated under drip irrigation and fertigation with increasing fertilizer rates. Scientific Papers. Series E. Land Reclamation, 2021. [Google Scholar]
  31. Hicklenton, P.R.; Jolliffe, P.A. Effects of greenhouse CO2 enrichment on the yield and photosynthetic physiology of tomato plants. Can. J. Plant Sci. 1978, 58, 801–817. [Google Scholar] [CrossRef]
  32. Frantz, J.M.; Joly, R.J.; Mitchell, C.A. Intracanopy lighting influences radiation capture, productivity, and leaf senescence in cowpea canopies. J. Am. Soc. Hortic. Sci. 2000, 125, 694–701. [Google Scholar] [CrossRef]
  33. Verkerk, K. Temperature, Light and the Tomato. Meded. Van Landbouwhogesch. Te Wagening. /Nederl. 1955, 55, 175–224. [Google Scholar]
  34. Demers, D.A.; Dorais, M.; Wien, C.H.; Gosselin, A. Effects of supplemental light duration on greenhouse tomato (Lycopersicon esculentum Mill.) plants and fruit yields. Sci. Hortic. 1998, 74, 295–306. [Google Scholar] [CrossRef]
  35. Demers, D.A.; Gosselin, A. Growing greenhouse tomato and sweet pepper under supplemental lighting: Optimal photoperiod, negative effects of long photoperiod and their causes. IV Int. ISHS Symp. Artif. Light. 2000, 580, 83–88. [Google Scholar] [CrossRef]
  36. Hurd, R.G. Long-day effects on growth and flower initiation of tomato plants in low light. Ann. Appl. Biol. 1973, 73, 221–228. [Google Scholar] [CrossRef]
  37. Suyanto, H.; Rupiasih, N.N.; Handayani, D. Influence of light wavelengths on growth of tomato. J. Bumi Lestari (J. Environ.) 2012, 12, 338–344. [Google Scholar]
  38. Logendra, S.; Putman, J.D.; Janes, H.W. The influence of light period on carbon partitioning, translocation and growth in tomato. Sci. Hortic. 1990, 42, 75–83. [Google Scholar] [CrossRef]
  39. Cherie, E. The complete guide to growing tomatoes: A complete step-by-step guide including heirloom tomatoes (back-to-basics gardening); Atlantic Publishin g Group Inc. 2010. [Google Scholar]
  40. Anwarzai, N.; Kattegoudar, J.; Anjanappa, M.; Sood, M.; Kumar BA RS, M. Evaluation of Cherry Tomato (Solanum Lycopersicum L. var. cerasiforme) Genotypes for Growth and Yield Parameters. J. Homepage: Http://Www. Ijcmas. Com 2020, 9, 2020. [Google Scholar] [CrossRef]
  41. Kittas, C.; Karamanis, M.; Katsoulas, N. Air temperature regime in a forced ventilated greenhouse with rose crop. Energy Build. 2005, 37, 807–812. [Google Scholar] [CrossRef]
  42. Alani, M.A.; Elkaaby, E.A.; Majeed, W.A.A.; Al-Mandelawy, F.N.; Almaliky, A.K.Q.; Raad, J.M.; Shukor, K. Evaluation of Growth, Yield and some Qualities Characteristics of Two Cherry Tomato (Solanum lycopersicum var. cerasiforme) Cultivars under Plastichouse Conditions. IOP Conf. Ser. : Earth Environ. Sci. 2023, 1225, 012026. [Google Scholar] [CrossRef]
  43. Jo, W.J.; Shin, J.H. Effect of leaf-area management on tomato plant growth in greenhouses. Horticulture, Environment, and Biotechnology, 2020, 61, 981–988. [Google Scholar] [CrossRef]
  44. Renuka, D.M.; Sadashiva, A.T.; Kavita, B.T.; Vijendrakumar, R.C.; Hanumanthiah, M.R. Evaluation of cherry tomato lines (Solanum lycopersicum var. cerasiforme) for growth, yield and quality traits. Plant Archives 2014, 14, 151–154. [Google Scholar]
  45. Pallardy, S. Physiology of woody plants Third edition. 2008. [Google Scholar]
  46. Wilson, K.B. Baldocchi, D.D., Hanson, P.J. Spatial and seasonal variability of photosynthetic parameters and their relationship to leaf nitrogen in a deciduous forest. Tree Physiol. 2000, 20, 565–578. [Google Scholar] [CrossRef] [PubMed]
  47. Rangaswamy, T.C.; Sridhara, S.; Ramesh, N.; Gopakkali, P.; El-Ansary, D.O.; Mahmoud, E.A.; Abdel-Hamid, A.M. Assessing the impact of higher levels of CO2 and temperature and their interactions on tomato (Solanum lycopersicum L.). Plants 2021, 10, 256. [Google Scholar] [CrossRef] [PubMed]
  48. Wei, P. Increase the productivity of tomato by changing the greenhouse environment. Second version. Research Skill Literature Report. 2017.
  49. Demers, D.A.; Gosselin, A. Growing greenhouse tomato and sweet pepper under supplemental lighting: Optimal photoperiod, negative effects of long photoperiod and their causes. In IV Int. ISHS Symp. Artif. Light. 2000, 580, 83–88. [Google Scholar] [CrossRef]
  50. Rajametov, S.N.; Lee, K.; Jeong, H.B.; Cho, M.C.; Nam, C.W.; Yang, E.Y. Physiological traits of thirty-five tomato accessions in response to low temperature. Agriculture 2021, 11, 792. [Google Scholar] [CrossRef]
  51. Kirschbaum, M.U. Does enhanced photosynthesis enhance growth? Lessons learned from CO2 enrichment studies. Plant Physiol. 2011, 155, 117–124. [Google Scholar] [CrossRef]
  52. Singh, G.; Singh, N.; Dixit, P.S.; Singh, A.; Singh, R.P.; Vishen, G.S.; Verma SR, K. Effect of integrated nutrient management on growth, yield and quality of tomato (Solanum lycopersicum L. ) var. Kashi amrit. International Journal of Chemical Studies 2021, 9, 262–269. [Google Scholar] [CrossRef]
  53. Guodaar, L. Effects of climate variability on tomato crop production in the Offinso North District of Ashanti region. Doctoral Dissertation. 2015.
  54. Abdul-Baki, A.A. Tolerance of tomato cultivars and selected germplasm to heat stress. J. Am. Soc. Hortic. Sci. 1991, 116, 1113–1116. [Google Scholar] [CrossRef]
  55. Heuvelink, E. Growth, development and yield of a tomato crop: Periodic destructive measurements in a greenhouse. Sci. Hortic. 1995, 61, 77–99. [Google Scholar] [CrossRef]
  56. Izzo, L.G.; Mele, B.H.; Vitale, L.; Vitale, E.; Arena, C. The role of monochromatic red and blue light in tomato early photomorphogenesis and photosynthetic traits. Environ. Exp. Bot. 2020, 179, 104195. [Google Scholar] [CrossRef]
  57. Lin, L.J.; Luther, G.C.; Hanson, P. Raising healthy tomato seedlings. AVRDC–The World Vegetable Center publication.
  58. Alsadon, A.A. , Al-Helal, I. M., Ibrahim, A.A., Shady, M.R., Al-Selwey, W.A. (, August). Growth analysis of tomato plants in controlled greenhouses. In XXX International Horticultural Congress IHC2018: III International Symposium on Innovation and New Technologies in Protected 2018, 1271, 177–184. [Google Scholar]
  59. Demers, D.A.; Dorais, M.; Wien, C.H.; Gosselin, A. Effects of supplemental light duration on greenhouse tomato (Lycopersicon esculentum Mill.) plants and fruit yields. Sci. Hortic. 1998, 74, 295–306. [Google Scholar] [CrossRef]
  60. Chen, J.M.; Rich, P.M.; Gower, S.T.; Norman, J.M.; Plummer, S. Leaf area index of boreal forests: Theory, techniques, and measurements. J. Geophys. Res. Atmos. 1997, 102, 29429–29443. [Google Scholar] [CrossRef]
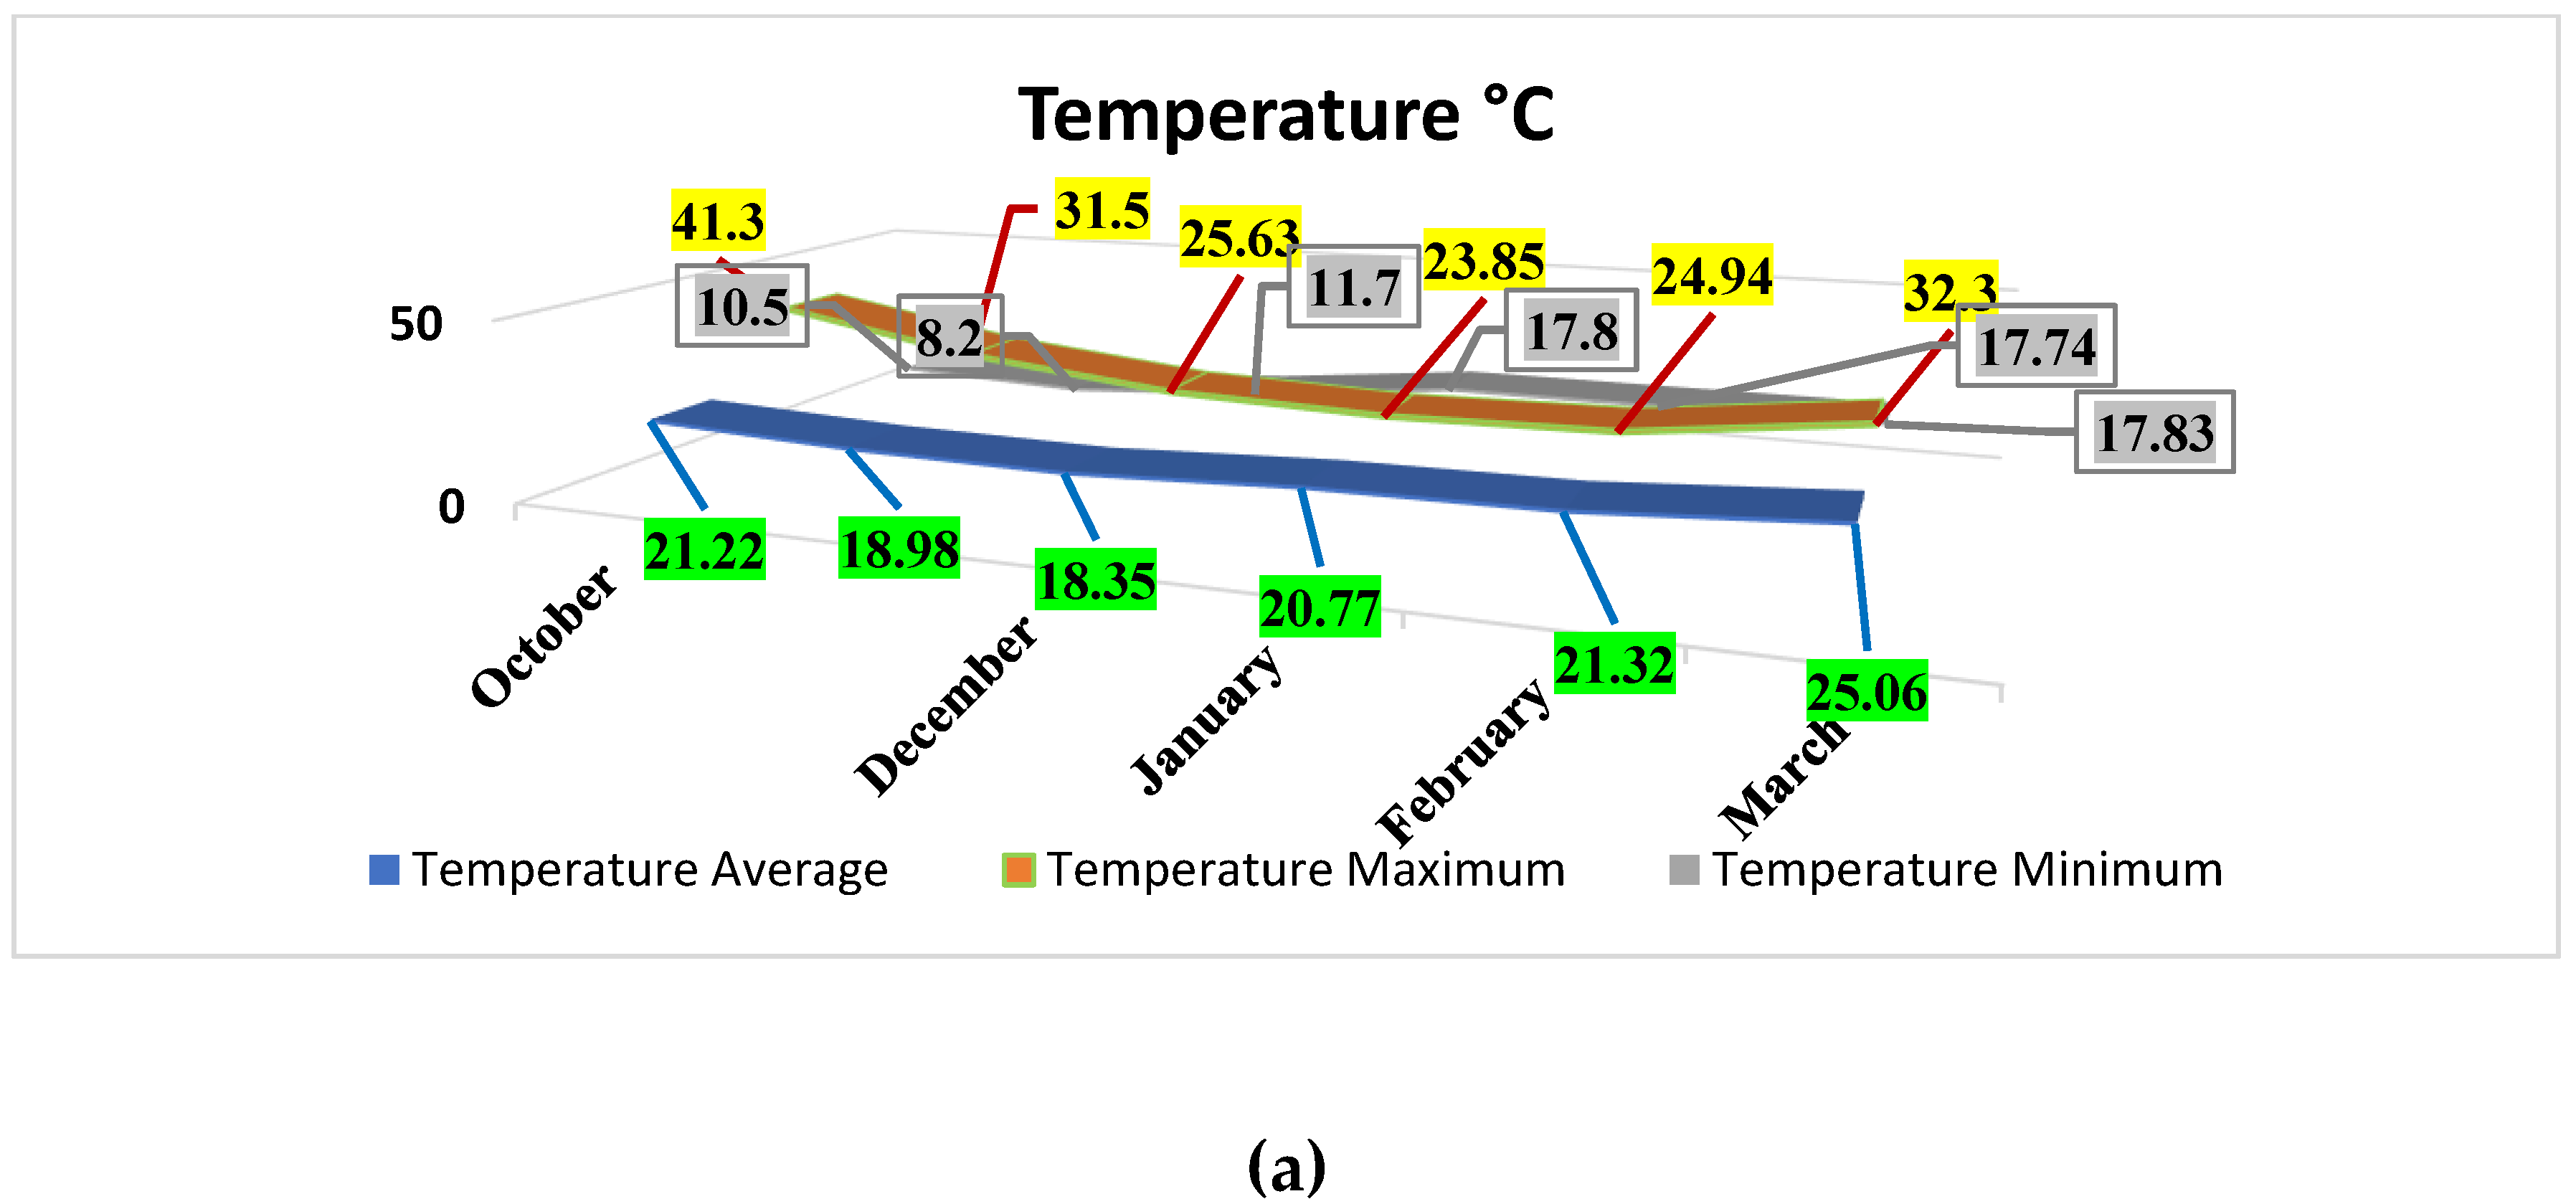
Figure 1. Recorded highest, lowest, and average values of (a) Temperature °C, (b) Carbon Dioxide (ppm) and (c) Light intensity (W/m²) in the greenhouse growing compartment.
Preprints 92799 g001aPreprints 92799 g001b
Figure 2. Plants height and change in growth rate of plant height per day (cm).
Preprints 92799 g002
Figure 3. Leaf area (cm²).
Preprints 92799 g003
Figure 5. (a) The mean interrfoliar spacing in Row 1 plants (b) The mean intefoliar spacing in Row 2 plants (c) The mean interfoliar spacing in Row 3 plants.
Preprints 92799 g005
Figure 6. (a) Total number of leaves per row (c) Leves growth rate per day (m²). (b) Change in leaves growth rate per day (m²). (c) leaf growth rate per observation date (m²).
Preprints 92799 g006aPreprints 92799 g006b
Figure 7. Average mass of a fruit (g) per inflorescence.
Preprints 92799 g007
Figure 8. Inflorescence length (cm).
Preprints 92799 g008
Figure 9. Comparison between the Number of fruits per inflorescence and total mass per inflorescence.
Preprints 92799 g009
Figure 10. (a) Number fruits shelf days per inflorescence.
Preprints 92799 g010
Figure 11. (a) Seedling growth in white cubes (b) Inner view of greenhouse experimental compartment.
Preprints 92799 g011
Table 1. Growth parameters (mean values ± SD) in response to greenhouse conditions in winter-grown cherry tomatoes.
Observation Dates Older leaf growth rate (m²) Mature leaf growth rate (m²) Nascent leaf growth rate (m²) Stem diameter growth rate at base
(mm)
Stem diameter growth rate in middle (mm) Stem diameter growth rate at top
(mm)
Total height of plant Total number of leaves plants¯¹
21-12-2022 0.194 ±0.013 0.158 ±0.011 0.051 ±0.011 10.07±0.867 11.46±0.99 5.83±0.328 169.88 ±5.38 32.13±1.52
06-01-2023 0.201 ±0.013 0.166 ±0.011 0.058 ±0.013 10.64±0.637 12.24±0.62 6.58±0.580 210.22 ±8.18 36.11±0.83
13-01-2023 0.207 ±0.016 0.174 ±0.011 0.077 ±0.014 11.06±0.622 12.89±0.94 7.29±0.638 230.77 ±8.52 39.44±0.50
20-01-2023 0.211 ±0.018 0.180 ±0.013 0.088 ±0.013 11.46±0.428 13.45±1.13 7.75±0.401 255.11 ±7.87 42.77±1.07
27-01-2023 0.214 ±0.022 0.184 ±0.014 0.099 ±0.011 11.86±0.378 13.98±1.16 8.20±0.364 279.00 ±7.88 46.44±0.50
03-02-2023 0.224 ±0.023 0.194 ±0.010 0.114 ±0.007 12.48±0.546 14.39±1.13 8.58±0.289 301.55 ±13.03 51.88±1.01
13-02-2023 0.227 ±0.025 0.201±0.006 0.125 ±0.004 12.84±0.405 14.92±1.08 8.90±0.301 325.22± 13.53 56.00±2.60
02-03-2022 0.230 ±0.029 0.209 ±0.008 0.135 ±0.008 13.26±0.541 15.50±1.30 9.36±0.442 381.22 ±29.13 68.11±2.52
27-03-2022 0.231 ±0.029 0.215 ±0.008 0.147 ±0.006 12.85±0.552 15.84±1.00 9.86±0.512 454.88 ±29.94 77.00±2.64
F 0.793 6.748 22.493 6.053 4.458 19.879 78.638 131.875
P 0.626 0.009 <.001 0.012 0.028 <.001 <.001 <.001
P < 0.05…*, 0.01…**, 0.001…*** ns = non-Significance level.
Table 2. Productivity parameters (mean values ± SD) in response to greenhouse conditions in winter-grown cherry tomatoes.
Inflorescence number. Inflorescence Length. (cm) Number of fruits. Total Fruit mass (g) Average fruit mass(g) Fruit Dry matter (%) Fruit diameter (mm) Shelf days
1 19.90±0.55 13.00±0.66 181.46±20.06 12.54±1.39 3.16±0.08 28.97±1.8868 14.00±2.00
2 25.36±1.72 13.00±0.57 183.84±37.80 14.40±2.43 3.69±0.61 30.23±1.2818 14.00±1.00
3 35.54±5.43 17.44±1.83 235.41±56.50 12.86±2.81 7.78±0.16 28.87±2.7486 13.67±2.08
4 38.83±2.83 34.67±4.48 161.63±37.02 11.08±2.39 10.31±3.88 28.74±1.7164 16.67±1.15
5 46.56±7.00 31.22±2.21 178.17±47.30 11.83±1.81 13.89±4.24 27.30±0.7007 21.67±1.52
6 47.54±6.13 26.00±2.81 240.27±36.76 9.79±0.85 11.49±3.44 28.35±0.6140 17.67±0.57
7 45.23±6.65 14.33±0.66 226.80±19.27 9.71±1.10 11.83±0.9 28.47±2.0001 19.67±1.15
8 36.17±5.08 18.22±6.25 213.19±11.75 9.95± 0.71 9.85±0.791 26.82±1.2453 16.33±1.15
9 32.33±5.57 28.78±9.91 220.76±10.83 10.26±0.36 10.18±0.8 26.57±1.6044 16.32±2.08
10 27.67±3.14 27.00±1.33 243.22±81.81 11.72±3.43 9.47±0.304 26.87±1.9358 15.00±1.00
F 22.700 36.078 1.479 1.604 210.726 1.401 0.998
p <.001 <.001 0.296 0.260 <.001 0.322 0.475

P < 0.05…*, 0.01…**, 0.001…*** ns = non-Significance level.
Table 3. Fruit nutritional contents (mean values ± SD) in response to greenhouse conditions of winter-grown cherry tomatoes.
Inflorescence number. Brix (%) Nitrate contents. (mg/kg) Fruit acidity Fruit Firmness
(kg /cm²)
Leaf Area
(cm²)
1 7.21±0.2536 136.67±5.77 12.76±0.399 6.43±0.38 7183±16
2 7.50±0.7708 125.00±5.00 14.12±0.51 5.68±0.86 7013±12
3 6.91±0.2143 135.00±8.66 15.81±0.59 5.93±0.50 10477±13
4 7.15±0.3585 131.67±7.63 13.77±1.50 5.40±0.28 8851±79
5 8.07±0.8730 133.33±5.77 15.63±0.60 5.76±0.66 7541±43
6 8.85±1.0671 145.00±5.00 15.64±0.81 7.15±0.55 9287±11
7 8.22±1.0607 124.00±5.29 13.73±0.40 7.21±0.16 6294±52
8 7.79±1.0829 125.00±5.00 14.73±2.54 6.62±0.14 9423±77
9 7.70±0.8812 133.33±5.77 15.19±1.09 7.57±0.26 8953±64
10 8.03±0.6467 150.67±5.03 13.21±1.49 6.23±0.30 7389±76
F 5.276 1.724 6.360 10.039 4.382
P 0.014 0.228 0.008 0.002 0.024
P < 0.05…*, 0.01…**, 0.001…*** ns = non-Significance level.
Table 4. The time range of sunrise and sunset during the cultivation period.
Month Sunrise (First to last date) Sunset (First to last date) Daylength (First to last date)
(Time).
January 7:51am to 7:35am 16:46pm to 17:22pm 8:54:29 to 9:47:12
February 7:34am to 6:55 am 17:24pm to 18:01pm 9:49:42 to 11:06:10
March 6:53am to 6:59 am 18:02pm to 19:41pm
11:09:13 to 12:41:43
April 6:57am to 6:08am 19:55pm to 20:18pm 12:44:47 to 14:09:37
Disclaimer/Publisher’s Note: The statements, opinions and data contained in all publications are solely those of the individual author(s) and contributor(s) and not of MDPI and/or the editor(s). MDPI and/or the editor(s) disclaim responsibility for any injury to people or property resulting from any ideas, methods, instructions or products referred to in the content.
Copyright: This open access article is published under a Creative Commons CC BY 4.0 license, which permit the free download, distribution, and reuse, provided that the author and preprint are cited in any reuse.
Prerpints.org logo

Preprints.org is a free preprint server supported by MDPI in Basel, Switzerland.

Subscribe

© 2024 MDPI (Basel, Switzerland) unless otherwise stated