1. Introduction
Global consumption of aquatic food has increased in recent years. The consumption of aquatic food grew from an average of 9.9 kg/capita in 1960 to 20.5 kg in 2019, and kept growing despite the decline to 20.2 kg/capita in 2020. However, the increased aquatic food consumption is not in line with the fisheries' resources. The decline is due to overfishing, poor management, and biologically sustainable stock [
1]. One solution to maintaining aquaculture stocks' sustainability is using the RAS. The RAS is a closed system that combines treatments and reuses the water with less than 10% of the total water volume replaced per day [
2]. One factor that affects water quality and guarantees the aquaculture species in RAS is the minimum amount of TAN. The TAN is produced by fish respiration and the decomposition of organic matter [
3]. So, a biofilter is needed to ensure a minimum amount of TAN through the biological process. In this process, ammonium is oxidized to nitrite and then nitrate with the help of nitrifying bacteria [
4]. The nitrification in biofilters is made possible by the autotrophic bacteria ammonia-oxidizing bacteria (AOB) and nitrite-oxidizing bacteria (NOB) [
5].
Moving bed biofilm reactor (MBBR) is a type of biofilter where nitrifying bacteria attached to the surface of suspended carrier media then form biofilm [
6]. The nitrifying activity in MBBR is influenced by the availability of oxygen concentration in the water [
7]. The oxygen diffusion from water to biofilm is the factor that affects the process in MBBR and consequently determines biofilm composition [
8]. A bubble diffuser is a recent technology to provide a sufficient amount of oxygen. The diffuser maintains the dissolved oxygen (DO) to satisfy the oxygen demand in the system. Other water quality parameters affecting nitrifying bacteria in MBBR are pH, temperature, and TDS. The safe range of water quality parameters should be maintained so efficient nitrification can be achieved. So, a measurement instrument is needed to monitor the water quality in real-time.
The Internet of Things (IoT) has recently gained much interest in real-time data measurement to achieve cost-effective aquaculture management. IoT refers to smart devices or sensors which uniquely addressable based on their communication protocols, adaptable, and autonomous with inherent security [
9]. IoT's architecture is composed of hardware which consist of sensor nodes and middleware which consist of data storage and a presentation layer. The presentation layers should give efficient visualization and be compatible with various platforms for different applications [
10]. A study is conducting to monitor water quality of fresh water aquaculture with integrating temperature, pH, DO, and EC sensors. The sensors is connected to ESP 32 Wi-Fi module to transmit the monitoring data then displaying the data in ThingSpeak IoT platform. However, to the author's best knowledge, there is no study reporting on the control of DO to fulfill oxygen demand in the system [
11]. While a study developed real-time DO, pH, and temperature sensors using CC3200 Launchpad as the microcontroller and integrated with the Internet of Things (IoT) [
12]. The real-time data from the study is displayed on the Node-Red dashboard. Similarly, others reported the development of aquaculture monitoring systems consisting of pH, turbidity, and temperature sensor with Things IoT platform and “If this then that (IFTTT)” integrated to the system to send a notification to owner’s registered number [
13]. A study was also done with Thingspeak IoT platform for monitoring physico-chemical variables like DO, pH, temperature, and salinity of fish farms in Mekong Delta. This study also proposes automatic sensor probe cleaning to improve sensor reliability and reduce maintenance costs [
14]. In another study, by building a system to real-time monitor DO, pH, ammonia nitrogen, and temperature, set a warning notification to the user if the parameter is beyond the normal scope of the setting value [
15]. However, the studies are only focused to monitor and control for the aquaculture stock, no study investigate effect of monitoring and control on the biofilm so that good water quality can be achieved. So that, this study focusses on the development of lab scale RAS monitoring and control system and integrated with Thingsboard IoT platform through MQTT architecture to allow investigation on biofilm growth process and mechanism. The advantage of the system is possible to control the system to improve TAN removal effectivity and efficiency. Information of the diffuser mechanism and performance to increase the DO can be used to scale up the system for the future development.
2. Design of Control and Monitoring System
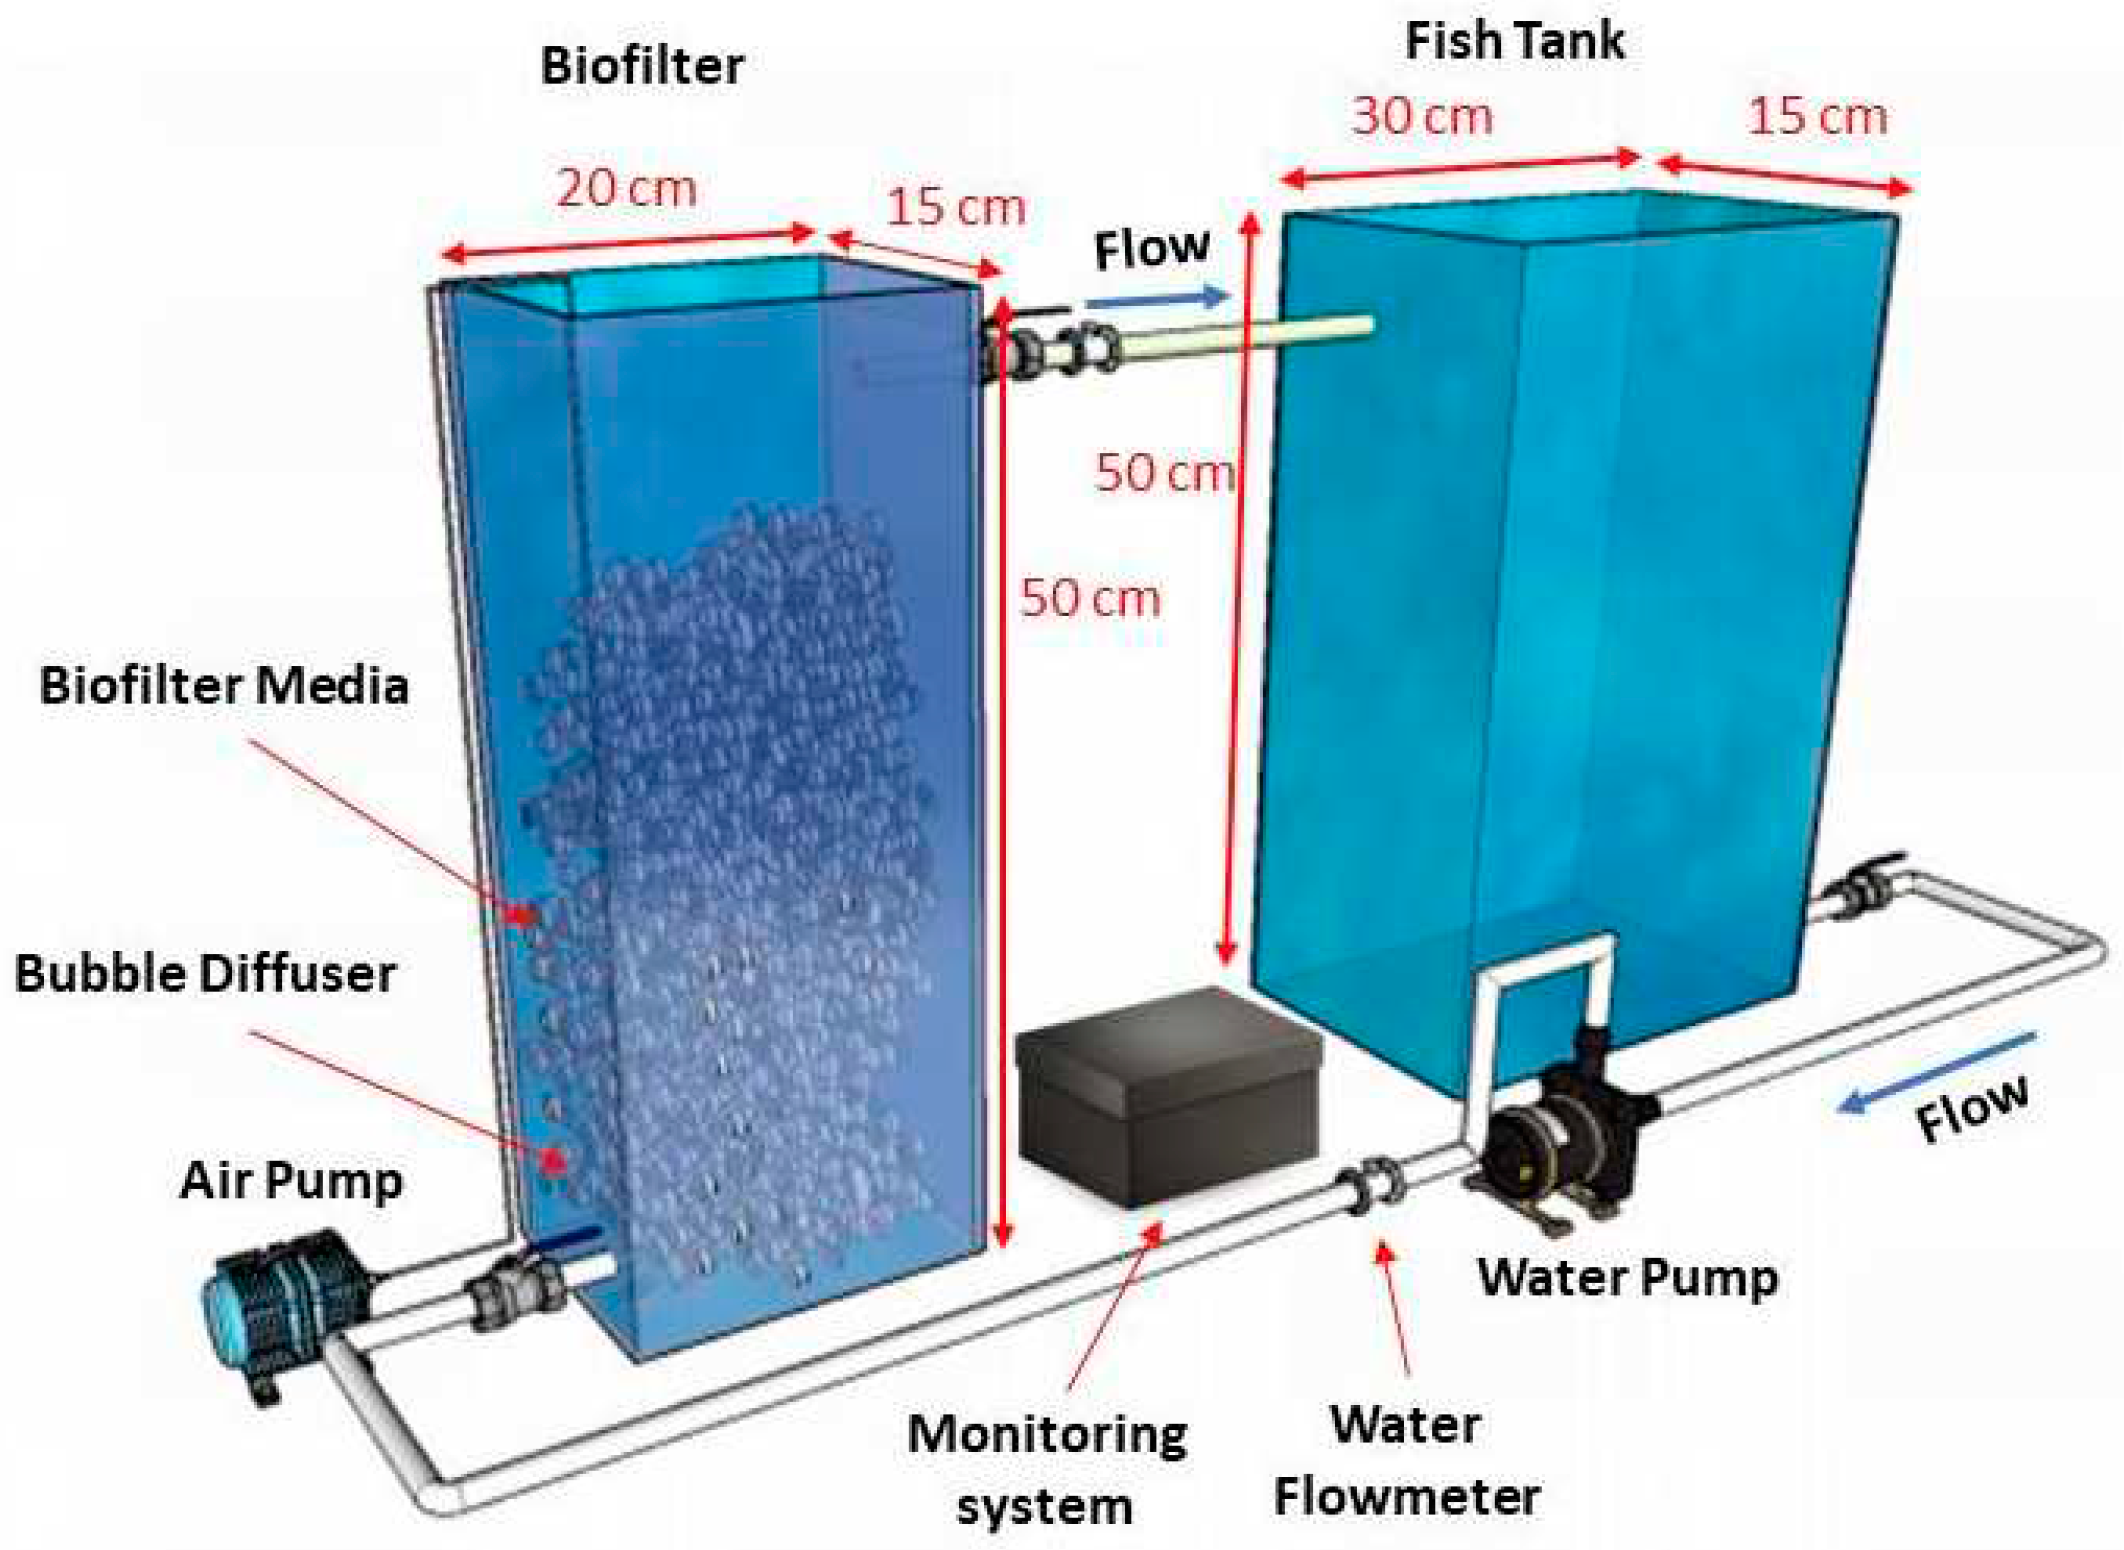
The laboratory scale system in the experiment (
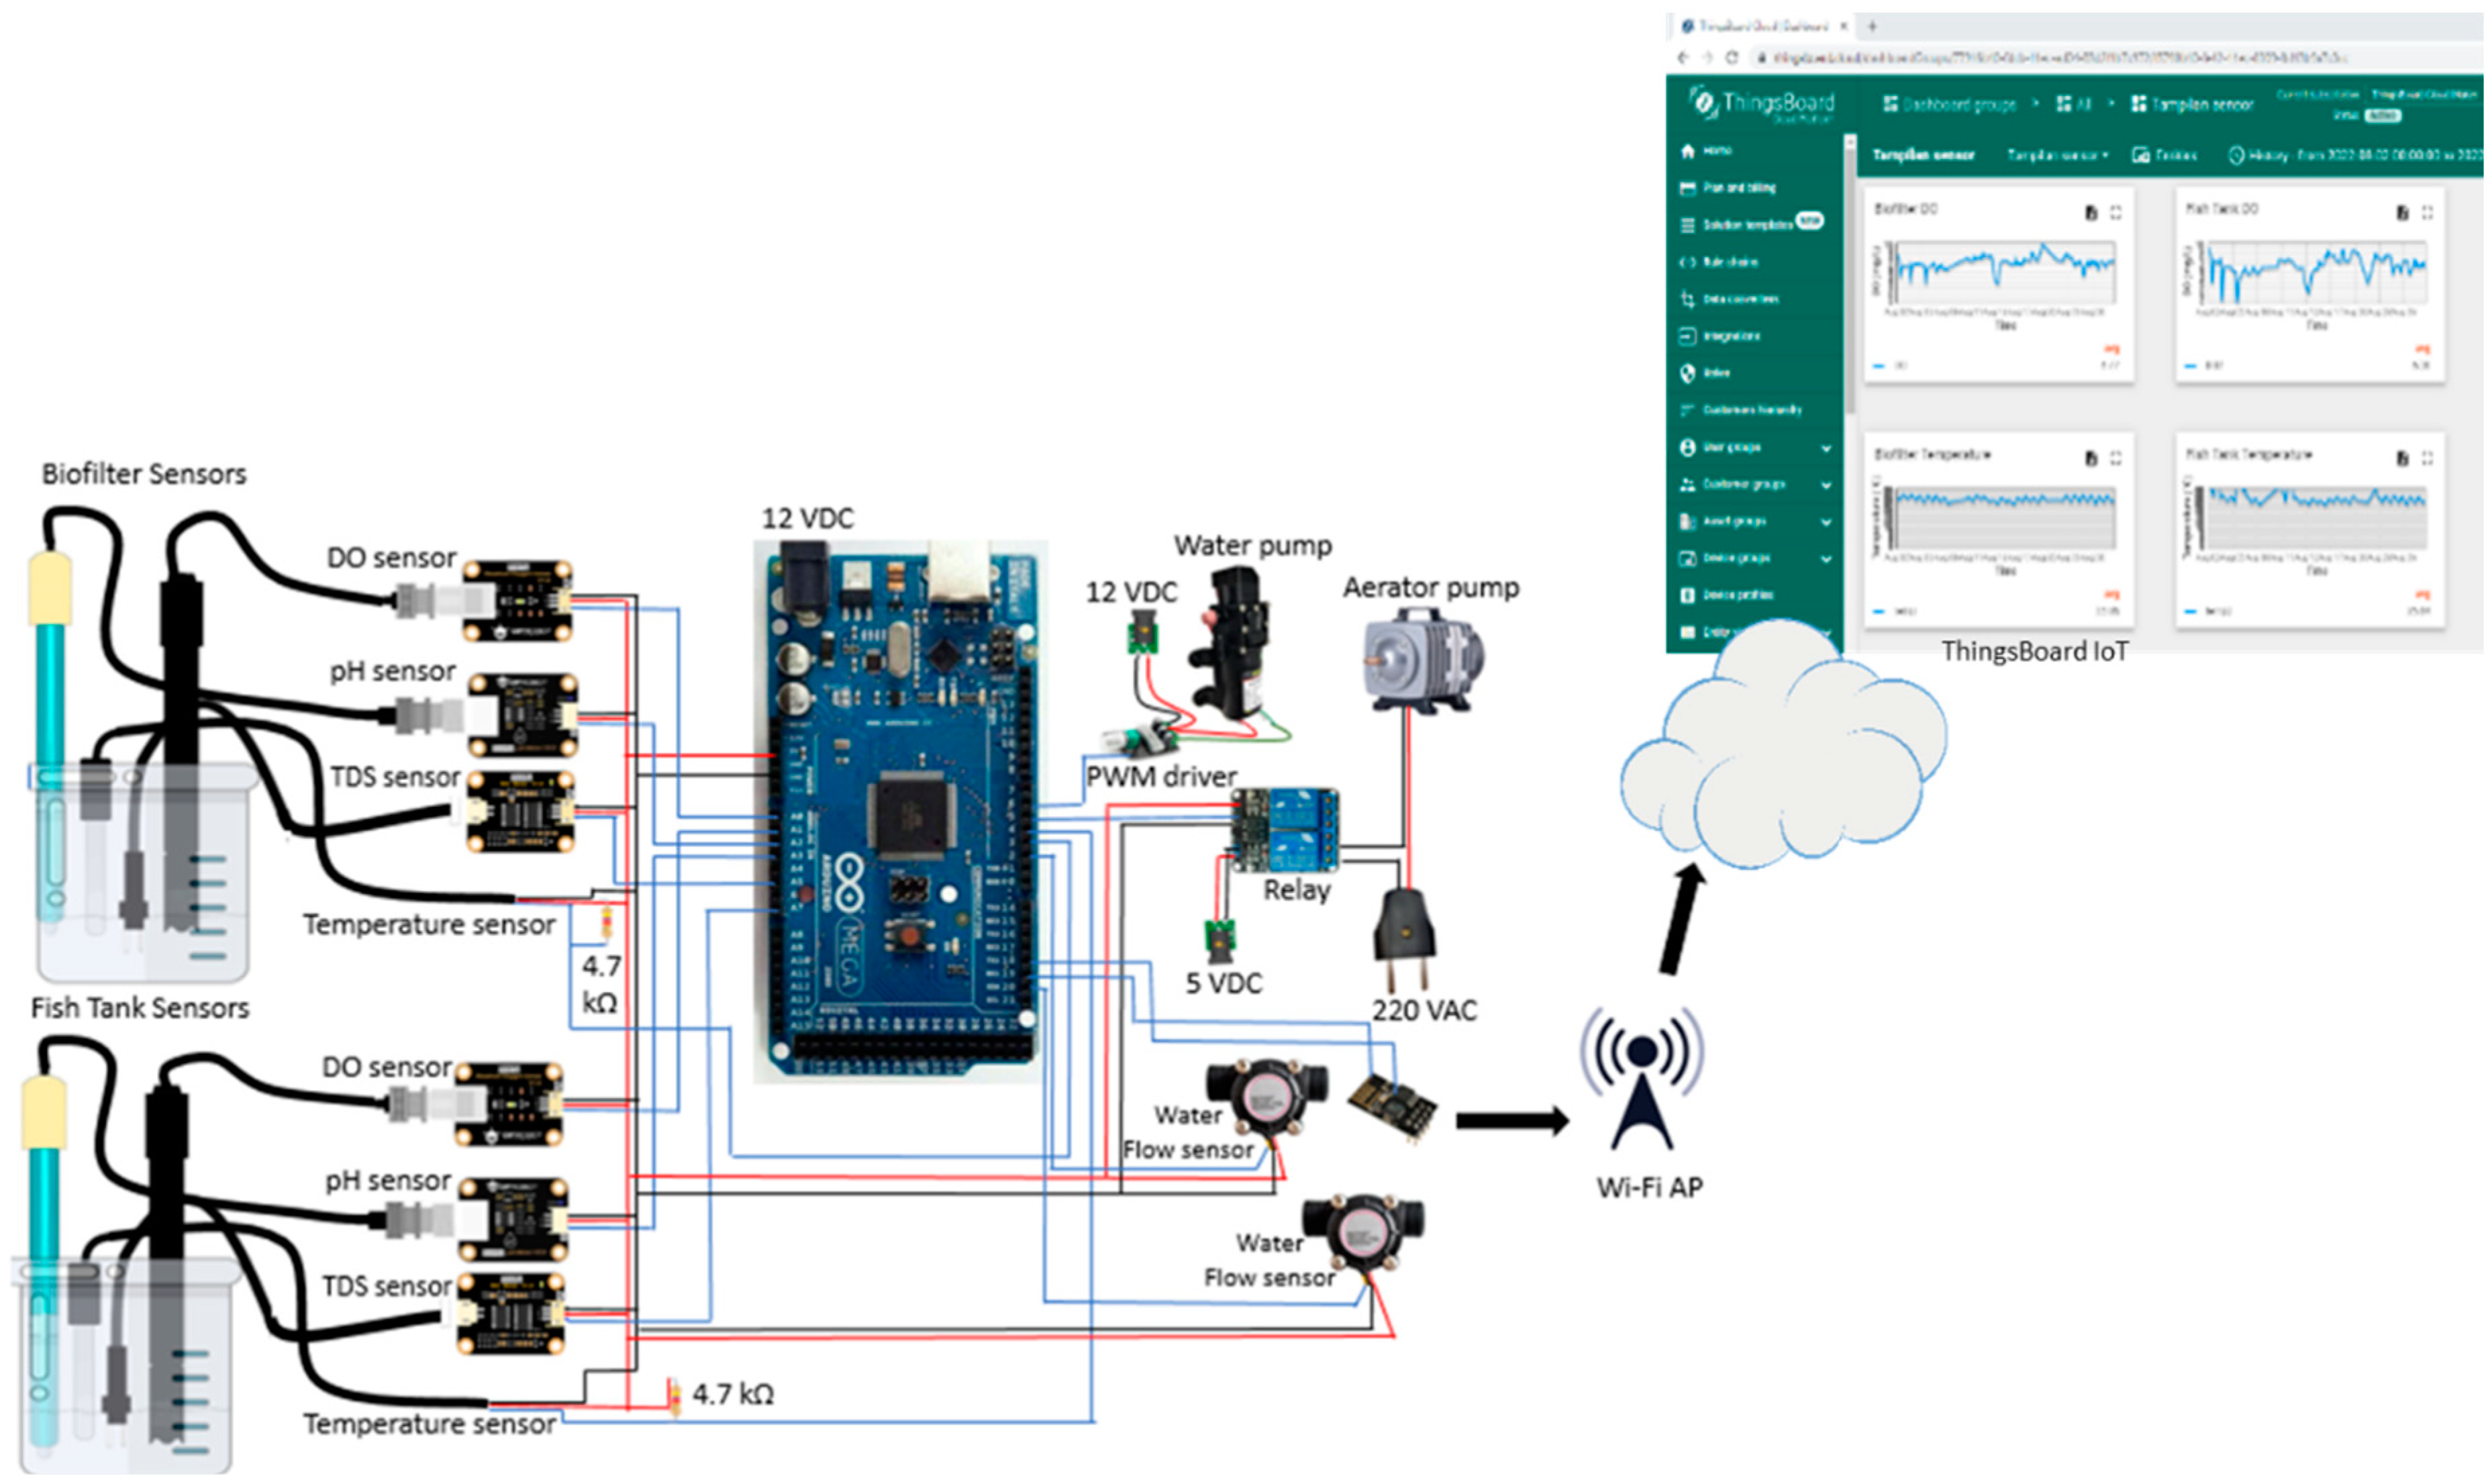
Figure 1) consists of biofilter (MBBR) tanks, fish tank, bubble diffuser, air pump, water pump for water recirculation, and monitoring system. The detail of monitoring system as seen in
Figure 2 consists of water quality sensors which are DO, temperature, pH, TDS, and flow sensor. The system also equipped with microcontroller Arduino Mega 2560 which function as data acquisition and processing device that supplied by power supply. Besides, the system has WiFi module ESP 8266-01 as transmitter device and IoT platform Thingsboard to display the monitoring data. The analog water quality sensors are connected to corresponding signal converter then arranged in parallel to connect with microcontroller for data acquisition. Whereas for digital temperature sensor, 4.7 kΩ resistor is added between the digital signal pin (blue line in
Figure 2.) and the 5 VDC power source to stabilize the temperature reading. For the digital water flow meter, the digital pin is directly connected to the digital input of microcontroller. The output data from sensors are read by microcontroller and sent to cloud using WiFi module. Afterward, the monitoring data displayed on the Thingsboard website in real time. In addition, the system consists of control element, relay and air pump to ensure sufficient DO in the RAS.
2.1. Sensors Devices
2.1.1. DO Sensor
DO is the level of free and non-compound oxygen present in water or other liquid [
16]. In addition, DO is an important parameter that indicates the quality of water and reflects biological, chemical and physical process that occurs in the water [
17]. Aquatic lives in RAS like fish and bacteria, needs DO to do the biochemical process such as respiration and metabolism. For biofilm growth efficient DO concentration in the system is excess 4 mg/L and below 8 mg/L [
18,
19]. Thus, sufficient amount of DO is needed to ensure efficient growth of aquatic lives. A galvanic typeDO sensor (DFRobot SKU:SEN0237) is used in this system to observe the DO in real time. The galvanic type consists of anode as reference electrode and cathode as working electrode. Both the electrode is inside the single electrode body that contained electrolyte solution and separated from the measured medium by a non-conducting membrane which is partially permeable to oxygen [
20]. When DO sensor entered the water, the anode is oxidized and releases electron and the cathode undergo reduction when it is passed by the electron. The oxidation and reduction written in Equation 1-4 [
11].
2.1.2. pH Sensor
The pH (power of Hydrogen) is an index of hydrogen ion concentration
in the water with scale of 0 to 14. The pH concept has its basis in the ionization as written in Eq. 1 [
21]. Optimum pH range for nitrification is between 7.0 and 9.0, whereas for nitrification bacteria growth like
Nitrosomonas the optimum pH range is between 7.2 and 8.8 and for
Nitrobacter is between 7.2 and 9.0 [
22]. To ensure the pH in the system, DFRobot Analog pH Pro Meter was used. The sensor has measuring range between 0 and 14 with measuring temperature 0-60
OC and accuracy ± 0.1pH (25
OC). The sensor consists of sensing and reference electrode to read potential difference between the sensing and reference electrode [
11].
2.1.3. Temperature Sensor
Temperature is important factor in wastewater treatment, because the changes of temperature will influence the pH and DO [
23,
24]. Moreover, the temperature is important factor determining the growth of nitrying bacteria. The optimal temperature range for nitrification in wastewater is 25-28
oC,
Nitrobacter is more sensitive to environmental condition compared to
Nitrosomonas [
25]. DS18B20 is used for the measurement with range of -55
OC to 125
OC and accuracy of ±0.5
OC. The sensor consists of three wire: DQ for data communication, VDD for voltage, GND for the ground.
2.1.4. TDS Sensor
TDS are the amount of minerals, salts, organic matter, and metals dissolved in water and expressed in ppm (parts per million) or mg/L [
26]. In RAS, dissolved solids consist of nitrogen and phosphorus compounds sourced from feeding or fertilizers. The increasing of TDS will cause harmful nitrogen compounds that can cause stress in aquatic lives. In the system, DFRobot SKU:SEN0244 with measurement range of 0-1000 ppm and accuracy of ±10% FS at 25
OC.
2.1.5. Water Flow Sensor
Water Flow sensor is used to ensure the right flow rate for water recirculation so that there is no overflow in biofilter. The flow rate will convert to rpm to control the recirculation pump from fish tank to biofilter. In this study, YF-201 is used as flow sensor which applies hall-effect in the operation. When water passing through the sensor, it makes the turbine wheel to rotate consequently creates magnetic flux and interfere the Hall Effect sensor to produce pulse signal output. The sensor has 1-30 L/min flow range with working voltage of 4.5- 24 VDC.
2.2. Hardware Description of Control and IoT System
2.2.1. Hardware Description of Control System
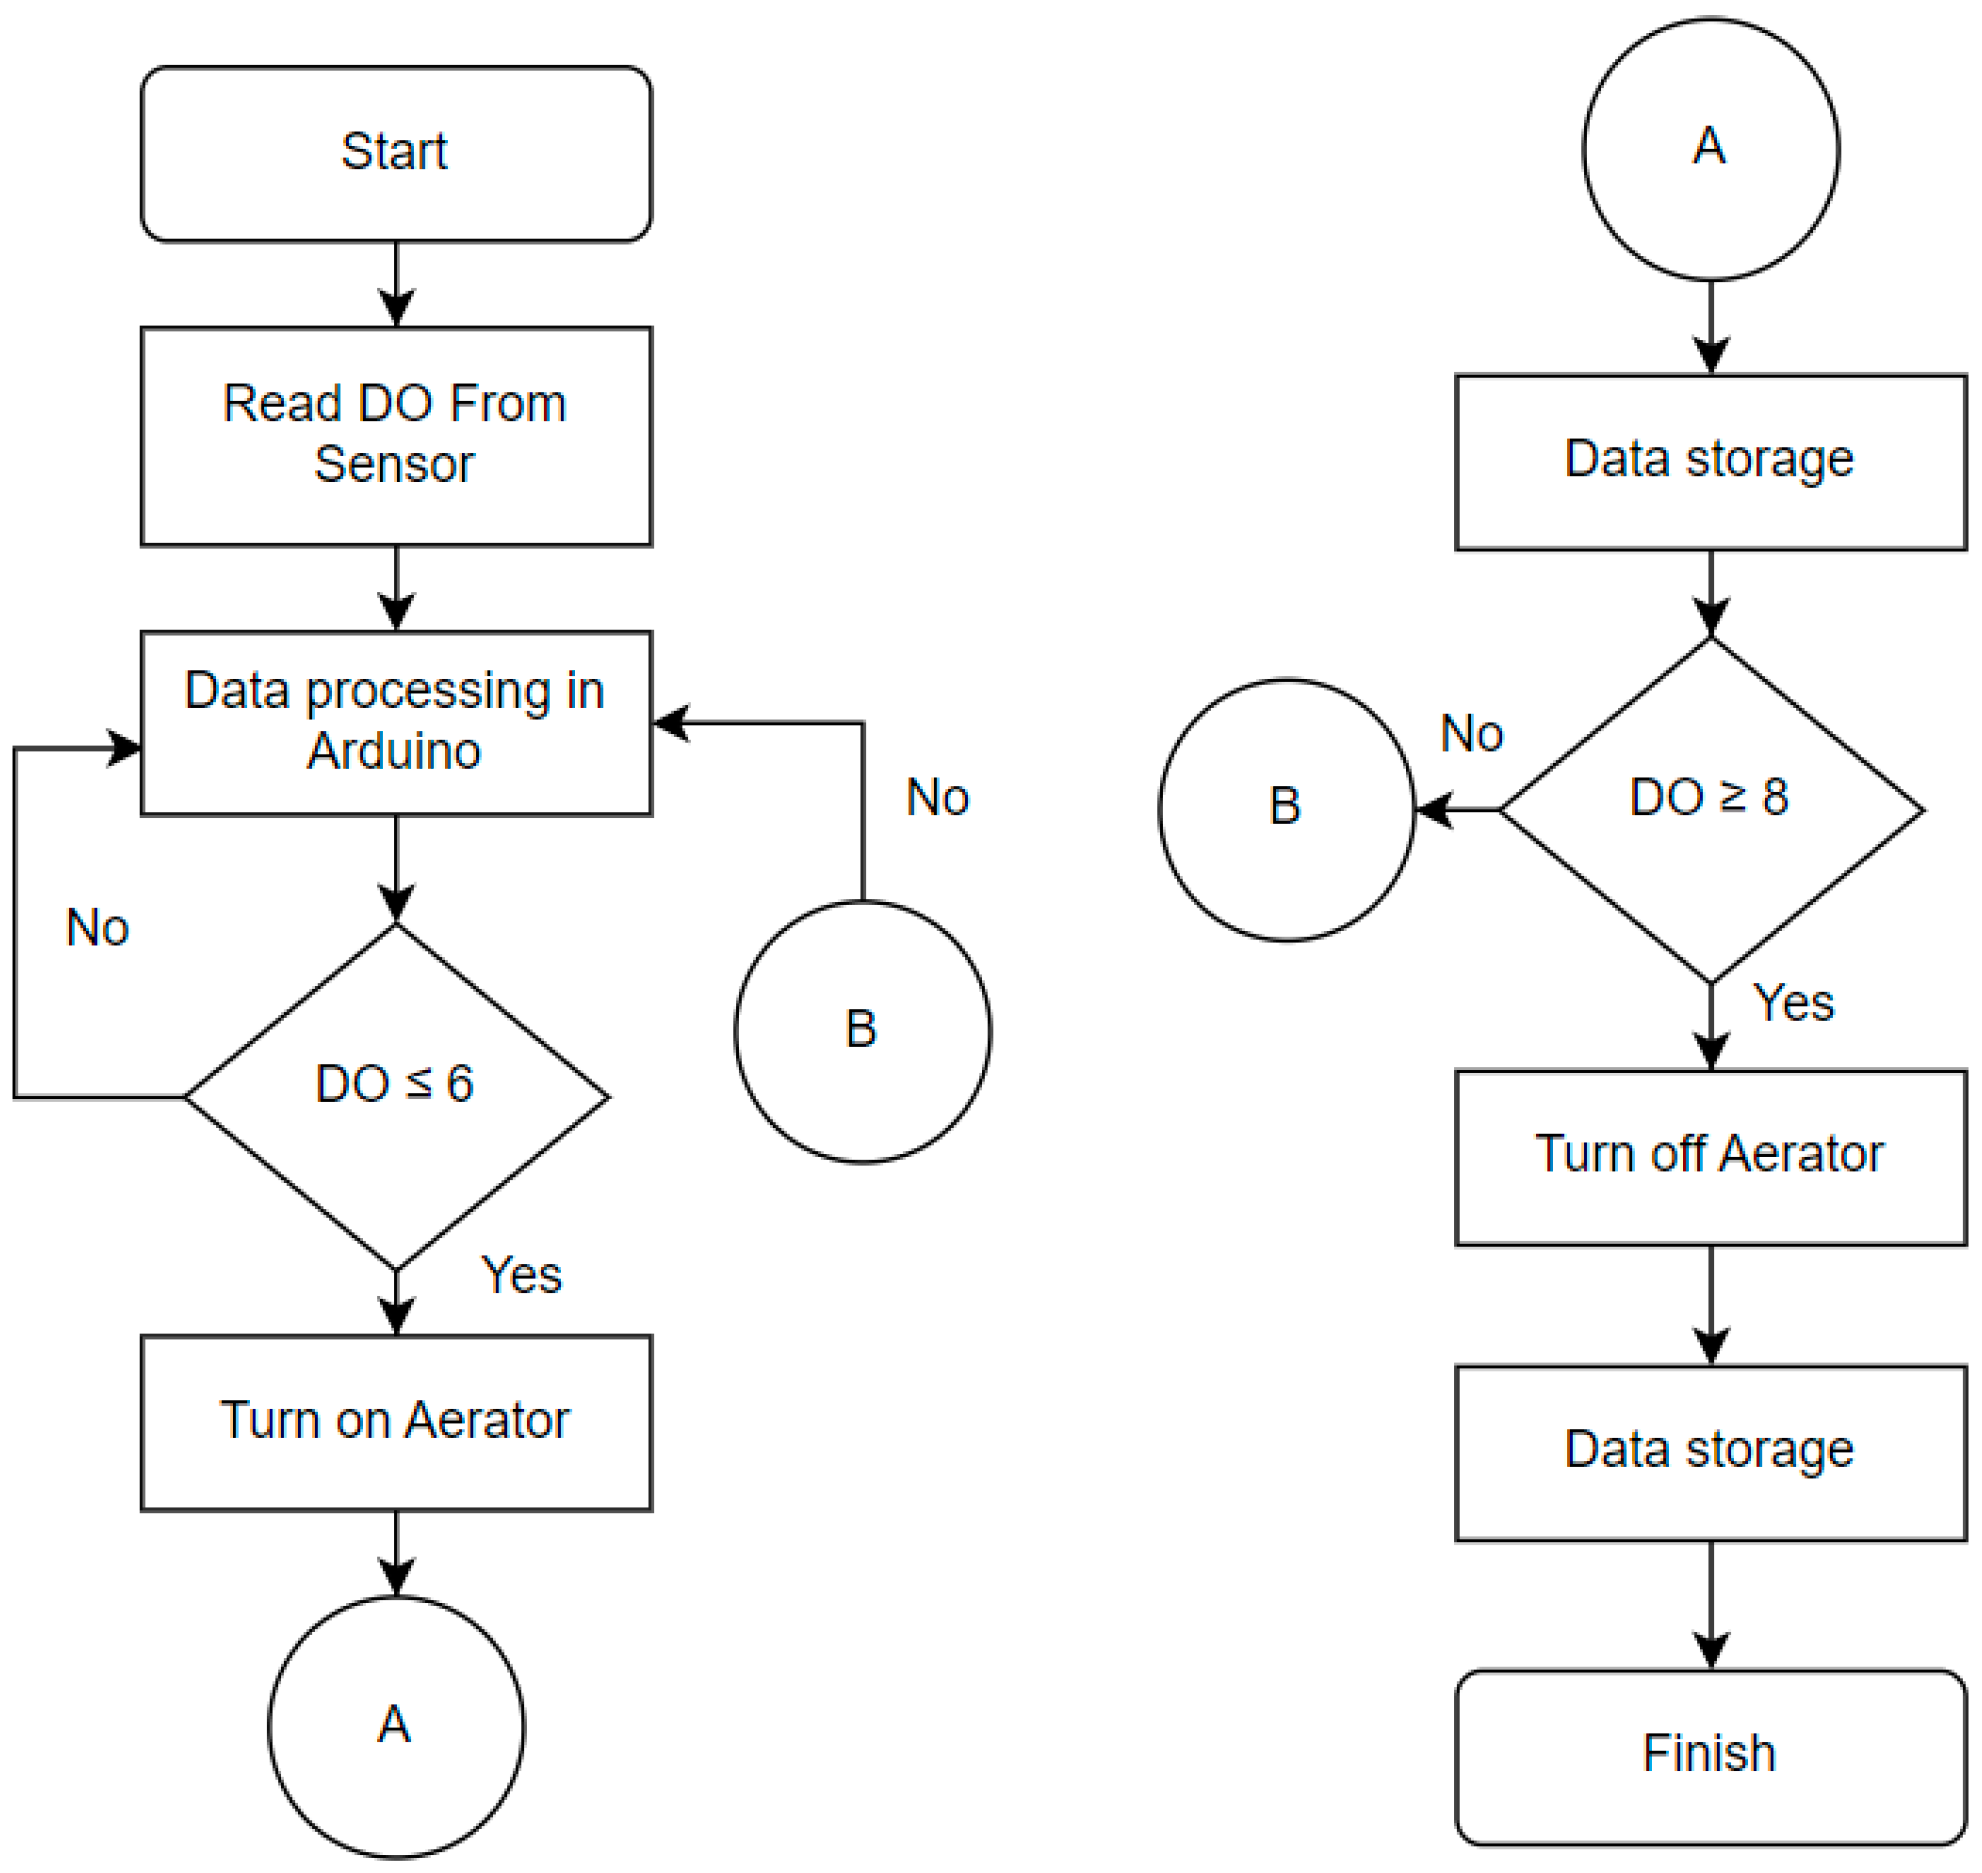
The control system utilized relay that opens and closes a switch as a result of input signal applied to coil. The normally closed (NC) of the relay is connected to AC source and the COM pin of the relay is connected to aerator pump. The input signal is the DO read from Arduino. When the DO is more than 8 mg/L, Arduino sends signal to relay then activated the magnet and pulling the contact apart, so the circuit is opened. Whereas, when the DO is less than 6 mg/L, the electromagnet is energized then attract the contact towards the NC terminal so the current flow through the circuit. The control flow chart of the system can be seen in the
Figure 3.
2.2.2. Hardware Description of IoT System
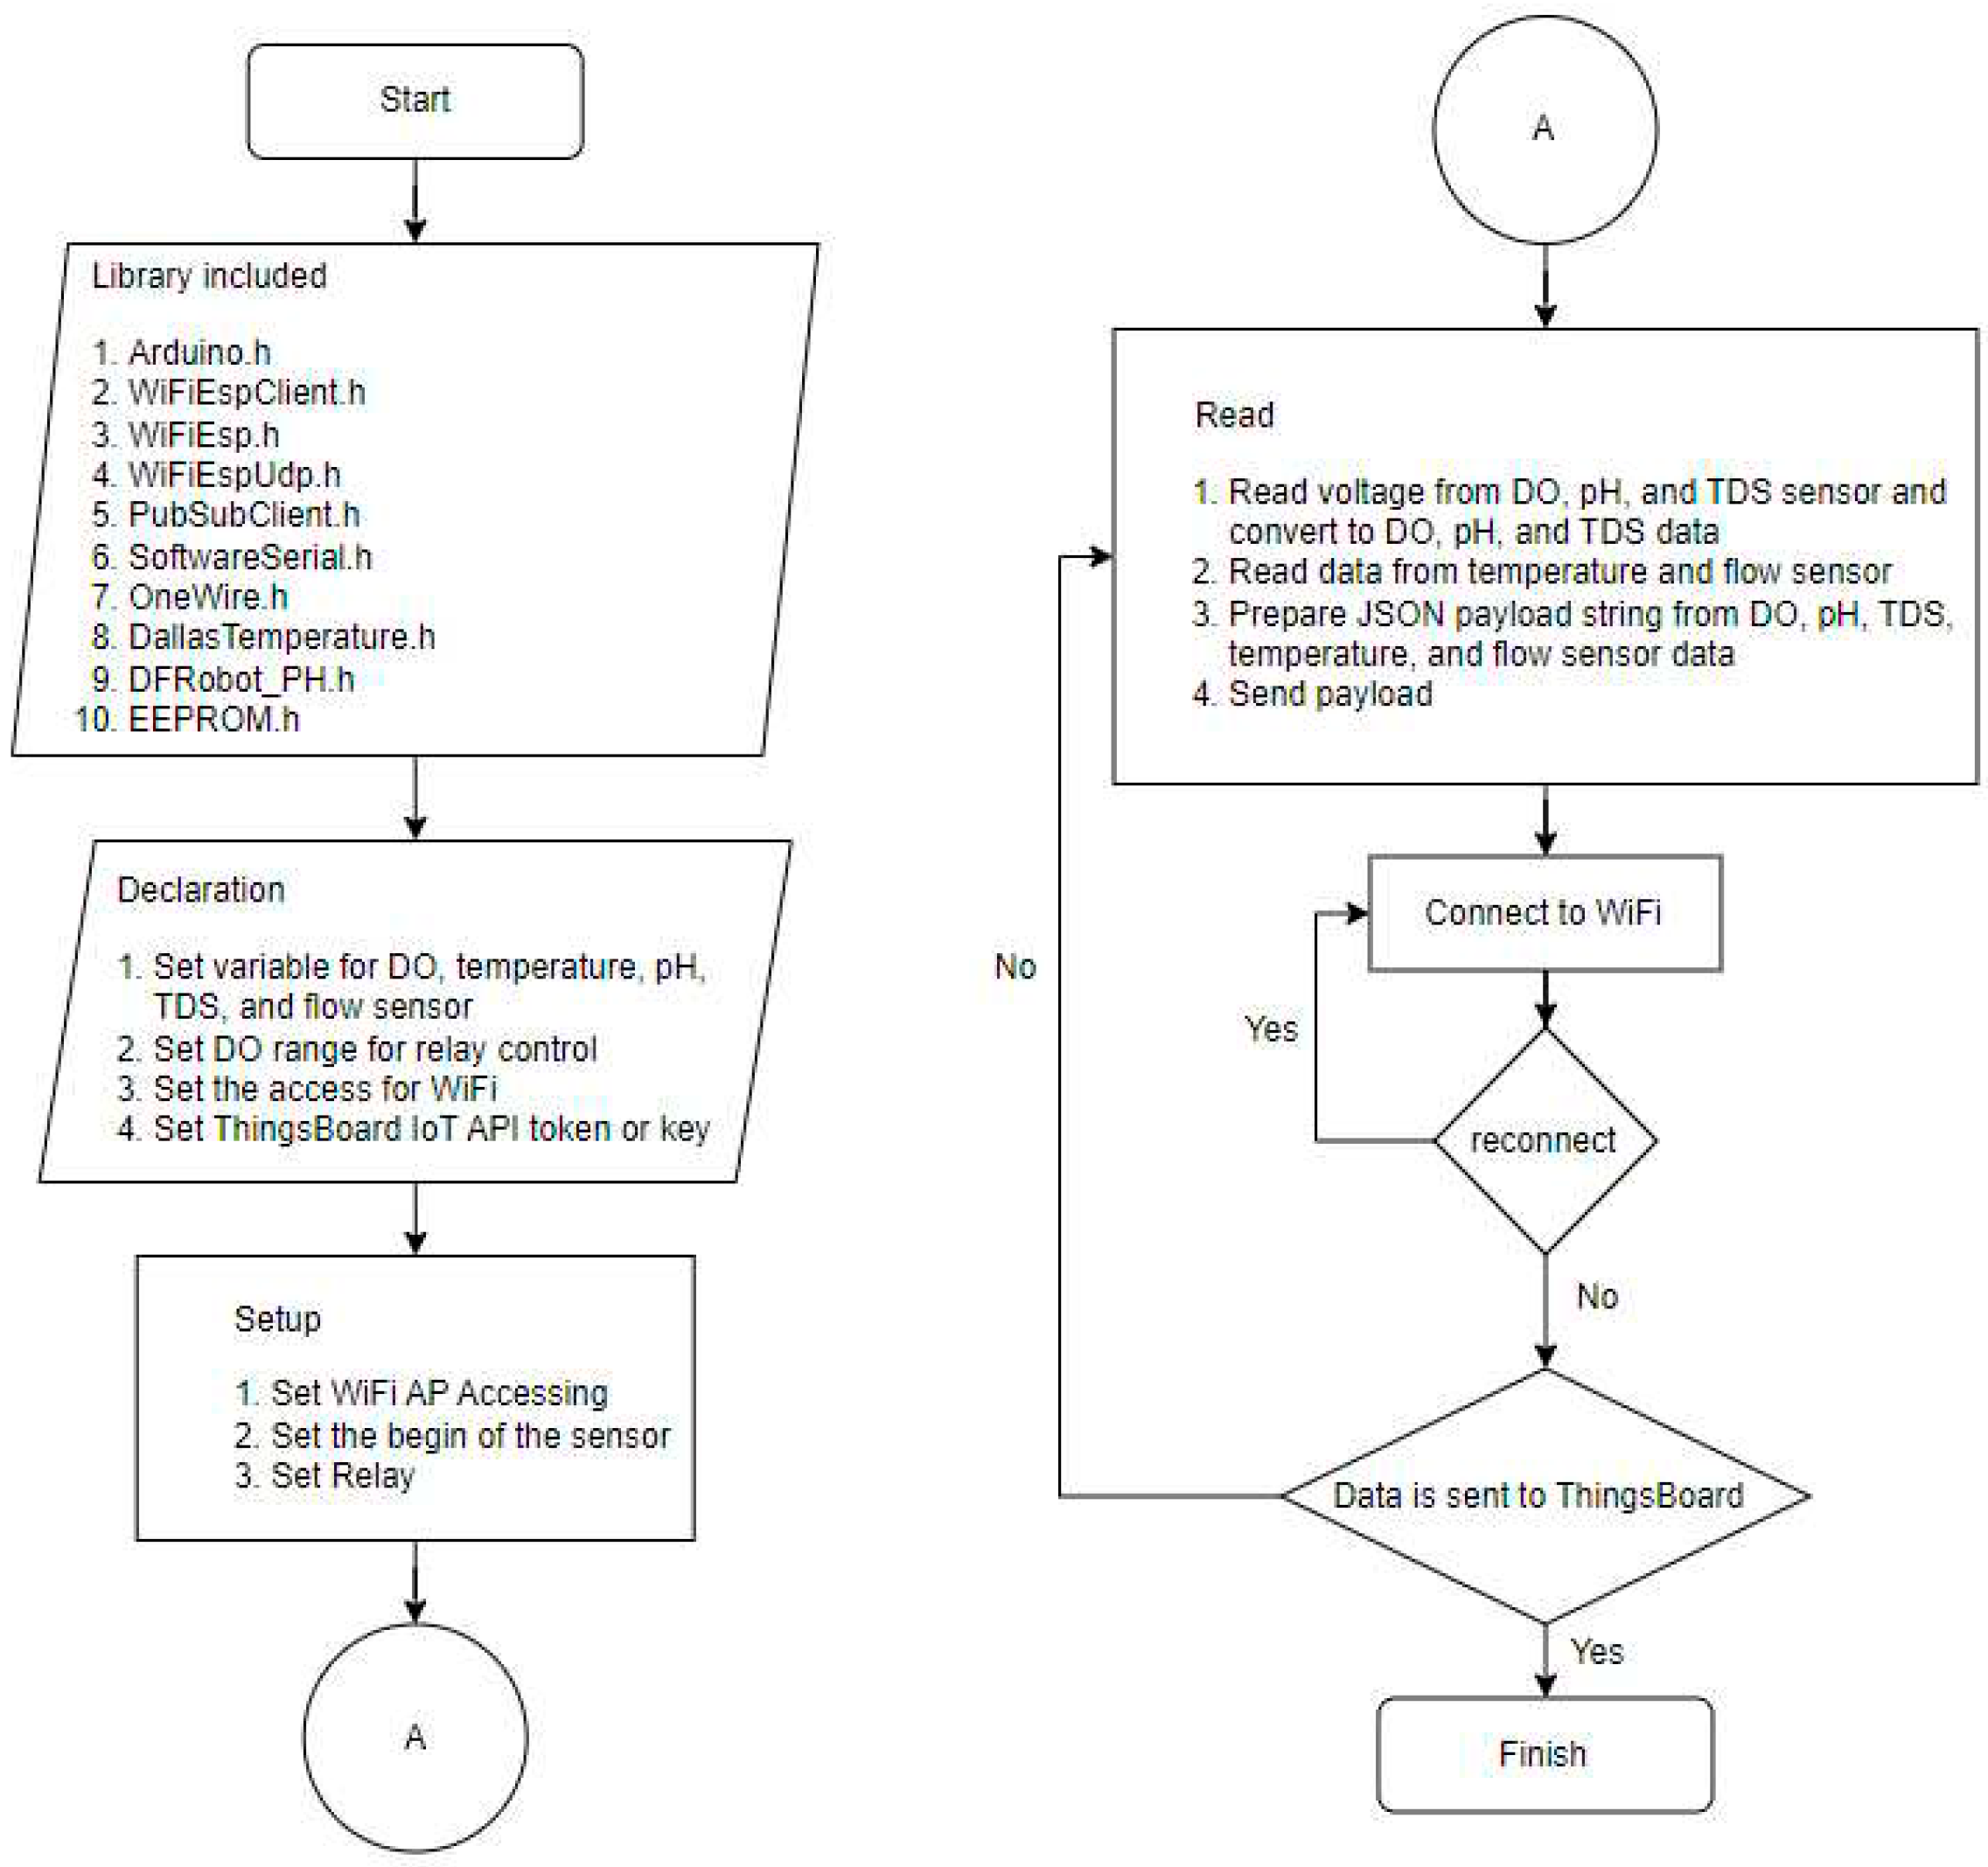
ESP-01 Wi-Fi module allows Arduino to connect to Wi-Fi network.
Figure 4 describes the algorithm on Arduino for sending data to the Thingsboard. The library was included to provide functionality then the variable of water quality sensor, DO control value, WiFi access, and the configuration access of the Thingsboard are defined and initialized. The sensor measurement data is read by Arduino and sent to the ThingsBoard IoT through Wi-Fi AP every 1 minute automatically without external interruption.
The open source Thingsboard IoT application program interface (API) provides an IoT platform to store and retrieve data from DO, temperature, pH, TDS, and flow sensor using Message Queuing Telemetry Transport (MQTT) publish-subscribe network protocol. As shown in
Figure 5, the MQTT consists of three main participants in the message exchange process which are publisher, MQTT broker, and subscriber [
27]. The publisher is the device that produce the message where in this experiment sensors and Arduino are acting as the publisher. Whereas ThingsBoard IoT platform acts as broker and subscriber which enables the message flow then receives the message.
2.2.3. Sensor Characteristics
Sensor characteristic experiment is done by compare the sensors with handheld sensors which have better accuracy. Characteristic of sensor calculated in this experiment are accuracy, precision, and error. The accuracy of DO sensor were compared with Milwaukee Mi 605 DO meter which have ± 1.5% F.S. accuracy and 0.01 mg/L resolution. DO was measured at flowrate of 0.4 L/min according to the flow rate used in the measurement. The measurement was done in biofilter and fish tank to represent the actual experiment. The same measurement points also used to test the rest of water quality sensor. For the pH sensor, the experiment was done by comparing the sensor with Milwaukee Mi 101 pH meter with ±0.02 pH accuracy and 0.01 pH resolution. While the TDS sensor was compared with Milwaukee EC59 ±2 % FS accuracy and 1 µS/cm / 1 ppm resolution and the temperature sensor were compared with Technol seven D617. All sensor measurement data was collected every 10 second for 2 minutes. The accuracy, precision, and error were calculated using Equation 5-6 based on the sensor characteristic measurement.
is standard deviation and can be calculated using Equation 8, bias can be calculated using Equation 9 with
is value from standard sensor which use as comparison, and
is average of measurement [
28].
3. MBBR Performance Evaluation
3.1. TAN Removal and Biofilm Thickness
The lab scale RAS consists of fish tank and MBBR with working volume of 24 and 15 L correspondingly. The water is circulated from the fish tank to MBBR by water pump. K1 kaldness was used as biofilm media with filling volume of 40% MBBR volume. The aeration was provided by nanobubble diffuser with bubble average diameter of 555 nm. At the beginning of experiment 1.2 g Nitrobacter and Nitrosomonas bacteria is dissolved to MBBR as the bacteria starter. Biofilm thickness was measured every 7-day using method gravimetric method [
29].
The synthesis waste generated from 0.151 g of NH4Cl and 1.51 g of glucose to produce 2 mg/L of TAN/day. The TAN concentration was measured using API test kit every day. Whereas TAN removal efficiency is calculated from the reducing TAN concentration in 1 day.
3.2. Dynamic Measurement of
The performance of bubble diffuser determines by the ability of diffuser to transfer the oxygen in the water which can be determined from
. The value can be derived from Equation 10 which is the mass balance for DO in the well mixed liquid. From the equation, dC/dt is the accumulation of oxygen rate in the liquid phase, OTR is oxygen transfer rate from gas to the liquid, and OUR is oxygen uptake rate by the microorganism.
One of the methods to measured DO transfer in the water is using dynamic method based on the absorption or desorption of oxygen. After the change of inlet, resulting dynamic change in the DO concentration. The integration of Equation 1 where OUR=0 was used to analyzed the dynamic change of DO concentration as written in Equation 11. From the equation,
is oxygen transfer volumetric (min
-1), C* is DO saturation concentration, C
1 is DO at time t
1, and C
2 is DO at time t
2.
The dynamic method consists of desorption where oxygen is supplied until reached the saturation. Then oxygen is eliminated from the liquid using nitrogen until DO concentration above the critical concentration which is 0.5 mg/L. The other step of dynamic method is absorption where air is in supply until the DO saturation is reached [
30]. The desorption and absorption method can be expressed in Equation 12 and Equation 13 respectively. Where
is DO concentration at the time t. In both steps,
can be determined from the slope of the ln f(
) vs. time graph.
4. Result and Discussion
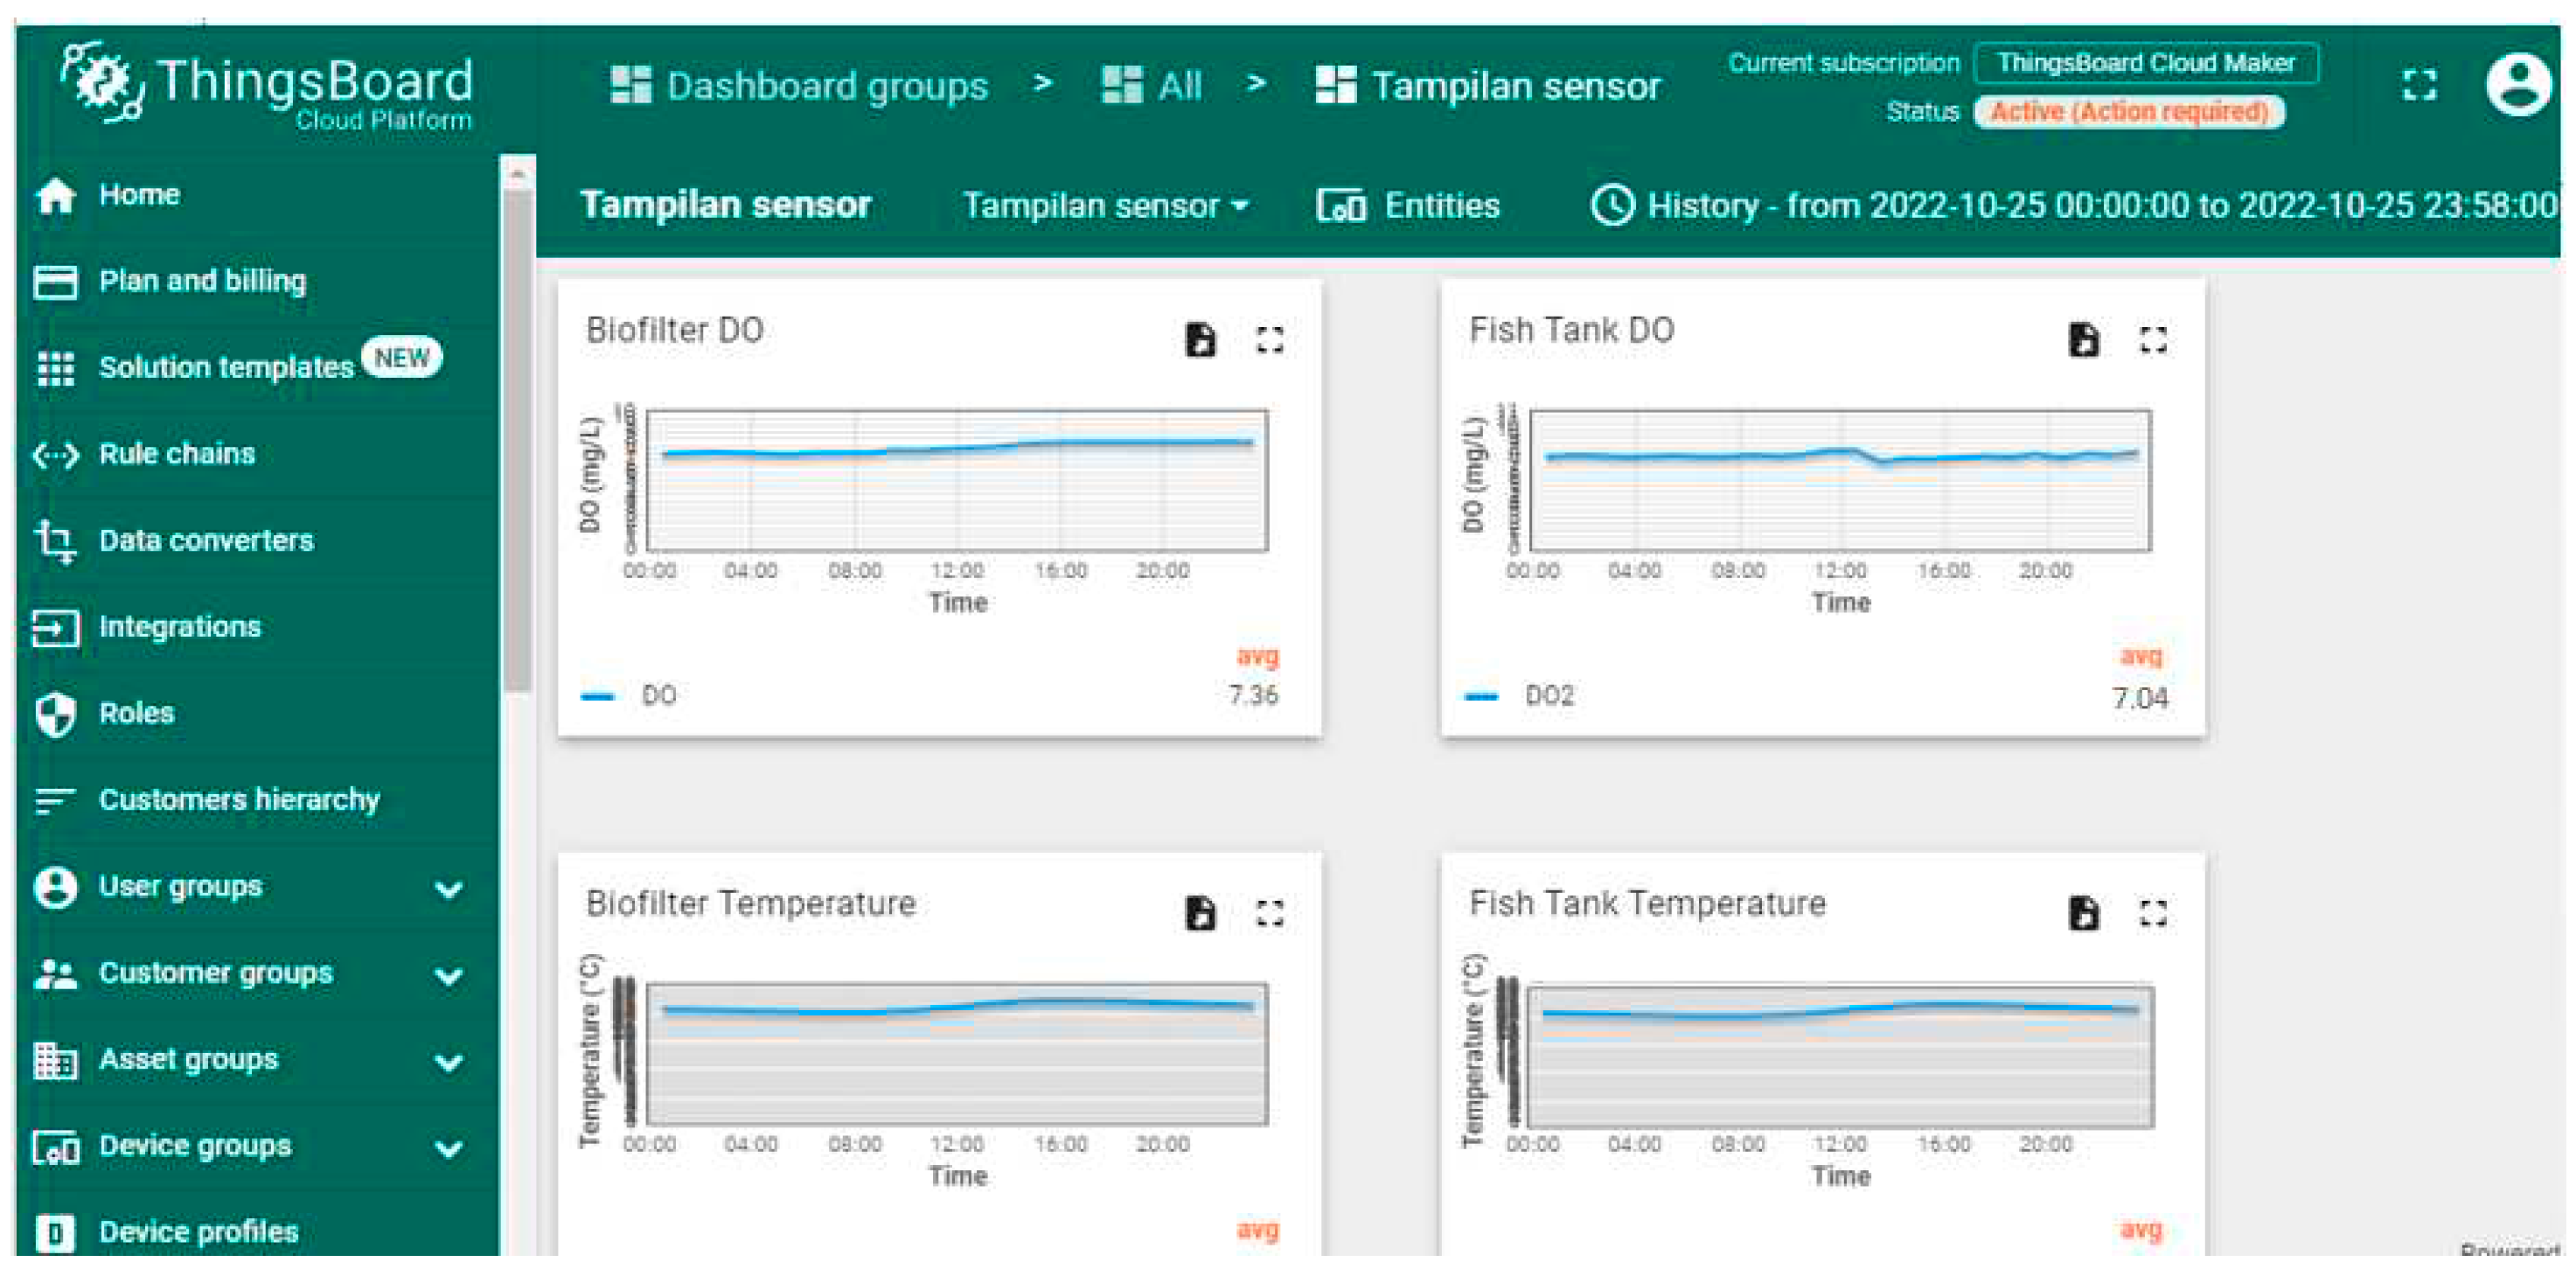
The monitoring of DO, temperature, pH, TDS is carried out through Thingsboard IoT platform. The display can be accessed via the dashboard menu on the thingsboard. The vertical line of the graph on the Thingsboard shows measurement data such as DO concentration in mg/L, pH, temperature in
oC, and TDS in mg/L. Whereas the horizonatal line shows the time interval. The data in Thingsboard is displayed in real time but also can be accessed correspond with the required time span needed.
Figure 6 shows the monitoring display data in 1 day with grouping interval of 5 minutes. The monitoring data from Thingsboard can be converted to excel and downloaded for analysis.
4.1. Water Quality Sensor Characteristic
The water quality sensor characteristic is listed in
Table 1. The DO sensor measurement on the biofilter and fish tank resulted good accuracy and precision with error <5%. Likewise, the accuracy and precision of pH sensor in biofilter is high, with error ±0.84. The value is represent the sensor consistency in the measurement. Meanwhile an error of >5% is generated from pH sensor in the fish, but the accuracy of the sensor still within the permissible limits for water quality measurements (<10%) [
31].
4.2. Result of the measurement
The measurement of
measurement was carried out without the presence of bacteria in suspension before bacterial growth experiment. The system can be used for
measurement because the measuring DO concentration data is sent every 1 minute. So that, the
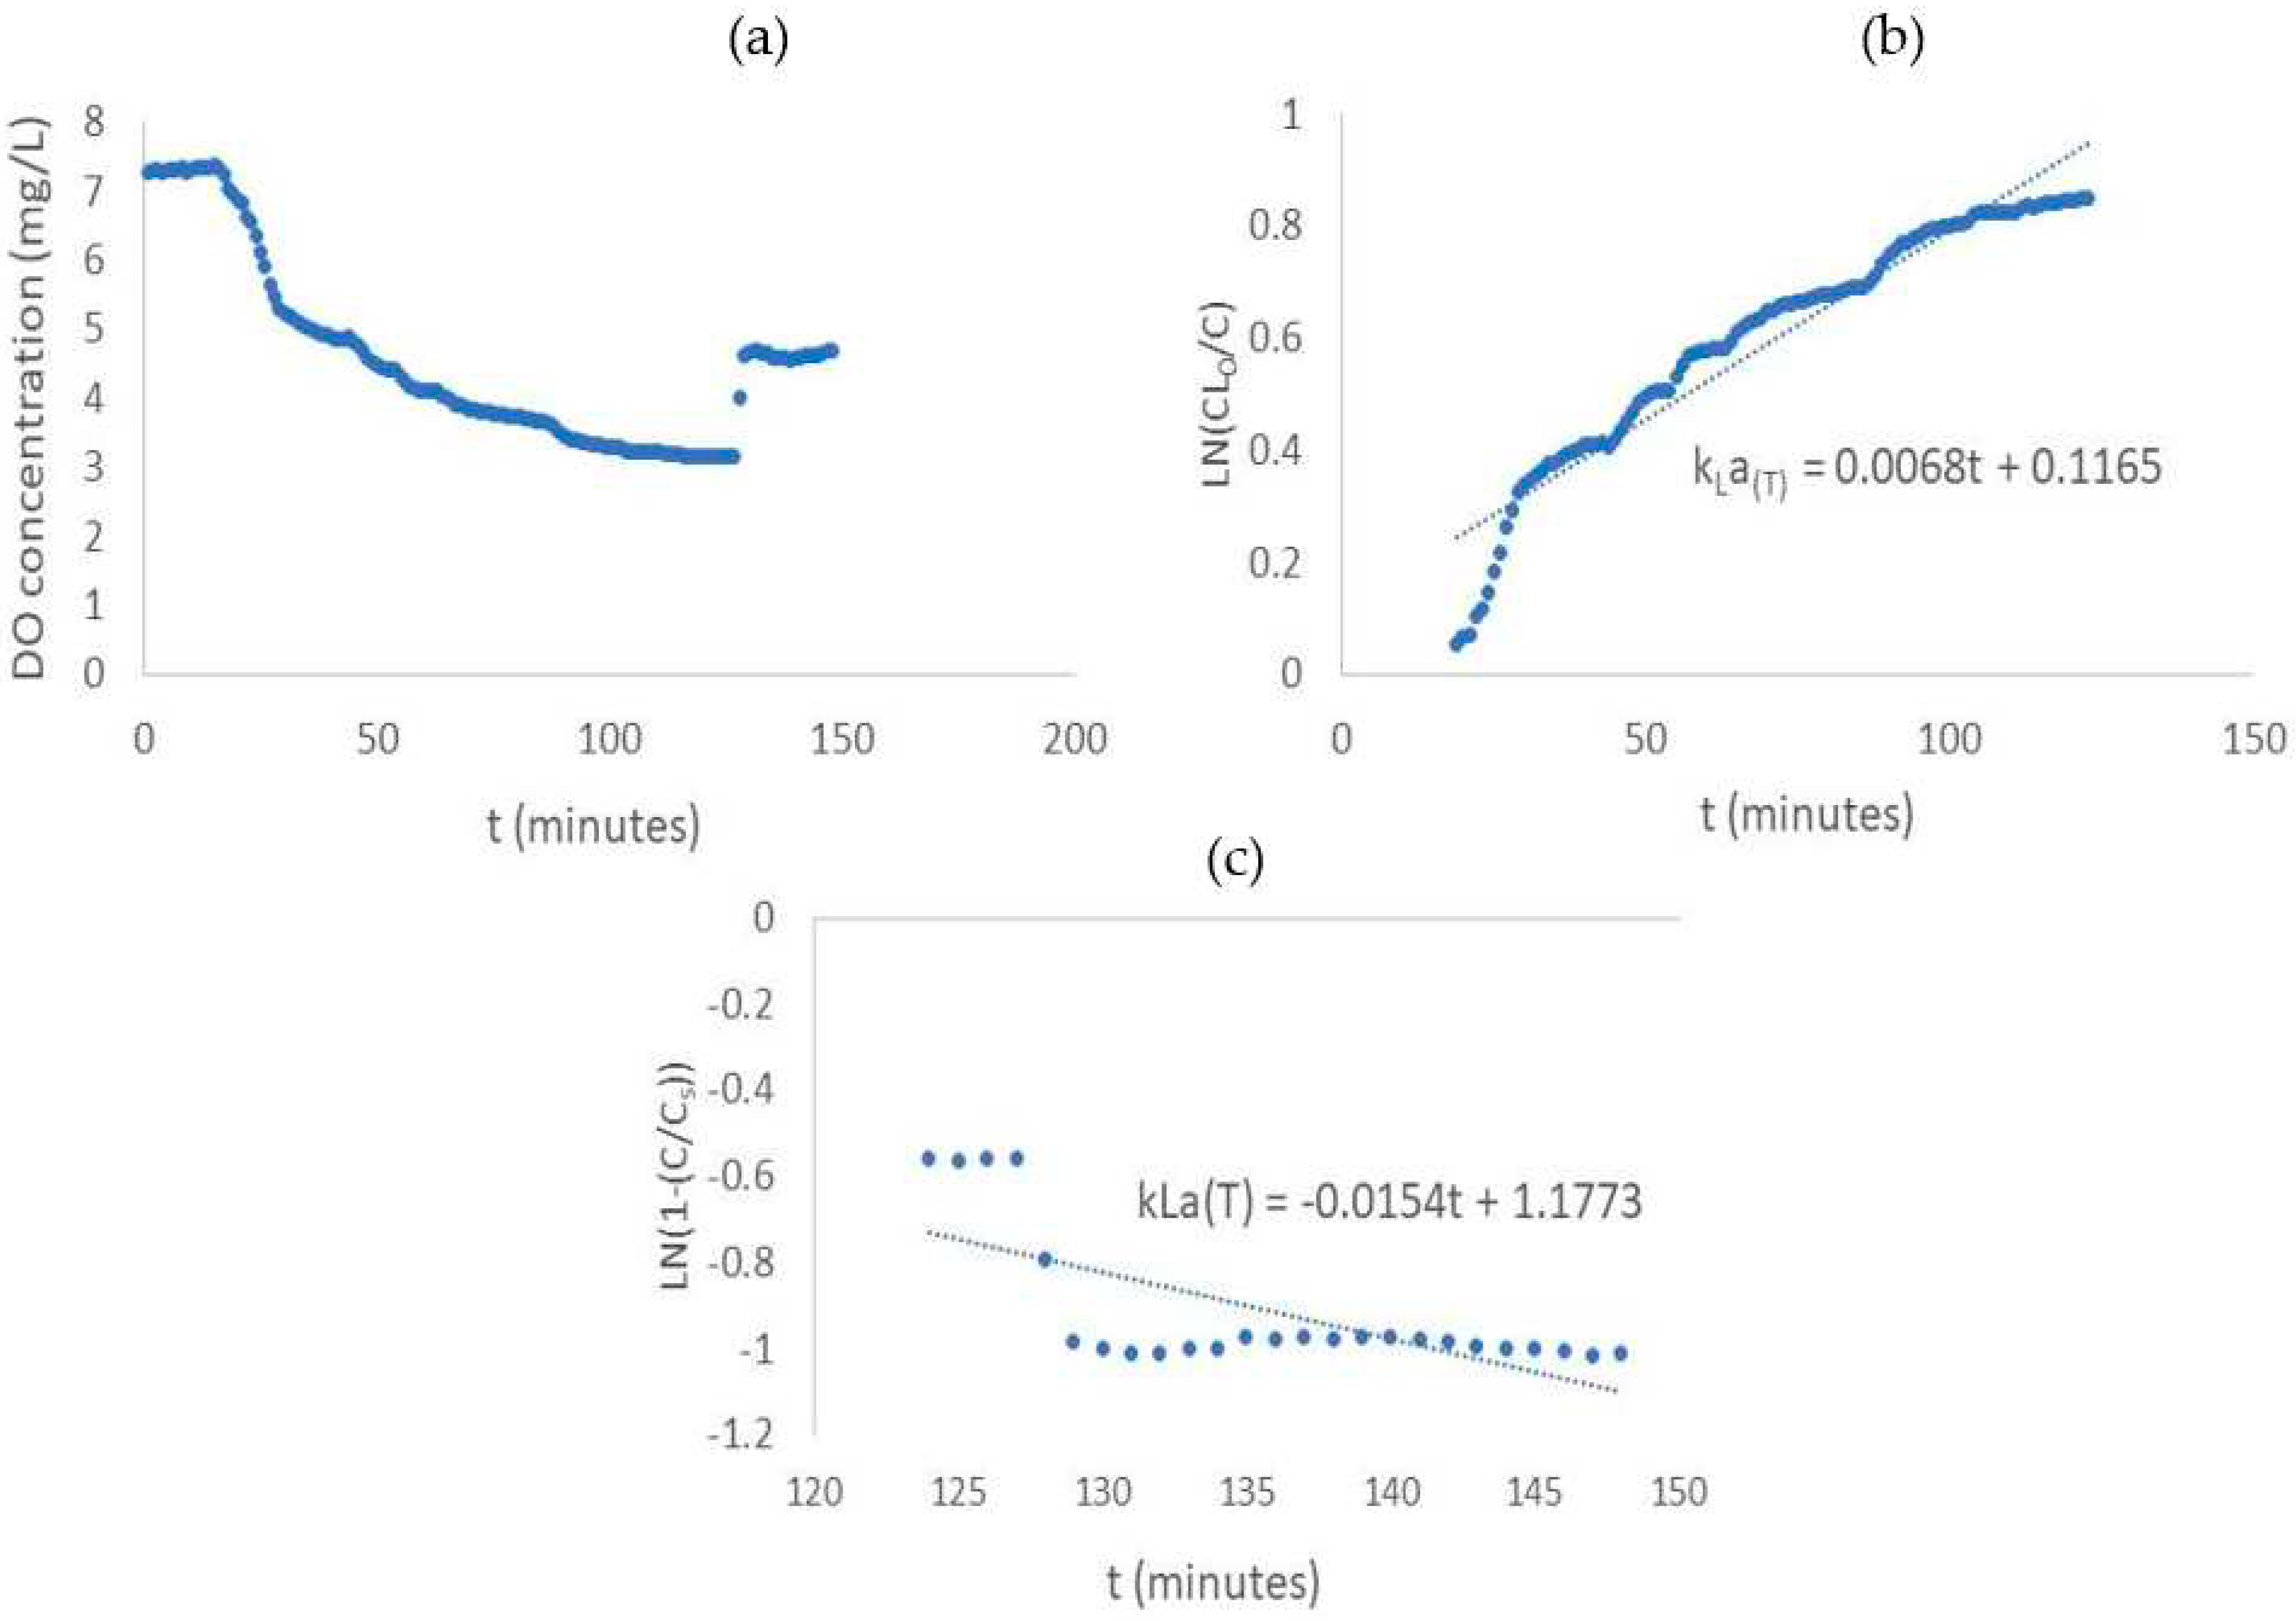
can be analyzed more accurately. The plot and result of
measurement can be seen in
Figure 7 and
Table 2. The resulting
desorption from the experiment is 0.0068 min
-1, while for
is 0.0154 min
-1. The high value of
indicates a large oxygen transfer so that the DO the increasing concentration of DO can be achieved faster [
32].
In the experiment of biofilm growth,
was measured every week with the bacteria inside the suspension or liquid. As can be seen in
Table 2, the
is decreased compare with the
measured in liquid without bacteria. This is happened because bacteria in liquid influence the liquid resistance so decreasing the oxygen transfer. Aerobic bacteria act as interfacial blanketing that reduce the contact between gas-liquid interface [
33]. The
is increasing in week 2 because the bacteria begin to attach at the surface of biofilm media. However, the
is decreasing in week 3 because the high TAN concentration in liquid subsequently increasing resistance in the gas-liquid interface. The highest
resulting in week 5, this related with the optimum performance of biofilm, so that the TAN in the system can be degraded and the gas-liquid resistance is decreasing.
4.3. Control System
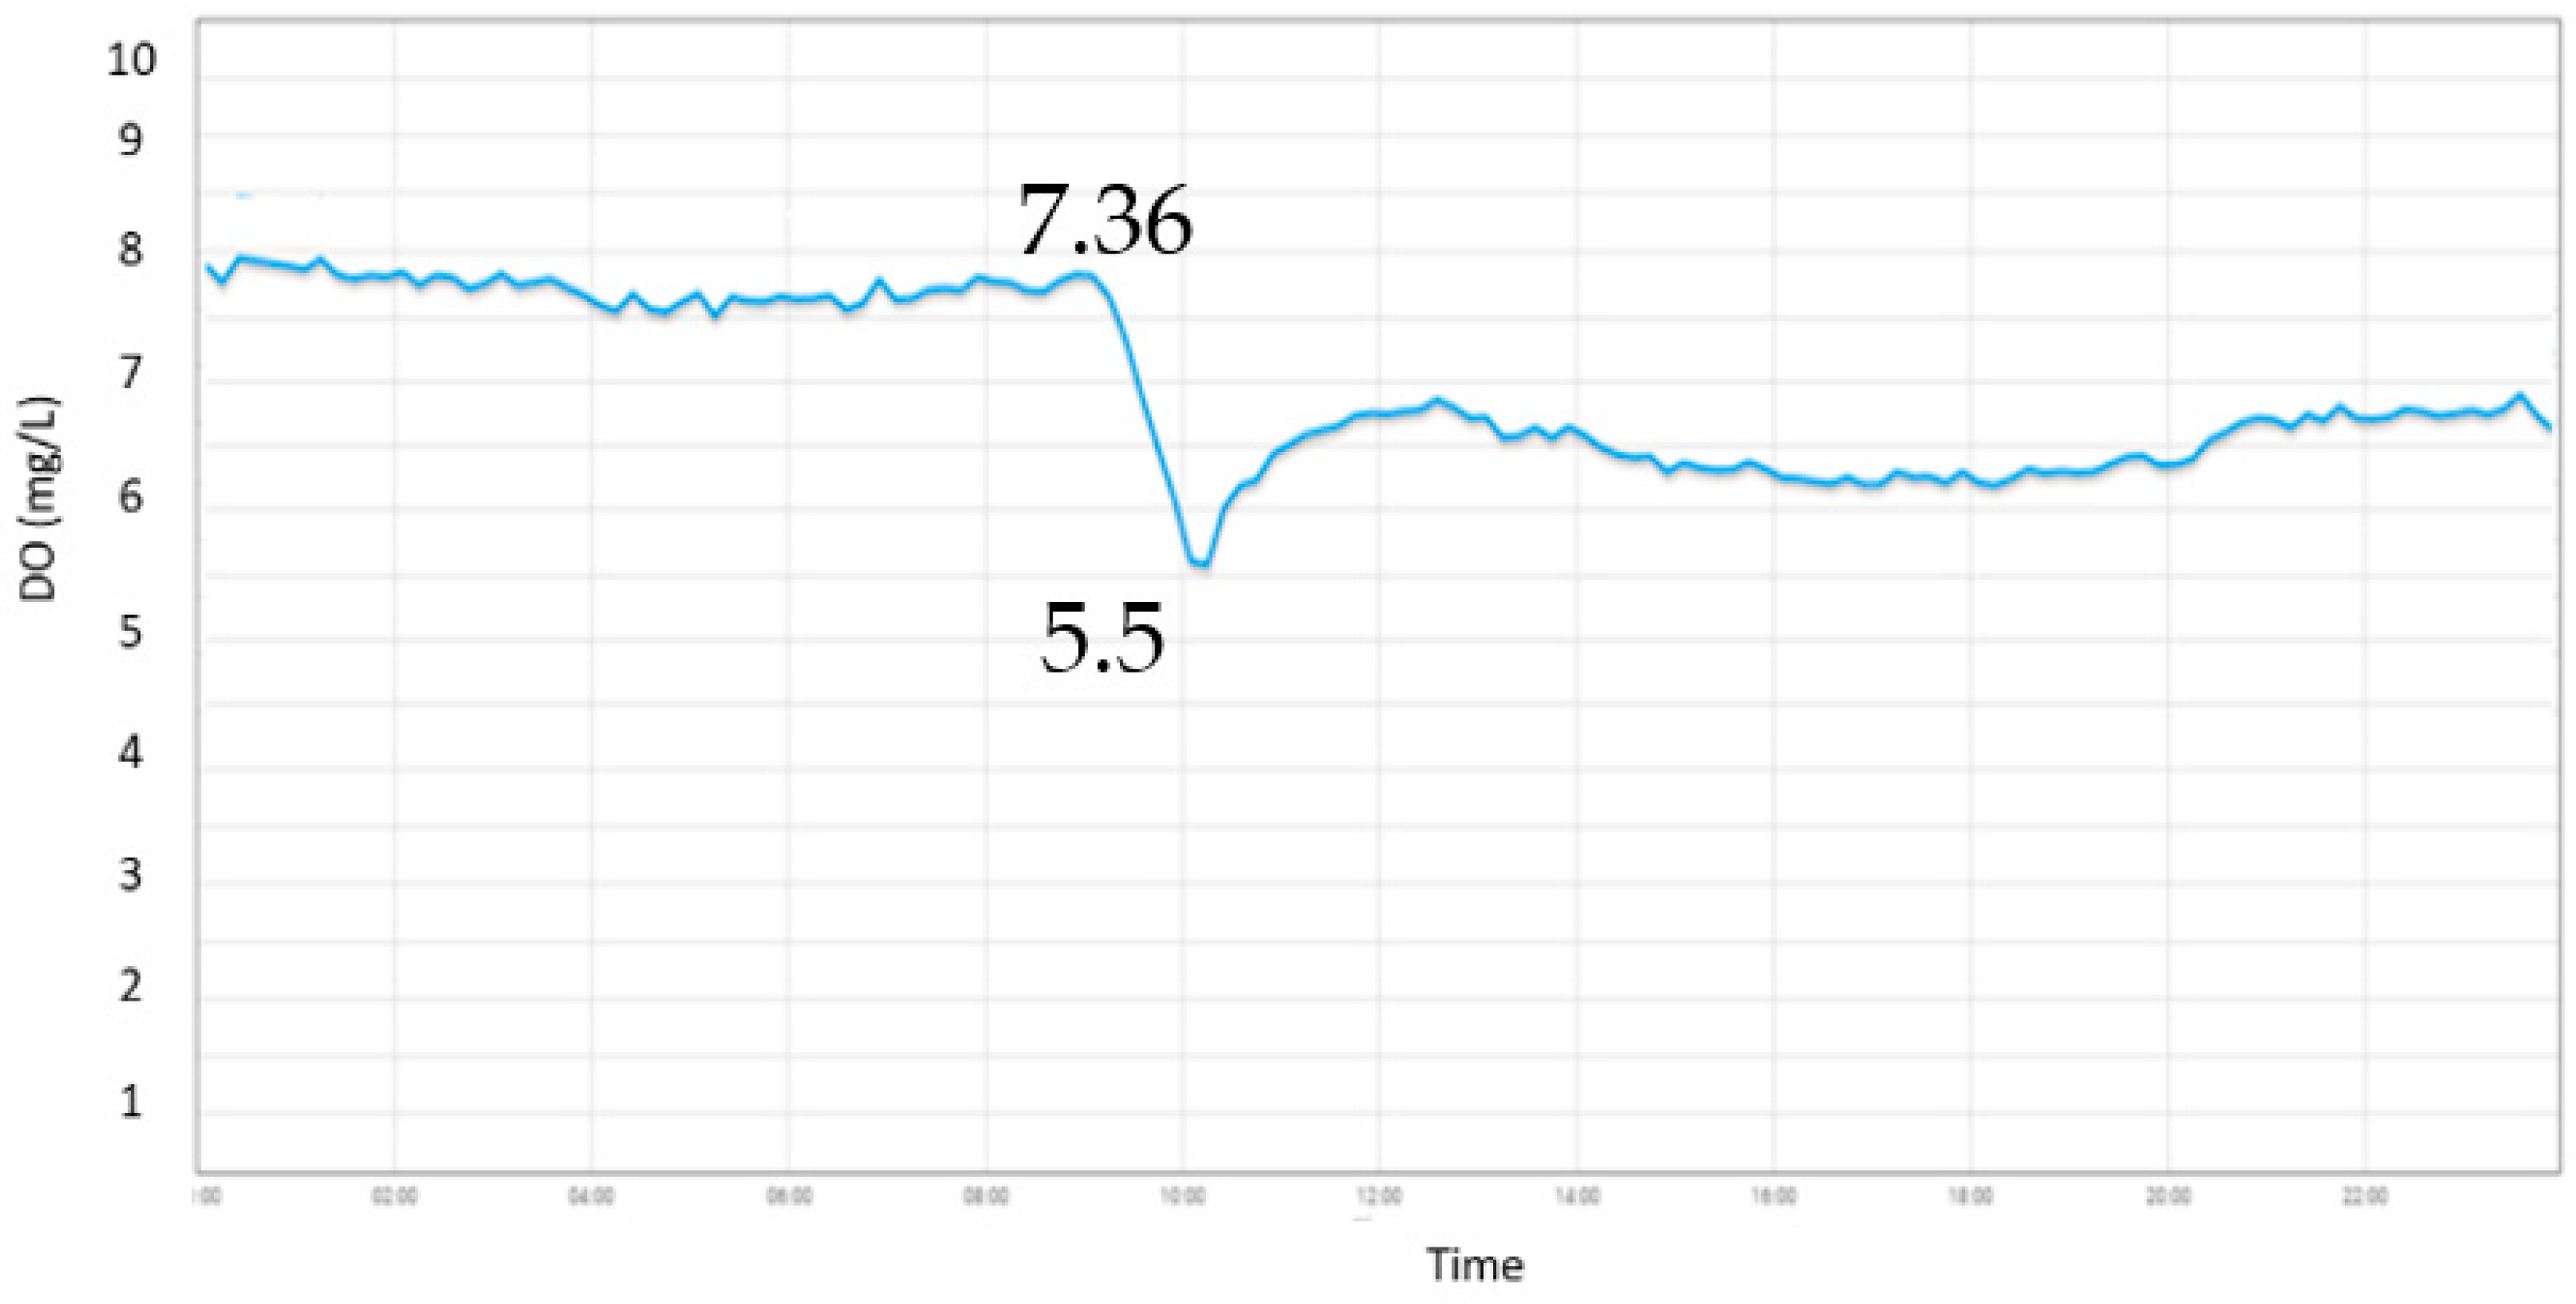
Figure 8 shows the system with aeration pump on-off control., The aeration pump turns off when reach the DO value of 8 mg/L then drop until 5.5 mg/L before turning on automatically. The rise time of the system has reached 7.36 mg/L when the aeration pump was turn on. The value represents how fast the system reaching the high value. The time needed by the system to reach steady state is 2 minutes. The steady state of the system maintained at around 7.3 mg/L.
4.4. Water Quality vs Film Thickness
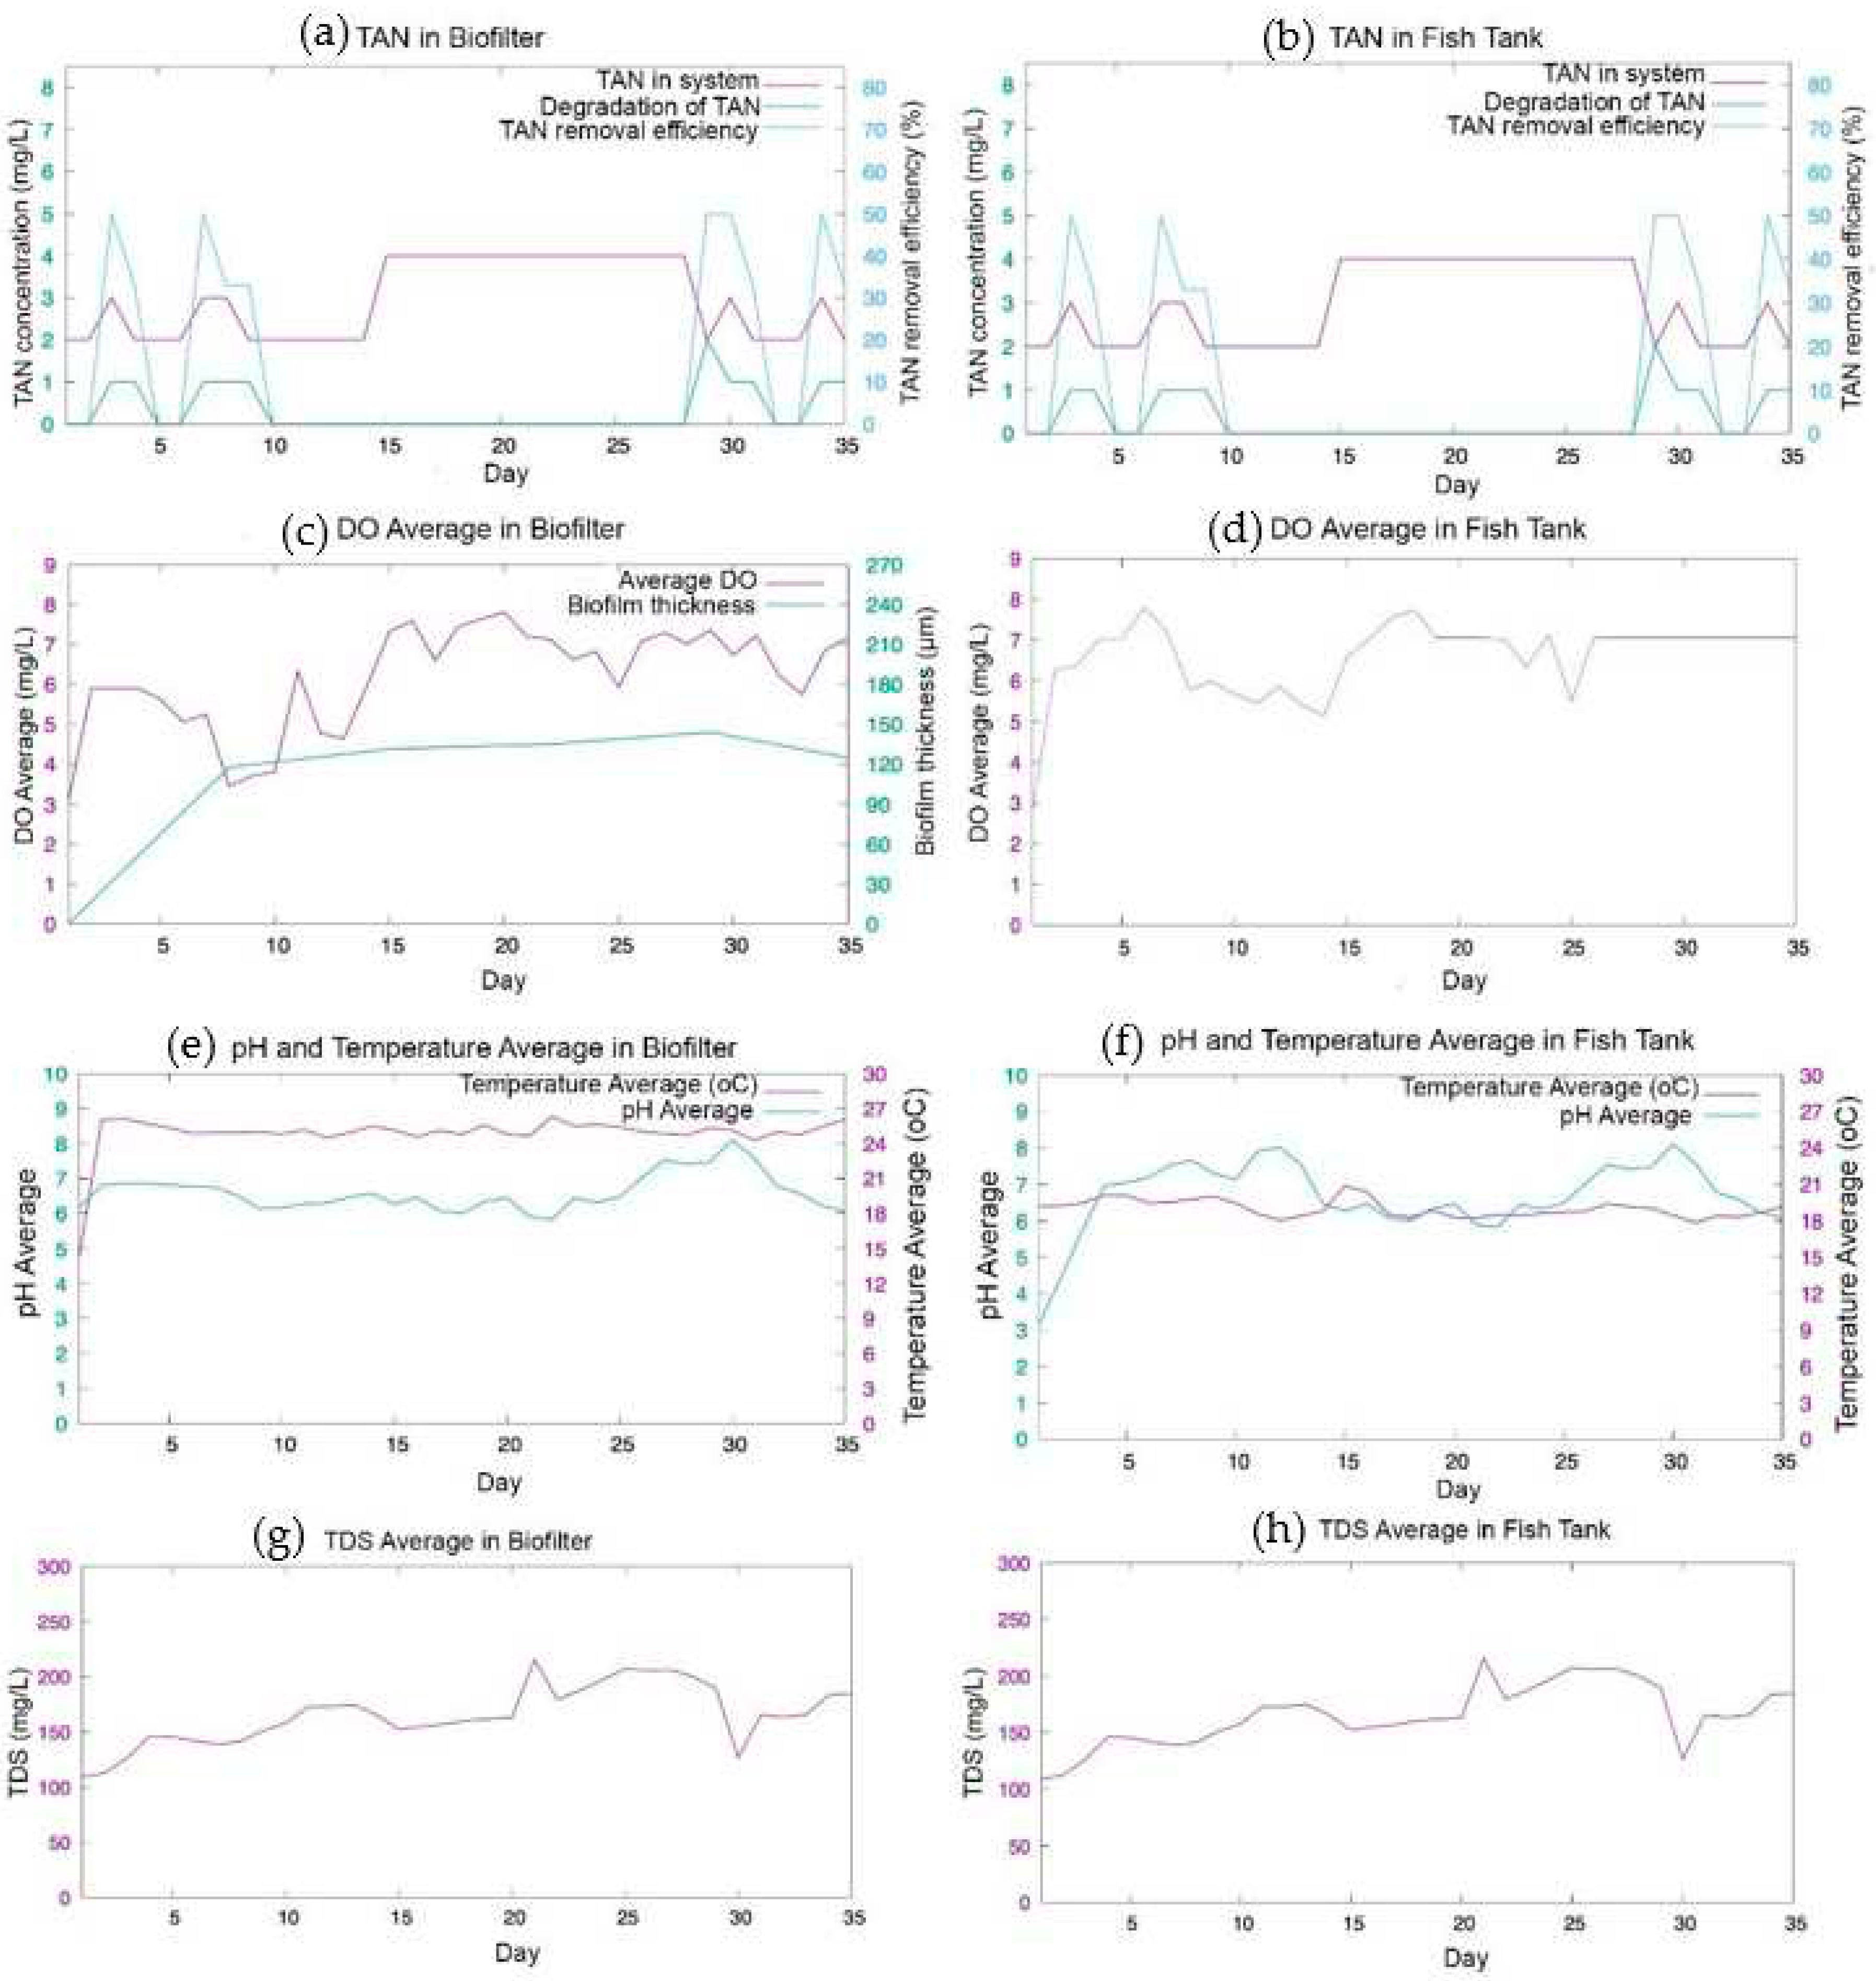
The experiment was carried out for 5 weeks to investigate the water quality monitoring and control on biofilm growth and TAN removal. The measurement data were plot in
Figure 9. At the first week, the MBBR showed good performance in TAN reduction. The highest TAN removal on first week reached 50% at day 2 and 6. The TAN reduction is influenced by the thickness of the biofilm, at first week the biofilm thickness reached 98 µm. Then, the TAN concentration was not decrease in week 3 and week 4 as shown in
Figure 9 (a) and (b). The stagnation can be caused by a slight increase in the biofilm thickness of 109.38 µm, 112.50 µm, and 119.88 µm for week 2, 3 and 4 correspondingly. However, the TAN concentration was decreased at the beginning of week 5. The TAN removal efficiency reached 50% on day 28
th with TAN concentration reduced 2 mg/L. The high removal efficiency can be caused by stable thickness of biofilm of 104 µm.
The biofilm growth occurs in a cycle, from reversible attachment, irreversible attachment, maturation, and detachment stage [
34,
35]. At first week, the reversible attachment stage of biofilm growth was occurred. Bacteria begin to attach on the surface of K1 Kaldness media. In this stage, bacteria need nutrition resulted in reduction of TAN concentration [
36]. In the week 2 and 3, the biofilm was in irreversible attachment stage and the beginning of maturation stage. In this stage bacteria produced Extracellular Polymers Substance (EPS) to support the structure of the biofilm. In this stage, the bacteria in the biofilm enter a period of starvation to increase the adhesion and surface hydrophobicity of the biofilm. The starvation period of bacteria leads to the TAN, which is a nutrient for bacteria in biofilms, not to be consumed [
37]. At the week 4, the biofilm enters maturation stage, which resulted in maximum thickness. However, the TAN is not decrease in week 5. Whereas, at the week 5, the TAN removal efficiency was reduced due to biofilm detachment stage with the biofilm thickness of 119.88 µm. Higher TAN removal efficiency was achieved when the DO concentration at range of 5-7.36 mg/L. Highest concentration DO of 8.53 mg/L was resulted in day 19 but did not give significant effect on the TAN removal. Based on study on the effect of oxygen concentration to biofilm growth, the nitrification is effective at the DO concentration of 2 mg/L- 8 mg/L [
19].
5. Conclusions
The IoT monitoring system and control has been developed to maintain the water quality for biofilm growth. The water quality sensor showed a good precision >95% except the DO sensor in the fish tank. The result of accuracy is mostly below 95% but this is still within the permissible limit. The water quality such as DO, pH, temperature, and TDS value are in safe range. The DO concentration was maintained at a range of 5-7.8 because of the on-off control. Therefore, the biofilm achieved optimum thickness of 119.88 µm and consequently received optimum performance of TAN degradation 50%.
Author Contributions
Conceptualization, I.M.J., F.F. W.H., C.P., U.S. and P.A.S.; methodology, P.A.S, W.H., C.P., U.S. and I.M.J.; design system and construction, P.A.S.; data mining, P.A.S.; writing—original draft preparation, P.A.S; writing—review and editing, F.F., W.H., C.P., U.S. and I.M.J; supervision, F.F. and I.M.J.; funding acquisition, I.M.J. All authors have read and agreed to the published version of the manuscript.
Funding
The author acknowledges the scholarship given to Putu Ayustin Suriasni from Beasiswa Unggulan Pascasarjana Padjadjaran (BUPP) with contract number no 2203/UN6.3.1/PT.00/2022 and this research was financially supported by ALG project, Universitas Padjadjaran, Bandung, Contract No:1959/UN6.3.1/PT.00/2023
Conflicts of Interest
The authors declare no conflict of interest.
References
- FAO, "The State of World Fisheries and Aquaculture 2022 Towards Blue Transformation," FAO, Rome, 2022.
- Hutchinson, W.; Jeffrey, M.; O’Sullivan, D.; Casement, D.; Clarke, S. Recirculating Aquaculture Systems Minimum Standards for Design, Construction and Management, 1st ed.; Inland Aquaculture Association of South Australia, South Australia, Australia, 2004, 1-70.
- Mook, W.; Chakrabarti, M.; Aroua, M.; Khan, G.; Ali, B.; Islam, M.; Hassan, M. A. Removal of total ammonia nitrogen (TAN), nitrate and total organic carbon (TOC) from aquaculture wastewater using electrochemical technology: A review. Desalination 2012, 285, 1–13. [CrossRef]
- Bernet, N.; Dangcong, P.; Delgenès, J.-P.; Moletta, R. Nitrification at Low Oxygen Concentration. J. Environ. Eng. 2001, 127, 266-271. [CrossRef]
- K. Havlíček, M. Nechanická, Lederer, T.; Sirková, B.K. Analysis of nitrifying bacteria growth on two new types of biomass carrier using respirometry and molecular genetic methods. Ecotoxicol. Environ. Saf. 2021, 225, 1-11. [CrossRef]
- Piculell, M.; Welander, P.; Jönsson, J.; Welander, T. Evaluating the Effect of Biofilm Thickness on Nitrification in Moving Bed Biofilm Reactors. Environ. Technol. 2016, 37:6, 732-743. [CrossRef]
- Tsitouras, A.; Al-Ghussain, N.; Butcher, J.; Stintzi, A.; Delatolla, R. The microbiome of two strategies for ammonia removal with the sequencing batch moving bed biofilm reactor treating cheese production wastewater. Appl Environ Microbiol. 2023, 27, e0150723. [CrossRef]
- Gapes, D.; Keller, J. Impact of oxygen mass transfer on nitrification reactions in suspended carrier reactor biofilms. Process Biochem. 2009, 44:1, 43-53. [CrossRef]
- Islam, M.M.; Kashem, M.A.; Alyami, S.A.; Moni, M.A. Monitoring water quality metrics of ponds with IoT sensors and machine learning to predict fish species survival, Microprocess. Microsyst. 2023, 102, 104930. [CrossRef]
- Shafique, K.; Khawaja, B.A.; Sabir, F.; Qazi, S.; Mustaqim, M. Internet of Things (IoT) for Next-Generation Smart Systems: A Review of Current Challenges, Future Trends and Prospects for Emerging 5G-IoT Scenarios. IEEE Access 2020, 8, 23022-23040. [CrossRef]
- Lin, J.-Y.; Tsai, H.-L.; Lyu, W.-H. An Integrated Wireless Multi-Sensor System for Monitoring the Water Quality of Aquaculture. Sensors 2021, 21, 8179. [CrossRef]
- Billah, M.M.; Yusof, Z.M.; Kadir, K.; Ali, A.M.M.; Ahmad, I. Quality Maintenance of Fish Farm: Development of Real-time Water Quality Monitoring System. In Proceedings of the 2019 IEEE 6th International Conference on Smart Instrumentation, Measurement and Applications (ICSIMA 2019), Kuala Lumpur, 2019.
- Naj, N., Sanzgiri, A. An IoT based Real-Time Monitoring of Water Quality System. Asian J. Converg. Technol. 2021, 7(2), 44-51. [CrossRef]
- Danh, L.V.Q.; Dung, D.V.M.; Danh, T.H.; Ngon, N.C. Design and Deployment of an IoT-Based Water Quality Monitoring System for Aquaculture in Mekong Delta. Int. J. Mech. Eng. Robot. Res. 2020, 9, 1170-1175. http://dx.doi.org/10.18178/ijmerr.9.8.1170-1175.
- Zhang, Z.; Mao, W.; Wang, Z.; Tan, X.; Wu, F.; Wang, D.; Fang, X. Development of remote monitoring system for aquaculture water quality based on Internet of Things. IOP Conf. Ser.: Mater. Sci. Eng. 2020, 768, 052033. Doi:10.1088/1757-899X/768/5/052033.
- Wang, M.; Zhang, G.; Chen, Y.; Zhao, L. Effect of dissolved oxygen on the sulfidization flotation of smithsonite. Miner. Eng. 2022, 186, 107741. [CrossRef]
- Devi, P.A.; Padmavathy, P.; Aanand, S.; Aruljothi, K. Review on water quality parameters in freshwater cage fish culture. Int. j. appl. res. 2017, 3, 114-120, 2017.
- Stenstrom, M.K.; Poduska, R.A. The effect of dissolved oxygen concentration on nitrification. Water Res. 1980, 14, 643-649. [CrossRef]
- Bernet, N.; Dangcong, P.; Delgenes, J.-P.; Rene, M. Nitrification at Low Oxygen Concentration in Biofilm Reactor. J. Environ. Eng. 2001, 127(3), 266-271. http://dx.doi.org/10.1061/(ASCE)0733-9372(2001)127:3(266).
- Lee, Y.H.; Tsao, G.T. Dissolved oxygen electrodes. In Advances in Biochemical Engineering, 1st ed.; Ghose, T.K., Blakebrough, N., Fiechter, A., Eds.; Publisher: Springer, Berlin, Heidelberg, 1979; Volume 13, pp. 35–86. [CrossRef]
- Boyd, C.E.; Tucker, C.S.; Viriyatum, R. Interpretation of pH, Acidity, and Alkalinity in Aquaculture and Fisheries. Aquaculture 2011, 73, 403-408. [CrossRef]
- Sajuni, N.; Ahmad, A.; Vadivelu, V. Effect of Filter Media Characteristics, pH and Temperature on the Ammonia Removal in the Wastewater. J. Appli. Sci. 2010, 10, 1146-1150. [CrossRef]
- Justnes, H.; Escudero-Oñate, C.; Garmo, Ø.A.; Mengede, M. Transformation Kinetics of Burnt Lime in Freshwater and Sea Water. Materials 2020, 13, 4926. [CrossRef]
- Walczyńska, A.; Sobczyk, Ł. The underestimated role of temperature–oxygen relationship in large-scale studies on size-to-temperature response. Ecol. Evol. 2017; 7, 7434–7441. [CrossRef]
- Paredes, D.; Kuschk, P.; Mbwette, T.S.A.; Stange, F.; Müller, R.A.; Köser, H. New Aspects of Microbial Nitrogen Transformations in the Context of Wastewater Treatment – A Review. Eng. Life Sci. 2007, 7, 13-25. [CrossRef]
- Garg, R.; Rao, R.; Uchchariya, D.; Shukla, G.; Saksena, D. Seasonal variations in water quality and major threats to Ramsagar reservoir, India. Afr. J. Environ. Sci. Technol. 2010, 4, 061-076.
- Azzola, F. Android Things Projects, 1st ed.; Packt Publishing Ltd: Birmingham, UK, 2017; pp. 1–232.
- He, Y.; He, J.; Wen, N. The challenges of IoT-based applications in high-risk environments, health and safety industries in the Industry 4.0 era using decision-making approach. J. Innov. Knowl. 2023, 8, 100347. [CrossRef]
- Tsagkari, E.; Sloan, W. The Role of Chlorine in the Formation and Development of Tap Water Biofilms under Different Flow Regimes. Microorganisms 2023, 11, 2680. [CrossRef]
- Tribe, L.A.; Briens, C.L.; Margaritis, A. Determination of the Volumetric Mass Transfer Coefficient (k,a) Using the Dynamic “Gas Out-Gas In” Method: Analysis of Errors Caused by Dissolved Oxygen Probes. Biotechnol. Bioeng. 1995, 46, 388-392. https://www.doi.org/10.1002/BIT.260460412.
- Raghavendra, N.; Krishnamurthy, L. Engineering Metrology and Measurement, 1st ed.; Oxford University Press: New Delhi, India, 2013; pp. 1-520.
- Terasaka, K.; Hirabayashi, A.; Nishino, T.; Fujioka, S.; Kobayashi, D. Development of microbubble aerator for waste water treatment using aerobic activated sludge. Chem. Eng. Sci. 2011, 66, 3172–3179. 3172-3179. [CrossRef]
- P. M. Doran, Bioprocess Engineering Principles, 2nd ed.; Academic Press: London, UK, 2013, pp. 379-444.
- Karaguler, T.; Kahraman, H.; Tuter, M. Analyzing effects of ELF electromagnetic fields on removing bacterial biofilm. Biocybern. Biomed. Eng. 2017, 37, 336-340. [CrossRef]
- Stoodley, P.; Sauer, K.; Davies, D.G.; Costerton, J.W. Biofilm as Complex Differentiated Communities. Annu. Rev. Microbiol. 2022, 56, 187–209. [CrossRef]
- Gilbert, P.; Allison, D.G.; Evans, D.J.; Handley, P.S.; Brown, M.R. Growth rate control of adherent bacterial populations. Appl. Environ. Microbiol. 1989, 55, 1308-11. [CrossRef]
- Morita, R.Y. Bioavailability of Energy and the Starvation State. In Starvation in Bacteria,1St ed.; Kjelleberg, S., Eds.; Springer: Boston, 1993; pp 1-23. [CrossRef]
|
Disclaimer/Publisher’s Note: The statements, opinions and data contained in all publications are solely those of the individual author(s) and contributor(s) and not of MDPI and/or the editor(s). MDPI and/or the editor(s) disclaim responsibility for any injury to people or property resulting from any ideas, methods, instructions or products referred to in the content. |
© 2023 by the authors. Licensee MDPI, Basel, Switzerland. This article is an open access article distributed under the terms and conditions of the Creative Commons Attribution (CC BY) license (http://creativecommons.org/licenses/by/4.0/).
