1. Introduction
In an era where living to 100 years old [
1] is not uncommon, it is important to extend healthy life expectancy [
2]. Furthermore, in an aging society with a declining birthrate, there is an increasing focus on health management, which considers the health of employees as a business resource and aims to improve the efficiency of a limited workforce [
3]. There are ongoing efforts to popularize health management by promoting initiatives related to health enhancement [
4].
On the other hand, the number of remote workers has increased due to the impact of COVID-19, affecting the lifestyle habits of employees. For example, during the home confinement period due to COVID-19, many people gained weight, and it was suggested that lack of exercise and excessive food intake due to stress were the causes of weight gain [
5]. A survey on global changes in physical activity under the COVID-19 pandemic reported a worldwide decrease in physical activity, which decreased even more during lockdown periods [
6]
In health management, absenteeism is when employees are absent due to ill health, and presenteeism is when employees are at work but have low productivity due to ill health [
7]. Traditional workforce management in companies has focused on the decline in productivity caused by absenteeism. However, it is increasingly recognized that presenteeism can cause greater economic losses [
8]. According to a meta-analysis on the effects of flexible working arrangements on attendance and absenteeism, it was suggested that the risk of presenteeism decreases in telework.
Additionally, everyday stress has increased and sleep patterns have become irregular in remote work [
9,
10]. Moreover, restrictions on face-to-face communication are affecting job satisfaction and happiness [
11].
Thus, under the pandemic of COVID-19, working styles and communication methods have changed through the use of video conferencing and other remote methods, which is believed to have an impact on remote workers. The purpose of this study is to conduct an empirical analysis of the impact of exercise intervention through tele-exercise on the lifestyle habits of remote workers.
Regarding exercise intervention through tele-exercise, a 6-month exercise-centered intervention using a telemonitoring system was shown to reduce the severity of metabolic syndrome, which could potentially not only reduce the risk of cardiovascular and metabolic diseases in employees with high risk but also improve mental health, work ability, and productivity-related outcomes [
12].
In this study, we conducted an empirical study on two groups receiving intervention through exercise guidance (G1: tele-exercise group, G2: face-to-face exercise group) with reference to these points.
2. Materials and Methods
This study was conducted with the approval of the Ethics Committee of the University of Tokyo (Approval date: April 9, 2021). The study was conducted with healthy adult members or non-members of JEXER, a fitness club of JR East Sports, with 8 individuals selected for remote instruction and 8 individuals selected for face-to-face instruction using a convenience sampling method. JEXER offers not only face-to-face exercise but also remote exercise. The selection criteria were men and women aged 20 to 65 with a BMI (Body Mass Index) of 25 or more, but also considered the frequency of remote work and willingness to participate.
Detailed information about the study was provided, and after signing informed consent, the tele-exercise group followed an exercise program conducted by JEXER trainers for 30 minutes a week over 3 months from July to October 2021. The exercise program consisted of one or a combination of services provided to JEXER members.
At the outset of the exercise program, participants’ height, weight, and BMI were recorded, and a questionnaire was given (Time1: July 2021). The same measurements were taken, and questionnaires were provided one month later (Time2: August 2021) and again three months after the program began (Time3: October 2021). The questionnaire covered topics such as presenteeism, weight, sleep, stress, job satisfaction, and happiness, as detailed in
Table 1. To standardize the physical and questionnaire data, ratio data (comprising BMI, PST, ST) and difference data (based on other Likert scales) were determined relative to the program’s onset.
The ratio and difference data for each parameter underwent a Two-way repeated measures Analysis of Variance (ANOVA) to discern any mean differences between the two groups: G1 (tele-exercise group) and G2 (face-to-face exercise group) across Time1 to Time3. A significance level of P < 0.05 was established. Additionally, an Autocorrelation and Correlation Analysis were conducted on the data from both groups for each parameter. Additionally, a Correspondence Analysis (CA) was conducted to visualize and interpret categorical data indicating the relationships and patterns in survey responses.
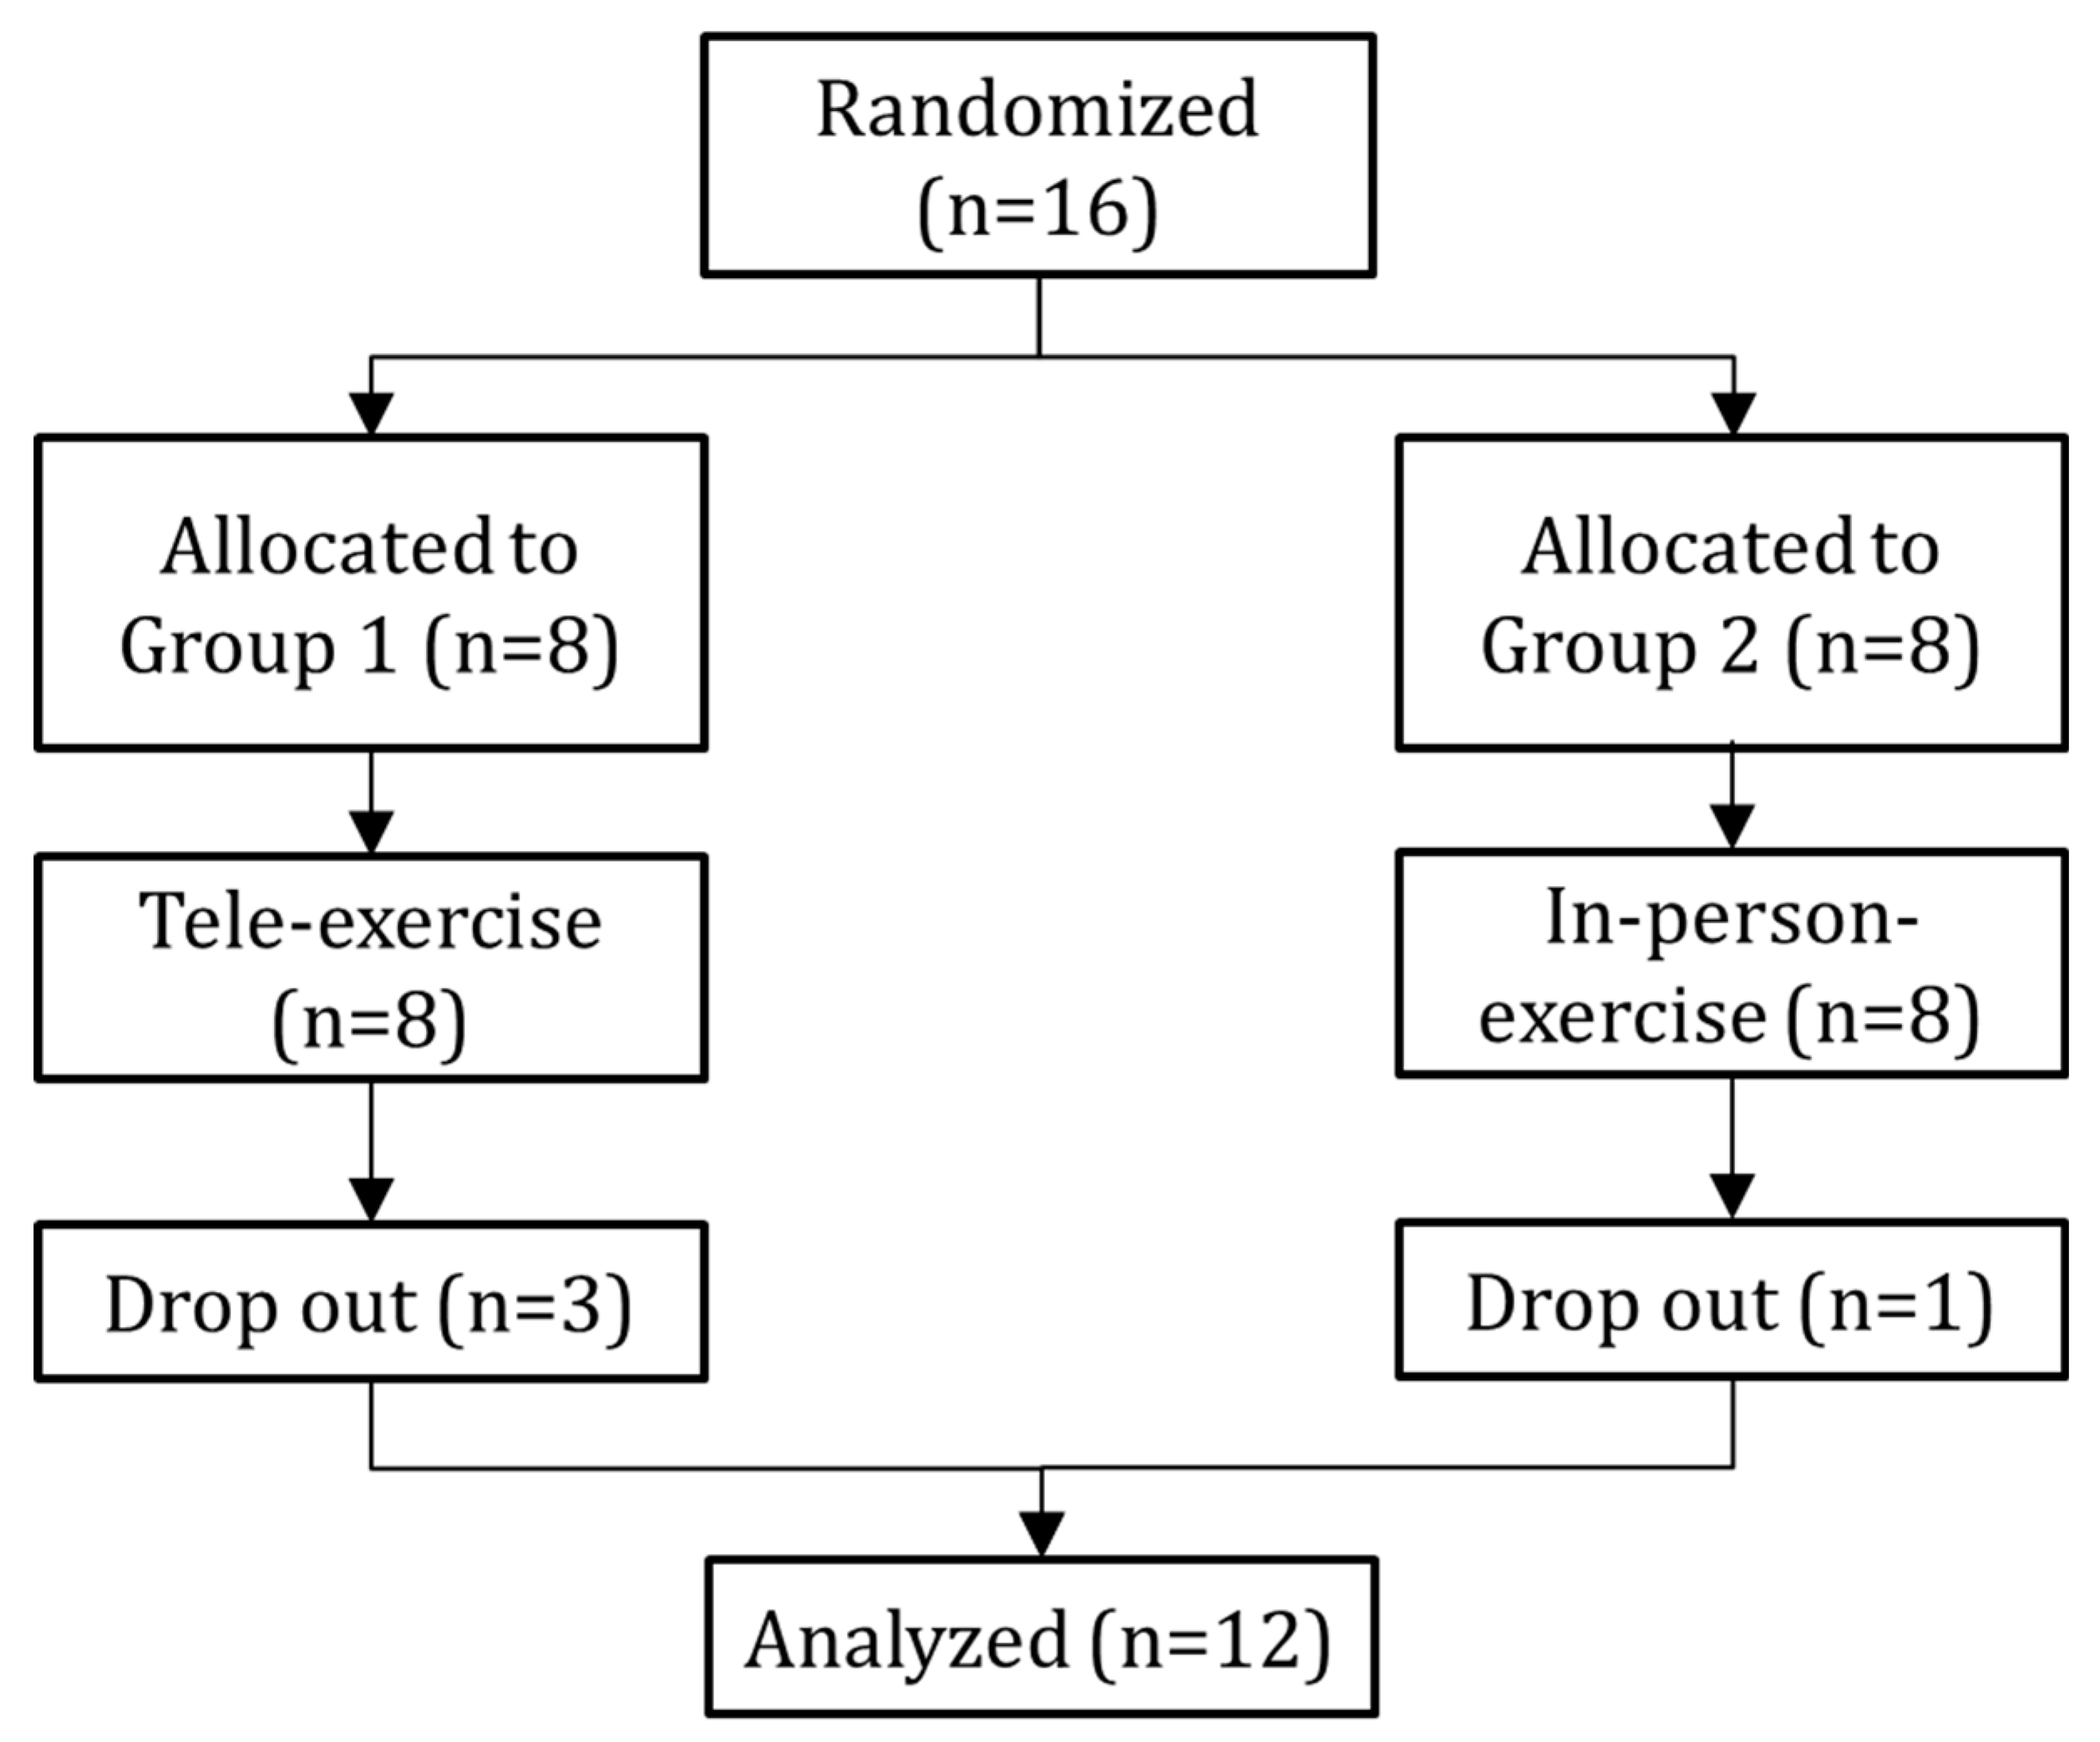
Figure 1 illustrates that while there were 8 participants each in G1 (tele-exercise) and G2 (face-to-face), only the data from 5 participants in G1 and 7 in G2 were included in the analysis after omitting those who didn’t complete the questionnaire.
3. Results
3.1. Attributes
The number of participants was 8 in the tele-exercise group G1 and 8 in the face-to-face exercise group G2. However, as a result, there were 5 participants in G1 and 7 participants in G2.
Figure 2 shows the attributes of the participants.
3.2. At the Start of Experiment
3.2.1. Weight Control: Has Your Weight Decreased or Increased Due to Remote Work?
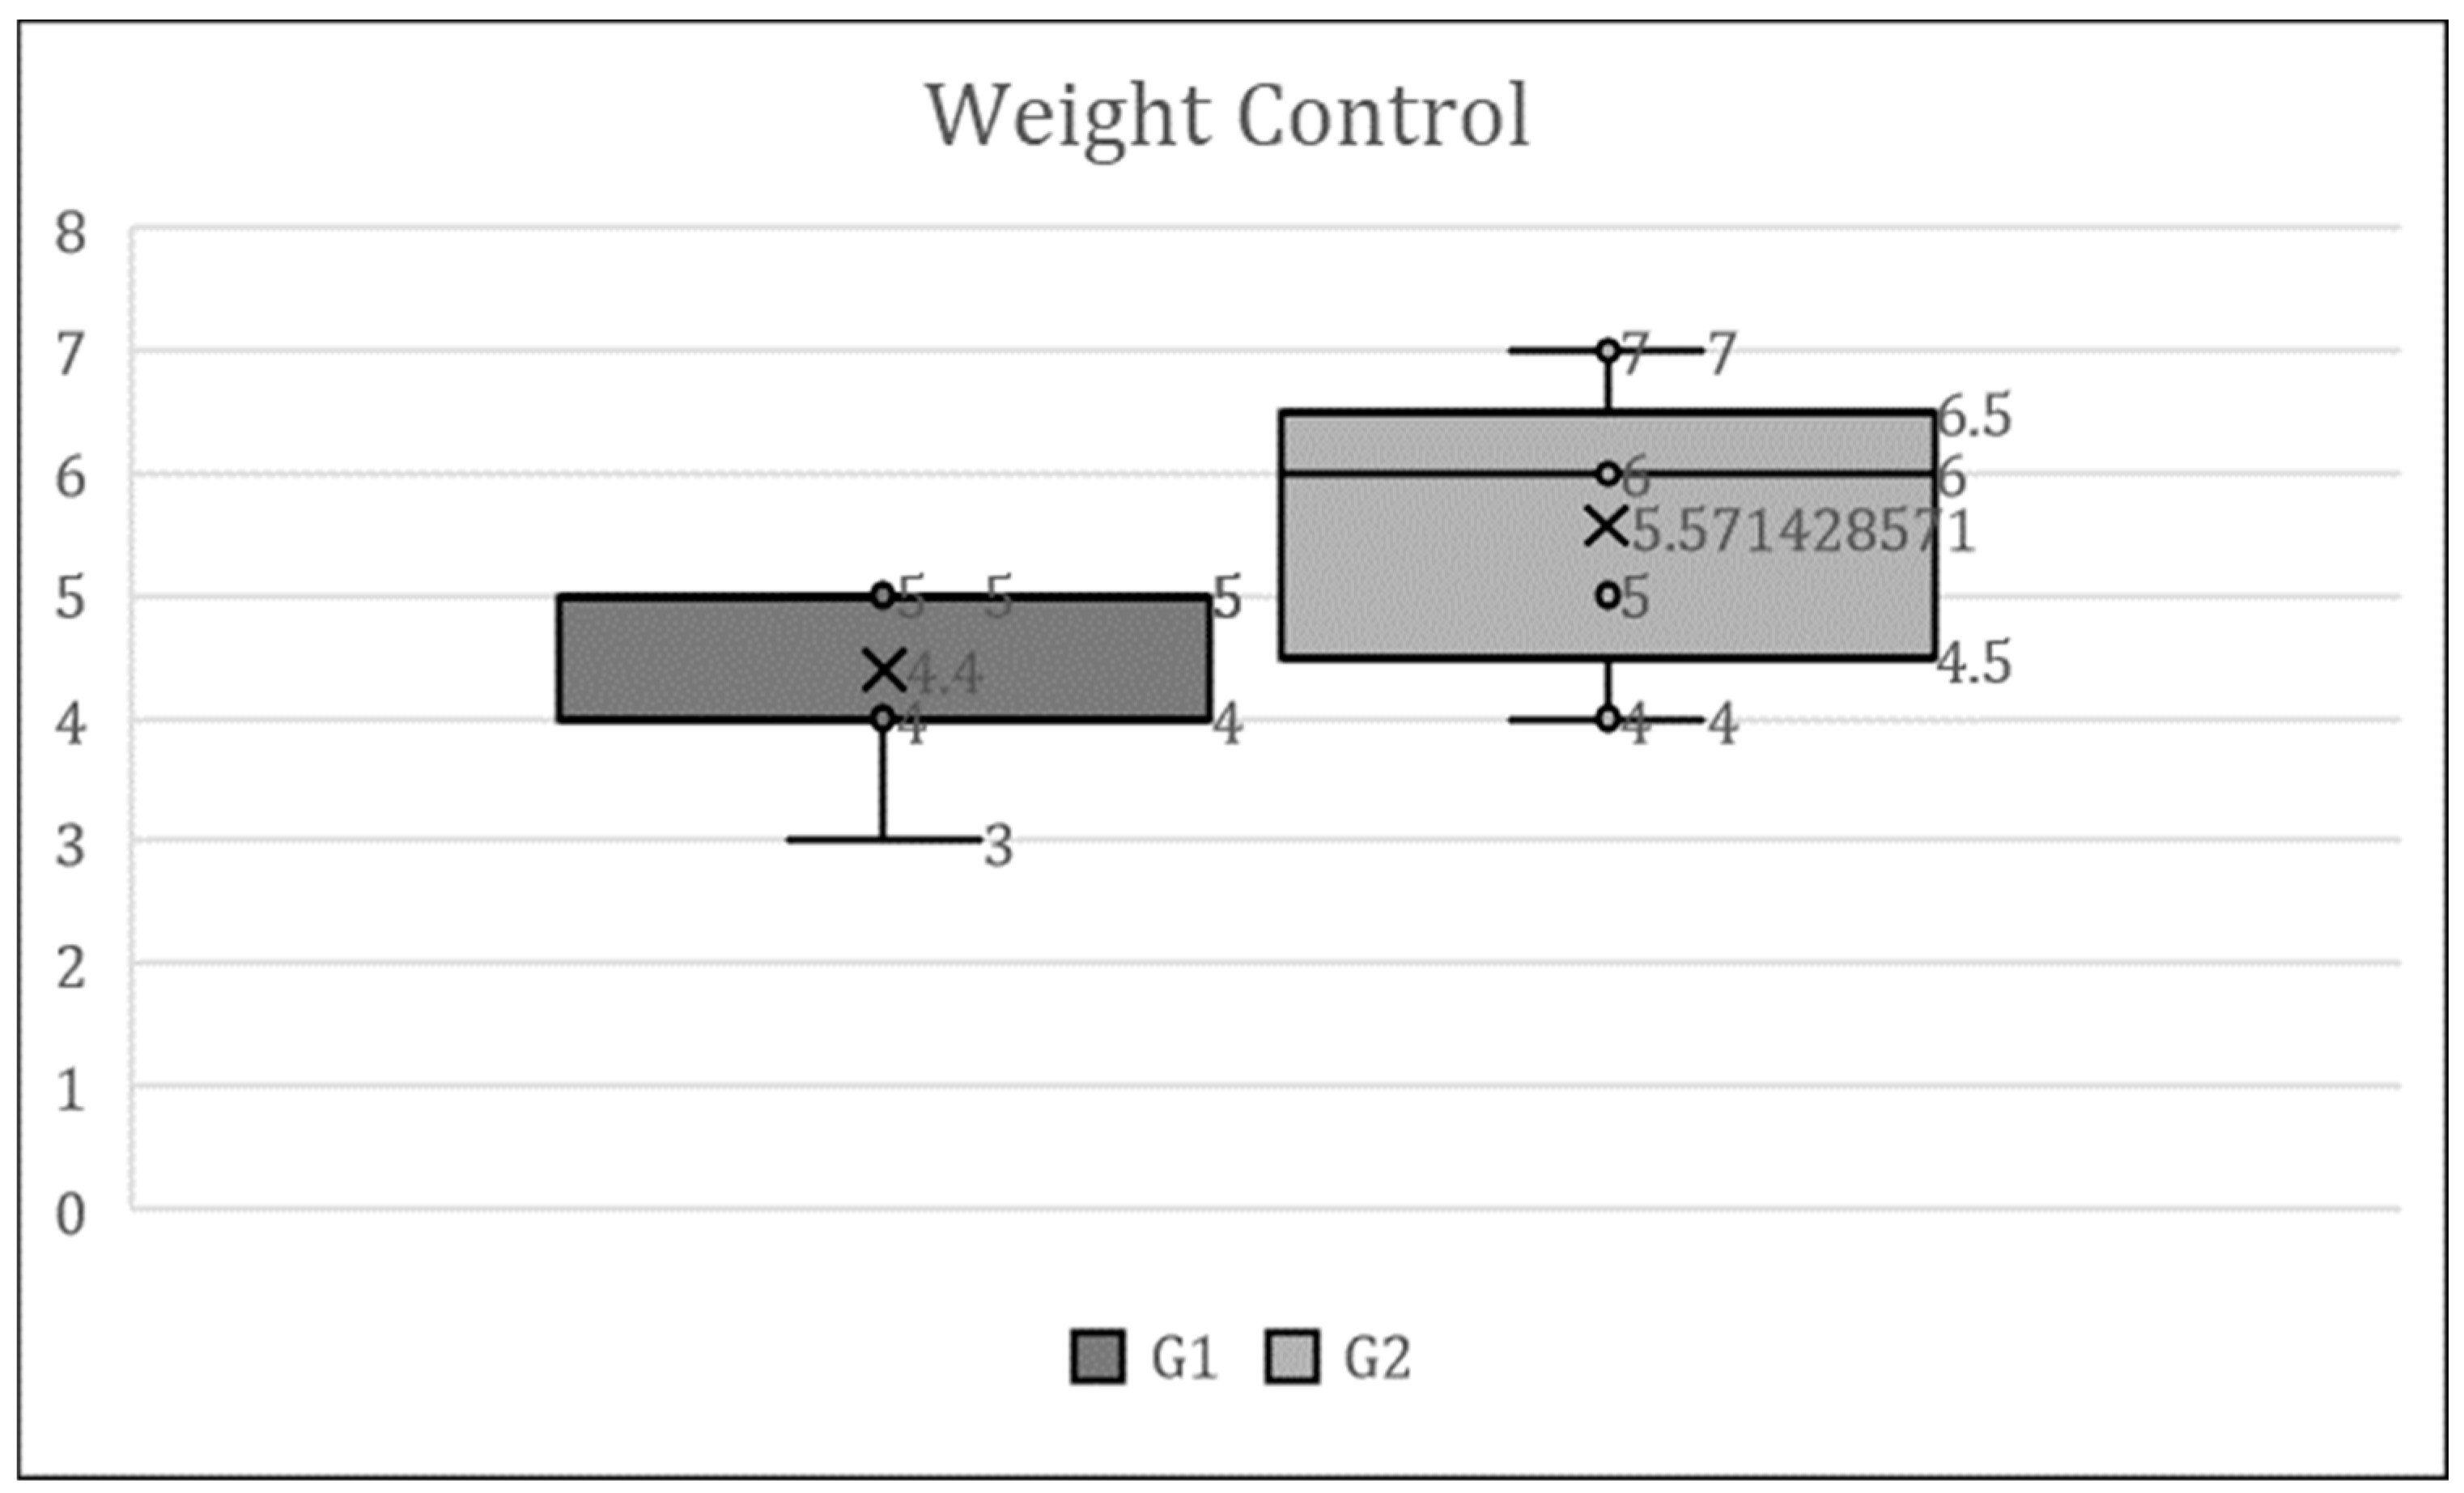
Figure 3 presents the results of the question asking about weight changes due to remote work, shown in a box-and-whisker plot using the overall median. The collected responses were selected from the following options: Answer (1. significantly decreased, 2. slightly decreased, 3. remained the same, 4. slightly increased, 5. significantly increased).
At the beginning of the exercise guidance in July 2021, both the tele-exercise group (G1) and the face-to-face exercise group (G2) had experienced weight gain due to remote work.
3.2.2. Sleep Duration: Has your Duration of Sleep Decreased or Increased Due to Remote Work?
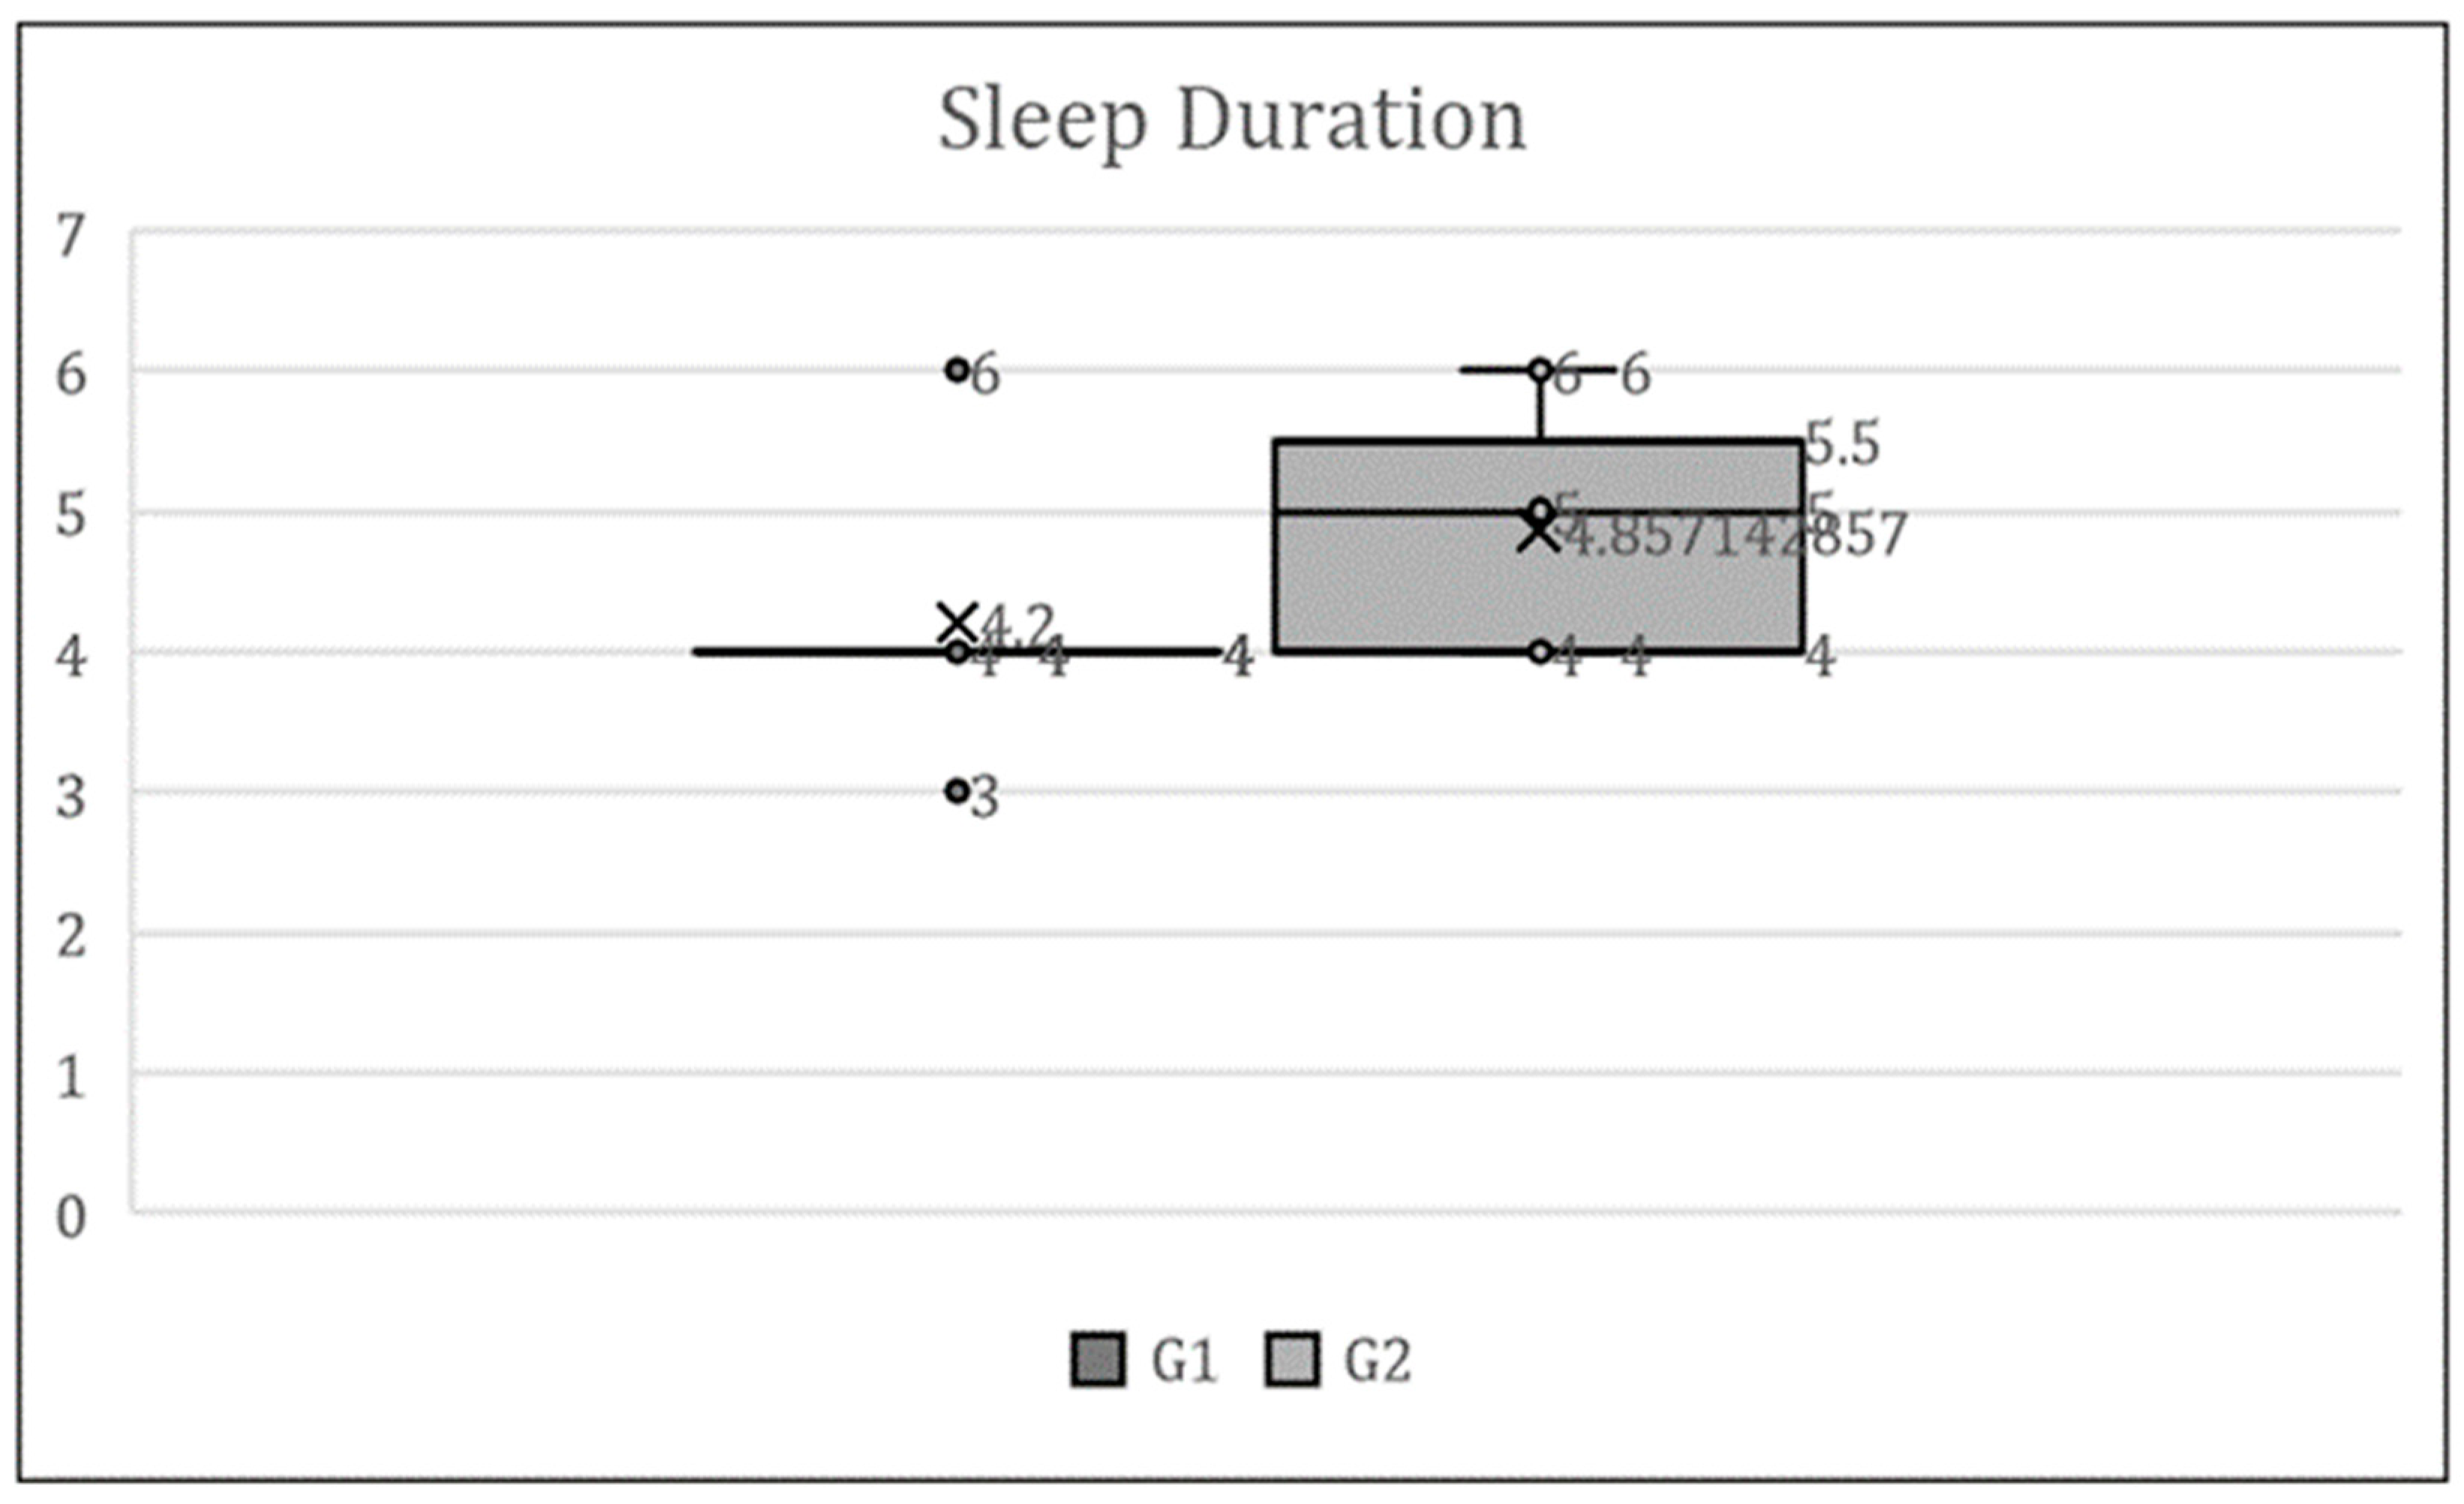
Figure 4 presents the results of the question asking about changes in sleep duration due to remote work, shown in a box-and-whisker plot using the overall median. The collected responses were selected from the following options: Answer (1. significantly decreased, 2. slightly decreased, 3. remained the same, 4. slightly increased, 5. significantly increased).
At the beginning of the exercise guidance in July 2021, both the tele-exercise group (G1) and the face-to-face exercise group (G2) had experienced longer sleep durations due to remote work.
3.3. Two-Way Repeated Measures ANOVA
3.3.1. Within-Subjects Contrast (Time Term and Interaction Term)
A test of the Within-Subjects Contrast revealed no significant differences in any of the items between the time term and the interaction term between time and group.
3.3.2. Between-Subjects Effects
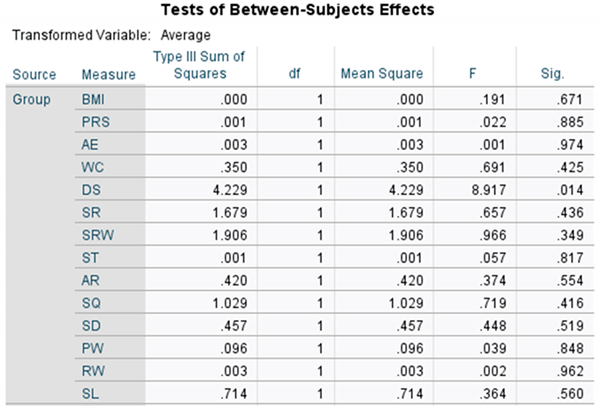
Table 2 illustrates the Between-Subjects Effects. As indicated in
Table 2, a significant difference was observed between groups G1 and G2 in the test of between-subjects effects, but only for Daily Stress (DS). However, no significant differences were noted between groups G1 and G2 for the other items.
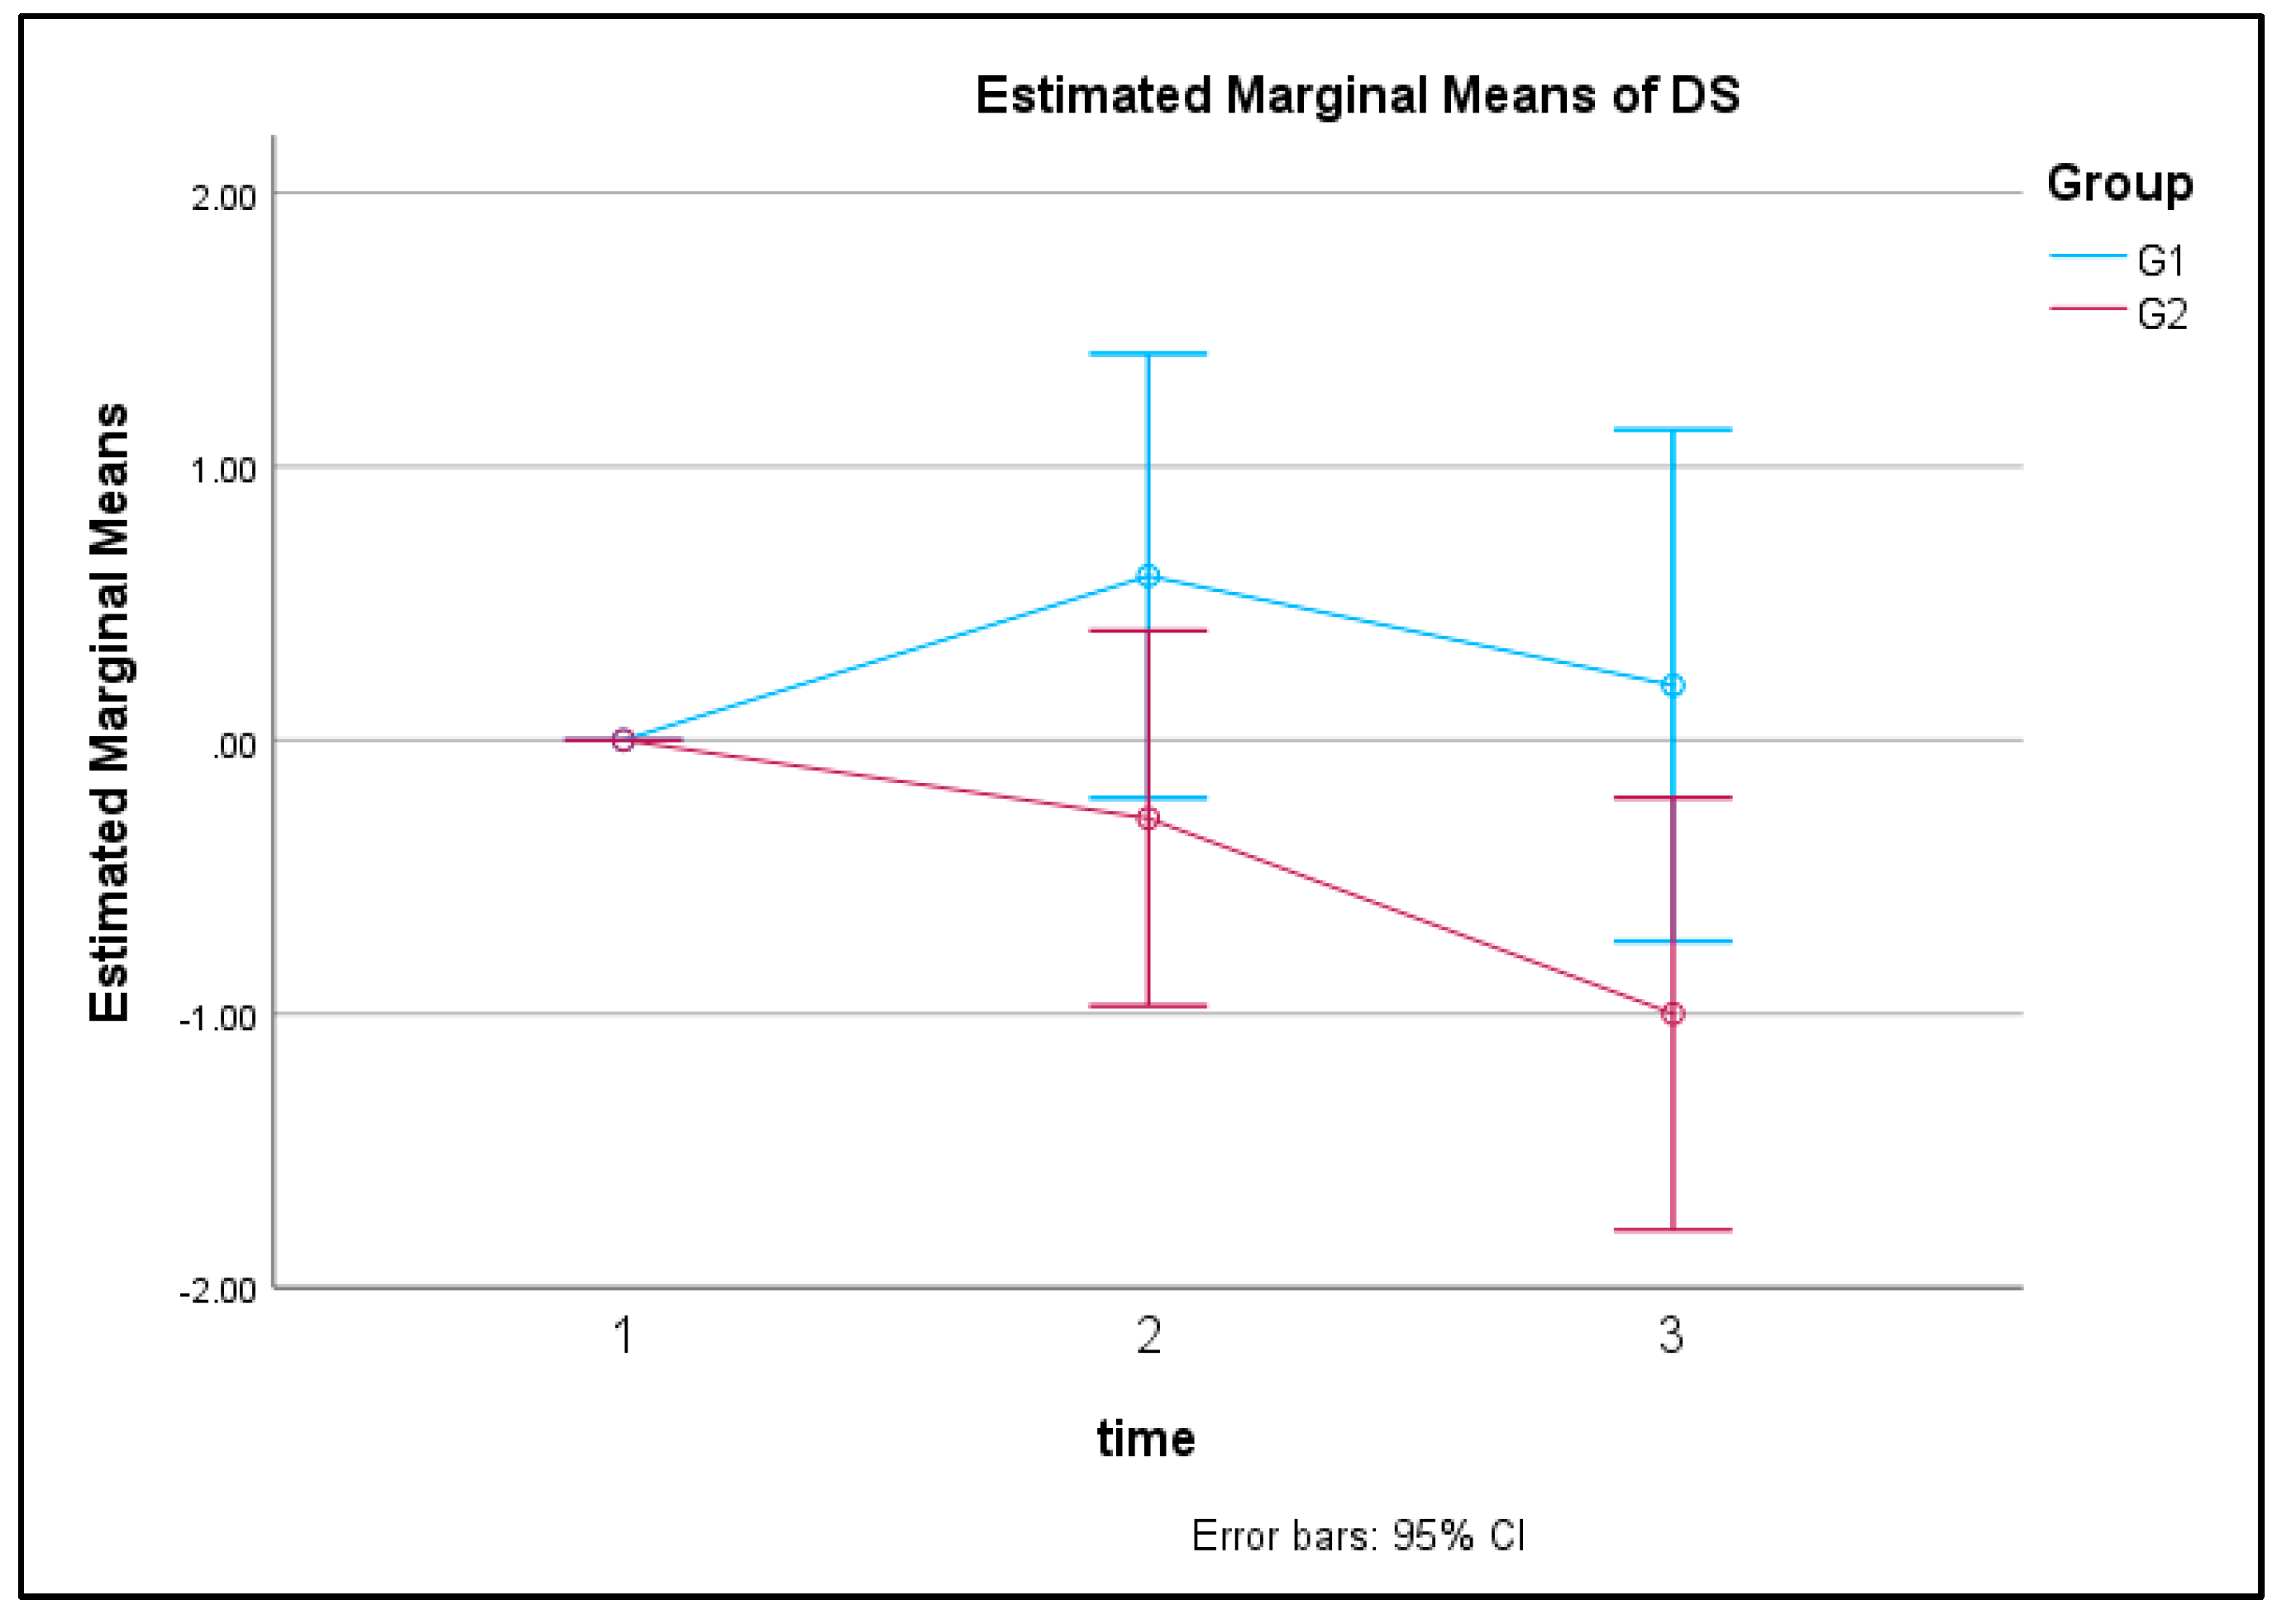
Figure 5 depicts the transition of Estimated Marginal Means of Daily Stress (DS). As shown in
Figure 5, a significant difference was observed in DS between groups G1 and G2, with the tele-exercise group (G1) exhibiting significantly higher Daily Stress compared to the face-to-face exercise group (G2).
3.4. Autocorrelation and Correlation
Autocorrelation is a statistical method to measure how values at different time points within a time series data are related to each other. Autocorrelation is calculated using time lag. A correlation relationship is a numerical relationship that indicates the extent to which two variables are related. This relationship is measured by the correlation coefficient, which is expressed in a range from -1 to +1, +1 indicates a perfect positive correlation, -1 indicates a perfect negative correlation, and 0 indicates no correlation.
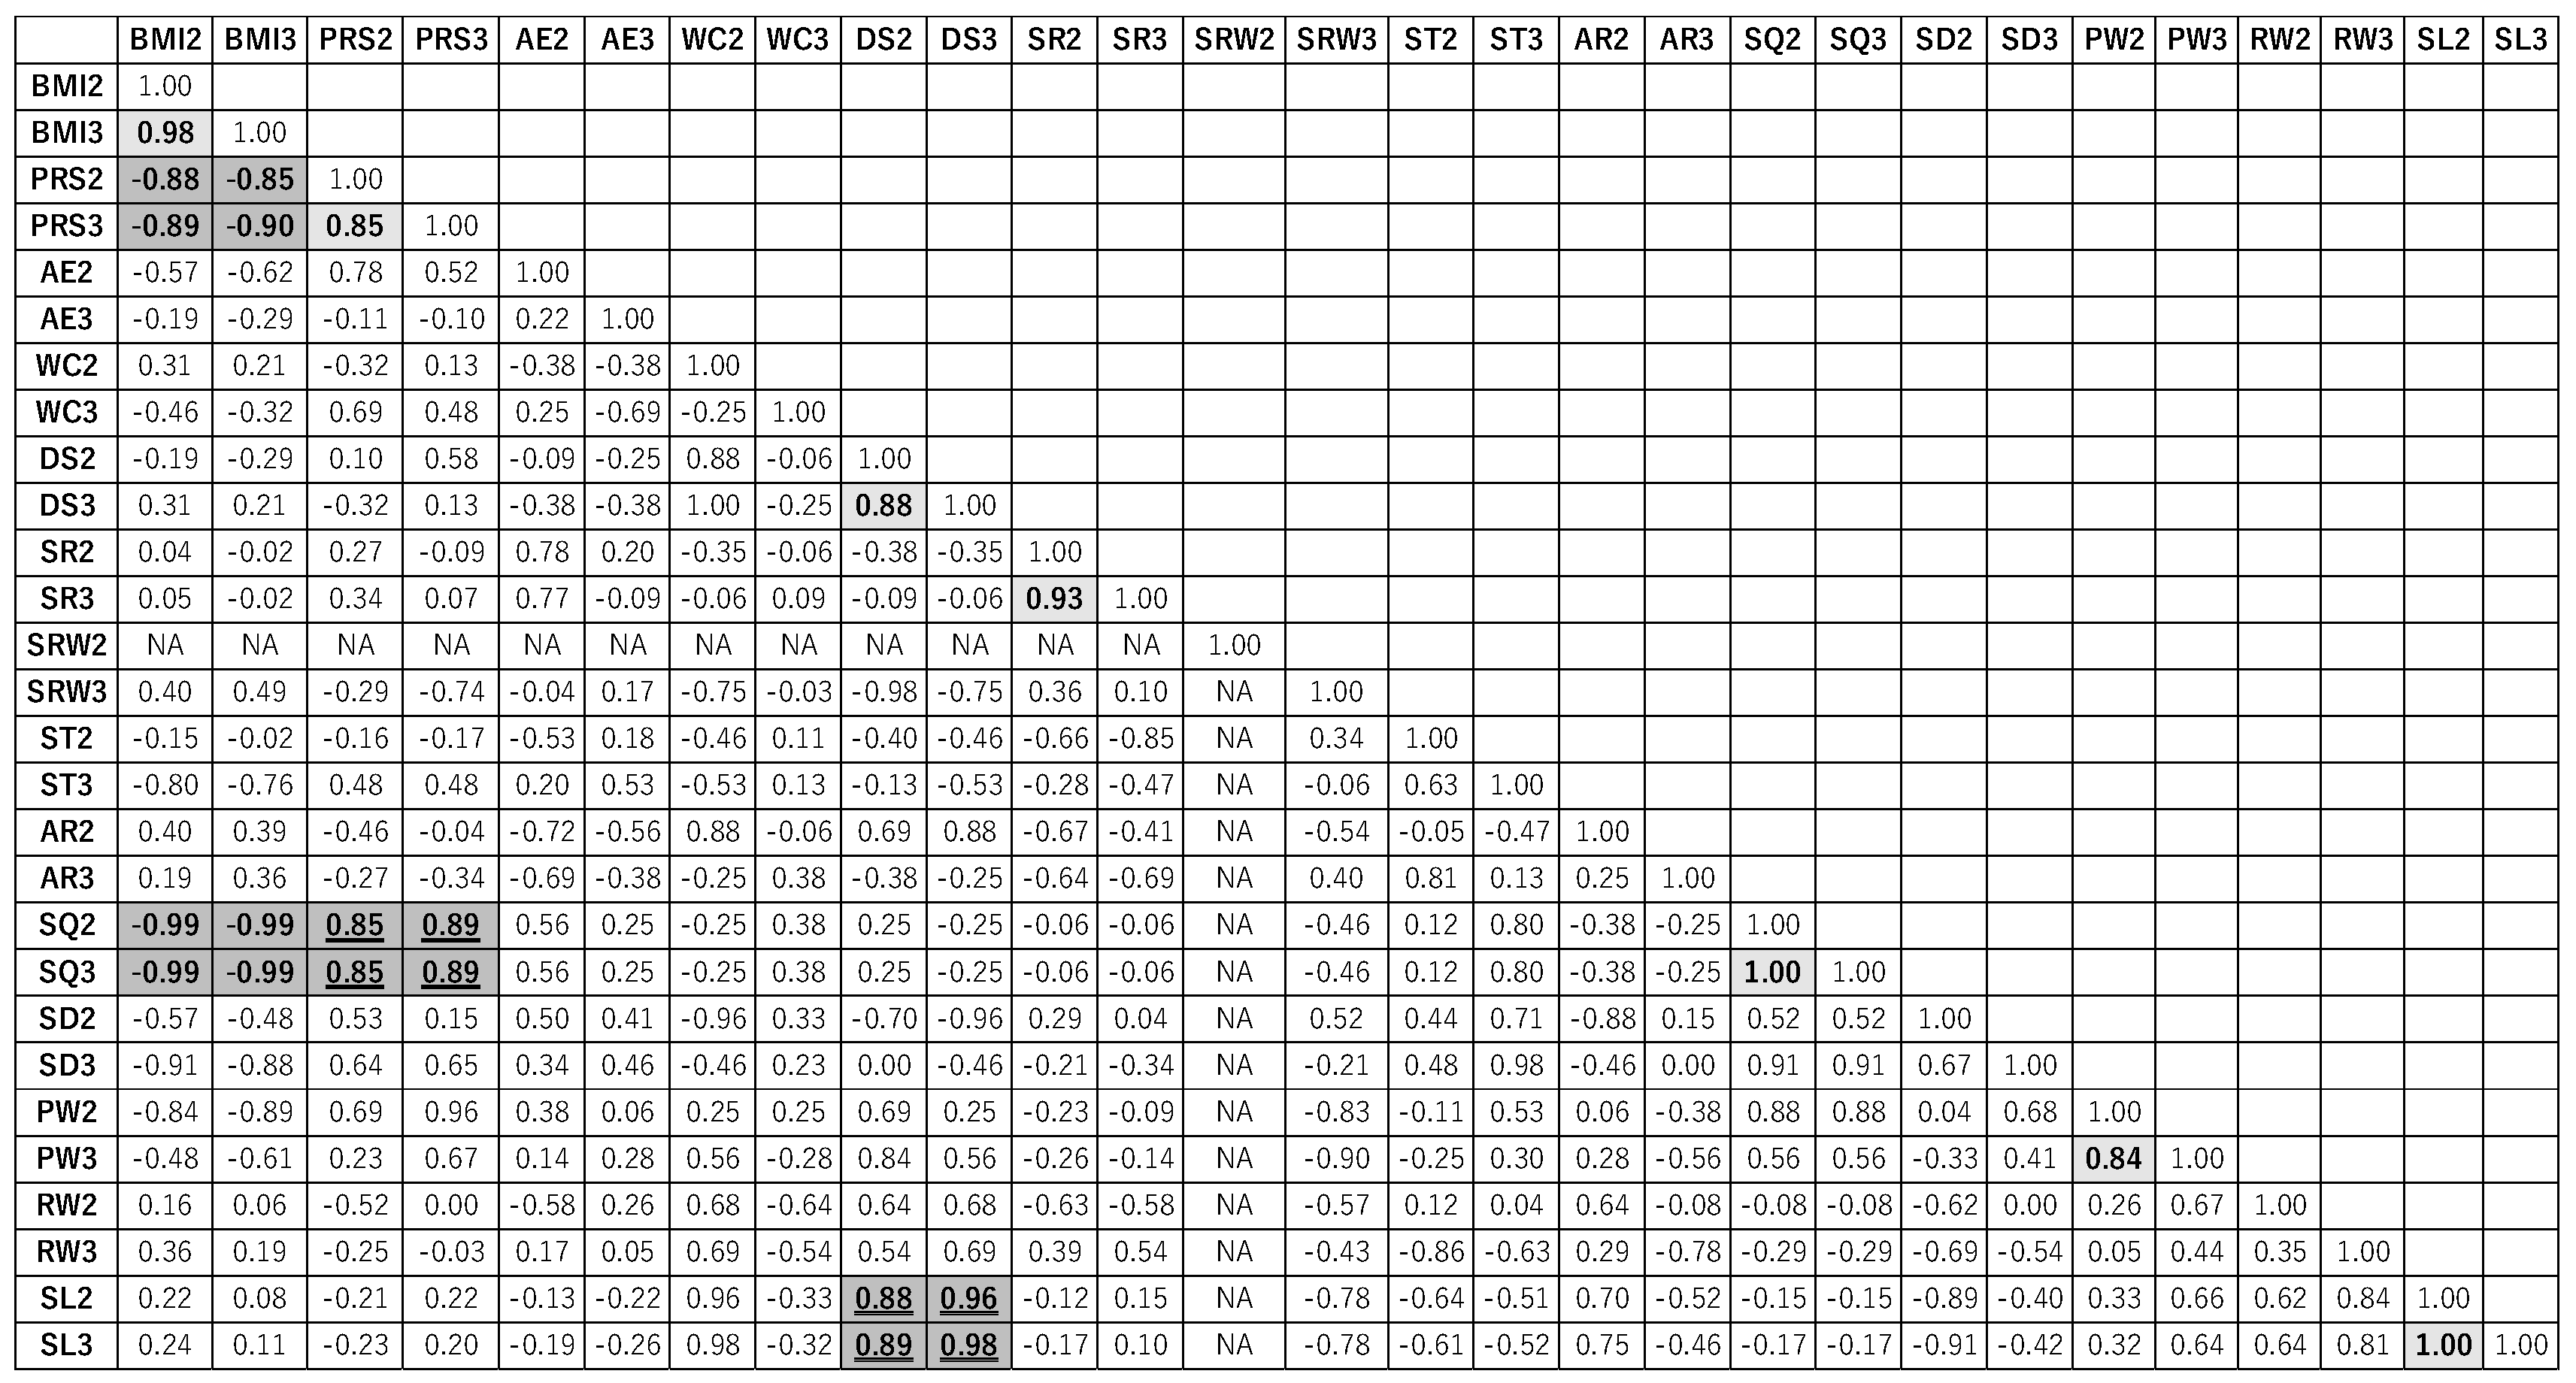
Figure 6 is a diagram illustrating the autocorrelation and correlation for G1 on the items at Time 2: August 2021 and Time 3: October 2021. The items with an autocorrelation coefficient of 0.8 or higher are indicated in light gray. Pairs of items where all four pairs correlation coefficients are either 0.8 or above or -0.8 or below are indicated in dark gray.
Autocorrelation was 0.8 or above in the case of BMI, PRS, DS, SR, SQ, PW, and SL. In these items, the data from Time 2 and Time 3 are strongly related and influenced by time. The pairs PRS and SQ, DS and SL had all four pairs correlation coefficients above 0.8. Moreover, the pairs BMI and PRS, BMI and SQ had all four pairs correlation coefficients below -0.8. If all four pairs correlation coefficients between pairs of items are 0.8 or higher or -0.8 or lower, it is considered to have a robust positive and negative correlation.
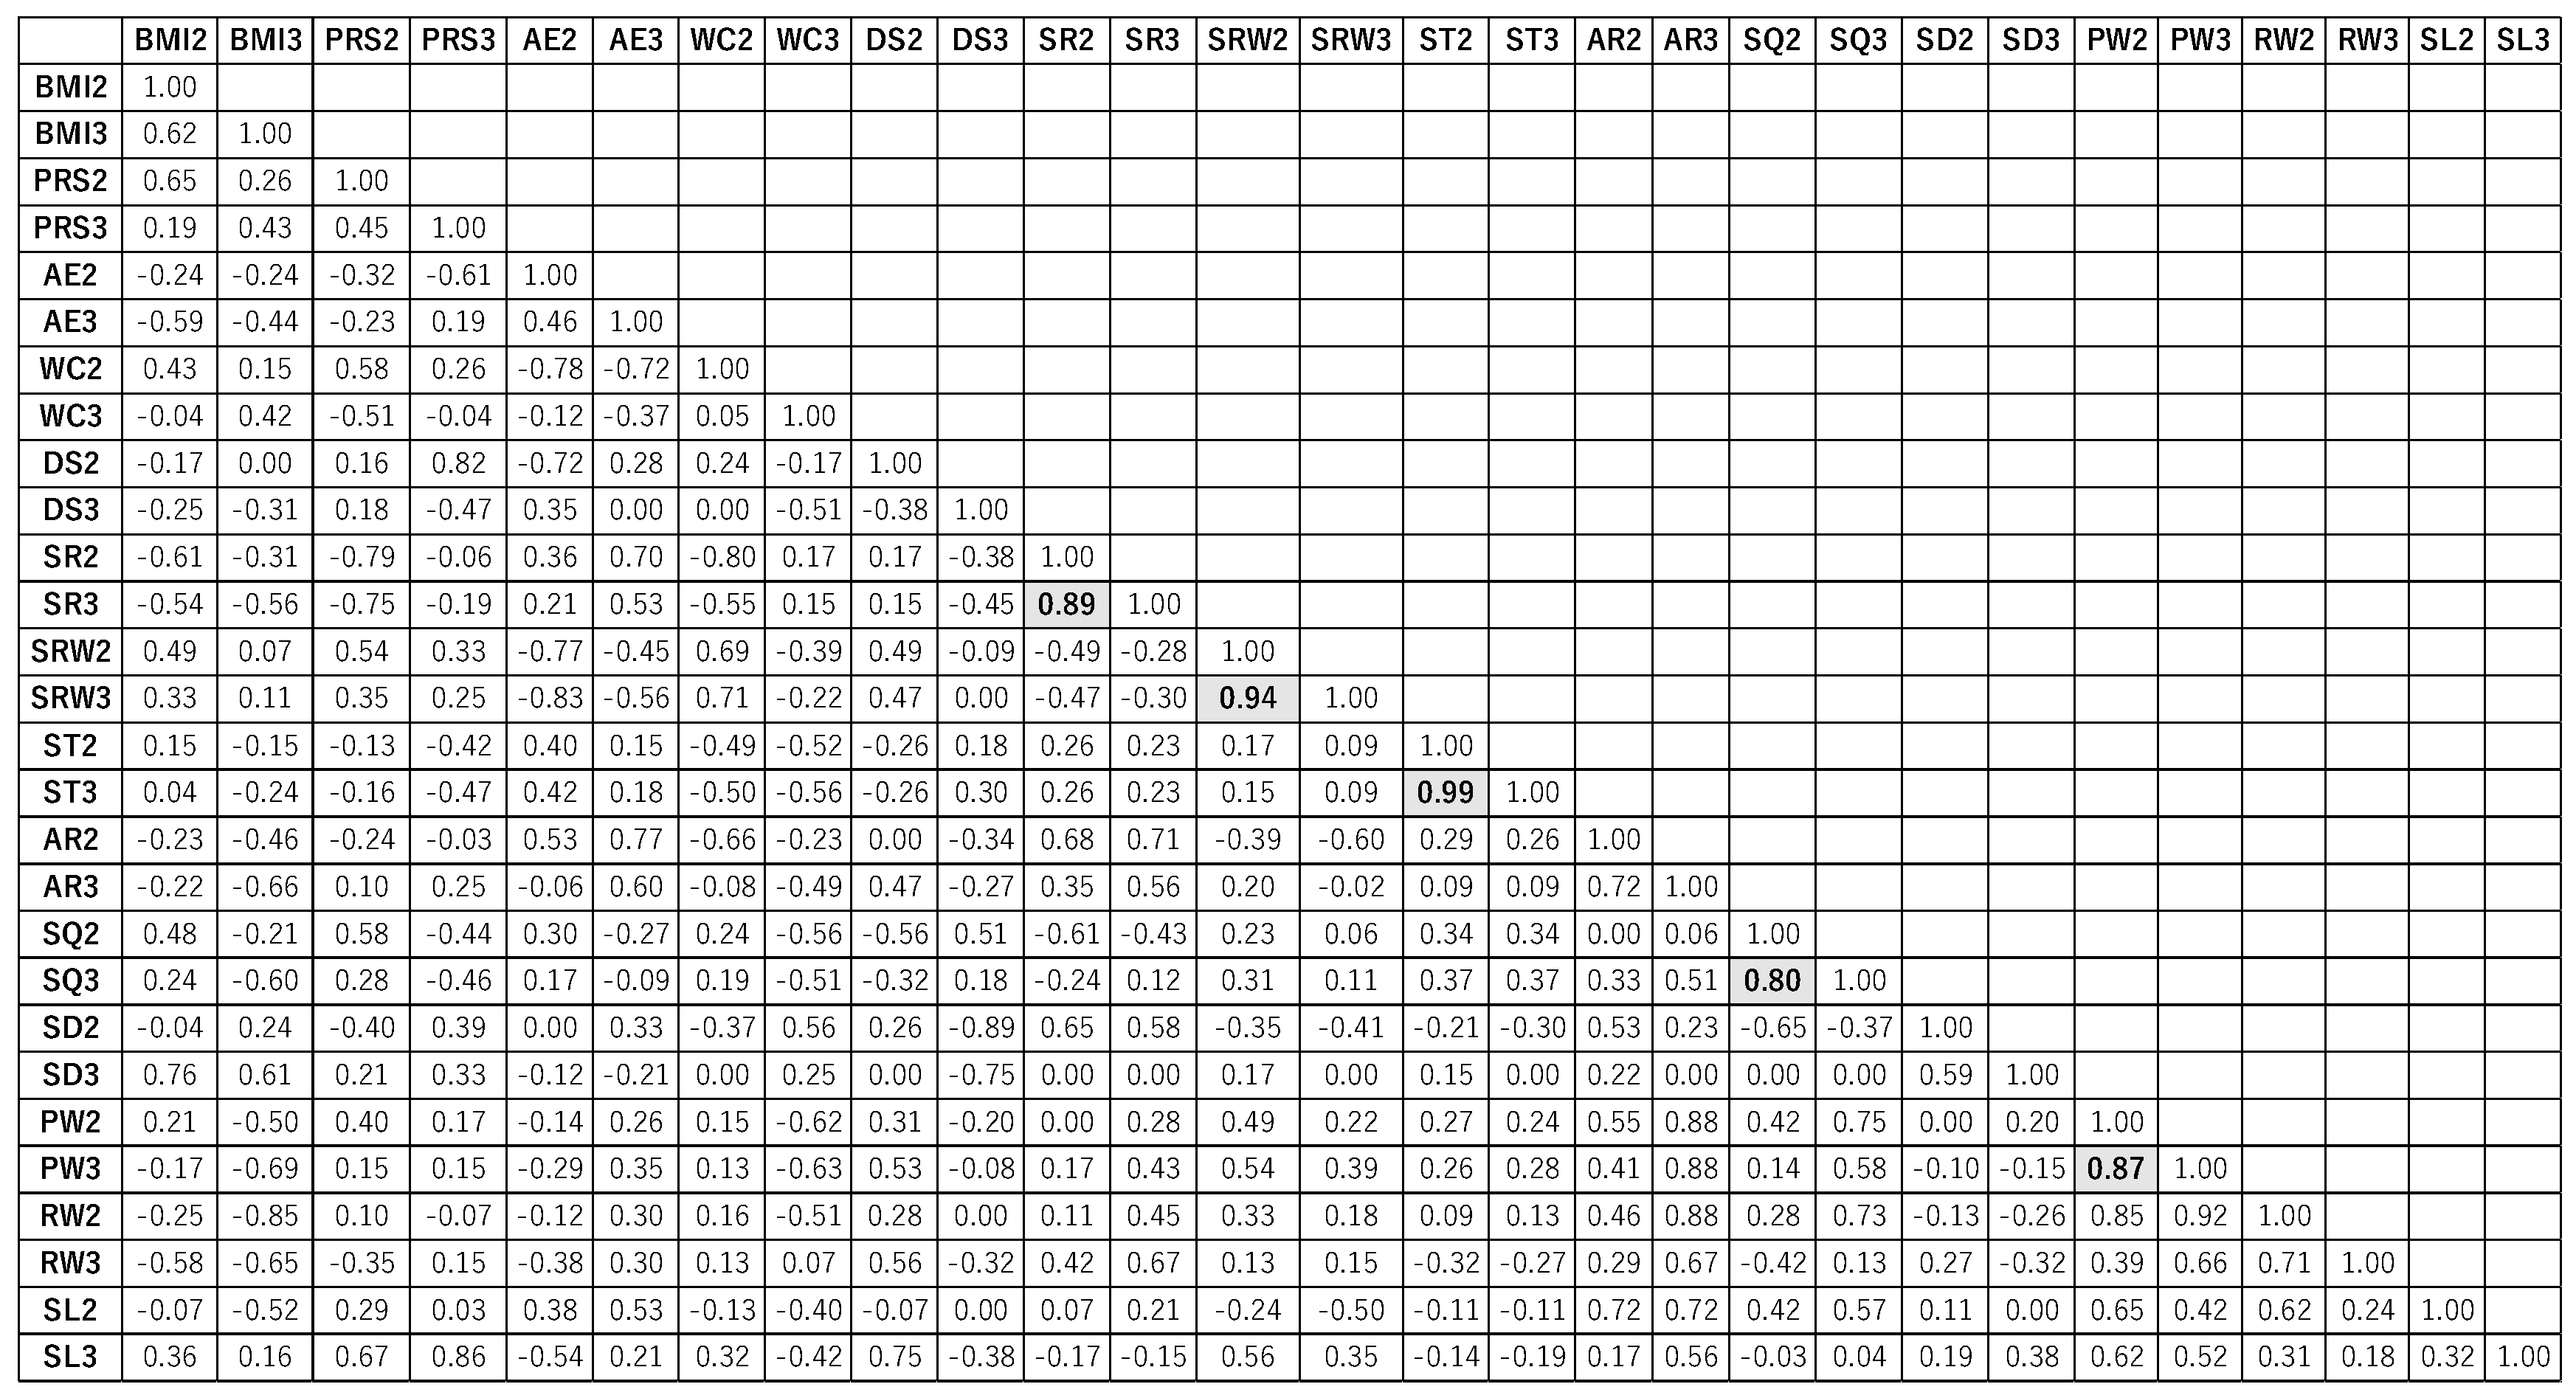
Figure 7 is a diagram illustrating the autocorrelation and correlation for G2 for the items at Time 2 and Time 3. The items with an autocorrelation coefficient of 0.8 or higher are marked in light gray. There were no items with a correlation coefficient of 0.8 or higher or -0.8 or lower.
Autocorrelation was found to be 0.8 or above for SR, SRW, ST, SQ, and PW. In these items, the data at Time 2 and Time 3 are strongly related and influenced by time.
3.5. Correspondence Analysis
Correspondence Analysis (CA) is a multivariate statistical technique aimed at the visualization and interpretation of categorical data, enabling the visualization of categorical data and explicitly illustrating the relationships and patterns in survey responses.
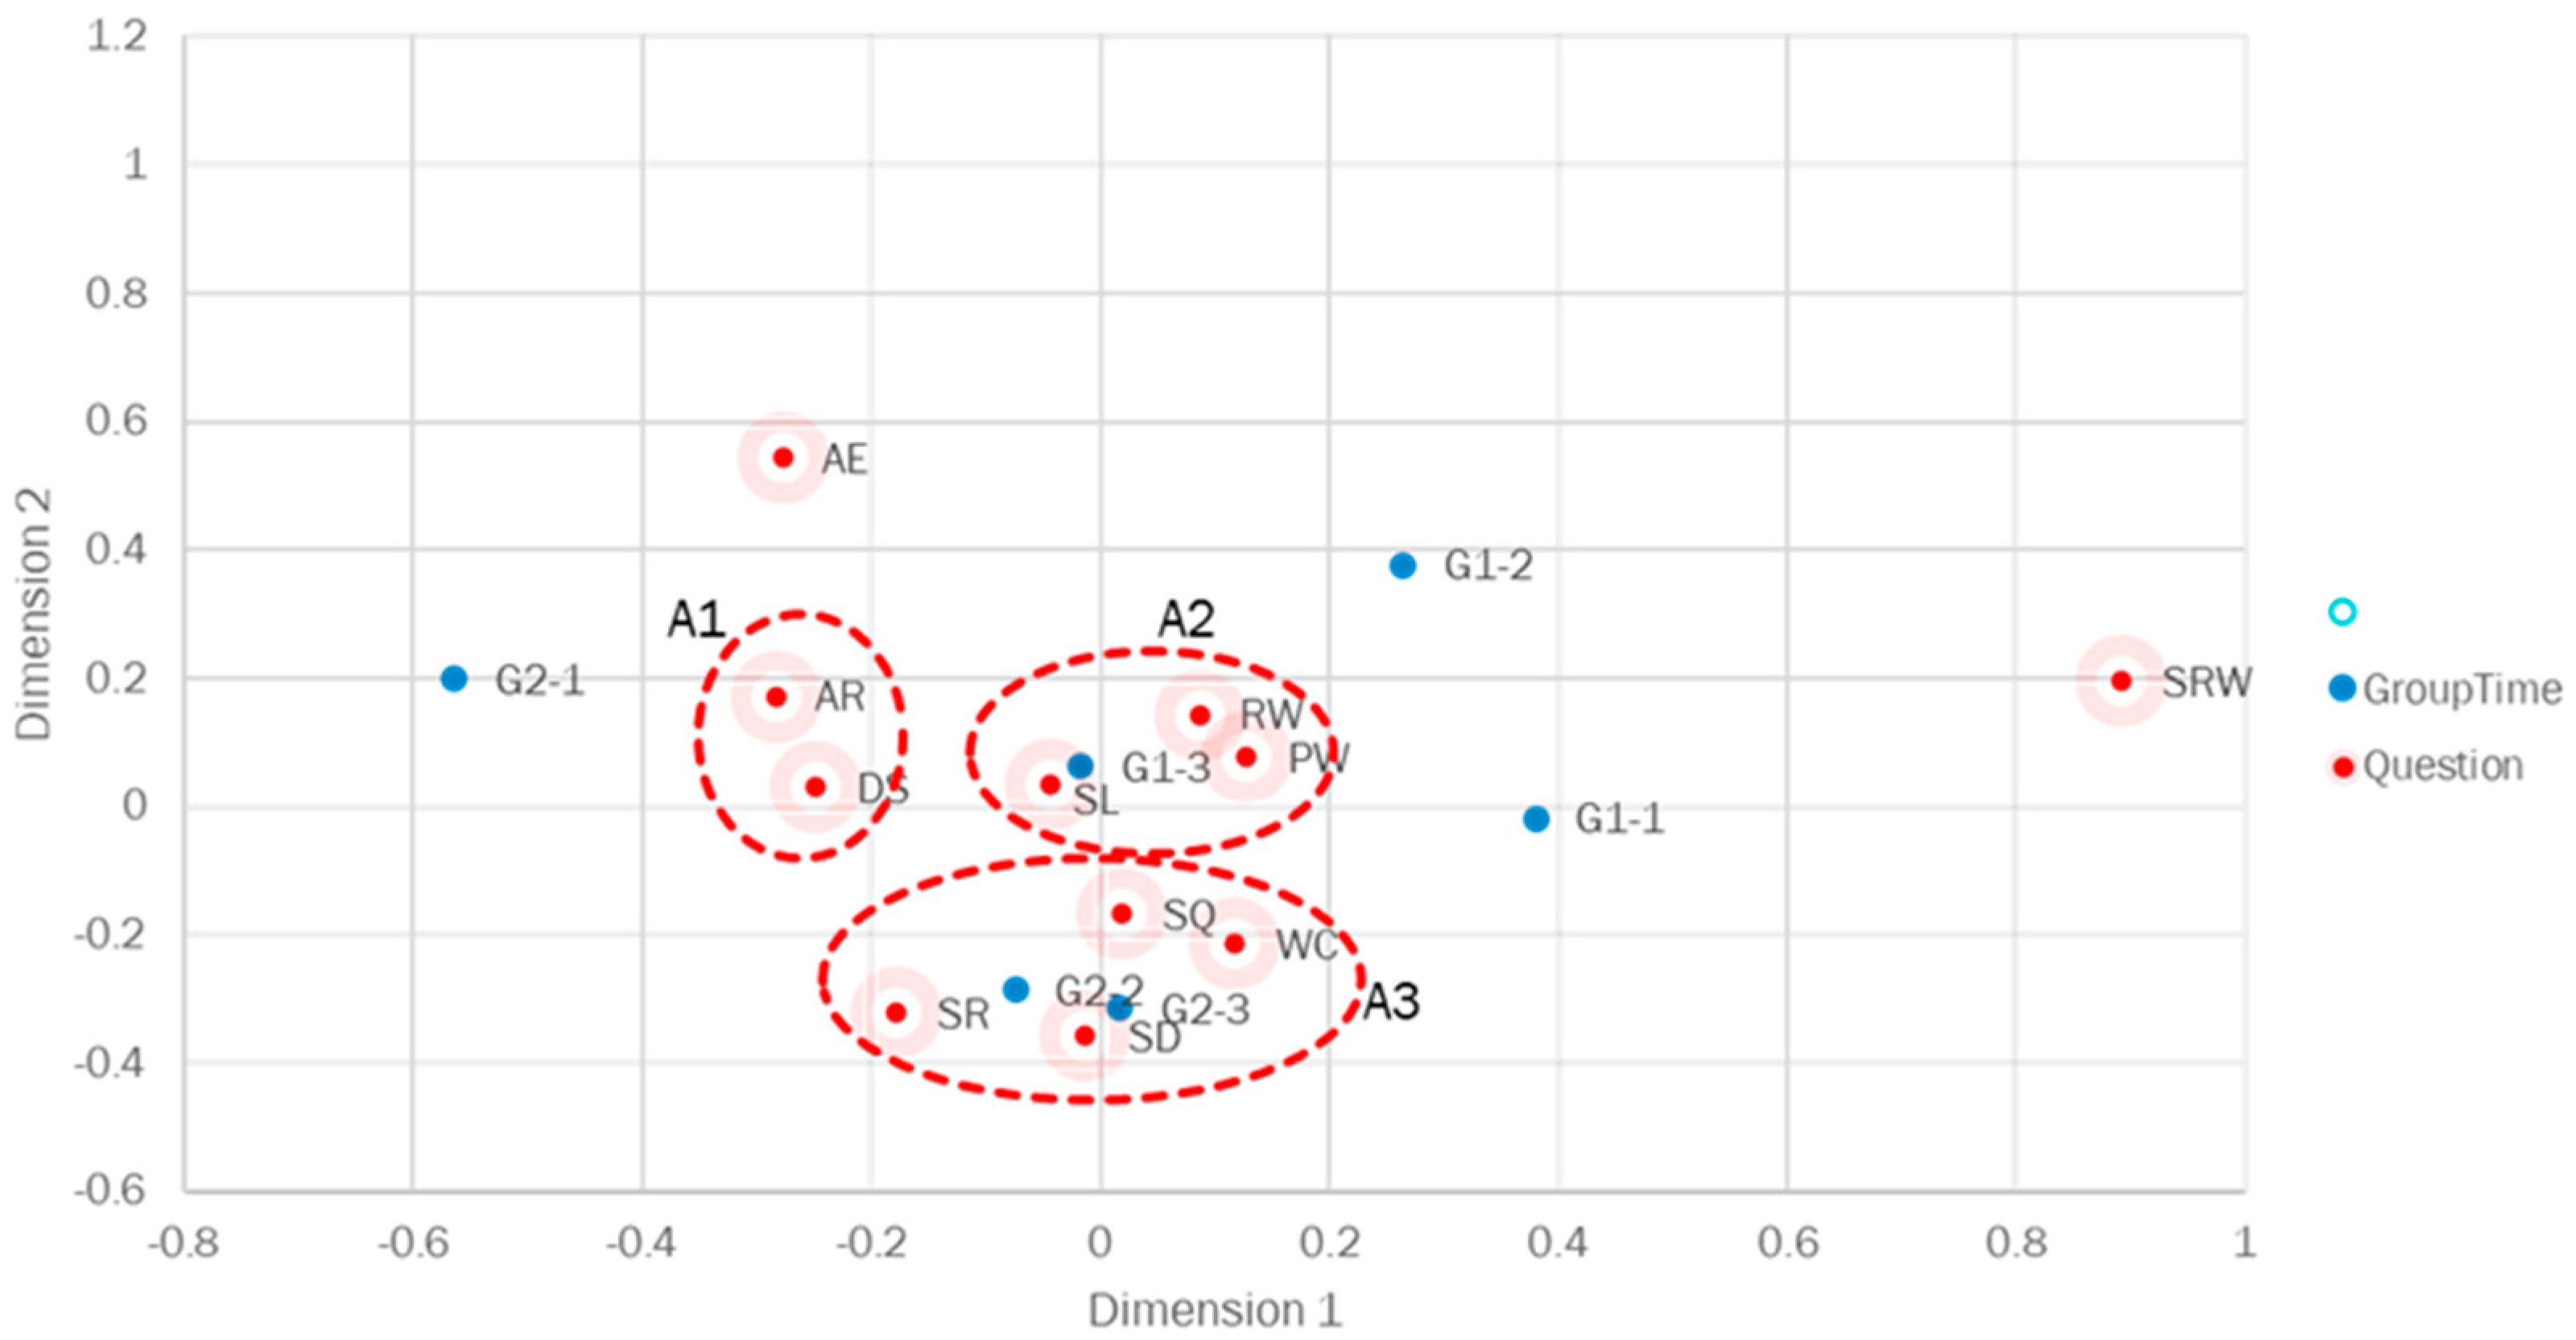
Figure 8 presents the results of the correspondence analysis conducted on the responses (average of G1 and G2) to the survey featuring a 7-point Likert scale (AE, WC, DS, SR, SRW, AR, SQ, SD, PW, RW, SL). As depicted in
Figure 8, the survey items AR, DS (A1 called as a rest for stress relief area) and PW, RW, SL (A2 called as a job and life satisfaction area) as well as WC, SR, SQ, SD (A3 called as a sleep and stress for weight control area) are proximate to each other, indicating that each set of categories is interrelated. Furthermore, it was observed that G1 at Time3 is encompassed in a job and life satisfaction area, and both G2 at Time2 and Time3 are encompassed in a sleep and stress for weight control area, indicating that each response exhibits a strong tendency for each category.
Figure 9 presents the summary of the correspondence analysis. With a contribution rate of 0.861 in Dimension 1 and Dimension 2, a high explanatory power is demonstrated.
4. Discussion
4.1. At the Start of the Exercise Program
As shown in
Figure 3 and
Figure 4, at the start of the exercise program, both the tele-exercise group (G1) and the face-to-face exercise group (G2) had experienced weight gain and longer sleep durations due to remote work. In Japan, the government expanded the declaration of emergency nationwide on April 16, 2020, and an expert panel recommended to the government behavior modification, an 80% reduction in the flow of people, refraining from unnecessary outings, and the introduction of telework. As a result of these recommendations, the promotion of remote work and the suggestion to refrain from going out led to reports of weight gain due to lack of exercise and increased sleep duration [
13]. Globally, weight gain has also been reported due to lockdowns caused by the coronavirus pandemic [
14]. In this study as well, weight gain and increased sleep duration due to remote work were observed prior to the start of the exercise program (July 2021). It is conjectured that this is the result of decreased physical activity due to remote work promoted by calls for refraining from going out, leading to weight gain. In addition, it is also inferred that sleep duration increased due to the reduction in commuting time as a result of remote work.
4.2. Two-Way Repeated Measures ANOVA
As shown in
Figure 5, a significant difference was observed in DS between groups G1 and G2. Daily Stress increases for the tele-exercise group (G1) and decreases for the face-to-face exercise group (G2).
The tele-exercise group (G1), which exercises at home, does not go out for exercise and does not engage in communication during exercise. Therefore, it is believed that they spend more time staying at home, resulting in higher daily stress. On the other hand, the face-to-face exercise group (G2) goes out for exercise and communicates face-to-face during exercise, so it is believed that their daily stress is lower.
In this way, even though exercise is performed, the tele-exercise group was unable to alleviate daily stress. It was demonstrated that mood states were not correlated with current physical activity patterns [
15]. Given the circumstances of COVID-19-related confinement, it seemed highly improbable that individual physical activity patterns alone could mitigate potential mood and behavioral impairments. Additionally, there was no evidence of an association between perceived changes in physical activity and anxiety when comparing twins who reported an increase with those who reported no change in physical activity [
16].
4.3. Autocorrelation and Correlation
The tele-exercise group (G1) exhibited self-correlations greater than or equal to 0.8 for BMI, PRS, DS, SR, SQ, PW, and SL. These variables appear to be strongly influenced by time, emphasizing the importance of continuity. Additionally, within the tele-exercise group (G1), all four combinations of PRS and SQ, as well as DS and SL, had correlation coefficients greater than 0.8. Furthermore, all four combinations of BMI with PRS and BMI with SQ had correlation coefficients less than -0.8.
In this manner, it was suggested that the tele-exercise group (G1) can enhance work productivity by obtaining good-quality sleep, even in situations of increased Daily Stress.
For instance, research revealed a significant impact of subjective sleep quality on presenteeism, suggesting that maintaining good sleep hygiene could be crucial for enhancing workers’ productivity [
17]. Moreover, the study demonstrated that the reduction of job demands or work-related pressure could result in enhanced sleep quality among employees, ultimately contributing to their mental health, well-being, and overall productivity [
18].
The tele-exercise group (G1) suggested the potential to enhance work productivity even when experiencing increased Daily Stress, possibly due to the moderate stress levels. The Yerkes-Dodson law elucidates the correlation between stress and performance in the form of an inverted-U curve. It posits that an optimal level of stress can facilitate peak performance [
19].
The tele-exercise group (G1) suggested that by effectively managing moderate levels of Daily Stress, it could potentially enhance work productivity and, in turn, increase life satisfaction. Research has demonstrated that when an employee’s job performance improves due to increased work commitment and enhanced task competence, it leads to an enhancement in their life satisfaction [
20]. Moreover, the study indicated that greater work satisfaction had a positive impact on overall life satisfaction [
21].
The tele-exercise group (G1) suggested that by effectively managing moderate levels of Daily Stress, it might be possible to enhance work productivity, which, in turn, could help control obesity. Controlling obesity was indicated as a means to improve sleep quality.
It has been demonstrated that there is a relationship between working hours and obesity even after adjusting for confounding variables, including occupational and health-related characteristics that may influence obesity. Furthermore, insufficient sleep was found to have a mediating effect on the connection between working hours and obesity. Consequently, these findings suggest the importance of identifying factors such as working and sleeping hours for the prevention and management of obesity in wage workers [
22].
The face-to-face exercise group (G2) exhibited self-correlations greater than or equal to 0.8 for SR, SRW, ST, SQ, and PW. These variables appear to be strongly influenced by time, emphasizing the importance of continuity.
4.4. Correspondence Analysis
Time3 of the tele-exercise group (G1) is included in PW, RW, SL (A2), while Time2 and Time3 of G2 are included in WC, SR, SQ, SD (A3). Strong responses are observed in each category’s trends. The tele-exercise group (G1) suggested a strong interest in job satisfaction and life satisfaction after completing the tele-exercise program.
Numerous studies have also reported a substantial enhancement in the quality of life (QoL) among office workers who engaged in supervised physical exercise. One study demonstrated that a 17-week exercise program conducted online and guided by a physiotherapist had a positive impact on the QoL perception of office workers [
23].
The face-to-face exercise group (G2) indicated a strong interest in stress relief and sleep quality both during and after face-to-face exercise sessions. It was demonstrated that exercise intervention (referred to as face-to-face exercise intervention) significantly improved depressive symptoms, alleviated anxiety, enhanced the quality of life, and reduced psychological stress and related stress symptoms in patients [
24]. Moreover, the results of a meta-analysis indicate that participation in exercise training (considered as face-to-face exercise training) has a moderately beneficial effect on sleep quality, reducing both sleep latency and the use of sleep medication [
25].
5. Conclusion
The study involved 16 participants divided into two groups: tele-exercise group (G1) and face-to-face exercise group (G2). However, the final participant count was 5 in G1 and 7 in G2. The study examined various factors related to remote work and exercise, with
Figure 2 displaying participant attributes.
At the start of the experiment in July 2021, both G1 and G2 experienced weight gain and longer sleep durations due to remote work. This was attributed to decreased physical activity and reduced commuting time.
A two-way repeated measures ANOVA was conducted, revealing no significant differences between time terms and interaction terms for various factors. However, Daily Stress (DS) showed a significant difference between G1 and G2, with G1 experiencing higher DS than G2.
Autocorrelation and correlation analysis showed that several variables in G1, such as BMI, PRS, DS, SR, SQ, PW, and SL, had strong relationships with time. The pairs of PRS and SQ, and DS and SL had strong positive correlation. The pairs of BMI and PRS, and BMI and SQ had strong negative correlation.
In contrast, G2 exhibited autocorrelation above 0.8 for SR, SRW, ST, SQ, and PW. There were no strong correlations between variables in G2.
Correspondence Analysis (CA) was performed on survey responses, showing that certain categories of responses were closely related. G1 at Time3 was associated with job and life satisfaction, while G2 at Time2 and Time3 was related to stress relief and sleep quality.
It was noted that both groups initially experienced weight gain and increased sleep duration due to remote work. Daily Stress was found to be significantly higher in G1 than in G2, possibly due to the isolation of tele-exercise. Autocorrelation and correlation analyses highlighted the influence of time on various factors, and some correlations suggested potential ways to enhance work productivity and control obesity.
In conclusion, the study revealed differences between the two exercise groups in terms of stress levels and highlighted the importance of managing stress and maintaining good sleep quality in remote work settings. It also suggested that exercise interventions could have positive effects on participants’ well-being and productivity.
Acknowledgments
The research was financially supported by the TANITA Healthy Weight Community Trust.
References
- Gratton L, Scott A, Caulkin S. 100 year life: A gift or a curse. London Bus Sch Rev 2016, 27, 40–43. [CrossRef]
- Van Solinge H, Henkens K. Living longer, working longer? The impact of subjective life expectancy on retirement intentions and behaviour. Eur J Public Health 2010, 20, 47–51. [CrossRef] [PubMed]
- Wolfe RA, Parker DF. Employee health management: Challenges and opportunities. Acad Manage Perspect 1994, 8, 22–31. [CrossRef]
- Terry PE, Grossmeier J, Mangen DJ, Gingerich SB. Analyzing best practices in employee health management. J Occup Environ Med 2013, 55, 378–392. [CrossRef]
- Kuswari M, Rimbawan R, Hardinsyah H, Dewi M, Gifari N. Effects of Tele-Exercise and Nutrition Tele-Counselling on Fitness Level of Obese Employee during COVID-19 Pandemic Time. JUARA: J Olahraga 2022, 7, 138–150. [CrossRef]
- Tison G et al. Worldwide Effect of COVID-19 on Physical Activity: A Descriptive Study. Ann Intern Med 2021, 173, 767–770. [CrossRef]
- Schultz AB, Edington DW. Employee health and presenteeism: a systematic review. J Occup Rehabil 2007, 17, 547–579. [CrossRef] [PubMed]
- Goetzel RZ, Long SR, Ozminkowski RJ, Hawkins K, Wang S, Lynch W. Health, absence, disability, and presenteeism cost estimates of certain physical and mental health conditions affecting U.S. employers. J Occup Environ Med 2004, 46, 398–412. [CrossRef] [PubMed]
- Soubelet-Fagoaga I, Arnoso-Martínez M, Guerendiain-Gabás I, Martínez-Moreno E, Ortiz G. (Tele) Work and Care during Lockdown: Labour and Socio-Familial Restructuring in Times of COVID-19. Int J Environ Res Public Health 2021, 18, 12087. [CrossRef]
- Simonelli G, Petit D, Delage JP, Michaud X, Lavoie MD, Morin CM, Bastien C. Sleep in times of crises: A scoping review in the early days of the COVID-19 crisis. Sleep Med Rev 2021, 60, 101545. [CrossRef] [PubMed]
- Möhring K, Naumann E, Reifenscheid M, Wenz A, Rettig T, Krieger U, Blom AG. The COVID-19 pandemic and subjective well-being: longitudinal evidence on satisfaction with work and family. Eur Soc. 2021, 23 (Sup1), S601–S617. [CrossRef]
- Haufe S, Kerling A, Protte G, Bayerle P, Stenner HT, Rolff S, Tegtbur U. Telemonitoring-supported exercise training, metabolic syndrome severity, and work ability in company employees: a randomised controlled trial. Lancet Public Health 2019, 4, e343–e352. [CrossRef] [PubMed]
- Iwane Mikino et al. Current Situation of the New Coronavirus Infection, New Working Styles and New Stress in the Corona Calamity. Bull Kansai Welfare Sci Univ EAP Res Inst 2021, 15, 1–8.
- Flanagan EW et al. The impact of COVID-19 stay-at-home orders on health behaviors in adults. Obesity 2021, 29, 438–445. [CrossRef] [PubMed]
- Aghababa A et al. No evidence of systematic change of physical activity patterns before and during the Covid-19 pandemic and related mood states among Iranian adults attending team sports activities. Front Psychol 2021, 12, 641895. [CrossRef] [PubMed]
- Duncan GE et al. Perceived change in physical activity levels and mental health during COVID-19: Findings among adult twin pairs. PloS One 2020, 15, e0237695. [CrossRef]
- Ishibashi Y, Shimura A. Association between work productivity and sleep health: A cross-sectional study in Japan. Sleep Health 2020, 6, 270–276, Epub 2020 Apr 28. [CrossRef] [PubMed]
- Lyons S, Strazdins L, Doan T. Work intensity and workers’ sleep: A case of working Australians. Hum Soc Sci Commun 2022, 9, 1–7. [CrossRef]
- Yerkes RM, Dodson JD. The relation of the strength of stimulus to the rapidity of habit-formation. J Comp Neurol Psychol 1980, 18, 459–82.
- Kumar P et al. Working in lockdown: the relationship between COVID-19 induced work stressors, job performance, distress, and life satisfaction. Curr Psychol. 2021, 1–16. [CrossRef]
- Coad A, Binder M. Causal linkages between work and life satisfaction and their determinants in a structural VAR approach. Econ Lett 2014, 124, 263–268. [CrossRef]
- Eum MJ, Jung HS. The interplay of sleep duration, working hours, and obesity in Korean male workers: The 2010–2015 Korea National Health and Nutrition Examination Survey. Plos One. 2021, 16, e0247746. [CrossRef]
- Moreira S et al. Positive Effects of an Online Workplace Exercise Intervention during the COVID-19 Pandemic on Quality of Life Perception in Computer Workers: A Quasi-Experimental Study Design. Int J Environ Res Public Health 2022, 19, 3142. [CrossRef] [PubMed]
- J Zhang J, Li S, Ji W. Exercise intervention improves the quality of life, anxiety, and depression of adolescent depression patients. Int J Clin Exp Med 2021, 14, 1292–1300.
- Yang PY et al. Exercise training improves sleep quality in middle-aged and older adults with sleep problems: a systematic review. J Physiother 2012, 58, 157–163. [CrossRef] [PubMed]
|
Disclaimer/Publisher’s Note: The statements, opinions and data contained in all publications are solely those of the individual author(s) and contributor(s) and not of MDPI and/or the editor(s). MDPI and/or the editor(s) disclaim responsibility for any injury to people or property resulting from any ideas, methods, instructions or products referred to in the content. |
© 2023 by the authors. Licensee MDPI, Basel, Switzerland. This article is an open access article distributed under the terms and conditions of the Creative Commons Attribution (CC BY) license (http://creativecommons.org/licenses/by/4.0/).
