Submitted:
07 December 2023
Posted:
12 December 2023
You are already at the latest version
Abstract
Keywords:
1. Introduction
2. Experimental Program
2.1. Materials
2.2. Concrete mixing and specimen preparation
2.3. Thermal and chemical (HC fluids) exposures
2.4. Tests
2.4.1. Residual mechanical properties test
2.4.2. Stress-strain test
2.4.3. Determination of Thermal Properties.
2.4.4. Fourier transform infrared spectroscopy (FTIR) analysis
2.4.5. Thermogravimetric (TG) and differential scanning calorimetry (DSC) analysis
2.4.6. Microstructural investigation
3. Result and discussion
3.1. Residual mechanical properties
3.1.1. Compressive strength
3.1.2. Indirect tensile strength
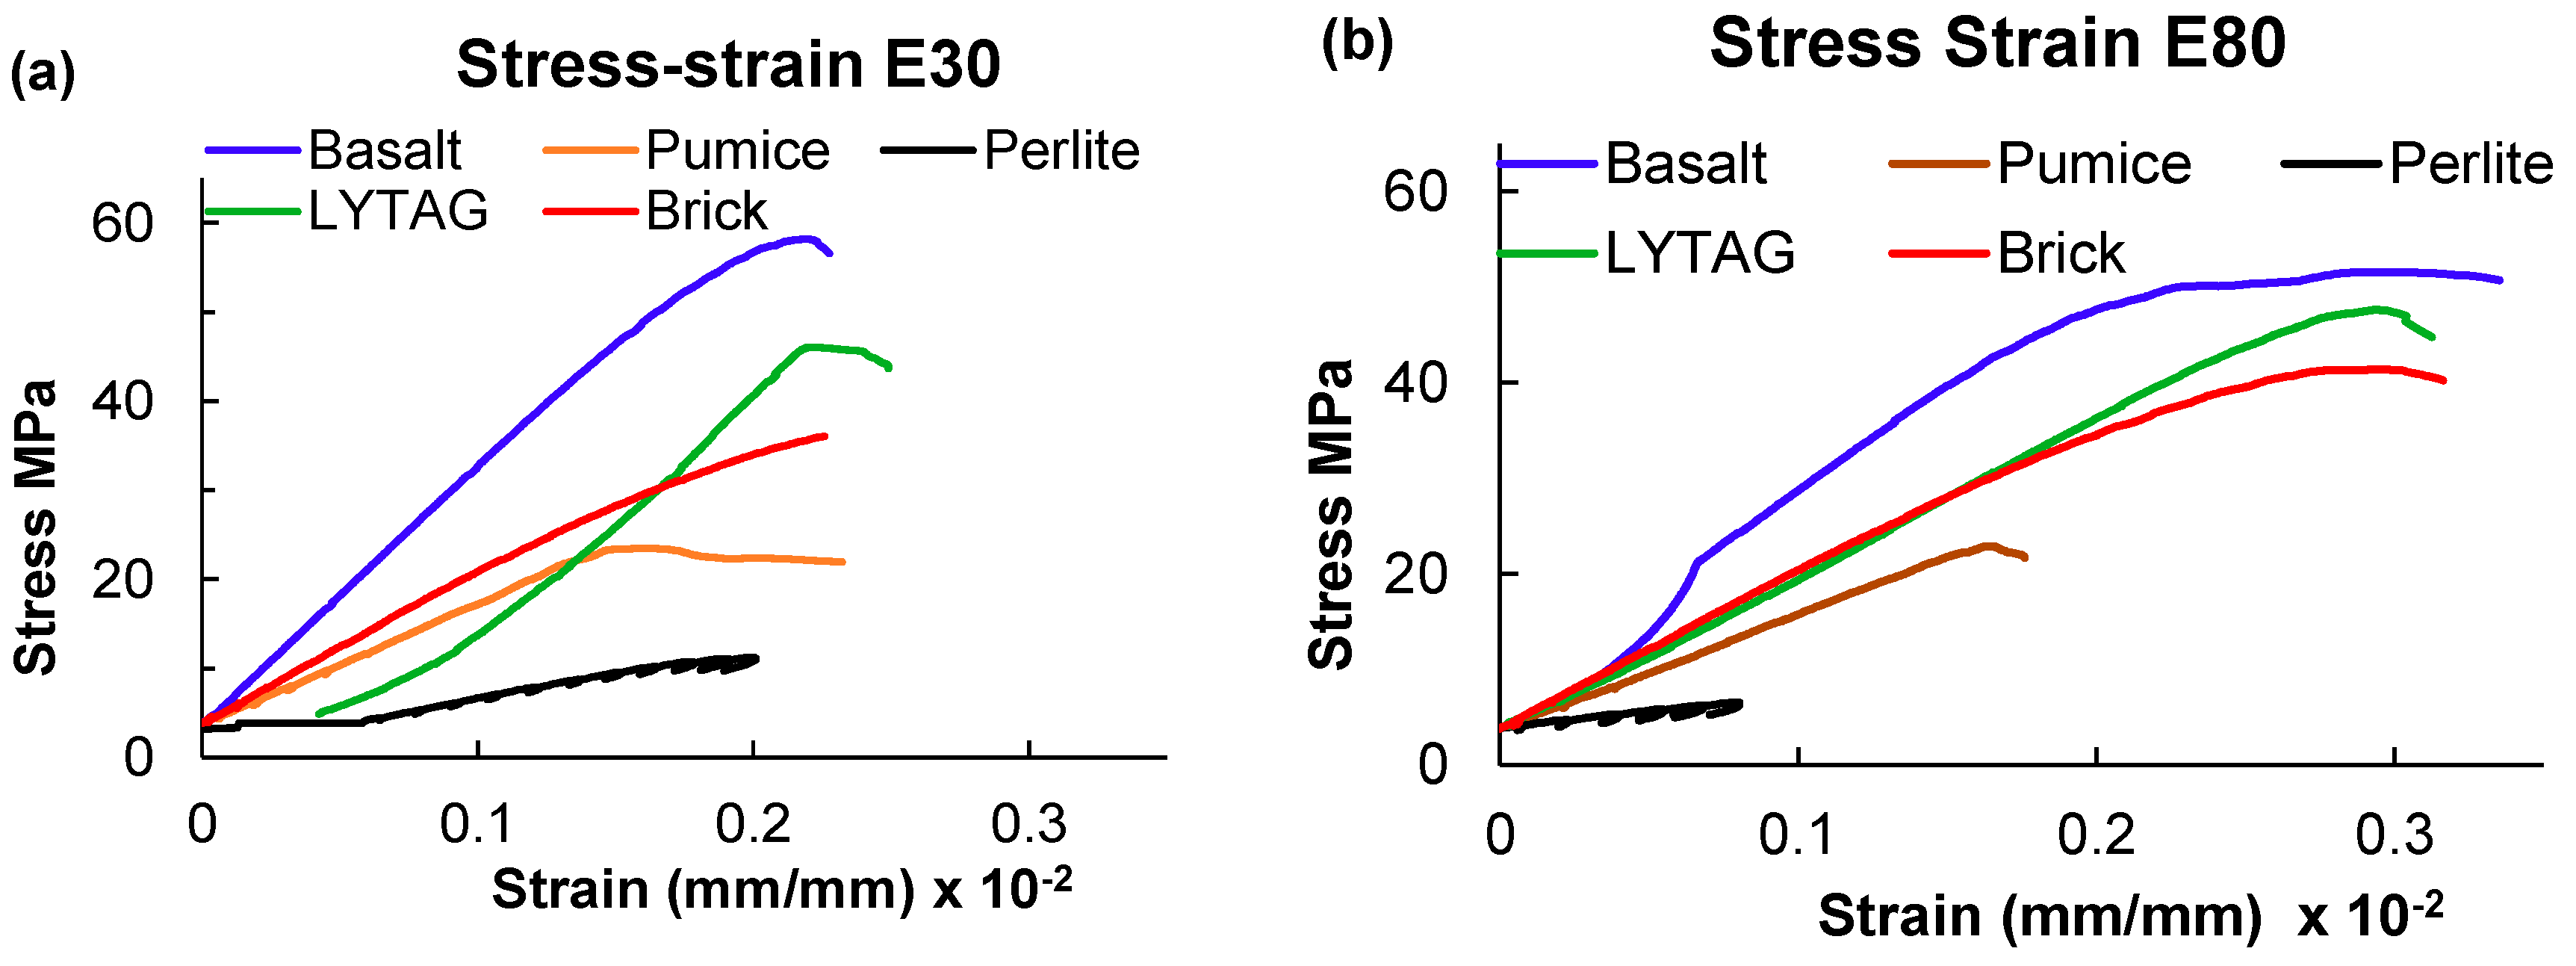
3.1.3. Stress-strain
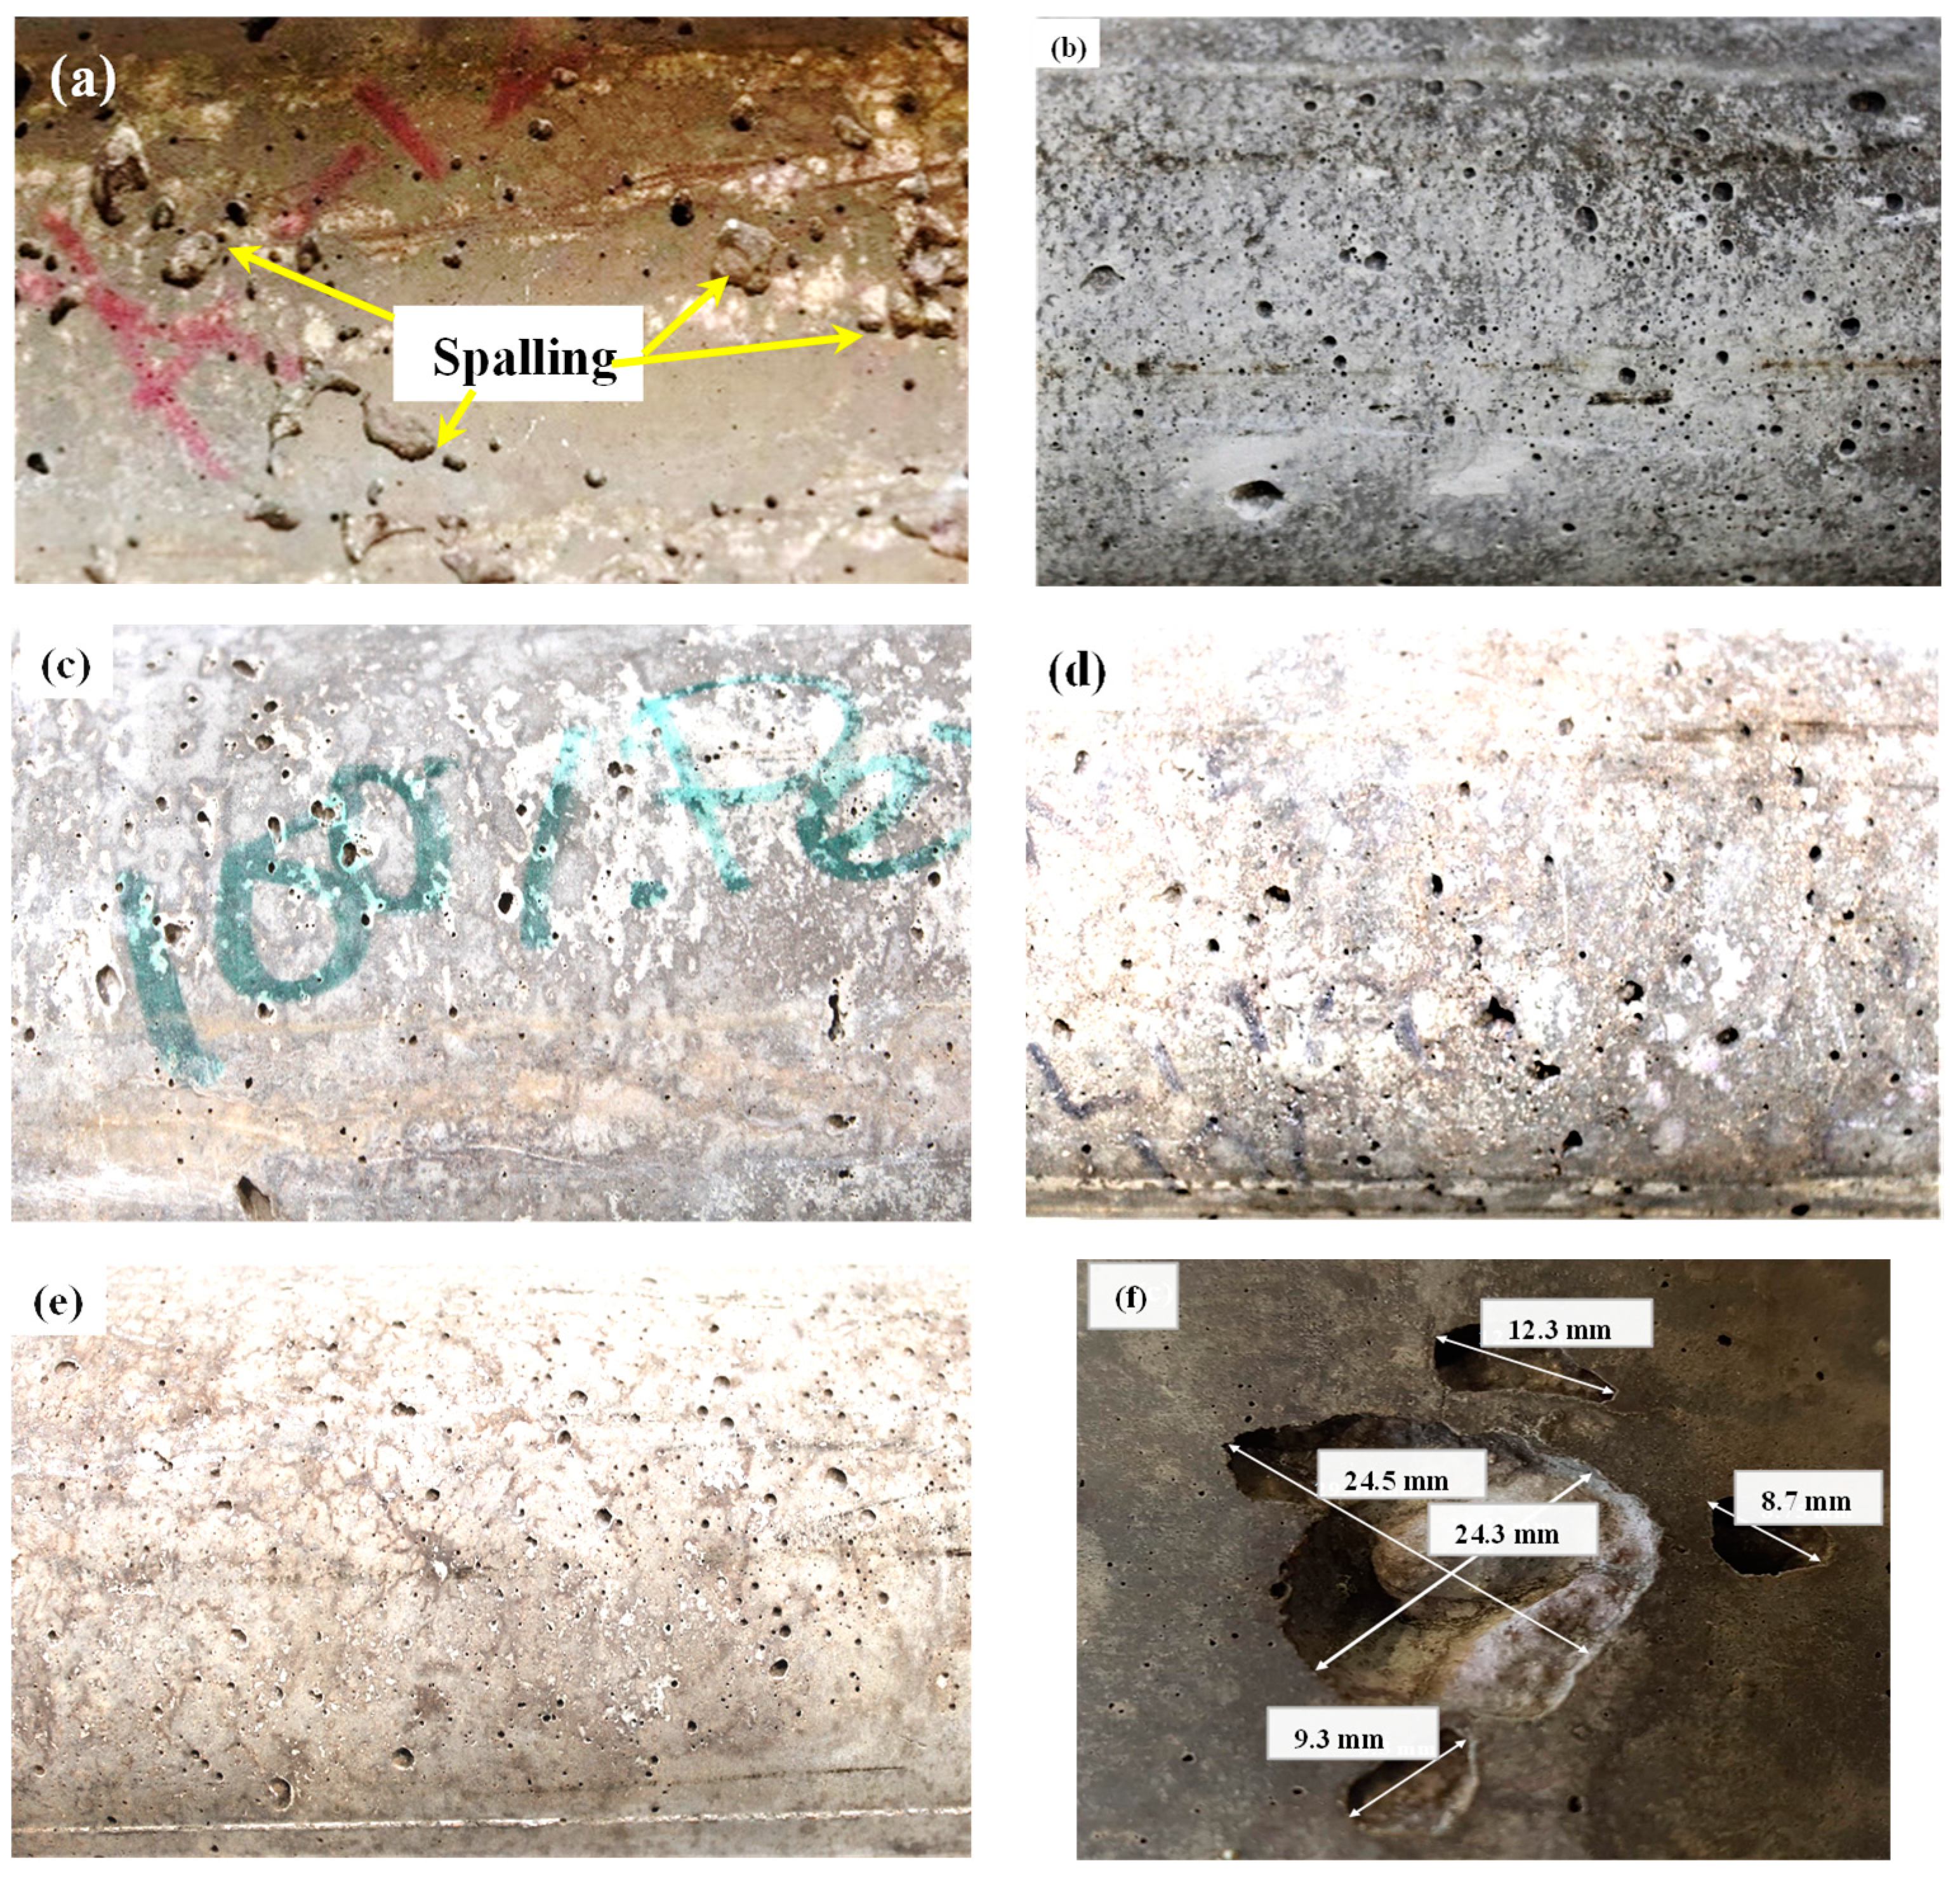
3.1.4. Concrete Spalling
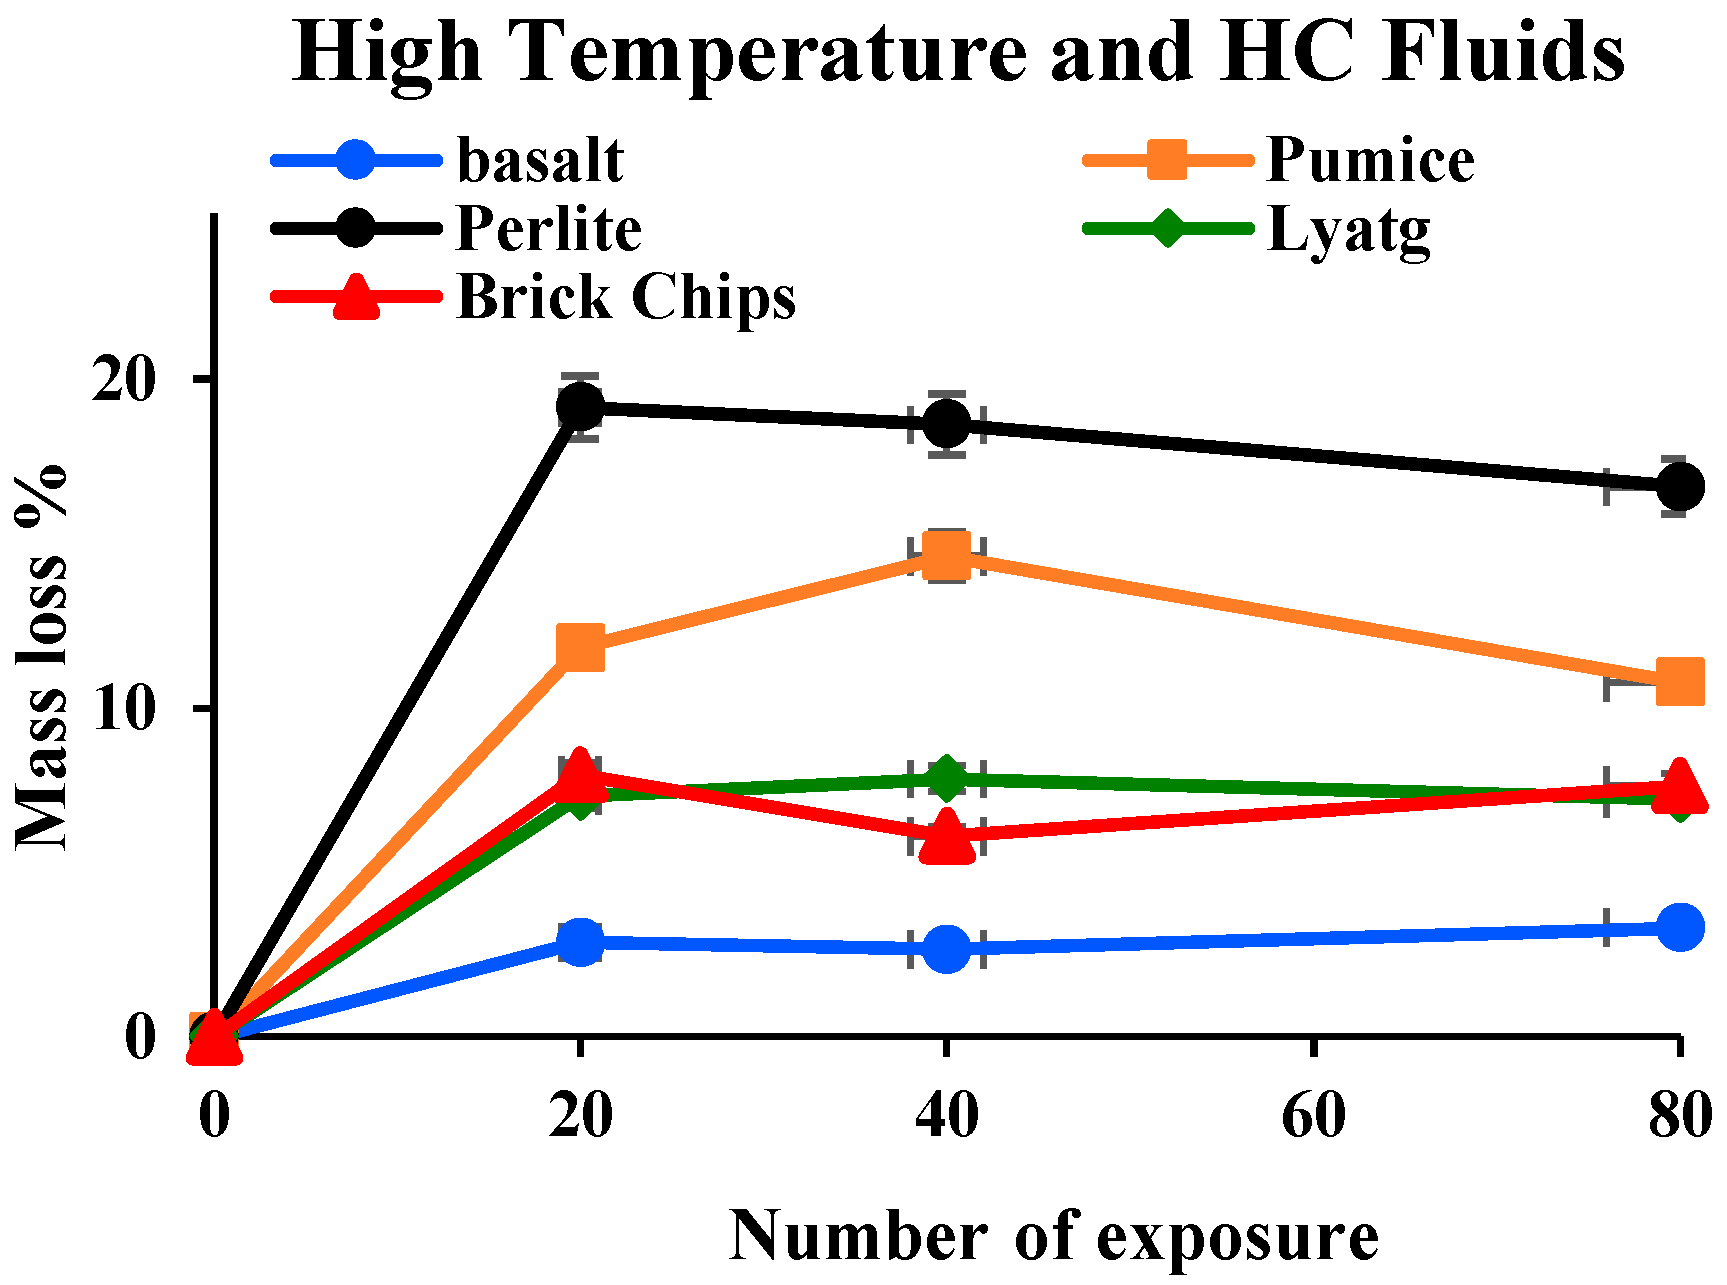
3.1.5. Mass Loss
3.2. Thermo-mechanical properties
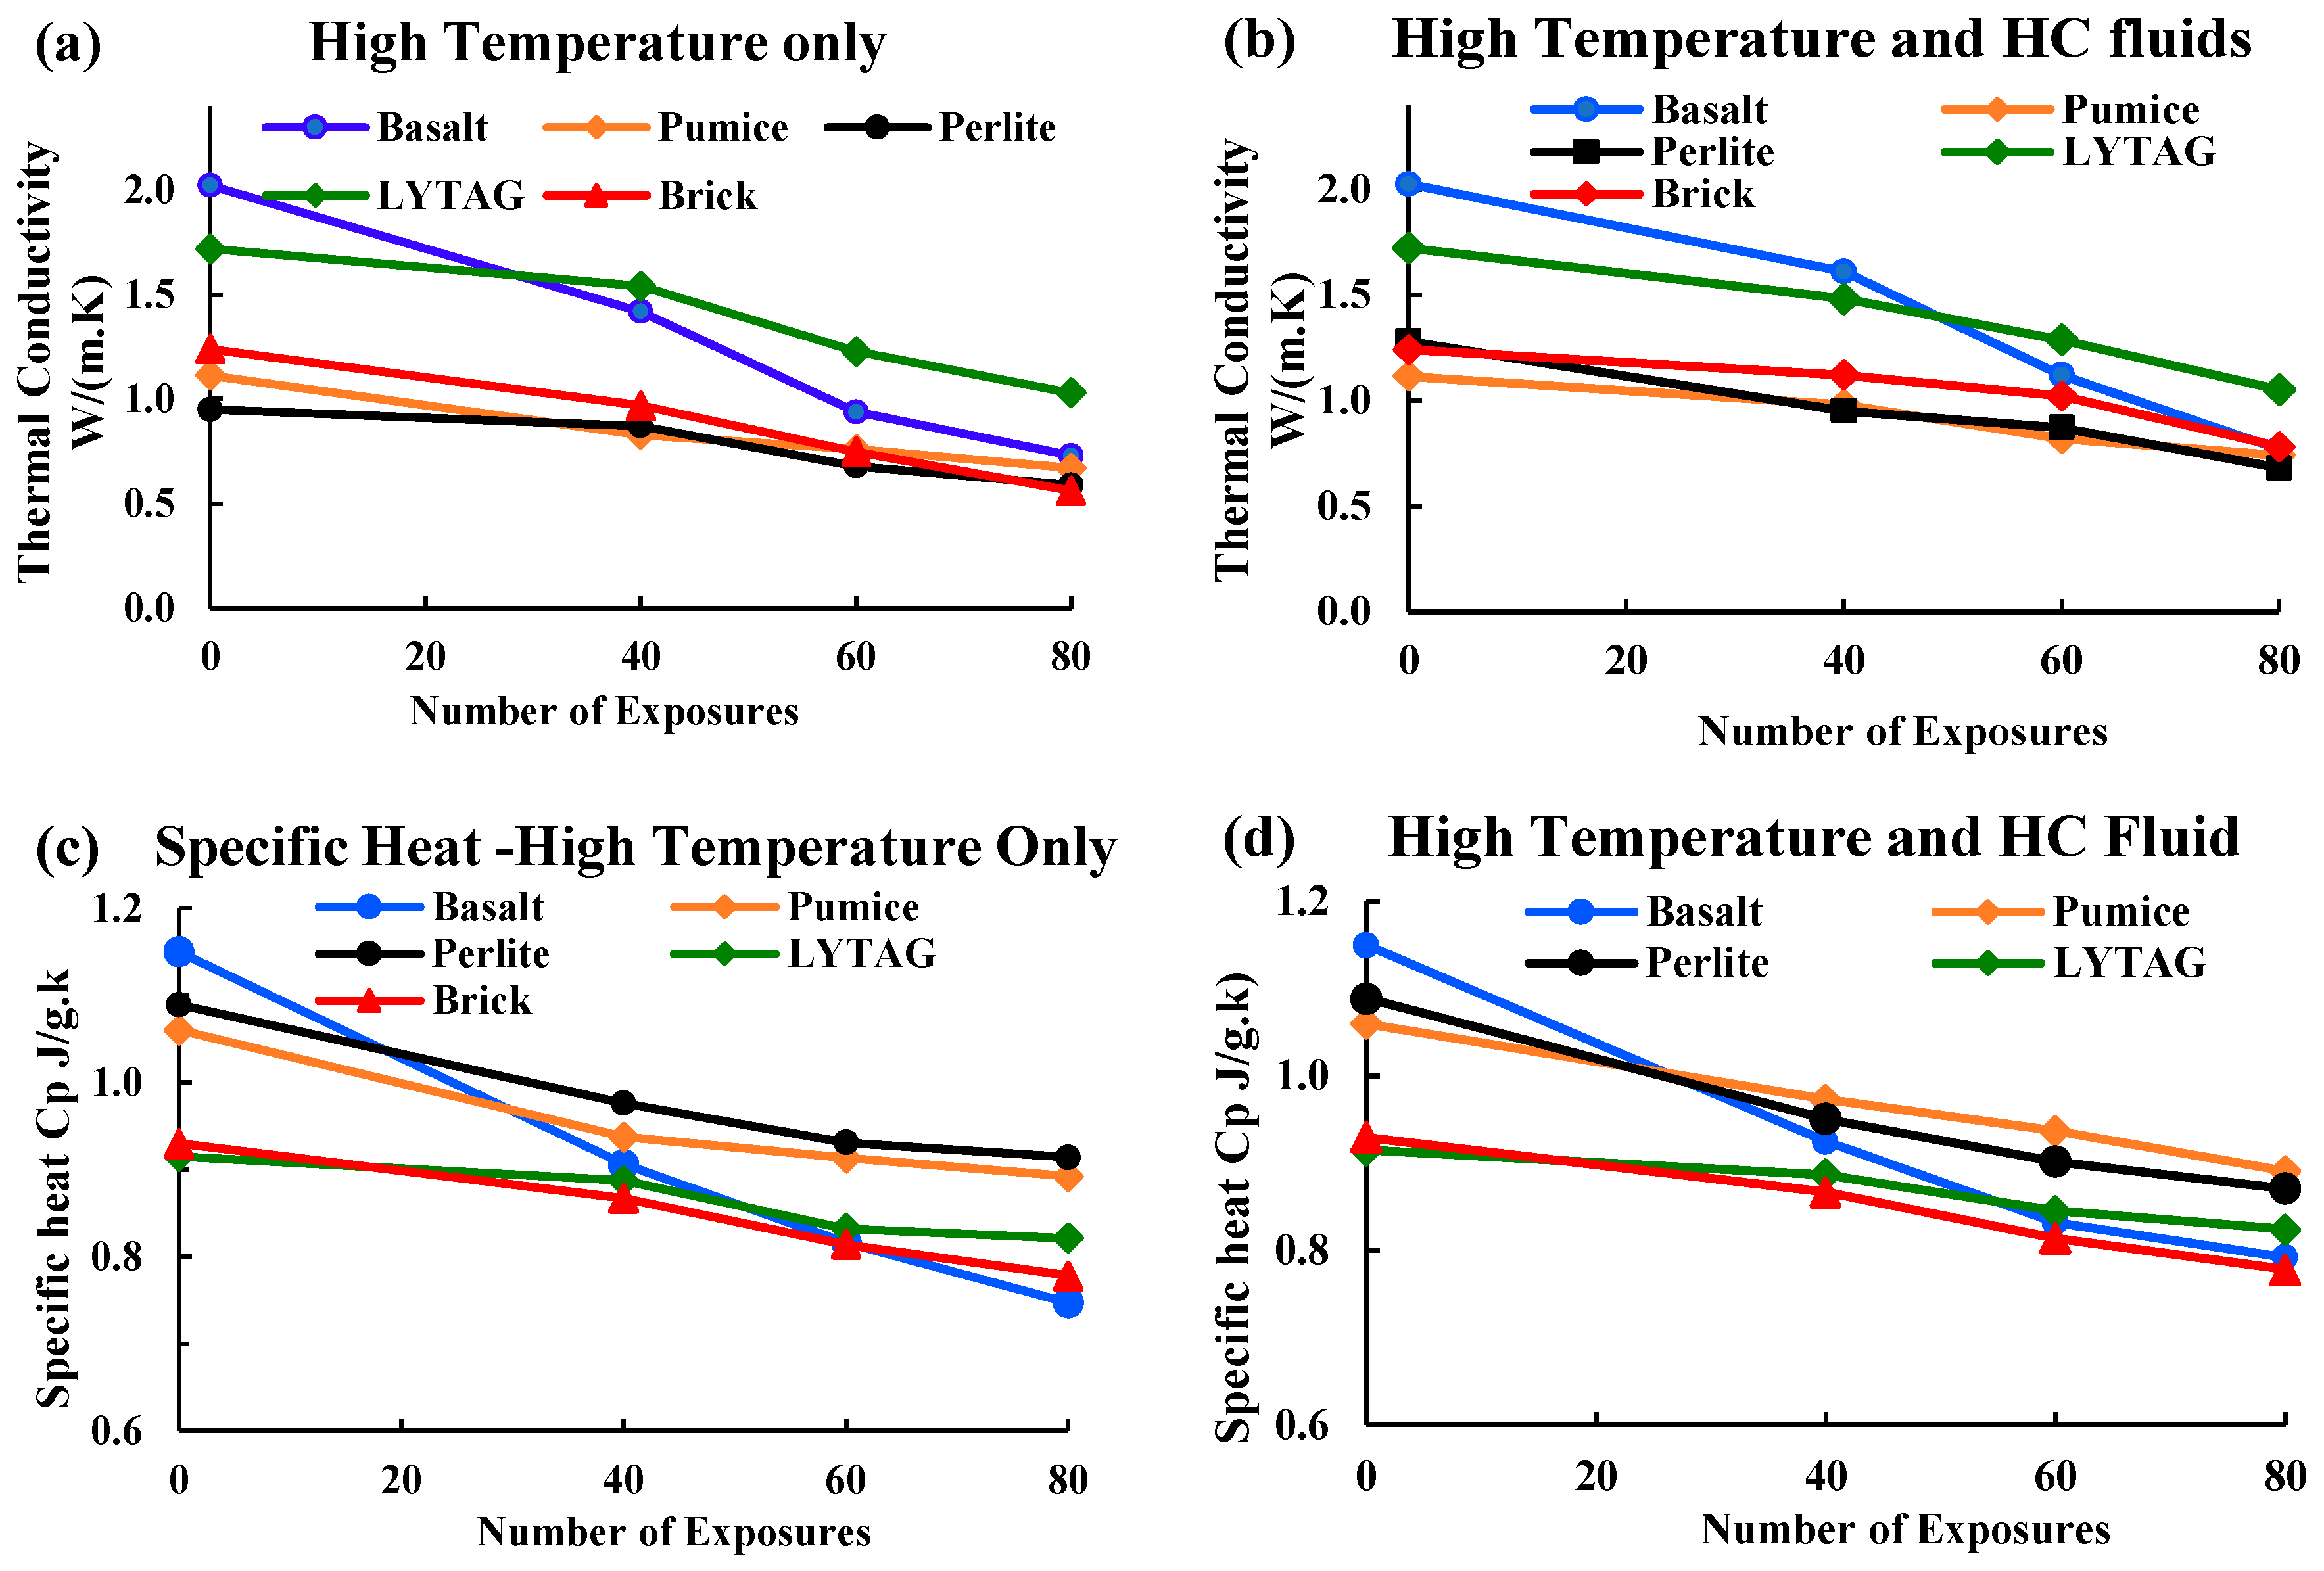
3.2.1. Thermal conductivity
3.2.2. Specific Heat
3.3. Thermochemical properties
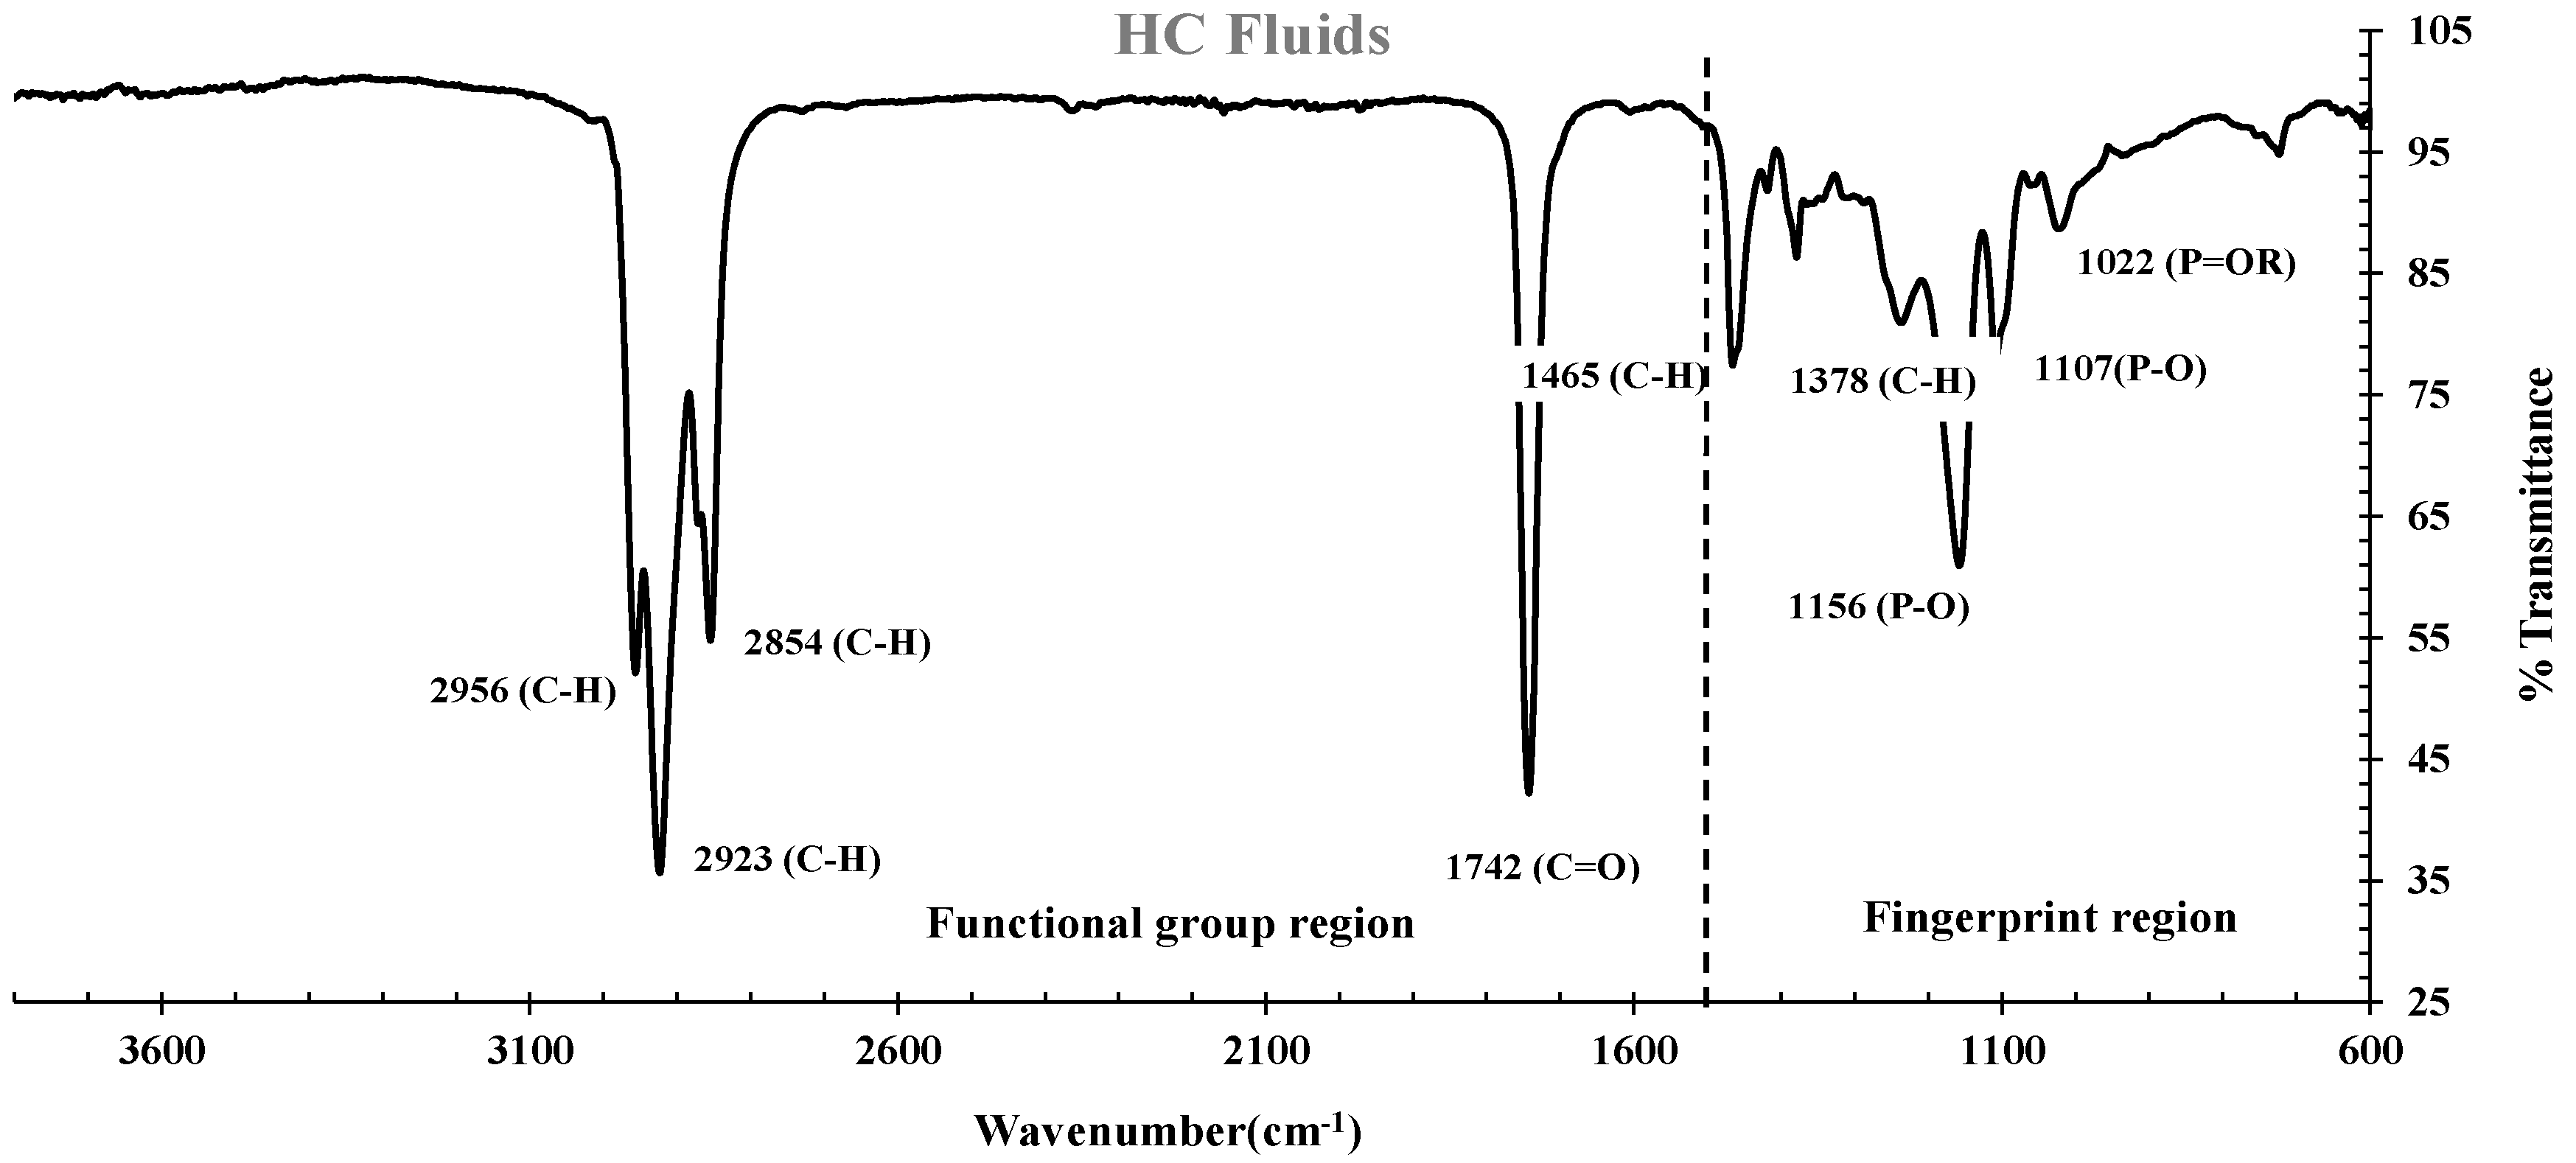
3.3.1. FTIR spectrums of HC fluids
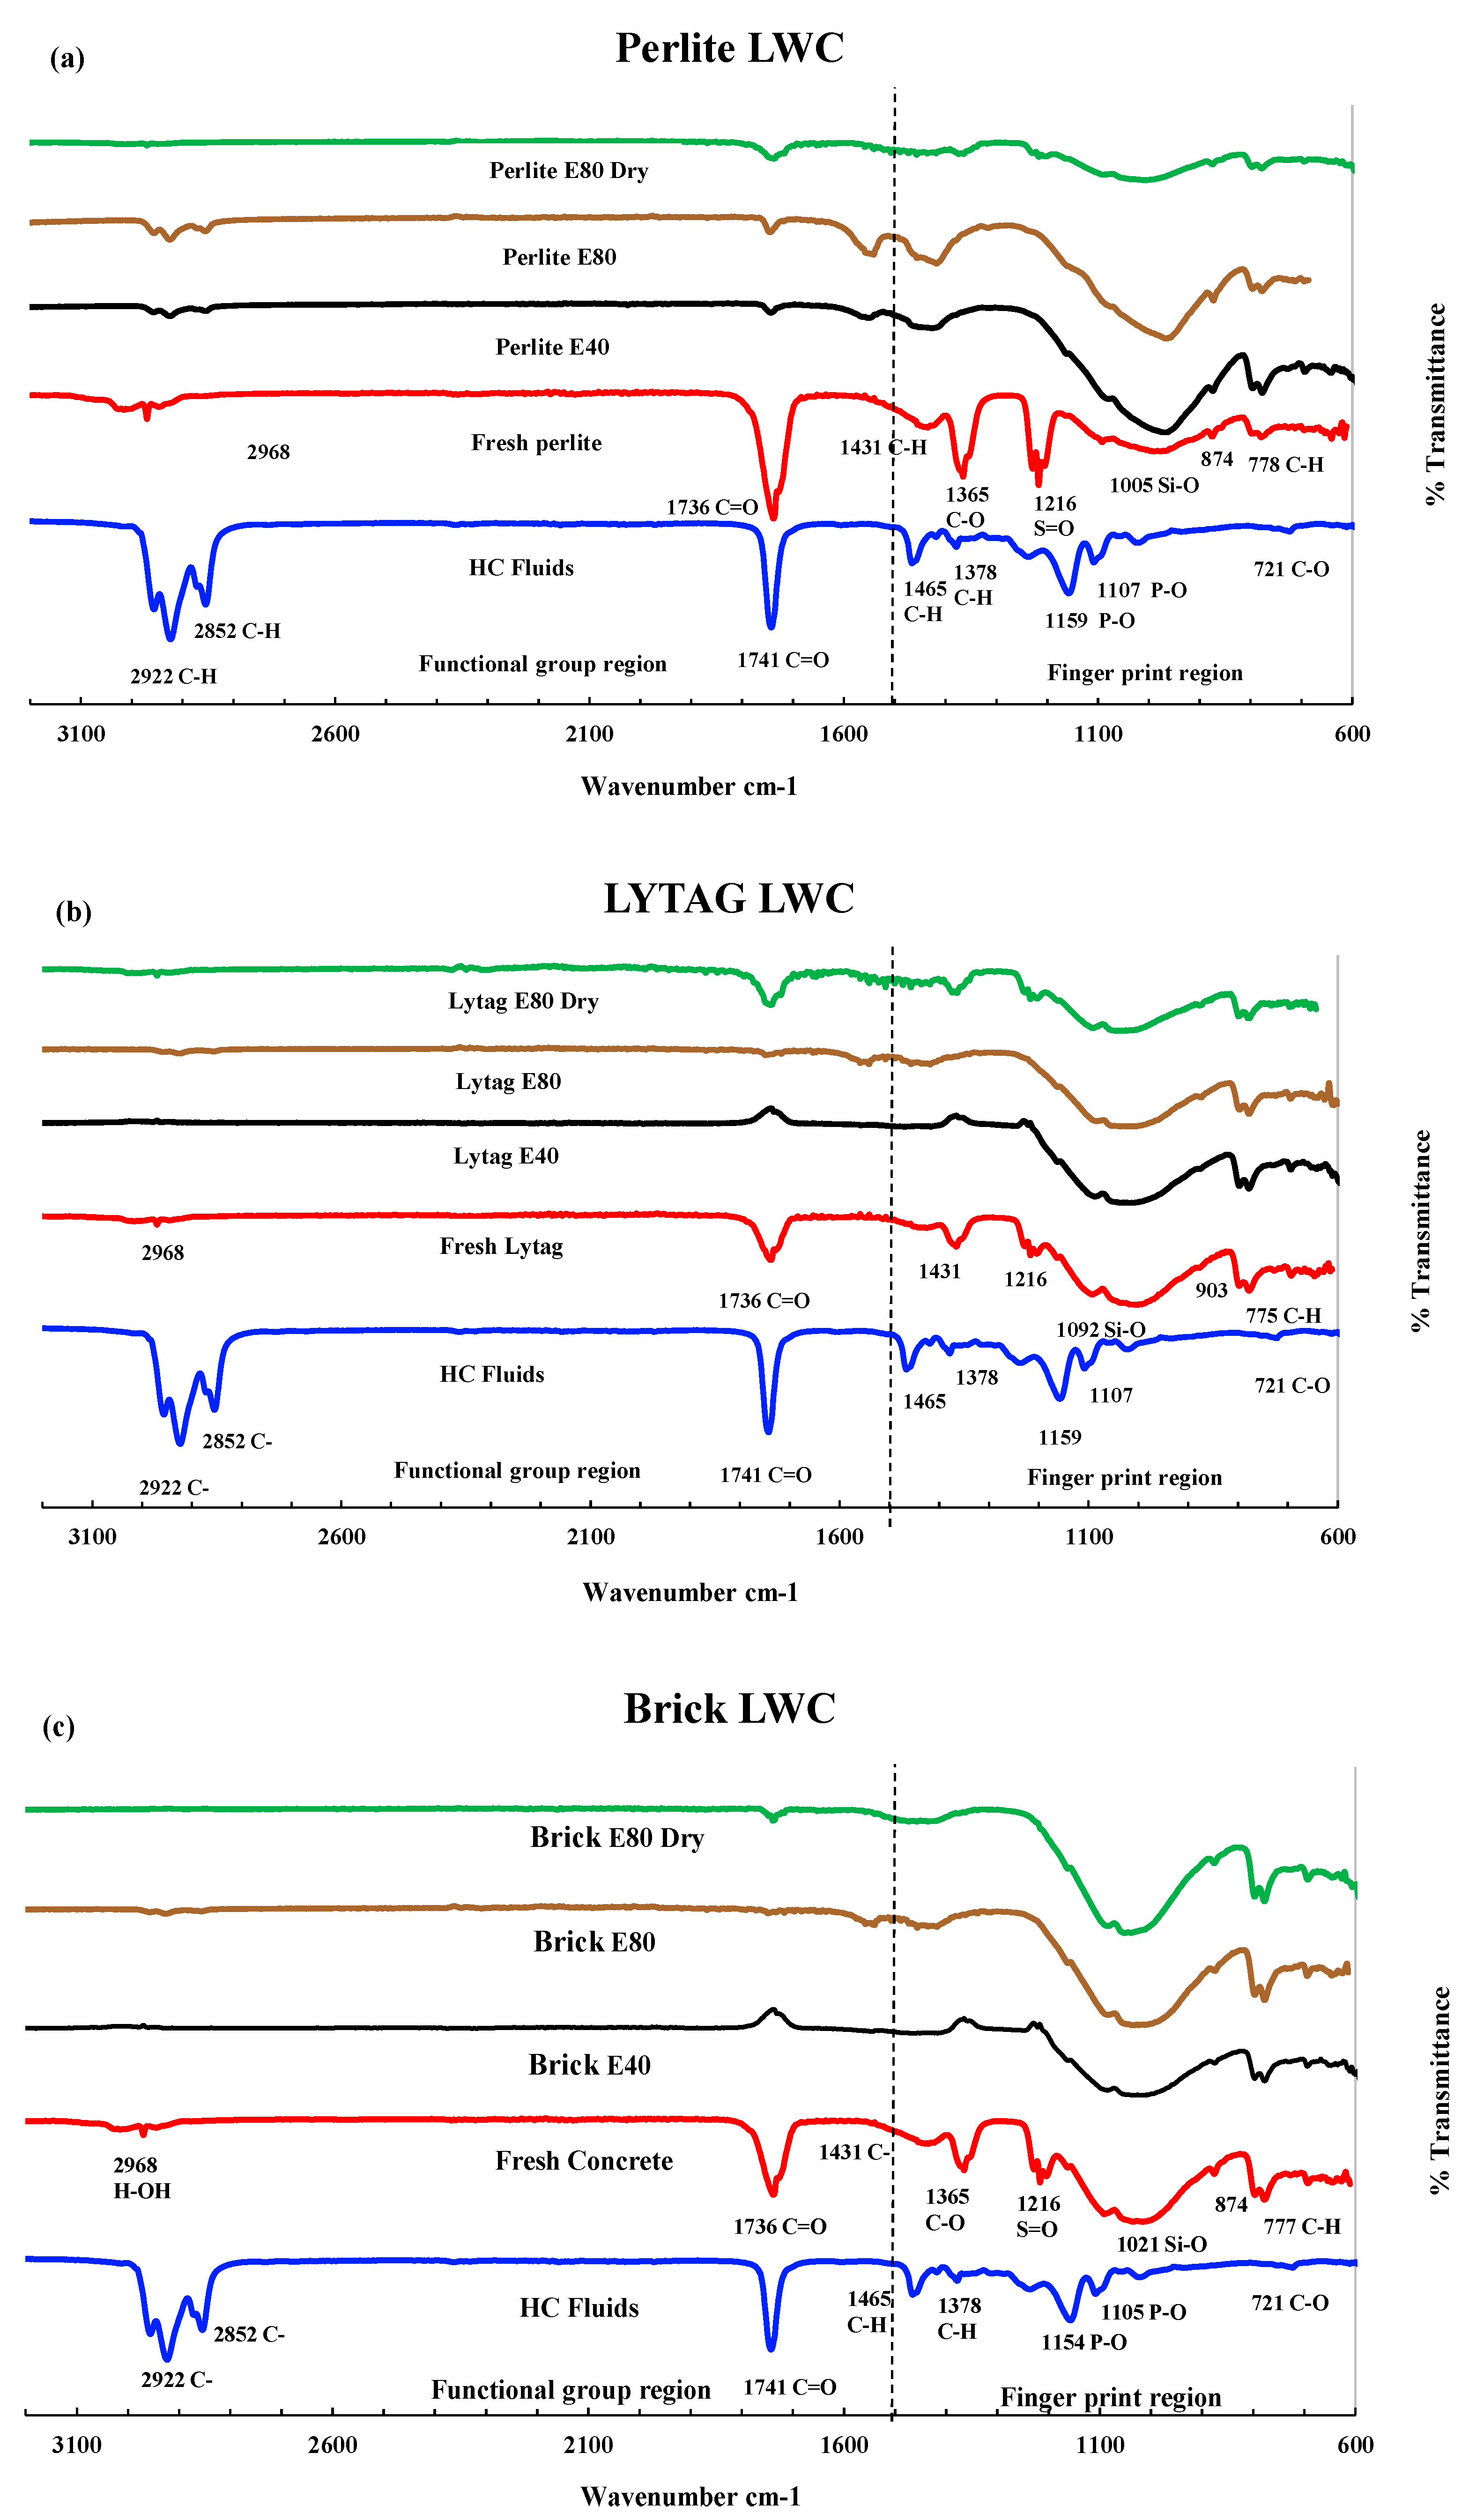
3.3.2. FTIR analysis of LWAC samples
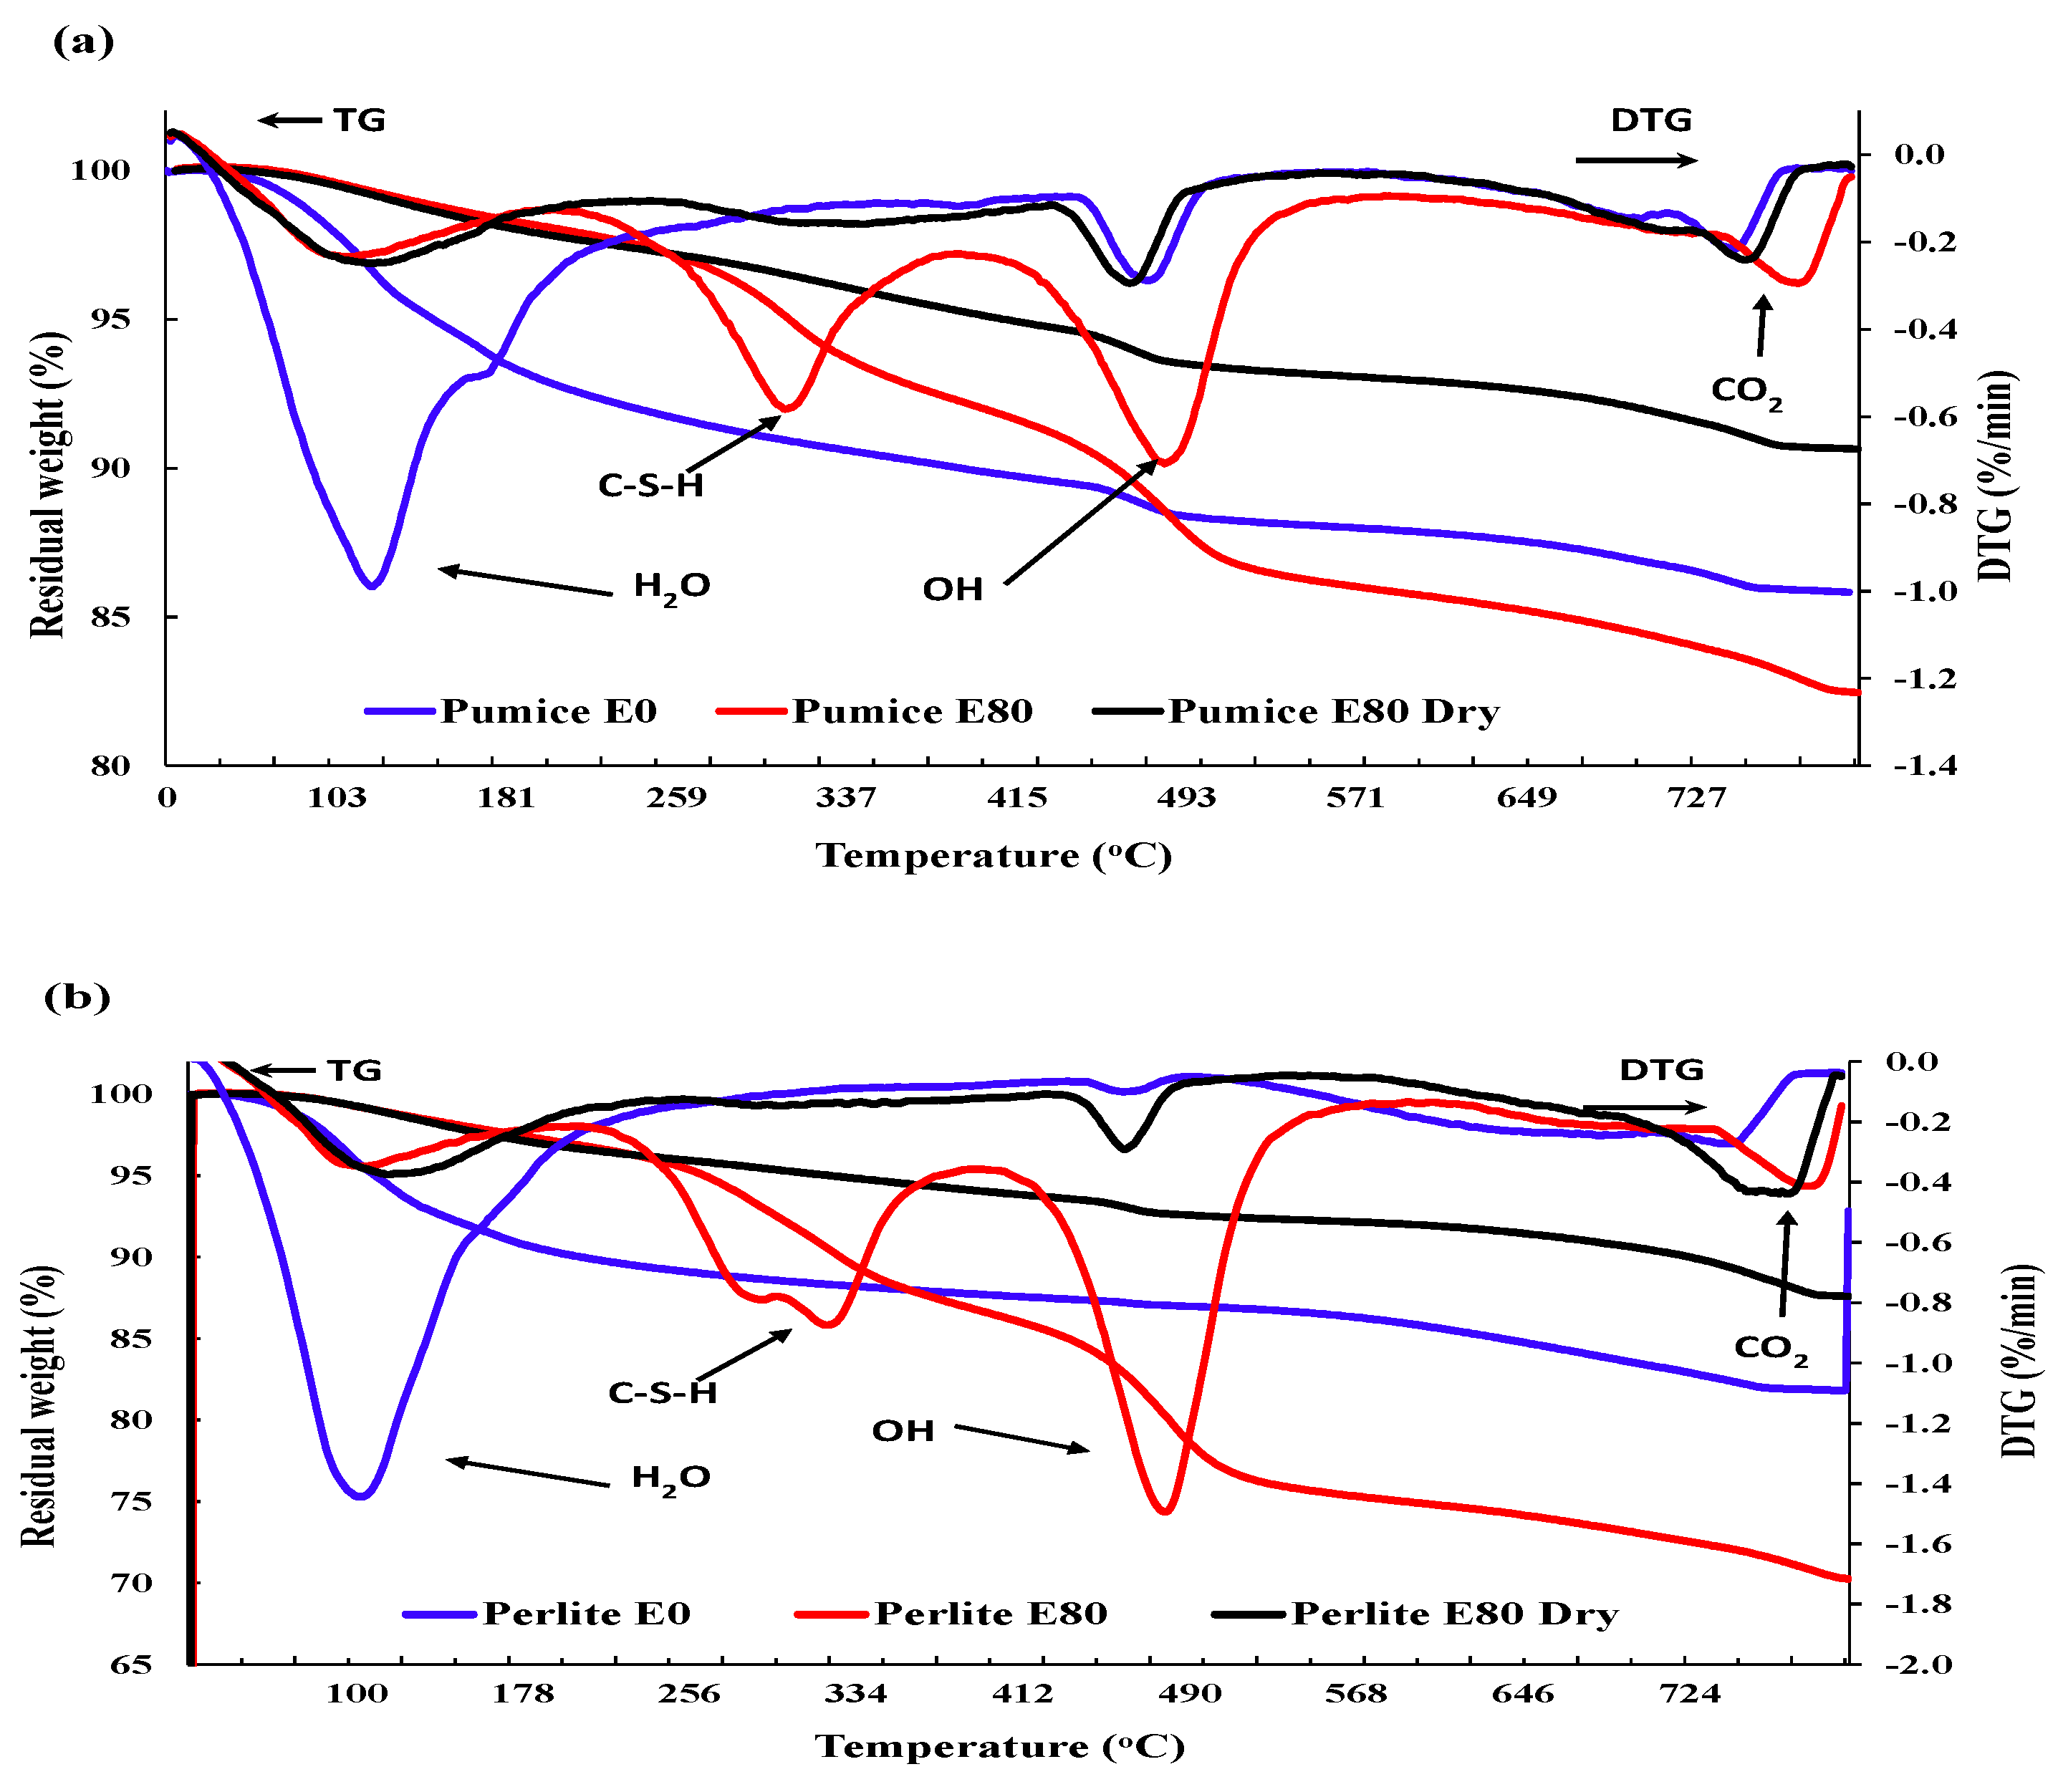
3.3.3. Thermogravimetric analysis
3.3.4. DSC Analysis
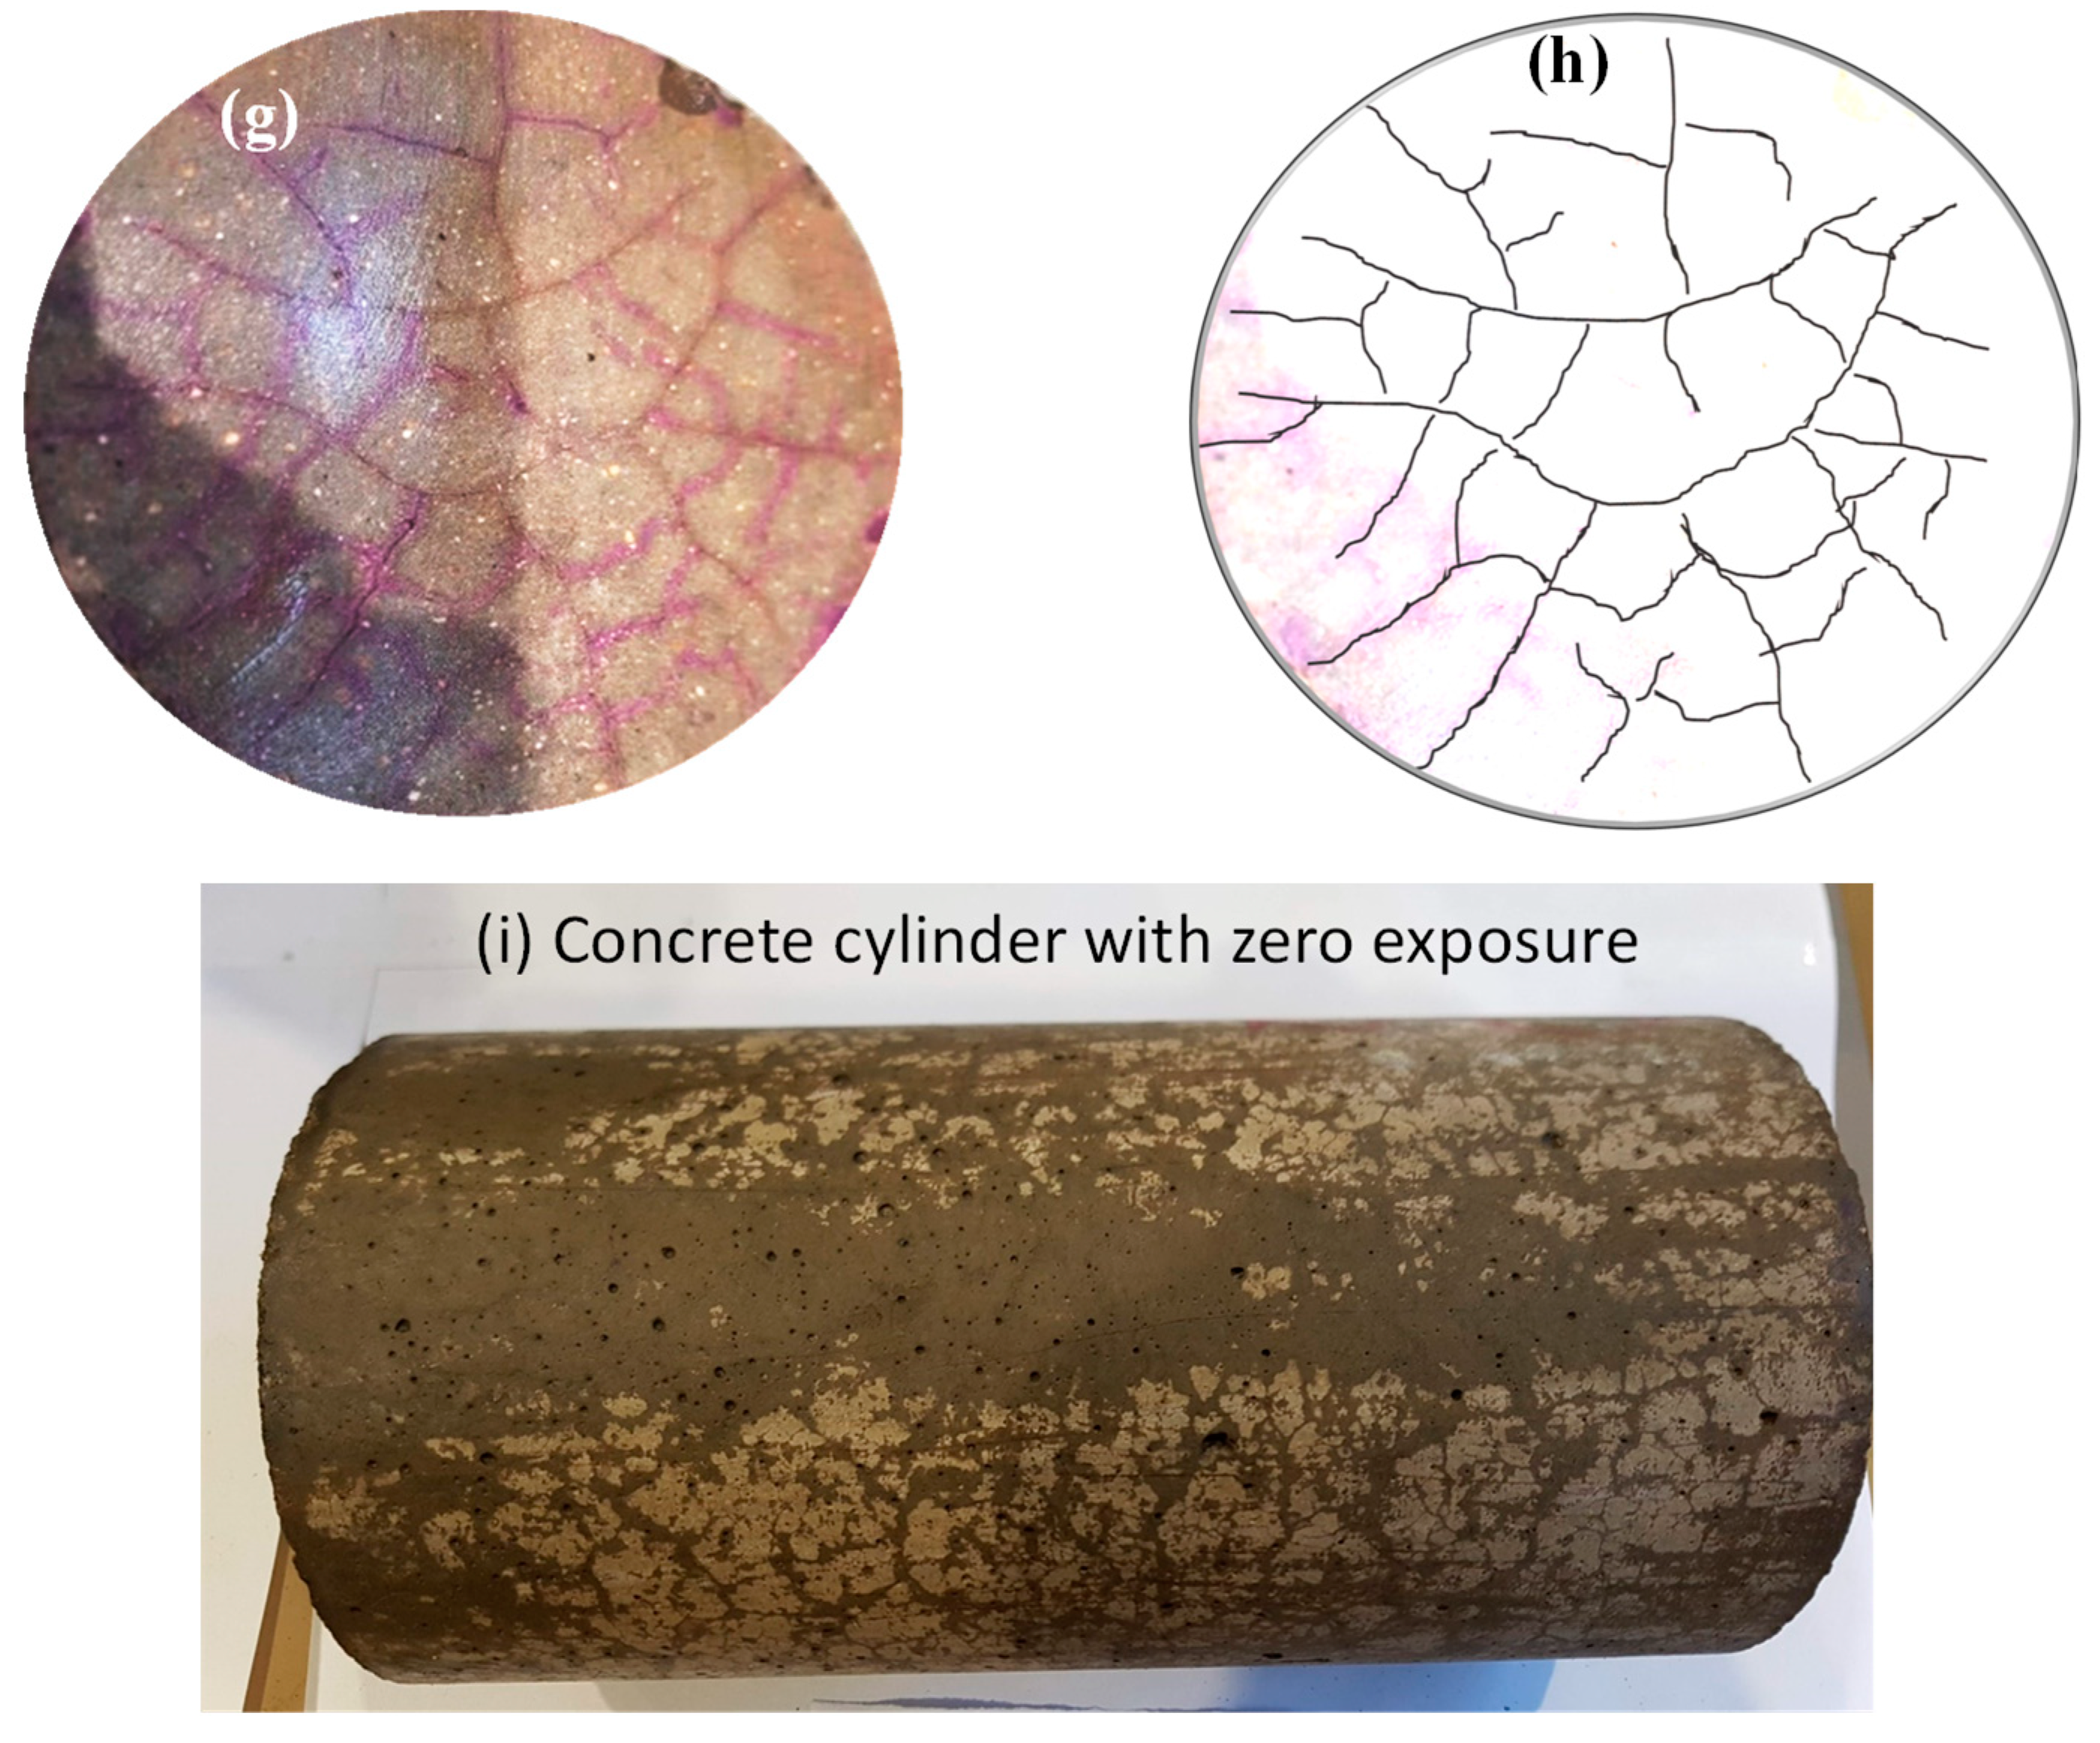
3.4. Morphology and microcracks-voids
4. Conclusion and recommendation
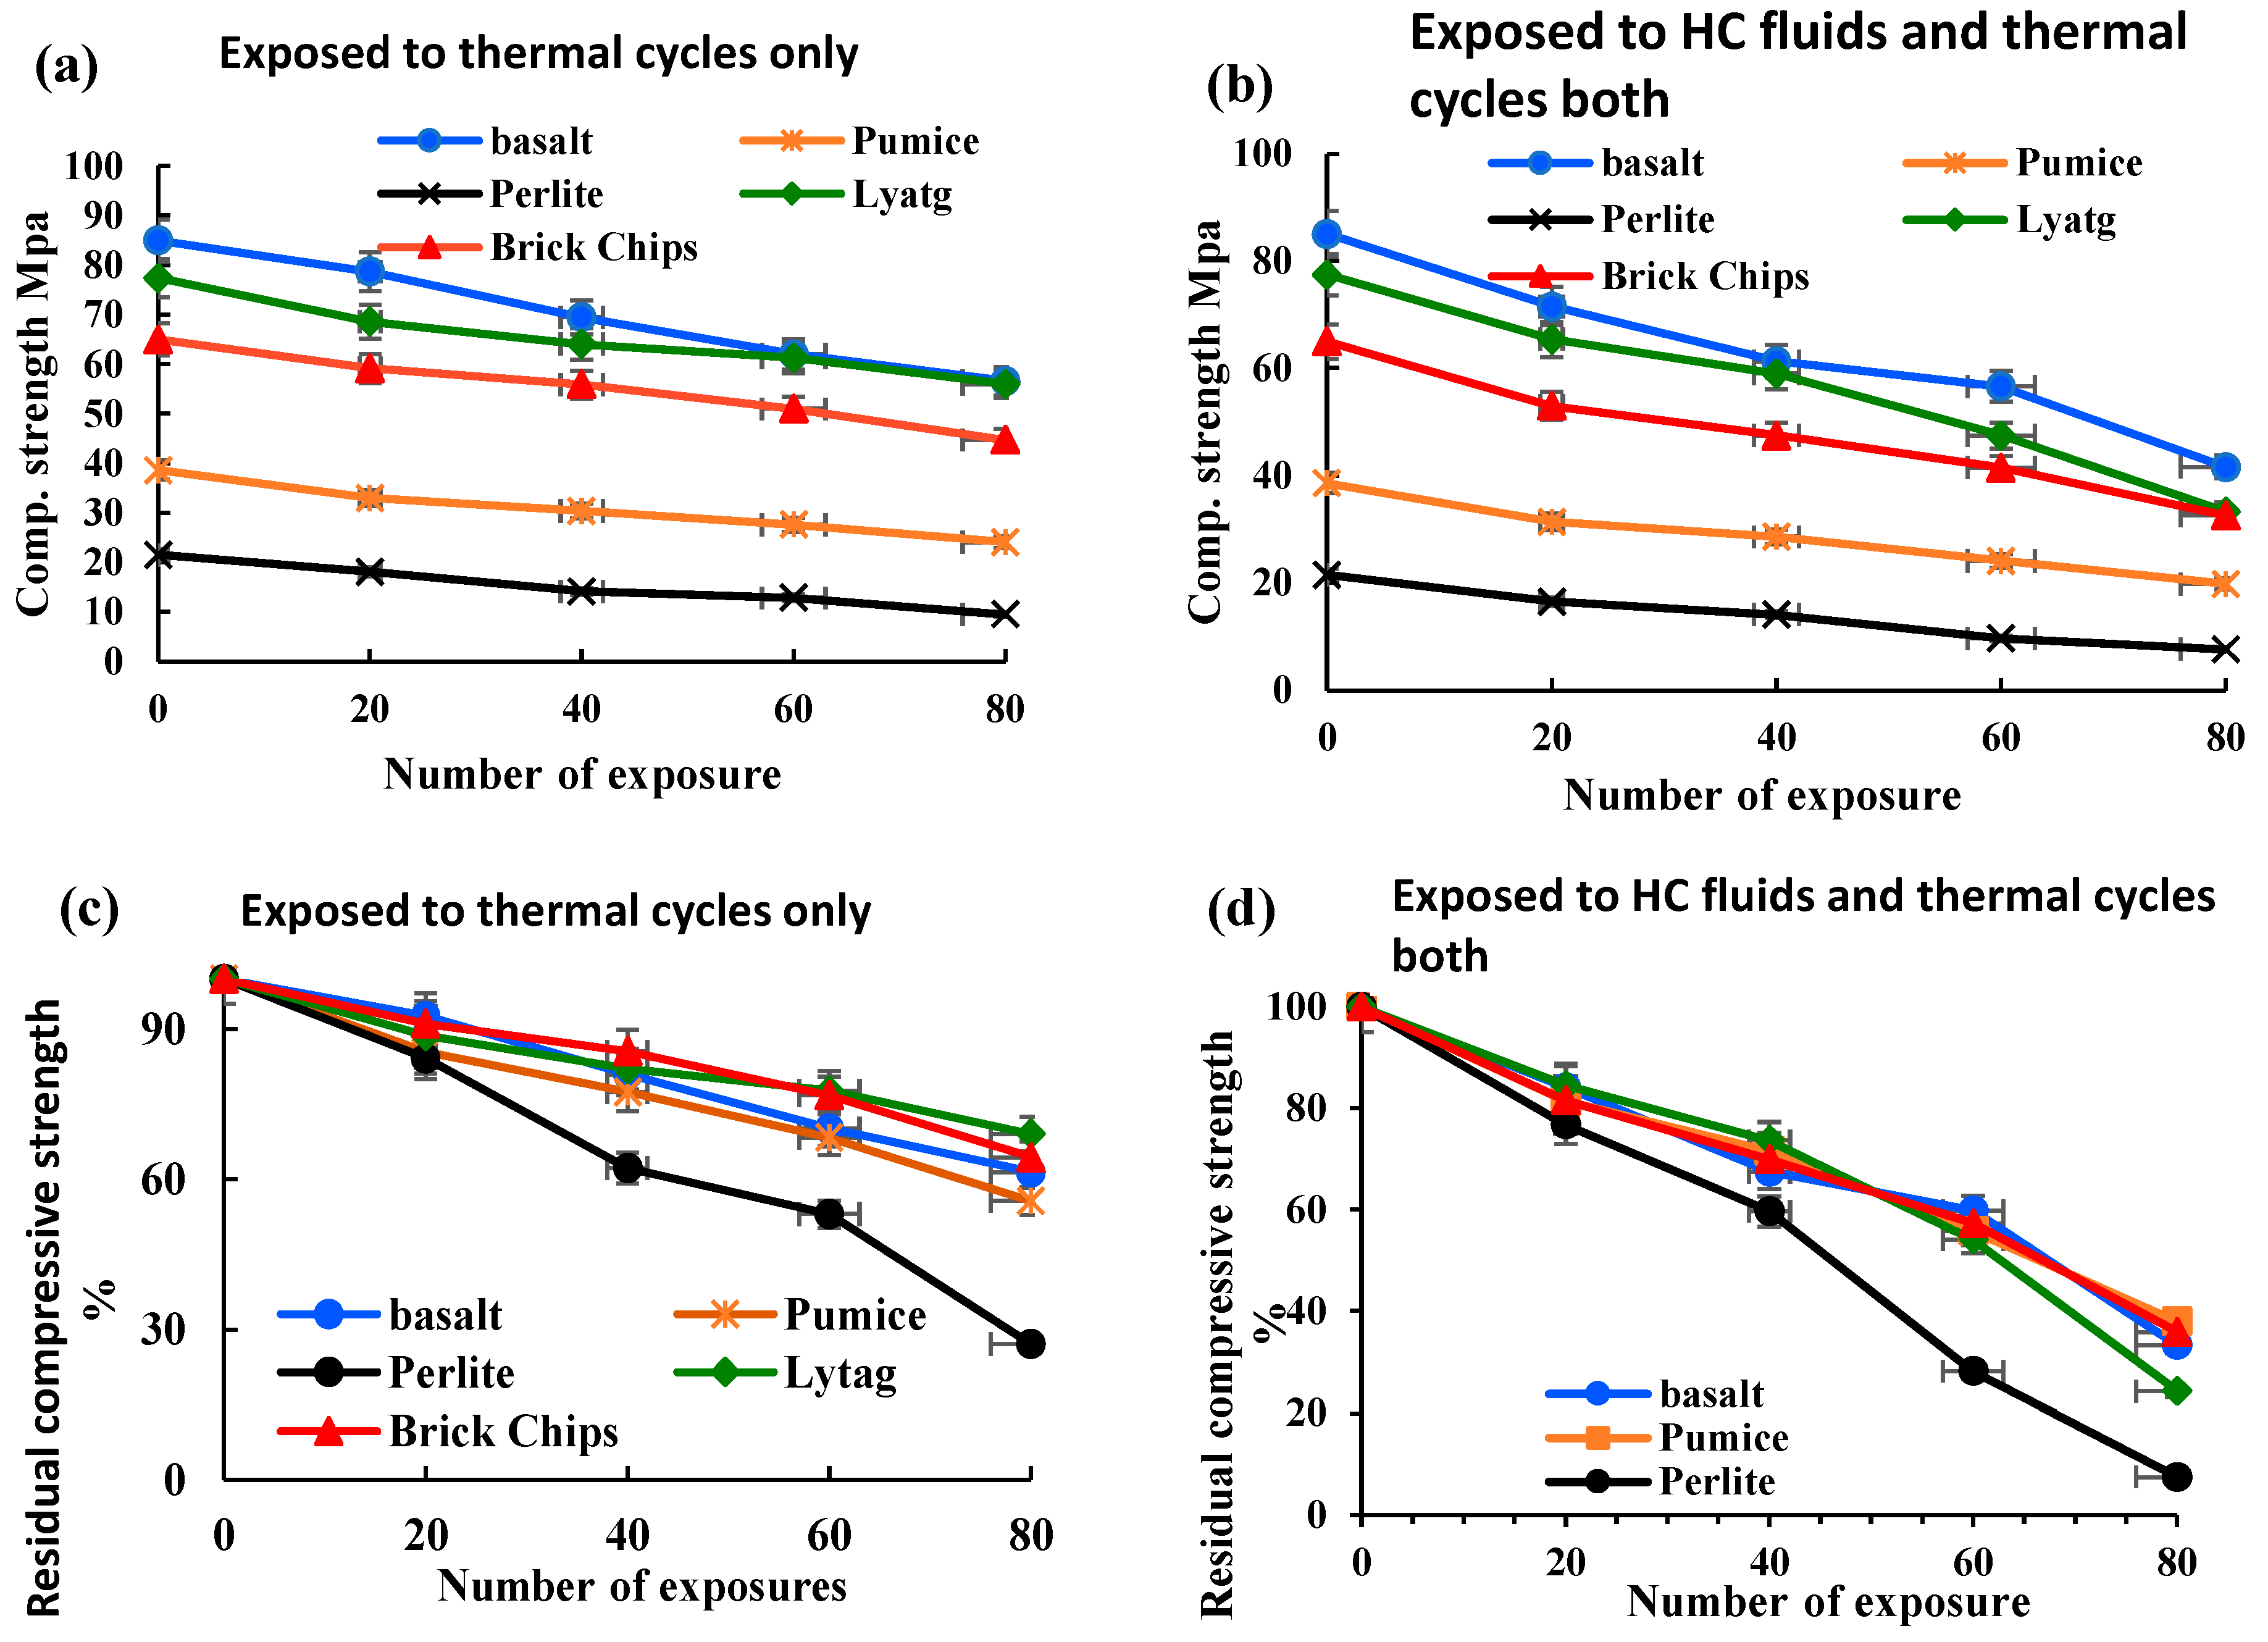
- LWAC retained a moderate amount of residual mechanical strengths after being exposed to repeated high temperatures and HC fluids. After 80 cycles of exposure to the coupled effect of HC fluids and high temperature, both control and LWAC suffered a significant strength loss. Lytag and brick LWAC showed higher compressive strength compared to other LWAC types and retained a residual compressive strength like the control specimen.
- The thermophysical properties of concrete are directly linked with the type and strength of the aggregate of concrete. LWAC showed much better thermal performances than NWA concrete under the repeated actions of HC fluids and high temperatures. Among the LWAC specimens used, perlite and pumice concrete specimens had better thermal performances than lytag and brick aggregate concrete samples due to their porous microstructure.
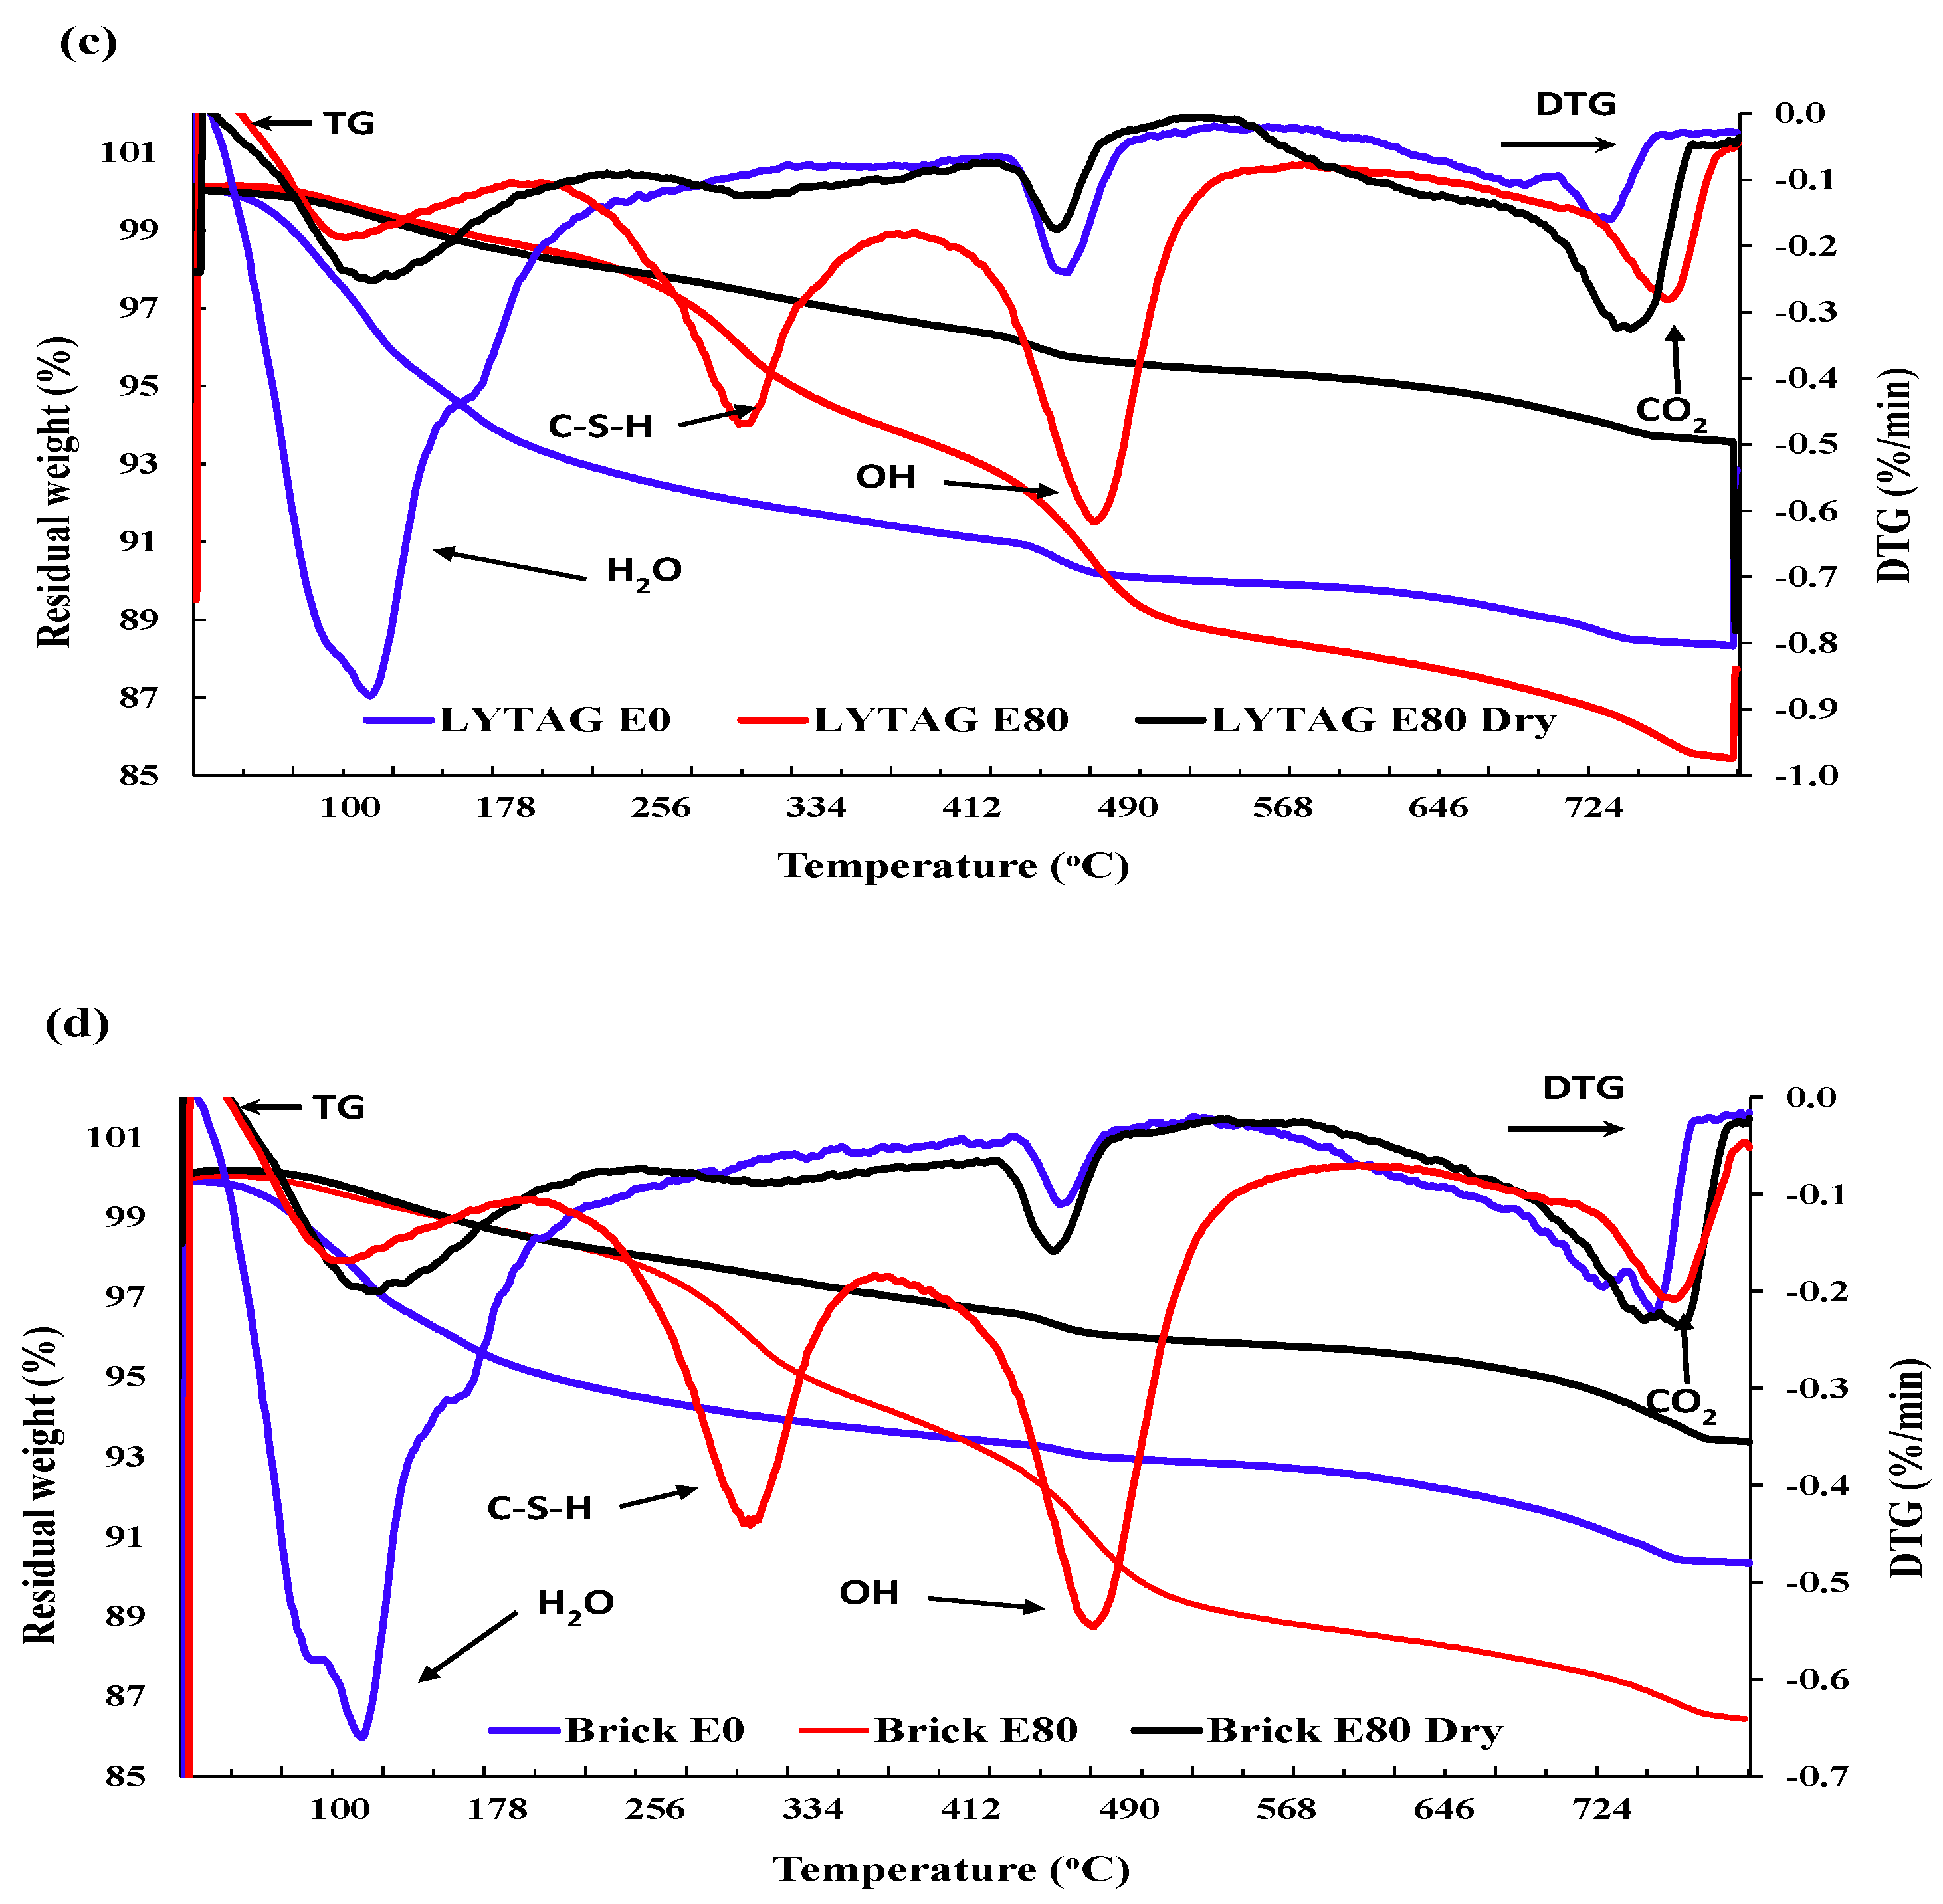
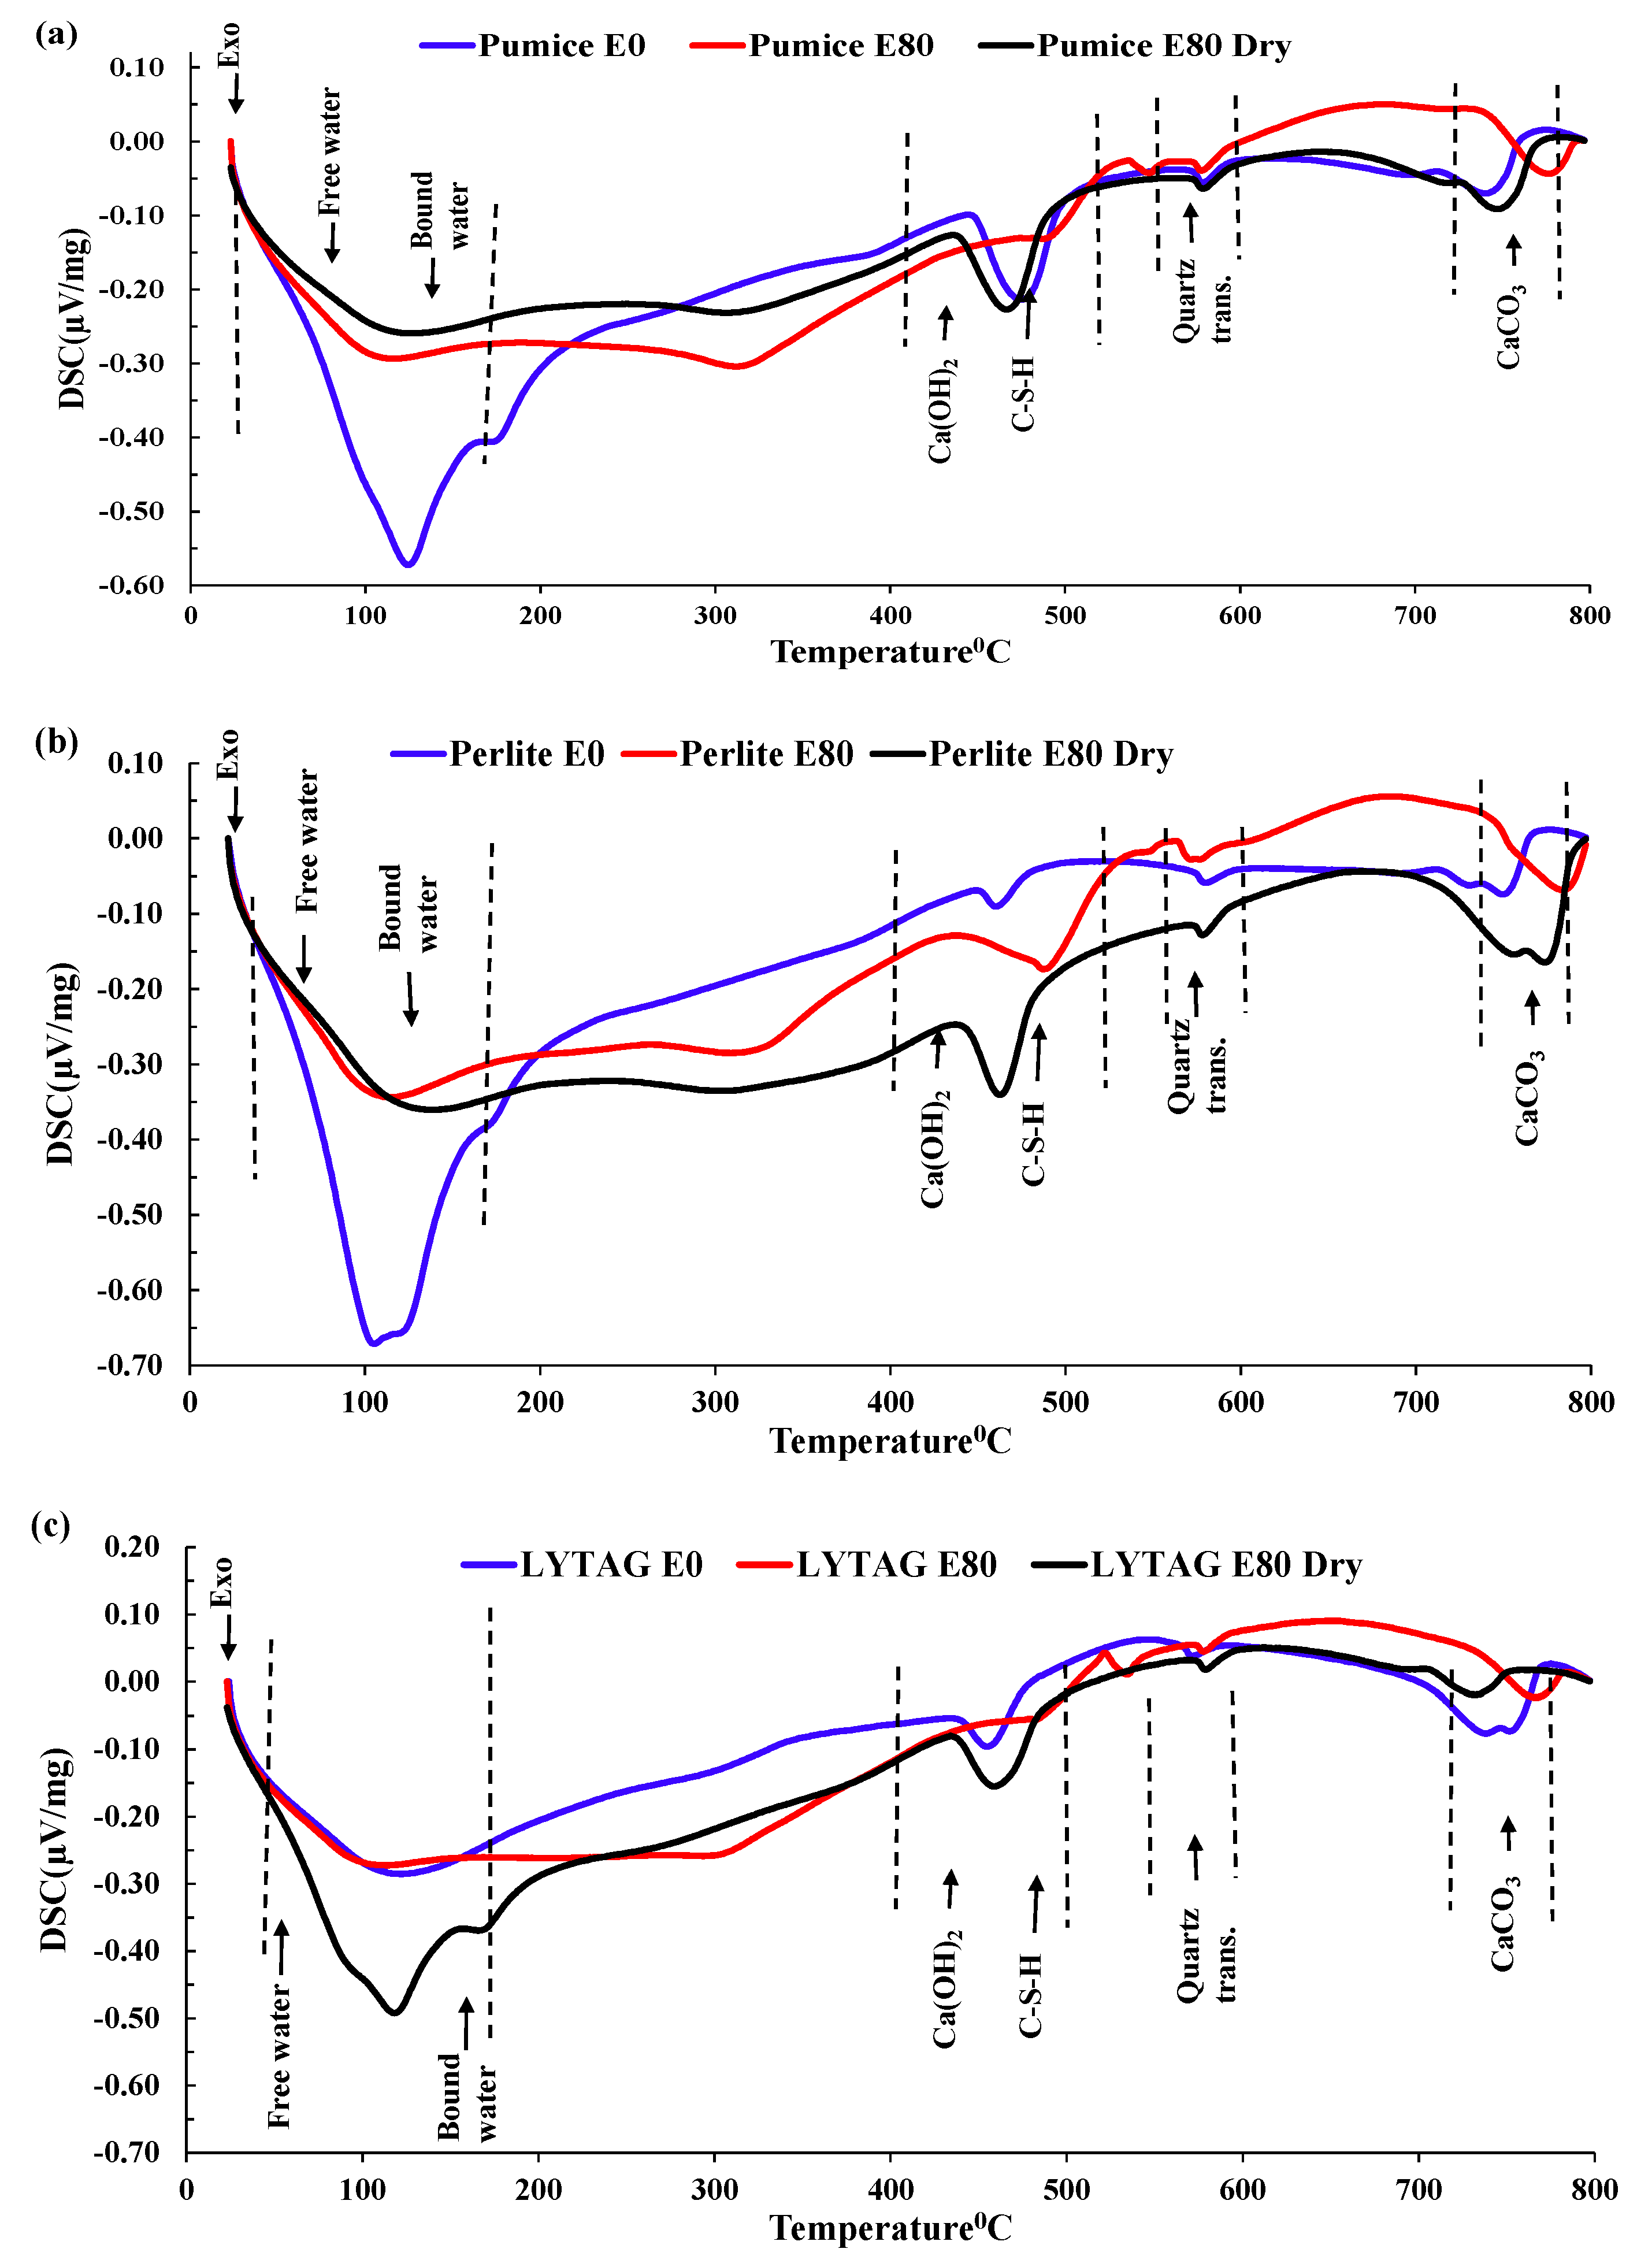
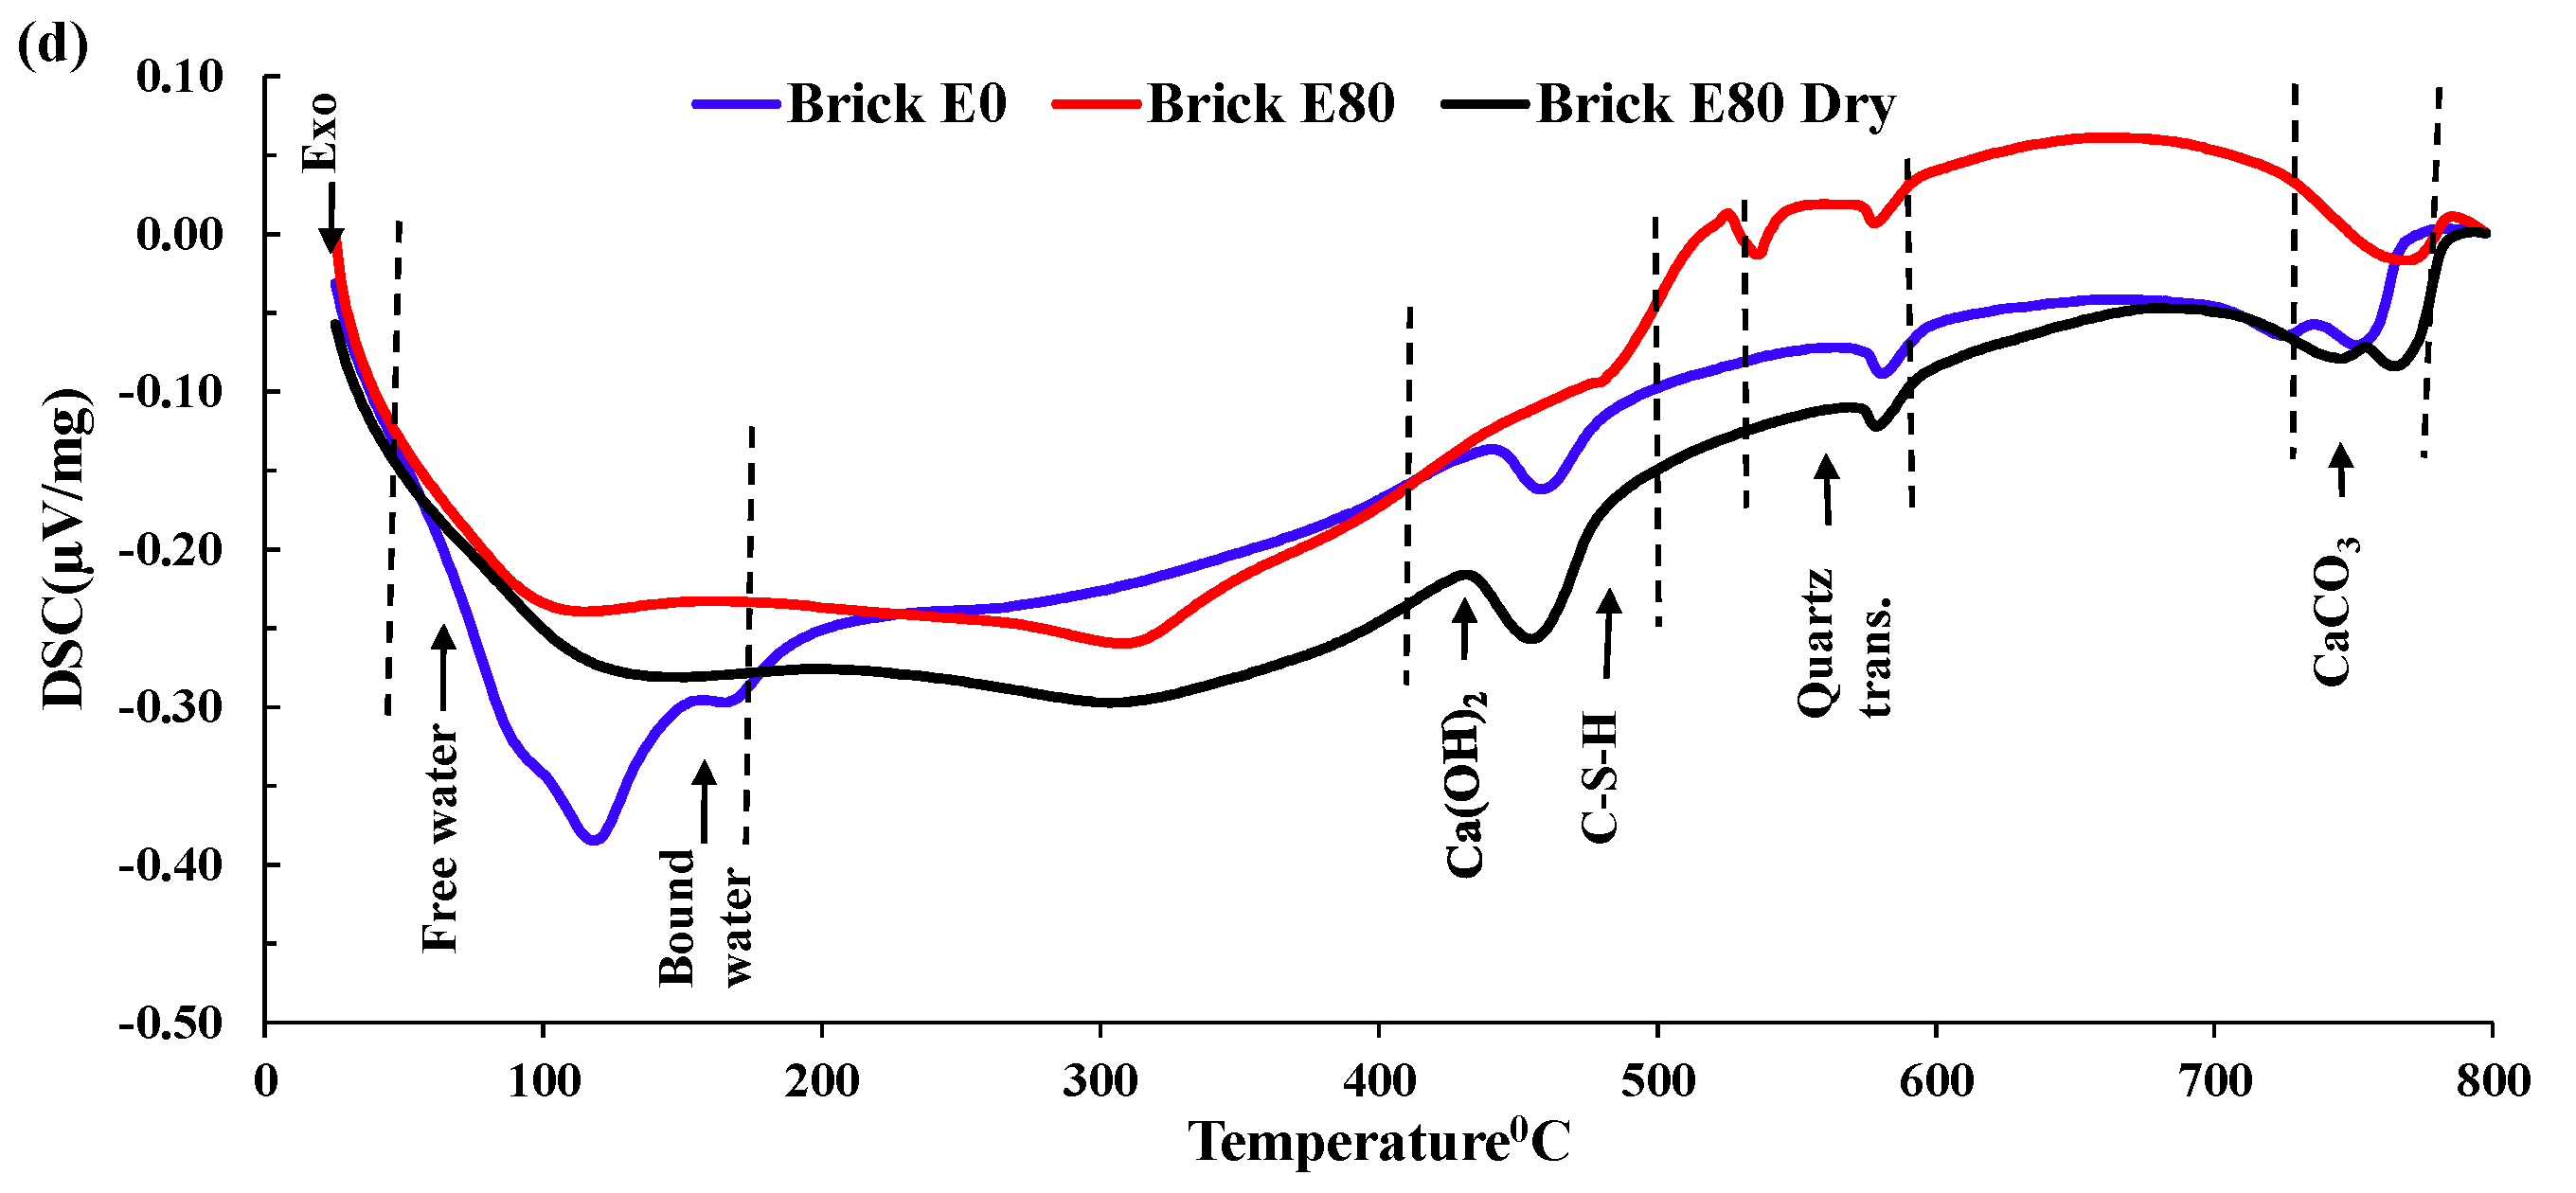
- Mass loss was prominent for pumice and perlite aggregate concrete due to their higher percentage of porosity. TG and DSC tests showed that the decomposition of cement causes the evaporation of bound water, increasing the mass loss substantially.
- Concrete samples exposed to the coupled effect of HC fluids and high temperature suffered spalling damage. Basalt concrete (control) was detected to develop significant spalling, but pumice, perlite and lytag LWAC suffered relatively less spalling. However, crushed brick concrete showed no spalling damage under the same exposure conditions.
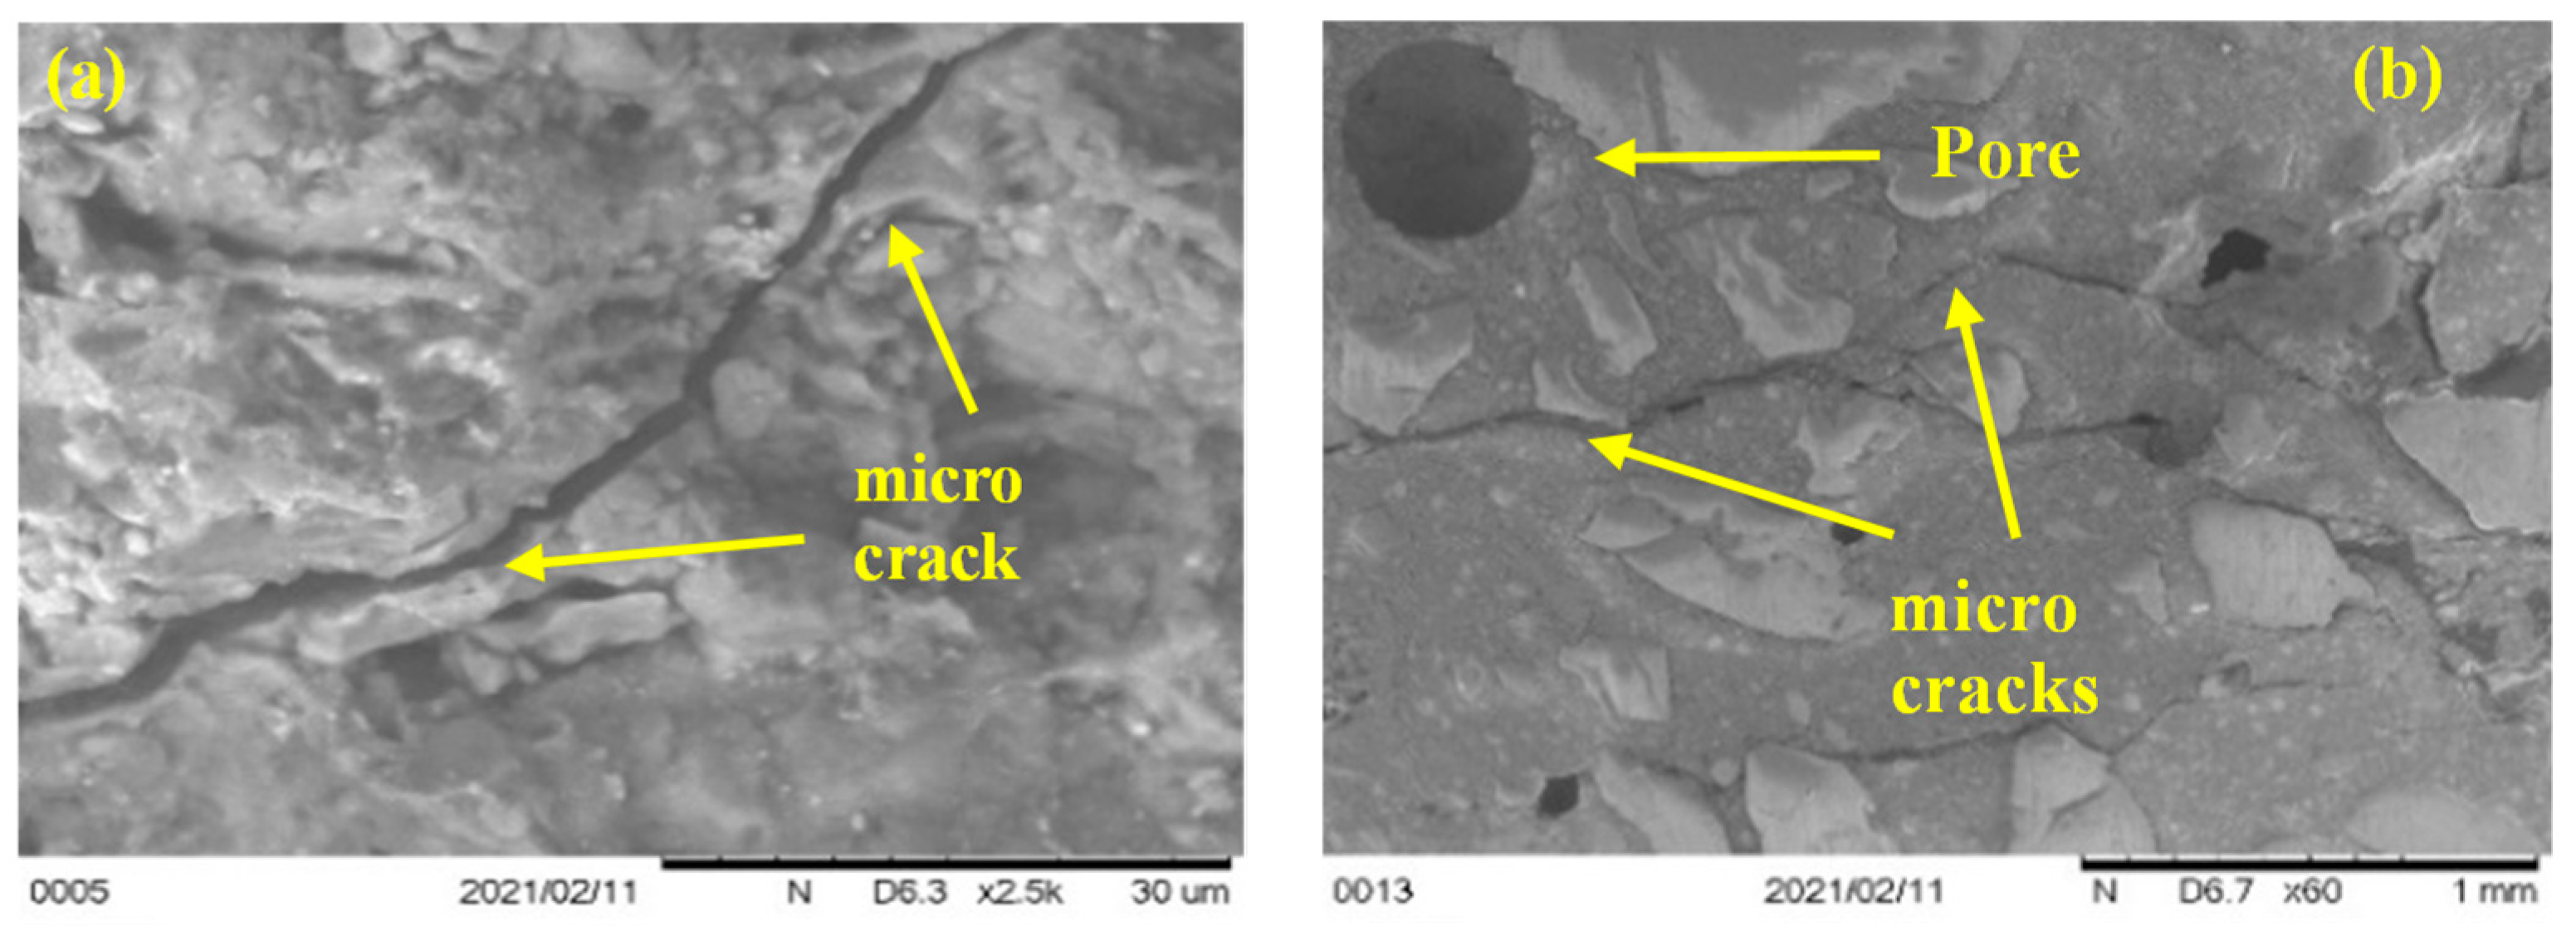
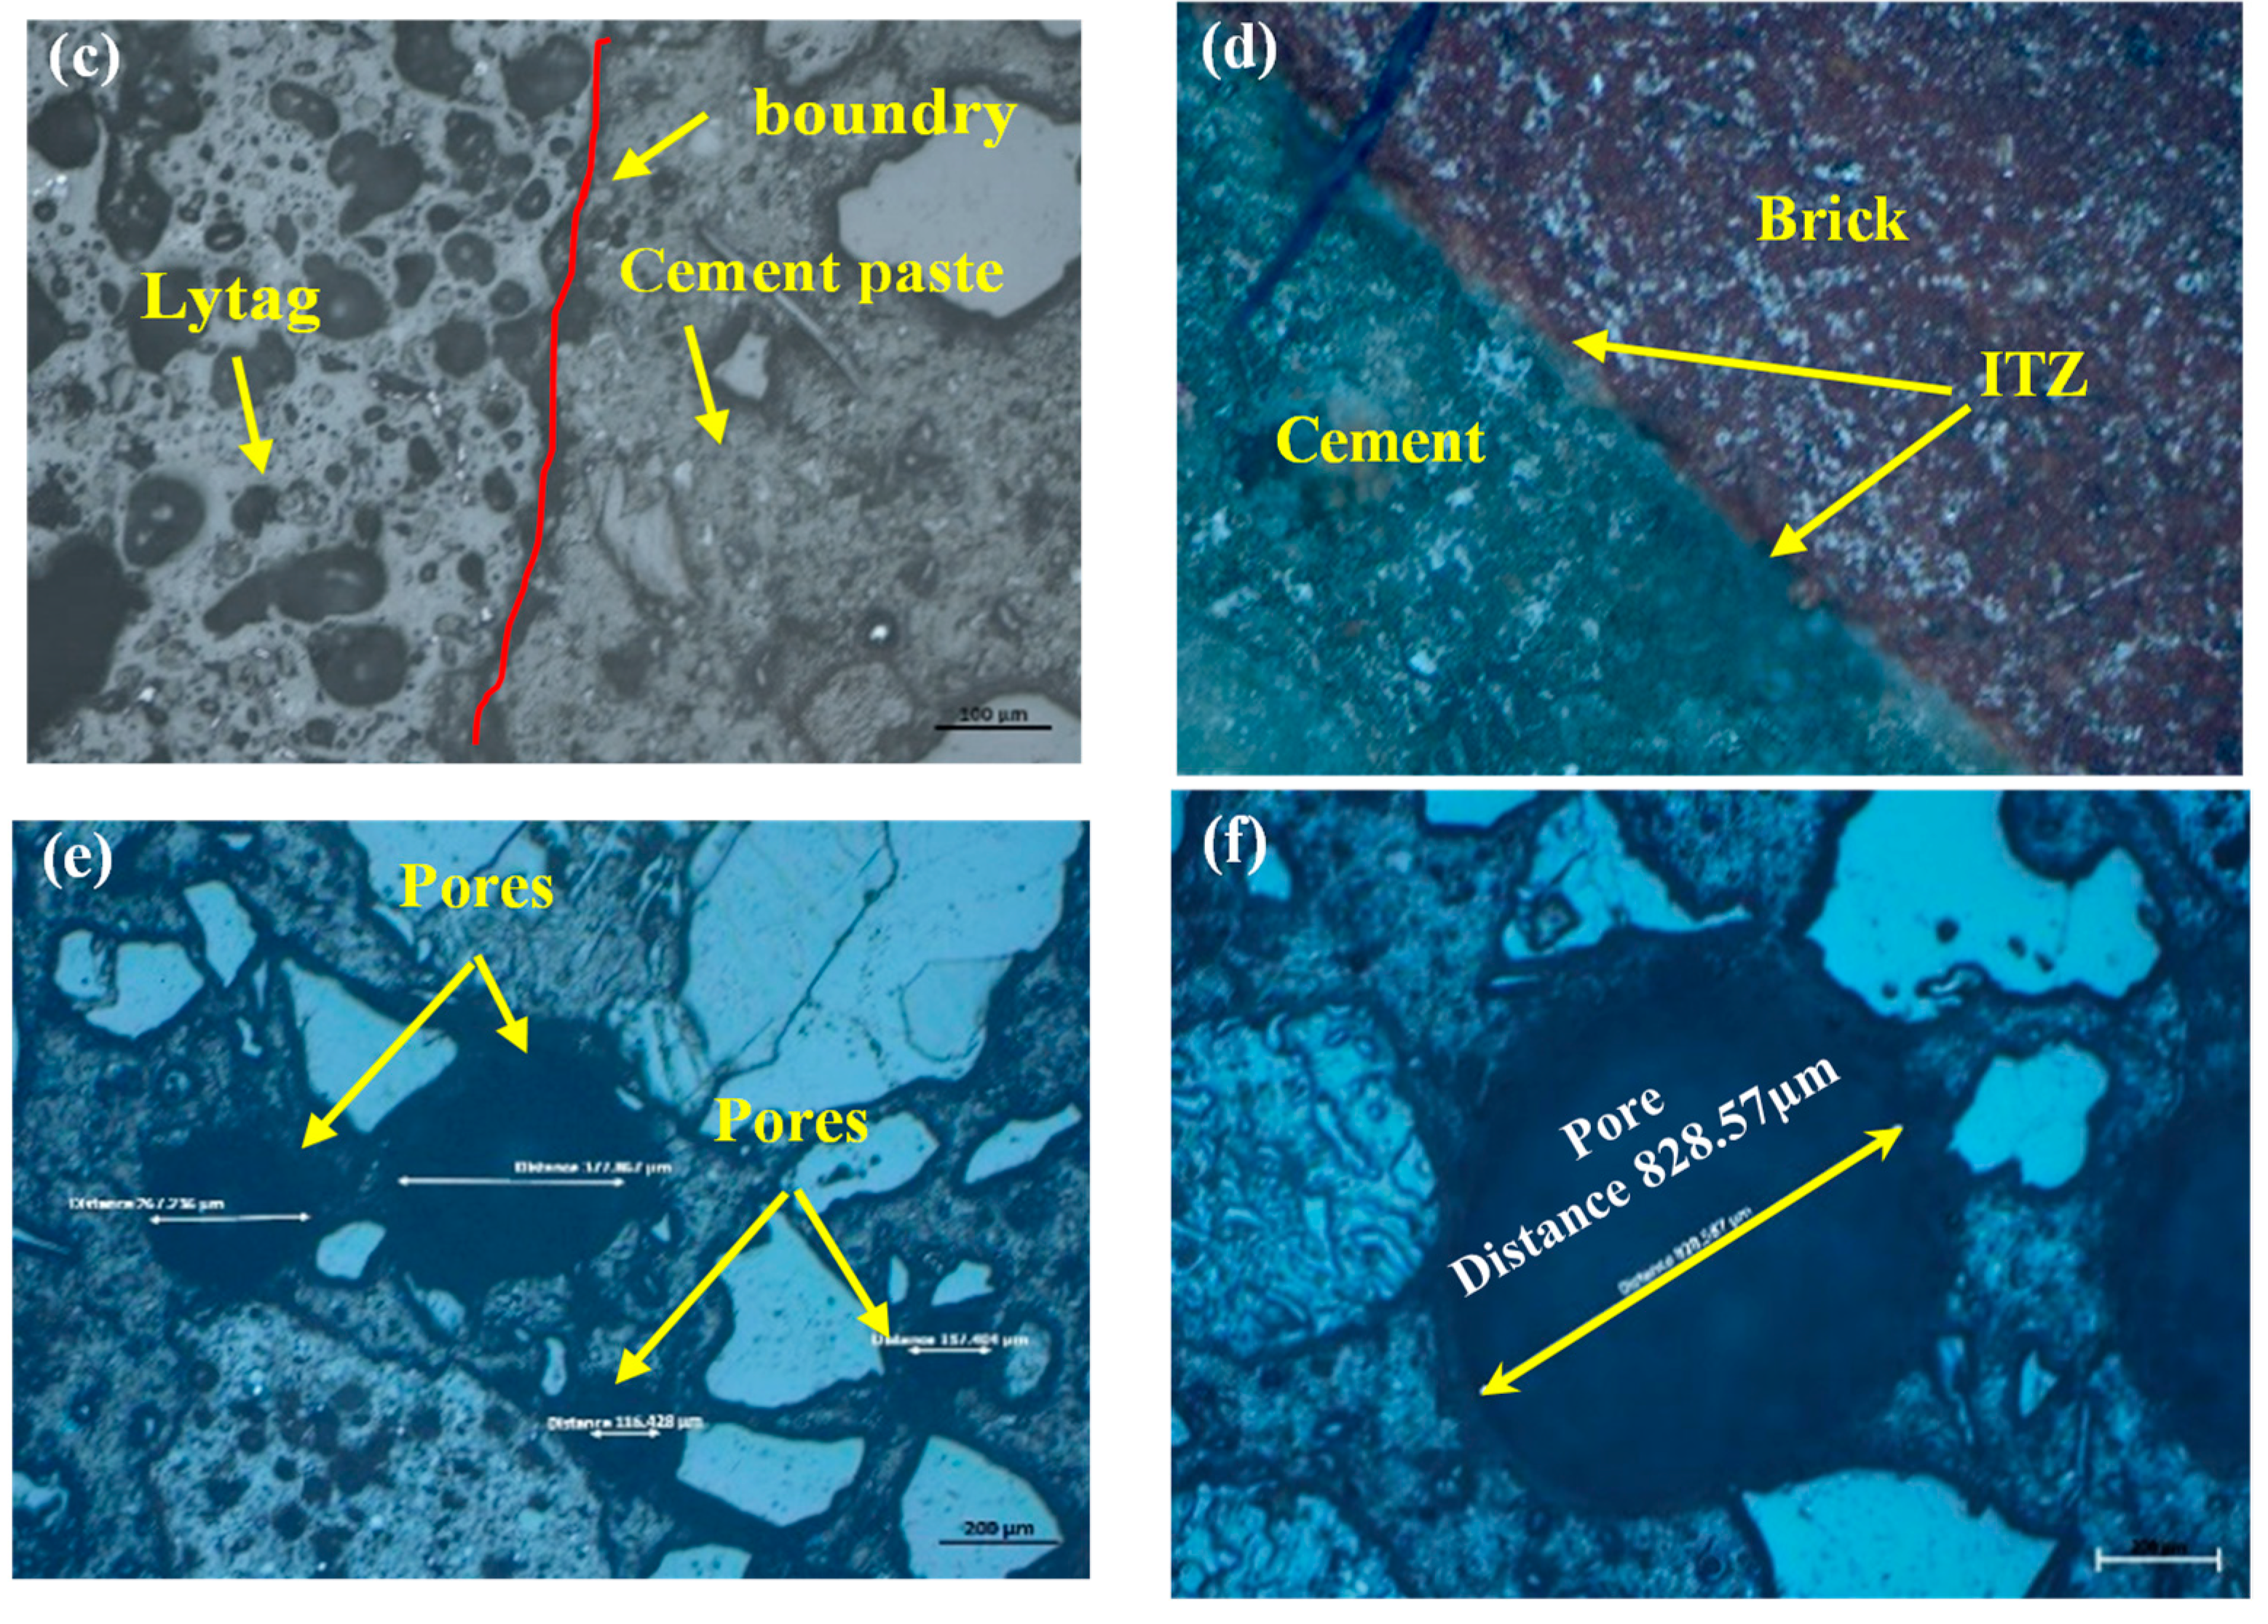
- SEM scans revealed that the low porosity in basalt aggregate caused the cracking in the cement paste at elevated temperatures as vapour pressure was not able to release immediately. Therefore, basalt concrete experienced higher heat-induced microcracks than other LWAC tested.
Acknowledgments
Conflicts of Interest
References
- H. Al-Khaiat, M. Haque, Effect of initial curing on early strength and physical properties of a lightweight concrete. Cement and Concrete Research 1998, 28, 859–866. [CrossRef]
- S. Hachemi, A. Ounis, Performance of concrete containing crushed brick aggregate exposed to different fire temperatures. European Journal of Environmental and Civil Engineering 2015, 19, 805–824. [CrossRef]
- S. Demirdag, L. Gunduz, Strength properties of volcanic slag aggregate lightweight concrete for high performance masonry units. Construction and building materials 2008, 22, 135–142. [CrossRef]
- N.U. Kockal, T. Ozturan, Durability of lightweight concretes with lightweight fly ash aggregates. Construction and Building Materials 2011, 25, 1430–1438. [CrossRef]
- K.M.A. Hossain, Properties of volcanic pumice based cement and lightweight concrete. Cement and concrete research 2004, 34, 283–291. [CrossRef]
- R. Demirboğa, İ. Örüng, R. Gül, Effects of expanded perlite aggregate and mineral admixtures on the compressive strength of low-density concretes. Cement and Concrete Research 2001, 31, 1627–1632. [CrossRef]
- C.-S. Poon, S. Azhar, M. Anson, Y.-L. Wong, Performance of metakaolin concrete at elevated temperatures. Cement and Concrete Composites 2003, 25, 83–89. [CrossRef]
- U. Schneider, Concrete at high temperatures—a general review. Fire safety journal 1988, 13, 55–68. [CrossRef]
- Hager, T. Tracz, J. Śliwiński, K. Krzemień, The influence of aggregate type on the physical and mechanical properties of high-performance concrete subjected to high temperature. Fire and materials 2016, 40, 668–682. [CrossRef]
- S. Yehia, M. AlHamaydeh, S. Farrag, High-strength lightweight SCC matrix with partial normal-weight coarse-aggregate replacement: Strength and durability evaluations. Journal of Materials in Civil Engineering 2014, 26, 04014086. [CrossRef]
- S.K. Shill, S. Al-Deen, M. Ashraf, Concrete durability issues due to temperature effects and aviation oil spillage at military airbase–A comprehensive review. Construction and Building Materials 2018, 160, 240–251. [CrossRef]
- S.K. Shill, S. Al-Deen, M. Ashraf, W. Hutchison, Resistance of fly ash based geopolymer mortar to both chemicals and high thermal cycles simultaneously. Construction and Building Materials 2020, 239, 117886. [CrossRef]
- S.K. Shill, S. Al-Deen, M. Ashraf, Saponification and scaling in ordinary concrete exposed to hydrocarbon fluids and high temperature at military airbases. Construction and Building Materials 2019, 215, 765–776. [CrossRef]
- S.K. Shill, S. Al-Deen, M. Ashraf, M.M. Hossain, Residual properties of conventional concrete repetitively exposed to high thermal shocks and hydrocarbon fluids. Construction and Building Materials 2020, 252, 119072. [CrossRef]
- S.K. Shill, S. Al-Deen, M. Ashraf, W. Hutchison, M.M. Hossain, Performance of amine cured epoxy and silica fume modified cement mortar under military airbase operating conditions. Construction and Building Materials 2020, 232, 117280. [CrossRef]
- S.K. Shill, S. Al-Deen, M. Ashraf, M.A. Elahi, M. Subhani, W. Hutchison, A comparative study on the performance of cementitious composites resilient to airfield conditions. Construction and Building Materials 2021, 282, 122709. [CrossRef]
- M.C. McVay, L.D. Smithson, C. Manzione, Chemical damage to airfield concrete aprons from heat and oils. Materials Journal 1993, 90, 253–258.
- S.K. Shill, S. Al-Deen, M. Ashraf, M. Rashed, W. Hutchison, Consequences of aircraft operating conditions at military airbases: degradation of ordinary mortar and resistance mechanism of acrylic and silica fume modified cement mortar. Road Materials and Pavement Design 2020, 1-14.
- M.M. Hossain, S. Al-Deen, M.K. Hassan, S.K. Shill, M.A. Kader, W. Hutchison, Mechanical and thermal properties of hybrid fibre-reinforced concrete exposed to recurrent high temperature and aviation oil. Materials 2021, 14, 2725. [CrossRef] [PubMed]
- M. McVay, J. Rish III, C. Sakezles, S. Mohseen, C. Beatty, Cements resistant to synthetic oil, hydraulic fluid, and elevated temperature environments. Materials Journal 1995, 92, 155–163.
- A.F. Bingöl, R. Gül, Compressive strength of lightweight aggregate concrete exposed to high temperatures. CSIR. 2004.
- Standard, AS 3972 General Purpose and Blended Cements. 2010.
- S.J.M.o.T.C. Australian. AS 1010.9-1999; Determination of the compressive strength of concrete specimens. 1999.
- C. ASTM, 518; Standard Test Method for Steady-State Thermal Transmission Properties by Means of the Heat Flow Meter Apparatus. Annual Book of ASTM Standards. 2003.
- M. Shannag, Characteristics of lightweight concrete containing mineral admixtures. Construction and Building Materials 2011, 25, 658–662. [CrossRef]
- S.Y.N. Chan, G.-F. Peng, M. Anson, Fire behavior of high-performance concrete made with silica fume at various moisture contents. Materials Journal 1999, 96, 405–409.
- M.B. Dwaikat, V. Kodur, Hydrothermal model for predicting fire-induced spalling in concrete structural systems. Fire safety journal 2009, 44, 425–434. [CrossRef]
- P. Kalifa, G. Chene, C. Galle, High-temperature behaviour of HPC with polypropylene fibres: From spalling to microstructure. Cement and concrete research 2001, 31, 1487–1499. [CrossRef]
- H. Oktay, R. Yumrutaş, A. Akpolat, Mechanical and thermophysical properties of lightweight aggregate concretes. Construction and Building Materials 2015, 96, 217–225. [CrossRef]
- Tandiroglu, Temperature-dependent thermal conductivity of high strength lightweight raw perlite aggregate concrete. nternational journal of thermophysics 2010, 31, 1195–1211.
- V. Kodur, M. Sultan, Effect of temperature on thermal properties of high-strength concrete. Journal of materials in civil engineering 2003, 15, 101–107. [CrossRef]
- R. Demirboğa, R. Gül, The effects of expanded perlite aggregate, silica fume and fly ash on the thermal conductivity of lightweight concrete. Cement and concrete research 2003, 33, 723–727. [CrossRef]
- L. Daasch, D. Smith, Infrared spectra of phosphorus compounds. Analytical chemistry 1951, 23, 853–868. [CrossRef]
- Y. Arai, D.L. Sparks, ATR–FTIR spectroscopic investigation on phosphate adsorption mechanisms at the ferrihydrite–water interface. Journal of Colloid and Interface Science 2001, 241, 317–326. [CrossRef]
- Mendes, W.P. Gates, J.G. Sanjayan, F. Collins, NMR, XRD, IR and synchrotron NEXAFS spectroscopic studies of OPC and OPC/slag cement paste hydrates. Materials and structures 2011, 44, 1773–1791. [CrossRef]
- M. Sanati, A. Andersson, DRIFT study of the oxidation and the ammoxidation of toluene over a TiO2 (B)-supported vanadia catalyst. Journal of molecular catalysis 1993, 81, 51–62. [CrossRef]
- R. Ylmén, U. Jäglid, B.-M. Steenari, I. Panas, Early hydration and setting of Portland cement monitored by IR, SEM and Vicat techniques. Cement and Concrete Research 2009, 39, 433–439. [CrossRef]
- M. Varas, M.A. de Buergo, R. Fort, Natural cement as the precursor of Portland cement: Methodology for its identification. Cement and Concrete Research 2005, 35, 2055–2065. [CrossRef]
- H. Fares, S. Remond, A. Noumowé, A. Cousture, Microstructure et propriétés physico-chimiques de bétons autoplaçants chauffés de 20 à 600°C. European Journal of Environmental and Civil Engineering 2011, 15, 869–888.
- L. Alarcon-Ruiz, G. Platret, E. Massieu, A.J.C. Ehrlacher, C. research, The use of thermal analysis in assessing the effect of temperature on a cement paste. Cement and Concrete Research 2005, 35, 609–613. [CrossRef]
- R. Way, K. Wille, Effect of heat-induced chemical degradation on the residual mechanical properties of ultrahigh-performance fiber-reinforced concrete. Journal of Materials in Civil Engineering 2016, 28, 04015164. [CrossRef]
- G.J.M.o.c.R. Khoury, Compressive strength of concrete at high temperatures: a reassessment. Magazine of Concrete Research 1992, 44, 291–309. [CrossRef]
- G. Ye, X. Liu, G. De Schutter, L. Taerwe, P. Vandevelde, Phase distribution and microstructural changes of self-compacting cement paste at elevated temperature. Cement and Concrete Research 2007, 37, 978–987. [CrossRef]
- T. Wu, X. Yang, H. Wei, X. Liu, Mechanical properties and microstructure of lightweight aggregate concrete with and without fibers. Construction and Building Materials 2019 2019, 199, 526–539. [CrossRef]



| Chemical analysis (% by mass) |
Pumice | Perlite | Lytag | Brick | Basalt | White Gravel | River Gravel | Peach Stone |
Portland cement | GPC |
|---|---|---|---|---|---|---|---|---|---|---|
| Calcium oxide (CaO) | 3.37 | 2.14 | 3.44 | 8.095 | 4.64 |
- | 0.26 |
- | 64.5 | 4.29 |
| Silica (SiO2) | 71.41 | 75.64 | 41.35 | 56.67 | 58.24 | 97.25 |
88.89 | 93.66 | 20.20 | 60.06 |
| Alumina (Al2O3) | 10.46 | 10.91 | 20.89 | 11.76 | 15.72 | 4.27 | 2.47 | 4.8 | 17.52 | |
| Iron oxide (Fe2O3) | 6.70 | 2.81 | 23.54 | 15.03 | 9.79 | 1.46 | 3.98 | 2.724 |
3.1 | 10.68 |
| Sulphur trioxide (SO3) | 0.86 | 0.81 | 1.09 | 0.44 |
0.668 | 1.13 | 3.982 | 1.02 | 2.70 | 0.901 |
| Magnesia (MnO) | 0.21 | 0.22 | 0.152 | 0.30 | 0.137 | - | - | - | 1.20 | 0.228 |
| Titanium oxide (TiO2) | 0.65 | - | 1.17 | 1.07 | 1.09 | - | 0.265 | - | 0.52 | 2.15 |
| Potassium Oxide (K2O) | 6.00 | 7.40 | 5.59 | 5.68 | 9.13 | - | 1.168 | - | 0.67 | 3.56 |
| Specific Gravity | 1.5 | 0.30 | 2.10 | 2.66 | - | - | - | - | - | |
| Moisture % | 45 | 35 | 15 | 12.5 | 4.3 | - | - | - | - | - |
| Designation of mixture | Cement (kg/m3) | Sand (kg/m3) |
Coarse Aggregate (kg/m3) |
W/C ratio |
Super plasticizer (kg/m3) | Dry unit weight of concrete (kg/m3) |
|---|---|---|---|---|---|---|
| Control | 462 | 792 | 1012 | 0.45 | 0 | 2323 |
| Pumice | 462 | 714 | 368 | 0.45 | 1.0 | 1897 |
| Perlite | 320 | 714 | 407 | 0.37 | 5.0 | 1578 |
| Lytag | 280 | 800 | 835 | 0.45 | 4.8 | 1909 |
| Crushed Brick | 462 | 750 | 1035 | 0.45 | 3.0 | 2094 |
| Types/Loss | Thermal conductivity % | Specific heat % | ||
|---|---|---|---|---|
| Heat exposed | HC and heat exposed | Heat exposed | HC and heat exposed | |
| Basalt | 63.91 | 61.94 | 35.04 | 31.13 |
| Brick | 54.68 | 37.09 | 16.34 | 10.26 |
| Lytag | 40.12 | 38.97 | 7.44 | 9.94 |
| Pumice | 39.86 | 33.57 | 15.85 | 15.94 |
| Perlite | 37.96 | 46.87 | 16.07 | 20.01 |
| Aggregates | Mass loss in the various temperature range | |||
|---|---|---|---|---|
| 20-2000C | 200-3500C | 350-6000C | 600-8000C | |
| Pumice E0 | 7.04 | 2.45 | 2.12 | 2.5 |
| Pumice E80 | 1.94 | 4.91 | 5.94 | 4.75 |
| Pumice E80 Dry | 2.14 | 1.99 | 2.39 | 2.77 |
| Perlite E0 | 9.84 | 2.08 | 1.14 | 5.11 |
| Perlite E80 | 3.04 | 8.6 | 10.95 | 7.14 |
| Perlite E80 Dry | 3.17 | 2.12 | 2.09 | 4.87 |
| LYTAG E0 | 6.67 | 1.71 | 1.53 | 1.76 |
| LYTAG E80 | 1.47 | 4.13 | 5.04 | 3.9 |
| LYTAG E80 Dry | 1.72 | 1.33 | 1.4 | 1.97 |
| Brick E0 | 4.93 | 1.31 | 0.93 | 2.57 |
| Brick E80 | 1.49 | 3.88 | 4.8 | 3.39 |
| Brick E80 Dry | 1.56 | 1.25 | 1.22 | 2.59 |
| Basalt E0 | 3.19 | 0.82 | 1.13 | 2.03 |
| Bsalt E80 | 2.92 | 2.5 | 3.17 | 3.64 |
Disclaimer/Publisher’s Note: The statements, opinions and data contained in all publications are solely those of the individual author(s) and contributor(s) and not of MDPI and/or the editor(s). MDPI and/or the editor(s) disclaim responsibility for any injury to people or property resulting from any ideas, methods, instructions or products referred to in the content. |
© 2023 by the authors. Licensee MDPI, Basel, Switzerland. This article is an open access article distributed under the terms and conditions of the Creative Commons Attribution (CC BY) license (http://creativecommons.org/licenses/by/4.0/).


